
Risorse educative aperte e corsi open online: sfide e opportunità per l'educazione
Bologna, 17 ottobre, 2018
La filiera Automotive italiana si confronta con le sfide globali: la solidità finanziaria alla base della futura competitività
Andrea Marinoni Senior Partner

2 18_10_17 Bologna ISP_Anfia_RB_AM.pptx
Agenda
This document shall be treated as confidential. It has been compiled for the exclusive, internal use by our client and is not complete without the underlying detail analyses and the oral presentation.
It may not be passed on and/or may not be made available to third parties without prior written consent from .
© Roland Berger
Q&A
C
5' Tempo
Conquistare la solidità finanziaria, prerequisito per la competitività
Sfide per i fornitori Auto
B
'10 Tempo
Perché si parla di disruption nel settore Auto
Scenario di riferimento
A
'10 Tempo

3 18_10_17 Bologna ISP_Anfia_RB_AM.pptx
Agenda
This document shall be treated as confidential. It has been compiled for the exclusive, internal use by our client and is not complete without the underlying detail analyses and the oral presentation.
It may not be passed on and/or may not be made available to third parties without prior written consent from .
© Roland Berger
Q&A
C
Conquistare la solidità finanziaria, prerequisito per la competitività
Sfide per i fornitori Auto
B
Perché si parla di disruption nel settore Auto
Scenario di riferimento
A
5' Tempo
'10 Tempo
'10 Tempo

4 18_10_17 Bologna ISP_Anfia_RB_AM.pptx
Tutti i business tendono ad uno stato "friction free" nella misura in cui tecnologia, normativa e comportamenti dei consumatori lo consentono
Convincimento chiave
Source: Roland Berger

5 18_10_17 Bologna ISP_Anfia_RB_AM.pptx
Per oltre 100 anni il settore dell'Auto ha accettato alcune "friction" che non ne hanno impedito il successo, nonostante alti costi sociali
Existing "frictions" in the Automotive industry
Very low asset productivity: In average, a car is only used for 60 minutes per day, accounting for less than 5%
Casualties: Nearly 1.3 million people die in road crashes per year, accounting for 2.2% of all deaths globally and additional 20-50 million people are injured or disabled
Congestion: Commuters spend by far more than 10 bn hours per year in congestions, accounting for ~10% of their driving time
Emissions: Road transportation cause more than 5,500 Mt CO2, reflecting 17% of global CO2 emissions
> More than 100 USD bn cost through congestion
> More than 500 USD bn cost through road accidents
> Additional non-quantified cost for CO2 emissions
Frictions in Automotive industry Cost impact

6 18_10_17 Bologna ISP_Anfia_RB_AM.pptx
Guardando avanti, quattro trend chiave concorrono alla disruption del settore Auto - MADE
Source: Roland Berger
Disruption
Alternative fuels
Autonomous Non-traditional entrants
ICE advancement
Electrified
New retail
Start-up OEMs
Low cost brands
Connected
Digitized
Mobility
Emissions regulations
Light-weighting
Fuel cells
Big data
Artificial Intelligence

7 18_10_17 Bologna ISP_Anfia_RB_AM.pptx
MADE – ma non solo – nell'orizzonte di medio lungo termine dei player dell'Automotive
Car buyers
OEMs
Competition Supply base
Capital markets/ financing
Technology/ legislation
Long-term Short-term
Volatility of capital markets
"Zero casualties"
Rising energy costs
Availability of skilled workforce
Supplier insolvencies
Factor cost inflation
Selective consolidation
"Rising star OEMs"
Global localization
Price pressure
Volume bundling
Emerging market
investors
New growth regions
Continued outsourcing
ADAS/ automated
driving
Further reduced
emissions
Comfort features
New players
(hardware and
software)
Volatility of exchange
rates
Demotorization
Digital technologies
Triad stagnation
Investors' and banks' view
on auto suppliers
New mobility concepts
Terms & conditions
Further reduced CO2
targets
Potential downturn
Diesel
Industry 4.0 New customers (IT/tech space)
Brexit
Automotive industry trend radar
Note: Excluding product segment specific technology and operational issues
Source: Lazard, Roland Berger

8 18_10_17 Bologna ISP_Anfia_RB_AM.pptx
Verso lo scenario 2030: diversi percorsi di avvicinamento avendo chiaro che tutto il settore sarà radicalmente trasformato
Source: Roland Berger
Esempio
Tempo Oggi
Grado di cambiamento
Scenario alta velocità Scenario media velocità Scenario bassa velocità Scenario area
Automotive "End game zone"
2020 2025 2030
Domanda chiave: quale scenario è più probabile?
> Alta percentuale di veicoli elettrici
> Alta percentuale di guida automatizzata
> Basso tasso di proprietà di automobili
> Impatto significativo sulla distribuzione dei profitti e sulla struttura del settore

9 18_10_17 Bologna ISP_Anfia_RB_AM.pptx
Con il nostro "Automotive Disruption Radar" monitoriamo su base globale 27 indicatori che guidano il cambiamento
Main indicators in the "Automotive Disruption Radar"
Source: Roland Berger
27 indicators
Type approval process
Autonomous vehicle – Computing power
Digital sales channel – OEM
EV portfolio
Automotive products (Level 4+)
R&D intensity – Autonomous driving
Test roads – Autonomous vehicle
Vehicle-2-vehicle communication
EV/PHEV charging infrastructure
Mobile network – 5G coverage
Venture Capital invest – Artificial intelligence
Venture Capital invest – Mobility
Battery cost – EVs
Patent activities
Automotive association activities
CO2 legislation
Restrictions for ICEs
Customer curiosity
Mobility behavior
EV preference
Digitized culture preference
Autonomous vehicle preference
Mobility concept preferences
EV/PHEV sales
Amount of shared vehicles
Mobility planning
Multi modal mobility
Industry activity
5
Customer interest
1
Regulation
2
Technology
3
Infrastructure
4

10 18_10_17 Bologna ISP_Anfia_RB_AM.pptx
La guida autonoma è un percorso a più livelli (5 secondo SAE): diversi percorsi/approcci per costruttori tradizionali e new comer
Note: AD classification for SAE international (Society of Automotive Engineers) has one level more vs. NHTSA (National Highway Traffic Safety Administration), with high and full automation Source: SAE, Roland Berger
Google car (Waymo)
All modes door 2 door
Robocab (cities) Highway (high speed) Parking and other
closed environments (eg. theme park, plants)
Highway autopilot
In lane traffic jam assistance
On-going initiatives on full autonomous vehicles
Line keeping system
1 2 3 4 5 Automation Levels (SAE)
Navya shuttle
Uber robocab Driver
assistance
2016 Partial
automation
2016 Conditional automation
2018 High automation
2020-25 Full automation
2025-30 Expected first launch
OEMs way
Tech players way
Good weather conditions
Limited lateral or longitudinal
control
Limited AD in very specific conditions
Driver has to take control
back from car at any time
Full autonomous drive in specific
environment
No driver required

11 18_10_17 Bologna ISP_Anfia_RB_AM.pptx
Gli annunci da parte degli OEM sulla guida autonoma stanno accelerando
Source: Evercore, OEM information, Press review
Lanci attesi dei veicoli autonomi
Automation level (SAE)
5 Full automation
4 High
automation
3 Conditional automation
• BMW / Ottomatika
• Fiat Chrysler / Google (tests)
• Uber / Daimler
• Uber / Volvo
• Lyft / Nutonomy
• Waymo (Google) / Avis
• Apple / Hertz
• Fiat / BMW / Intel / FCA
• Toyota / Nvidia
• Microsoft / Baidu
Full autonomous drive under specific
environment (ex : valet parking)
Driver could take control back at any moment (ex :
highway auto-pilot)
No more driver required (ex : robocab)
2018 2019 2020 2025 2021
Google Waymo
Nutonomy Self-driving taxis
Mercedes F015 (in 2030)
Audi A8 "Jack"
Nissan Propilot
Renault Zoe EV
Volvo XC90
Audi A8
BMW iNext
Driverless car
2024 Partnerships
Key acquisitions • Delphi / Ottomatika (2015)
• GM / Cruise
• Ford / Argo AI
• Uber / Otto
• GM / Lyft (investment)
• Intel / Mobileye
Other moves • Aurora creation by ex Tesla /
Google employees
• Launch of Lyft open data platform
• Mass-Manufacturing started by GM
?
With BMW / Intel
Toyota
PSA Diverse prototypes tested
Hyundai Ioniq

12 18_10_17 Bologna ISP_Anfia_RB_AM.pptx
Il dominio tecnologico con il più alto livello di disruption è il powertrain
Impact of technology shifts by domain
Source: Lazard, Roland Berger
Disruption impact on current business
Supplier domain Low High
Interior
Exterior
Chassis
Powertrain
Powertrain > E-motors and power electronics
> Battery systems
> Simple 1-2 step reduction gears
Interior > New HMI / display technologies
> Extended Infotainment solutions
> Increased interior insulation (NVH)
> Integration of electronics and surfaces
Next generation vehicle concept
Substantial new requirements for the supply base
Chassis > Advanced driver assistance systems and autonomous features
> Adaptive suspensions
> Active steering and braking systems
> Shifting material focus and growing importance of multi-material applications
> Growth of non-structural composites
Exterior

13 18_10_17 Bologna ISP_Anfia_RB_AM.pptx
2025 2020 2010 2030/2035 2015
101.9 94.9
74.4
88.8
Nel breve medio termine i volumi sono previsti in leggera crescita, in rallentamento rispetto al passato - incertezza nel lungo periodo
> Growth has recently being slowing down in mature markets
> In the future, supplier revenue growth will be determined more by the product portfolio and content per vehicle than by underlying production volume growth
> After 2025, a decline of overall production volumes might occur in a disruptive scenario
Business as usual
Disruptive scenario (RoboCabs)
Recovery and sustained growth
Growth slow down
Growth stagnation
Emergence of shared and autonomous
mobility
Short term Mid term Long term
> Slowing growth in mature markets – US – Europe – Japan – Korea
> Shifting content per vehicle
> Suppliers growth perspective will depend on product portfolio
> Less ownership and higher utilization of mobility services
> Exponential adoption of RoboCabs possible
Today
CAGR 3.5%
CAGR 2.4%
CAGR ~1-2%
Shared mobility ?
Short to long term growth perspectives [LV production; m units]
Source: IHS, Global RB Mobility Revenue and Profit Pool Model, Lazard, Roland Berger

14 18_10_17 Bologna ISP_Anfia_RB_AM.pptx
Agenda
This document shall be treated as confidential. It has been compiled for the exclusive, internal use by our client and is not complete without the underlying detail analyses and the oral presentation.
It may not be passed on and/or may not be made available to third parties without prior written consent from .
© Roland Berger
Q&A
C
Conquistare la solidità finanziaria, prerequisito per la competitività
Sfide per i fornitori Auto
B
Verso la disruption nel settore Auto
Scenario di riferimento
A
5' Tempo
'10 Tempo
'10 Tempo
15 18_10_17 Bologna ISP_Anfia_RB_AM.pptx
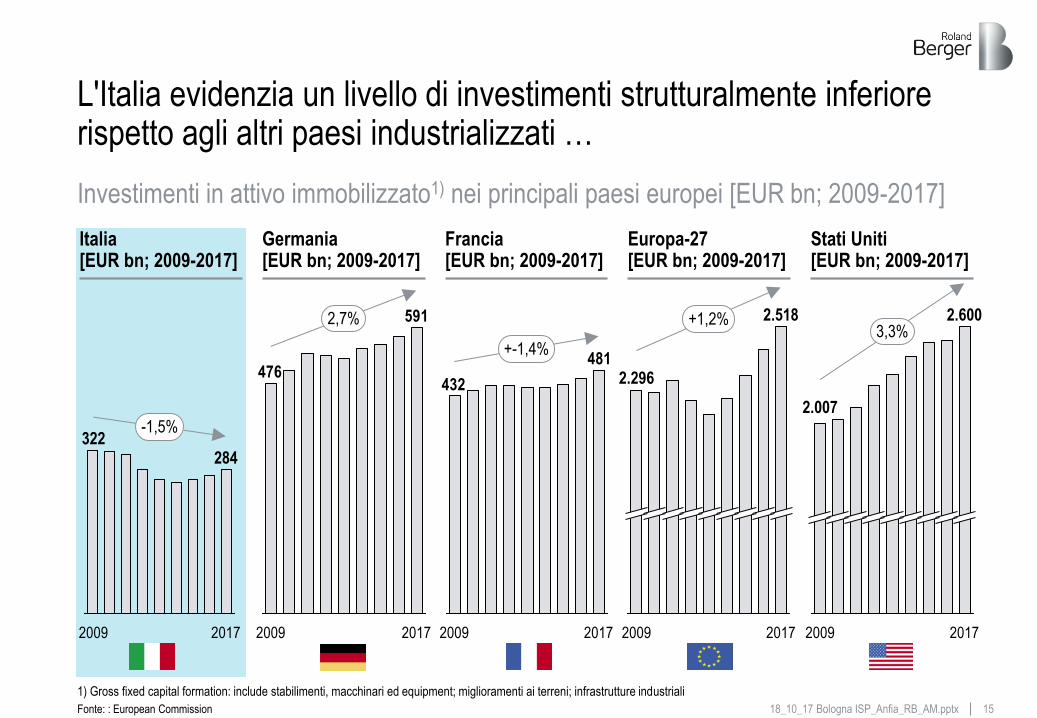
L'Italia evidenzia un livello di investimenti strutturalmente inferiore rispetto agli altri paesi industrializzati …
-1,5%
284
2009
322
2017
591
476
2009 2017
2,7%
481
432
2009 2017
+-1,4%
2.518
2017
2.296
2009
+1,2%
Investimenti in attivo immobilizzato1) nei principali paesi europei [EUR bn; 2009-2017]
Italia [EUR bn; 2009-2017]
Germania [EUR bn; 2009-2017]
Francia [EUR bn; 2009-2017]
Europa-27 [EUR bn; 2009-2017]
Stati Uniti [EUR bn; 2009-2017]
2.600
2.007
2009 2017
3,3%
Fonte: : European Commission
1) Gross fixed capital formation: include stabilimenti, macchinari ed equipment; miglioramenti ai terreni; infrastrutture industriali

16 18_10_17 Bologna ISP_Anfia_RB_AM.pptx
… pur con una inversione di tendenza mostrata da una ripresa degli investimenti confermata nel medio termine
Investimenti in attivo immobilizzato1): focus Italia [2012-19; EUR bn; prezzi costanti]
305298284
274265260266285
2012 2019F 2017 2014 2018F 2013 2016 2015
-2,3% 3,5% 3,6%
Forecast > In Italia gli investimenti in asset sono stati
fortemente colpiti dalla recessione, registrando una ripresa più lenta rispetto ai paesi Europei comparabili (CAGR 12-15 -2,3% in Italia vs. +0,85% Euro Area)
> Nel 2015 gli investimenti hanno iniziato a dimostrare segni di ripresa, in linea con un aumento della produzione industriale e un miglioramento dell'outlook economico
> I feedback del mercato suggeriscono un aumento sino al 2019 (+3,6% CAGR 2017-19) spinto dalla ripresa, su scala globale, dei settori pivot dell'economia Italiana (e.g. settore dei macchinari prevista una crescita del 4% a livello globale)
Investimenti [EUR bn]
1) Gross fixed capital formation: include stabilimenti, macchinari ed equipment; miglioramenti ai terreni; infrastrutture industriali
Fonte: European Commission (AMECO); IHS
17 18_10_17 Bologna ISP_Anfia_RB_AM.pptx
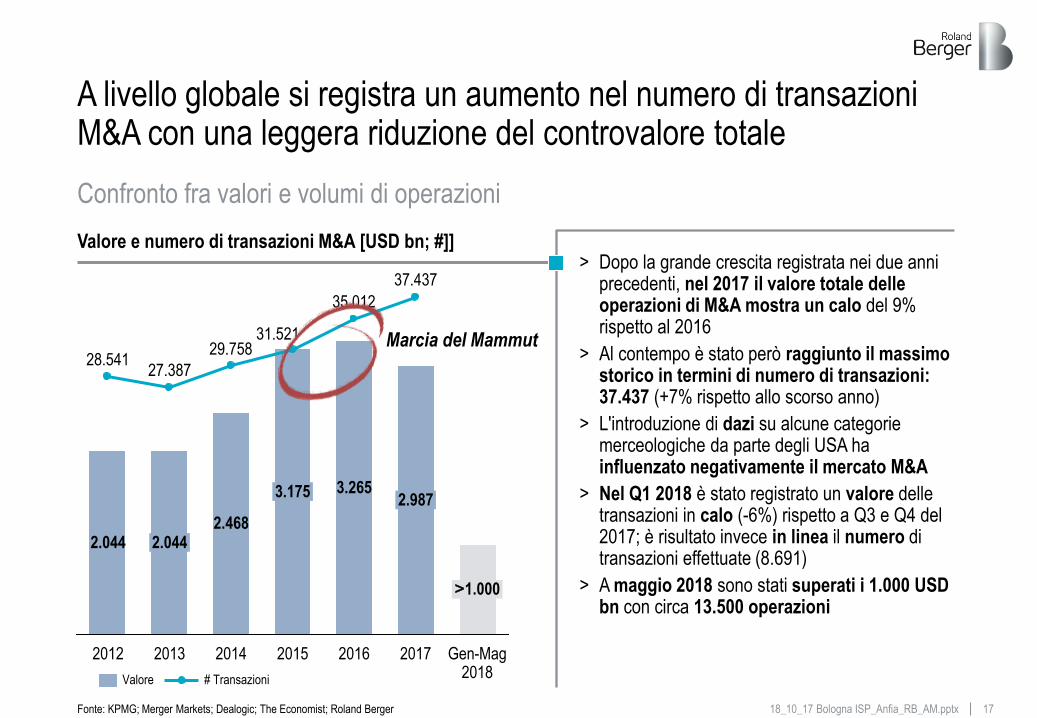
A livello globale si registra un aumento nel numero di transazioni M&A con una leggera riduzione del controvalore totale
> Dopo la grande crescita registrata nei due anni precedenti, nel 2017 il valore totale delle operazioni di M&A mostra un calo del 9% rispetto al 2016
> Al contempo è stato però raggiunto il massimo storico in termini di numero di transazioni: 37.437 (+7% rispetto allo scorso anno)
> L'introduzione di dazi su alcune categorie merceologiche da parte degli USA ha influenzato negativamente il mercato M&A
> Nel Q1 2018 è stato registrato un valore delle transazioni in calo (-6%) rispetto a Q3 e Q4 del 2017; è risultato invece in linea il numero di transazioni effettuate (8.691)
> A maggio 2018 sono stati superati i 1.000 USD bn con circa 13.500 operazioni
Confronto fra valori e volumi di operazioni
Valore e numero di transazioni M&A [USD bn; #]]
Fonte: KPMG; Merger Markets; Dealogic; The Economist; Roland Berger
Gen-Mag 2018
2016 2013 2014 2012 2017
29.758
2.044 2.044
2015
28.541 27.387
3.175
2.468
31.521
37.437
2.987
>1.000
35.012
3.265
Valore # Transazioni
Marcia del Mammut

18 18_10_17 Bologna ISP_Anfia_RB_AM.pptx
Il mercato rimane solido in Italia, con un numero di operazioni in crescita e una flessione del controvalore del 20% nel 2017
2017: operazioni con società Acquirente Straniera e Target
Italiana
2017: operazioni con società Acquirente
Italiana e Target Estera
Mercato M&A Italia, valore cumulato delle operazioni per anno [EUR bn, 2011/2017]
Focus sul 2017: punti chiave
[# operazioni] Operazioni M&A di società estere su target Italiane nel 2017
266
[# operazioni] Operazioni M&A di società Italiane su target estere nel 2017
159
[EUR m] Valore medio di un'operazione M&A nel 2017 85
[EUR m] Valore medio di un'operazione M&A nel 2017 57
329 340 381 543 583 829
[USD bn, 2016] Mercato M&A Globale 2.987 [USD bn, 2016] Mercato M&A Europeo 656
7
17 1410
14
26
3
4 1310
12
187
13
2732
20
15
9
23
2016
2
28
2014 2013
50
26
31
58 56
2015 2017
47
2011 2012 2017: operazioni con società Acquirente
Italiana e Target Italiana
[# operazioni] Operazioni M&A di società Italiane su target Italiane nel 2017
392
[EUR m] Valore medio di un'operazione M&A nel 2017 38
# operazioni
Mercato M&A Italia e operazioni Cross-border
817
Fonte: MergerMarket; KPMG; Roland Berger

19 18_10_17 Bologna ISP_Anfia_RB_AM.pptx
Nel 2018 si osserva una rilevante attività M&A nella componentistica Automotive con operazioni promosse da investitori USA e cinesi
2013
Amtek / Neumayer Tekfor
Wanxiang Group/ A123
Ningbo Huaxiang / HIB Trim Parts
Huayu Auto. Systems / Yanfeng Visteon JV
BorgWarner/ Wahler
Mahle/ Behr
Gentherm/ W.E.T. Automotive
Tokai Rubber/ Anvis
Grammer/ Nectec
Gentex/ JCI HomeLink
TMT / ZF Boge
Halla/ Visteon climate business
Wangfeng/ Meridian Lightweight
Nidec/ Honda Elesys
2014
Amtek/ Kuepper Group
AVIC/ Hilite
AVIC/ KOKI Technik
AUNDE/ Fehrer
Amtek/ Kaiser
Bosch / ZF Lenksysteme
Shanghai Prime Machinery/Nedschroef
MAHLE/ Letrika
ZF/ TRW
Lear/ Eagle Ottawa
Visteon/ JCI auto. electronics bus.
Sensata/ Schrader
Delphi/ Unwired Technology
Federal-Mogul/ TRW valves business
2015
AVIC Automotive/ Henniges
China National Tire/ Pirelli
Delphi/ HellermannTyton
Continental/ Elektrobit
BorgWarner/ Remy International
Grupo Antolin/ Magna interior business
Mann+Hummel / Affinia
Magna/ Getrag
Linamar/ Montupet
Johnson Electric / Stackpole
MAHLE/ Delphi thermal business
NGK Spark Plug/ Wells Vehicle Electronics
Valeo/ Peiker Acustic
Harman/ Symphony Teleca/Redbend
2016
Illinois Tool Works/ TRW Auto. Elec. & Comp.
Musashi Seimitsu/ Hay
Freudenberg/ TBVC
Yinyi Group/ Punch Powertrain
Plastic Omnium/ Faurecia exterior bus.
Ningbo Joyson/ KSS
Megatech/ Boshoku Europe
Valeo/ FTE Automotive
Samsung/ Harman
Valeo/ Ichikoh
VBP Group/ Mobile Climate Ctrl. Group
American Axle/ Metaldyne
Mecaplast/ Key Plastics
CIE Automotive / Grupo Amaya Telleria
Intel/ Mobileye
Superior Industries/ Uniwheels
Lear/Grupo Antolin (Seating & Metal B.ness)
BorgWarner/ Sevcon
ZMJ/CRCI / Bosch SMG
Luxshare / ZF Body Controls
Fountain West/Bosch Mahle Turbo Chargers
2017
KSS/ Takata
TE Connectivity/ Hirschmann Car Comm.
Fuxin Dare Automotive/ Carcoustics
Motherson Sumi Systems /PKC Group
Genuine Parts/ Alliance Automotive
CIE Automotive/ Newcor
WABCO/ RH Sheppard
Selected automotive supplier acquisitions, 2012-2017 (YTD)
Key: Acquirer/Target Note: Excluding financial sponsor led transactions. Some 2017 transactions are signed, but not yet closed
Source: Zephyr, Capital IQ, Thomson, Dealogic, Merger Market, press research, Lazard, Roland Berger
2018
Tenneco Inc./Federal-mogul Corporation
Autoliv Inc../ Veoneer Inc
Jiye Auto Parts Gmbh/Grammer Ag
Aptiv Plc/Kum Inc.
Schaeffler India Ltd/LUK India Pvt Ltd
Superior Industries Intern. Germany Ag/Uniwheels Ag
Accuride Corporation/Mefro Wheels Gmbh
Magna International Inc./Olsa Spa
Shanghai Daimay Automotive Interior/Motus Integrated Tech.
Samvardhana Motherson Group Bv/Reydel Automotive
Z. Wanfeng Auto Wheel /Wuxi Xiongwei Jinggong
Pacific Industrial Co/Schrader-Bridgeport & August France
Pierer Industrie Ag/ Pankl Racing Systems
Zhejiang Geely Royal Engine/Ningbo Umd

20 18_10_17 Bologna ISP_Anfia_RB_AM.pptx
20
L'Automotive segue l'organizzazione di filiera, in cui la testa è tipicamente il costruttore e grandi OES rappresentano snodi chiave
> Passengers per uso urbano / periurbano / commuting
• Transportation - W. Europe
Domanda finale
> Passengers per media-lunga distanza
> PaC
> Powertrain
> Chassis
> Exteriors
> Interiors
> Infotainment
> Coach / bus
> Metro
> …
Building block industriali – Filiera e catena di fornitura rilevante - Illustrativo
1. Driver assistance systems
2. Braking systems
3. Axles
4. Suspension systems
5. Wheels
6. Electronic braking assistant components
7. Tires
8. Steering systems
9. Parking brake
10. Active Front Steering
11. Pedals
12. 4-wheel steering
OEM
OES
Esempio: fornitore fastening systems
Fonte: Roland Berger
Esempio di filiera
Estratto dominii applicativi
21 18_10_17 Bologna ISP_Anfia_RB_AM.pptx
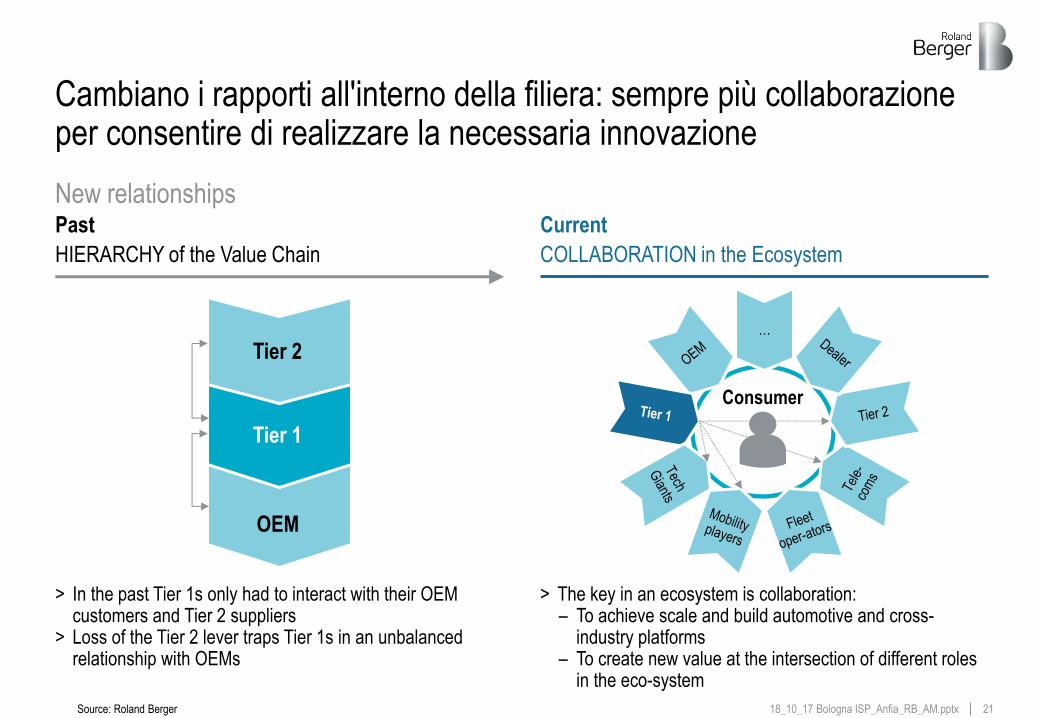
Cambiano i rapporti all'interno della filiera: sempre più collaborazione per consentire di realizzare la necessaria innovazione
New relationships Past
HIERARCHY of the Value Chain
> In the past Tier 1s only had to interact with their OEM customers and Tier 2 suppliers
> Loss of the Tier 2 lever traps Tier 1s in an unbalanced relationship with OEMs
Current
COLLABORATION in the Ecosystem
> The key in an ecosystem is collaboration: – To achieve scale and build automotive and cross-
industry platforms – To create new value at the intersection of different roles
in the eco-system
Tier 2
Tier 1
OEM
Consumer
…
Source: Roland Berger

22 18_10_17 Bologna ISP_Anfia_RB_AM.pptx
La generazione di cassa e la sua allocazione condizionano la futura competitività dei fornitori: finanza di filiera come strumento abilitante
Capacity rightsizing
Target cost budget
Purchasing excellence
Lean overhead
Operational efficiency
Current cost
runrate
R&D efficiency
Maximize resource generation (efficiency) Strategically allocate resources (effectiveness)
Reduce cost and improve output adapting to lower volumes and higher competitive pressure
Generate additional cash by strategically focusing spending on the right products, investments and R&D activities
Target cash flow
Focus R&D on key segments
Rethink investments
Active portfolio management
Cash flow budget 2018
Reduce operational cost base Strategically rethink cash allocation
Supplier performance improvement – Main levers and budget impact
Source: Lazard, Roland Berger

23 18_10_17 Bologna ISP_Anfia_RB_AM.pptx
Agenda
This document shall be treated as confidential. It has been compiled for the exclusive, internal use by our client and is not complete without the underlying detail analyses and the oral presentation.
It may not be passed on and/or may not be made available to third parties without prior written consent from .
© Roland Berger
Q&A
C
Conquistare la solidità finanziaria, prerequisito per la competitività
Sfide per i fornitori Auto
B
Verso la disruption nel settore Auto
Scenario di riferimento
A
5' Tempo
'10 Tempo
'10 Tempo