Automation for accurate and reliable quality control ...
4
Automation for accurate and reliable quality control measurements CASE STUDY Kulicke & Soffa Liteq B.V. Kulicke & Soffa (NASDAQ: KLIC) is a leading provider of semiconductor packaging and electronic assembly solutions, supporting the global automotive, consumer, communications, computing, and industrial markets. Introduction Lithography is a crucial microfabrication technique used in the semiconductor and electronics industries. It involves coating a substrate with a light-sensitive material, applying a patterned mask, and exposing it to radiation or chemicals to yield a patterned coating on a surface. The importance of lithography becomes evident when considering that it accounts for 30% of the manufacturing costs of producing integrated circuits. “At Kulicke & Soffa, we manufacture world-class projection steppers that need to comply with rigorous quality requirements”, Sylvain Misat says. “In our research and development (R&D) laboratory, we have chosen the Thermo Scientific ™ Phenom XL ™ desktop scanning electron microscope (SEM) as part of our process validation procedure. Apart from its ease of use and the ability to accommodate 100 mm x 100 mm samples, the Thermo Scientific Phenom XL has the fastest loading cycle for a desktop SEM in its class”. Sylvain Misat, manager of photolithography applications, Kulicke & Soffa Liteq B.V.
Transcript of Automation for accurate and reliable quality control ...

Automation for accurate and reliable quality control measurements
CASE STUDY Kulicke & Soffa Liteq B.V.
Kulicke & Soffa (NASDAQ: KLIC) is a leading provider of semiconductor packaging and electronic assembly solutions, supporting the global automotive, consumer, communications, computing, and industrial markets.
Introduction Lithography is a crucial microfabrication technique used in the semiconductor and electronics industries. It involves coating a substrate with a light-sensitive material, applying a patterned mask, and exposing it to radiation or chemicals to yield a patterned coating on a surface. The importance of lithography becomes evident when considering that it accounts for 30% of the manufacturing costs of producing integrated circuits.
“At Kulicke & Soffa, we manufacture world-class projection steppers that need to comply with rigorous quality requirements”, Sylvain Misat says. “In our research and development (R&D) laboratory, we have chosen the Thermo Scientific™ Phenom XL™ desktop scanning electron microscope (SEM) as part of our process validation procedure. Apart from its ease of use and the ability to accommodate 100 mm x 100 mm samples, the Thermo Scientific Phenom XL has the fastest loading cycle for a desktop SEM in its class”.
Sylvain Misat, manager of photolithography applications, Kulicke & Soffa Liteq B.V.
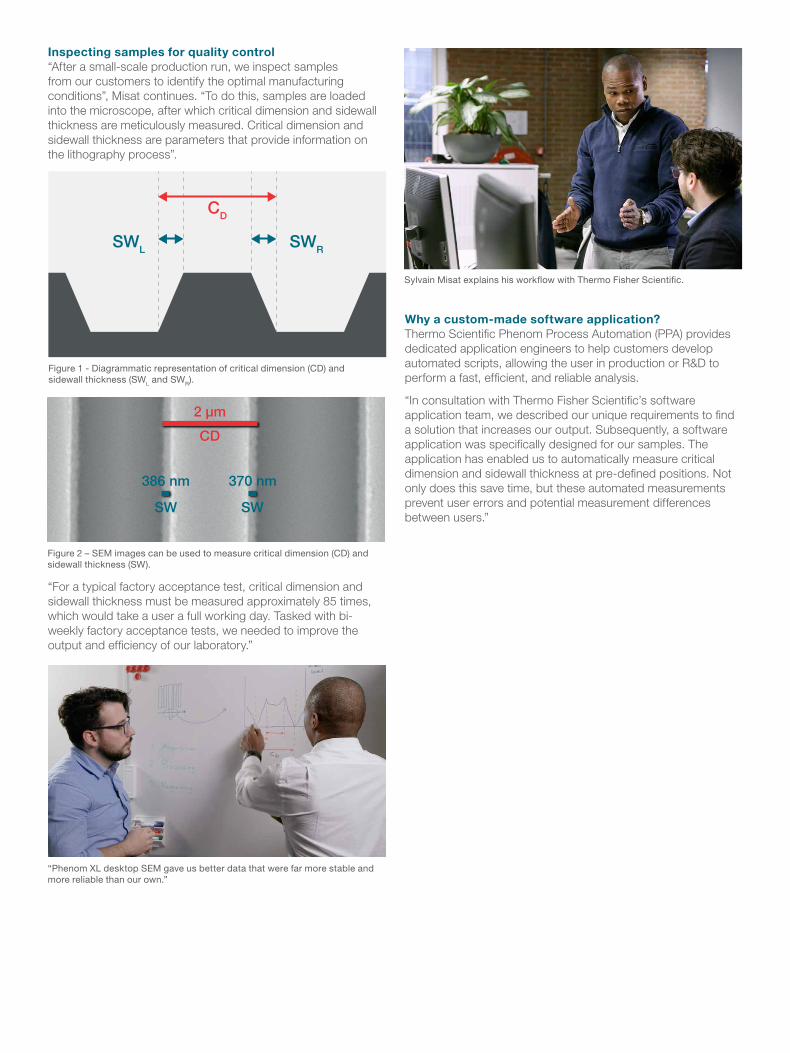
Inspecting samples for quality control“After a small-scale production run, we inspect samples from our customers to identify the optimal manufacturing conditions”, Misat continues. “To do this, samples are loaded into the microscope, after which critical dimension and sidewall thickness are meticulously measured. Critical dimension and sidewall thickness are parameters that provide information on the lithography process”.
“For a typical factory acceptance test, critical dimension and sidewall thickness must be measured approximately 85 times, which would take a user a full working day. Tasked with bi- weekly factory acceptance tests, we needed to improve the output and efficiency of our laboratory.”
Why a custom-made software application?Thermo Scientific Phenom Process Automation (PPA) provides dedicated application engineers to help customers develop automated scripts, allowing the user in production or R&D to perform a fast, efficient, and reliable analysis.
“In consultation with Thermo Fisher Scientific’s software application team, we described our unique requirements to find a solution that increases our output. Subsequently, a software application was specifically designed for our samples. The application has enabled us to automatically measure critical dimension and sidewall thickness at pre-defined positions. Not only does this save time, but these automated measurements prevent user errors and potential measurement differences between users.”
Figure 2 – SEM images can be used to measure critical dimension (CD) and sidewall thickness (SW).
Figure 1 - Diagrammatic representation of critical dimension (CD) and sidewall thickness (SWL and SWR).
2 µm
CD
370 nm
SW
386 nm
SW
CD
SWRSWL
Sylvain Misat explains his workflow with Thermo Fisher Scientific.
“Phenom XL desktop SEM gave us better data that were far more stable and more reliable than our own.”

During operation, the script displays all relevant measurements that are exported to a CSV file.
Conclusion“With the help from Thermo Fisher Scientific™, our lab’s efficiency has been improved. Not only was a laborious manual task automated, requiring minimal user input, but the results are more reliable due to a decrease in operator error.”
The benefits of automationFor the application, the workflow involves loading the sample, and setting the coordinates of all the positions where measurements need to be taken. These coordinates are relative to the reference position which the user moves to after performing an alignment procedure. The diagram below highlights the workflow of the application (Figure 3):
Whereas making accurate measurements manually require uninterrupted attention from the user for prolonged periods, the application takes these measurements automatically, requiring no further input from the user.
The application makes automatic measurements over a distance of 6 microns, which yields more reliable results than manual measurements, which are performed only at one position.
Figure 3 - Application workflow with the automated part of the process highlighted in red.
Automatically repeated until finished
Performed by user
Load sample
Upload relative coordinates
Move to reference position
Add information to CSV file
Measure critical dimension and sidewall thickness
Alignment procedure
Navigate to region of interest
Figure 5 - Script UI, highlighting the area over which critical dimensions were measured (left), and tabulated results (right).
Figure 4 - Without an automated solution, an operator would literally spend days evaluating and measuring this sample.
100 μm

For current certifications, visit thermofisher.com/certifications. © 2020 Thermo Fisher Scientific Inc. All rights reserved. All trademarks are the property of Thermo Fisher Scientific and its subsidiaries unless otherwise specified. CS0038-EN-03-2020
Find out more at thermofisher.com/phenom-xl
Notes