Automatic annotation of N-glycans in MALDI-TOF spectra for rapid glycan profiling and comparison...
28
Automatic annotation of N-glycans in MALDI-TOF spectra for rapid glycan profiling and comparison Chuan-Yih, Yu 2010.05.14 Capstone Presentation Advisor: Prof. Haixu Tang Indiana University Bloomington School of Informatics and Computing
-
Upload
osborn-shawn-hoover -
Category
Documents
-
view
232 -
download
0
Transcript of Automatic annotation of N-glycans in MALDI-TOF spectra for rapid glycan profiling and comparison...

Automatic annotation of N-glycans in MALDI-TOF spectra for rapid glycan profiling and comparison
Chuan-Yih, Yu
2010.05.14 Capstone Presentation
Advisor: Prof. Haixu Tang
Indiana University Bloomington School of Informatics and Computing

2
Outline
• Background
• Problem definition and goals
• Implementation of Multi N-Glycan
• Results
• Future work

3
Background
• Post-Translation Modification (PTM)– Enzyme-catalyzed protein modification after protein synthesized– Acetylation, Glycosylation, Methylation, Phosphorylation,
Prenylation, and etc.
• >50% of all eukaryotic proteins are glycosylated1
[Apweiler, et al.]
1.Apweiler, R., H. Hermjakob, and N. Sharon, On the frequency of protein glycosylation, as deduced from analysis of the SWISS-PROT database. Biochim Biophys Acta, 1999. 1473(1): p. 4-8
http://yahoo.brand.edgar-online.com/EFX_dll/EDGARpro.dll?FetchFilingHTML1?SessionID=WD8AC7y2l3h1FMr&ID=5101862

4
Glycosylation
• Attachment of a glycan(sugar) to the peptide chain• N-linked glycosylation
– Nitrogen link to Asn– Asn-X-Ser(NXS) or Asn-X-Thr(NXT), X can be any but
Pro (glycosylation sequon)– Core structure – 2 GlcNac + 3 Man– Glycosylation while folding
• O-linked glycosylation– Many different core structures– Serine or Threonine– Glycosylation after folding

5
N-linked glycosylation • Tree structure• Monosaccharides- building blocks of
polysaccharide chain• Diverse linkage – at most four
branches• Three types of N-linked glycan tree
– High mannose– Complex– Hybrid
Graphs: Varki, A., Essentials of glycobiology. 2nd ed. 2009, Cold Spring Harbor, N.Y.: Cold Spring Harbor Laboratory Press. xxix, 784 p
Name Molecular formula/ Structure
Mannose (Man) C6H12O6
Galactose (Gal) C6H12O6
Fucose (Fuc) C6H12O5
GlcNac C8H15NO6
NeuNAC C11H19NO9
NeuNGC C11H19NO10

6
Analytical strategies for analyzing glycans
7
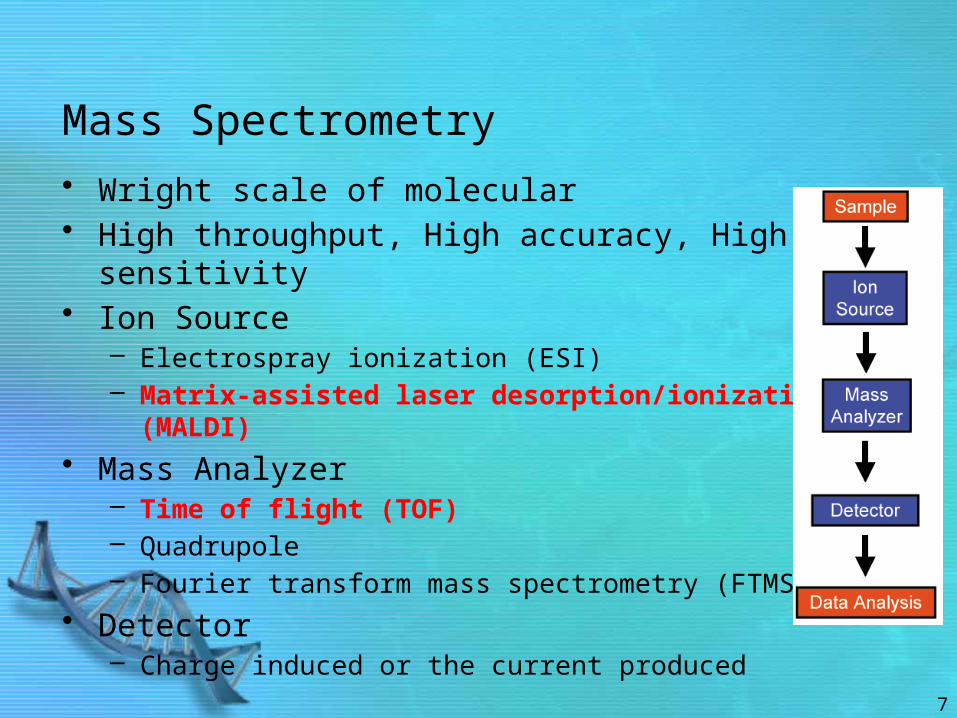
Mass Spectrometry
• Wright scale of molecular • High throughput, High accuracy, High sensitivity• Ion Source
– Electrospray ionization (ESI)– Matrix-assisted laser desorption/ionization (MALDI)
• Mass Analyzer– Time of flight (TOF)– Quadrupole– Fourier transform mass spectrometry (FTMS)
• Detector– Charge induced or the current produced

8
Mass Spectrometry Spectrum
Isotopic envelope

9
N-Glycan Profiling
• Given a MS spectrum screen which glycans present in this spectrum (annotation) and how abundance it is (quantification)

10
Problem Definition
• Glycan isotope envelope– Isotope present in the natural world
• different numbers of neutrons
Graphs: Isotope Pattern Calculator v4.0 http://yanjunhua.tripod.com/pattern.htm http://en.wikipedia.org/wiki/Carbon
2 GlcNac + 9 Man = 2374.5960 7 GlcNac + 3 Man = 2375.63
Mass % Mass %
2371 0.0
2372 84.3 2372 0.0
2373 100.0 2373 82.4
2374 68.5 2374 100.0
2375 34.3 2375 68.8
2376 13.9 2376 34.4

11
Problem Definition
7 GlcNac + 3 Man = 2375.632 GlcNac + 9 Man = 2374.59602 GlcNac + 9 Man = 2374.5960
?Unknown2 GlcNac + 9 Man = 2374.5960

12
Goals
• Annotation of N-glycan – Decompose observed isotopic envelopes into non-overlapping
and overlapping isotopic envelopes of glycan– Quantify the relative abundance of glycan
• Glycan profile comparison– Report glycans that show significant different abundance between
groups of samples– Discover glycan biomarkers

13
Glycans Annotation
• For each glycan ( i.e. monosaccharides composition)
– 412 different glycans [Krambeck, et al. ]1
– Generate a theoretical isotope envelope– Calculate the correlation between the theoretical and
observed isotope envelopes for each of following scenarios
1. Glycans
2. Glycans + Glycans, linear fitting applied
3. Glycans + Unknown, linear fitting applied– Mercury algorithm2 - generate the unknown isotope
envelopes
2.Rockwood, A., S. Van Orden, and R. Smith, Rapid Calculation of Isotope Distributions. Analytical Chemistry, 1995. 67: p. 2699-2704.
1.Krambeck, F.J. and M.J. Betenbaugh, A mathematical model of N-linked glycosylation. Biotechnol Bioeng, 2005. 92(6): p. 711-28.

Three scenarios
Experimental isotope envelope
Glycan CorrelationScore
14
Theoretical isotope envelope
0.2
0.8
0.6
α
Glycan
β
α
Unknown
β

15
Glycan Profiles
• Decompose the abundance for two glycans with overlapping isotopic envelopes
α
Glycans
β
GlycansExperimental
isotope envelope

16
Glycan Profile Comparison
• Comparison of glycan abundances in multiple samples• Biomarker discovery
– Given glycan spectra from multiple samples under different (e.g. disease vs. health) conditions
– Goal: To find glycans with distinct abundances between samples
Z Kyselova, Y. Mechref, M. M. Al Bataineh, L. E. Dobrolecki, R. J. Hickey, J. Vinson, C. J. Sweeney, and M. V. Novotny. Alterations in the serum glycome due to metastatic prostate cancer. Journal of Proteome Research, 6:18221832, 2007.

17
Approach
Health spectra(H1, H2, H3…Hk)
Disease spectra(D1, D2, D3…Dk)
Remove the least significant component. Repeat until all the score above threshold.
1.Hastie, T., et al., 'Gene shaving' as a method for identifying distinct sets of genes with similar expression patterns. Genome Biol, 2000. 1(2): p. RESEARCH0003
70% identical with a cutoff at 0.5

18
Implementation of Multi N-Glycan
• Software Requirements– .net framework 2.0 using C#– C++ runtime– [R] for PCA analysis– Thermo Scientific Xcalibur
• Input– Spectrum
• File format: Plain text (Peak list), mzXML1,RAW file (Thermo Scientific raw file)
– N-Glycans list• CSV file (User-defined); default define by
[Krambeck, et al. ]
• Output– List of glycans with scores
1.Pedrioli, P., et al., A Common Open Representation of Mass Spectrometry Data and its Application in a Proteomics Research Environment. Nature Biotechnology, 2004. 22(11): p. 1459-1466.

19
Software Interface

20
Software features
• Signal preprocessing provided– Subtracting background – Smoothing and picking peaks– Tolerating mass accuracy
• Flexible parameters incorporate actual experiment• Isotope envelopes generator• Content rich output, supporting multiple formats
– csv, text, html

21
Software screenshot
Html result export

22
Software screenshot

23
Result
• Data set [ Zhiqun T., et al]– Liver Cancer : 73 individuals– Health: 78 individuals
• 412 N-glycan are used• Parameters
– Correlation score < 0.5 will be discarded.– Present in >30% of all samples
1.Zhiqun T., et al., Identification of N-Glycan Serum Markers Associated with Hepatocellular Carcinoma from Mass Spectrometry Data. J Proteome Res, 2009

24
Result Derived from The Paper
Filtered out
Can’t find the glycan structure neither in my list nor CFG database
Low c
orre
latio
n
scor
e
Ove
rlap
with 2
192
Zhiqun T., et al., Identification of N-Glycan Serum Markers Associated with Hepatocellular Carcinoma from Mass Spectrometry Data. J Proteome Res, 2009
Identified
25
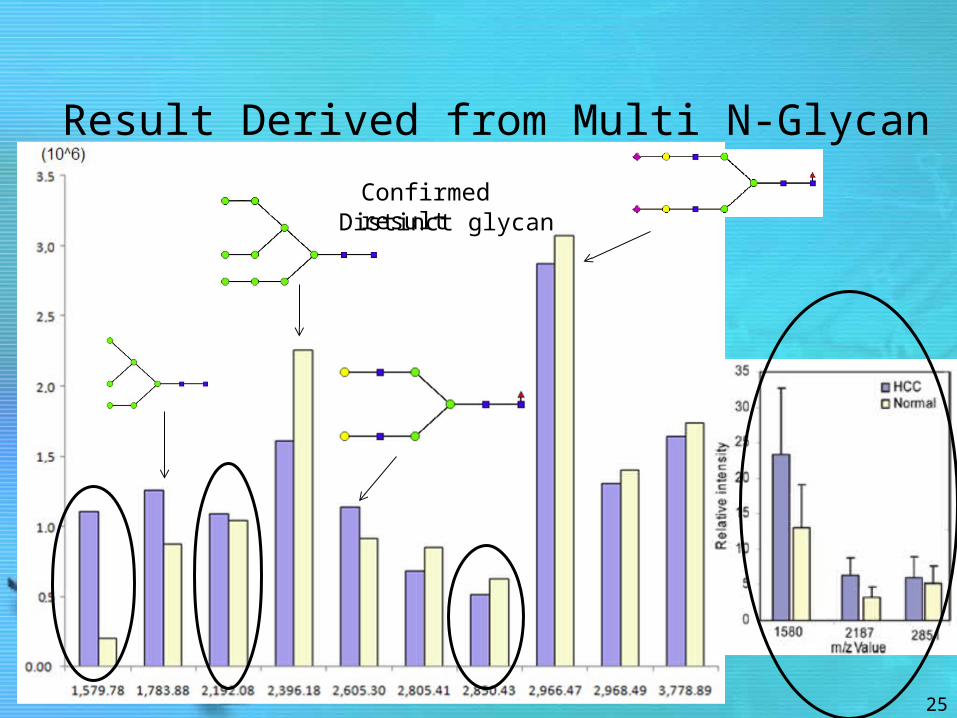
Result Derived from Multi N-Glycan
Confirmed resultDistinct glycan

26
Future Work
• Test on more clinical samples
• Extend to O-glycan profiling
• Apply de novo glycan sequencing on reported glycan (ongoing)
• Connect reported glycans to glycan research literatures

27
Acknowledge
• Advisor: Prof. Haixu Tang • Co-worker: Anoop Mayampurath• Collaborator: Yehia Mechref, Department of Chemistry• COL Lab members
• This work will be presented on May 26th 2010, 58th ASMS Conference Salt Lake City, Utah; and will be submitted to the Bioinformatics.
• This work is funded by NCI/NIH grant number 1 U01 A128535-01.

Thank You