Automated, high sensitivity analysis of single ... · 3 Results and discussion Time resolved...
6
Introduction Advances in nanotechnology are forecast to have a major impact on a broad range of industry segments. Because of the novel physical and chemical characteristics of nanoparticles (NPs), much remains unknown of their environmental fate and toxicological properties. As a result, there is a growing need for a rapid, accurate, sensitive technique for characterizing and quantifying NPs in a wide range of sample types. ICP-MS can be used to measure individual NPs using a technique called single particle ICP-MS (sp-ICP-MS). This approach allows simultaneous determination of NP size, size distribution, elemental composition, and number concentration in a single, rapid analysis [1-3]. Recent enhancements to ICP-MS hardware and software have further improved this technique. Agilent has developed a dedicated Single Nanoparticle Application Module for ICP-MS MassHunter software (G5714A) to simplify sp-ICP-MS analysis using the Agilent 7900 ICP-MS. The 7900 ICP-MS uses short dwell times (below 1 ms) and fast Time Resolved Analysis (TRA) mode, permitting single element acquisition at a sampling rate as fast as 100 μs, with no settling time. Automated, high sensitivity analysis of single nanoparticles using the Agilent 7900 ICP-MS with Single Nanoparticle Application Module Application note Authors Michiko Yamanaka, Kazuo Yamanaka and Takayuki Itagaki Agilent Technologies, Japan Steven Wilbur Agilent Technologies, USA Ed McCurdy Agilent Technologies, UK Materials, environmental
-
Upload
nguyennguyet -
Category
Documents
-
view
219 -
download
2
Transcript of Automated, high sensitivity analysis of single ... · 3 Results and discussion Time resolved...
Introduction
Advances in nanotechnology are forecast to have a major impact on a broad range of industry segments. Because of the novel physical and chemical characteristics of nanoparticles (NPs), much remains unknown of their environmental fate and toxicological properties. As a result, there is a growing need for a rapid, accurate, sensitive technique for characterizing and quantifying NPs in a wide range of sample types. ICP-MS can be used to measure individual NPs using a technique called single particle ICP-MS (sp-ICP-MS). This approach allows simultaneous determination of NP size, size distribution, elemental composition, and number concentration in a single, rapid analysis [1-3]. Recent enhancements to ICP-MS hardware and software have further improved this technique.
Agilent has developed a dedicated Single Nanoparticle Application Module for ICP-MS MassHunter software (G5714A) to simplify sp-ICP-MS analysis using the Agilent 7900 ICP-MS. The 7900 ICP-MS uses short dwell times (below 1 ms) and fast Time Resolved Analysis (TRA) mode, permitting single element acquisition at a sampling rate as fast as 100 μs, with no settling time.
Automated, high sensitivity analysis of single nanoparticles using the Agilent 7900 ICP-MS with Single Nanoparticle Application ModuleApplication note
Authors
Michiko Yamanaka, Kazuo Yamanaka and Takayuki Itagaki Agilent Technologies, Japan
Steven Wilbur Agilent Technologies, USA
Ed McCurdy Agilent Technologies, UK
Materials, environmental
2
The capability to make multiple measurements during the signal pulse from a single particle significantly reduces the risk of overlapping signals from adjacent particles. Another advantage is the option to use a lower sample dilution and shorter sample acquisition time. The large data sets produced by the sp-ICP-MS analysis are managed and processed using the Single Nanoparticle Application Module [4].
The performance of the Agilent 7900 ICP-MS with the Single Nanoparticle Application Module was evaluated using gold (Au) and silver (Ag) NP reference standards.
Experimental
Reference materials and sample preparationThe Au NP reference materials used were NIST 8013 with a nominal 60 nm diameter (56.0 ± 0.5 nm determined by Transmission Electron Microscopy (TEM)) and NIST 8012 with a nominal 30 nm diameter (27.6 ± 2.1 nm by TEM). Four Ag NP samples from Sigma-Aldrich with nominal diameters of 20 nm, 40 nm, 60 nm, 100 nm were also used. All reference materials and samples were diluted to between 10 and 100 ng/L with 10% ethanol in deionized water, and sonicated for 5 min to ensure sample homogeneity. A Au ionic standard of 1 μg/L was prepared with 10% ethanol/1% HCl and was used to determine the elemental response factor.
InstrumentationAn Agilent 7900 ICP-MS was used throughout. The instrument was equipped with standard nickel sampling and skimmer cones, a standard glass concentric nebulizer, quartz spray chamber and quartz torch. Samples were introduced directly into the ICP-MS with the standard peristaltic pump and tubing (i.d. 1.02 mm). Analyses were performed in TRA mode using an integration time of 0.1 ms (100 μs) per point with no settling time between measurements.
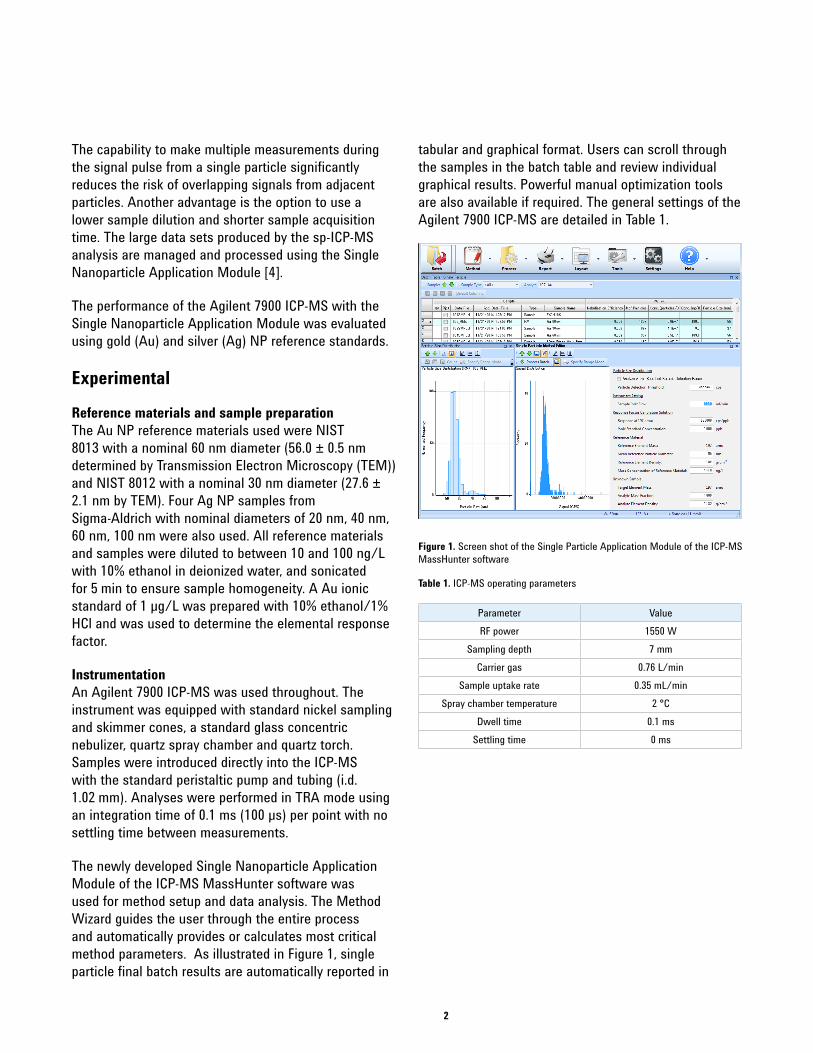
The newly developed Single Nanoparticle Application Module of the ICP-MS MassHunter software was used for method setup and data analysis. The Method Wizard guides the user through the entire process and automatically provides or calculates most critical method parameters. As illustrated in Figure 1, single particle final batch results are automatically reported in
tabular and graphical format. Users can scroll through the samples in the batch table and review individual graphical results. Powerful manual optimization tools are also available if required. The general settings of the Agilent 7900 ICP-MS are detailed in Table 1.
Figure 1. Screen shot of the Single Particle Application Module of the ICP-MS MassHunter software
Table 1. ICP-MS operating parameters
Parameter ValueRF power 1550 W
Sampling depth 7 mm Carrier gas 0.76 L/min
Sample uptake rate 0.35 mL/min Spray chamber temperature 2 °C
Dwell time 0.1 msSettling time 0 ms

3
Results and discussion
Time resolved analysis of NPs ICP-MS measurement of NPs provides narrow time resolved peaks with the intensity dependant on the particle mass. Typical peaks are shown in Figure 2. A reduction by half in particle size results in an 8x reduction in mass and therefore signal. Fast TRA mode allows the shape and duration of the ion plume from a single NP to be determined.
Figure 2. Nanoparticle events acquired using fast TRA mode with 0.1 ms dwell time. Left – wide scale. Right – zoomed in on 30 nm and 60 nm Au NPs.
Analysis of Au NPs The measured concentrations of the Au NPs in the SRMs showed good agreement with the nominal concentrations and reference size obtained by TEM (Table 2). Figure 3 shows the particle size distribution graphically for both 60 and 30 nm particles.
Figure 3. Particle size distribution for Au NPs. A: NIST 8013 (nominal 60 nm). B: NIST 8012 (nominal 30 nm).
Analysis of mixtures of Au NPs In addition to the excellent resolution of particle size, sp-ICP-MS can quantify the number of particles in different size groups. Two mixed solutions with different ratios of 60 nm and 30 nm Au NPs were prepared and measured. Good results were obtained for total particle concentration, as shown in Table 3. The particle number distribution for each particle size shows excellent agreement with the prepared particle number, as shown in Figures 4 and 5. The median size for each group was consistent with the values obtained by TEM. These results suggest that this technique can accurately discriminate particle size groups.
Table 3. Results for the analysis of Au NPs mixture
Sample Measured
conc. (particles/L)
Measured conc.
(ng/L)
Prepared total conc.
(ng/L)Recovery
(%)
60 nm (NIST 8013) 50 ng/L + 30 nm (NIST 8012) 5 ng/L
4.78 x10⁷ 57.6 55 105
60 nm (NIST 8013) 80 ng/L + 30 nm (NIST 8012) 2 ng/L
5.13 x10⁷ 86.1 82 105
Table 2. Results for the analysis of Au NPs
Sample (prepared
concentration)
Measured concentration (particles/L)
Measured concentration
(ng/L)
Measured particle size
(nm)
Reference particle size obtained by TEM
(nm)NIST 8013 Nominal 60 nm (100 ng/L) 5.59 x 10⁷ 103 55 56.0 ± 0.5
NIST 8012 Nominal 30 nm (10 ng/L) 4.27 x 10⁷ 10.5 28 27.6 ± 2.1

4
Reference particle size by
TEM (nm)
Measured particle size
(nm)
Prepared particle number
ratio (%)
Measured particle number
ratio (%)56.0 ± 0.5 58 55.6 57.8
27.6 ± 2.1 28 44.4 42.2
Figure 4. Particle size distribution for a sample containing 50 ng/L of 60 nm Au NPs and 5 ng/L 30 nm of Au NPs
Reference particle size by TEM
(nm)
Measured particle size
(nm)
Prepared particle number ratio
(%)
Measured particle number ratio
(%)
56.0 ± 0.5 58 83.3 84.727.6 ± 2.1 28 16.7 15.3
Figure 5. Particle size distribution for a sample containing 80 ng/L of 60 nm Au NPs and 2 ng/L 30 nm of Au NPs
Analysis of Ag NPs
The results for the analysis of the Ag NP mixture containing different sized NPs are shown in Figure 6. The 20 nm Ag NP can be easily measured due to the high sensitivity of the Agilent 7900 ICP-MS. The particle size distribution measured in the Ag NP mixture indicates good resolution between the 20 nm, 40 nm, 60 nm, and 100 nm particles.
Figure 6. Size distribution results of 20, 40, 60, 100 nm Ag NPs
Conclusions
The Agilent 7900 ICP-MS with dedicated Single Nanoparticle Application Module for ICP-MS MassHunter software was used successfully for the determination and characterization of nanoparticles. The integrated data analysis software is capable of quickly and automatically performing the complex calculations required for the analysis of single particles, while permitting simple, visual optimization and validation of results in single particle mode. The sp-ICP-MS method provides a combination of particle size distribution and sample concentration information that is generally not available with other techniques.

5
References
1. C. Degueldre, P. Favarger, Colloids Surf., A., 2003, 217(1-3),137-142
2. H. E. Pace, N. J. Rogers, C. Jarolimek, V. A. Coleman, C. P. Higgins and J. F. Ranville, Anal. Chem., 2011, 83, 9361-9369
3. J. W. Olesik and P. J. Gray, J. Anal. At. Spectrom., 2012, 27, 1143-1155
4. S. Wilbur, M. Yamanaka and S. Sannac, ‘Characterization of nanoparticles in aqueous samples by ICP-MS’, Agilent publication, 2015, 5991-5516EN

www.agilent.comAgilent shall not be liable for errors contained herein or for incidental or consequential
damages in connection with the furnishing, performance or use of this material.
Information, descriptions, and specifications in this publication are subject to change without notice.
© Agilent Technologies, Inc. 2015Published May 19, 2015
Publication number: 5991-5891EN