Automated Coding of Survey - Statistikmyndigheten SCB
35
Transcript of Automated Coding of Survey - Statistikmyndigheten SCB


R & D Report 1992:2. Automated coding of survey responses: An international review / Lars Lyberg, Patricia Dean. Digitaliserad av Statistiska centralbyrån (SCB) 2016. urn:nbn:se:scb-1992-X101OP9202
INLEDNING
TILL
R & D report : research, methods, development / Statistics Sweden. – Stockholm :
Statistiska centralbyrån, 1988-2004. – Nr. 1988:1-2004:2.
Häri ingår Abstracts : sammanfattningar av metodrapporter från SCB med egen
numrering.
Föregångare:
Metodinformation : preliminär rapport från Statistiska centralbyrån. – Stockholm :
Statistiska centralbyrån. – 1984-1986. – Nr 1984:1-1986:8.
U/ADB / Statistics Sweden. – Stockholm : Statistiska centralbyrån, 1986-1987. – Nr E24-
E26
R & D report : research, methods, development, U/STM / Statistics Sweden. – Stockholm :
Statistiska centralbyrån, 1987. – Nr 29-41.
Efterföljare:
Research and development : methodology reports from Statistics Sweden. – Stockholm :
Statistiska centralbyrån. – 2006-. – Nr 2006:1-.
Automated Coding of Survey Responses: An International Review
Lars Lyberg and Patricia Dean
R&D Report Statistics Sweden
Research - Methods - Development 1992:2

Från trycket Februari 1992 Producent Statistiska centralbyrån, utvecklingsavdelningen Ansvarig utgivare Åke Lönnqvist Förfrågningar Lars Lyberg, 08/783 41 79
© 1992, Statistiska centralbyrån ISSN 0283-8680 Garnisonstryckeriet, Stockholm

Automated Coding of Survey Responses: An International Review
by
Lars Lyberg and Patricia Dean
Abstract: Manual coding of survey responses is an operation that is time-consuming, costly, and error-prone. This paper reviews endeavors to computerize the coding operation. Such efforts have been conducted all over the world, mostly by national statistical offices where coding operations are extensive. There are essentially two basic approaches to computerization. One is a dictionary method where new responses are matched with dictionary entries, where each entry is selected from a set of actual responses. The other method uses an expert system to build a dictionary based on phrases that appear in coding manuals. Such systems use various forms of pattern matching and weighting algorithms based on, for instance, entropy measures to code new responses. The computerization can be administered in two ways, either as an automated coding with manual coding of the residual, or as a computer-assisted coding where the coder uses various levels of automation when handling all coding cases. Some system descriptions and cost and quality data are discussed when such information was provided by the statistical organization.
Key words: Computerized coding; computer-assisted coding; coding algorithms; manual coding; coding errors; data preparation.


Contents Page
1. Introduction 1
2. The Coding Process 2
2.1 Justifications for automation 2
2.2 Different degrees of automation 3
3. The Automated Coding System 4
3.1 Construction of a computer-stored dictionary 4 3.2 Entering object descriptions into the computer 5 3.3 Matching and coding 5 3.4 Evaluation 6 4. Automated Coding Worldwide 6
4.1 The U.S. Bureau of the Census 6 4.2 Statistics Sweden 11 4.3 Statistics Canada 13 4.4 Australian Bureau of Statistics 15 4.5 INSEE, France 17 4.6 Department of Statistics - New Zealand 18 4.7 The Netherlands Central Bureau of Statistics 19 4.8 Statistics Denmark 20 4.9 Some other organizations 21
5. System Evaluations: Quality and the Future 22
6. References 24


1. Introduction
All surveys and censuses have a number of data preparation operations. Usually these operations are editing, keying, imputation, and coding. Their purpose is to transform raw survey data into a form that can be used in the final stages of the statistical investigation, such as, calculation of estimates, data analysis, and tabulations. Among data preparation operations, coding is especially important. In many surveys and censuses, the coding is an extensive operation where survey responses are classified into categories and the number of categories varies over variables. Usually, the coding is done by clerks and evaluation studies have shown that coding is error prone, time-consuming, and costly.
It is safe to say that a good number of survey organizations are indifferent to coding as a specific source of nonsampling error. In contrast, most national statistical offices devote a great deal of methodological and financial resources to improving the coding. One reason for this difference among organizations might be that national offices are in charge of censuses and in censuses the problems with coding are salient. Hundreds of clerks are needed to carry out the coding and the costs and quality problems for such operations are serious and can even be staggering. In organizations that conduct sample surveys only, the coding operation is much smaller and the problems are not considered as serious.
Errors in census coding were discussed decades ago, for instance, in Fasteau, Ingram, and Mills (1962), U.S. Bureau of the Census (1965), and Minton (1969). These authors discuss both error rates per se and various forms of verification techniques. Coding has also been discussed from somewhat different perspectives including its contribution to the total survey error and its role in estimating survey model error components (see Bailar and Dalenius 1969; Hansen, Hurwitz, and Bershad 1961; Jabine and Tepping 1973; Lyberg 1981). About 20 years ago, a new line of development started. It was suggested that coding could be done by means of computer programs similar to the computerized systems already used for data editing. Early examples of these systems, originating at the U.S. Bureau of the Census, are found in Corbett (1972) and O'Reagan (1972). During the last decade this development has gained considerable momentum and today most prominent national offices use or have experimented with systems for automated coding.
It is our intention to review these endeavors since the results of this development are not readily available in the survey literature.
In Section 2, we discuss coding in general and some of the problems associated with coding. Section 3 describes automated coding systems and Section 4 discusses some of the work done and systems in use in the United States, Canada, New Zealand, Australia, Denmark, The Netherlands, France, Germany, Japan, Israel, and Sweden. We review the procedures based on published articles, agency documentation, and even some personal correspondence. Section 5 closes with some remarks on quality, evaluation, and suggestions for future research.
We do not make any attempt to make direct comparisons of the various approaches to automated coding. Nor are such comparisons feasible. Each agency or organization has its own application adapted to its special needs. Furthermore, language and other specialized features make performance comparisons close to impossible.
1
2. The Coding Process
Coding can be defined in the following way: Let us assume that there is a collective of objects of some kind (individuals, households, businesses, etc.) and a set of mutually disjoint categories. Each object belongs to exactly one of these categories. Coding is the act of classifying the objects, via a code number, into these categories.
In most cases, coding is based on verbal information about the objects of the population or sample under study. In other cases, coding is based on quantitative information, like income or other economic variables. Usually, this information is obtained from questionnaires or other forms and is recorded by respondents or interviewers. Verbal responses and some types of quantitative data cannot immediately be calculated into the descriptive statistics which arc presented in statistical tables. They must first be coded into prespecified categories where each category is labeled with a code number. The key to these code numbers is called the code list, nomenclature, or classification scheme. The key is supplemented by a set of coding instructions which relate the verbal descriptions to code numbers.
The definition of coding postulates that a given object belongs to one and only one category. It is common, however, that coding is described as an operation where the verbal descriptions or responses are coded rather than the objects themselves. This is easily understood since in most surveys and censuses each object is coded with respect to more than one variable. Examples of variables that are coded are occupation, industry, education, socioeconomic status, and relationship to head of household.
2.1 Justifications for automation
Most of the coding performed in surveys is done manually; this presents a number of problems since manual coding is highly susceptible to errors. Some variables have hundreds of categories and coding becomes very complex with error rates of 10% or greater. This makes manual coding the most error-prone survey operation next to data collection. Lyberg (1981, 1986) provides overviews of coding error rates in various surveys.
Manual coding can be very time-consuming and costly. For instance, in the 1970 Swedish Census of Population the coding took more than 300 person-years to carry out. In many countries, large scale surveys and censuses hire coders on a temporary basis which makes maintaining good quality coding problematic. As a matter of fact, many industrialized countries have experienced increasing difficulty in hiring temporary staff for this kind of monotonous work.
The complexity also makes the operation difficult to control. Using the key to the code numbers requires a great deal of judgement on the part of the coder and it can be very difficult to decide upon a correct code number. Simple control schemes, like dependent verification where a verifier inspects the code number assigned and decides whether or not it is correct, have proved highly inefficient. Correction rates are often less than 50%, sometimes considerably less. More efficient verification schemes, like independent verification where two or more verifiers assign code numbers independently and where a matching rule decides the correct code number, are expensive and difficult to administer.
2

Faced with these problems, it seems natural to consider using the computer to automate the coding process. The computer has been used extensively in another data processing operation for decades, namely, editing. Using computers to code has its roots in computerized editing applications. Early examples of automated coding date as early as 1963, when the U.S. Bureau of the Census started to conduct its geographic coding by means of computer programs.
A computer coding application that stands out for its inherent complexity is the coding of industry, occupation, and goods. Research on complex applications has been going on for 25 years. It has taken some time, however, before the techniques could be applied in survey work. The first application of complex automated coding was the coding of goods in the 1978 Swedish Household Expenditure Survey. Since then, an increasing number of countries have experimented with and applied different approaches to automated coding.
2.2 Different degrees of automation
There are three kinds of coding systems which range from (1) pure manual coding to (2) varying degrees of manual coding mixed with computer coding, i.e., computer assisted coding (CAC) systems, and (3) computer or automated coding.
In pure manual coding, all objects are coded without any degree of computer assistance. Manual coding can be performed by trained coders, interviewers (in the field or in the office), or by the respondent as he or she fills in the questionnaire (self-coding). The Australian Bureau of Statistics uses self-coding for the most common countries of birth in its population censuses.
In computer-assisted coding, a human coder assigns code numbers while working interactively with a computer. In most CAC systems, all objects are handled by the coder and in this respect, CAC resembles pure manual coding, with the exception that the coders have access to a number of facilities offered by the computer. As the coding cases appear on the screen, the coder assigns a code number with the guidance and assistance of the computer. The coder can request help screens, various decision tables, call for auxiliary object information, and so forth.
In automated coding, a portion of the objects are assigned code numbers by the computer and the rest is taken care of manually or with a CAC system. Thus, "fully" automated coding systems are really a mixture of manual and automated coding.
In mixed systems, an automated coding system can be linked to a CAC system so that only referred cases appear on the screen for resolution by the coder. There is not full agreement among the agencies that use computers in coding whether CAC is more closely related to manual coding or automated coding, but for the purposes of this paper, that distinction is uninteresting as most of the agencies studied use all three types of coding to varying degrees.
3

3. The Automated Coding System
The basic features of any automated coding system are:
i. a computer-stored dictionary; ii. object descriptions entered into the computer; iii. object descriptions matched with dictionary descriptions and based on that matching
code numbers are either assigned or objects are left uncoded; iv. a continuing evaluation of the process which might result in dictionary updates or
other procedural changes.
3.1 Construction of a computer-stored dictionary
The dictionary is an important part of an automated coding system, since it replaces the coding instructions and nomenclatures in the manual coding. The construction of the dictionary can be based on the coding manuals or on empirical patterns of responses provided by respondents in earlier surveys, pilot studies, or on a combination of the manuals and the empirical patterns. The actual compilation of the dictionary can be done manually or by special computer programs.
Dictionaries constructed from coding manuals have a number of disadvantages. Coding manuals are desk products which rely on the imagination and experience of the coder. Despite the massive size of these manuals, respondents manage to use words and phrases not included in the manuals. For a computer application, it is usually more efficient to base the dictionary on the empirical response patterns. This approach leads to dictionaries of smaller sizes, especially if the distribution of the use of various categories is skewed. Transferring the coding manual to the computer is possible if the variables have relatively few categories. For more complex variables, letting the computer generate the dictionary is a much better alternative.
Descriptions that are included in the dictionary should be unambiguous, i.e., each unique description should be associated with exactly one code number. To accomplish this, a sample of descriptions (in the empirical response case) or the phrases and words in the coding manuals (in the case where manuals are used) are coded by experts. After that it is checked whether a description or phrase is associated with a unique code number. One way of doing this is to list all the words and phrases in alphabetical order. Then it is easily seen whether uniqueness exists or not. Of course, a computer program which takes, say, irrelevant word order into account and eliminates less informative words can do the checking.
Nevertheless, the end result is always a dictionary that is incomplete and cannot code all responses, with a portion left for manual coding. The dictionary is also incomplete from a data quality point of view. The uniqueness criterion might not hold when new descriptions are entered for matching. And in some applications, the uniqueness criterion is relaxed in the construction phase. If a description is associated with a certain code number in, say, 97% of the cases, one might be willing to accept a relatively small systematic error to accomplish smooth coding by coding all such descriptions to the same category.
4
3.2 Entering object descriptions into the computer
The obvious way to enter descriptions into the computer is to key them in a more or less free format. Fears have been expressed over the inclusion of this manual operation in an automated system. Keying verbal information can be costly and requires a lot of space on the records compared to keying numeric information only. Fortunately, this practical problem is not as great as one might think. In most applications keying has to be done for all variables that consist of numerical information to begin with, like age, sex, and precoded values. Most key operators also think that their work becomes less monotonous if alphabetical data are mixed with numerical data. Of course, if a certain amount of alphabetical keying is added, keying costs increase, but the increase is moderate. (See Brown et al. 1983.) The obvious automated alternative to keying is optical character recognition of verbal information. However, the recognition of hand-written letters has not been sufficiently developed for this purpose. It appears as if this area of high technology has not been prioritized either, at least not at the present.
Most automated coding systems standardize descriptions entered in preparation for matching. Some words are deleted, like certain prefixes, suffixes, prepositions, etc. For example, double letters are sometimes replaced by single letters. This standardization procedure is called parsing.
3.3 Matching and coding
There are two kinds of matching in automated coding: exact matching and various forms of inexact matching. In exact matching a description entered must be identical with the dictionary entry and if so, the associated code number is assigned. One might think that such a matching rule would be very inefficient leaving large portions of descriptions uncoded. This is not always the case because the proportion coded always depends on the application. If the variable under study has a simple structure, like goods in household expenditure surveys or occupation in various Swedish surveys (where occupation very often is just one word) the exact matching rate can be between 60% and 80%.
The matching rate can be increased by using various techniques for inexact matching. By inexact matching we mean that an object description and the dictionary entry can be considered a match if they are similar enough, even though they are not identical. Inexact matching rules must be based on empirical probability patterns or other reliable information.
Simple types of rules for inexact matching include: ignoring the word order of input descriptions, successive truncation of input descriptions, identification of highly informative words or word strings that are associated with a certain code number, and assigning heuristic weights to words where the weights are proportional to each word's information content.
The development of matching algorithms is a great concern to those in charge of automated coding systems. Its importance might be somewhat over-stated, however. When automated coding was in its infancy, it was postulated that this new field would be an amalgamation of artificial intelligence, pattern recognition, computational linguistics, etc. It has turned out, however, that even though these disciplines have contributed a great deal, automated coding has remained within the discipline of statistics. Automated coding systems are developed and
5

run by statisticians who use statistical tools and statistical reasoning, rather than the disciplines named above.
3.4 Evaluation
It is important to continuously evaluate the performance of an automated coding system. First, there is the issue of cost. Since objects that cannot be assigned a code number automatically are referred to manual coding, there is always a break-even point regarding the matching rate. If the matching rate slips below the break-even point, the automated coding system becomes less economical than a purely manual coding system. The matching rate can be increased during the coding process by means of dictionary updates, but our experience is that the increases are relatively moderate in most applications. Thus, before production starts, one should be able to count on a matching rate well above the break-even point unless other factors predominate, for instance, a limited supply of manual coders. As long as the system uses exact matching only and since exact matching implies very low error rates, the economy of the system can be controlled fairly well. But when inexact matching is used as well, a trade-off arises between quality and cost. Code number assignments based on inexact matching have to be verified on a sampling basis. If too many errors are found, the dictionary might have to be made smaller or the match scoring methods might have to be adjusted. This in turn might lead to a decreased matching rate.
In most applications, however, quality improvement can be achieved by continual updating of the dictionary. It is seldom possible to create a very good dictionary from the start New object descriptions are continually introduced in large-scale operations. By analyzing cases that are referred to manual coding, some of the new descriptions can be added to the existing dictionary. It is common that the dictionary is updated several times during the coding.
4. Automated Coding Worldwide
In this section we provide descriptions of automated coding systems that are used in various agencies around the world. The coverage is good, but not complete. For instance, we know that work is being conducted in some places but we were not able to obtain documentation. It is also likely that work is conducted that we are not aware of.
Most of the documents that we read dealt more with system description than with system performance. This one-sidedness is reflected in our review. Finally, the development in this field is rapid. Therefore, it is likely that some of the systems we describe have already been modified.
It should be pointed out that the terminology varies among agencies. In most cases we have tried to retain the terminology used by the agency we describe. For instance, matching rate is the same thing as coding degree, but in some cases differences in terminology reflect actual differences in concepts and definitions.
4.1 The U.S. Bureau of the Census
The U.S. Bureau of the Census is the agency where research on automated coding started. Early endeavors include the geographic coding mentioned earlier. In the late, sixties,
6
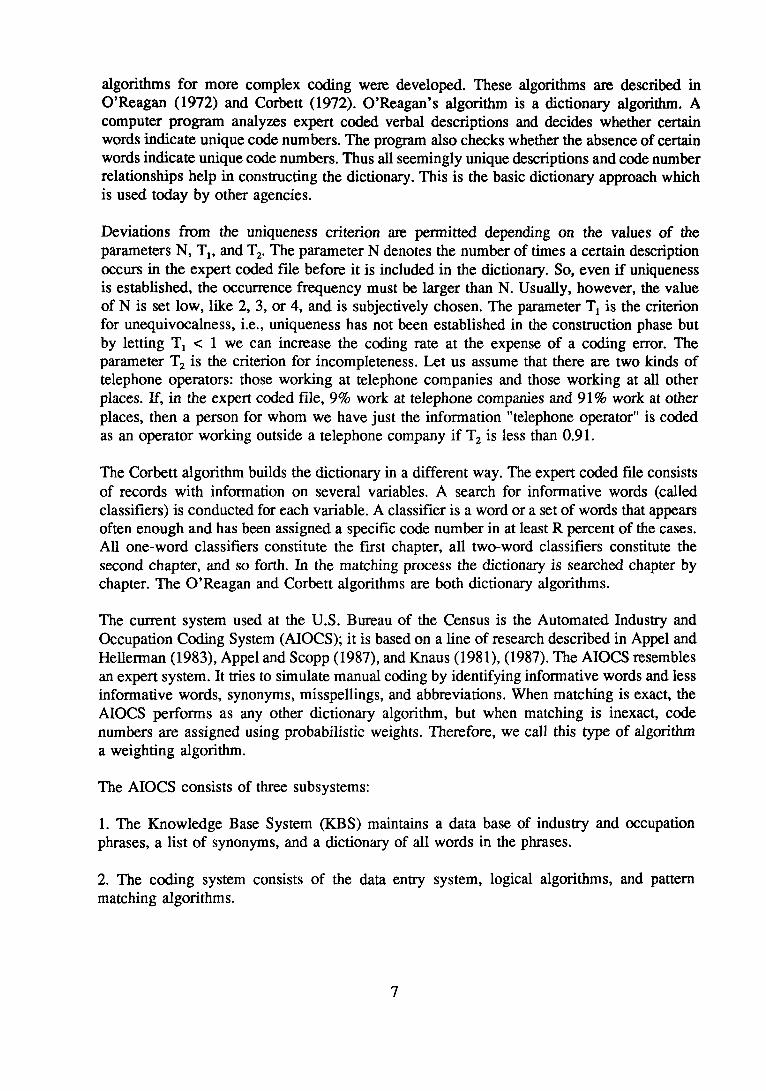
algorithms for more complex coding were developed. These algorithms are described in O'Reagan (1972) and Corbett (1972). O'Reagan's algorithm is a dictionary algorithm. A computer program analyzes expert coded verbal descriptions and decides whether certain words indicate unique code numbers. The program also checks whether the absence of certain words indicate unique code numbers. Thus all seemingly unique descriptions and code number relationships help in constructing the dictionary. This is the basic dictionary approach which is used today by other agencies.
Deviations from the uniqueness criterion are permitted depending on the values of the parameters N, Tj, and T2. The parameter N denotes the number of times a certain description occurs in the expert coded file before it is included in the dictionary. So, even if uniqueness is established, the occurrence frequency must be larger than N. Usually, however, the value of N is set low, like 2, 3, or 4, and is subjectively chosen. The parameter T, is the criterion for unequivocalness, i.e., uniqueness has not been established in the construction phase but by letting Tl < 1 we can increase the coding rate at the expense of a coding error. The parameter T2 is the criterion for incompleteness. Let us assume that there are two kinds of telephone operators: those working at telephone companies and those working at all other places. If, in the expert coded file, 9% work at telephone companies and 91% work at other places, then a person for whom we have just the information "telephone operator" is coded as an operator working outside a telephone company if T2 is less than 0.91.
The Corbett algorithm builds the dictionary in a different way. The expert coded file consists of records with information on several variables. A search for informative words (called classifiers) is conducted for each variable. A classifier is a word or a set of words that appears often enough and has been assigned a specific code number in at least R percent of the cases. All one-word classifiers constitute the first chapter, all two-word classifiers constitute the second chapter, and so forth. In the matching process the dictionary is searched chapter by chapter. The O'Reagan and Corbett algorithms are both dictionary algorithms.
The current system used at the U.S. Bureau of the Census is the Automated Industry and Occupation Coding System (AIOCS); it is based on a line of research described in Appel and Hellerman (1983), Appel and Scopp (1987), and Knaus (1981), (1987). The AIOCS resembles an expert system. It tries to simulate manual coding by identifying informative words and less informative words, synonyms, misspellings, and abbreviations. When matching is exact, the AIOCS performs as any other dictionary algorithm, but when matching is inexact, code numbers are assigned using probabilistic weights. Therefore, we call this type of algorithm a weighting algorithm.
The AIOCS consists of three subsystems:
1. The Knowledge Base System (KBS) maintains a data base of industry and occupation phrases, a list of synonyms, and a dictionary of all words in the phrases.
2. The coding system consists of the data entry system, logical algorithms, and pattern matching algorithms.
7

3. The Quality Measurement System (QM) is a system for comparing manual coding and automated coding on a sampling basis. The results are used for improvements in the dictionary and the algorithms.
In most of the U.S. Bureau of the Census's demographic surveys and the population census, there are six questions on industry and occupation. The responses are entered and each word in the response is standardized. The standardization deletes all plurals, replaces long suffixes with numeric suffix identifiers, and replaces adjacent double letters with single letters. The standardization is terminated if the resulting word is less than three characters.
Then, a number of key words are searched for. There are just ten key words and these are scanned first to see whether the industry requires special attention. If special attention is required, the general data base process can usually be bypassed.
In AIOCS, the data base is a computer version of the manual used in manual coding. Exact matches are infrequent, so each response is usually broken down into several phrases.
The dictionary consists of 7200 standardized words. Two heuristic weights are associated with each word: one for industry and one for occupation. Also associated with each word is a pointer to the data block containing all phrases with this word. During the data base construction, heuristic weights are calculated for each word. The weight H is
Pi = proportion of occurrences of the word in a data base phrase that indicates code number i,
n = number of code numbers indicated by a data base phrase containing this word,
8

The general data base match examines case by case all data base phrases containing the response word with the highest heuristic weight. Certain data base phrases contain constraints and other information and might be excluded by a filter for bypassing inappropriate data base phrases. If there is no bypass, the scoring process starts. Each word of a candidate data base phrase is matched against each word in the appropriate response field. Additionally, a pseudo-response, representing a combination of words from different fields is constructed from matched words and is also scored.
The ultimate score is
where M = number of words matched,
£ HM = sum of heuristic weights for words matched,
A, = number of words in response,
Ad = number of words in candidate data base phrase, and
BONUS = value added to the score if a response word is strongly informative (there are number of such words giving unique indications to certain parts of the nomenclature).
If the match with the candidate is exact, i.e., M = A, = A d , then the score is doubled. If the data base phrase score is below a certain benchmark value, it is no longer considered a candidate phrase.
Thus, the scoring results in 0, 1, or more candidate phrases. If there is just one candidate phrase, that one is chosen. If there are two or more candidates, they are ordered by scores from the largest to the smallest A candidate is chosen when it has the highest score, provided that the score is at least a fixed percentage above the next candidate's score.
This algorithm has been tested extensively during the late 1970s and 1980s with the 1990 census in mind. In a test which used data from the 1984 Consumer Expenditure Survey, manual coding was compared to AIOCS coding. Any differences were evaluated by coding experts. The following results were obtained.
Table 1. Automated test coding in the 1984 Consumer Expenditure Survey.
9

In a later (August 1990) and much larger study using the census benchmark file of 132,742 cases the results provided in Table 2 were obtained.
Table 2. Automated test coding using census benchmark file.
The coding rates were fair, but the error rates were higher than would be obtained in manual coding. During the fall of 1990, the AIOCS design was developed further. As a result, significant improvements in processing rates were obtained and the AIOCS was used in the coding of the 1990 census for industry and occupation.
In the 1980 census, the coding of industry and occupation cost 7.7 million USD. Also the coding of industry and occupation costs 1.2 million USD a year for the agency's continuing demographic surveys. Thus, during a ten-year period, just the costs for coding industry and occupation costs the bureau close to 20 million USD. This explains why the bureau has been so persistent in its efforts towards developing automated coding systems over the years.
The U.S. Bureau of the Census has conducted more research on the problems of coding natural language survey data than any other agency. One comprehensive reference on coding using semantic vectors, semantic representations, and various computer implementations is Knaus (1987). This line of research is interesting but arcane and many of the results have not yet found direct application.
Recently the research at the bureau has developed along some new lines. Creecy, Causey, and Appel (1990) describe the construction of a dictionary based on empirical response patterns. This research is similar to the work done by O'Reagan 20 years ago (O'Reagan 1972) and uses the benchmark file from the 1980 census to build the dictionary. They use a Bayesian approach where the posterior probabilities of different categories (assumed to be correct) are estimated given a specific verbal description. Descriptions with high probabilities form the dictionary. This research is still in its infancy since only single words have been considered. Early on, O'Reagan pointed out that word pairs increase the discriminating power and the inclusion of word pairs seems to be a natural development.
In Masand, Smith, and Waltz (1990) and Creecy (1992) experiments with automated industry and occupation coding on the connection machine system are described. The connection machine is a massively parallel computer with tens of thousands of processors. The processors can execute the same operation, on individual data, at the same time. The connection machine uses memory based reasoning which in a coding situation can be viewed as recalling which
10

code number corresponds to similar past descriptions. In these experiments, the benchmark file mentioned above was used as a training set. The benchmark file (previously manually coded) is loaded into the machine. When new descriptions are to be coded, their distances from each file case are computed using nearest neighbor techniques. The distance measures vary, but the system that used the same weights as in the Creecy et al. experiment was successful. Experiments with connection machines showed that its performance was very good compared to AIOCS but there was simply not enough time to implement it in the 1990 census. Nevertheless, for the 2000 census, it should be a viable option.
4.2 Statistics Sweden
Automated coding has a long history at Statistics Sweden. Research began in 1970 and the first application was the coding of goods or purchases in the 1978 Household Expenditure Survey.
The two systems currently in use are the dictionary approach and CAC. The dictionary approach is a simpler variant of O'Reagan's algorithm. The inclusion of entries in the dictionary is based on a mixture of the empirical response patterns and subjective choices. A sample of expert coded responses are sorted with respect to code number and then sorted again alphabetically. These sortings are called list 1 and list 2. List 1 is used to get information on the descriptions per code number. A frequency limit parameter N is used for defining "high frequency" descriptions. All descriptions occurring N or more times are stored in a preliminary version of the primary dictionary. This dictionary is called PLEX.
List 2 checks the uniqueness of a description stored in the preliminary PLEX. Any ambiguous descriptions can then be removed from the preliminary PLEX resulting in a definitive PLEX. When checking an ambiguity, a Tj-criterion like the one used in the O'Reagan algorithm has sometimes been used. On those rare occasions the value of Tj has been around 0.9.
This approach leads to the inclusion of common variants of unambiguous descriptions in PLEX. For instance, in occupation coding, the PLEX dictionary contains common misspellings of the entry "chauffeur." Instead of having a standardization procedure that can eliminate the effects of misspellings, common misspellings form their own entries.
To increase the coding rate the system offers a secondary dictionary, SLEX, that is scanned if PLEX fails to code. The entries in SLEX are based on the descriptions that do not fulfil the N criterion. An attempt is made to identify discriminating word strings for each code number. In the ideal situation one such string can represent many variants of a certain description. There are problems with SLEX, though. SLEX words must not fit PLEX entries for other code numbers. Thus, SLEX must be continuously evaluated since one cannot know in advance how it behaves when new objects are coded. As a consequence, SLEX should never be allowed to expand too much because of the difficulties in maintaining its accuracy.
The design of the 1978 Household Expenditure Survey (HES) included continuous delivery of diaries kept by respondents. This resulted in the material being processed in cycles. The dictionary in the 1978 HES was based on an experimental coding from a pilot study conducted the previous year. After each cycle a decision was made whether to update the dictionary or not. During the 1978 HES, the dictionary was updated 16 times which led to
11
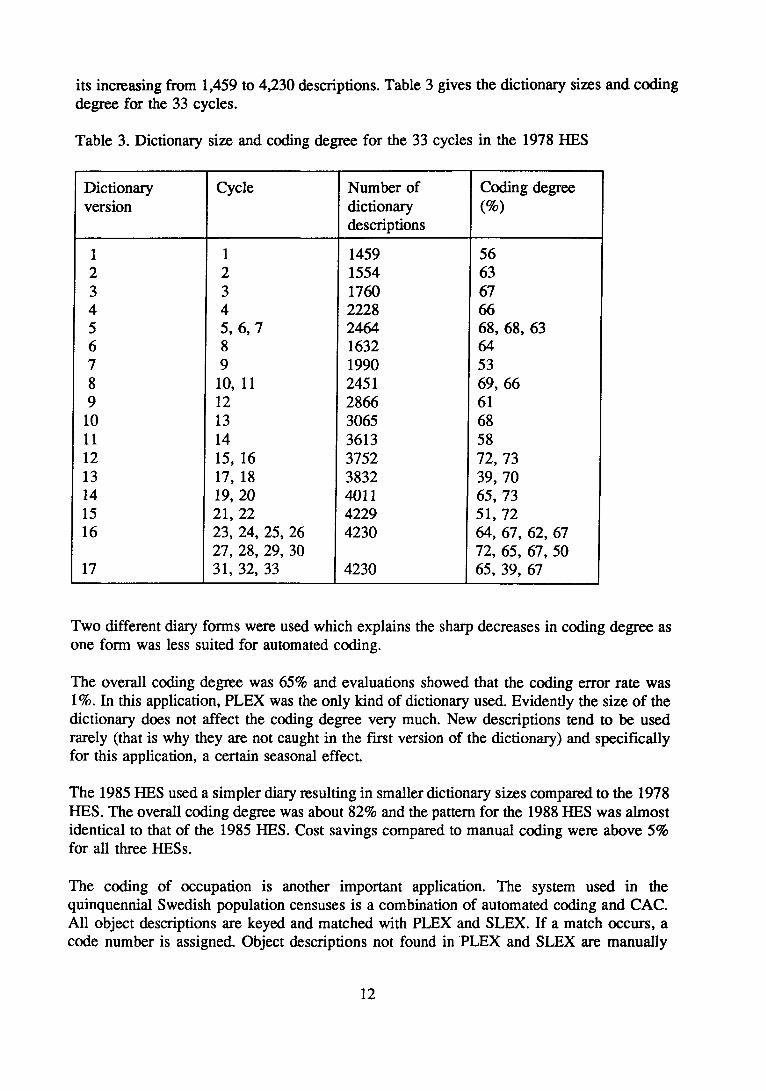
its increasing from 1,459 to 4,230 descriptions. Table 3 gives the dictionary sizes and coding degree for the 33 cycles.
Table 3. Dictionary size and coding degree for the 33 cycles in the 1978 HES
Two different diary forms were used which explains the sharp decreases in coding degree as one form was less suited for automated coding.
The overall coding degree was 65% and evaluations showed that the coding error rate was 1%. In this application, PLEX was the only kind of dictionary used. Evidendy the size of the dictionary does not affect the coding degree very much. New descriptions tend to be used rarely (that is why they are not caught in the first version of the dictionary) and specifically for this application, a certain seasonal effect.
The 1985 HES used a simpler diary resulting in smaller dictionary sizes compared to the 1978 HES. The overall coding degree was about 82% and the pattern for the 1988 HES was almost identical to that of the 1985 HES. Cost savings compared to manual coding were above 5% for all three HESs.
The coding of occupation is another important application. The system used in the quinquennial Swedish population censuses is a combination of automated coding and CAC. All object descriptions are keyed and matched with PLEX and SLEX. If a match occurs, a code number is assigned. Object descriptions not found in PLEX and SLEX are manually
12
coded using a two-step CAC system. In the first step, the coders have access to the description only as displayed on the screen. This is a very fast operation since all difficult cases are left and taken care of in the second step by coders who have access to the questionnaires.
In the 1980 Swedish census, the size of PLEX went from about 4,000 to more than 11,000 during the course of the census. SLEX was kept at about 500 word strings. The overall coding degree was 71.5%, roughly 68% by PLEX and 3.5% by SLEX.
In the 1985 census, dictionary sizes were increased to about 20,000 for PLEX and 1900 for SLEX. Not much happened to the coding degree, though. The PLEX coding degree was about the same as in 1980 while the SLEX coding degree went from 3.5% to 5%. The cost of automated coding was roughly 10% lower than that of manual coding.
Occupation is also coded in the continuing Labor Force Survey. With a PLEX of only 5,000 descriptions the system's coding degree is fairly stable at around 70%. The larger coding degree in the Labor Force Survey compared to the census is explained by the fact that the former does not use the third digit of the code.
Automated coding is used in some other surveys as well. The most notable example is the coding of library book loans in a survey sponsored by the Swedish Authors' Fund. Automated coding has been used for more than ten years and during that period, the dictionary size has grown from 7,000 to over 65,000 authors and book tides. The current coding degree is approximately 75% and the system is highly profitable compared to the manual system.
Currently, there are no plans to develop more sophisticated systems to obtain higher coding degrees. The dictionary approach has its limits mainly because of the skewed distribution of code number assignments. After a certain increase in dictionary size, coding rates level off. Further increase in coding rates would call for an entirely new approach, perhaps along the U.S. Bureau of the Census's research lines. Such a development has a low priority at Statistics Sweden, at least for now.
The automated coding systems used at Statistics Sweden are more thoroughly dealt with in Andersson and Lyberg (1983), Lyberg (1981), (1986), and Lyberg and Dean (1988).
4.3 Statistics Canada
Statistics Canada has been experimenting with automated coding for about a decade. This work has eventually led to the development of a general system called Automated Coding by Text Recognition (ACTR) which now exists in two versions, ACTR1 and ACTR2. A number of different automated coding systems have been in use in production at Statistics Canada, but they are all application specific even though they use techniques similar to ACTR.
ACTR is general in that it can be used by any application and any classification scheme. The main feature of ACTR is that text is rated according to how similar it is to some other text. ACTR uses two different algorithms depending upon whether the match is exact or inexact.
13

For an exact match, the system uses a technique developed by Wenzowski which compresses the parsed text and employs single-hit data base access. For an inexact match, the algorithm is similar to that used by the U.S. Bureau of the Census developed by Hellerman.
Statistics Canada and the U.S. Bureau of the Census also use different parsing strategies. In ACTR, the parsing is user controlled as are most of the matching parameters. When parsing is insufficient to generate a match, ACTR will compute a score for the degree of similarity. The score is compared to a threshold value determined by the user.
Statistics Canada is considering making ACTR commercially available in the future. It is more flexible than the other systems developed at Statistics Canada. ACTR1 was a mainframe package. ACTR2 is compatible with all types of computing environments where the data base management system Oracle is available. The system can handle both English and French, like other systems at Statistics Canada. A detailed description is found in Wenzowski (1988).
ACTR can perform both automated coding and CAC. In automated coding mode, the coding is performed in batch with a single file input and multiple file output. In CAC mode, the user works interactively with the software and chooses from the ranked alternatives that are presented. When requested, CAC also provides the user with additional information from the record to be coded allowing the user to consider auxiliary information when assigning a code number.
The creation and maintenance of the coding data base are also performed by the user. The obvious sources for creating the dictionaries are the coding manuals, results from previous surveys, and results from CAC runs. ACTR allows dictionary contents to be displayed and updated interactively. This feature, when used with an exhaustive search of the data base, is a highly effective means of maintaining the dictionary.
ACTR performs differently depending on the application. Coding degrees of about 90% have been obtained in occupation coding from death certificates while there are examples of occupation coding degrees of only about 20% for census material.
ACTR2 has addressed a fundamental problem in most automated coding systems: the problem of assigning reliable code numbers when coding depends on access to auxiliary variables. While ACTR1 allowed for only one data base to be coded from at a time, ACTR2 imposes no such limit. Applications are free to scan as many data bases as necessary to make a match. This feature, in conjunction with the creation of concordance lists which define dependencies, offers a cost-effective solution to the problem of accessing auxiliary information.
Statistics Canada's experience has shown that very few applications would ever make use of such a feature. The initial release of ACTR2 will require that users create their own "drivers" which embed the dependency knowledge of their application and control ACTR's searching of other coding data bases.
In general, methods used to calculate word weights and phrase scores assume the existence of statistics on the frequencies of words and word combinations and the associated code
14

numbers. ACTR uses the data base statistics to calculate word weights because data on word frequencies from preferred sources (previous surveys, for instance) are usually unavailable.
With ACTR2, Statistics Canada has broken away from the U.S. Bureau of the Census's approach to word weighting. ACTR2's techniques are simpler and more intuitive. Matching scores are always in the range of 0 to 10 (10 represents a perfect match) and word weights are bounded in the same way. According to Wenzowski (1990, personal correspondence), automated assignments are most frequent when the matches are exact. On the other hand, CAC, working interactively with the coder, uses scores when displaying ranked alternatives of objects to be matched inexactly.
On an IBM 3090 model 200E, ACTR1 can load approximately 10,000 records and, provided a mix of 50/50 exact and scoring matches, it can match 20,000 records in one minute CPU time. These figures are intended to provide a rough feel for how the system performs. Actual cost and performance figures are heavily dependent on the application itself. Factors affecting costs, processing times, and matching rates are: the threshold on search parameters, length of text, and parsing strategies.
Total savings of approximately 15% are expected from the 1991 census application. ACTR1 is planned to code 10 variables, which, compared to manual coding, will entail a savings of 2.5 million Canadian dollars. Included in this estimate are all costs associated with automation, i.e., hardware, set-up, testing, training, integration, and production. Coding rates of 85%-90% are expected for most variables (Wenzowski 1990, personal correspondence).
Statistics Canada also uses CAC in its Labor Force Survey. A recent reference is Hale (1988). Two important works that document the prerequisites for Statistics Canada's research on automated coding are Brown, Goldmann, Michel, and van Barren (1983) and Brown et al. (1984).
4.4 Australian Bureau of Statistics
Since the mid-1970s, the Australian Bureau of Statistics (ABS) has used automated coding techniques for geographic coding. The system was based on a dictionary of localities (including common misspellings) and where that proved insufficient, street indexes were used. Match rates were often as high as 98%.
The ABS has concentrated on developing the Australian Standard Classification of Occupations (ASCO) CAC System, which can be considered an implementation of an expert system. The CAC System was used in the 1986 census.
In 1986, the system was run on IBM-XT compatible microcomputers and was written in Microsoft C, version 3. The compatibles had 640 K ram, a hard disk drive, and a color monitor.
The coding procedure is as follows: The coder enters the first three characters of the description. Then a subset of dictionary entries are displayed on the screen. The coder chooses the appropriate entry, often using auxiliary information. The choices presented to the coder are determined by matching rules and color is used to convey different status levels assigned
15

to title, task, and industry information on the questionnaire. Six screen windows are resolved by the computer program.
In 1986, the system processed 6.5 million occupation descriptions. The process took eight months and the cost was 1.3 million Australian dollars (AD) and another 0.3 million AD went to the 90 Olivetti microcomputers. This total cost of 1.6 million should be compared to an estimated cost of 3 million AD for a manual system.
The average overall coding rate was 120 descriptions per hour and the consistency with expert manual coding was above 95%. The manual coding rate was 70 descriptions per hour and the overall query rate was 7.5%.
The ASCO guides the coder so well that far fewer cases end up being coded into "miscellaneous" categories, i.e., categories for "not elsewhere classified." As a preparation for the 1991 census, the CAC system has been rewritten using facilities from Microsoft C, versions 3 and 4. It has recently been used in processing 70,000 occupation descriptions in the 1988 Survey of Employee Earnings and Hours.
There are four reasons for CAC s success: - The interface is user-friendly, offering multiple selections of possible matches with automatic program resolution and on-line help screens. - Memory coding is greatly reduced. - CAC can handle abbreviated data entry of descriptions. - The searching and matching procedures are fast.
In the 1986 CAC coding, a computer search provided the coder with alternatives. This was achieved by parsing the descriptions into basic words, qualifying words, and extraneous words and searching in a basic word list and a qualifying word list ignoring extraneous words. If a unique choice failed to appear, the relevant subset of dictionary entries was displayed on the screen for semantic interpretation and close matching by the coder.
This is in essence what makes CAC superior to a fully automated coding system. In CAC, the abilities of the human mind is combined with the capacity of the computer. The coder analyzes the description and breaks it into its components. The computer searches the dictionary of basic words for an exact match with the entered three character abbreviations.
If no exact match occurs, an abbreviated qualifying word is entered by the coder and matched against the qualifying word dictionary. CAC reduces the complexity inherent in most automated coding matching algorithms, without reducing the quality of coding. By using the color screen to represent the different status levels and by using automated complex coding rules, the coder is guided through a correct coding sequence.
Although the ASCO CAC system can allow relatively untrained coders to perform in a way consistent with that of manual coding experts, the need for coder training remains. The coders have to know the system very well since it is complicated, sometimes even restricted in the choices available to the coder. Typing skills are also needed.
16

ABS experiments with automated coding prior to CAC resulted in coding degrees on occupation similar to those obtained by Statistics Sweden, i.e., around 70%. The ABS could not accept the information loss inherent in a fully automated system and opted for CAC, which in the 1986 census handled 92% of the cases.
The ASCO dictionaries are based on empirical responses; no complex scoring rules are used. During the 1986 census, the dictionaries were updated at least once a month. Descriptions of the ASCO system are provided in Embury (1988a, b).
For the 1991 census, CAC has been extended (together with increased self-coding by respondents) to include other variables requiring coding such as industry, educational qualifications, country of birth, religion, and geography. It is anticipated that significant savings will result as well as improvements in quality. A large scale test of the system was conducted in the last half of 1990.
The ABS also uses computer based matching techniques to match names and addresses to the business enterprise group register for possible inclusion. Staff savings have been extensive and these efforts are described in Bennison and Bear (1988). Basically, this work is similar to other applications of geographic coding: The system is a mixture of algorithms usually found in systems for automated coding and general matching algorithms.
Proprietary versions of the computer assisted occupation and industry coding systems are available.
4.5 INSEE, France
At the Institut National de la Statistique et des Études Economiques (INSEE), the French national statistical office, research on automated coding has been ongoing for almost two decades. Work has primarily concentrated on two systems: COLIBRI and QUID.
COLIBRI, described in Lery and Stephany (1985) is a data entry system that was used in the 1975 and 1982 French population censuses. The system consists of 440 TRANSAC terminals at 18 regional INSEE offices and connected to two IBM 4341 centrally located computers. It has been used for coding economic activity, place of work, and occupation.
COLIBRI is a CAC system. As for economic activity, an automated search of the register of establishments is carried out based on the name and address of the establishment. Likely candidates are ranked and displayed on the screen and the coder chooses one of the candidates. In approximately 70% of the cases, an economic activity code number can be assigned in this way. For the remaining 30%, coding is based on the answer to the question concerning economic activity. The answer is matched against a special file. If no match occurs, file designations with at least one word in common with the answer are displayed and the coder chooses the appropriate code number.
As for place of work, names of municipalities are keyed in full, and matched with a dictionary of municipality names. On the sub-municipal level, street information is keyed and matching is based on the last word in the street name. The coding of occupation is highly complex. The responses are first standardized and then the standardized form is matched with
17

the occupation dictionary. The standardized form is then compared with all dictionary occupations starting with the same word as the standardized form does. For example, if the standardized form is ENGINEER, there are 245 dictionary entries to choose from.
In cases where the coder is undecided, values of auxiliary variables can be displayed or the coder can even be asked to key in additional information. In all, the system contains for this variable 628 decision tables, 249 various messages to the coder, and 455 code numbers.
Evaluation studies show that the overall error rate for occupation is approximately 5% and for economic activity approximately 4%. These are very good results by any standard.
During recent years, a new system, QUID (QUestionnarires d'IDentification - Identification Questionnaires), has been developed and is described in Lorigny (1988). The system is based on a very large dictionary of empirical responses coded by experts; the dictionary is organized into an optimized tree pattern. The organization of the tree pattern is in turn based on mathematical results from information theory, like Shannon's entropy.
QUID has been applied in various surveys. A recent application is the coding of socioeconomic status in the Annual Social Information Study. For this application, the dictionary consists of approximately 122,000 descriptions or phrases and the coding degree is about 90%. No precise quality measures are available, but an error rate between 5% and 10% among the 90% coded seems highly likely. In other applications, the coding degree has reached 75% at most.
QUID is updated once a year by entering new expert coded descriptions. QUID does not, however, handle auxiliary information very well. To correct this shortcoming, a new version QUID2 is under development.
4.6 Department of Statistics - New Zealand
The national statistical office in New Zealand uses CAC but has not yet reached the implementation level obtained by, for instance, the Australian Bureau of Statistics. In the New Zealand system, the coder keys in the verbal information and all exact matches are stored. If no match occurs in this first step, the system truncates the description one letter at a time until a match occurs. If NURSE is a dictionary word, NURSING becomes a match after three truncations. Thus, in the second step, exact matching is not necessary since truncation continues until an identical sequence of letters is found. In this example, we end up with the match NURSe vs NURSing. After all descriptions have been processed, matched descriptions are scanned to find the most frequent references. These references are used to retrieve and display those descriptions and code numbers containing the largest number of matched words. Then the coder makes a choice, if possible. If no choice is made, the case can be bypassed and all alternative code numbers are stored for future scrutiny.
Some variables have very few entries in their dictionaries. Such "short" dictionaries are directly displayed on the screen and coding of these variables is done by cursor placement.
In a test coding of 15,000 questionnaires from the 1986 census the following coding degrees were obtained. The list shows the percentage of cases where the system provided a match.
18
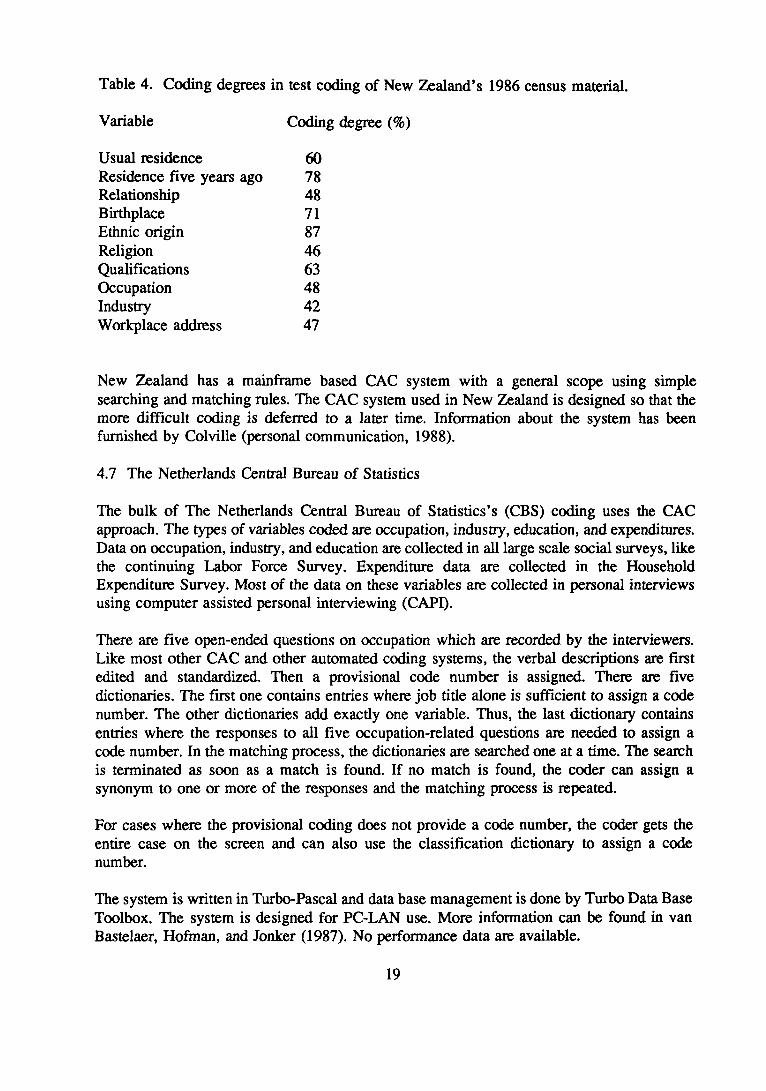
Table 4. Coding degrees in test coding of New Zealand's 1986 census material.
New Zealand has a mainframe based CAC system with a general scope using simple searching and matching rules. The CAC system used in New Zealand is designed so that the more difficult coding is deferred to a later time. Information about the system has been furnished by Colville (personal communication, 1988).
4.7 The Netherlands Central Bureau of Statistics
The bulk of The Netherlands Central Bureau of Statistics's (CBS) coding uses the CAC approach. The types of variables coded are occupation, industry, education, and expenditures. Data on occupation, industry, and education are collected in all large scale social surveys, like the continuing Labor Force Survey. Expenditure data are collected in the Household Expenditure Survey. Most of the data on these variables are collected in personal interviews using computer assisted personal interviewing (CAPI).
There are five open-ended questions on occupation which are recorded by the interviewers. Like most other CAC and other automated coding systems, the verbal descriptions are first edited and standardized. Then a provisional code number is assigned. There are five dictionaries. The first one contains entries where job title alone is sufficient to assign a code number. The other dictionaries add exactly one variable. Thus, the last dictionary contains entries where the responses to all five occupation-related questions are needed to assign a code number. In the matching process, the dictionaries are searched one at a time. The search is terminated as soon as a match is found. If no match is found, the coder can assign a synonym to one or more of the responses and the matching process is repeated.
For cases where the provisional coding does not provide a code number, the coder gets the entire case on the screen and can also use the classification dictionary to assign a code number.
The system is written in Turbo-Pascal and data base management is done by Turbo Data Base Toolbox. The system is designed for PC-LAN use. More information can be found in van Bastelaer, Hofman, and Jonker (1987). No performance data are available.
19

The coding of industry is a pure CAC application which uses an excerpt of the data base of enterprises from the mainframe computer. The coder searches the data base for the firm looking for the name and address provided by the respondent. If the search is successful, the code number already present in the firm's record is assigned. The identification of the firm record in the data base is also stored for further analysis. If the firm cannot be located in the data base, a code number can be assigned using a large dictionary of activity descriptions. Each activity in this dictionary has several key words which can be used as an index for the activity.
The coding of education uses a large dictionary of descriptions and a file of synonyms. The respondent's answer is first edited and standardized by making use of the synonyms. All the dictionary descriptions that match the standardized response are presented to the coder. The matching is performed by examining the response, word by word. The word order in the description is not important. After selecting a description, the code number is assigned. If only one match is found, the code number is assigned automatically.
The coding of expenditures uses the BLAISE coding module which functions in two modes: stepwise coding and dictionary coding. A flat classification uses dictionary coding only. A hierarchical classification uses both stepwise and dictionary coding.
In stepwise coding, the first digit of the code is selected by choosing the proper category from a menu. After the digit is entered, a subsequent menu appears which contains a finer breakdown of the previously selected category. This process continues as the description becomes more and more detailed until the final digit is obtained.
In dictionary coding, a verbal description is entered and the computer tries to locate the description in its list. If the description is not found, a list is displayed, starting with a description that is as close as possible to the initially entered response. The list can be made such that almost any description, including permutations, is presented.
Stepwise coding can be combined with dictionary coding in a very simple way. Start with stepwise coding until you reach the point where the appropriate category is no longer obvious. Then change to dictionary coding, and the coding module will display an alphabetically ordered list. This list contains only a subset of the descriptions for which the first group of digits is identical to those already selected. More information about the coding module in BLAISE can be found in Bethlehem, Hofman, and Schuerhoff (1989) and in Schuerhoff, Roessing, and Hofman (1991).
4.8 Statistics Denmark
Statistics Denmark's automated coding systems are used for register-based occupation coding, coding of goods in household expenditure surveys, and coding of mortgage registrations.
Register-based occupation coding has been used by Statistics Denmark since 1970. In the register-based occupation coding, taxpayers provide occupation descriptions on their tax forms. Local tax authorities manually transcribe each description into an abbreviated string with a maximum of 12 letters. The description is registered and converted into a standard
20

abbreviation. There is a coding module consisting of about 12,000 abbreviations. All new descriptions are matched against this list of dictionary abbreviations.
From the tax return form, approximately 75% of all of those classified as employees can be coded as such, which is a fraction of all people with an occupation. Since respondents have a tendency not to report occupational changes from one year to another, a second coding module has been established. This module is supposed to use additional sources for occupation coding. The use of this second coding module increases the coding rate to slightly above 90% for all employees.
The coding modules are also used in some surveys. In the Labor Force Survey the occupation coding rate is 75% and the coding rate of activity type is 40%. In an omnibus survey the occupation coding rate is approximately 80%.
In the Danish Household Expenditure Survey, a system similar to Statistics Sweden's is used. First, all exact matches are stored. Descriptions that are not coded automatically are listed and the number of occurrences is registered. For each description occurring more than twice, a decision is made whether or not to include the description in the dictionary. Ambiguous texts are deleted. The coding process uses exact matching and in one expenditure survey the dictionary was updated three times during the process, resulting in a total of 7,000 different texts. The overall coding degree was about 75% and the remaining 25% were coded manually.
The coding of mortgage registrations is an application whose design makes it well-suited for automated coding. The coding of mortgage registrations has been highly successful with coding degrees between 95% and 98%.
The information on automated coding at Statistics Denmark has been furnished by Thygesen (personal communication, 1989).
4.9 Some other organizations
In Germany automated coding is used only occasionally and typically in aviation statistics. Each month the German airline Lufthansa provides the national statistical office with 160,000 records which contain verbal descriptions of goods transported by air. The contents of these records are matched against a dictionary file.
At the Japanese national office, a new line of research is under development. Systems used in the Western world cannot be applied in Japan because the Japanese language uses ideograms, i.e., Chinese characters, instead of letters and words. Ideograms cannot be parsed or truncated as can languages that use the Latin alphabet. Therefore, work on image processing to process the verbal information in censuses has started. Verbal responses concerning economic activities are scanned by optical mark and image readers. The mark data are stored on magnetic tapes and the image data on optical disks. Mark and image data are then displayed on screens for CAC coding of industry and occupation.
The Office of Population Censuses and Surveys, London, England, will use CAC in the processing of its 1991 census. CAC will be used to code occupation and to resolve queries for the coding of area (assign postal codes), industry, and workplace. Their system is similar
21

to Australia's, but their dictionary is much larger. The Australians have about 5,000 descriptions in their dictionary, whereas the OPCS's system will have to deal with around 20,000 descriptions. Nevertheless, the bulk of the coding will still be performed manually. The goal is to increase quality rather than speed. OPCS does not use automated coding for its sample surveys. Rather, the interviewers are trained to code industry and occupation in the field. Studies have shown that interviewer coding is slightly less accurate than coding done by trained office coders, but the differences are not significant for highly aggregated groupings.
At the Israeli national office, automated coding was used in the 1986-87 Family Expenditure Survey. Variables coded were items purchased and type of store. The Israeli and the Swedish systems are similar. A dictionary approach is used in the Family Expenditure Survey and 81% of the purchases were coded by fully automated systems. An evaluation study showed that the error rate of the part coded by the automated system was 1.8%. For the part that was manually coded, the error rate was 3.6%. The previous Family Expenditure Survey had an error rate of 8.2%. The costs of coding also decrease, making this first attempt at automation very successful. More information is provided by Berg and Har (n.d.).
At the Research Triangle Institute, NC, USA, automated coding has been used in the coding of university transcripts (see Pratt and Mays 1989) and medical records (Bethke and Pratt 1989) with good results. For instance, in the transcript coding, the time required to conduct the automated coding was 8 person-months compared to an estimated 91 person-months for pure manual coding.
A research firm in Australia, Inference Data Systems, has developed a program for data entry called Precision Data. The program contains a powerful coding module suited for complex variables like occupation and education. The module is knowledge-based with a natural language interface. Essentially the system helps the coder find the correct code by suggesting potential dictionary candidates based on an intelligent interpretation of descriptions entered by the coder. The system is primarily built for interactive use but can also be run in batch mode. In the latter case it behaves like any fully automated system, leaving a portion for manual interactive coding.
The current version of the program can handle English descriptions. The manufacturer plans to develop versions suitable for nine other languages. No performance data are available but CBS in the Netherlands will test the system in 1992.
There are a number of other applications as well. Geographic coding is done automatically at some agencies and so is the coding of underlying causes of death. Illustrations of various forms of computerized coding are presented in Lyberg (1981).
5. System Evaluations: Quality and the Future
Section 4 shows that it is difficult to judge and compare different systems. As for comparing different systems, there are very few studies on how different systems perform on identical material. The exceptions are the various studies that the U.S. Bureau of the Census has conducted using its 132,000 benchmark file of responses from the 1980 census. Instead, automated coding research has been characterized by trial and error. Each organization and
22

sometimes even individual surveys have had a tendency to develop systems that fit their own specific needs. There are examples of the existence of different systems for coding the same variable within one agency. Only recently have there been efforts to develop general systems (Statistics Canada and INSEE) that could be used for various applications and various languages.
The algorithms used span from very simple to very complex. It seems as if the simpler algorithms have been the most successful. At least these have been applied while the more complex ones need more testing. One difference between simple dictionary and complicated weighting algorithms is that the simple dictionaries leave a good portion of uncoded cases. This means that any system using a simple algorithm can count on matching rates or coding degrees that, for most variables, are considerably less than 100%. Typical coding degrees run between 60% and 80%. Also, any such system must rely on manual coding for the part that is left uncoded by the automated coding system. Thus, it becomes important to obtain an economically sound procedure. Automated coding and residual manual coding should be less expensive than the same operation being 100% manually coded.
With the more complex weighting algorithms, the basic aim has been to increase the coding degrees so that they come closer to 100%, thereby avoiding manual coding almost entirely. Generally, this endeavor has not been so successful. In cases where the coding degree is large, the resulting coding quality has often been discouraging. Furthermore, the justification for some of the scoring rules used in the weighting algorithms is unclear. As a result, Statistics Canada, for instance, is trying to develop simpler weighting algorithms.
Most of the research on automated coding has concentrated on achieving high coding degrees. Much less has been done on quality issues. This allocation of resources is understandable. If acceptably high coding degrees cannot be obtained there is no need for quality studies. It is nevertheless surprising that the lack of quality studies is so glaring. And when studies have been performed it is often not clear how the studies have been designed. For instance, it is often not clear how correct code numbers have been obtained in quality studies. Examples of issues that are obscurely treated are: the expert coding of dictionary phrases; whether there are differences in coding quality between cases coded by exact match, indirect match, or manually; and the effect on the quality of the distribution of cases per code number.
Other important quality and cost issues include the size of the dictionaries. Some systems use enormous dictionaries while others use relatively small ones. Also, the difference between dictionaries based on empirical responses and those based on coding manuals and instructions are not adequately researched. It seems, however, as if empirical dictionaries are more efficient and to be able to compete, those dictionaries that are based on coding manuals have to be many times as large.
Automated coding has come to stay in statistics production. There are no examples of agencies that have started automated coding programs and then gone back to 100% manual coding. To have large pools of temporarily hired coders to do a relatively monotonous job is hardly something to strive for in the 1990s. But since coding is so error-prone, quality issues must be emphasized more heavily in the future. The portion that is matched exactly does not present any serious problems. By manipulating the nomenclature, the exact matches can be
23
processed with error rates close to zero. It is the indirect matches that cause problems and that call for a much tighter control than what is currently performed.
6. References
Andersson, R. and Lyberg, L. (1983). Automated Coding at Statistics Sweden. In Proceedings of the Section on Survey Research Methods, American Statistical Association, 41-50.
Appel, M.V. and Scopp, T. (1987). Automated Industry and Occupation Coding. Paper presented at Seminar on Development of Statistical Expert Systems (DOSES), Luxembourg, December 1987.
Appel, M. and Hellerman, E.(1983). Census Bureau Experiments with Automated Industry and Occupation Coding. In Proceedings of the Section on Survey Research Methods, American Statistical Association, 32-40.
Bailar, B.A. and Dalenius, T. (1969). Estimating the Response Variance Components of the U.S. Bureau of the Census's Survey Model. Sankhya, Ser. B, 31, 341-360.
van Bastelaer, A.M.L., Hofman, L.M.P.B., and Jonker, K.J. (1987). Computer-assisted Coding of Occupation. Chapter 6 in Automation in Survey Processing. Select no. 4, the Netherlands Central Bureau of Statistics.
Bennison, D. and Bear, C. (1988). The Use of Statistical Matching Techniques for Updating and Maintaining a Business Register. Paper presented at the Fourth Annual Research Conference, U.S. Bureau of the Census.
Berg, A. and Har, S. (n.d.). Automatic Coding in the Israeli 1986/87 Family Expenditure Survey. Unpublished manuscript, Central Bureau of Statistics, Israel.
Bethke, A.D. and Pratt, D.J. (1989). Automatic Coding Methods and Practices. Research report, Research Triangle Institute, NC, USA.
Bethlehem, J., Hofman, L.P.M.B., and Schuerhoff, M.H. (1989). Computer-assisted Coding at the Netherlands Central Bureau of Statistics. CBS report.
Brown, K., Fyffe, S., Simard, G., St John, E., Warren, B., and van Baaren, A. (1984). Automatic Coding Research and Development: Industry Prototype. Analysis report, Statistics Canada.
Brown, K., Goldmann, G., Michel, A., and van Baaren, A. (1983). 1986 Census of Canada, Data Assimilation Task. Automated Coding Research Report.
Corbett, J.P. (1972). Encoding from Free Word Descriptions. Unpublished manuscript, U.S. Bureau of the Census.
Creecy, R.H. (1992). Massively Parallel Computing and Statistics. Paper presented at the seminar on "New Techniques and Technologies for Statistics", Bonn, February 24-26, 1992.
24

Creecy, R.H., Causey, B.D., and Appel, M.V. (1990). A Bayesian Classification Approach to Automated Industry and Occupation Coding. Paper presented at the American Statistical Association's Joint Statistical Meetings, Anaheim, CA, August 1990.
Embury, B. (1988a). The ASCO Computer Assisted Coding System. Paper presented at the Social Research Conference, University of Queensland, Brisbane.
Embury, B. (1988b). The Methodology of Occupation Coding in the 1991 Census. Unpublished manuscript, Australian Bureau of Statistics.
Fasteau, H.H., Ingram, J.J., and Mills, R.H. (1962). Study of the Reliability of Coding of Census Returns. In Proceedings of the Social Statistics Section, American Statistical Association, 104-115.
Hale, A. (1988). Computer-assisted Industry and Occupation Coding in the Canadian Labour Force Survey. Paper presented at the Fourth Annual Research Conference, U.S. Bureau of the Census.
Hansen, M.H., Hurwitz, W.N., and Bershad, M.A. (1961). Measurement Errors in Censuses and Surveys. Bulletin of the International Statistical Institute, 38, 359-374.
Jabine, T.B. and Tepping, B.J., (1973). Controlling the Quality of Occupation and Industry Data. Invited paper, Bulletin of the International Statistical Institute, pp. 1-28.
Knaus, R. (1981). Pattern-Based Semantic Decision Making. In Empirical Semantics, ed B. Rieger, Bochum, Germany: Brockmeyer.
Knaus, R. (1987). Methods and Problems in Coding Natural Language Survey Data. Journal of Official Statistics, 3, 45-67.
Lery, A. and Stephany, A. (1985). COLIBRI E - On-line Key Entry and Coding of 1982 Population Census Forms. Technical report no. 1830/RP82, INSEE.
Lorigny, J. (1988). QUID, A General Automatic Coding Method. Survey Methodology, 14, 289-298.
Lyberg, L. (1981). Control of the Coding Operations in Statistical Investigations - Some Contributions. Ph.D thesis, Urval no. 13, Statistics Sweden.
Lyberg, L. (1986). On the Use of Automated Coding at Statistics Sweden. Research report no. 21, Green series, Statistics Sweden.
Lyberg, L. and Dean, P. (1988). The Use of Technology at Statistics Sweden. Proceedings of Symposium 88 on the Impact of High Technology in Survey Taking, Ottawa, Ontario, October 24-25, 1988.
25
Masand, B., Smith, S., and Waltz, D. (1990). Automated Industry and Occupation Coding on the Connection Machine System. Project report, Thinking Machines Corporation, Cambridge, MA.
Minton, G. (1969). Inspection and Correction Error in Data Processing. Journal of the American Statistical Association, 64, 1256-1275.
O'Reagan, R.T. (1972). Computer-assigned Codes from Verbal Responses. Communications from the ACM, vol. 15, no. 6, 455-459.
Pratt, D.J. and Mays, J.W. (1989). Automatic Coding of Transcript Data for a Survey of Recent College Graduates. In Proceedings of the Section on Survey Research Methods, American Statistical Association, pp. 796-801.
Schuerhoff, M., Roessingh, M., and Hofman, L. (1991). Examples of Computer Assisted Coding. The Netherlands Central Bureau of Statistics, CBS Report BPA 87-M3.
U.S. Bureau of the Census (1965). 1960 Quality Control of Preparatory Operations, Microfilming, and Coding. Washington, DC: Government Printing Office.
Wenzowski, M.J. (1988). ACTR - A Generalized Automated Coding System. Survey Methodology, 14, 299-397.
26