Auto-Tracking System for Human Lumbar Motion Analysis
27
1 Auto-Tracking System for Human Lumbar Motion Analysis Fuge Sui 1 ,Da Zhang 3 ,Shing Chun Benny Lam 4 , Lifeng Zhao 1 Dongjun Wang 1 ,Zhenggang Bi 5 ,Yong Hu 2 * 1. Department. of Orthopaedic Surgery, Longnan Hospital, Daqing , Helongjiang, PR China 2. Department of Orthopaedics and Traumatology, The University of Hong Kong 3. Daqing Youtian Gerneral Hospital aqing , Helongjiang, PR China 4. Department of Radiology, University of Pennsylvania, Philadelphia, PA, USA 5. Department of Orthopaedic surgery, The First Affiliated Hospital of Harbin Medical University, Harbin , China * Correspondence to: Dr. Y. Hu 12 Sandy Bay Road, Hong Kong Duchess of Kent Children’s Hospital Department of Orthopaedics Surgery, The University of Hong Kong Pokfulam, Hong Kong Tel: (852) 29740359 Fax: (852) 29740335 E-mail: [email protected]
Transcript of Auto-Tracking System for Human Lumbar Motion Analysis

1
Auto-Tracking System for Human Lumbar Motion Analysis
Fuge Sui1 ,Da Zhang3,Shing Chun Benny Lam4, Lifeng Zhao1 Dongjun Wang1 ,Zhenggang Bi5 ,Yong Hu2*
1. Department. of Orthopaedic Surgery, Longnan Hospital, Daqing , Helongjiang, PR China
2. Department of Orthopaedics and Traumatology, The University of Hong Kong
3. Daqing Youtian Gerneral Hospital aqing , Helongjiang, PR China
4. Department of Radiology, University of Pennsylvania, Philadelphia, PA, USA
5. Department of Orthopaedic surgery, The First Affiliated Hospital of Harbin Medical University, Harbin , China
* Correspondence to: Dr. Y. Hu
12 Sandy Bay Road, Hong Kong
Duchess of Kent Children’s Hospital
Department of Orthopaedics Surgery,
The University of Hong Kong
Pokfulam, Hong Kong
Tel: (852) 29740359
Fax: (852) 29740335
E-mail: [email protected]

2
Abstract 1
Previous lumbar motion analyses suggest the usefulness of quantitatively characterizing 2
spine motion. However, the application of such measurements is still limited by the lack of 3
user-friendly automatic spine motion analysis systems. This paper describes an automatic 4
analysis system to measure lumbar spine disorders that consists of a spine motion guidance 5
device, an X-ray imaging modality to acquire digitized video fluoroscopy (DVF) sequences 6
and an automated tracking module with a graphical user interface (GUI). DVF sequences of 7
the lumbar spine are recorded during flexion-extension under a guidance device. The 8
automatic tracking software utilizing a particle filter locates the vertebra-of-interest in every 9
frame of the sequence, and the tracking result is displayed on the GUI. Kinematic parameters 10
are also extracted from the tracking results for motion analysis. We observed that, in a bone 11
model test, the maximum fiducial error was 3.7%, and the maximum repeatability error in 12
translation and rotation was 1.2% and 2.6%, respectively. In our simulated DVF sequence 13
study, the automatic tracking was not successful when the noise intensity was greater than 0.50. 14
In a noisy situation, the maximal difference was 1.3 mm in translation and 1° in the rotation 15
angle. The errors were calculated in translation (fiducial error: 2.4%, repeatability error: 0.5%) 16
and in the rotation angle (fiducial error: 1.0%, repeatability error: 0.7%). However, the 17
automatic tracking software could successfully track simulated sequences contaminated by 18
noise at a density ≤ 0.5 with very high accuracy, providing good reliability and robustness. A 19
clinical trial with 10 healthy subjects and 2 lumbar spondylolisthesis patients were enrolled in 20
this study. The measurement with auto-tacking of DVF provided some information not seen in 21
the conventional X-ray. The results proposed the potential use of the proposed system for 22
clinical applications. 23
Index Terms— Auto-tracking; digitized video fluoroscopy; Spine Motion; Particle Filter; 24
Lumbar Spine; Vertebral Body. 25
3
1. Introduction 1
Lumbar spine instability is an ill-defined clinical entity and is most likely related to the large 2
number of patients with chronic low back pain. Current definitions of spinal instability are 3
based on “a loss of stiffness” [1, 2]. Thus, in an unstable condition, a small load results in a 4
large displacement. There has been difficulty in translating this definition into criteria that can 5
be applied to clinical diagnosis and consequent choice of treatment [3]. Clinically, physical 6
signs, such as a visible slip, catch, click or shaking of the section during motion, are 7
commonly used for diagnosing spinal instability [1, 3, 5]. 8
The diagnosis of lumbar instability commonly depends on the chief complaints by the patient 9
and plain X-ray radiography in two dimensions [4]. Radiographs taken at several different 10
positions, such as in full extension and full flexion, are a definite and convenient way to 11
obtain information about spine motion, but do not reflect the continuous vertebral process. 12
Due to the application and expansion of medical technology [5-8], digitalized video 13
fluoroscopy (DVF) sequences [9-15] have been recommended for kinematic data acquisition 14
of spine motion. In 1989, DVF was first applied to investigate spine kinematics by Breen et al. 15
[14]. The advantages include a low level of intervention, a low-dose X-ray and continuous 16
imaging for moving vertebrae. This special imaging technology laid the groundwork for 17
recording spine motion in vivo. Many biomedical engineering studies [10, 13, 14, 16-27] have 18
analyzed spine biomechanics and have presented methods to identify and mark vertebral 19
corners, as well as tracking algorithms for vertebrae. However, relevant information 20
regarding realization and application at clinical system levels is rarely reported. Therefore, we 21
combined all of the necessary components for a comprehensive system, denoted as the 22
Vertebrae Analysis System (VAS), which allows the study of lumbar vertebrae movement in 23
models and in vivo. The results from the VAS provide an objective basis for lumbar disorder 24
diagnoses. 25
The VAS is capable of tracking the vertebrae of the lumbar spine and to estimate the dynamic 26
motion of the spine in most cases. Breen et al. [14], who firstly introduced DVF to investigate 27

4
spine kinematics, succeeded in using DVF to acquire and analyze lumbar spine motion. 1
Kondracki consolidated the usefulness of DVF in spine motion with a passive motion table 2
[28]. Okawa et al. [11] used a sandwich stand to assist in video fluoroscopy acquisition from 3
subjects with and without back pain. Teyhen et al. [13] proposed methods for video 4
fluoroscopy image enhancement and distortion-compensated roentgen analysis, as well as 5
showed the reliability of their methods and demonstrated an improvement in video 6
fluoroscopy image measurements. However, the main limitation of their study was that the 7
vertebral motions could only be recorded at certain fixed frames or time intervals. Lee et al. 8
[9] and Wong et al. [28] evaluated the inter-vertebral motion at certain fixed anatomic ranges 9
of lumbar spine motion, which was not a time-dependent parameter. Notably, the VAS 10
overcomes these limitations. The development of auto-tracking technology was mainly 11
attributed to the application of DVF and the improvement of tracking algorithms [18]. 12
In this study, an attempt was made to gain the motion trajectories of model lumbar vertebrae 13
to test the robustness and the reliability of the VAS. Specifically, clinical practicability was 14
illustrated by importing a healthy human DVF sequence into the auto-tracking system. 15
16

5
2. Materials and methods 1
2.1. Instrumentation 2
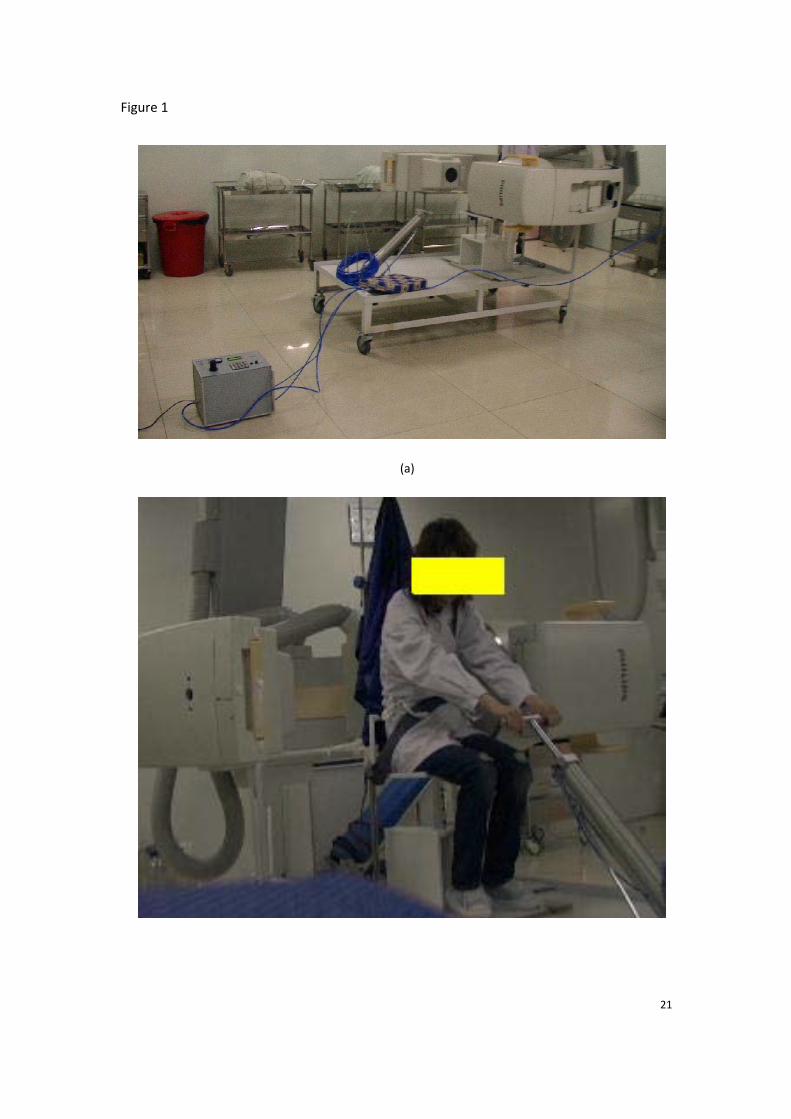
Each DVF sequence was collected using Philips Digital Subtraction Angiography (Philips 3
Medical Systems, Netherlands). The system was in a horizontal position as shown in Fig. 1. 4
DVF sequences were stored and processed on a desk-top computer. 5
An automatic guidance device was custom-designed to keep the subject (model or human) 6
aligned, in order to minimize out-of-plane motion during constant speed sagittal flexion-7
extension, as shown in Fig. 1 (a). The guide device included a control unit, an air cylinder and 8
a rising and dropping stool. The subject sat on the stool, and their hip was held against the 9
stool with a seat belt in order to keep the sacral vertebrae from sliding (Fig. 1 (b)). 10
2.2. Image preprocessing 11
Each DVF image sequence had a low signal to noise ratio due to the low X-ray dose imaging 12
mode employed in our setup, while the contrast between vertebrae and surrounding tissue was 13
degraded. In order to enhance the image quality and to facilitate automated tracking, two-14
dimensional median filtering was applied in histogram equalization to the images. This 15
application was employed to preserve a clear vertebra boundary and to minimize noise as 16
much as possible. 17
The executable software used in the VAS was developed for both automatic tracking and 18
optional manual locating algorithms. The operation window was developed with the open 19
Graphical User Interface (GUI) (Fig 2). 20
Landmarking the vertebrae in a DVF sequence, which can be done automatically, is the basis 21
of kinematic analysis. The previous publication claimed that automatic vertebra tracking may 22
not be succeed in a very poor imaging [24]. Therefore, this system remain a function to allow 23
the operator to manually place the markers on the four vertebra corners (two dorsal corners 24
and two ventral corners) in each vertebra of the start frame of the DVF sequence. Trajectory 25

6
analysis was performed by local polynomial regression analysis [29] to construct a smooth 1
curve graph, after which the translation and angle of rotation of the vertebrae were obtained. 2
2.3. Automated tracking module 3
The proposed VAS adopted the automated vertebra tracking algorithm reported in [23]. The 4
tracking algorithm utilizes particle filter to estimates the posterior distribution of the x- and y-5
displacement (Δxt, Δ yt) and the change in orientation (Δθt) of the vertebra from frame t to t+1, 6
which are formulated in a state vector as 7
Xt = [Δxt, Δ yt, Δθt]T (1) 8
The particle filter estimates the posterior distribution p(Xt|Z1 :t) of Xt from a noisy collection 9
of observations (or measurements) Z1 :t = (Z1, Z2, ⋅⋅⋅, Zt) from each frame of the fluoroscopic 10
sequence arriving in a sequential fashion. From frame t-1 to t, the particle filter generates N 11
samples (called particles) according to the prior distribution of a state transition model 12
p(Xt|Xt-1) for each vertebra to predict the location and orientation in the frame t. The 13
observation model measures the goodness of fit between the projected spline contour 14
(according to the particles) and the vertebral edge. This forms the likelihood distribution 15
p(Zt|Xt) of the measurements. Here, the scoring function of measurement of contour, , is 16
formulated as the sum of gradient magnitude squared under the spline contour A(Ct), where 17
Ct is a vector contains all the control points that constitute the contour. Let the contour giving 18
the highest score be )max( tϕ , the likelihood distribution 19
)2
)max(exp()(
)()(
nttn
tt XZpϕϕ −
∝ (2). 20
where n denotes the number of particles. 21
By applying Sequential Importance Resampling (SIR) to each time step to prevent 22
degeneracy problems [30], the weight for each particle n becomes 23
)|( )()( ntt
nt XZp∝ω (3) and 24

7
∑=
−≈N
n
ntt
nttt XXZXp
1
)()(:1 )()|( δω (4), 1
where ( )δ • is a Dirac delta function. The kinematic parameters in the state vector ˆtX at 2
frame t were computed using the maximum likelihood (ML) estimate 3
∑=
≈N
n
nt
ntt X
NX
1
)()(1ˆ ω, (5) 4
after which Ct is updated with ˆtX and return to the particle filter for the next iteration. 5
2.4. Performance assessment with simulation studies and human subjects 6
To assess the robustness and the reliability of the VAS, a simulation study using a bone 7
model was performed. The DVF of the bone model was obtained at 45kV, 80mA and an 8
exposure time of 3 ms. During the DVF acquisition process, the L1 to L5 region was 9
maintained within the field of view. The assisting device also pulled and pushed the plastic 10
model of the lumbar vertebral column (Anatomical lambo-sacral model, Ortholink LLC, CA, 11
USA) to perform sagittal cycling flexion-extension motion. The continuous dynamic lumbar 12
sequence of the model was assessed in four cycles. When the collection was finished, each 13
vertebra trajectory was recorded by a real-time depiction of the vertebral body with a fixed-14
pen and chart paper recorder and was used for a benchmark of the vertebral motion analysis. 15
The measurement accuracy in terms of the x-, y-translations and rotation angles was 16
calculated in comparison with the benchmark. Additionally, the reproducibility was evaluated 17
by measurement errors in the cycles. 18
To test the robustness of the VAS to noise, a new sequence was produced by adding noise 19
with differing densities to degrade the image quality. The simulated sequence consisted of 61 20
frames of a drawn vertebra in motion. The vertebra moved by 1 mm in x- and y-translations 21
and by 1° in the rotation angle in each frame of the simulated sequence. The range of motion 22
was preset respectively at -20 to 10 mm and 20 to -10 mm in the x- and y-translations and 20° 23

8
to -10° in the rotation angle by 1 mm and 1º between the adjacent frames. The histogram 1
equalization and filter were not applied to the specific sequence. The intensity values of the 2
sequence were scaled to [0 1], such that both the image and noise were of the same scale. 3
To evaluate the clinical usefulness of the VAS, 10 healthy subjects and 2 lumbar degenerated 4
patients were enrolled in the study with informed consent. There were 3 female and 7 male 5
healthy subjects, aged from 19 to 25 at mean of 23.5 years old, without any evidence of 6
lumbar degenerative disease. One female patient at 38 years old was diagnosed with L5/S1 7
lumbar spondylolisthesis, confirmed with radiological detection. Another male patient at 38 8
years old was also diagnosed as L5/S1 lumbar spondylolisthesis without obvious radiological 9
evidence. The DVF sequences of the healthy subjects and patients were obtained by the same 10
medical system (68 kV, 300 mA, exposure time: 7 ms). Each subject was asked to sit in their 11
neutral position and led by the guide device to perform sagittal flexion-extension motion 12
starting from this position. The L1 to S region of the lumbar was maintained within the field 13
of view while the DVF sequence was collected. Image sequences were taken at a lateral 14
projection. The normal parameters of x-translation and the rotation angle were calculated in 15
the control group from the extension to flexion position with time normalization. The x-16
translation and rotation angle in the patients were measured and then compared with the data 17
from the healthy subjects. 18
19
9
3. Results 1
3.1. Reliability assessment with an anatomical lambo-sacral model 2
A bone model from L1 to the sacrum was used for the assessment of the VAS. Figure 3 3
partly plots frames from the DVF sequence of the tracking process. The trajectories of the 4
lumbar vertebrae model (L1-L5) motion were recorded as benchmarks. In the 4 integral 5
cycles, the fiducial errors of x- and y-translations were calculated correspondingly between 6
the automatic tracking and actual measurements (Table 1). The maximum of the fiducial error 7
was 3.7% in x-translation. The root mean square differences (RMS) and the standard error of 8
the measurement (SEM) [31] of the rotation angle, as well as the x- and y-translations, were 9
calculated to test the variability and robustness of the VAS. The average RMS differences of 10
the x-translation, y-translation and angle of rotation were 0.69 (SD 0.4) mm, 0.64 (SD 0.3) 11
mm and 0.9° (SD 0.3°), while the SEM was 0.47, 0.42 and 0.57°, respectively, as shown in 12
Table 2. The mean and standard deviation of the intraclass correlation coefficient [31] (ICC) 13
is shown in Table 3. The average ICCs of the x- and y-translations were 0.99 (SD 0.009) and 14
0.99 (SD 0.005), respectively, between the auto-tracking and actual measurements. 15
3.2. Robustness assessment with a simulated sequence 16
A simulated sequence was measured in order to assess the performance of the auto-tracking 17
system during measurements of low quality imaging. The densities of added noise were 0.10, 18
0.30, 0.50 and 0.70. The example of an image contaminated by “salt & pepper” is shown in 19
Fig. 4. The tracking process failed with a noise density of 0.70. Therefore, subsequent 20
analyses included simulations at noise densities of 0.10, 0.30 and 0.50. For auto tracking in 21
the VAS, each sequence was initialized by placing approximately 50 control points along the 22
vertebral edges on the first frame. Each vertebra used 2000 particles, and the original point of 23
]yx[ 2t
2t
2t θΔΔΔ ,, was set as [4, 1, 1]. 24
Simulated results, representing the average value of 6 trials, showed a fiducial error of 2.4% in 25
x-translation, 2.4% in y-translation and 1.0% in rotation angle (Table 4). The repeatability 26

10
error was 0.5%, 0.5%, and 0.7%, respectively, in the x- and y-translations and in the rotation 1
angle. In the sequence with the added “salt & pepper” noise (density = 0.10, 0.30 and 0.50), 2
the tracking results were good and did not show obvious differences with the increasing noise 3
densities. 4
3.3. Performance in human subjects 5
Using the guidance system, the scope of lumbar flexion and extension was acquired from 6
each subject. The DVF sequences were then analyzed by the VAS system. For the analysis of 7
the DVF model sequences, each vertebra used 2000 particles, and the original point of 8
]yx[ 2t
2t
2t θΔΔΔ ,, was set as [4, 1, 1]. 9
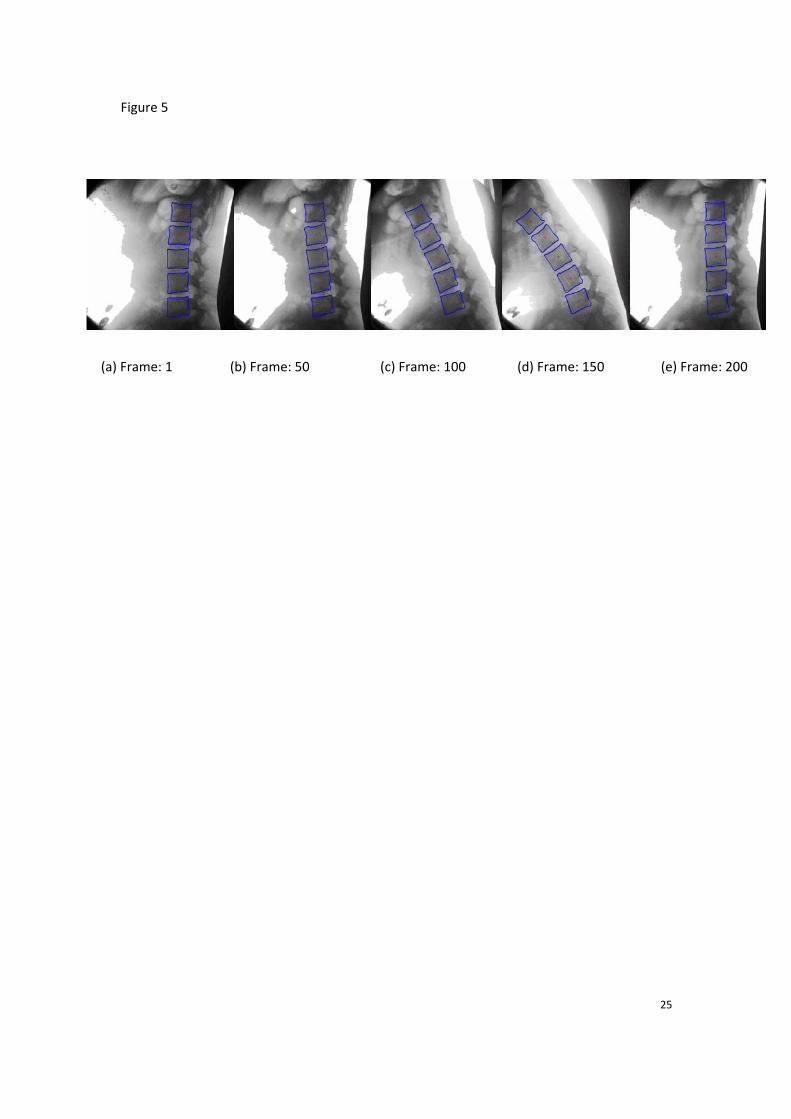
Each subject was asked to perform a complete flexion-extension cycle, to/from straight sitting 10
to extension/flexion (Figure 5). Healthy subjects showed a rotation angle pattern in a 11
complete flexion-extension cycle as depicted in Figure 6, where the blue solid line presents 12
the mean value of 10 healthy subjects, and the green and light-blue dotted lines present the 13
range (±2.5SD) of normal values. The trace of vertebra angles during the flexion-extension of 14
a 38-years-old female, who was diagnosed with L5 spondylolisthesis with obvious 15
radiography disability in the L5-S disc level (Figure 7(a)), is plotted in Figure 6(a), 16
demonstrating that the VAS results confirmed the radiographical diagnosis. In case 2, a 53-17
year-old female presented with symptoms of spondylolisthesis without obvious radiology 18
presentation during standing, flexion and extension X-ray examination (Figure 7(b)). 19
However, the DVF analysis indicated L5 spondylolisthesis during dynamic movement, as 20
shown in Fig 6(b). The results of the rotation angle in Figure 6(b) indicate abnormal rotation 21
in a short period of flexion-extension, which was not identified by traditional X-ray in 22
standing, flexion or extension postures. 23
11
4. Discussion 1
The VAS was developed into a medical system for clinical application. It is capable of 2
tracking the vertebrae of the lumbar spine and to estimate the dynamic motion of the spine in 3
most cases. The development of auto-tracking technology was mainly attributed to the 4
application of DVF and the improvement of tracking algorithms [18]. Breen et al. [14], who 5
firstly introduced DVF to investigate spine kinematics, succeeded in using DVF to acquire 6
and analyze lumbar spine motion. Kondracki consolidated the usefulness of DVF in spine 7
motion with a passive motion table [28]. Okawa et al. [11] used a sandwich stand to assist in 8
video fluoroscopy acquisition from subjects with and without back pain. Teyhen et al. [13] 9
proposed methods for video fluoroscopy image enhancement and distortion-compensated 10
roentgen analysis, as well as showed the reliability of their methods and demonstrated an 11
improvement in video fluoroscopy image measurements. However, the main limitation of 12
their study was that the vertebral motions could only be recorded at certain fixed frames or 13
time intervals. Lee et al. [9] and Wong et al. [28] evaluated the inter-vertebral motion at 14
certain fixed anatomic ranges of lumbar spine motion, which was not a time-dependent 15
parameter. Notably, the VAS overcomes these limitations. With its clinical application, it is 16
possible to standardize the spine motion and to quantify the pattern of spinal movement. 17
In this study, the radiography system selected the minimal X-ray exposure automatically 18
(based on a setting threshold of 45 kV, 80 mA and an exposure time of 3 ms). The results 19
were compared with a standard radiological dose of 68 kV, 300 mA and an exposure time of 20
7 ms. The DVF sequences under the lower dose were tracked completely, as well as those 21
obtained under the higher dose. This result indicates that the VAS performed robustly when 22
the dose was higher than or equal to the lower radiological dose. 23
The measurement model of the particle filter employed in this study considers the nature of 24
image formation of X-ray DVF [18]. A simulation study was performed which compared the 25
RMS error between the particle filter-estimated angle of rotation and translation (i.e. tracking 26
results) with corresponding preset values. We found that a particle filter of the same type 27

12
achieved an RMS error for less than 0.2 degrees and 0.5 pixels in the angle of rotation and 1
translation, respectively, when the Gaussian noise of the normalized variance (σ2) was less 2
than 0.65. The particle filter-tracker slightly tolerated speckled-noise, whereas it failed when 3
σ2 > 0.75. These results suggest that our particle filter exhibited a significantly high tolerance 4
to different densities of noise. 5
In the present bone model and simulation study, the automatic tracking results were very 6
close to the actual measurements or the preset values. The translation and angle were accurate 7
in the limited flexion-extension range. In the human subjects, the use of a guidance system 8
provided an efficient examination, without any out-of-plane effects. When the developed 9
VAS system was applied to the lumbar degenerated patients, an accurate diagnosis was made 10
for both patients, in particular for one patient when the traditional X-ray did not show an 11
abnormal pattern. These preliminary results suggest the potential use of this new system for 12
the clinical diagnosis of spondylolisthesis. 13
Notably, the small sample size (10 healthy subjects and 2 symptom-presenting patients) is a 14
limiting factor in this study, and we require additional subjects with and without lumbar spine 15
problems for further comparisons. A large scale prospective randomized double blind clinical 16
trial should be investigated to evaluate the clinical usefulness of this in vivo diagnosis of 17
lumbar disorders. 18

13
5. Conclusions 1
The proposed VAS provides a tool to investigate lumbar disorders. The automated tracking 2
module performed with significant robustness and reliability in tracking the motions from 3
DVF sequences. Our proposed VAS was evaluated by bone models, simulated sequences and 4
human subjects. Collectively, we found that the auto-tracking algorithm produced results with 5
acceptable accuracy, good reliability and robustness, suggesting that the proposed VAS 6
should be considered for further clinical trial evaluations. 7
8
Acknowledgment 9
This work was supported in part by Institute of Biomedical Engineering of Perking Union 10
Medical College & Chinese Academy of Medical Sciences and Daqing Petroleum 11
Administrative Bureau. The authors thank Dr Xueming Wang for assistance in the process of 12
tailor-made guide device and Miss Anna Lee for the language editing. 13
14

14
References 1
[1] P. M. White A, "Kinematics of the spine," Clinical Biomechanics of the Spine P. M. White A, 2 ed., Philadelphia: J.B. Lippincott, 1990. 3
[2] M. H. Pope, and M. Panjabi, “Biomechanical definitions of spinal instability,” Spine (Phila 4 Pa 1976), vol. 10, no. 3, pp. 255-6, Apr, 1985. 5
[3] F. J., P. M., and W. D., “ Segmental instability. In The Lumbar Spine Edited by Wiesel S, 6 Weinstein J, Herkowitz H, et al. 2nd Ed. W. B. Saunders, Philadelphia. ,” 1996. 7
[4] F. Ringel, M. Stoffel, C. Stuer et al., “Minimally invasive transmuscular pedicle screw 8 fixation of the thoracic and lumbar spine,” Neurosurgery, vol. 59, no. 4 Suppl 2, pp. ONS361-9 6; discussion ONS366-7, Oct, 2006. 10
[5] J. M. Olsewski, E. H. Simmons, F. C. Kallen et al., “Morphometry of the lumbar spine: 11 anatomical perspectives related to transpedicular fixation,” Journal of Bone and Joint 12 Surgery-American Volume, vol. 72, no. 4, pp. 541-9, Apr, 1990. 13
[6] M. M. Panjabi, V. Goel, T. Oxland et al., “Human lumbar vertebrae. Quantitative three-14 dimensional anatomy,” Spine (Phila Pa 1976), vol. 17, no. 3, pp. 299-306, Mar, 1992. 15
[7] M. M. Panjabi, K. Takata, V. Goel et al., “Thoracic human vertebrae. Quantitative three-16 dimensional anatomy,” Spine (Phila Pa 1976), vol. 16, no. 8, pp. 888-901, Aug, 1991. 17
[8] A. White, and P. M, "Kinematics of the spine," Clinical Biomechanics of the Spine P. M. 18 White A, ed., Philadelphia: J.B. Lippincott, 1990. 19
[9] S. W. Lee, K. W. Wong, M. K. Chan et al., “Development and validation of a new technique 20 for assessing lumbar spine motion,” Spine (Phila Pa 1976), vol. 27, no. 8, pp. E215-20, Apr 21 15, 2002. 22
[10] A. Breen, R. Allen, and A. Morris, “A digital videofluoroscopic technique for spine 23 kinematics,” J Med Eng Technol, vol. 13, no. 1-2, pp. 109-13, Jan-Apr, 1989. 24
[11] A. Okawa, K. Shinomiya, H. Komori et al., “Dynamic motion study of the whole lumbar 25 spine by videofluoroscopy,” Spine (Phila Pa 1976), vol. 23, no. 16, pp. 1743-9, Aug 15, 1998. 26
[12] D. Vander Kooi, G. Abad, J. R. Basford et al., “Lumbar spine stabilization with a 27 thoracolumbosacral orthosis: evaluation with video fluoroscopy,” Spine (Phila Pa 1976), vol. 28 29, no. 1, pp. 100-4, Jan 1, 2004. 29
[13] D. S. Teyhen, T. W. Flynn, A. C. Bovik et al., “A new technique for digital fluoroscopic 30 video assessment of sagittal plane lumbar spine motion,” Spine (Phila Pa 1976), vol. 30, no. 31 14, pp. E406-13, Jul 15, 2005. 32
[14] A. C. Breen, R. Allen, and A. Morris, “Spine kinematics: a digital videofluoroscopic 33 technique,” J Biomed Eng, vol. 11, no. 3, pp. 224-8, May, 1989. 34
[15] K. Takayanagi, K. Takahashi, M. Yamagata et al., “Using cineradiography for continuous 35 dynamic-motion analysis of the lumbar spine,” Spine, vol. 26, no. 17, pp. 1858-1865, Sep 1, 36 2001. 37
[16] M. Panjabi, D. Chang, and J. Dvorak, “An analysis of errors in kinematic parameters 38 associated with in vivo functional radiographs,” Spine (Phila Pa 1976), vol. 17, no. 2, pp. 39 200-5, Feb, 1992. 40

15
[17] Y. L. Zheng, M. S. Nixon, and R. Allen, “Automated segmentation of lumbar vertebrae in 1 digital videofluoroscopic images,” Ieee Transactions on Medical Imaging, vol. 23, no. 1, pp. 2 45-52, Jan, 2004. 3
[18] S. C. B. Lam, B. McCane, and R. Allen, “Automated tracking in digitized videofluoroscopy 4 sequences for spine kinematic analysis,” Image and Vision Computing, vol. 27, no. 10, pp. 5 1555-1571, Sep 2, 2009. 6
[19] P. Bifulco., M. Cesarelli., R. Allen. et al., “Automatic extraction of kinematic parameters 7 from videofluoroscopic sequences of the spine,” Health Telematics, Naples, Italy, pp. 147–8 148, 1995. 9
[20] J. M. Muggleton, and R. Allen, “Automatic location of vertebrae in digitized 10 videofluoroscopic images of the lumbar spine,” Medical Engineering & Physics, vol. 19, no. 1, 11 pp. 77-89, Jan, 1997. 12
[21] A. Thorkeldsen, and A. C. Breen, “Gray scale range and the marking of vertebral coordinates 13 on digitized radiographic images,” J Manipulative Physiol Ther, vol. 17, no. 6, pp. 359-63, 14 Jul-Aug, 1994. 15
[22] C. Cardan., and R. Allen., “Measurement of spine motion for diagnosis of mechanical 16 problems,” J. Comp. Simu. Mod. Med, vol. 1, pp. 15-19, 2000. 17
[23] S. C. B. Lam, R. Allen, G. Pearson et al., “Parametric characterization of spinal motions in 18 osteoporotic vertebral fracture at level T12 with fluoroscopy,” Medical Engineering & 19 Physics, vol. 31, no. 3, pp. 346-355, Apr, 2009. 20
[24] W. Frobin, P. Brinckmann, G. Leivseth et al., “Precision measurement of segmental motion 21 from flexion-extension radiographs of the lumbar spine,” Clin Biomech (Bristol, Avon), vol. 22 11, no. 8, pp. 457-465, Dec, 1996. 23
[25] C. Simonis., R. Allen., and a. R. Cloke, “Spatial analysis of the movement of the spine: 24 application of parallel computing in the field of spine biomechanics,” Transputer Applications, 25 vol. 1, pp. 35-38, 1993. 26
[26] P. P. Smyth, C. J. Taylor, and J. E. Adams, “Vertebral shape: automatic measurement with 27 active shape models,” Radiology, vol. 211, no. 2, pp. 571-8, May, 1999. 28
[27] M. G. Roberts, T. F. Cootes, and J. E. Adams, “Vertebral shape: Automatic measurement with 29 dynamically sequenced active appearance models,” Medical Image Computing and 30 Computer-Assisted Intervention - Miccai 2005, Pt 2, vol. 3750, pp. 733-740, 2005. 31
[28] K. W. Wong, J. C. Leong, M. K. Chan et al., “The flexion-extension profile of lumbar spine 32 in 100 healthy volunteers,” Spine (Phila Pa 1976), vol. 29, no. 15, pp. 1636-41, Aug 1, 2004. 33
[29] Z. G. Zhang, S. C. Chan, K. L. Ho et al., “On bandwidth selection in local polynomial 34 regression analysis and its application to multi-resolution analysis of non-uniform data,” 35 Journal of Signal Processing Systems for Signal Image and Video Technology, vol. 52, no. 3, 36 pp. 263-280, Sep, 2008. 37
[30] G. Kitagawa, “Monte carlo filter and smoother for non-gaussian non-linear state space 38 models,” Comput. Graph. Statist., vol. 5, no. 1, pp. 1-25, 1996. 39
[31] M. Bland, An introduction to medical statistics, 3rd ed ed., New York: Oxford University 40 Press, 2000. 41
42
43

16
Table 1 1
The fiducial error between the tracking results and the actual measurement and the 2
repeatability error in first 4 tracking trails 3
4
Vertebra Fiducial Error (%) Repeatability
Error (%)
x 3.7 0.8
y 2.3 0.6 L1
ө -- 2.6
x 2.5 0.6
y 1.6 0.8 L2
ө -- 1.1
x 1.9 0.5
y 1.8 1.2 L3
ө -- 1.0
x 0.7 0.5
y 2.6 1.0 L4
ө -- 1.4
x 0.3 0.1
y 0.5 0.4 L5
ө -- 2.2
‐‐: the value cannot be measured. 5

17
Table 2 1
RMS and SEM of the model tracking results 2
Sagittal flexion‐extension Vertebra
x(mm) y(mm) degree
RMSD 1.13(0.53) 0.63(0.28) 1.019(0.11)L1
SEM 0.75 0.41 0.62
RMSD 0.85(0.39) 1.10(0.61) 0.69(0.07) L2
SEM 0.57 0.76 0.42
RMSD 0.67(0.34) 0.49(0.08) 0.64(0.07) L3
SEM 0.45 0.30 0.39
RMSD 0.73(0.46) 0.79(0.30) 0.91(0.10) L4
SEM 0.51 0.51 0.56
RMSD 0.09(0.01) 0.18(0.02) 1.31(0.56) L5
SEM 0.05 0.11 0.86
RMSD 0.69 (0.4) , 0.64 (0.3) 0.9 ( 0.3)Averaging
SEM 0.47 0.42 0.57
3
RMSD: Root mean square differences among first 4 tracking trials are presented as 4
mean (standard deviation). 5
SEM: Standard error of the measurement among first 4 tracking trails. 6

18
Table 3 1
The mean and standard deviation of ICC (Intraclass Correlation Coefficient) in 20 2
intergral cycles between the tracking results and the actual measurement and in the 3
test-retest in 20 tracking trails 4
Vertebra Statistical Value of ICC
( p < 0.05 ) Statistical Value of ICC ( Test-Retest, p < 0.05 )
x 0.994 ± 0.004 0.9999 ± 0.0001
y 0.991 ± 0.005 0.9998 ± 0.0048 L1
ө ‐‐ 0.9977 ± 0.0016
x 0.992 ± 0.004 0.9999 ± 0.0001
y 0.990 ± 0.005 0.9995 ± 0.0002 L2
ө ‐‐ 0.9989 ± 0.0003
x 0.993 ± 0.005 0.9999 ± 0.0001
y 0.986 ± 0.013 0.9994 ± 0.0003 L3
ө ‐‐ 0.9984 ± 0.0010
x 0.992 ± 0.006 0.9997 ± 0.0002
y 0.986 ± 0.010 0.9987 ± 0.0006 L4
ө ‐‐ 0.9981 ± 0.0006
x 0.974 ± 0.020 0.9954 ± 0.0022
y 0.978 ± 0.014 0.9936 ± 0.0046 L5
ө ‐‐ 0.9933 ± 0.0026
‐‐: the value can not be measured. 5
P-value: Significance of the correlation coefficient. 6

19
Table 4
Mean and standard of tracking results in simulated sequence (original) in 6 trials and the results of adding noise (salt & pepper) with different density
x-translation (mm) y-translation (mm) Rotation Angle (°) Preset
-5 -10 -15 -20 -5 -10 -15 -20 5 10 15 20
Mean(Std) ‐5.4(0.1) ‐10.8(0.1) ‐16.3(0.1) ‐20.7(0.1) ‐5.4(0.1) ‐10.8(0.1) ‐16.3(0.1) ‐20.7(0.1) 5.1(0.2) 10.1(0.2) 15.2(0.2) 19.4(0.2)
density(0.1) ‐5.3 ‐10.7 ‐16.2 ‐20.5 ‐5.3 ‐10.7 ‐16.2 ‐20.5 5.1 10.5 15.2 19.0
density(0.3) ‐5.2 ‐10.6 ‐16.0 ‐20.4 ‐5.2 ‐10.6 ‐16 ‐20.4 5.2 10.3 15.1 19.0
density(0.5) ‐5.0 ‐10.5 ‐15.9 ‐20.3 ‐5.0 ‐10.5 ‐15.9 ‐20.3 5.0 10.2 15.3 19.2
Maximum error 2.4% 2.4% 1.0%
repeatability error 0.5% 0.5% 0.7%
Mean (Std): mean and standard of tracking results in simulated sequence (original or no adding noise) in 6 trials.

20
Figure captions
Figure 1 The medical data acquisition system and motion
(a) Illustration of whole system. (b) The subject perform sitting flexion‐extension movement
under guidance.
Figure 2 Operation Interface.
Figure 3 An example of the lumbar model tracking results (sagittal bending)
Figure 4 The original and contaminated image in the simulated sequences. (a) The original
image for simulating. (b) the images of the sequence are contaminated by “salt & pepper”
(density = 0.50).
Figure 5 Extractions of the tracking results with healthy huam DVF sequence (sagittal
bending)
Figure 6 Rotation angle analysis of lumbar motion (a) Case 1 verse normal group , (b) Case 2
verse normal group.
Figure 7 X‐ray examination (a) Flexion X‐ray of Case 1, (b) Standing X‐Ray of Case 1, (c)
Extension X‐ray of Case 1, (d) Flexion X‐ray of Case 2, (e) Standing X‐Ray of Case 2, (f)
Extension X‐ray of Case 2.
21
Figure 1
(a)

22
Figure 2

23
Figure 3
(a) Frame: 1 (b) Frame: 50 (c) Frame: 100 (d) Frame: 150 (e) Frame: 200

24
Figure 4
(a) (b)
25
Figure 5
(a) Frame: 1 (b) Frame: 50 (c) Frame: 100 (d) Frame: 150 (e) Frame: 200

26
Figure 6
(a) (b)

27
Figure 7
(a) (b) (c)
(d) (e) (f)


