Individual based models by using GIS and a wildlife auto tracking
6
Individual‐based models by using GIS and a wildlife auto‐tracking system Masatoshi Masatoshi DENDA, DENDA, Junji Junji MIWA MIWA and and Toshitaka Toshitaka IWAMOTO IWAMOTO River Restoration Research Team, Public Works Research Institute, Japan River Restoration Research Team, Public Works Research Institute, Japan 8 TH INTRENATIONAL SYNPOSUM ON ECHOHYDRAULICS Sep.12-16 2010 COEX Seoul, Korea Introduction: Background • In order to conserve wildlife habitat, information on the spatial suitability of the habitat is necessary. • Additionally, for more effective policies and planning, it is important to have a simulation model and tools that can reconstruct the mechanism and preliminarily analysis effects of undertaking. river improvement Simulation tool for conserve wildlife habitat Spatial suitability + The 7th International Forum on Waterfront and Watershed Restoration(2010/9/14) http://www.a-rr.net/
Transcript of Individual based models by using GIS and a wildlife auto tracking
Individual‐based models by using GIS and a wildlife auto‐tracking system
MasatoshiMasatoshi DENDA,DENDA, JunjiJunji MIWAMIWA andand ToshitakaToshitaka IWAMOTOIWAMOTORiver Restoration Research Team, Public Works Research Institute, JapanRiver Restoration Research Team, Public Works Research Institute, Japan
8TH INTRENATIONAL SYNPOSUM ON ECHOHYDRAULICS Sep.12-16 2010 COEX Seoul, Korea
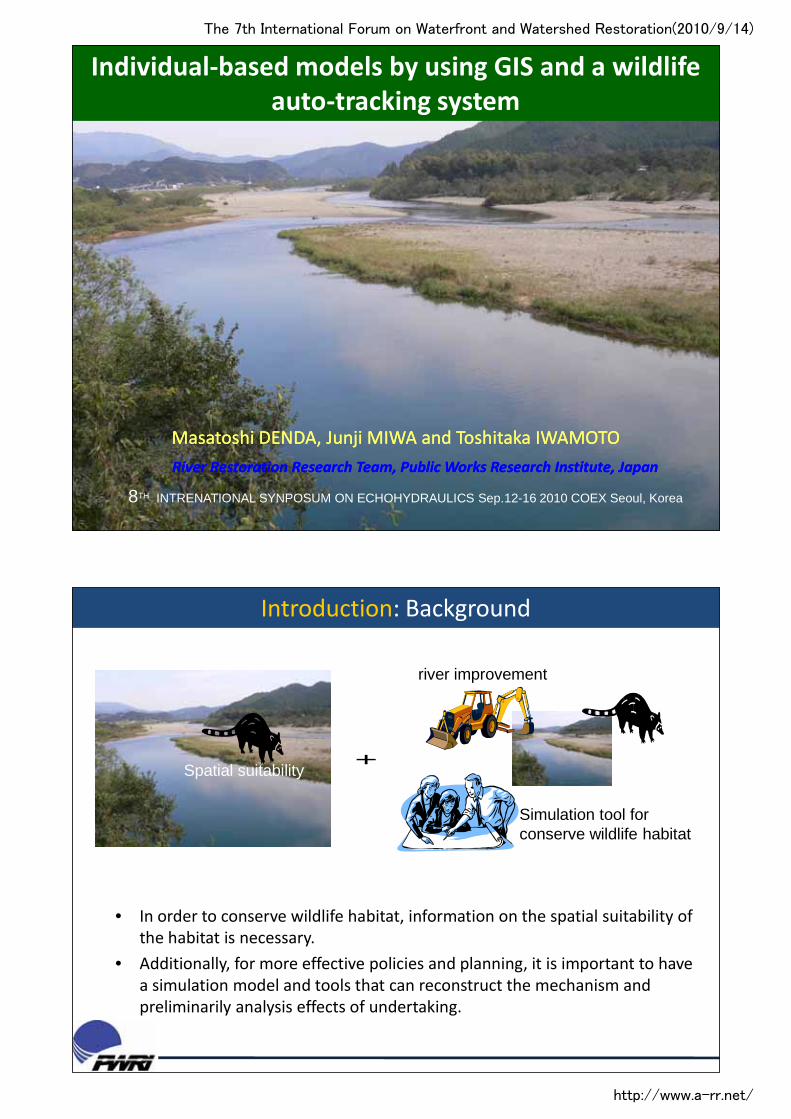
Introduction: Background
• In order to conserve wildlife habitat, information on the spatial suitability of the habitat is necessary.
• Additionally, for more effective policies and planning, it is important to have a simulation model and tools that can reconstruct the mechanism and preliminarily analysis effects of undertaking.
river improvement
Simulation tool for conserve wildlife habitat
Spatial suitability +
The 7th International Forum on Waterfront and Watershed Restoration(2010/9/14)
http://www.a-rr.net/

Introduction: purpose
• We describe the tracking results and spatial preferences ofraccoon dogs (Nyctereutes procyonoides), using an AdvancedTelemetry System (ATS), which is an automatic wildlife tracking.
• We then improved the individual‐based models, which are activelystudied in mathematical ecology.
• We developed a simulation taking into consideration theirbehavioral characteristics and spatial preferences.
Method: Study site Kita River
・The study :Kita River in Miyazaki Pref., eastern Kyushu Island. ・Kita river frequently floods during typhoons. These floods disturb the river’s topography and maintain its spatial diversity.・Therefore, many land mammals inhabit in study site.
Basin area :1,820km2
River Length:106km
The 7th International Forum on Waterfront and Watershed Restoration(2010/9/14)
http://www.a-rr.net/

Method: General description of the ATS
・The ATS used consists of one control station and several receiver stations .
・The control station sends commands to each receiver station to measure the angle of a transmitter.
・Each receiver station rotates directional antenna and measures the angle data
・After collecting data from each receiver station, the control station computes the location of each transmitter by triangulation. The positioning accuracy of the ATS is within 30 m.
control station
Wild Animal
receiver stations
receiver stations
receiver stations
Method: Field survey methodology
Racoon dog #1 Racoon dog #2 Racoon dog #3Gender ♀ ♀ ♀
Tracking period 2004.11.4-11.13 2006.10.27-10.30 2006.10.27-11.22Age (estimate) - ca. 1 to 2 ca. 1 to 2Body weight(㎏) 4.6 4.78 4.56Body length(㎜) 510 594 654Tail length(㎜) 100 125 66Transmitter weight (g) 93 61.7 75.6Transmitter frequency 148.76 141.51 142.08
We trapped three raccoon dogs,attached transmitters to them, andtracked their behavior for 1.5 months.
Transmitter
The 7th International Forum on Waterfront and Watershed Restoration(2010/9/14)
http://www.a-rr.net/

Methods: Data analysis
■Producing spatial data using image analysis
Field data about vegetation community was used as training data, and we re‐ran the analysis until the results of the image analysis agreed with the filed data. a vegetation community map was made using image analysis (supervised classification).
■Analysis of spatial preferences of the raccoon dogsBy analyzing the relationship between raccoon dog movements and the vegetation community, we identified the spatial preferences of the raccoon dogs. Spatial preferences were evaluated using the Ivlev selection index.
Result :Tracking results of the raccoon dogs
Data points showing movements of racoon dog #1
11071108
11091110
1111
1112
A
B
11071108
11091110
1111
1112
11071108
11091110
1111
1112
A
B
Each polygon shows the home range of racoon dog #1
Data points showing movements of racoon dog #3
1029
1101
1104
11071113
1119
1122
1029
1101
1104
11071113
1119
1122
Each polygon shows the home range of racoon dog #3
The average home range of the three raccoon dogs tracked for a week was 15.6 ha .
■Feeding Area
■Activity and rest Area
The 7th International Forum on Waterfront and Watershed Restoration(2010/9/14)
http://www.a-rr.net/

Result :Vegetation community preferences of the raccoon dogs
‐1 ‐0.8 ‐0.6 ‐0.4 ‐0.2 0 0.2 0.4 0.6 0.8 1
sands
bamboo grove
reeds
hackberry and multi flora rose
Japanese red pines
Ivlef Index
LOW HIGHPreference
Raccoon dogs preferred area where vegetation is low density
Method: General description of the model
Channels
Virtual Shrimp
Step1:Consideration of stored energy and consumption energy:start and stop of the action based on stored energy in the body.
E=Ef-(MB+MA)E:Total energy in the bodyEf: Energy by feedingMB: Base Metabolic RateMA: Active Metabolic Rate
MB=70W3/4 (Kleiber,1963)W:Body weight
MA=0.16(10)e (Tucker,1970)e=1.67W-0.126
W:Body weight
E<1.2MB:move to feeding area1.2MB<E<2.2MB:action
Selection Index of Ivlef: LOW⇔high
Step4: Direction selection:virtual animal select one grid where selection index is high to a target direction
:feeding area
:wild animal
Step3: Spatial recognition Virtual animal stores important spatial information(e.g. feeding area)
Step2:Judgment Of Action
The 7th International Forum on Waterfront and Watershed Restoration(2010/9/14)
http://www.a-rr.net/

m
Observed behavior simulation behavior
Result : Comparison of observed behavior and simulation behavior
・The model reproduced each animal’s movements relatively accurately. In particular, the model reproduced round-trip movements between the river terrace and fields around the mountain. ・The order of the animal of the simulation acting roughly agrees with an actual animal behavior.
Conclusions
• We describe the tracking results and spatial preferences of raccoon dogs (Nyctereutes procyonoides), using an Advanced Telemetry System (ATS)
• The average home range of the three raccoon dogs tracked for a week was 15.6 ha.
• The animals frequently used sand, bamboo grove, hackberry, and multiflora rose communities and did not use reeds or Japanese red pines.
• We then improved the individual-based models, and developed a simulation tool ,taking into consideration their behavioral characteristics and spatial preferences. In the result, we recorded successfully the raccoon dog behavior.
• Combination of results of preset research and actual behavior data improve individual based model.
The 7th International Forum on Waterfront and Watershed Restoration(2010/9/14)
http://www.a-rr.net/