Author's personal copy - Official Source of Cassini images ...
18
This article appeared in a journal published by Elsevier. The attached copy is furnished to the author for internal non-commercial research and education use, including for instruction at the authors institution and sharing with colleagues. Other uses, including reproduction and distribution, or selling or licensing copies, or posting to personal, institutional or third party websites are prohibited. In most cases authors are permitted to post their version of the article (e.g. in Word or Tex form) to their personal website or institutional repository. Authors requiring further information regarding Elsevier’s archiving and manuscript policies are encouraged to visit: http://www.elsevier.com/copyright
Transcript of Author's personal copy - Official Source of Cassini images ...

This article appeared in a journal published by Elsevier. The attachedcopy is furnished to the author for internal non-commercial researchand education use, including for instruction at the authors institution
and sharing with colleagues.
Other uses, including reproduction and distribution, or selling orlicensing copies, or posting to personal, institutional or third party
websites are prohibited.
In most cases authors are permitted to post their version of thearticle (e.g. in Word or Tex form) to their personal website orinstitutional repository. Authors requiring further information
regarding Elsevier’s archiving and manuscript policies areencouraged to visit:
http://www.elsevier.com/copyright
Author's personal copy
The three-dimensional structure of Saturn’s E ring
M.M. Hedman a,⇑, J.A. Burns a,b, D.P. Hamilton c, M.R. Showalter d
a Department of Astronomy, Cornell University, Ithaca, NY 14853, USAb Department of Mechanical Engineering, Cornell University, Ithaca, NY 14853, USAc Astronomy Department, University of Maryland, College Park, MD 20742, USAd SETI Institute, 189 Bernardo Dr., Mountain View, CA 94043, USA
a r t i c l e i n f o
Article history:Received 26 April 2011Revised 31 October 2011Accepted 2 November 2011Available online 19 November 2011
Keywords:Planetary ringsSaturn, RingsDisks
a b s t r a c t
Saturn’s diffuse E ring consists of many tiny (micron and sub-micron) grains of water ice distributedbetween the orbits of Mimas and Titan. Various gravitational and non-gravitational forces perturb theseparticles’ orbits, causing the ring’s local particle density to vary noticeably with distance from the planet,height above the ring-plane, hour angle and time. Using remote-sensing data obtained by the Cassinispacecraft in 2005 and 2006, we investigate the E-ring’s three-dimensional structure during a time whenthe Sun illuminated the rings from the south at high elevation angles (>15�). These observations showthat the ring’s vertical thickness grows with distance from Enceladus’ orbit and its peak brightness den-sity shifts from south to north of Saturn’s equator plane with increasing distance from the planet. Thesedata also reveal a localized depletion in particle density near Saturn’s equatorial plane around Enceladus’semi-major axis. Finally, variations are detected in the radial brightness profile and the vertical thicknessof the ring as a function of longitude relative to the Sun. Possible physical mechanisms and processes thatmay be responsible for some of these structures include solar radiation pressure, variations in the ambi-ent plasma, and electromagnetic perturbations associated with Saturn’s shadow.
� 2011 Elsevier Inc. All rights reserved.
1. Introduction
Saturn’s E ring is a tenuous and diffuse ring extending from theorbit of Mimas out to at least as far as the orbit of Titan (Srama et al.,2006; Kempf et al., 2006). Prior to Cassini’s arrival at Saturn,analyses of Voyager and early ground-based images had clearlydemonstrated that the ring is composed primarily of extremelysmall (<5 lm) grains and that its vertically-integrated brightnesspeaks near Enceladus’ orbit (Showalter et al., 1991). Later Earth-based images also indicated that the ring’s vertical thicknessincreases with distance from the planet exterior to Enceladus’ orbit(Showalter et al., 1991; Nicholson et al., 1996; de Pater et al., 2004).These early data, reviewed by Burns et al. (2001), already pointedtowards Enceladus as the source of the E ring and the structure ofthis ring was used to explore the production, transport and loss ofcircumplanetary dust grains (Horányi et al., 1992; Hamilton,1993a; Hamilton and Burns, 1994; Juhász and Horányi, 2002,2004; Juhász et al., 2007; Horányi et al., 2008).
Data from the Cassini Mission have spectacularly confirmed thatEnceladus is indeed the E-ring’s source, revealing a series of ventsnear the moon’s south pole that are launching plumes of tiny ice
grains into orbit around Saturn (see Spencer et al. (2009) andreferences therein). However, the various remote-sensing andin situ measurements onboard Cassini have also provided substan-tial new information about the structure of the E ring itself (seeHorányi et al. (2009) for a recent review). These data promise toprovide many new insights into the dynamics of this ring, as wellas how the E-ring particles interact with Saturn’s moons and magne-tospheric environment (Schenk et al., 2001; Verbiscer et al., 2007).
The currently published analyses of the Cassini E-ring observa-tions mostly utilize in situ data, and have revealed several interest-ing additional structures. Data from the plasma wave antennasshow a depletion in the local particle density near Saturn’s equato-rial plane in the E-ring’s core (Kurth et al., 2006). The dust detectoronboard the spacecraft has not clearly seen this feature, but hasconfirmed that the vertical thickness of the ring increases exteriorto Enceladus’ orbit (Kempf et al., 2008). Furthermore, data fromthis instrument indicate that the ring’s vertical thickness also in-creases interior to Enceladus’ orbit, and that the peak particle den-sity of the inner parts of the E ring occurs significantly south ofSaturn’s equatorial plane (Kempf et al., 2008).
The extensive remote-sensing observations of the ringsobtained by Cassini not only confirm the existence of the above-mentioned ring features, but also yield new insights into the ring’sthree-dimensional structure. In particular, edge-on images providea more global view of the ring’s vertical structure, and various
0019-1035/$ - see front matter � 2011 Elsevier Inc. All rights reserved.doi:10.1016/j.icarus.2011.11.006
⇑ Corresponding author. Address: 322 Space Sciences Building, Department ofAstronomy, Cornell University, Ithaca, NY 14853, USA.
E-mail address: [email protected] (M.M. Hedman).
Icarus 217 (2012) 322–338
Contents lists available at SciVerse ScienceDirect
Icarus
journal homepage: www.elsevier .com/ locate/ icarus

Author's personal copy
observations reveal significant azimuthal asymmetries in the ring.Some of these features can be understood in the context of existingmodels, while others are unexpected and require furtherinvestigation.
Rather than attempt to provide a complete assessment of all theavailable remote-sensing data for the E ring, this paper will focus onselected observations that provide the best global views of theE-ring’s large-scale structure. These observations were all made in2005 and 2006, and thus provide a snapshot of the ring’s structureat a particular point in time when the Sun illuminated the ringsfrom the south at a fairly large elevation angle (19.8–15.8�), andthe planet’s shadow only reached as far as 213,000 km in Saturn’sequator plane and thus did not extend much beyond the inner edgeof the E ring. Studies of the ring’s time variability will therefore bethe subject of a future work. Furthermore, by focusing on the datathat best document the E-ring’s morphology, we also defer anydetailed analysis of spectral or photometric constraints on the ring’sparticle size distribution to a separate report (and see Ingersoll andEwald (2011) for a preliminary photometric analysis of certainhigh-phase Cassini images). However, since non-gravitational,size-dependent forces play an important role in shaping the E ring,we will have to consider the typical particle sizes observed in therelevant images.
We begin by discussing the imaging data used in this analysisand how it has been processed. We then describe a series ofhigh signal-to-noise observations of the edge-on E ring and usethose data to parametrize the ring’s vertical structure. Next, wedemonstrate that the global structure of the ring does not varymuch with longitude relative to Enceladus, but does change sig-nificantly with longitude relative to the Sun. Using multiple datasets, we identify asymmetries in both the ring’s brightness andits vertical thickness. Finally, we discuss some dynamical impli-cations of these various observations, and the challenges theypose for future theoretical modeling efforts.
2. Observations
While various remote-sensing instruments onboard Cassinihave obtained extensive data on the E ring, our investigation ofthe E-ring’s global structure will focus exclusively on data obtainedby the cameras of the Imaging Science Subsystem (Porco et al.,2004), which provide the clearest pictures of the ring’s morphol-ogy. Furthermore, only data from observations that are particularlyinformative regarding the global structure of the ring will be usedin this analysis. These include:
� Multiple series of nearly edge-on images of the E ring obtainedduring Revs 17–23 (‘‘Rev’’ designates a Cassini orbit around Sat-urn) that were obtained in late 2005 through the middle of2006. These observations are particularly useful for determiningthe vertical structure of the ring.� A sequence of narrow-angle camera images taken along the
boundary of Saturn’s shadow on the ring obtained during Rev28 in late 2006. This sequence provides information about azi-muthal asymmetries in the ring.� The spectacular wide-angle camera mosaic of the Saturn system
obtained when Cassini flew through Saturn’s shadow duringRev 28 in September 2006. During this uniquely distant eclipse,Cassini was able to image the rings at exceptionally high phaseangles. This final observation provides the highest signal-to-noise measurements of the E ring and provides the most com-prehensive view of the azimuthal variations in the ring.
All these observations are from a relatively restricted timeperiod (2005–2006). This is partially due to distribution of the
available observations, but it also allows us to develop a modelof the E-ring’s structure at one particular point in time when thesolar elevation angle was fairly large.
These remote-sensing observations only provide informationabout the particles that are sufficiently large to efficiently scatterlight from the Sun into the camera. For light of a given wavelengthk, the scattering cross-section r of a given particle depends on theparticle’s size (radius) s. In the large-particle (geometrical optics)limit r / s2, while in the small-particle (Rayleigh scattering) limit,r / s6, and the transition between these two limiting trends occurswhere s � k (van de Hulst, 1957). Spectral and photometric studiesof the E ring (Showalter et al., 1991; de Pater et al., 2004; Ingersolland Ewald, 2011) and in situ measurements by the RPWS instru-ment (Kurth et al., 2006) and the High-Rate Detector (HRD) onthe Cassini Dust Analyzer (Kempf et al., 2008) indicate that theE-ring’s particle size distribution is steeper than s�4 for particleswith s > 1 lm. For such a steep size distribution, the particles withs ’ k (i.e. the most common relatively efficient scatterers) willmake the biggest contribution to the light scattered by the ring.The above-mentioned images were made at wavelengths around0.63 lm (0.42–0.97 lm for the high-phase mosaic), so the rings’appearance should be dominated by particles with radii betweenabout half a micron and a micron. Indeed, several of the observedstructures in the ring can best be explained if the typical observa-ble ring particles are in this size range (see below).
The above images and the published in situ measurementsprobe overlapping but different parts of the E-ring’s particle sizedistribution. Specifically, the range of particle sizes observed bythe remote-sensing data extends below the s > 0.9 lm limit forthe published HRD data (Kempf et al., 2008). The dynamics of E-ring particles can vary dramatically with particle size, especiallyaround 1 lm (Horányi et al., 1992; Hamilton and Burns, 1994;Juhász and Horányi, 2004; Juhász et al., 2007; Horányi et al.,2008), so the sensitivity of the imaging data to sub-micron grainscomplicates comparisons between the remote-sensing and in situobservations. The contribution of sub-micron grains to the ob-served ring brightness is uncertain because the particle size distri-bution on these scales is not yet well constrained in the E ring. Forthe Enceladus plume, measurements of the plasma environmentby Cassini’s Langmuir Probe suggest that the steep size distributionobserved by RPWS and the HRD may extend through the sub-mi-cron range (Wahlund et al., 2009; Yaroshenko et al., 2009; Shafiqet al., 2011), and the CAPS instrument has even detected a signifi-cant number of nanometer-scale grains within the plume (Joneset al., 2009). However, the size distribution in the E ring will differfrom that of the plume on account of the larger particles re-impact-ing onto Enceladus (Hedman et al., 2009; Kempf et al., 2010), andthe smaller particles being rapidly eroded by sputtering fromcharged particle impacts or lost by other dynamical mechanisms(Burns et al., 2001; Juhász et al., 2007). Future analyses of in situand remote sensing data will likely provide better constraints onthe sub-micron particle size distributions, but for now we will sim-ply urge the reader to not over-interpret the discrepancies be-tween these remote-sensing observations and other data sets.
3. Imaging data reduction
All the relevant images were calibrated using the standard CIS-SCAL routines (Porco et al., 2004) to remove instrumental back-grounds, apply flatfields and convert the raw data numbers to I/F,a standardized measure of reflectance that is unity for a Lamber-tian surface at normal incidence and emission. The images are geo-metrically navigated using the appropriate SPICE kernels and thisgeometry was refined based on the position of stars in the fieldof view. For the images taken at sufficiently high ring-opening
M.M. Hedman et al. / Icarus 217 (2012) 322–338 323

Author's personal copy
angles, this improved geometry could be used to determine the E-ring’s projected brightness as a function of radius and longitude inSaturn’s equatorial plane. By contrast, the interpretation of thenearly edge-on views of the rings required additional datareduction.
The most natural coordinate system to use with edge-on imagesare the cylindrical coordinates q, h and z, where z is the distancefrom Saturn’s equatorial plane (positive being defined as north-wards), h is an azimuthal coordinate, and q is the distance fromthe planet’s spin axis. For any given image, we can define a q � zplane passing through Saturn’s center that is most perpendicularto the camera’s line of sight,1 and then re-project the brightnessmeasurements onto a regular grid of q and z values. We have chosento produce maps of the edge-on rings with resolutions of 500 km inq and 100 km in z in order to facilitate subsequent processing. Forexample, maps derived from different images can be easily com-bined to produce larger-scale mosaic maps of the rings or to improvethe signal-to-noise on the ring (e.g., stars and moons in the imagescan be effectively removed from the maps using a median filter priorto producing the combined map).
The E-ring’s optical depth is so low that all the particles withinthe camera’s field of view are visible, hence the maps derived fromedge-on images represent the integrated brightness through thering along the line of sight. Since the outer parts of the ring appearsuperimposed on the inner parts, interpreting the observed bright-ness measurements is not straightforward. Fortunately, we can re-move these complicating projection effects using a deconvolutionalgorithm known as ‘‘onion-peeling’’ (Showalter, 1985; Showalteret al., 1987). Such algorithms have been used previously to convertvertically-integrated brightness profiles of the edge-on E ring intoestimates of the ring’s normal I/F as a function of radius (de Pateret al., 2004). However, our edge-on maps of the E ring have suffi-cient signal-to-noise that we can, for the first time, apply the algo-rithm directly to the two-dimensional maps themselves.
Applying an onion-peeling algorithm directly to I/F data yields anovel photometric quantity that has a similar relationship to theprojected I/F as the local particle number density has with opticaldepth. For a sufficiently low optical-depth ring consisting of spher-ical particles of size s, the observed optical depth s is given by thefollowing integral:
s ¼Z
ps2NðlÞdl; ð1Þ
where l is the distance along the line of sight and N(l) is the localparticle number density in the ring. If these particles have an albedow and a phase function P(a), then the ring’s observed I/F is simply:
I=F ¼ 14
wPðaÞs ¼Z
14
wPðaÞps2NðlÞdl: ð2Þ
More realistically, the particles in the ring will have a range of sizess, and a corresponding range of cross-sections r(s), phase functionsP(a, s) and albedos w(s). Given the particle size distribution n(s, l),we can integrate the above expression over all particle sizes to ob-tain the following expression for the observed I/F:
I=F ¼Z Z
14
wðsÞPða; sÞrðsÞnðs; lÞds� �
dl ¼ZðJ=FÞdl; ð3Þ
where J/F is something we call the ‘‘local brightness density’’. Thisquantity has units of inverse length and can be regarded as the totaleffective surface area per unit volume in the ring. This parameterhas the benefit of providing a localized measure of the ring’slight-scattering properties, which is much easier to interpret thanthe integrated I/F.
The onion-peeling algorithm derives J/F estimates from the I/Fdata using an iterative procedure. For each row in the maps (i.e.,a fixed z), the algorithm starts with the pixel corresponding tothe largest distance from Saturn (i.e., the largest q) and uses themeasured I/F to determine the J/F in this outer fringe of the rings.This information is then used to estimate how much light thismaterial should contribute to the ring’s measured brightness atsmaller values of q. Once this contribution to the observed I/Fhas been removed from the remaining pixels in the row, we cancompute the local brightness density for the ring material visiblein the next closest pixel to the planet’s spin axis. Iterating overall the pixels then yields J/F as a function of q at the z of the se-lected row.
Any instrumental background level in the I/F maps will createspurious gradients in the peeled maps of J/F, so such backgroundsmust be removed prior to applying the algorithm to a given map. Inpractice this is done by computing the median brightness in thepixels more than 20,000 km from Saturn’s equatorial plane andsubtracting this number from the entire image. Also, since thisinversion method involves repeated differencing of signals fromdifferent pixels, which tends to amplify any noise in the image(especially at low q), we re-bin the maps to a radial resolution of5000 km/pixel prior to performing the inversion.
Once the maps have been suitably prepared, the actual onion-peeling can be performed. For simplicity, the algebra used in thisanalysis assumes the spacecraft is very far from the rings, whichis a reasonable approximation for all the images discussed here.These calculations also assume that the ring is azimuthally sym-metric. This is not precisely true for the E ring (see below), butthe brightness profiles derived under this assumption have shapesconsistent with those derived from images with finite ring-openingangles, so complicating the algorithm to account for azimuthalasymmetries does not appear to be necessary at this point.
Each iteration in the onion-peeling algorithm begins by esti-mating the brightness density J/F from the outermost pixel withnon-zero signal in the I/F map generated during the previous iter-ation. Say this pixel covers the region between the minimum andmaximum radii q1 and q2 = q1 + Dq and the vertical range z1 toz2 = z1 + Dz, respectively. Since previous iterations of the algorithmhave already removed the signal from all the material orbiting theplanet at radii greater than q2, the light seen in the pixel comes en-tirely from an annulus extending between q1 and q2. Assuming thebrightness density J/F is constant within this annulus, then the ob-served I/F is simply:
IF¼ J
FVo
DqDz; ð4Þ
where Vo is the volume of the part of the annulus that lies withinthe limits of the pixel:
Vo ¼ q22 cos�1ðq1=q2Þ � q1
ffiffiffiffiffiffiffiffiffiffiffiffiffiffiffiffiffiq2
2 � q21
q� �Dz: ð5Þ
Eq. (4) can thus be solved for J/F in order to estimate the averagebrightness in this range of q and z. This number is added to theappropriate pixel of the onion-peeled map of J/F.
This estimate of J/F is also used to compute and remove the con-tribution of this ring annulus to the other pixels in the I/F map.Assuming the ring is azimuthally symmetric, this annulus will con-tribute to pixels in the same row of the map (i.e., with the samevalues of z1 and z2). For any pixel covering the radial range be-tween qi and qj = qi + Dq < q1, the volume of the annulus capturedin the pixel is:
V 0 ¼ Vðqi;q2;DzÞ � Vðqj;q2;DzÞ � Vðqi;q1;DzÞ þ Vðqj;q1;DzÞ;ð6Þ
1 If the camera is at an azimuthal angle hC, this plane corresponds to whereh = hC ± 90� in the limit where the range to Saturn approaches infinity.
324 M.M. Hedman et al. / Icarus 217 (2012) 322–338

Author's personal copy
where Vðx; r; hÞ is the volume of the portion of a cylinder with ra-dius r and height h that lies exterior to a vertical plane that has aminimum distance x from the cylinder’s symmetry axis:
Vðx; r;hÞ ¼ r2 cos�1ðx=rÞ � xffiffiffiffiffiffiffiffiffiffiffiffiffiffiffir2 � x2ph i
h: ð7Þ
Given V0, the contribution of the relevant annulus to the observedbrightness in the selected pixel is simply:
I0
F¼ J
FV 0
DqDz: ð8Þ
We can therefore subtract I0/F from the signal in the appropriatepixel of the I/F map, and thereby remove the light scattered by thisannulus from the integrated brightness map. The map of the resid-ual I/F left over after this subtraction is performed on all relevantpixels then forms the basis for the next iteration of the routine.
Of course, the outermost pixel in the map is always a specialcase, since we cannot first remove the contribution due to ringmaterial exterior to this pixel. However, in practice the brightnessof the ring becomes sufficiently faint near the edge of the framethat any residual signal has little effect on the peeled map.
4. Vertical structure of the E ring
The best data set for documenting the detailed vertical struc-ture of the E ring is part of the E130MAP observation obtainedon day 137 of 2006 in Rev 024. This is a large-scale map of the Ering obtained at moderately high phase angles (�130�) and verylow ring-opening angles (�0.1�), which yielded near edge-on, highsignal-to-noise data on the ring. A single map of the ring was con-structed from the longer-exposure WAC images on the lower-phase ansa of the ring, which contained fewer stray light artifacts(W1526532467, W1526536067, W1526539667, W1526543267,W1526546867, W1526550467 and W1526554067). While thismap extends out to radii of 600,000 km, the ring is only clearlydetectable out to about 400,000 km.
Fig. 1 shows the E-ring map derived from these data, as well as amap of the local brightness density obtained by onion-peeling theedge-on images. These maps clearly show the ring’s density peaksnear Enceladus’ orbit at 240,000 km, as expected. What is perhapsmore surprising is that the peak brightness does not occur at z = 0.Instead, there appear to be bands at z = ±1000 km that are slightlybrighter than the region in between. While this ‘‘double-banded’’structure is not apparent in data obtained by the HRD on theCosmic Dust Analyzer (Kempf et al., 2008, 2010), it was previouslydetected in RPWS data (Kurth et al., 2006). We can also observe inthe peeled map that the peak of the ring’s brightness occursslightly north of the ring-plane (z > 0) at radii outside the Encela-dus’ orbit, and slightly south of the ring-plane (z < 0) interior toEnceladus’ orbit.
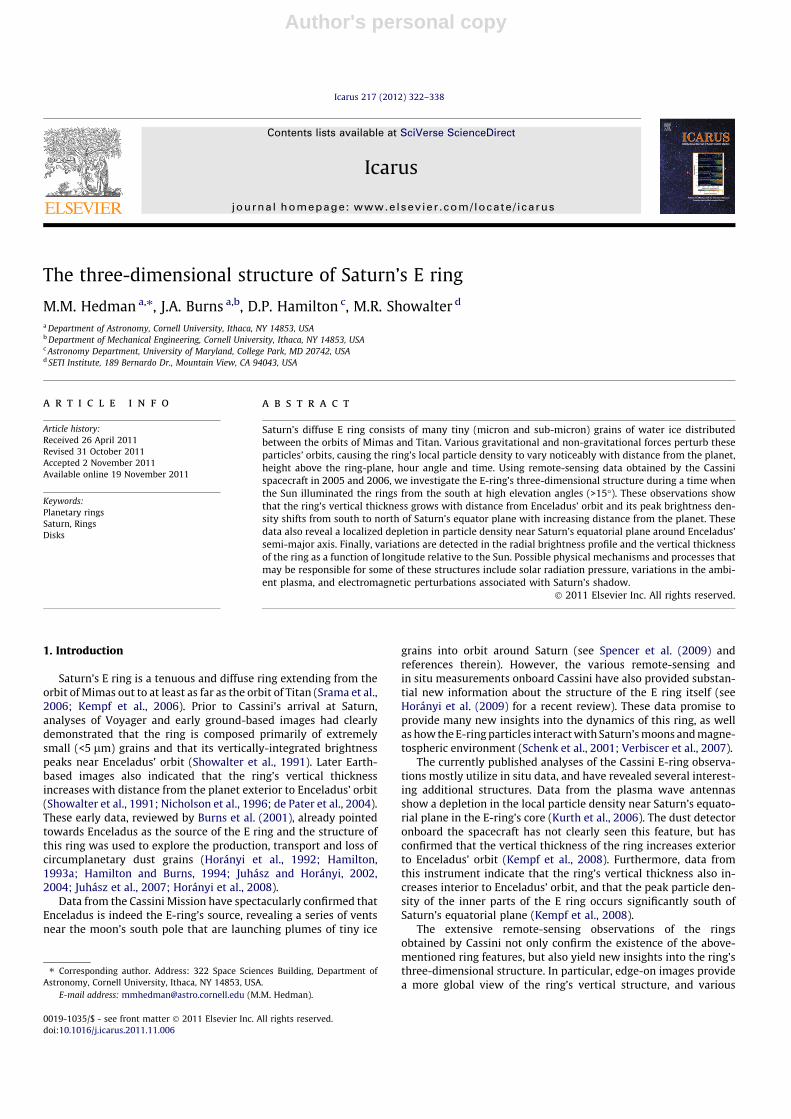
In order to better quantify the ring’s vertical structure, we canfit vertical brightness profiles derived from vertical cuts throughthe peeled map to various functional forms, and plot the resultingfit parameters as functions of the radius q. Fig. 2 shows an examplebrightness profile and several different possible fits. It is fairly clearthat a Gaussian cannot accurately reproduce the observed verticalprofile. In particular, the E-ring profile has much broader wingsthan the best-fit Gaussian model. By contrast, a Lorentzian fit doesa much better job matching the overall shape of the profile. How-ever, even this fit is not perfect, as it overpredicts the density inboth the wings and around z = 0. These discrepancies are almostcertainly due to the ‘‘double-banded’’ structure of the E-ring corediscussed above. Even though the profile shown here does not havetwo distinct peaks separated by a local minimum,2 it clearly has aflat-topped appearance that reflects a localized depletion near thepeak of the profile. If we exclude this region and only fit the dataat more than 2000 km from the profile’s peak, the resulting modelmatches the shape of the wings very well, but grossly overpredictsthe signal near z = 0. However, if we fit the residuals between this
Fig. 1. Edge-on views of the E ring derived from the Rev 024 E130MAP observations. The top image shows the ring’s observed brightness as a function of radius q and z, whilethe bottom image shows the onion-peeled data, which represent the local brightness density as a function of q and z. For clarity, the vertical scale is enhanced by a factor of�3 relative to the horizontal axis. Both images use a ‘‘cyclic’’ stretch (where the displayed brightness equals the intrinsic ring brightness modulo some number) in order toillustrate both the brighter and fainter parts of the ring. A faint dip in brightness near the mid-plane can be seen near the core of the ring around 240,000 km from Saturncenter. Also note that the ring’s peak brightness seems to occur at slightly positive values of z outside 240,000 km and slightly negative values of z inside 240,000 km in theonion-peeled image.
2 A true dip near z = 0 is only clearly detected when a broader range of radii are co-added.
M.M. Hedman et al. / Icarus 217 (2012) 322–338 325
Author's personal copy
last model and the data to a Gaussian, the resulting combination of aLorentzian peak and a Gaussian dip reproduces the observed profileremarkably well. It turns out that this combined model also workswell in other parts of the E ring.
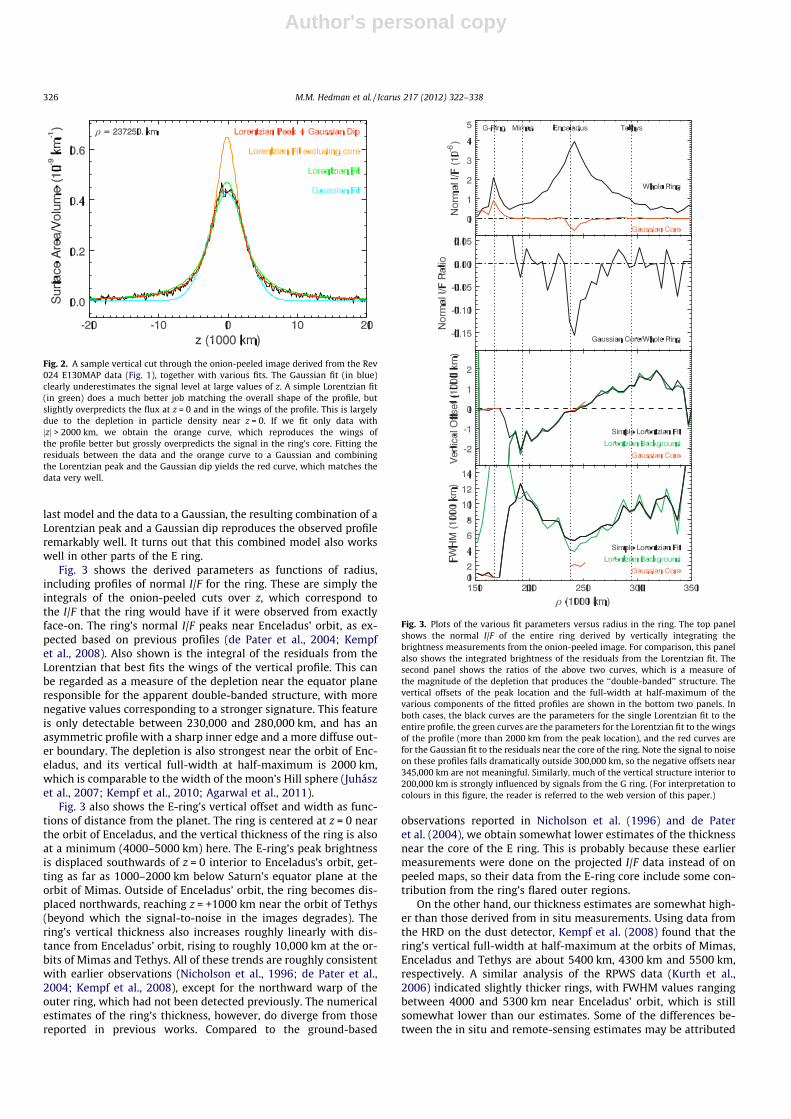
Fig. 3 shows the derived parameters as functions of radius,including profiles of normal I/F for the ring. These are simply theintegrals of the onion-peeled cuts over z, which correspond tothe I/F that the ring would have if it were observed from exactlyface-on. The ring’s normal I/F peaks near Enceladus’ orbit, as ex-pected based on previous profiles (de Pater et al., 2004; Kempfet al., 2008). Also shown is the integral of the residuals from theLorentzian that best fits the wings of the vertical profile. This canbe regarded as a measure of the depletion near the equator planeresponsible for the apparent double-banded structure, with morenegative values corresponding to a stronger signature. This featureis only detectable between 230,000 and 280,000 km, and has anasymmetric profile with a sharp inner edge and a more diffuse out-er boundary. The depletion is also strongest near the orbit of Enc-eladus, and its vertical full-width at half-maximum is 2000 km,which is comparable to the width of the moon’s Hill sphere (Juhászet al., 2007; Kempf et al., 2010; Agarwal et al., 2011).
Fig. 3 also shows the E-ring’s vertical offset and width as func-tions of distance from the planet. The ring is centered at z = 0 nearthe orbit of Enceladus, and the vertical thickness of the ring is alsoat a minimum (4000–5000 km) here. The E-ring’s peak brightnessis displaced southwards of z = 0 interior to Enceladus’s orbit, get-ting as far as 1000–2000 km below Saturn’s equator plane at theorbit of Mimas. Outside of Enceladus’ orbit, the ring becomes dis-placed northwards, reaching z = +1000 km near the orbit of Tethys(beyond which the signal-to-noise in the images degrades). Thering’s vertical thickness also increases roughly linearly with dis-tance from Enceladus’ orbit, rising to roughly 10,000 km at the or-bits of Mimas and Tethys. All of these trends are roughly consistentwith earlier observations (Nicholson et al., 1996; de Pater et al.,2004; Kempf et al., 2008), except for the northward warp of theouter ring, which had not been detected previously. The numericalestimates of the ring’s thickness, however, do diverge from thosereported in previous works. Compared to the ground-based
observations reported in Nicholson et al. (1996) and de Pateret al. (2004), we obtain somewhat lower estimates of the thicknessnear the core of the E ring. This is probably because these earliermeasurements were done on the projected I/F data instead of onpeeled maps, so their data from the E-ring core include some con-tribution from the ring’s flared outer regions.
On the other hand, our thickness estimates are somewhat high-er than those derived from in situ measurements. Using data fromthe HRD on the dust detector, Kempf et al. (2008) found that thering’s vertical full-width at half-maximum at the orbits of Mimas,Enceladus and Tethys are about 5400 km, 4300 km and 5500 km,respectively. A similar analysis of the RPWS data (Kurth et al.,2006) indicated slightly thicker rings, with FWHM values rangingbetween 4000 and 5300 km near Enceladus’ orbit, which is stillsomewhat lower than our estimates. Some of the differences be-tween the in situ and remote-sensing estimates may be attributed
Fig. 2. A sample vertical cut through the onion-peeled image derived from the Rev024 E130MAP data (Fig. 1), together with various fits. The Gaussian fit (in blue)clearly underestimates the signal level at large values of z. A simple Lorentzian fit(in green) does a much better job matching the overall shape of the profile, butslightly overpredicts the flux at z = 0 and in the wings of the profile. This is largelydue to the depletion in particle density near z = 0. If we fit only data withjzj > 2000 km, we obtain the orange curve, which reproduces the wings ofthe profile better but grossly overpredicts the signal in the ring’s core. Fitting theresiduals between the data and the orange curve to a Gaussian and combiningthe Lorentzian peak and the Gaussian dip yields the red curve, which matches thedata very well.
Fig. 3. Plots of the various fit parameters versus radius in the ring. The top panelshows the normal I/F of the entire ring derived by vertically integrating thebrightness measurements from the onion-peeled image. For comparison, this panelalso shows the integrated brightness of the residuals from the Lorentzian fit. Thesecond panel shows the ratios of the above two curves, which is a measure ofthe magnitude of the depletion that produces the ‘‘double-banded’’ structure. Thevertical offsets of the peak location and the full-width at half-maximum of thevarious components of the fitted profiles are shown in the bottom two panels. Inboth cases, the black curves are the parameters for the single Lorentzian fit to theentire profile, the green curves are the parameters for the Lorentzian fit to the wingsof the profile (more than 2000 km from the peak location), and the red curves arefor the Gaussian fit to the residuals near the core of the ring. Note the signal to noiseon these profiles falls dramatically outside 300,000 km, so the negative offsets near345,000 km are not meaningful. Similarly, much of the vertical structure interior to200,000 km is strongly influenced by signals from the G ring. (For interpretation tocolours in this figure, the reader is referred to the web version of this paper.)
326 M.M. Hedman et al. / Icarus 217 (2012) 322–338

Author's personal copy
to azimuthal variations in the ring (see below) and differences inthe assumed functional form of the E-ring’s vertical profile, whileothers may reflect the different range of particle sizes probed bythe various instruments (see Section 2). Smaller particles are ex-pected to have a broader inclination distribution (Hamilton,1993a; Burns et al., 2001; Horányi et al., 2008), and in situ obser-vations indicate that different-sized particles have different verti-cal scale heights in the ring (Srama et al., 2006). The largerwidths reported here may therefore be in part due the remote-sensing data’s finite sensitivity to smaller, sub-micron grains. How-ever, detailed investigations of these issues is beyond the scope ofthis report.
5. Longitudinal variations
In the E ring, there are two physically meaningful longitude sys-tems, one measured relative to Enceladus and one measured rela-tive to the Sun. In principle, asymmetries could be tied to either ofthese coordinate systems.
Let us first consider variations in the E ring that rotate around theplanet at the same rate as Enceladus. The most obvious of these arethe so-called ‘‘tendrils’’, regions of enhanced optical depth near Enc-eladus that could either represent plume material that has not yetbeen dispersed into the E ring or local variations in the E-ring densityinduced by the moon’s gravitational perturbations on the ring parti-cle’s orbits (Spencer et al., 2009). These structures clearly follow Enc-eladus around on its orbit. Furthermore, early ground-basedobservations detected a bright cloud in the E ring that moved aroundthe planet at roughly the same orbital speed as Enceladus (Roddieret al., 1998). While a detailed analysis of these localized structuresis beyond the scope of this work, their existence motivates us to ex-plore the possibility that some of the E-ring’s large-scale structuremay vary with longitude relative to Enceladus.
A useful data set for examining such variations is theE80PHASE001 imaging sequence from Day 11 of 2006 in Rev 020.During this sequence, the cameras observed one ansa of the E ringfor a period of 16 h, or about one-half of Enceladus’ orbit period.During this time, the spacecraft stared at the same longitude inthe rings relative to the Sun as material rotated through. We mademaps of the 17 clear-filter images taken during the long stare thatwere targeted directly at the core of the E ring.3 These images wereall obtained at moderate phase angles (�80�), which meant that thering was quite faint and spurious structures in the images due tostray light scattered within the camera (West et al., 2010) were moreprominent. We were therefore unable to use the onion-peeling algo-rithm on these images, and so only considered the edge-on observedbrightness maps. Fortunately, the stray-light patterns were stablefrom image to image, so we could still use these data to look for vari-ations with longitude relative to Enceladus.
For each radius in the map derived from each image, we com-puted the vertically integrated brightness of the ring within15,000 km of Saturn’s equatorial plane after subtracting a cubicbackground based on the data at larger jzj. Fig. 4 plots the varia-tions in these brightness estimates with longitude relative to Enc-eladus. Note that the observed longitudes cover the region nearEnceladus as well as both the leading and trailing Lagrange points,and thus these data include most regions where one might suspectaccumulations of material to be found. However, these plots onlyshow subtle longitudinal brightness variations, many of whichmay simply be imaging artifacts. For example, there might be aslight (5–10%) elevation in the ring’s brightness in the vicinity of
Enceladus’ longitude at q = 241,000 km, but this peak may simplybe due to stray light from the moon itself. However, even if theinterpretation of these variations are problematic, these plotsclearly demonstrate that there are no systematic brightness trendswith longitude at any radius within the ring above the 10% level,which is much less than the variations among observations madeat different hour angles (see below). Plots of peak brightness andvertical width of the ring also fail to produce strong trends. Wetherefore conclude that, despite the existence of localized ten-dril-like structures in the vicinity of Enceladus, the broad-scalestructure of the rings is not a strong function of longitude relativeto Enceladus.
6. Hour-angle variations
The E-ring’s large-scale structure varies much more dramati-cally with longitude relative to the Sun than it does with longituderelative to Enceladus. In order to avoid possible confusion
Fig. 4. Plots showing the vertically-integrated brightness of the edge-on E ring as afunction of longitude relative to Enceladus derived from the Rev 020 E80PHASEdata. All observations cover the same range of longitudes relative to the Sun. Eachpanel shows the brightness estimates normalized such that their average bright-ness is unity. Note that brightness measurements are not from onion-peeled maps,so each panel includes contributions from material outside the labelled distance.For all these plots, the brightness varies by less than 10%, suggesting that thebrightness of the ring does not vary much with longitude relative to Enceladus.
3 Image names W1515651456, W1515652240, W1515656916, W1515662987,W1515664339, W1515668736, W1515669520, W1515674496, W1515680256,W1515686016, W1515691776, W1515692560, W1515697536, W1515697810,W1515703308, W1515704660 and W1515709057.
M.M. Hedman et al. / Icarus 217 (2012) 322–338 327

Author's personal copy
regarding different longitude systems, patterns that appear totrack the Sun will be referred to as ‘‘hour-angle variations’’ or‘‘hour-angle asymmetries’’. Multiple observing sequences docu-ment these asymmetries. First, selected edge-on views of the ringsshow asymmetries in the rings’ brightness and vertical structure.Second, the data obtained during Rev 28, when Cassini flewthrough Saturn’s shadow provides a global view of the E ring’sasymmetric structure at very high phase angles. Finally, imagesof Saturn’s shadow within the E ring reveal further asymmetrieswithin the ring’s anti-solar quadrant.
6.1. Edge-on views at moderate phase angles
During Revs 17–23 (days 306–2005 through 113–2006) Cassiniobserved the nearly edge-on E ring at phase angles around 105� inseveral separate E105PHASE campaigns. With this viewing geome-try, one ring ansa is near the sub-solar longitude and the other isnearly aligned with the anti-solar longitude and Saturn’s shadow.Note that when these observations were made, the solar elevationangle was above 17.7�, so Saturn’s shadow does not extend muchbeyond 190,000 km from Saturn center within the E ring. Both an-sae of the ring were viewed three separate times. The sub-solaransa was observed during Revs 17, 18 and 23, while the anti-solaransa was observed during Revs 19, 22 and 23. A subset of the clear-filter images from each observation listed in Table 1 was used togenerate sufficiently high signal-to-noise maps of the appropriateansa for the onion-peeling procedures described above. Examplesof the onion-peeled maps of the sunward and shadowed ansa areshown in Fig. 5 with a common stretch applied to facilitate com-parisons between the images. In both images the double-bandedstructure near the orbit of Enceladus is visible, but we can alsosee differences between the images. In particular, the sub-solaransa is clearly brighter than the anti-solar one, and the brightnesspeaks at a smaller radius. These trends are found in all the relevantedge-on maps and are consistent with the high-phase observationsdescribed below.
In order to quantify these asymmetries, we fit vertical cutsthrough the peeled images to simple Lorentzians (note the sig-nal-to-noise ratios of these onion peeled maps were too low forstable Gaussian + Lorentzian fits). Fig. 6 plots the resulting fitparameters. Note that the parameters derived from the threeobservations of each ansa show the same trends, which means thatthe systematic differences between the two ansae are not due toinstrumental artifacts. As before, normal I/F curves are derived byvertically integrating the brightness measurements in the onion-peeled maps. In the sub-solar profiles, the normal I/F peaks nearEnceladus’ orbit, while the anti-solar profiles peak about1000 km further out. Also, the sub-solar profiles are systematicallybrighter than the anti-solar profiles between 210,000 km and250,000 km (and perhaps even further out as well). These findingsare consistent with those from the high-phase observations
described below (see Fig. 9), and demonstrate that this hour-angleasymmetry is a stable and persistent feature of the E ring.
Turning to the vertical structure of the ring, we find that thevertical offsets in the ring’s peak brightness density are essentiallythe same on the two ansae throughout the E ring, even between210,000 and 250,000 km where the brightness asymmetries aremost prominent. However, the trends in the ring’s vertical thick-ness systematically differ for the two ansae (see Fig. 13 below fora cartoon sketch of these asymmetries). Exterior to Enceladus’ or-bit, the E-ring’s thickness grows more rapidly with increasing ra-dius on the sub-solar ansa than on the anti-solar ansa. On theother hand, interior to Enceladus’ orbit, the E-ring’s thickness risesmore steeply away from Enceladus on the anti-solar side of therings. These trends are consistent among multiple observationsand therefore cannot be ascribed to instrumental artifacts. Thisasymmetry in the ring’s vertical structure suggests that those par-ticles with their pericenters near the sub-solar longitude have asmaller range of inclinations than those whose pericenters are nearthe anti-solar point.
Unfortunately, Cassini did not obtain similarly high signal-to-noise edge-on views of the ring at extremely high or low phaseangles, where the ansa would correspond to the ring’s ‘‘morning’’and ‘‘evening’’ sides (i.e., longitudes ±90� away from the Sun). Bothansae were observed during the E130MAP observations describedabove, but at these phase angles the ansae are halfway betweenthe morning/evening and sub-solar/anti-solar parts of the rings.These data show trends that are qualitatively similar to those seenin the E105PHASE data, with the more sunward ansa appearingbrighter and having a more pronounced exterior flare than the sha-dow-ward ansa. We therefore do not see any novel differences inthe ring’s vertical structure in these data that could easily be attrib-uted to any asymmetries between the morning and evening sidesof the ring.
6.2. Extremely high-phase observations
Fig. 7 shows a false-color mosaic derived from images(W1537023863–W153703340) taken through the IR3, CLR andVIO filters (effective central wavelengths 420 nm, 634 nm and917 nm, respectively) while Cassini flew through Saturn’s shadowon Day 258 of 2006 during the Rev 28 HIPHWAC observation. Notethe Sun is located behind the planet in this image (a bright spot atabout 7 o’clock on Saturn’s limb hints at its location). The rings inthe upper half of the mosaic are closer to the Sun, while those inthe lower half are closer to Saturn’s shadow. The left ansa in thisimage is thus the evening side of the rings and the right ansa lieson the morning side of the rings. During this observation, Encela-dus was moving from the evening ansa towards the anti-solar sideof the rings. This mosaic contains several instrumental artifacts,including a dark horizontal band due to partial saturation of thedetector, and various bright streaks and flares due to stray lightfrom the planet. Nevertheless, one can still identify several
Table 1Images used to construct maps from E105PHASE Imaging sequences.
Rev 17 Rev 18 Rev 19 Rev 22 Rev 23 Rev 23Sunward Sunward Shadow Shadow Sunward Shadow
W1509652497 W1512071423 W1514471249 W1521084669 W1524468111 W1524509713W1509652763 W1512071689 W1514473949 W1521084967 W1524474840 W1524558146W1509659157 W1512075983 W1514475209 W1521091512 W1524481590 W1524565192W1509667164 W1512080543 W1521098412 W1524488340W1509667978 W1512085103 W1521105312 W1524495090W1509674638 W1512085369 W1521112269W1509675718 W1512089663W1509675984
328 M.M. Hedman et al. / Icarus 217 (2012) 322–338

Author's personal copy
asymmetries in the ring’s brightness and color from a visualinspection of this image.
Perhaps the most obvious E-ring asymmetry is the difference inthe color of the two ansae. On the evening ansa, the ring has a sim-ilar color just interior and exterior to the E-ring core, while on themorning ansa, the inner parts of the ring appear distinctly ‘‘bluer’’than the outer parts. Also, on the evening ansa the ring’s brightnesssmoothly decreases inwards towards the G ring, while the morningansa seems to have a sharper inner edge somewhat exterior to theG ring. In addition, the sub-solar and anti-solar sides of the ringsshow a more subtle, but still important, asymmetry. In this mosaic,the Sun was located somewhat below the center of the planet, sothe anti-solar side of the rings is being observed at a somewhathigher phase angle than the sub-solar side of the rings. Since adusty ring’s brightness should increase with phase angle(Showalter et al., 1991; Burns et al., 2001), the anti-solar part ofthe rings should be brighter than the sunward region, but in factthese two sides of the ring actually appear to be equally bright,which implies that the E ring is intrinsically brighter near thesub-solar longitude.4 The edge-on images discussed above are con-sistent with this interpretation, and furthermore the fact that thoseobservations always show the sub-solar ansa to be brighter than theanti-solar ansa means that this asymmetry is a persistent ring fea-ture and not a result of a coincidence involving the location of Enc-eladus in these images.
In order to explore these asymmetries more quantitatively, wemust generate profiles of brightness versus radius. However, to beinformative, these profiles need to account for the significantchanges in the phase and emission angles across this mosaic. Theemission-angle variations can be dealt with relatively simply bycomputing the emission angle at the ring-plane for each pixel inthe images and multiplying the observed I/F by the cosine of theemission angle l to obtain the normal I/F, i.e., the predictedbrightness of the ring when it is viewed at normal incidence. Forlow-optical-depth rings like the E ring, this quantity should beindependent of the observed emission angle.
Dealing with the phase-angle variations is more difficult, be-cause we do not know a priori how the ring’s brightness changeswith phase angle, especially if there are azimuthal asymmetriesin the ring. Fortunately, we can avoid this issue by constructingbrightness profiles at a fixed phase angle. Lines of constant phaseangle correspond to circles in the mosaic centered on the apparentposition of the Sun behind the planet, with the circle’s radius beingset by the phase angle (see Fig. 8). For phase angles between 174.5�and 177.5�, these circles cut through the E-ring’s core at four sep-arate longitudes. Figs. 9 and 10 show the profiles corresponding tophase angles of 177� and 175�, respectively (these phase angleswere chosen to minimize stray-light contamination within thecore of the E ring). In both figures, two sets of profiles are shown,one derived from VIO-filter images (effective wavelength420 nm) and the other derived from IR3-filter images (effectivewavelength 917 nm). In both cases, only data from the images withrelatively short exposures were used to avoid saturation effects.
First, consider the brightness measurements made at 177�phase in Fig. 9. The cuts through the E-ring’s core now fall eitherclose to the sub-solar side of the rings (k � k� � 0�, purple–pinkin Fig. 9) or the anti-solar side of the rings (k � k� � 180�, green–blue in Fig. 9). The IR3-filter data do not show strong azimuthalvariations; the offsets between the profiles primarily reflect thedifferent instrumental background levels seen interior to the ring.However, the VIO-filter profiles show clear asymmetries. In thiscase, the peak brightness occurs near Enceladus’ orbit on thesub-solar side of the rings, while on the anti-solar side the peak liesabout 10,000 km further from Saturn. Furthermore, the peakbrightness on the sub-solar side is roughly 50% higher than thepeak brightness on the anti-solar side. Thus, while outside250,000 km the profiles are basically the same, between 190,000and 250,000 km the sub-solar ring is always brighter than theanti-solar ring in the VIO-filter images. This asymmetry in therings’ brightness is consistent with that seen in the edge-on viewsdescribed above (compare Fig. 6).
Next, consider the 175� phase data in Fig. 10, where the cutsthrough the ring’s core fall near the morning ansa (k � k� � 270�,orangish-red and green in Fig. 10) or the evening ansa(k � k� � 90�, various shades of blue in Fig. 10). The brightness
Fig. 5. Sample onion-peeled maps of the E-ring’s two ansa derived from E105PHASE observations in Revs 17–23. Both images use the same stretch. Note the sub-solar ansa issignificantly brighter than the anti-solar ansa, and peaks at a smaller radius. Also note that the double-banded structure is visible in both images.
4 Ingersoll and Ewald (2011) recently came to the same conclusion in anindependent analysis of these images.
M.M. Hedman et al. / Icarus 217 (2012) 322–338 329

Author's personal copy
profiles derived from the IR3-filter images are basically the same atthe two ansa, but the VIO-filter shows a clear asymmetry. Theevening-ansa, VIO-filter profiles have a slightly wider peak thanthe IR3 profiles (which is why the core of the ring in that part ofthe mosaic has a reddish core and blue wings in Fig. 7), but other-wise the IR3-filter and evening-ansa VIO-filter profiles have similarshapes with a rather sharp peak at Enceladus’ orbit. By contrast,the morning-ansa VIO-filter profiles maintain a higher brightness(relative to the peak at Enceladus’ orbit) between 210,000 and240,000 km, which corresponds to the bluish-colored region onthe morning ansa that can be seen in Fig. 7. Around 210,000 km,
there is a relatively sharp drop in brightness that corresponds tothe edge of this region in the mosaic. Further information aboutthis morning–evening asymmetry can be obtained by examininghigh-phase images of the region around the edge of Saturn’sshadow.
6.3. High-phase shadow-edge observations
Brightness asymmetries in the E ring can also be identified in amosaic of images (N1536644151–N1536651126) obtained duringthe Rev 28 SHADBOUND observation on Day 254 of 2006 at phaseangles between 145� and 150� (see Fig. 11). These images trace outthe edge of Saturn’s shadow on the planet’s equatorial plane, andindeed the shadow edge is visible in many of the images, especiallynear the G ring. Differencing the observed signals interior and exte-rior to the shadow edge enables us to remove any sky or instru-mental backgrounds and thus provides estimates of the ring’sabsolute brightness near the two sides of the shadow (see Fig. 12).
There is a clear asymmetry in the brightness contrast along thetwo sides of the shadow, which is most prominent exterior to the Gring at 167,500 km. The difference in the normal I/F across theevening edge of the shadow is of order 10�6 between 170,000and 190,000 km, while on the morning edge of the shadow the nor-mal I/F change is 5–10 times smaller. Thus the E-ring is about anorder of magnitude fainter on the shadow’s morning side than itis on the evening side, far more than would be expected givenslight differences in the phase angle between these two regions(Showalter et al., 1991).
This difference between the two edges is likely connected to themorning–evening asymmetry seen in the high-phase mosaic.Returning to Fig. 7, note that interior to the ‘‘blue’’ region of the E ringon the morning ansa, the E ring has a sharp inner edge that is not seenon the evening ansa. The relatively empty region interior to this edgeprobably corresponds to the region of reduced brightness on theshadow’s morning edge seen in the SHADBOUND data. This suggeststhat while the morning side of the E-ring has a higher particle densitythan the evening side between 210,000 and 240,000 km (cf. Fig. 10),the opposite is true between 170,000 and 190,000 km. Unfortu-nately, due to difficulties in determining the instrumentalbackground levels in the mosaics and complications associated withchanging phase angles, we cannot generate profiles like those inFig. 10 that clearly document this transition. Nevertheless, such atransition is a reasonable interpretation of the combined data fromthe high-phase mosaics and the shadow-boundary observations.The location of this transition is interesting, because it occurs nearthe location of the tip of Saturn’s shadow in the planet’s equatorialplane. Together with the evidence for the sharp change in the E-ring’s brightness between the morning and evening sides of Saturn’sshadow, this strongly suggests that the shadow influences the struc-ture of the inner E ring.
Finally, note that on the shadow’s evening side the sharp bright-ness transition deviates from the expected position of the shadowedge in Saturn’s equator plane at radii greater than 190,000 km. Asshown in Fig. 11 the observed position of the brightness boundaryin this region would correspond to the expected shadow edge at alocation between 0 and 2000 km south of Saturn’s equator plane.Thus the apparent position of the shadow boundary could reflectthe inner E-ring’s southward deflection observed in edge-onimages (see Figs. 3 and 6). The proximity of the brightness edgeto the predicted shadow edge at z = 0 for radii less than190,000 km would then imply that the ring is not vertically offsetinterior to 190,000 km. However, we should note that the contri-butions from Saturn’s very flat G ring may be affecting the appar-ent position of the shadow edge. Furthermore, we cannotcompletely rule out the possibility that the brightness variationsseen outside 190,000 km do not trace the position of the shadow
Fig. 6. Vertical structure of the sub-solar and anti-solar ansae of the E ring derivedfrom clear-filter images obtained during E105PHASE observations. All results arederived from simple Lorentzian fits. The top panel shows the vertically integratedbrightness profiles of the ring. The second panel presents the normal I/F derived byvertically integrating the onion-peeled maps. The third panel displays the peakbrightness (J/F) in the onion-peeled maps, while the bottom two panels show thevertical offset and full width at half maximum of the ring. The black curves comefrom the sub-solar ansa while the green/gray curves are for the anti-solar ansa. Notethat the inner part of the ring is systematically brighter on the sub-solar ansa(compare with Fig. 9). Also, while the vertical offset of the ring appears to be similaron the two ansae, the vertical thicknesses are clearly different. (For interpretation tocolours in this figure, the reader is referred to the web version of this paper.)
330 M.M. Hedman et al. / Icarus 217 (2012) 322–338

Author's personal copy
edge but instead reflect variations in the rings’ surface density inthe vicinity of the shadow.
7. Synthesis
The above observational data document several interestingstructures and asymmetries in Saturn’s E ring, which should helpelucidate the dynamics of E-ring particles. Unfortunately, the ob-served data only provide measurements of the brightness densityas a function of radius, longitude and z, and the mapping betweenthese real-space coordinates and particle orbital elements is notstraightforward. In particular, there is often insufficient informa-tion to determine whether a given radial brightness distributionis due to variations in either the particles’ semi-major axes or theireccentricities. Over the years, numerical simulations have beenused to predict the spatial distribution of particles moving underthe influence of a specified set of forces and compare those withthe observed data (Horányi et al., 1992; Juhász and Horányi,2002, 2004; Juhász et al., 2007; Horányi et al., 2008). However, athorough comparison of these models with the data is beyondthe scope of this paper because the relatively complex dynamicsof E-ring particles make it difficult to exhaustively explore the rel-evant parameter space. Instead, we will focus on a few features ofthe data where analytical expressions can clarify the physical pro-cesses involved.
First, we will consider the average vertical warp and the double-banded structure in the vicinity of Enceladus’ orbit. Here, analyticalcalculations demonstrate that these features of the E ring are
consistent with current models and theories of the E ring and wecan therefore use these features to constrain both the physicaland orbital properties of the E-ring particles. Next we will discussthe azimuthal asymmetries, which are difficult to explain in termsof existing theory and models. Here we will highlight aspects of thering’s structure that will likely pose the biggest challenge for the-oretical models or numerical simulations.
7.1. Average vertical warp
Edge-on observations at a variety of longitudes consistentlyshow that the E-ring’s peak brightness density shifts from�1000 km southwards of Saturn’s equator plane to �1000 kmnorthwards of Saturn’s equator plane between the orbits of Mimasand Tethys (see Figs. 3, 6 and 13). The simplest interpretation ofthis shape is that a significant fraction of the E-ring particles in thisregion are on eccentric, inclined orbits with arguments of pericen-ter (i.e. the angle between the orbit’s ascending node and the or-bit’s pericenter) x around �90�. For such orbits, the longitudesof their ascending nodes on Saturn’s equatorial plane X are roughly90� ahead of its longitude of pericenter -, so these particles are al-ways found south of Saturn’s equator plane near their orbital peri-centers and north of Saturn’s equatorial plane near their orbitalapocenters (see Fig. 13). Note that such a constraint on x doesnot necessarily require X or - to have any particular value. Indeed,since the warp is observed at various longitudes, the E-ring mustcontain particles with all possible orbital pericenter longitudesor, equivalently, ascending nodes (see also below).
Fig. 7. Mosaic of images obtained during the Rev 28 HIPHWAC sequence. Red, green and blue in this image correspond to images taken in the IR3, CLR and VIO filters,respectively, and a gamma correction has been applied to make regions of differing brightness easier to see. The E ring is the outermost diffuse ring in this image, while the Gring can be seen as a narrow feature between the diffuse E ring and the main ring system. Several camera artifacts can be seen in this image, including a horizontal lineassociated with image saturation, and diagonal bright streaks due to stray light from the planet. Nevertheless, certain asymmetries in the E ring can also be observed in thismosaic. The E ring is particularly bright where it passes near the planet because the ring is viewed at higher phase angles that highlight small particles. Also the left, orevening, E-ring ansa has a similar color just inside and outside the E-ring core, while the right, or morning ansa appears bluer interior to the E-ring core than it does furtherfrom the planet. This blue region also appears to have a relatively sharp inner edge outside the G ring, which is not apparent on the opposite ansa.
Fig. 8. A graphical illustration of two lines of constant phase (175� and 177�), overlaid on the VIO filter image mosaic shown in Fig. 7 (also gamma-stretched). The colors alongeach circle indicate the longitude of the observations relative to the Sun, using the same color codes as Figs. 9 and 10. Slight ripples in the two circles occur at the boundariesbetween images within the mosaic due to small variations in the viewing geometry over the course of the observation.
M.M. Hedman et al. / Icarus 217 (2012) 322–338 331

Author's personal copy
This distribution of orbital elements is not entirely unexpected.Numerical studies of eccentric circumplanetary orbits previouslydemonstrated that non-gravitational forces can cause x to becomelocked around ±90� (Horányi et al., 1990; Horányi et al., 1992;Hamilton, 1993a; Juhász and Horányi, 2004). Hamilton (1993a)provides analytical expressions that demonstrate how this lockingcan arise from the out-of-plane components of solar radiationpressure and the Lorentz forces from Saturn’s magnetic field andderives the appropriate governing equations. However, these newdata permit us to examine these processes in more detail thanwas previously possible and to test this theoretical model.
As mentioned above, there is no completely generic way totransform an onion-peeled brightness distribution in q and z intoa distribution in orbital elements. However, the presence of
detectable vertical offsets enables us to estimate the ‘‘typical’’ orbi-tal elements of the E-ring particles at various locations withinthe rings. Let us assume that most of the E-ring particles betweenthe orbits of Mimas and Tethys are on eccentric, inclined orbitswith x ’ ±90�, so the particles reach the extremes of their verticalmotions at pericenter and apocenter. Since dq/dt ’ dz/dt ’ 0 atthese locations, the time any particle spends in a small range ofq and z will be a local maximum at its orbital pericenter and apo-center. Particles with a given semi-major axis a, eccentricity e andinclination i will therefore make the strongest contributions to thering’s edge-on brightness density at the locations whereq = a(1 ± e) and z = ±q sin i (cf. Fig. 3 of Horányi et al. (1992)). Thissuggests that the onion-peeled brightness of the ring at a given qcan often be dominated by particles with pericenters or apocentersat the specified value of q, in which case the vertical profile at thatlocation would reflect the distribution of orbital inclinations ofthose particles. Of course particles spend a finite amount of time
Fig. 9. Radial brightness profile derived from images of the E ring obtained duringthe Rev 28 eclipse observations. All data come from a narrow range of phase angleswithin ±0.05� of 177�, and are color-coded by longitude relative to the Sun (seeFig. 8). The top panel shows data from VIO-filter (420 nm) images and the bottompanel shows data from IR3-filter (917 nm) images. Dotted lines in the profilesindicate regions of the profile corrupted by instrumental artifacts: narrow positivespikes are generated by stars or cosmic rays, while the narrow dips around160,000 km are likely due to a change in the instrument’s response along lines thatbecame saturated on the bright parts of Saturn’s limb, and the plateau around320,000 km is due to stray light from the planet. Note that in the VIO-filter imagesthe region between 190,000 and 250,000 km is systematically brighter on the sub-solar side (k � k� ’ 0�) of the rings.
Fig. 10. Radial brightness profiles derived from E-ring images obtained during theRev 28 eclipse observations. All data come from a narrow range of phase angleswithin ± 0.05� of 175�. The data points are color-coded by longitude relative to theSun (see Fig. 8). The top panel shows data from VIO-filter (420 nm) images and thebottom panel shows data from IR3-filter (917 nm) images. Dotted lines in theprofiles indicate regions corrupted by instrumental artifacts: positive spikes aregenerated by stars or cosmic rays, while the narrow dips around 210,000 km arelikely due to a change in the instrument’s response along lines that becamesaturated on bright parts of Saturn’s limb. Note the differences in the shape of theVIO-filter profiles on the morning (k � k� � 270�) and evening (k � k� � 90�) ansa.
332 M.M. Hedman et al. / Icarus 217 (2012) 322–338

Author's personal copy
between periapse and apoapse, so the observed vertical distribu-tion will be contaminated at some level by particles with periapsesless than q and apoapses greater than q. Nevertheless, even if weneglect these complications and assume that particles are onlyseen near their periapses and apoapses, we can still obtain
illuminating information regarding the trends and correlationsamong the orbital elements of the E-ring particles.
Let us define a mean ‘‘effective’’ inclination of the particles at agiven radial location q as simply tan ieff = jzoffj/q, where zoff is themeasured vertical offset at that location shown in Figs. 3 and 6.As shown in the left-hand panel of Fig. 14, this effective mean incli-nation increases on either side of Enceladus’ orbit, reachingroughly 0.2� around 200,000 km and 300,000 km. Given that Enc-eladus is the source of the E ring, we may assume that most ofthe particles observed outside 240,000 km are near apoapse andthose interior to 240,000 km are near periapse. Thus the data inte-rior to 240,000 km show how the inclination varies with periapsedistance, while the data exterior to 240,000 km show how theinclination varies with apoapse distance. Turning this around, wemay regard the two radial locations where the ring has the sameeffective mean inclination as indicating the ‘‘effective mean peri-center distance’’ aeff(1 � eeff) and ‘‘effective mean apocenter dis-tance’’ aeff(1 + eeff) of particles with those inclinations. These twonumbers then yield an effective semi-major axis aeff and effectiveeccentricity eeff of the particles with each effective inclination.These parameters are plotted in the right-hand panels of Fig. 14.Note that for these calculations we take the pericenter distancesfrom observations of one ansa and the apocenter distances froma separate observation of the opposite ansa. While there may besome slight differences in the trends derived from opposite ringansa, they are fairly subtle and will not be considered further here.
Despite their crudity, the above calculations reveal interestingcorrelations among the various orbital elements. The effective
Fig. 11. A mosaic of images obtained during the Rev 028 SHADBOUND sequence. These images trace out the arc of Saturn’s shadow on Saturn’s equatorial plane (indicated bythe dark dashed line in the right-hand plot) and have been re-projected onto a regular grid of radii and longitudes relative to the Sun. The saturated ends of the mosaiccorrespond to the edge of the A ring, and the G-ring can be seen outside the shadow around 167,500 km. Note that the brightness contrast across the shadow edge is muchmore prominent along the evening edge of the shadow than it is on the morning side (the G ring also appears somewhat brighter along the evening side, but this is largely anartifact of the background levels, see Fig. 12). In the right-hand mosaic, the dashed line indicates the position of Saturn’s shadow in the planet’s equatorial plane, while thetwo dotted lines mark the apparent positions of Saturn’s shadow in planes at z = +2000 km (lower curve) and z = �2000 km (upper curve).
Fig. 12. Profiles of the ring brightness versus ring-plane radius along the two edgesof the shadow. Each profile is a plot of the brightness difference between regions0.2� and 0.4� on either side of the predicted shadow position, which eliminatesinstrumental backgrounds. Each plotted brightness value is an average of multiplemeasurements derived from individual rows or columns of the relevant images(whether rows or columns are used depends on which is more perpendicular to theshadow edge). These individual brightness measurements are median filtered priorto averaging to remove contamination from stars and cosmic rays. The peak at167,000 km in both profiles is due to the G ring. The brightness level exterior to theG ring is systematically higher on the evening side of the shadow, consistent withFig. 11.(For interpretation to colours in this figure, the reader is referred to the webversion of this paper.)
Fig. 13. Sketch of the E-ring’s vertical structure. The grey bands on either side of Saturn illustrate the symmetric warp and asymmetric flare of the ring, while the ellipsesindicate representative orbits with arguments of pericenter near �90� (see Section 7.1). Note the planet and rings are not shown to scale.
M.M. Hedman et al. / Icarus 217 (2012) 322–338 333

Author's personal copy
inclination and effective eccentricity are strongly correlated, whichis perfectly sensible given that vertical forces are more efficient attilting eccentric orbits due to the differences in the torque appliedat periapse and apoapse (see below). In addition, the effectivesemi-major axes are all between 0 and �10,000 km exterior Enc-eladus’ orbit. This is reasonable as Enceladus is the E-ring’s primarysource, and small grains launched from that moon are expected tohave semi-major axes that are nearby but somewhat exterior tothe moon’s semi-major axis due to the charging of the grains uponexposure to the magnetosphere (Schaffer and Burns, 1987). Fur-thermore, the forces that perturb semi-major axes (like plasmadrag and electromagnetic forces associated with Saturn’s shadow)tend to cause the semi-major axis to slowly migrate outwards(Horányi and Burns, 1991; Burns et al., 2001; Horányi et al.,2008; Hamilton and Krüger, 2008).
To further evaluate these trends and correlations, we may com-pare the observed relationship between eeff and ieff with that ex-pected due to the action of various vertical forces. Hamilton(1993a) derived Gauss perturbation equations for E-ring particlesmoving under the influence of Saturn’s oblateness, solar radiationpressure and Lorentz forces from Saturn’s offset dipolar magneticfield, but ignoring asymmetric terms associated with Saturn’s sha-dow, etc. If the particle’s orbit has a sufficiently slowly varyingeccentricity e, the equations of motion have a solution where theargument of pericenter x and inclination i are (Eq. (33) of Hamil-ton (1993a)):
sin xeq ¼ signð _xxy=ZÞ; ð9Þsin ieq ¼ jZ= _xxyj; ð10Þ
where sign(x) = x/jxj, _xxy is the precession rate for the argument ofperiapse and Z is a rate determined by the out-of-plane forces actingon the particle. Assuming small inclinations and making a small for-matting change from Eqs. (31) and (32) of Hamilton (1993a), theserates are:
_xxy¼n3J2R2
p
a2ð1�e2Þ2� L
ð1�e2Þ3=2 1�e2�3nXp
� �það1�e2Þ1=2
necos/�
" #;
ð11Þ
Z ¼ ne
ð1� e2Þ1=2
an
sin B� þ3L
2ð1� e2Þ2g2;0
g1;0
!Rp
a
� �nXp
� �" #; ð12Þ
where Rp = 60,330 km is the planet’s radius, Xp � 1.7 � 10�4/s is theplanet’s rotation rate, J2 � 0.017 is Saturn’s quadrupole gravitational
harmonic (Jacobson et al., 2006), g1,0 � 21.2 lT and g2,0 ’ 1.5 lT arethe dipole and aligned quadrupole Gauss coeffcients of Saturn’smagnetic field (Gombosi et al., 2009), a is the particle’s orbitalsemi-major axis, n is the particle’s orbital mean motion, /� is theangle between the particle’s orbital pericenter and the sub-solarlongitude, B� is the solar elevation angle, and a/n and L are unitlessforce ratios. The ratio a/n is set by the ratio of solar radiation pres-sure to the planet’s gravity, and is:
an¼ b
3M�a2
2Mpa2p; ð13Þ
where M� = 2 � 1030 kg is the Sun’s mass, Mp = 5.7 � 1026 kg is Sat-urn’s mass, ap � 1.5 � 109 km is the planet’s heliocentric orbitalsemi-major axis, and b is the ratio of the solar radiation force tothe solar gravitational force acting on the particle, which dependson the particle’s physical and optical properties (Burns et al.,1979). The parameter L is a measure of the strength of the electro-magnetic force relative to the planet’s gravity and is given by (mod-ified to mks units and corrected to fix a typographical error from Eq.(22) in Hamilton (1993a), see Hamilton, 1993b):
L ¼qg
mg
g1;0R3pXp
GMp; ð14Þ
where qg and mg are the grain’s charge and mass. The charge-to-mass ratio can be expressed as 3�oU/qgs2, where �0 is the permittiv-ity of free space, U is grain’s electrostatic potential, qg is the grain’smass density, and s is the grain radius.
In order to evaluate Z and _xxy numerically, we will assume thatthe particles have semi-major axes close to Enceladus’(a ’ 240,000 km and n ’ 5.2 � 10�5/s) and have moderate eccen-tricities (e < 0.25), consistent with the trends seen in Fig. 14. In thiscase, we may approximate terms like 1 � e2 as simply unity. We alsoassume B� ’ �17�, which is the average solar ring opening angleduring these observations. Also, as discussed in Section 2, theparticles that dominate the observed E-ring brightness in the Cassiniimages should be of order 1 lm in radius. Furthermore, variousobservations indicate that E-ring particles are composed primarilyof water–ice and that the largest particles are charged toroughly �2 V (Kempf et al., 2006; Hillier et al., 2007; Postberget al., 2008; Hedman et al., 2009). Hence the parameter b � 1 (Burnset al., 1979) and we may express the charge-to-mass ratio qg/mg � �0.05 C/kg (U/�2 V)/(s/1 lm)2 (assuming qg = 1 g/cm3, whichmay be an overestimate if the grains have an aggregate or porousstructure). Thus the unitless parameters are a/n ’ 1.3 � 10�4b andL ’ �9.6 � 10�4 (U/�2 V)/(s/1 lm)2 and:
Fig. 14. Effective orbital parameters derived from edge-on images of the E ring. Plus signs come from the E105PHASE observations (see Fig. 6), while the diamonds come fromthe E130MAP sequence (see Fig. 3). The left-hand panel shows the effective mean inclination of the ring particles as a function of radius in the ring. Assuming that regionswith similar effective inclination inward and outward of Enceladus correspond to particles on similar orbits at periapse and apoapse, we compute the effective semi-majoraxis and effective eccentricity of particles as a function of inclination, shown in the right two panels. (In each case the periapse data from one ansa are matched to the apoapsedata on the opposite ansa.) The dotted and solid lines in the rightmost plots show two different linear fits to all the data (sin ieff = 0.0208eeff and sin ieff = 0.0243eeff � 0.0002,respectively). (For interpretation to colours in this figure, the reader is referred to the web version of this paper.)
334 M.M. Hedman et al. / Icarus 217 (2012) 322–338
Author's personal copy
_xxy¼n 0:0032þ0:00005U=ð�2 VÞðs=1lmÞ2
1� e2
0:05
� �þ0:00013b
cos/�e
" #;
ð15Þ
Z ¼ �ne 3:9 � 10�5bþ 0:8� 10�5 U=ð�2 VÞðs=1 lmÞ2
" #: ð16Þ
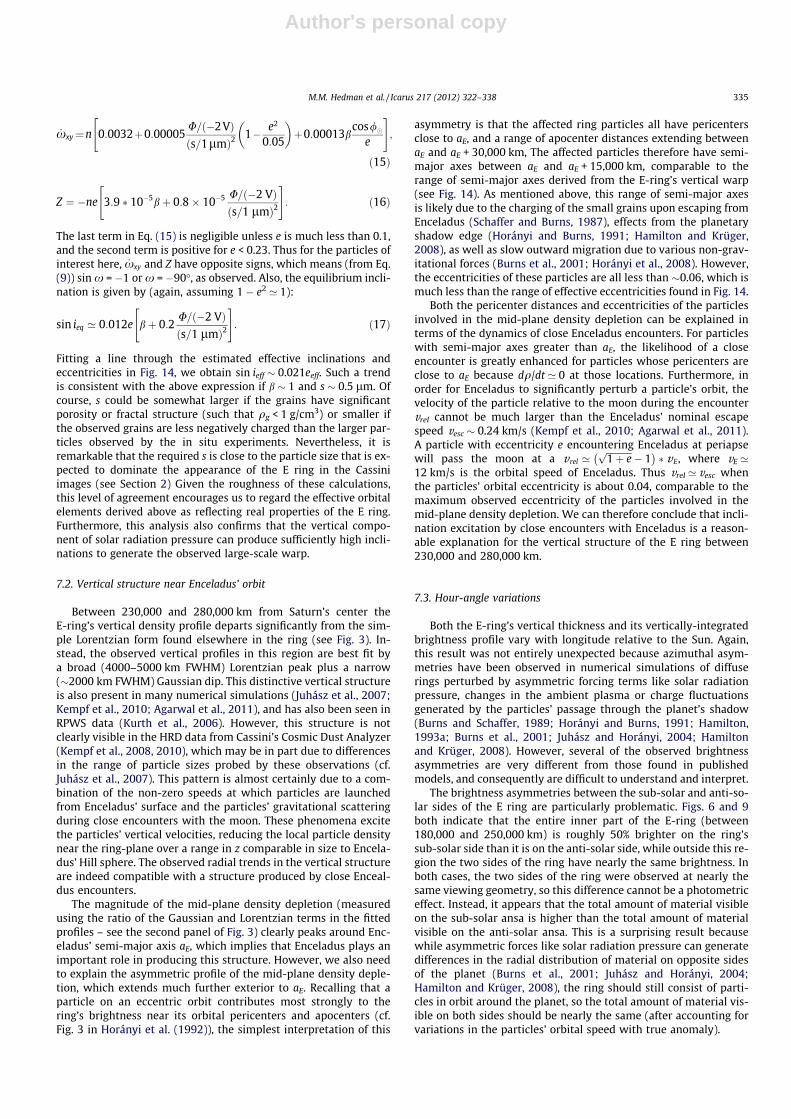
The last term in Eq. (15) is negligible unless e is much less than 0.1,and the second term is positive for e < 0.23. Thus for the particles ofinterest here, _xxy and Z have opposite signs, which means (from Eq.(9)) sin x = �1 or x = �90�, as observed. Also, the equilibrium incli-nation is given by (again, assuming 1 � e2 ’ 1):
sin ieq ’ 0:012e bþ 0:2U=ð�2 VÞðs=1 lmÞ2
" #: ð17Þ
Fitting a line through the estimated effective inclinations andeccentricities in Fig. 14, we obtain sin ieff � 0.021eeff. Such a trendis consistent with the above expression if b � 1 and s � 0.5 lm. Ofcourse, s could be somewhat larger if the grains have significantporosity or fractal structure (such that qg < 1 g/cm3) or smaller ifthe observed grains are less negatively charged than the larger par-ticles observed by the in situ experiments. Nevertheless, it isremarkable that the required s is close to the particle size that is ex-pected to dominate the appearance of the E ring in the Cassiniimages (see Section 2) Given the roughness of these calculations,this level of agreement encourages us to regard the effective orbitalelements derived above as reflecting real properties of the E ring.Furthermore, this analysis also confirms that the vertical compo-nent of solar radiation pressure can produce sufficiently high incli-nations to generate the observed large-scale warp.
7.2. Vertical structure near Enceladus’ orbit
Between 230,000 and 280,000 km from Saturn’s center theE-ring’s vertical density profile departs significantly from the sim-ple Lorentzian form found elsewhere in the ring (see Fig. 3). In-stead, the observed vertical profiles in this region are best fit bya broad (4000–5000 km FWHM) Lorentzian peak plus a narrow(�2000 km FWHM) Gaussian dip. This distinctive vertical structureis also present in many numerical simulations (Juhász et al., 2007;Kempf et al., 2010; Agarwal et al., 2011), and has also been seen inRPWS data (Kurth et al., 2006). However, this structure is notclearly visible in the HRD data from Cassini’s Cosmic Dust Analyzer(Kempf et al., 2008, 2010), which may be in part due to differencesin the range of particle sizes probed by these observations (cf.Juhász et al., 2007). This pattern is almost certainly due to a com-bination of the non-zero speeds at which particles are launchedfrom Enceladus’ surface and the particles’ gravitational scatteringduring close encounters with the moon. These phenomena excitethe particles’ vertical velocities, reducing the local particle densitynear the ring-plane over a range in z comparable in size to Encela-dus’ Hill sphere. The observed radial trends in the vertical structureare indeed compatible with a structure produced by close Enceal-dus encounters.
The magnitude of the mid-plane density depletion (measuredusing the ratio of the Gaussian and Lorentzian terms in the fittedprofiles – see the second panel of Fig. 3) clearly peaks around Enc-eladus’ semi-major axis aE, which implies that Enceladus plays animportant role in producing this structure. However, we also needto explain the asymmetric profile of the mid-plane density deple-tion, which extends much further exterior to aE. Recalling that aparticle on an eccentric orbit contributes most strongly to thering’s brightness near its orbital pericenters and apocenters (cf.Fig. 3 in Horányi et al. (1992)), the simplest interpretation of this
asymmetry is that the affected ring particles all have pericentersclose to aE, and a range of apocenter distances extending betweenaE and aE + 30,000 km, The affected particles therefore have semi-major axes between aE and aE + 15,000 km, comparable to therange of semi-major axes derived from the E-ring’s vertical warp(see Fig. 14). As mentioned above, this range of semi-major axesis likely due to the charging of the small grains upon escaping fromEnceladus (Schaffer and Burns, 1987), effects from the planetaryshadow edge (Horányi and Burns, 1991; Hamilton and Krüger,2008), as well as slow outward migration due to various non-grav-itational forces (Burns et al., 2001; Horányi et al., 2008). However,the eccentricities of these particles are all less than �0.06, which ismuch less than the range of effective eccentricities found in Fig. 14.
Both the pericenter distances and eccentricities of the particlesinvolved in the mid-plane density depletion can be explained interms of the dynamics of close Enceladus encounters. For particleswith semi-major axes greater than aE, the likelihood of a closeencounter is greatly enhanced for particles whose pericenters areclose to aE because dq/dt ’ 0 at those locations. Furthermore, inorder for Enceladus to significantly perturb a particle’s orbit, thevelocity of the particle relative to the moon during the encountervrel cannot be much larger than the Enceladus’ nominal escapespeed vesc � 0.24 km/s (Kempf et al., 2010; Agarwal et al., 2011).A particle with eccentricity e encountering Enceladus at periapsewill pass the moon at a vrel ’
ffiffiffiffiffiffiffiffiffiffiffi1þ ep
� 1� �
� vE, where vE ’12 km/s is the orbital speed of Enceladus. Thus vrel ’ vesc whenthe particles’ orbital eccentricity is about 0.04, comparable to themaximum observed eccentricity of the particles involved in themid-plane density depletion. We can therefore conclude that incli-nation excitation by close encounters with Enceladus is a reason-able explanation for the vertical structure of the E ring between230,000 and 280,000 km.
7.3. Hour-angle variations
Both the E-ring’s vertical thickness and its vertically-integratedbrightness profile vary with longitude relative to the Sun. Again,this result was not entirely unexpected because azimuthal asym-metries have been observed in numerical simulations of diffuserings perturbed by asymmetric forcing terms like solar radiationpressure, changes in the ambient plasma or charge fluctuationsgenerated by the particles’ passage through the planet’s shadow(Burns and Schaffer, 1989; Horányi and Burns, 1991; Hamilton,1993a; Burns et al., 2001; Juhász and Horányi, 2004; Hamiltonand Krüger, 2008). However, several of the observed brightnessasymmetries are very different from those found in publishedmodels, and consequently are difficult to understand and interpret.
The brightness asymmetries between the sub-solar and anti-so-lar sides of the E ring are particularly problematic. Figs. 6 and 9both indicate that the entire inner part of the E-ring (between180,000 and 250,000 km) is roughly 50% brighter on the ring’ssub-solar side than it is on the anti-solar side, while outside this re-gion the two sides of the ring have nearly the same brightness. Inboth cases, the two sides of the ring were observed at nearly thesame viewing geometry, so this difference cannot be a photometriceffect. Instead, it appears that the total amount of material visibleon the sub-solar ansa is higher than the total amount of materialvisible on the anti-solar ansa. This is a surprising result becausewhile asymmetric forces like solar radiation pressure can generatedifferences in the radial distribution of material on opposite sidesof the planet (Burns et al., 2001; Juhász and Horányi, 2004;Hamilton and Krüger, 2008), the ring should still consist of parti-cles in orbit around the planet, so the total amount of material vis-ible on both sides should be nearly the same (after accounting forvariations in the particles’ orbital speed with true anomaly).
M.M. Hedman et al. / Icarus 217 (2012) 322–338 335

Author's personal copy
This asymmetry becomes even more puzzling if we also takethe ring’s vertical warp into account. The above analysis of thiswarp indicates that most of the E-ring particles observed between180,000 and 300,000 km have semi-major axes close toaE = 240,000 km. If this is correct, then the excess brightness be-tween 180,000 and 240,000 km on the sunward ansa would beassociated with particles near their orbital periapses. However,these same particles would be near their apoapses on the anti-solarside of the planet, so we would expect the anti-solar ansa to bebrighter than the sub-solar ansa between 240,000 and300,000 km, which is not the case (the brightness profiles are actu-ally nearly identical exterior to 250,000 km). The relevant particlesalso probably cannot be hidden within Saturn’s shadow or in a re-gion far beyond 300,000 km, because this would produce system-atic differences in the mean vertical offset profiles between thetwo ansa that are incompatible with the observations. If the parti-cles responsible for the brightness excess had apoapses much lessthan 250,000 km or much greater than 300,000 km, then theywould have significantly different semi-major axes and eccentrici-ties from the particles with periapses on the ring’s shadowed side.This would in turn alter the inclinations induced by the out-of-plane forces (see Section 7.1), yielding a different southward verti-cal offset on the sub-solar ansa than the anti-solar ansa, which isnot observed (see Fig. 6). Thus reconciling these observations willpose a significant challenge to any theoretical and numerical mod-els of the E ring.
In the absence of an obvious simple model for the E-ring’s en-hanced brightness near the sub-solar longitude, we will simplysuggest some possible explanations that are worthy of futureexploration. The most straightforward option is that there is somenon-trivial correlation between particles’ eccentricities and peri-centers that crowd streamline trajectories between 180,000 and250,000 km on the sunward side of the rings, and disperse the rel-evant material over a wide radius range at other longitudes, mak-ing the brightness excess at anti-solar longitudes difficult todetect. We could also consider more exotic scenarios, such ashour-angle variations in the individual ring particles’ light-scatter-ing properties, or the particles not following the expected Keple-rian orbits due to some interaction with the magnetosphericplasma.
The remaining hour-angle asymmetries in the ring are less par-adoxical. For example, unlike the sub-solar/anti-solar asymmetriesdiscussed above, the differences between the morning and eveningsides of the ring seen in VIO-filter data (see Fig. 10) probably can beattributed to differences in the eccentricity distributions of parti-cles with pericenters on the morning and evening sides of the pla-net. Assuming that the brightness at a given radius is dominated byparticles near their orbital pericenters or apocenters, then theshape of the brightness profile interior to Encealdus should reflectthe eccentricity distribution of particles with longitudes of pericen-ter - near the observed longitude. The morning ansa’s profile isbrighter that the evening ansa between 200,000 and 240,000 km(Fig. 10), and fainter interior to 200,000 km (Fig. 12). Thus theparticles with - ’ k� � 90� would appear to have an excess oflow-eccentricity orbits and a depletion of high-eccentricity orbitscompared to the particles with - ’ k� + 90�. Support for thisinterpretation of the data can be obtained by examining the bright-ness profiles exterior to Enceladus’ orbit, where the relevant parti-cles should reach their apoapses. In particular, the material thatcauses the morning ansa to appear brighter between 210,000 and240,000 km should also cause the evening side of the rings to ap-pear brighter between 250,000 km and 280,000 km, and such abrightness excess may be present in the dark blue VIO-filter profileof Fig. 10.
The position of the sharp edge in the morning ansa’s brightnesslies around 200,000 km, near the location of the tip of Saturn’s
shadow in the z = 0 plane (see Figs. 7 and 11). Thus the ring’sbrightness profile on the morning side of the planet and the lackof material on the morning edge of the planet’s shadow could indi-cate that the particles with sufficiently high eccentricities to enterthe shadow near periapse had their eccentricities reduced andtheir periapses raised until their orbits no longer intercepted theshadow. If we also consider the relevant orbital precession rates,such a scenario can even explain why the particles with periapseson the two sides of the ring have different eccentricitydistributions.
If we neglect the effects of solar radiation pressure, then usingEqs. (30) and (31) of Hamilton (1993a) we can estimate the apsidalprecession rate of the E-ring particles as:
_-x ¼ n3J2R2
P
2a2ð1� e2Þ2þ 2nL
Xpð1� e2Þ3=2
" #ð18Þ
(Note this expression differs from that given in Eq. (11) because itgives the precession rate of the pericenter longitude relative to aninertial direction instead of relative to the ascending node.) Thisequation is evaluated using the same parameters as discussed inSection 7.1 to yield:
_-x ¼ 0:42�=day 1� 0:39U=ð�2 VÞðs=1 lmÞ2
" #: ð19Þ
For these nominal values _-x > 0 and it takes about 4 years for theparticle’s pericenter to drift all the way around the planet (in con-trast to the simulations of Hamilton, 1993a, which assumed a largernominal charge-to-mass ratio, so _-x < 0). Thus particles with peri-centers on the morning ansa had their periapses aligned with Sat-urn’s shadow less than a year ago, while the particles withperiapses on the evening ansa last had their pericenters alignedwith Saturn’s shadow over 3 years ago. The difference in timing be-tween these ‘‘periapse shadow passages’’ is significant, because dur-ing the few years before these observations, the tip of Saturn’sshadow has been gradually moving outward into the E ring. Thetip of Saturn’s shadow only reached into the E ring between 2005and 2006, so E-ring particles with - � k� � 90� could have encoun-tered Saturn’s shadow during their last periapse shadow passage,while E-ring particles with - � k� + 90� would not have been ableto encounter the shadow during their last periapse shadow passage.Hence, only particles with periapses on the morning side of therings would be likely to have their orbits altered by passage throughSaturn’s shadow, supporting the above notion that such shadowpassages could have raised the relevant particle’s orbitalpericenters.
While these calculations are suggestive, it is important to notethat the precession rate is sensitive to particle size, and thepericenter will regress instead of precess if s < 0.7 lm. Such parti-cle-size-dependent variations in the precession rate can haveimportant effects on the spatial distribution of E-ring particles(Hamilton and Burns, 1994; Horányi et al., 2008). Even thoughexploring these phenomena in detail is beyond the scope of thispaper, we can at least point out that the particles cannot be toosmall if the precession rate is to be sufficiently large and positivefor shadow-induced perturbation to be a plausible explanationfor the morning–evening asymmetries. At the same time, the par-ticles cannot be too large or else the expected non-gravitationalforces would not be able to produce the observed large-scale warpin the ring (see above). Fortunately, the cameras are most sensitiveto particles in the 0.5–1.0 lm size range, which is roughly compat-ible with both these constraints. This bodes well for future effortsto model these features, but it does suggest that there may only bea rather restricted range of particle parameters that will be consis-tent with all the observed E-ring structures.
336 M.M. Hedman et al. / Icarus 217 (2012) 322–338

Author's personal copy
Another asymmetry that may be associated with Saturn’s sha-dow is the difference in the E-ring’s vertical thickness betweenthe sub-solar and anti-solar sides of the planet. As shown in Figs. 6and 13, the ring is thicker on the anti-solar side of the rings at radiiinterior to aE, and is thicker on the sub-solar side at larger radii.This suggests that particles with periapses on the planet’s shad-owed side have a broader range of inclinations than those withperiapses on the planet’s sunward side. So long as j _-xj is less thanabout 0.5�/day, particles with periapses on the sunward side of theplanet in 2006 would not have encountered the shadow duringtheir previous periapse shadow passage, while the particles withperiapses on the anti-solar side of the planet would have enteredthe shadow. Thus only the latter particles are likely to experienceshadow-induced perturbations, which may have excited inclina-tions and produced a thicker ring.
Despite the above evidence for the shadow’s role in generatingthese asymmetries, the precise physical processes involved remainunclear and require further examination. For example, the ring’sbrightness profile on the morning side of the planet and the lackof material on the morning edge of the planet’s shadow both sug-gest that particles with sufficiently high eccentricities to enter theshadow near periapse had their eccentricities reduced and theirperiapses raised until their orbits no longer intercepted the shadow.However, published theoretical studies of the orbital perturbationsinduced by a planet’s shadow have focused on the reduction in solarradiation pressure and the Lorentz forces associated with chargevariations (Horányi and Burns, 1991; Juhász and Horányi, 2004;Hamilton and Krüger, 2008), both of which are primarily radial per-turbations that cannot efficiently reduce orbital eccentricities whenapplied near periapse (Burns, 1976). Thus more complex interac-tions between the ring particles and the plasma environment inthe vicinity of Saturn’s shadow may need to be considered. Indeed,recent plasma measurements within the core of the E ring may im-ply that dusty plasma phenomena could be relevant to the chargestate of the E-ring particles (Wahlund et al., 2009).
The above discussions demonstrate that more work needs to bedone to identify the forces responsible for the observed hour-angleasymmetries in the E ring. However, a fully self-consistent modelof the ring will not only have to reproduce the observed asymme-tries, but also explain why the expected asymmetries from well-studied non-gravitational perturbations such as solar radiationpressure are not obvious in the observed data. For example, includ-ing solar radiation pressure introduces an asymmetry into theequations of motion that prevents particles’ orbits from maintain-ing a fixed eccentricity as they precess around the planet. Instead,there is a specific solution with a finite ‘‘forced eccentricity’’ ef thatmaintains a fixed orientation with respect to the Sun, and in gen-eral the particles’ orbits oscillate around this steady-state solution(Hedman et al., 2010). Using Eqs. (27), (31) and (32) in Hamilton(1993a) and again approximating 1 � e2 as unity (see above), wecan derive the eccentricity ef and longitude of pericenter -f of thissteady-state solution:
cosð-f � k�Þ ¼ �signð _-xÞ ð20Þ
and
ef ¼a_-x
; ð21Þ
where a and -x are given by Eqs. (13) and (19), respectively. As be-fore, inserting the numerical values for the relevant parametersused in Section 7.1, we find that the forced eccentricity is:
ef ¼ 0:081b 1� 0:39U=ð�2 VÞðs=1 lmÞ2
�1
: ð22Þ
Regardless of the sign of _-x, such a large ef means that the variousparticles’ orbits will have either pericenters that remain on one sideof the planet or substantially different eccentricities when the peri-centers are on the sub-solar and anti-solar sides of the ring. Anymodel for the brightness asymmetries between the sub-solar andanti-solar sides of the rings will therefore have to account for thisforced eccentricity.
8. Summary and conclusions
Images obtained in 2005–2006 have both confirmed the exis-tence of previously detected E-ring structures, and have also re-vealed several new features. The E-ring structural propertiesfound in this analysis include:
� The vertical particle density profile of the ring at radii greaterthan 280,000 km and less than 230,000 km can be best fit bya Lorentzian function.� Between 230,000 and 280,000 km, there is a localized depletion
in brightness density relative to the best-fit Lorentzian profilewithin �1000 km of Saturn’s equator plane.� The ring’s peak brightness density shifts from roughly 1000 km
south of Saturn’s equator plane to roughly 1000 km north ofSaturn’s equator plane between the orbits of Mimas and Tethys.� The ring’s vertical width increases with distance from Encela-
dus’ semi-major axis.� The ring’s overall brightness and vertical structure do not vary
significantly with longitude relative to Enceladus.� The ring’s vertical thickness varies with longitude relative to the
Sun, being thicker on the anti-solar side of the planet interior toEnceladus’ semi-major axis and thicker on the sub-solar sidefurther from Saturn.� The mean vertical offsets in the ring’s peak brightness density
do not vary with longitude relative to the Sun.� The ring’s brightness profiles on the morning and evening sides
of the planet differ interior to Enceladus’ semi-major axis, withthe morning profile showing a sharp edge around 200,000 km.� The ring’s brightness profiles on the sub-solar and anti-solar
sides of the planet differ interior to Enceladus’ semi-major axis,with the sub-solar side being intrinsically brighter.
We have only just begun efforts to interpret these features interms of particle dynamics. The overall vertical warp can be rea-sonably attributed to the vertical components of solar radiationpressure and Lorentz forces from Saturn’s offset dipole field, andthe particle depletion close to the orbit of Enceladus is consistentwith gravitational perturbations from that moon. However, thevarious hour-angle asymmetries are still difficult to understand,so additional work will be needed in order to fully understandthe azimuthal structure of this ring.
Acknowledgments
We acknowledge the support of NASA, the Cassini project andthe Cassini Imaging Team. This work was supported by grants fromthe Cassini Data Analysis, Planetary Geology and Geophysics, andOuter Planets Research programs. We also thank two anonymousreviewers for their helpful comments on an earlier draft of thismanuscript.
References
Agarwal, M., Burns, J.A., Hedman, M.M., Tiscareno, M.S. 2011. The dynamics ofparticles in Saturn’s E ring near Enceadus’ orbit, in preparation.
Burns, J.A., 1976. Elementary derivation of the perturbation equations of celestialmechanics. Am. J. Phys. 44, 944–949.
M.M. Hedman et al. / Icarus 217 (2012) 322–338 337

Author's personal copy
Burns, J.A., Schaffer, L., 1989. Orbital evolution of circumplanetary dust by resonantcharge variations. Nature 337, 340–343.
Burns, J.A., Lamy, P.L., Soter, S., 1979. Radiation forces on small particles in the solarsystem. Icarus 40, 1–48.
Burns, J.A., Hamilton, D.P., Showalter, M.R., 2001. Dusty rings and circumplanetarydust: Observations and simple physics. In: Grün, E., Gustafson, B., Dermott, S.,Fecthig, H. (Eds.), Interplanetary Dust. Springer, pp. 641–725.
de Pater, I., Martin, S.C., Showalter, M.R., 2004. Keck near-infrared observations ofSaturn’s E and G rings during Earth’s ring plane crossing in August 1995. Icarus172, 446–454.
Gombosi, T.I. et al., 2009. Saturn’s magnetospheric configuration. In: Dougherty,M.K., Esposito, L.W., Krimigis, S.M. (Eds.), Saturn from Cassini-Huygens.Springer, Dordrecht Heidelberg, pp. 203–255.
Hamilton, D.P., 1993a. Motion of dust in a planetary magnetosphere – Orbit-averaged equations for oblateness, electromagnetic, and radiation forces withapplication to Saturn’s E ring. Icarus 101, 244–264.
Hamilton, D.P., 1993b. Erratum: Motion of dust in a planetary magnetosphere:Orbit-averaged equations for oblateness, electromagnetic, and radiation forceswith application to Saturn’s E-ring. Icarus 103, 161.
Hamilton, D.P., Burns, J.A., 1994. Origin of Saturn’s E ring: Self-sustained, naturally.Science 264, 550–553.
Hamilton, D.P., Krüger, H., 2008. The sculpting of Jupiter’s gossamer rings by itsshadow. Nature 453, 72–75.
Hedman, M.M. et al., 2009. Spectral observations of the Enceladus plume withCassini-VIMS. ApJ 693, 1749–1762.
Hedman, M.M., Burt, J.A., Burns, J.A., Tiscareno, M.S., 2010. The shape and dynamicsof a heliotropic dusty ringlet in the Cassini division. Icarus 210, 284–297.
Hillier, J.K. et al., 2007. The composition of Saturn’s E ring. Monthly Notices Roy.Astron. Soc. 377, 1588–1596.
Horányi, M., Burns, J.A., 1991. Charged dust dynamics – Orbital resonance due toplanetary shadows. J. Geophys. Res. 96, 19283–19289.
Horányi, M., Burns, J.A., Tatrallyay, M., Luhmann, J.G., 1990. Toward understandingthe fate of dust lost from the martian satellites. Geophys. Res. Lett. 17, 853–856.
Horányi, M., Burns, J.A., Hamilton, D.P., 1992. The dynamics of Saturn’s E ringparticles. Icarus 97, 248–259.
Horányi, M., Burns, J.A., Hedman, M.M., Jones, G.H., Kempf, S., 2009. Diffuse rings. In:Dougherty, M.K., Esposito, L.W., Krimigis, S.M. (Eds.), Saturn from Cassini-Huygens. Springer, London, pp. 511–536.
Horányi, M., Juhász, A., Morfill, G.E., 2008. Large-scale structure of Saturn’s E-ring.Geophys. Res. Lett. 35, 4203.
Ingersoll, A., Ewald, S., 2011. Total particulate mass in Enceladus plumes and massof Saturn’s E ring inferred from Cassini ISS images. Icarus 216, 492–506.
Jacobson, R.A. et al., 2006. The gravity field of the saturnian system from satelliteobservations and spacecraft tracking data. Astronom. J. 132, 2520–2526.
Jones, G.H. et al., 2009. Fine jet structure of electrically charged grains in Enceladus’plume. Geophys. Res. Lett. 36, L16204.
Juhász, A., Horányi, M., 2002. Saturn’s E ring: A dynamical approach. J. Geophys. Res.(Space Phys.) 107, 1066.
Juhász, A., Horányi, M., 2004. Seasonal variations in Saturn’s E-ring. Geophys. Res.Lett. 31, L19703.
Juhász, A., Horányi, M., Morfill, G.E., 2007. Signatures of Enceladus in Saturn’s E ring.Geophys. Res. Lett. 34, L09104.
Kempf, S., Beckmann, U., Srama, R., Horanyi, M., Auer, S., Grün, E., 2006. Theelectrostatic potential of E ring particles. Planet. Space Sci. 54, 999–1006.
Kempf, S., Beckmann, U., Moragas-Klostermeyer, G., Postberg, F., Srama, R.,Economou, T., Schmidt, J., Spahn, F., Grün, E., 2008. The E ring in the vicinityof Enceladus. I. Spatial distribution and properties of the ring particles. Icarus193, 420–437.
Kempf, S., Beckmann, U., Schmidt, J., 2010. How the Enceladus dust plume feedsSaturn’s E ring. Icarus 206, 446–457.
Kurth, W.S., Averkamp, T.F., Gurnett, D.A., Wang, Z., 2006. Cassini RPWSobservations of dust in Saturn’s E ring. Planet. Space Sci. 54, 988–998.
Nicholson, P.D. et al., 1996. Observations of Saturn’s ring-plane crossings in Augustand November 1995. Science 272, 509–515.
Porco, C.C. et al., 2004. Cassini imaging science: Instrument characteristics andanticipated scientific investigations at Saturn. Space Sci. Rev. 115, 363–497.
Postberg, F., Kempf, S., Hillier, J.K., Srama, R., Green, S.F., McBride, N., Grün, E., 2008.The E-ring in the vicinity of Enceladus. II. Probing the moon’s interior – Thecomposition of E-ring particles. Icarus 193, 438–454.
Roddier, C., Roddier, F., Graves, J.E., Northcott, M.J., 1998. Discovery of an arc ofparticles near Enceladus’ orbit: A possible key to the origin of the E ring. Icarus136, 50–59.
Schaffer, L., Burns, J.A., 1987. The dynamics of weakly charged dust – Motionthrough Jupiter’s gravitational and magnetic fields. J. Geophys. Res. 92, 2264–2280.
Schenk, P., Hamilton, D.P., Johnson, R.E., McKinnon, W.B., Paranicas, C., Schmidt, J.,Showalter, M.R., 2001. Plasma, plumes, and rings: Saturn system dynamics asrecorded in global color patterns on its midsize icy satellites. Icarus 211, 740–757.
Shafiq, M., Wahlund, J.-E., Morooka, M.W., Kurth, W.S., Farrell, W.M., 2011.Characteristics of the dust–plasma interaction near Enceladus’ South Pole.Planet. Space Sci. 59, 17–25.
Showalter, M.R., 1985. Jupiter’s Ring System Resolved: Physical Properties Inferredfrom the Voyager Images. Ph. D. thesis. Cornell Univ., Ithaca, NY.
Showalter, M.R., Burns, J.A., Cuzzi, J.N., Pollack, J.B., 1987. Jupiter’s ring system –New results on structure and particle properties. Icarus 69, 458–498.
Showalter, M.R., Cuzzi, J.N., Larson, S.M., 1991. Structure and particle properties ofSaturn’s E ring. Icarus 94, 451–473.
Spencer, J.R. et al., 2009. Enceladus: An active cryovolcanic satellite. In: Dougherty,M.K., Esposito, L.W., Krimigis, S.M. (Eds.), Saturn from Cassini-Huygens.Springer, New York, pp. 683–724.
Srama, R. et al., 2006. In situ dust measurements in the inner saturnian system.Planet. Space Sci. 54, 967–987.
van de Hulst, H.C., 1957. Light Scattering by Small Particles. John Wiley & Sons, NewYork.
Verbiscer, A.R., French, M., Showalter, P., 2007. Helfenstein Enceladus: Cosmicgraffiti artist caught in the act. Science 315, 815.
Wahlund, J.-E. et al., 2009. Detection of dusty plasma near the E-ring of Saturn.Planet. Space Sci. 57, 1795–1806.
West, R. et al., 2010. In-flight calibration of the Cassini imaging science sub-systemcameras. Planet. Space Sci. 58, 1475–1488.
Yaroshenko, V.V. et al., 2009. Characteristics of charged dust inferred from theCassini RPWS measurements in the vicinity of Enceladus. Planet. Space Sci. 57,1807–1812.
338 M.M. Hedman et al. / Icarus 217 (2012) 322–338