Basic Differences (KA C90ABGT and KA 200_B200_B200GT) Handout_R0.0

Singapore
Australia
United Kingdom
FY18/19 Financial ResultsPresentation
29 April 2019

Disclaimers
▪ This material shall be read in conjunction with Ascendas Reit’s financial statements for the financial yearended 31 March 2019.
▪ This presentation may contain forward-looking statements that involve assumptions, risks and uncertainties.Actual future performance, outcomes and results may differ materially from those expressed in forward-lookingstatements as a result of a number of risks, uncertainties and assumptions. Representative examples of thesefactors include (without limitation) general industry and economic conditions, interest rate trends, cost of capitaland capital availability, competition from similar developments, shifts in expected levels of property rentalincome and occupancy, changes in operating expenses, including employee wages, benefits and training,property expenses and governmental and public policy changes and the continued availability of financing in theamounts and the terms necessary to support Ascendas Reit's future business. Investors are cautioned not toplace undue reliance on these forward-looking statements, which are based on the Manager’s current view onfuture events.
▪ The value of Units in Ascendas Reit (“Units”) and the income derived from them, if any, may fall as well as rise.Units are not obligations of, deposits in, or guaranteed by, the Manager or any of its affiliates. An investment inUnits is subject to investment risks, including the possible loss of the principal amount invested. Investorsshould note that they will have no right to request the Manager to redeem or purchase their Units for so long asthe Units are listed on the SGX-ST. It is intended that unitholders of Ascendas Reit may only deal in their Unitsthrough trading on the SGX-ST. Listing of the Units on the SGX-ST does not guarantee a liquid market for theUnits. The past performance of Ascendas Reit is not necessarily indicative of the future performance ofAscendas Reit.
▪ Any discrepancies between the figures in the tables and charts and the listed amounts and totals thereof aredue to rounding.
2

Agenda
3
Key Highlights for FY18/19 4
Financial Performance 7
Investment Management 11
Capital Management 14
Asset Management 21
Portfolio Resilience 40
Market Outlook 45

Key Highlights for FY18/19
4

Key Highlights for FY18/19
▪ Gross revenue rose 2.8% y-o-y to S$886.2 m. Key drivers were:
• Newly acquired properties in the United Kingdom and Australia
• Redevelopment of 20 Tuas Avenue 1 and Schneider Electric Building in Singapore
• Partially offset by non-renewals and downsizing by tenants in certain Singapore properties during the year
5
Gross Revenue
+2.8% y-o-y
▪ Total amount available for distribution rose 3.8% y-o-y to S$485.7 m, in tandem with the increase in net property income and due to the higher rollover adjustments in FY18/19
▪ Net property income increased 3.2% to S$649.6 m, underpinned by growth in gross revenue and net property tax savings
▪ Distribution per Unit (DPU) improved 0.3% y-o-y to 16.035 cents taking into account an enlarged number of Units in issue
Net Property Income
+3.2% y-o-y
Total Amount Available for Distribution
+3.8% y-o-y
DPU+0.3% y-o-y

Key Highlights for FY18/19
6
▪ Investment properties under management grew 10.1% to S$11.1 b
• Acquired S$948.0 m worth of properties in the United Kingdom and Australia
• Completed S$97.9 m of redevelopment and asset enhancement projects in Singapore
• Divested S$37.6 m worth of properties in Singapore
▪ Achieved average positive rental reversion of 3.7% for leases in multi-tenant buildings renewed during the financial year
▪ Portfolio occupancy rate increased to 91.9%
▪ Maintained A3 credit rating
▪ Healthy aggregate leverage at 36.3%
▪ Average interest cost maintained at 3.0%
▪ Maintained high level of natural hedge for overseas investments
Investment Highlights
Operational Highlights
Annual Property Revaluation
Proactive Capital
Management
▪ Same-store valuation of 129 properties @ 31 Mar 2019 improved to S$10.22 b(vs. S$10.11 b @ 31 Mar 2018)
▪ Singapore’s capitalisation rate was firm at 6.18%▪ Australia’s capitalisation rate compressed to 6.08%

Financial Performance
7

8
FY18/19 vs FY17/18
(S$’m) FY18/19 FY17/18 Variance
Gross
revenue 886.2 862.1 +2.8%
• Mainly attributable to:• United Kingdom logistics portfolios acquired in Aug 2018 and Oct 2018,• Australian properties, 108 & 100 Wickham Street, 169-177 Australis Drive
and Cargo Business Park acquired in Dec 2017, Sep 2017, Jun 2018 andAug 2018 respectively,
• Contributions from redeveloped Singapore properties, Schneider ElectricBuilding and 20 Tuas Avenue 1 completed in Jun 2017 and Apr 2018respectively,
• Partially offset by non-renewals and downsizing by tenants at certainproperties in Singapore.
Net property Income (NPI)
649.6 629.4 +3.2%
• Property operating expenses increased mainly due to new acquisitions andhigher operating expense incurred in relation to the deployment of the newoperation command center supporting multiple buildings in Singapore;partially offset by net property tax savings mainly due to the retrospectivedownward revisions in the annual value of certain properties in FY18/19.
• NPI growth is underpinned by the increase in gross revenue.
Total amount available for distribution
485.7 468.0 +3.8%
• Higher distributable income in tandem with the increase in NPI• Included in FY18/19 and FY17/18 were distributions of rollover adjustments from
prior years amounting to S$7.8 m (DPU impact of 0.250 cents) in 4Q FY18/19 andS$5.9 m (DPU impact of 0.200 cents) in 1Q FY17/18.
DPU (cents) 16.035 15.988 +0.3%
• DPU increased 0.3% after taking into consideration the enlarged number ofUnits in issue
• Includes taxable (FY18/19: 14.273 cents, FY17/18: 14.976 cents) and capital(FY18/19: 1.762 cents, FY17/18: 1.012 cents) distributions
Note: The Group had 171 properties as at 31 Mar 2019 and 131 properties as at 31 Mar 2018.

9
4Q FY18/19 vs 3Q FY18/19
Note: The Group had 171 properties as at 31 Mar 2019 and 31 Dec 2018 .
(S$’m) 4Q FY18/19 3Q FY18/19 Variance
Gross revenue 225.1 226.4 -0.6% • Mainly due to lower utilities income during the quarter
Net property income (NPI)
163.4 168.0 -2.7%
• Mainly due to higher property tax arising from the higherannual value for certain properties as well as higheroperating costs, including expenses in relation to thedeployment of the new operation command center atvarious buildings in Singapore
Total amount available for distribution
129.0 124.3 +3.8%• Higher distributable income despite lower NPI mainly due to
a rollover adjustment of S$7.8 m.
DPU (cents) 4.148 3.998 +3.8%
• DPU increased by 3.8%, in line with the higher distributableincome.
• Includes taxable (4Q FY18/19: 3.633 cents, 3Q FY18/19:3.456 cents) and capital (4Q FY18/19: 0.515 cents, 3QFY18/19: 0.542 cents) distributions.

Distribution Details
10
Distribution Period DPU (cents)
1 October 2018 to 31 March 2019 8.146
6 May 2019
(Mon)
7 May 2019 (Tue)9am
8 May 2019
(Wed) 5pm
Last day of trading on
“cum” basis
Ex-distribution date
Books closure date
Distribution payment date
Distribution Timetable
30 May 2019 (Thu)

Investment Management
11

FY18/19 CountryPurchase Consideration
(S$m) Completion Date
Acquisition 948.0
169-177 Australis DriveAustralia
(Melbourne)34.5 4 Jun 2018
1314 Ferntree Gully DriveAustralia
(Melbourne)16.4 26 Jun 2018
1st UK Portfolio (12 logistics properties)
United Kingdom(England)
373.2 (1) 16 Aug 2018
1-7 Wayne Goss DriveAustralia
(Brisbane)30.8 7 Sep 2018
Cargo Business ParkAustralia
(Brisbane)33.9 17 Sep 2018
2nd UK Portfolio (26 logistics properties)
United Kingdom(England)
459.2 (1) 4 Oct 2018
(1) Refers to Agreed Portfolio Value
Investment Highlights
12
▪ Acquired a total of S$948 m worth of properties in UK (S$832.4 m) and Australia (S$115.6 m)

FY18/19 CountryTotal Cost/ Sale
Price (S$m) Completion Date
Redevelopment 61.4
20 Tuas Avenue 1 Singapore 61.4 Apr 2018
Asset Enhancement Initiative 36.5
21 Changi South Avenue 2 Singapore 4.5 Apr 2018
KA Centre, KA Place and 1 Jalan Kilang Singapore 7.8 Jun 2018
Nordic European Centre Singapore 8.5 Jan 2019
Aperia Singapore 11.8 Jan 2019
138 Depot Road Singapore 3.9 Mar 2019
Divestment 37.6
30 Old Toh Tuck Road Singapore 24.0 30 Apr 2018
41 Changi South Avenue 2 Singapore 13.6 20 Aug 2018
Investment Highlights
13
▪ Completed 1 redevelopment and 5 asset enhancement initiatives worth S$97.9 m
▪ Divested 2 properties which generated total proceeds of S$37.6 m

Capital Management
14

Healthy Balance Sheet
▪ Aggregate leverage remained healthy at 36.3%
▪ Available debt headroom of ~S$0.7 b to reach 40.0% aggregate leverage
15
(1) Excludes fair value changes and amortised costs. Borrowings denominated in foreign currencies are translated at the prevailing exchange rates except for JPY/HKD-denominated debt issues, which are translated at the cross-currency swap rates that Ascendas Reit has committed to.
(2) Adjusted for the amount to be distributed for the relevant period after the reporting date.
As at 31 Mar 2019
As at 31 Dec 2018
As at 31 Mar 2018
Total Debt (S$m) (1) 4,141 4,136 3,563
Total Assets (S$m) 11,414 11,260 10,354
Aggregate Leverage 36.3% 36.7% 34.4%
Unitholders' Funds (S$m) 6,642 6,503 6,194
Net Asset Value (NAV) per Unit 213 cents 209 cents 212 cents
Adjusted NAV per Unit (2) 205 cents 205 cents 204 cents
Units in Issue (m) 3,111 3,111 2,929

Well-spread Debt Maturity Profile
16
Diversified
Financial
Resources
▪ Well-spread debt maturity with the longest debt maturing in FY29/30
▪ Average debt maturity improved to 4.0 years (3QFY18/19: 3.6 years; 4QFY17/18: 3.2 years)
• Issued HK$1.45 b (S$252 m) 10-yr bond at a tight 115 bps spread in Mar 2019. The proceeds was swapped into GBP at a fixed all-in rate of 2.872% for 10 years.
200
-
100
- - - - - - - --
95
162
330
150 200
354
217 163
-
252
103
-
100
271
132
467 362 - 271
-
-
-
-213
-
-
-
-
-
-
0
100
200
300
400
500
600
700
FY18/19 FY19/20 FY20/21 FY21/22 FY22/23 FY23/24 FY24/25 FY25/26 FY26/27 FY27/28 FY28/29 FY29/30
S$ (
mill
ion
)
Committed Revolving Credit Facilities Medium Term Notes Term Loan Facilities Revolving Credit Facilities
5%7%
39%
49%

Key Funding Indicators
17
(1) Based on total gross borrowings divided by total assets. Correspondingly, the ratio of total gross borrowings to unitholders’ funds is 62.4%.(2) Total investment properties exclude properties reported as finance lease receivable.
As at 31 Mar 2019
As at 31 Dec 2018
As at 31 Mar 2018
Aggregate Leverage 36.3% (1) 36.7% 34.4%
Unencumbered Properties as % of Total Investment Properties (2) 90.8% 91.0% 89.7%
Interest Cover Ratio 5.2 x 5.3 x 5.9 x
Debt / EBITDA 7.0 x 7.1 x 6.2 x
Weighted Average Tenure of Debt (years)
4.0 3.6 3.2
Weighted Average all-in Debt Cost 3.0% 3.0% 2.9%
Issuer Rating by Moody’s A3 A3 A3
▪ Healthy financial metrics way above bank loan covenants
▪ Enable access to wider funding options at competitive rates

(S$1.6 b)
(S$1.2 b)
(S$0.8 b) (S$0.8 b)
TotalAustralia
Assets
TotalAustralia
Borrowings
TotalUnited
KingdomAssets
TotalUnited
KingdomBorrowings
£0.5 b
High Level of Currency Hedge
▪ Achieved high level of natural hedge in Australia (75.5%) and the United Kingdom (100%) to minimise the effects of adverse exchange rate fluctuations
GBPNatural Hedge
100%
AUD Natural Hedge
75.5%
A$1.6 b
A$1.2 b
£0.5 b
18

Change in Interest Rates
Decrease in Distribution
(S$m)
Change as % of FY18/19 Distribution
Pro Forma DPU Impact (cents) (1)
+50 bps 3.5 -0.7% -0.11
+100 bps 7.0 -1.4% -0.23
+150 bps 10.6 -2.2% -0.34
+200 bps 14.1 -2.9% -0.45
Prudent Interest Rate Risk Management
19
(1) Based on number of Units in issue of 3,111m as at 31 Mar 2019.
▪ 83.0% of borrowings are on fixed rates with an average term of 3.6 years
▪ 50 bps increase in interest rate is expected to have a pro forma impact of S$3.5m decline in distribution or 0.11 cent decline in DPU

As at 31 Mar 2019Valuation
(S$b)
Weighted Average Cap
Rates
Cap RatesRange
Singapore portfolio (98 properties) 8.77 6.18% 5.00% - 7.00%
Business & Science Parks 3.69 6.02% 5.75% - 6.40%
High-Specifications/ Data Centres 2.19 6.34% 5.50% - 6.75%
Light Industrial/ Flatted Factories 0.95 6.23% 6.00% - 7.00%
Logistics & Distribution Centres 1.21 6.53% 6.00% - 7.00%
Integrated Development, Amenities & Retail
0.72 5.87% 5.00% - 6.75%
Australia portfolio (35 properties) (2)
1.56 6.08% 5.25% - 6.75%
Suburban Offices1.56 6.08% 5.25% - 6.75%
Logistics & Distribution Centres
United Kingdom portfolio (38 properties) (3)
0.81 5.77%(4)
4.30% - 8.00%(4)
Total Portfolio (171 properties) 11.14
Annual Property Revaluation
20
(1) Excludes properties which were divested (30 Old Toh Tuck and 41 Changi South Avenue 2) and newly acquired properties (United Kingdom properties, 169-177 Australis Drive, 1314 Ferntree Gully Drive, 1-7 Wayne Goss Drive and Cargo Business Park).
(2) All S$ amount based on exchange rate of A$1.00: S$0.9596 as at 31 Mar 2019.(3) All S$ amount based on exchange rate of £1.00: S$1.7680 as at 31 Mar 2019.(4) Refers to equivalent yield, which reflects the current level of return on property investments in the United Kingdom.
▪ Total valuation of 171 properties was S$11.1b
▪ Same-store valuation (1) of 129 properties @ 31 Mar 2019 improved to S$10.22b (vs. S$10.11b @ 31 Mar 2018)

Asset Management
21

88.3%
98.0% 100.0%
91.9%87.3%
98.1% 100.0%
91.3%89.5%
98.5%
91.5%
Singapore Australia United Kingdom Total
Mar-19 Dec-18 Mar-18
(1) Gross Floor Area as at 31 Mar 2019.(2) Gross Floor Area for Australia portfolio refers to the Gross Lettable Area/Net Lettable Area.(3) Gross Floor Area for United Kingdom portfolio refers to the Gross Internal Area.
Overview of Portfolio Occupancy
22
N.A.
Gross Floor Area (sqm) (1) 3,034,122 810,772 (2) 509,032 (3) 4,353,926

As at 31 Mar 2019 31 Dec 2018 31 Mar 2018
Total Singapore Portfolio GFA (sqm) 3,034,122 (1) 3,034,122 (1) 3,012,157 (2)
Singapore Portfolio Occupancy (same store) (3) 88.5% 87.5% 89.6%
Singapore MTB Occupancy (same store) (4) 85.7% 83.4% 86.0%
Occupancy of Singapore Investments Completed in the last 12 months
91.1% 91.1% 100.0%
Overall Singapore Portfolio Occupancy 88.3% 87.3% 89.5%
Singapore MTB Occupancy 85.5% 83.4% 85.9%
(1) Excludes 41 Changi South Avenue 2 and 30 Old Toh Tuck Road which were divested on 20 Aug 2018 and 30 Apr 2018 respectively.(2) Excludes 20 Tuas Avenue 1 which was previously de-commissioned for redevelopment. (3) Same store portfolio occupancy rates for previous quarters are computed with the same list of properties as at 31 Mar 2019, excluding new investments completed in
the last 12 months and divestments.(4) Same store MTB occupancy rates for previous quarters are computed with the same list of properties as at 31 Mar 2019, excluding new investments completed in the
last 12 months, divestments and changes in classification of certain buildings from single-tenant to multi-tenant buildings or vice-versa.
Singapore: Occupancy
23
▪ Occupancy improved to 88.3% mainly due to new take ups and expansions at 40 PenjuruLane, 4 Changi South Lane and 9 Changi South Street 3
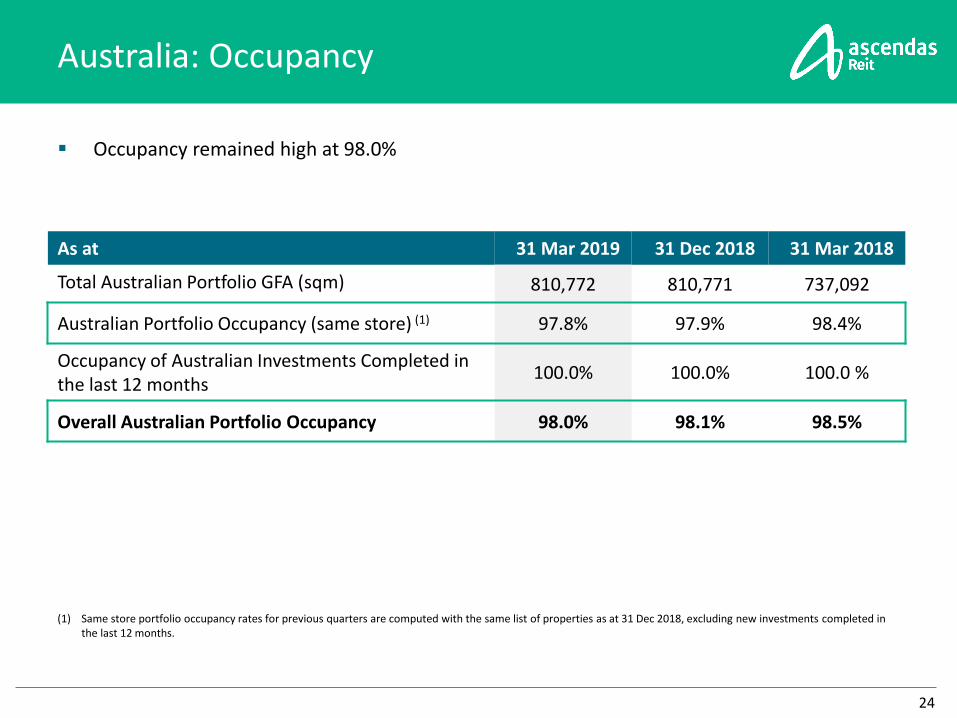
Australia: Occupancy
24
As at 31 Mar 2019 31 Dec 2018 31 Mar 2018
Total Australian Portfolio GFA (sqm) 810,772 810,771 737,092
Australian Portfolio Occupancy (same store) (1) 97.8% 97.9% 98.4%
Occupancy of Australian Investments Completed in the last 12 months
100.0% 100.0% 100.0 %
Overall Australian Portfolio Occupancy 98.0% 98.1% 98.5%
(1) Same store portfolio occupancy rates for previous quarters are computed with the same list of properties as at 31 Dec 2018, excluding new investments completed in the last 12 months.
▪ Occupancy remained high at 98.0%

United Kingdom: Occupancy
25
▪ Occupancy remained at 100%
As at 31 Mar 2019 31 Dec 2018 31 Mar 2018
Total United Kingdom Portfolio GFA (sqm) 509,032 509,032 n.a.
Occupancy of United Kingdom Investments Completed in the last 12 months
100.0% 100.0% n.a.
Overall United Kingdom Portfolio Occupancy 100.0% 100.0% n.a.

Singapore: Sources of New Demand (4Q FY18/19)
26
Others Transport and Storage Precision Engineering
Biomedical Lifestyle and Services Electronics
Financial Service General Manufacturing
▪ Continues to attract demand from a wide spectrum of industries
55.4%
37.1% 3.1%1.4%
1.1%
1.1%
0.6%
0.2%
By NLA
60.6%
23.7%4.9%
4.2%3.1%
2.0%
1.3%
0.2%
By Gross Rental Income

Transport and Storage Others Precision Engineering
Electronics Food Products & Beverages Biomedical
Financial Service IT Lifestyle and Services
General Manufacturing Telecommunication & Datacentre Structural Engineering
Singapore: Sources of New Demand (FY18/19)
27
▪ Continues to attract demand from a wide spectrum of industries
36.7%27.6%
10.0%
5.6% 5.4%3.6%3.2%
3.0%
2.8%
1.1%
0.8%
0.3%
By Gross Rental Income
40.0%
37.3%
6.8% 4.3%3.6%
2.3%1.4%1.4%
1.2%
0.9%
0.5%
0.4%
By NLA

Portfolio Rental Reversions
% Change in Renewal Rates for
Multi-tenant Buildings (1)FY18/19 FY17/18 4Q FY18/19 4Q FY17/18
Singapore 3.7% 0.5% 6.6% -6.8%
Business & Science Parks 4.3% 3.9% 4.8% 1.7%
High-Specifications Industrial and Data Centres 2.0% -6.6% 3.9% -18.8%
Light Industrial and Flatted Factories 3.5% 0.4% 2.9% 3.3%
Logistics & Distribution Centres 2.5% 0.1% 9.7% 0.0%
Integrated Development, Amenities & Retail 7.9% 11.6% 8.5% 3.3%
Australia - (2) 1.8% - (2) - (2)
Suburban Offices - (2) - (2) - (2) - (2)
Logistics & Distribution Centres - (2) 1.8% - (2) - (2)
United Kingdom - (2) - (2) - (2)
Logistics & Distribution Centres - (2) - (2) - (2)
Total Portfolio: 3.7% 0.7% 6.6% -6.8 %
28
(1) Percentage change of the average gross rent over the lease period of the renewed leases against the preceding average gross rent from lease start date. Takes into account renewed leases that were signed in their respective periods and average gross rents are weighted by area renewed.
(2) There were no renewals signed in the period for the respective segments.
▪ Portfolio reversions of 3.7% and 6.6% were recorded for leases renewed in FY18/19 and 4QFY18/19 respectively
▪ Rental reversion is expected to be flat in FY19/20 in view of the current global uncertaintyand excessive supply of industrial properties in Singapore

Weighted Average Lease Expiry (By gross revenue)
WALE (as at 31 Mar 2019) Years
Singapore 3.8
Australia 4.5
United Kingdom 9.3
Portfolio 4.2
29
▪ Portfolio Weighted Average Lease Expiry (WALE) stood at 4.2 years

34%
16%9%
23%
10%
8%
FY20/21
Portfolio Lease Expiry Profile (as at 31 Mar 2019)
30
(1) New leases refers to new, expansion and renewal leases. Excludes leases from new acquisitions.
Breakdown of expiring leases
for FY19/20 and FY20/21
Business and Science Parks
High-Specifications Industrial and Data Centres
Light Industrial and Flatted Factories
Logistics & Distribution Centres
Integrated Development, Amenities & Retail
Logistics & Suburban Offices (Australia)
41%
20%
14%
13%
6%6%
FY19/20
▪ Portfolio weighted average lease to expiry (WALE) of 4.2 years▪ Lease expiry is well-spread, extending beyond 2032▪ About 16.3% of gross rental income is due for renewal in
FY19/20▪ Weighted average lease term of new leases (1) signed in 4Q
FY18/19 was 4.1 years and contributed 1.6% of 4Q FY18/19 total gross revenue
1.6%
6.4%
1.6% 0.8%2.5% 2.1% 1.1%
4.5%
0.7%
14.7%
14.9%
13.0%
10.6% 6.6%
4.2%
0.3%
0.3%
2.8%
16.3%
21.3%
14.6%
11.4%
9.1%
6.3%
1.4%
4.8%
0.2%1.8%
3.5%1.7% 1.2% 1.0%
5.4%
FY
19/2
0
FY
20/2
1
FY
21/2
2
FY
22/2
3
FY
23/2
4
FY
24/2
5
FY
25/2
6
FY
26/2
7
FY
27/2
8
FY
28/2
9
FY
29/3
0
FY
30/3
1
FY
31/3
2
FY
32/3
3
>F
Y32
/33
% o
f G
ross
Re
nta
l In
com
e (
Tota
l Po
rtfo
lio)
Multi-tenant Buildings
Single-tenant Buildings

44%
22%
14%
14%
6%
FY19/20
Singapore: Lease Expiry Profile (as at 31 Mar 2019)
31
▪ Singapore portfolio weighted average lease to expiry (WALE) of 3.8 years
▪ Lease expiry is well-spread, extending beyond 2032▪ 18.4% of Singapore’s gross rental income is due for renewal in
FY19/20
Breakdown of expiring leases
for FY19/20 and FY20/21
Business and Science Parks
High-Specifications Industrial and Data Centres
Light Industrial and Flatted Factories
Logistics & Distribution Centres
Integrated Development, Amenities & Retail
Logistics & Suburban Offices (Australia)
37%
17%10%
25%
11%
FY20/21
1.7%
6.0%
0.8% 1.0% 0.6%2.1%
0.3%
3.2%
0.0% 0.6% 0.6%2.1%
0.0% 0.6%
5.3%
16.7%
17.6%
14.4%12.2%
6.4% 3.8%
0.1%
0.3%
0.0%0.1%
3.4% 0.0%
0.0%0.0%
0.0%
18.4%
23.6%
15.2%
13.2%
7.0%5.9%
0.4%
3.5%
0.0% 0.7%
4.0%2.1%
0.0% 0.6%
5.3%
FY
19/2
0
FY
20/2
1
FY
21/2
2
FY
22/2
3
FY
23/2
4
FY
24/2
5
FY
25/2
6
FY
26/2
7
FY
27/2
8
FY
28/2
9
FY
29/3
0
FY
30/3
1
FY
31/3
2
FY
32/3
3
>F
Y32
/33
% o
f G
ross
Re
nta
l In
com
e (
Sin
gap
ore
)
Multi-tenant Buildings - SG
Single-tenant Buildings - SG

29%
50%
21%
FY20/21
74%
20%
6%
FY19/20
Australia: Lease Expiry Profile (as at 31 Mar 2019)
32
▪ Australia portfolio weighted average lease to expiry (WALE) of 4.5 years
▪ Lease expiry is well-spread, extending beyond 2031▪ 8.0% of Australia’s gross rental income is due for renewal in
FY19/20
Breakdown of expiring leases
for FY19/20 and FY20/21
Sydney Melbourne Brisbane
0.6%
10.4%
5.9%
13.9%
2.9% 3.0%
7.1%7.4%
3.1%9.0%
9.9%
8.7%
2.1%
0.9%
8.0%
13.5%14.9%
4.1%
23.8%
11.6%
5.1%
8.0%
1.1%
6.6%
3.3%
FY
19/2
0
FY
20/2
1
FY
21/2
2
FY
22/2
3
FY
23/2
4
FY
24/2
5
FY
25/2
6
FY
26/2
7
FY
27/2
8
FY
28/2
9
FY
29/3
0
FY
30/3
1
FY
31/3
2
FY
32/3
3
>F
Y32
/33
% o
f G
ross
Re
nta
l In
com
e (
Au
stra
lia)
Multi-tenant building - AUSSingle-tenant building - AUS

United Kingdom: Lease Expiry Profile(as at 31 Mar 2019)
33
6.5%
1.5%
1.5%
3.6%5.4%
0.3%
8.0%
0.4%
7.9%
17.6%
0.9%
8.5%
4.2%
14.2%
8.1%
19.4%
FY
19/2
0
FY
20/2
1
FY
21/2
2
FY
22/2
3
FY
23/2
4
FY
24/2
5
FY
25/2
6
FY
26/2
7
FY
27/2
8
FY
28/2
9
FY
29/3
0
FY
30/3
1
FY
31/3
2
FY
32/3
3
>F
Y32
/33
% o
f G
ross
Re
nta
l In
com
e (
Un
ite
d K
ingd
om
)
Multi-tenant building - UKSingle-tenant building - UK
100%
FY19/20
Breakdown of expiring leases
for FY19/20 and FY20/21▪ United Kingdom portfolio weighted average lease to expiry (WALE) of 9.3 years
▪ Lease expiry is well-spread, extending beyond 2032▪ 1.5% of United Kingdom’s gross rental income is due for
renewal in FY19/20
100%
FY20/21
West Midlands

CountryEstimated
Value (S$m)Estimated
Completion Date
Development 181.2
Built-to-suit business park development for Grab
Singapore 181.2 3Q FY20/21
Redevelopment 35.0
25 & 27 Ubi Road 4 (NEW) Singapore 35.0 1Q FY21/22
Asset Enhancement Initiatives 21.5
52 & 53 Serangoon North Avenue 4 (NEW) Singapore 8.5 4Q FY19/20
Plaza 8 (Part of 1, 3 & 5 Changi Business Park Crescent) (NEW)
Singapore 8.5 4Q FY19/20
ONE@Changi City (NEW) Singapore 4.5 3Q FY19/20
Ongoing Projects: Improve Portfolio Quality
34

35
Development (On-going): Build-to-suit Business Park Development in Singapore for Grab
Land Premium S$84.0 m
Total Construction Costs S$88.8 m
Stamp Duty & Other Transaction Costs
S$8.4 m
Total Development Costs S$181.2 m
Land Area 11,435 sqm
Land Tenure 30 years
Gross Floor Area (GFA) 42,310 sqm
Occupancy Rate (upon completion)
100% pre-committed
Weighted Average Lease Expiry 11.0 years
Initial NPI Yield 6.4% (1)
Tenant GrabTaxi Holdings Pte Ltd (Grab)
Estimated Completion Date 3Q FY20/21
Build-to-suit development: ▪ Well-specified business park property with two
tower blocks (9 storeys and 4 storeys) connected via a sky bridge; Green Mark Gold Plus building -green features include energy efficient low emissive glass façade to reduce solar heat gain, recycled building materials
Well-Located: ▪ Within one-north, a vibrant business park which
houses Singapore’s knowledge economy sectors such as biomedical sciences, info-communications technology and media; 10 minutes’ drive to Singapore’s CBD
Artist’s Impression
(1) The NPI yield is derived using the net property income expected in the stabilised year of operation of the BTS development.

Drop-off area
Facade View from Ubi Avenue 2
Description
▪ Demolition of two existing light industrial buildings and redeveloping them into a single High-Specifications building
▪ Maximise site’s rental potential given the locational advantage, being 1-2 mins walk to Ubi MRT station
▪ Upgrading of building specifications i.e. enlarged floor plate (from 1,700 sqm to 4,000 sqm), higher ceiling height (from 4m to 6m)
Property SegmentLight Industrial (To be repositioned to High-Specifications Industrial)
Net Lettable Area 13,322 sqm
Occupancy (as at 31 Mar 2019) 60.9%
Cost S$35.0 m
Completion Date 1Q FY21/22
36
Redevelopment (New): 25 & 27 Ubi Road 4, Singapore

37
Asset Enhancement Initiative (New): 52 & 53 Serangoon North Avenue 4, Singapore
1st to 7th Storey Toilets
Main Lobby
Description
▪ Utilize remaining plot ratio by converting the roof level to a new production area
▪ Enhance building frontage and introducing an open fencing design.
▪ Upgrade drop-off point canopy, main lobby and existing toilets
Property Segment Light Industrial
Net Lettable Area 18,894 sqm
Occupancy (as at 31 Mar 2019) 92.0%
Cost S$8.5 m
Completion Date 4Q FY19/20

New Retail Internal Corridor Perspective
Futsal/Cricket Courts
Description
▪ Enhancement works to Podiums, reception, lobby, restrooms, common corridors, perimeter walkways etc.
▪ Improve existing layout of the driveway and creating new drop-off bays with new canopy
▪ Construct futsal/cricket courts and end-of-trip/bike parking/shower facility to generate activities and vibrancy
Property Segment Business Park
Net Lettable Area 25,359 sqm
Occupancy (as at 31 Mar 2019) 96.5%
Cost S$8.5 m
Completion Date 4Q FY19/20
38
Asset Enhancement Initiative (New): Plaza 8 (Part of 1, 3 & 5 Changi Business Park Crescent), Singapore

Lobby Area
Driveway and Drop-off Point
Description
▪ Enhancement work to reception and lobby, and creating new lounge, discussion area to create a premium look and feel
▪ Enhancement work to drop-off area, with new ceiling design, new feature wall design, graphics for existing façade glass facing the driveway
▪ Improve the existing layout and widen the driveway to improve traffic flow
Property Segment Business Park
Net Lettable Area 61,447 sqm
Occupancy (as at 31 Mar 2019) 96.5%
Cost S$4.5 m
Completion Date 3Q FY19/20
39
Asset Enhancement Initiative (New): ONE@Changi City, Singapore

Portfolio Resilience
40

Business & Science Parks,
33%
High-Specifications Industrial and Data Centres,
20%
Light industrial and Flatted
Factories, 9%
Integrated Development, Amenities &
Retail, 6%
Logistics & Distribution
Centres Singapore,11%
Logistics and Distribution
Centres Australia, 11%
Suburban Offices
Australia, 3%
Logistics and Distribution
Centres United Kingdom 7%
Singapore 79%
Australia 14%
United Kingdom 7%
Notes:• Multi-tenant buildings account for 70.6% of Ascendas Reit’s portfolio by asset value as at 31 Mar 19.• About 65.1% of Logistics & Distribution Centres in Singapore (by gross floor area) are multi-storey facilities with vehicular ramp access.• Within Hi-Specs Industrial, there are 3 data centres (4.8% of portfolio), of which 2 are single-tenant.• Within Light Industrial, there are 2 multi-tenant flatted factories (3.0% of portfolio).
Well Diversified PortfolioBy Value of Investment Properties
41
Total Investment PropertiesS$11.14 b
▪ As at 31 Mar 2019, total investmentproperties stood at S$11.14 b
• Singapore portfolio: S$8.77 b
• Australia portfolio: S$1.56 b
• United Kingdom portfolio: S$0.81 b
▪ Diversified across
• Business & Science Park/ Suburbanoffice: 36%
• Logistics & Distribution Centre: 29%
• Industrial: 35%

Customers’ Industry DiversificationBy Monthly Gross Revenue
42
Note: Others include research & development, manufacturing, oil and gas, multi-media products etc.
More than20 industries
12.7%0.4%
0.8%
0.9%1.1%1.2%1.4%1.6%1.6%
2.0%2.5%2.6%2.6%2.7%
6.3%6.5%6.5%
7.4%8.3%
9.0%
9.4%12.7%
OthersRubber and Plastic Products
Fabricated Metal Products
Printing & Reproduction of Recorded MediaChemical
Textiles & Wearing ApparelsHealthcare Products
Repair and Servicing of vehiclesHotels and restaurants
ConstructionMedical, Precision & Optical Instruments, Clocks
Food Products & BeveragesPublic Services
Wholesale and Retail TradeElectronics
Information Technology
Telecommunication & DatacentreLife Science & Other Scientific Activities
M&E and Machinery & EquipmentFinancial
Distributors, trading company3rd Party Logistics, Freight Forwarding
▪ Well-diversified customer base across more than 20 industries

Quality and Diversified Customer Base
43
▪ Total customer base of around 1,360 tenants▪ Top 10 customers (as at 31 Mar 2019) account for about 20.2% of monthly portfolio gross
revenue▪ On a portfolio basis, weighted average security deposit is about 5.0 months of rental
income
4.8%
3.1%
2.1% 2.0%1.6% 1.5% 1.5%
1.2% 1.2% 1.2%
SingaporeTelecomm-unications
Ltd
DSONational
Laboratories
Citibank,N.A
DBS Bank Ltd WesfarmersGroup
CevaLogisticsS Pte Ltd
JPMorganChase
Bank, N.A
A*STARResearchEntities
SiemensPte Ltd
FederalExpress
Corporation

Diversified Portfolio
44
Aperia, 5.3%ONE@ Changi City, 3.8%12, 14 & 16 Science Park Drive, 3.6%1, 3 & 5 Changi Business Park Crescent, 3.3%Kim Chuan Telecommunication Complex, 2.6%TelePark, 2.3%Neuros & Immunos, 2.2%Pioneer Hub, 2.2%Hyflux Innovation Centre, 2.0%TechPlace II, 2.0%40 Penjuru Lane, 1.9%Nexus@One North, 1.9%The Aries, Sparkle & Gemini, 1.8%TechPoint, 1.7%31 International Business Park, 1.6%DBS Asia Hub (Phase I & II), 1.5%Techlink, 1.5%Techview, 1.5%Siemens Centre, 1.5%TechPlace I, 1.5%Corporation Place, 1.4%197-201 Coward Street, 1.3%Cintech III & IV, 1.2%10 Toh Guan Road, 1.2%FoodAxis @ Senoko, 1.2%HansaPoint @ CBP, 1.1%Infineon Building, 1.1%Nordic European Centre, 1.0%The Capricorn, 1.0%Giant Hypermart, 1.0%The Galen, 0.9%19 & 21 Pandan Avenue, 0.9%Courts Megastore, 0.8%AkzoNobel House, 0.8%Acer Building, 0.8%The Alpha, 0.8%LogisTech, 0.8%7 Grevillea Street, 0.8%21 Jalan Buroh, 0.8%Changi Logistics Centre, 0.8%108 Wickham Street, 0.8%100 Wickham Street, 0.7%50 Kallang Avenue, 0.7%Others, 32.3%
▪ No single property accounts for more than 5.3% of Ascendas Reit’smonthly gross revenue

Market Outlook
45

Market Outlook
▪ The global economy continues to face considerable headwinds including the on-going US-China trade conflict and prolonged Brexit uncertainties.
▪ Singapore’s economy grew 1.3% y-o-y in 1Q 2019 and is expected to grow at slightly below the mid-point of the “1.5% to 3.5%” forecast range in 2019 (MTI).
• On top of the excessive new supply of industrial property space that was built-up over the last 4-5 years, an additional 2.8 million sqm of new industrial space is expected to complete in 2019 and 2020
▪ Australia’s economy grew by 2.3% y-o-y in 2018 and is expected to grow by 2.3%y-o-y in 2019 (Bloomberg).
• A key external risk to Australia’s growth outlook is the potentially slower growth inChina, its key trading partner. Stable performance of the portfolio is underpinned bythe long WALE of 4.5 years and average annual rent escalations of approximately 3%per annum.
▪ UK’s economy grew by 1.4% y-o-y in 2018 and is forecasted to grow by 1.2% y-o-yin 2019 (Bloomberg).
• Ascendas Reit’s UK portfolio has strong attributes such as the long WALE of 9.3 years,and the domestic nature of the tenants’ logistics business will stand Ascendas Reit ingood stead to overcome any potential impact arising from Brexit.
46

Additional Information
47
1 Historical Quarterly Results
2 Details on Investments and Capital Recycling
3 Ascendas Reit’s Singapore Occupancy vs Industrial Average
4 Singapore Industrial Property Market
5 Singapore New Supply

Historical Quarterly Results
48
Financial Highlights
FY17/18 FY18/19
(S$ m) 1Q 2Q 3Q 4Q Total 1Q 2Q 3Q 4Q Total
Gross Revenue 213 216 217 216 862 217 218 226 225 886
Net Property Income
152 161 158 158 629 159 159 168 164 650
Total Amount Available for Distribution
118 119 116 115 468 117 115 124 130 486
No. of Units in Issue (m)
2,927 2,927 2,929 2,929 2,929 2,930 3,108 3,111 3,111 3,111
Distribution Per Unit (cents)
4.049 4.059 3.970 3.910 15.988 4.002 3.887 3.998 4.148 16.035

169-177 Australis Drive, Melbourne
Purchase Consideration (1)(2) A$34.0 m (S$34.5 m)
Acquisition Fee, Stamp Duty and Other Transaction Costs
A$2.3 m (S$2.3 m)
Total Acquisition Cost A$36.3 m (S$36.8 m)
Vendor Abacus Funds Management
Land Area 56,330 sqm
Land Tenure Freehold
Lettable Floor Area 31,048 sqm
Occupancy (31 Mar 2019) 100%
Weighted Average Lease Expiry (31 Mar 2019)
2.2 years
Key Tenants▪ Hitachi Transport System▪ United Wholesalers▪ HB Commerce
Initial Net Property Income Yield 6.9% (6.5% post-cost yield)
Completion Date 4 Jun 2018
(1) S$ amount based on exchange rate of A$1.00: S$1.0133 as at 31 Mar 2018 (2) Includes outstanding incentives reimbursed by the Vendor.
Acquisition: 169-177 Australis Drive, Melbourne, Australia
49
The Property: ▪ Modern logistics facility with flexibility to accommodate
multiple tenancies
Well-Located: ▪ Sits within the highly regarded West Park Industrial Estate,
in the established industrial precinct of Derrimut. ▪ Serviced by the Western Ring Road, the Western Freeway
and the Princes Freeway. ▪ Located 16 km west of the Melbourne Central Business
District, 15 km from the Port of Melbourne and 24 km from Melbourne Airport.

1314 Ferntree Gully Drive, Melbourne
Purchase Consideration (1)(2) A$16.2 m (S$16.4 m)
Acquisition Fee, Stamp Duty and Other Transaction Costs
A$1.3 m (S$1.3 m)
Total Acquisition Cost A$17.5 m (S$17.7 m)
Vendor Brian Davis Investments Pty Ltd
Land Area 25,895 sqm
Land Tenure Freehold
Lettable Floor Area 16,134 sqm
Occupancy (as at 31 Mar 2019)(3) 100%
Weighted Average Lease Expiry (31 Mar 2019)
Nil
Initial Net Property Income Yield 7.8% (7.3% post-cost yield)
Completion Date 26 Jun 2018
(1) S$ amount based on exchange rate of A$1.00: S$1.0099 as at 30 Jun 2018(2) Includes rental guarantee provided by the Vendor.(3) Physical occupancy is 0%, rental support provided by the Vendor for the vacant space.
The Property: ▪ Comprises three levels of office, low-bay 6m clearance
warehouse and ultra high-bay 15 – 16m clearance warehouse, fully racked and includes Materials Handling Equipment.
Well-Located: ▪ Situated in the established industrial precinct of Scoresby,
a strategic location in Melbourne’s eastern suburbs.▪ Approximately 30 km east of the Melbourne Central
Business District, 37 km from the Port of Melbourne and 53 km from Melbourne Airport.
Acquisition: 1314 Ferntree Gully Drive, Melbourne, Australia
50

Agreed Portfolio Value (1)(2) £207.27 m (S$373.15 m)
Acquisition Fee, Stamp Duty and Other Transaction Costs
£4.98 m (S$8.97 m)
Total Acquisition Cost (3) £205.01 m (S$369.08 m)
VendorOxenwood Catalina Midco Limited and Oxenwood Catalina II MidcoLimited
Land Area 549,201 sqm
Land Tenure Freehold (4)
Gross Internal Area 242,633 sqm
Occupancy (as at 31 Mar 2019) 100%
Weighted Average Lease Expiry (31 Mar 2019)
10.4 years
Key TenantsDHL, Howden Joinery Group, Bibby Distribution, Amazon
Initial Net Property Income Yield 5.32% (5.22% post-cost yield) (5)
Completion Date 16 Aug 2018
(1) S$ amount based on exchange rate of £1.00:S$1.8003 as at 29 Jun 2018 (2) Includes rental guarantee provided by the Vendors.(3) Adjusted for the estimated net assets and liabilities of the companies acquired.(4) 10 properties on freehold land and 2 properties on 999-year leasehold land. (5) Derived from the estimated NPI expected in the first year of acquisition and includes rental guarantee
provided by the Vendors.
Acquisition: 1st Portfolio of 12 logistics properties, United Kingdom
51
The Portfolio: ▪ Well-specified and functional logistics properties e.g. high
floor loading of 50KN/sqm to 80 KN/sqm, eaves height of 8m to 14m
▪ Property sizes range between 2,785 sqm to 47,298 sqm
Well-Located: ▪ Sited in established industrial areas across regions in the
UK including Yorkshire and the Humber, North West England, East Midlands, West Midlands, South East England and East of England
12 logistics properties, United Kingdom

Land and Development Cost (1)(2) A$30.0 m (S$30.8 m)
Acquisition Fee, Stamp Duty and Other Transaction Costs
A$1.0 m (S$1.0 m)
Total Investment Cost A$31.0 m (S$31.8 m)
DeveloperGoodman Property Services (Aust) Pty Ltd (“Goodman”)
Land Area 30,196 sqm
Land Tenure Freehold
Lettable Floor Area 17,880 sqm
Occupancy (as at 31 Mar 2019)(3) 100%
Weighted Average Lease Expiry (31 Mar 2019)
Nil
Key Tenants Nil
Initial NPI Yield (4) 6.7% (6.5% post-cost yield)
Construction Completion Date 7 Sep 2018
(1) All S$ amount based on exchange rate of A$1.00: S$1.0258 as at 30 Nov 2017 (2) Includes rental guarantee provided by the Vendor.(3) Includes rental support provided by the Vendor for the vacant space. Physical occupancy is 0%.(4) Derived from the estimated NPI expected in the first year of acquisition and includes rental guarantee
provided by the Vendor.
Acquisition: 1-7 Wayne Goss Drive, Berrinba, Brisbane, Australia
52
The Property: ▪ Developed by Goodman▪ Generic design and layout - functional and efficient for a
wide range of users▪ Designed with sub-division flexibility to accommodate up
to 2 tenants
Well-Located: ▪ In the established industrial precinct of Berrinba, 30km
south of Brisbane CBD. ▪ Good access to Logan, Gateway and Pacific Motorways
1-7 Wayne Goss Drive, Brisbane

Purchase Consideration (1)(2) A$33.5 m (S$33.9 m)
Acquisition Fee, Stamp Duty and Other Transaction Costs
A$2.6 m (S$2.6 m)
Total Acquisition Cost A$36.1 m (S$36.5 m)
Vendor TS1 (Qld) Pty Ltd
Land Area 7,786 sqm
Land Tenure Freehold
Lettable Floor Area 8,216 sqm
Occupancy (as at 31 Mar 2019)(3) 100%
Weighted Average Lease Expiry (31 Mar 2019)
2.0 years
Key TenantsCommonwealth of Australia (Bureau of Meteorology), Asics,Nike
Initial Net Property Income Yield 7.4% (6.8% post-cost yield)(4)
Completion Date 17 Sep 2018
(1) S$ amount based on exchange rate of A$1.00: S$1.0126 as at 31 Jul 2018(2) Includes rental guarantee provided by the Vendor for the vacant space.(3) Includes rental support provided by the Vendor for the vacant spaces. Physical occupancy is 93.4%.(4) Derived from the estimated NPI expected in the first year of acquisition and includes rental guarantee
provided by the Vendor.
Acquisition: Cargo Business Park, Brisbane, Australia
53
The Property: ▪ Comprises three buildings with office / warehousing
facilities across a central driveway; 160 car park spaces
Well-Located: ▪ Situated in the established industrial precinct of Eagle
Farm in Queensland, ~ 9 km north east of the Brisbane CBD and ~ 6 km from the Brisbane Domestic and International Airport
Cargo Business Park, Brisbane

Agreed Portfolio Value (1)(2) £257.46 m (S$459.18 m)
Acquisition Fee, Stamp Duty and Other Transaction Costs
£6.80 m (S$12.13 m)
Total Acquisition Cost (3) £260.05 m (S$463.80 m)
Vendor Griffen Group UK Holding Limited
Estimated Land Area 586,850 sqm
Land Tenure Freehold (4)
Gross Internal Area (GIA) 266,184 sqm
Occupancy (as at 31 Mar 2019) 100%
Weighted Average Lease Expiry (31 Mar 2019)
8.56 years
Key TenantsAston Martin Lagonda, Amethyst Group, Eddie Stobart, Royal Mail, Sainsbury, Vax
Initial NPI Yield 5.54% (5.39% post-cost yield) (5)
Completion Date 4 Oct 2018
54
The Portfolio: ▪ Well-specified and functional logistics properties
e.g. eaves height of 6 m to 16 m, yard depths of 15 m to 60 m
▪ Property sizes range between 835 sqm to 35,104 sqm
Well-Located: ▪ About 70% of the portfolio’s gross internal area is
situated within the West Midlands, an important logistics hub located at the centre of UK’s motorway network.
26 logistics properties, United Kingdom
(1) S$ amount based on exchange rate of £1.00:S$1.7835 as at 28 Sep 2018 (2) Includes rental guarantee and incentives provided by the Vendor.(3) Adjusted for the estimated net assets and liabilities of the companies acquired.(4) 25 properties are on freehold land and 1 property is on 965-year leasehold land.(5) Includes the estimated NPI expected in the first year of acquisition, rental guarantee and incentives
provided by the Vendor. The NPI yield is derived accordingly.
Acquisition: 2nd Portfolio of 26 Logistics Properties, United Kingdom

Warehouse Block and Ramp
Roof Top Parking
Description
The property was redeveloped into a ramp-up 3-storey warehouse block with efficient and regular floor plate sizes. Features include a concrete rooftop carpark for 40 foot container and lorries. Plot ratio was maximized.
Property Segment Logistics & Distribution Centre
Net Lettable Area 41,134 sqm
Occupancy (as at 31 Mar 2019) 91.1%
Cost S$61.4 m
Completion Date Apr 2018
Redevelopment: 20 Tuas Avenue 1, Singapore
55

Description
The property was retrofitted with new cargo lifts, fire protection system and smoke purge fans.Existing toilets were upgraded and layout of 3rd and 4th storeywarehouse were regularized.
Property Segment Logistics & Distribution Centre
Net Lettable Area 11,440 sqm
Occupancy (as at 31 Mar 2019) 36.1%
Cost S$4.5 m
Completion Date Apr 2018
56
Asset Enhancement Initiative: 21 Changi South Avenue 2, Singapore
Loading and Unloading Bay
Building Facade

1 Jalan Kilang: Canopy and Main Entrance
KA Centre: Level 2 Canteen
Description
The property was enhanced to provide a more delightful environment for customers. Upgrades were made to the main entrance, lift lobbies, cafeteria, landscape and drop-off area.
Property Segment High-Specifications Industrial
Net Lettable Area
KA Centre : 13,557 sqmKA Place : 6,652 sqm1 Jalan Kilang : 6,071 sqmTotal : 26,280 sqm
Occupancy (as at 31 Mar 2019)KA Centre : 95.5%KA Place : 66.8%1 Jalan Kilang : 92.2%
Cost S$7.8 m
Completion Date Jun 2018
57
Asset Enhancement Initiative: KA Centre, KA Place and 1 Jalan Kilang, Singapore

Main Lobby at Level 1
Canopy Leading to Main Entrance
Description
▪ Activate the main lobby with shared collaborative spaces for tenants and visitors
▪ Refresh building façade▪ Delight tenants with gym and
End-of-trip facility, promoting Live-Work-Learn-Play
▪ Adopt technologies e.g. mobile platforms for access to shared facilities e.g. gym and meeting rooms
▪ Achieve Green Mark Certification
Property Segment Business Park
Net Lettable Area 21,847 sqm
Occupancy (as at 31 Mar 2019) 69.6%
Cost S$8.5 m
Completion Date Jan 2019
58
Asset Enhancement Initiative: Nordic European Centre, Singapore

Open Walkway
Retail Podium
Description
▪ Improve tenant mix with more F&B options and active lifestyle venues such as rock climbing, gym & yoga studio
▪ Create a Food Street corridor with more F&B options such as restaurant, café and take-away kiosk
▪ Enhance drop-off point and lobby to improve visitor experience for both retail and B1 towers
Property SegmentIntegrated Development,Amenities and Retail
Net Lettable Area 68,583 sqm
Occupancy (as at 31 Mar 2019)Aperia B1: 96.5%Aperia Mall: 87.2% Total: 95.2%
Cost S$11.8 m
Completion Date Jan 2019
59
Asset Enhancement Initiative: Aperia, Singapore

Level 1 Lift Lobby
Level 1 Main Lobby
Description
▪ Multi-tenanted building conversion with focus on potential tenants’ experience
▪ Accentuate visitor arrival experience through refreshing building façade, installing new full height glass at the main entrance, re-cladding existing columns and installing new artificial vertical green walls along the driveway up to the building’s drop off area
Property Segment High-Specifications Industrial
Net Lettable Area 26,695 sqm
Occupancy (as at 31 Mar 2019) 98.1%
Cost S$3.9 m
Completion Date Mar 2019
60
Asset Enhancement Initiative: 138 Depot Road, Singapore

Capital Recycling
61
30 Old Toh Tuck 41 Changi South Avenue 2
Description5-storey ramp-up logistics building located in the Western part of Singapore
4-storey light industrial building located in the eastern part of Singapore
Remaining Land Tenure (at point of sale)
~39 years ~37 years
Net Lettable Area 14,103 sqm 6,154 sqm
Acquisition Year / Price 2006/ S$19.6 m 2003/ S$13.5 m
Book Value (as at 31 Mar 2018) S$20.3 m S$11.6 m
Sales Price (1) S$24.0 m S$13.6 m
Pro-forma Net Property Income Impact S$0.69 m -S$0.1 m
Buyer Soon Bee Huat Trading Pte Ltd Y K Toh Marketing (S) Pte Ltd
Completion Date 30 Apr 2018 20 Aug 2018
(1) In accordance to Ascendas Reit’s Trust Deed, the Manager is entitled to a divestment fee of 0.5% of the sale price of the properties.
▪ Divested 2 properties in Singapore, generating gross proceeds of S$37.6 m
▪ Realised net gains of about S$4.1 m over book value

Source : Ascendas Reit’s Singapore portfolio as at 31 Mar 2019. Market: JTC statistics as at 25 Apr 2019 (1Q 2019).JTC statistics do not breakdown High-Specifications Industrial and Light Industrial, ie they are treated as one category with occupancy of 89.6%
Ascendas Reit’s Singapore Occupancy vs Industrial Average
62
84.8%87.1%
84.0%
93.4%
85.6%
89.6% 89.6% 89.2%
50%
55%
60%
65%
70%
75%
80%
85%
90%
95%
100%
Business and SciencePark
High-SpecificationsIndustrial
Light Industrial Logistics
Ascendas Reit JTC Statistics
Occ
up
ancy
Rat
e

Business Park (City Fringe) : $5.80 psfpm
Business Park (Rest of Island) : $3.80 psfpm
Hghi-Specifications : $3.15 psfpm
Light Industrial : $1.57 psfpm
Logistics : $1.58 psfpm
20
00
20
01
20
02
20
03
20
04
20
05
20
06
20
07
20
08
20
09
20
10
20
11
20
12
20
13
20
14
20
15
20
16
20
17
Q1
20
17
Q2
20
17
Q3
20
17
Q4
20
18
Q1
20
18
Q2
20
18
Q3
20
18
Q4
20
19
Q1
Source : JTC’s First Quarter Market Report
Source : CBRE Market View Report Q4 2018 for Business Park (City Fringe), Business Park (Rest of Island), High-Specifications, Light Industrial and Logistics.
Average Market Rents (Singapore)by Segment
63
3Q2018: 90.9
4Q2018: 90.9
1Q2019: 90.9
20
00
20
01
20
02
20
03
20
04
20
05
20
06
20
07
20
08
20
09
20
10
20
11
20
12
20
13
20
14
20
15
20
16
20
17
20
18
20
19
Industrial Rental Index

Note: Excludes projects under 7,000 sqm. Based on gross floor area Source: URA Realis & Ascendas Reit internal research
Sector ('000 sqm) 2019 2020 2021New
Supply(Total)
Existing Supply(Total)
% of New/ Existingsupply
Business & Science Park 18 144 26 1892,201 4.5%
% of Pre-committed (est) 100% 48% 100% 60%
High-Specifications Industrial 388 143 37 568
36,116 7.1%% of Pre-committed (est) 77% 100% 100% 84%
Light Industrial 448 1,221 342 2,011
% of Pre-committed (est) 93% 35% 50% 50%
Logistics & Distribution Centres
155 265 16 43610,778 4.0%
% of Pre-committed (est) 67% 11% 100% 34%
Total 1,008 1,774 422 3,204 49,095 6.5%
% Pre-committed (est) 83% 38% 59% 55%
▪ Potential new supply of about 3.2 m sqm (~6.5% of existing stock) over next 3 years, of which 55% are pre-committed
▪ Island-wide occupancy was 89.3% as at 31 Mar 19 (vs. 89.3% as at 31 Dec 18)
Singapore Industrial Market: New Supply
64

Singapore Business & Science Parks: New Supply
Expected Completion
Location Developer GFA (sqm)% Pre-
committed (Estimated)
2019 International Business ParkPension Real Estate Singapore Pte Ltd
17,730 100%
2020 One-north Crescent Snakepit-BP LLP 16,410 100%
2020 Biopolis Road Wilmar International Limited 16,580 100%
2020 One-north Avenue Ascendas Reit 35,960 100%
2020 Cleantech Loop JTC Corporation 75,450 0%
2021 Cleantech Heights PBA Innovation Centre Pte Ltd 26,490 100%
2023 Punggol Way JTC Corporation 143,500 0%
332,120 34%
65

Singapore High-Specifications & Light Industrial: New Supply (1)
66
Expected Completion
Location Developer GFA (sqm)% Pre-
committed (Estimated)
2019 Kallang Way SB (Waterview) Investment Pte Ltd 54,490 0%
2019 Ang Mo Kio Street 64 United Engineers Limited 60,180 80%
2019 North Coast DriveMicron Semiconductor Asia Operations Pte Ltd
261,320 100%
2020 Senoko Drive/Senoko RoadTee Yih Jia Food Manufacturing Pte Ltd
69,630 100%
2020 North Coast Avenue JTC Corporation 45,810 0%
2020 North Coast Avenue JTC Corporation 83,780 0%
2020 Bedok North Avenue 4 JTC Corporation 105,720 0%
2020 Lok Yang Way Google Asia Pacific Pte Ltd 120,070 100%
2020 Kranji Loop/Kranji Road JTC Corporation 143,270 0%
2020Bartley Road East/Kim ChuanRoad
JTC Corporation 327,080 0%
1,225,540 41%
(1) Projects that are above 50,000 sqm

Singapore High-Specifications & Light Industrial: New Supply (1)
67
Expected Completion
Location Developer GFA (sqm)% Pre-
committed (Estimated)
2021 Kranji Loop JTC Corporation 134,030 0%
2021 Sunview Way Malkoha Pte Ltd 170,860 100%
2022 Tai Seng Avenue SB (Ipark) Investment Pte. Ltd. 105,250 0%
2022 Ang Mo Kio Street 64/65 JTC Corporation 116,940 0%
2022 Bulim Lane 1/2 JTC Corporation 159,400 0%
686,480 25%
1,995,800 34%
(1) Projects that are above 50,000 sqm

Singapore Logistics: New Supply (1)
68
Expected Completion
Location Developer GFA (sqm)% Pre-
committed (Estimated)
2019 Alps Avenue Schenker Singapore (Pte) Ltd 51,430 0%
2020 Tembusu Crescent S H Cogent Logistics Pte Ltd 87,500 0%
2020 Gul Circle JTC Corporation 134,320 0%
2023 Sunview Road Allied Sunview Pte Ltd 116,810 100%
390,060 30%
(1) Projects that are above 50,000 sqm

Important Notice
This presentation has been prepared by Ascendas Funds Management (S) Limited as Manager for Ascendas Real Estate Investment Trust. The details in this
presentation provide general information only. It is not intended as investment or financial advice and must not be relied upon as such. You should obtain
independent professional advice prior to making any decision. This presentation is not an offer or invitation for subscription or purchase of securities or other
financial products. Past performance is no indication of future performance. All values are expressed in Singaporean currency unless otherwise stated.
Thank you
69