August 2012 Impact of Implementing a Primary Enforcement ...
68
Impact of Implementing a Primary Enforcement Seat Belt Law in Florida: A Case Study
Transcript of August 2012 Impact of Implementing a Primary Enforcement ...

DOT HS 811 XXXAugust 2012
Impact of Implementing a Primary Enforcement Seat Belt Law in Florida: A Case Study

This publication is distributed by the U.S. Department of
Transportation, National Highway Traffic Safety Administration, in the interest of information exchange. The opinions, findings, and conclusions expressed in this publication are those of the authors and not necessarily those of the Department of Transportation or the National Highway Traffic Safety Administration. The United States Government assumes no liability for its contents or use thereof. If trade or manufacturers’ names or products are mentioned, it is because they are considered essential to the object of the publication and should not be construed as an endorsement. The United States Government does not endorse products or manufacturers.
Suggested APA Citation Format: Nichols, J. L., Chaffe, R., & Solomon, M. G. (2012, August). Impact of implementing a primary
enforcement seat belt law in Florida: A case study. (Report No. DOT HS 811 656). Washington, DC: National Highway Traffic Safety Administration.

i
Technical Report Documentation Page
1. Report No. DOT HS 811 656
2. Government Accession No. 3. Recipient's Catalog No.
4. Title and Subtitle Impact of Implementing a Primary Enforcement Seat Belt Law in Florida: A Case Study
5. Report Date
August 2012 6. Performing Organization Code
7. Authors
J.L. Nichols, R. Chaffe, and Mark G. Solomon 8. Performing Organization Report No.
9. Performing Organization Name and Address
Preusser Research Group, Inc. 7100 Main Street Trumbull, CT 06611
10. Work Unit No. (TRAIS)
11. Contract or Grant No.
DTNH22-08-R-00145 12. Sponsoring Agency Name and Address
U.S. Department of Transportation National Highway Traffic Safety Administration Office of Behavioral Safety Research, NTI-132 1200 New Jersey Avenue SE. Washington, DC 20590
13. Type of Report and Period Covered
Final Report
14. Sponsoring Agency Code
15. Supplementary Notes
16. Abstract
On June 30, 2009, Florida implemented a primary seat belt law. The State was already engaged in a Rural Demonstration Program (RDP) to increase belt usage in rural areas in the northern part of the State and participated regularly in annual Click It or Ticket (CIOT) mobilizations. This study examined the changes in belt usage associated with the primary law change and the contribution of the rural and statewide belt programs. Awareness surveys indicated that 94% of respondents knew of the primary law and 77% supported the law immediately after the law went into effect. The 2009 CIOT May Mobilization resulted in a 3-point increase in statewide usage, from 77.9% to 80.9%. The new primary law provided an additional gain of 4.3 percentage points in statewide usage to 85.2%. Belt use increased the most among the lowest belt use groups, including males, the African-American population, pickup truck occupants, younger occupants, and motorists on local roads. Statewide belt usage increased to 87.4% after the 2010 CIOT, about one full year after the primary belt law went into effect.
17. Key Words
Seat Belt Use Primary Enforcement High-Visibility Enforcement
18. Distribution Statement Document is available through the National Technical Information Service www.ntis.gov
19. Security Classif.(of this report)
Unclassified 20. Security Classif.(of this page)
Unclassified 21. No. of Pages
68 22. Price

ii
iii
EXECUTIVE SUMMARY
Background This report describes the characteristics and results of a primary law upgrade for seat belt use (SBU) in Florida. Florida’s law change went into effect on June 30, 2009. At the time, Florida was implementing statewide high-visibility enforcement (HVE) efforts as part of a May Click It or Ticket (CIOT) mobilization and a Rural Demonstration Program (RDP) in 36 northern counties to increase seat belt use. Florida Experience. Florida implemented its initial seat belt law on July 1, 1986, becoming the 18th State to enact such a law. At the time, 8 States had enacted primary laws allowing for standard law enforcement procedures and 9 States and the District of Columbia had enacted secondary laws. Like these 9 secondary law States, the initial Florida law required officers to first observe another violation before stopping a vehicle and issuing a citation for nonuse of seat belts (i.e., secondary enforcement procedures). Prior to its initial belt law, Florida’s observed usage rate was 22%. By early 1986, usage had increased to 61%. Then, as in most new seat belt law States, usage declined modestly to about 56%. Over the years, Florida participated extensively in HVE programs, initially preferring “softer” messages but later embracing the “harder” enforcement messages of CIOT (“Wear your seat belt, or you will get a ticket”). As a result of participating in such efforts, usage increased by about 10 percentage points from 1999 to 2001 (from 65% to 75%) and another substantial 7-point gain from 2001 to 2006 (from 74% to 81%). Usage remained at or around 81% from 2006 to 2008. Florida enacted its primary belt law from this relatively high baseline use rate. Objectives of this case study. The objective of this study was to identify changes in seat belt usage across Florida with the change from secondary to primary enforcement in the context of the ongoing enforcement and media activities with CIOT statewide and with the rural program in the northern counties. The evaluation tracked the amount and type of media and enforcement activity that accompanied the law change and measured public awareness levels and perceptions relative to the new law. Methods Florida has conducted annual statewide seat belt surveys at 150 sites before and after each May mobilization since 2006. A representative statewide survey was conducted in July 2009, approximately one month after the 2009 CIOT and immediately after the primary law upgrade went into effect. Six waves of smaller (45 sites) observational surveys were conducted in northern Florida in 2009 and 2010 as part of the RDP. Florida also conducts Statewide awareness surveys at 16 Department of Motor Vehicle (DMV) licensing centers across the State, and provided these data approximately one month after the law change and again nearly a year after the change. A subsample of 6 of the 16 licensing centers conducted awareness surveys in the northern part of the State as part of the RDP evaluation.

iv
Media and enforcement data associated with CIOT and RDP mobilizations were examined to understand their role in any post-law changes in usage and awareness. Monthly seat belt citation data, obtained from Florida’s Uniform Traffic Citation (UTC) database for the years from 2005 to 2009 were examined for changes in citation rates among various driver subgroups. Results Annual Enforcement. Monthly citation data from 2005 to 2009 showed peaks in citations associated with May CIOT mobilizations. These peaks declined from 2006 to 2009 indicating slightly lesser enforcement intensity over time. In 2009, there was an increase in citations in May and another significant increase in July that was associated with the primary law change. The number of seat belt citations remained elevated through December 2009. Time series analyses confirmed the significance of the July increase associated with the law change. An examination of the seat belt citations issued to Whites, African-Americans (Blacks), and Hispanics showed a significant increase in the proportion issued to Whites and a significant decrease in the proportion issued to African-Americans following the law change. The proportion of citations issued to Hispanics also declined, but not significantly. CIOT Enforcement. Monthly citation data indicated that Florida enforcement agencies decreased the intensity of their enforcement efforts immediately prior to the implementation of the new law in 2009, but increased during the 2010 CIOT mobilization. CIOT Media. Florida’s CIOT media funding declined substantially after 2006, with the largest declines occurring from 2008 to 2010. There were fewer statewide ads aired in 2009 and 2010 leading up to and following the law change, although the national CIOT ads continued to reach Florida each year. The number of documented news stories (earned media) declined from 2006 to 2008 but there was no further decline in 2009 or 2010. Similarly, the number of media events declined by about 80% from 2006 to 2008, but there was no further decline in 2009 and 2010. Earned Media: Stories Associated With the Law Change. Although there was no database of news stories associated with the upgrade, a search of the Internet identified several articles about the law change. Most articles focused on the fact that officers could now stop a car and ticket someone who was not buckled up without having to observe another offense first. Generally, the earned media coverage was in support of the law upgrade, yet warned motorists that now they could be stopped and that the fine plus other costs was near $100. Many stories mentioned the safety benefits of seat belts and primary enforcement, providing examples of both survivors and teens killed who were not wearing their belts. Many stories reported that Florida received a $35 million incentive for enacting a primary law.
Awareness and Perceptions Awareness surveys conducted at the 16 driver licensing centers measured public perceptions of seat belts, the primary belt law, and related issues. Immediately after the law change, 9 out of 10 respondents said that an officer could stop a vehicle and issue a citation simply for observing a seat belt violation. There were slight regional differences, higher in North and Central Florida (94-95%) and slightly lower for South Florida (91%). About three-quarters (77%) thought that an

v
officer should be able to stop a vehicle and ticket an occupant solely for a seat belt violation, higher in South Florida (79%) and slightly lower in North and Central Florida (76-77%). Nearly 60% of respondents thought that it was certain or very likely that one would be stopped and ticketed if they drove without buckling up. This percentage was slightly higher in the North, where the RDP was being implemented (62%), compared with Central and South Florida (about 60% in both areas). About 73% were aware of special seat belt enforcement and about 86% had heard something about seat belts or seat belt use. These percentages were slightly higher in the north and central regions than in the southern part of the State. There were slight declines in most of these awareness indices from 2009 to 2010.
Observed Seat Belt Use The figure below shows observed seat belt use as measured by 10 statewide surveys conducted from April 2006 to June 2010. There were significant gains associated with CIOT mobilizations in 2006, 2008, 2009 and 2010, and a significant gain in observed belt use associated with the primary law upgrade in 2009. In 2007, there was only post-CIOT survey that occurred in July instead of June.
Changes in Observed Seat Belt Use Associated With CIOT and Law Interventions: 2006 – 2010
75.2 77.4 77.9
84.3 80.7 81.7
80.9 87.4
79.1
85.2
50
55
60
65
70
75
80
85
90
2006 2007 2008 2009 2010
April
June
July
Post-Law Upgrade
Annual CIOT mobilizations provided an important context within which the 2009 law upgrade was implemented. In 2006, the gain in usage associated with the 2006 May CIOT campaign was 5.5 percentage points (from 75.2% to 80.7%). In 2008, the gain associated with CIOT was 4.3 points (from 77.4% to 81.7%). In 2009, the year of the law change, there was a 3-point gain associated with CIOT, which was completed about one month prior to the law upgrade. Finally, in 2010, there was a 3.1-point gain associated with CIOT under the new law environment. The primary law upgrade, effective on June 30, 2009, was associated with a gain of 4.3 percentage points, from 80.9% to 85.2%, in addition to the 3-point gain associated with the 2009 RDP/CIOT effort. Thus, the total gain from April to July was 7.3 points. This was the largest gain measured during the 5 years resulting in a post-law use rate of 85.2% in July 2009, the highest usage rate achieved in Florida at the time. By June 2010, seat belt use in Florida had increased to 87.4%. The gain experienced in 2010 was from a 6.4-percentage-point higher

vi
baseline than the estimated CIOT gain in 2009. This higher baseline was very likely associated with the law change.
Changes in Observed Seat Belt Use: Pre- and Post-CIOT, 2006 - 2010
77.4 81.7
77.9 80.9
85.2 84.3
87.4
7072747678808284868890
Post-Law
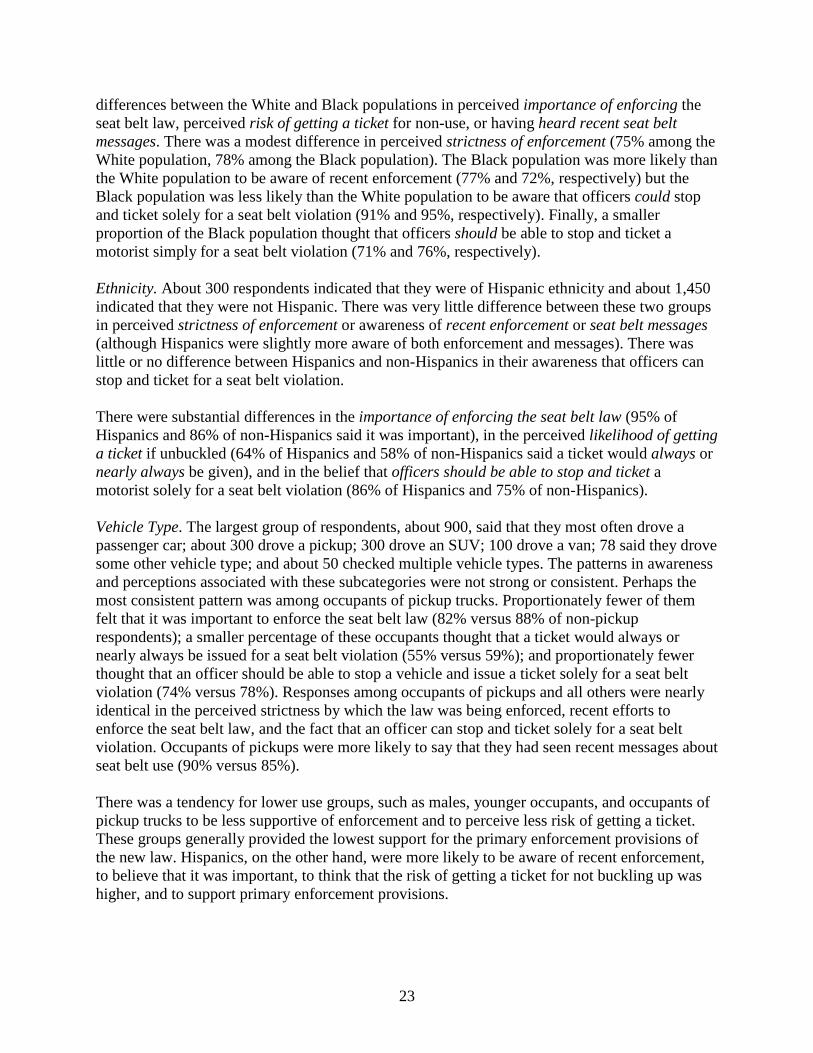
Belt use rose with the law change for all road types, all days of the week, males and females, drivers and passengers, all ages, and all vehicle types. Consistent with past primary law upgrade research, belt use increases were greatest for low-use groups including: males (+6.1 points), compared with females (+3.9 points); Blacks (+ 8.0 points), compared with Whites (+4.7 points) or Hispanics (+3.8 points); and occupants of pickup trucks (+9.1), compared with passenger cars (+4.3 points), SUVs (+4.7 points), or vans (+3.5 points). Impact was also greatest on local (collector) roads (+7.9 points) than on other roadway types.
Increases in Seat Belt Use Associated With Law Change, by Subgroup
6
4 5
8
4
5 5 4
9
5
4 4
5 6 6
0123456789
10
Pct.P
t. C
hg. i
n U
se
Gender Race/Ethnicity Age Vehicle Type Road Type
The next two figures show typical trends in Florida seat belt use from June 2008 to June 2010. The lowest-use groups nearly always responded more to both the CIOT and the law change and usage among these groups generally declined the most in between interventions.

vii
Trends in Statewide Observed Usage, by Race/Ethnicity, 2008-2010
60.0
65.0
70.0
75.0
80.0
85.0
90.0
95.0
Jun-08
Aug-08
Oct-08
Dec-08
Feb-09
Apr-09
Jun-09
Aug-09
Oct-09
Dec-09
Feb-10
Apr-10
Jun-10
Seat
Bel
t Use
(%)
White Black Hispanic
2009 CIOT and Law 2010 CIOT
Trends in Statewide Observed Usage, by Vehicle Type, 2008- 2010
60
65
70
75
80
85
90
Jun-08
Aug-08
Oct-08
Dec-08
Feb-09
Apr-09
Jun-09
Aug-09
Oct-09
Dec-09
Feb-10
Apr-10
Jun-10
Seat
Bel
t Use
(%)
Van SUV Car Pickup
2010 CIOT 2009 CIOT and Law Change
95

viii
Summary There was a significant 4.3-percentage-point increase in seat belt use immediately after Florida’s primary law upgrade from June to July 2009, which followed a 3-point gain following the May 2009 CIOT mobilization, for a total increase of 7.3 percentage points. Belt use increases were greatest for low-use groups such as males, the African-American population, younger occupants, motorists on local roadways, and occupants of pickup trucks, probably due in part to the lower baseline rates of these groups. Using April 2009 as a baseline, the net increase in usage was greatest in northern Florida, where the rural seat belt program was in progress. This large net gain (+13 points) was influenced by the fact that there was no decline in usage in the northern region from the law change to the next CIOT period. This may reflect the ongoing RDP media and enforcement effort in that region of the State. Following the primary law upgrade, more (94%) of the public knew that they could be stopped and ticketed solely for non-use of a seat belt and more than three-quarters of respondents thought that an officer should be able to stop a vehicle and ticket a non-user without first observing some other violation. Discussion Florida is the largest of a very recent group of States to enact primary law upgrades (2008-2010) and the first of this group to be evaluated. It had the second highest baseline rate (81%) in observed seat belt use of any upgrade State. Florida has a relatively high fine ($30) for failing to buckle up and with fees and court costs totals more than $90. The measured 4.3 point gain is a positive result, particularly on the heels of a 3-point gain associated with the CIOT mobilization. The gain in the northern part of the State (from April 2009 to June 2010) was nearly 13 percentage points and it was largely due to the fact that there was no decay of the gains made after the 2009 CIOT and the law change. This, in turn, may have been associated with RDP enforcement and publicity ongoing in the northern region that helped sustain the impact of the law change and CIOT from the previous year. Conclusions The conclusion of this case study is that the primary law upgrade in Florida had a significant impact on observed usage in the State that was most apparent among low-use groups.

ix
Table of Contents
I. Background ........................................................................................................................1
A. Mandatory Seat Belt Use Laws .............................................................................................. 1 B. Primary Law Upgrades........................................................................................................... 1 C. Florida’s History With SBU Laws and Observed Seat Belt Usage ....................................... 4 D. Evaluation of a Primary Law Upgrade in Florida: A Case Study .......................................... 7
1. Objectives ........................................................................................................................... 8
II. Methods ...............................................................................................................................9
A. Overview of Survey and Activity Data .................................................................................. 9 B. Observational Survey Procedures ........................................................................................ 10
1. Statewide Surveys ............................................................................................................. 10 2. Sub-Sample Observational Surveys .................................................................................. 10 3. DMV Awareness Surveys ................................................................................................. 11
III. Results ....................................................................................................................................13
A. Enforcement and Media Activity ......................................................................................... 13 1. Enforcement Activity ........................................................................................................ 13 2. Media Activity .................................................................................................................. 17
B. Awareness of Enforcement and the Law Change ................................................................ 20 1. Statewide Awareness Surveys .......................................................................................... 20 2. RDP Awareness Surveys .................................................................................................. 24
C. Changes in Observed Seat Belt Usage ................................................................................. 26 1. Statewide Observational Surveys ..................................................................................... 26 2. Trends in Usage Among Subgroups ................................................................................. 27 3. North Florida Observational Surveys (RDP) .................................................................... 37
IV. Summary and Discussion ......................................................................................................39
A. Summary .............................................................................................................................. 39 B. Discussion ............................................................................................................................ 39
References .....................................................................................................................................41
Appendices Appendix A. Florida Seat Belt Observational Form ............................................................. A-1 Appendix B. Rural Demonstration Program County Map.....................................................B-1 Appendix C. DMV Awareness Survey Form ........................................................................C-1 Appendix D. DMV Awareness Survey Results .................................................................... D-1

x

1
I. Background
A. Mandatory Seat Belt Use Laws Mandatory seat belt use laws have been associated with the greatest increases in seat belt usage in the United States, as well as in other industrialized nations. Prior to 1984, when New York enacted the first mandatory seat belt use law in the United States, no State had achieved a usage rate above 20%. Nationwide, usage in 1983 was less than 15%, based on observational surveys conducted by the National Highway Traffic Safety Administration in and around 19 major U.S. cities. From 1984 to 1992, 44 States plus the District of Columbia and Puerto Rico implemented mandatory seat belt use laws. These laws were followed by large and significant increases in seat belt usage nationwide from 14% (in 1984) to 62% (in 1992) as measured in these 19 cities.1 Early SBU Laws. A recent review for the Transportation Research Board (TRB) reported that the first SBU laws, initiated from 1984 to 1986, were associated with immediate increases of about 32 percentage points from low baseline rates of 16- to 18% (Nichols & Ledingham, 2008). During this 3-year period, increases were greatest in 8 States with primary enforcement laws. Primary laws allow officers to stop and cite motorists solely for not buckling up. Secondary enforcement laws, present in 24 States and the District of Columbia, require an officer to observe (and in some cases issue a citation for) another traffic violation before issuing a seat belt citation. Early seat belt laws appeared to affect lower-risk groups (e.g., females, adults, non-drinking drivers, and daytime motorists) more than they affected higher-risk groups (e.g., males, teens, drinking drivers, and nighttime motorists). They clearly affected observed daytime usage more than they affected usage among people actually killed or injured in motor vehicle crashes. Based on 5 multi-State studies, for example, Nichols and Ledingham (2008) reported a median 7% reduction in fatalities and a median 13% reduction in injuries associated with early seat belt laws. This was a smaller impact than would have been expected based upon the increases in observed usage and the estimated effectiveness of seat belts against fatalities, and it was consistent with findings that lower-risk occupants were often affected more than higher-risk occupants. Thus, while the impact of early laws on fatalities was significant, it likely would have been even greater if high-risk occupants had been affected as much as low-risk occupants.
B. Primary Law Upgrades From 1984 to 1992 no State upgraded to primary enforcement and, as a result, there were no within-State comparisons to estimate the impact of such an upgrade. During this period, however, cross-sectional comparisons of States with primary and secondary laws consistently showed that usage in primary law States was 10- to 15 percentage points higher than in secondary law States. Impact of Law Upgrades on Observed Seat Belt Use. In 1993, California upgraded its secondary law to allow for primary enforcement. A study by Ulmer, Preusser, and Preusser (1994) found an 1 Changes in national usage are based on a combination of 19-city surveys conducted from 1979 to 1990 and on population-weighted aggregates of annual statewide surveys conducted in 1991 and 1992.

2
18-percentage-point increase in observed usage (from 58% to 76%) in a sub-sample of 6 California cities. Annual statewide surveys conducted by the State showed a 13-percentage-point increase in observed usage (70% to 83%) from the year prior to the change to the year of the change (Bentacourt, 1992, 1993). This increase followed four years of relatively stagnant statewide usage that varied between 66% and 71%. Twenty-two upgrades have been enacted since 1993. Nichols and Ledingham (2008) examined the impact for more than a dozen of these upgrades. Based on 14 studies conducted in 10 States from 1993 to 2003, they reported that the median increase in usage was 16 percentage points, with a range of 4 to 23 points. The median increase among the last 5 law upgrades evaluated by Nichols and Ledingham was 12 points (range: 9 to 16 points). These upgrades included Alabama in December 1999 (+11 points); Michigan and New Jersey in 2000 (+15 points and +11 points, respectively); Washington in 2002 (+12 points), and Illinois in 2003 (+9 points). A sixth State, Delaware, also upgraded in 2003. While this law change was not formally evaluated, there was an 11-point gain from the year prior to the law (2002) to the year after the law (2004), as measured by the State’s annual observational surveys. From 2004 to 2007 an additional 6 upgrades were enacted. As a group, these upgrades have been associated with smaller pre-to-post gains in usage (median = 6 points). This estimate is based on the results of statewide surveys conducted the year before the upgrade and the year after the upgrade (NHTSA, 2010). These States included Tennessee in 2004 (+5 points); Kentucky and South Carolina in 2005 (+5 points and +7 points, respectively); Alaska in 2006 (+4 points); and Maine in 2007 (+6 points). Mississippi also upgraded in 2006 and experienced an 11-point increase, similar to the magnitude of gains seen in Michigan, New Jersey, Washington, and Illinois.2 Figure 1 shows the median baseline and post-law usage rates, as well as the median fine amount, for four chronological groups of States that have enacted primary law upgrades. For the fourth group (which includes Florida), post-law rates are just now becoming available. The first group, which upgraded its laws from 1993 to 1998, had the lowest median baseline rate (61%). This low rate was likely a factor in the large median gain of 12- to 16 percentage points. The median fine level for this group was $24. The median post-law rate for the second group (2000-03) was 82%, 13 points higher than its median baseline rate of 69%. This gain, which was similar to that of the first group, occurred in spite of a baseline that was 8 percentage points higher than the baseline of the first group. The median fine level for the second group was $34, more than 40% higher than for the first group. The median gain associated with upgrades in the third group, with laws implemented from 2004 to 2007, was much smaller (median gain = 6 points) than for the second group, in spite of a nearly identical baseline (68% and 69%, respectively). The median fine amount for the third group was $25, about 25% lower than that of the second group.
2 The most recent States to enact primary law upgrades (Arkansas, Florida, Minnesota, Wisconsin, and Kansas) have not been formally evaluated; most will have a full year of post-law usage data in 2010 or 2011.

3
Figure 1. Observed Use: Baseline and Post-Upgrade Rates Plus Fines for Upgrade Groups: 31993-98 (6 States); 2000-03 (6 States); 2004-07 (6 States); 2008-10 (5 States); and Florida
The most recent States to enact primary law upgrades were Arkansas, Florida, Minnesota, and Wisconsin in 2009; and Kansas in 2010. No studies of these law changes have been conducted at this point. Figure 1 shows that the median baseline use rate for this fourth group was 77% and the median fine amount was $20. If we hypothesize (based on past experience) that high baselines (and lower fines) will be associated with smaller gains, this group of upgrades could experience smaller gains than those associated with prior upgrades. With regard to Florida, the baseline is even higher than the median rate (82% versus 77%) but the fine amount is also higher ($30 versus $20). Further, an examination of fines plus other costs associated with a seat belt violation suggests that the actual costs resulting from such a violation are more than $90. This is a relatively high cost compared with other States. Thus, entering into this evaluation, it could be hypothesized that the higher baseline rate will exert a downward pressure on any gain associated with a primary law but the higher fine plus fee amount may exert an upward influence on such a gain. Usage Among High Risk Groups. Compared with studies of original SBU laws, studies of primary law upgrades have shown that they frequently affect higher risk groups at least as much as they affect lower risk groups. Upgrades have, for example, resulted in significant increases in usage among young males, drivers of pickup trucks, rural occupants, drinking drivers and occupants killed in late night crashes (Eby et al., 2002; Voas et al., 2007; and Masten, 2007). Interaction With Highly Visible Enforcement. Most recent upgrades have been accompanied by participation in nationwide enforcement mobilizations. Some of the largest impacts in recent years have been in States that have both upgraded their laws and participated in Click It or Ticket campaigns. Examples include Illinois, Michigan, and Washington (Nichols & Ledingham, 2008).
3 Note that Alabama’s law went into effect in December 1999 but was placed in Group 2; similarly, South Carolina’s law went into effect in December 2005 but was considered to have been implemented in 2006. Post-law rates (Groups 1 & 2) are based on evaluation results; post-law rates for group 3 are based on State-reported use rates.
61
69 68
77 82
73
82
74
$24
$34
$25 $20
$30
0
10
20
30
40
50
60
70
80
90
100
1993-1998 2000-2003 2004-2007 2008-2010 Florida
Perc
ent U
sage
Median Baseline Median Post-Law Average Fine

4
Enforcement has been a factor in terms of increasing seat belt use, primarily in association with May CIOT mobilizations. Florida’s past and current experience with high-visibility enforcement mobilizations is likely to be an influencing factor in terms of the gain associated with its primary law upgrade.
C. Florida’s History With SBU Laws and Observed Seat Belt Usage 1985 Through 1992. Florida implemented its initial SBU law on July 1, 1986. It was the 18th State (plus the District of Columbia and Puerto Rico) to enact such a law. At the time, 8 States had enacted laws allowing for standard (primary) enforcement procedures and 9 States (and DC) had enacted secondary laws. Like the 9 secondary-law States, Florida specifically required secondary enforcement procedures. Prior to its SBU law in 1985, Florida reported a 22% observed usage rate. After enactment, but prior to the implementation of the new law, Florida reported 28% usage and, immediately after the law was put into effect, it reported 41% usage (2nd half of 1986). In early 1987, observed use increased to 61%, then declined to about 56% later in the year. This represented a typical pattern of relatively large gains immediately after a law is put into effect, followed by declining rates associated with little or no enforcement. Figure 2 shows the end-of-year rates reported by Florida, from 1985 to 1992.4 This figure does not show the 61% peak which occurred early in 1987; it does show a slight decline by late 1987. Initial peaks in usage immediately after law implementation, followed by slight declines within 1 to 2 years, were typical patterns following SBU law enactment in early law States (1984-1992).
Figure 2. Observed Seat Belt Use in Florida and the United States From 1985 to 1992
22
41
50 47
55 53
60 57
0
10
20
30
40
50
60
70
80
1985 1986 1987 1988 1989 1990 1991 1992
Perc
ent U
se
Florida U.S.
Secondary Law Period
4 These estimates were obtained by examining historical records of statewide usage rate results reported to NHTSA, beginning in 1985 by all States that enacted SBU laws.

5
State-reported usage increased from 1988 to 1989 (+8 points) and again from 1990 to 1991 (+7 points), when Florida participated in the national 70% by ’92 program, the first nationwide enforcement mobilization -- also called Operation Buckle Down. During most of this early law period, Florida’s use rate was slightly higher than the national use rate, as measured by NHTSA’s 19-city survey.5 That gap declined, however, as more states enacted seat belt laws and participated in the national enforcement effort. 1992 to 2002. During the next 7 years (1993 to 1999), a period during which there were 8 primary law upgrades across the United States, observed seat belt use in Florida remained relatively unchanged, ranging from 59% to 63%, at or slightly below the national use rate. During the first two full years of Operation ABC (1998 and 1999), which constituted the second national seat belt enforcement program, Florida’s usage rate was substantially below the U.S. rate (see Figure 3). Then, from 2000 to 2002, when States in the Southeast (Region 4) of the United States began participating in Operation ABC mobilizations; when Region 4 mounted its own CIOT mobilization (in 2001); and when Florida participated in a Model Seat Belt Enforcement Program (in 2002), usage in Florida increased substantially, reaching 75% in 2002, just prior to the start of the national Click It or Ticket program. Operation ABC was sponsored by the Air Bag & Seat Belt Safety Campaign (AB&SBSC) and NHTSA with primary implementation and monitoring responsibilities funded by AB&SBSC, using private sector funds. It began with a late summer campaign in 1997 and then twice-annual campaigns each year thereafter. By 2003, when it was renamed the National CIOT campaign, more than 40 States were using Section 157 Innovative Grant funds to participate in these mobilizations. Beginning in May 2001 Florida participated in NHTSA’s Region 4 (southeast) regional CIOT mobilization, followed by participation in NHTSA’s Model Seat Belt Enforcement Program in 2002, and continuing with participation in subsequent Operation ABC and national CIOT mobilizations. Florida received Innovative Grant funds for such participation (authorized by Section 157 of TEA-21, the Transportation Equity Act for the 21st Century) and they were used nearly exclusively for highly visible enforcement, including paid advertising. During this timeframe, usage in Florida increased substantially, essentially eliminating the gap between usage in Florida and across the United States.
5 During this period from 1984 to 1992, when the national use rate derived from the 19-city survey, the sources for such information were as follows: 1983 use rates (Perkins, Cynecki, & Goryl, 1984); 1984 use rates (Goryl & Cynecki, 1985); 1985 use rates (Goryl, 1986); 1986 use rates (Goryl & Bowman, 1987); 1987-88 use rates (Bowman & Rounds, 1988 and 1989); and 1989-91 use rates (Datta & Guzek; 1990, 1991, and 1992).

6
Figure 3. Observed Seat Belt Use in Florida and the United States From 1993 to 2002
62
61
59
63
60 59 59
65
70
75
50
55
60
65
70
75
80
1993 1994 1995 1996 1997 1998 1999 2000 2001 2002
Per
cent
Use
Florida U.S.
HVE mobilizations in Florida
Prior to 2000, Florida generally preferred a “softer” enforcement message, preferring slogans such as Thumbs Up and Operation Beltway, rather than the stronger enforcement message of Click It or Ticket. In addition, Florida did not use checkpoints or enforcement zones, generally preferring to use saturation patrols or regular traffic patrols. Messaging began to get “harder” after 2000 when Florida began participation in HVE efforts and, as the Figure 3 suggests, there were subsequent gains in observed use, which increased by about 16 percentage points from 1999 to 2002. Beginning in 2003, national Operation ABC mobilizations became national CIOT mobilizations and the number of States conducting HVE under Section 157 of TEA-21 more than doubled, from less than 20 to more than 40. Associated with this change, U.S. seat belt use increased by 4 percentage points, from 75% in 2002 to 79% in 2003, the second largest one-year gain since a National Occupant Protection Use Survey (NOPUS) was implemented in 1994. Florida’s observed use rate increased in 2004 as well, but usage declined slightly in 2005 following four years of steady increases (from 59% to 76%). In 2006, Florida redesigned its statewide survey and usage was measured at 81%, 7 points higher than in 2005. This was also the final year of a two-year, NHTSA region-wide, Buckle Up in Your Truck (BUIYT) program. By 2008, the official observed use rate in Florida was 82%, nearly identical to the national use rate of 83%. This was the last official observed rate prior to enactment of Florida’s primary law upgrade (see Figure 4).

7
Figure 4. Observed Use in Florida and the United States During the CIOT Period: 2003-08
In Summary, Florida is among 5 States to recently upgrade their seat belt laws to primary enforcement. As a secondary law State, Florida reached 82% observed use, similar to the U.S. rate. Gains in Florida were associated with eight years of participation in HVE programs such as Operation ABC (national), Operation Beltway (Florida), Click It or Ticket (national and in Florida) and, more recently, Buckle Up in Your Truck and Rural Demonstration Programs. Entering into its primary law phase, Florida had a high baseline usage rate, second only to Washington among primary-law upgrade States; it has had considerable experience with HVE programs; and it has a relatively high fine (plus fee) amount.
D. Evaluation of a Primary Law Upgrade in Florida: A Case Study Florida passed a primary enforcement seat belt bill (SB 344) on April 29, 2009, and the Governor signed that bill into law on May 6, 2009, with an effective date of June 30, 2009. The new law created an uninterrupted change from secondary enforcement of seat belt violations to primary enforcement. Florida offers an interesting case study opportunity for a number of reasons. First, there is considerable historical data regarding Florida’s past usage rates. Second, because Florida has participated regularly in CIOT mobilizations and because the State has central repositories for seat belt citations, there is considerable data available to describe past and present activities related to increasing seat belt use. Finally, Florida’s high baseline rate, combined with its high fine (plus fee) amount provides a unique situation from which to implement a primary law. This case study was conducted under Task C.4.14 “Optional Data Collection for Case Studies for the 2009 CIOT Mobilization” listed in Contract DTNH22-08-R-00145 titled “Evaluation of the 2009 and 2010 CIOT High-Visibility Seat Belt Enforcement Mobilizations.”
73
76 74
81 79
82
65
70
75
80
85
90
2003 2004 2005 2006 2007 2008
Perc
ent U
se
Florida U.S.
CIOT Mobilization Period

8
1. Objectives The primary objective of this case study was to identify changes in seat belt usage across Florida associated with the change from secondary to primary enforcement. This included magnitude and timing of changes in usage, and changes by driver age, gender, race or ethnicity, vehicle type, road type, and area of the State. A second objective was to determine the amount and type of media and enforcement that accompanied both the old law and the law change. A third objective was to examine changes in awareness and perceptions relative to the new law and its enforcement. Specific questions to be addressed included:
• Was there a change in observed seat belt use associated with the change from secondary to primary enforcement? If so, what was the magnitude of this change?
• Were there differential changes in belt use or attitude and awareness associated with the law change with regard to variables such as race and ethnicity; urban versus rural driving environments; gender; age; and vehicle type?
• Were drivers aware that they could be stopped and ticketed solely for non-use of their seat belts? Were they receptive towards the new law?
• Were there changes in the number of seat belt citations issued and shifts in the proportion of tickets issued to various sub-groups associated with the law change?

9
II. Methods
A. Overview of Survey and Activity Data Representative statewide observational surveys at 150 sites before and after May mobilizations measured changes in seat belt use from 2006 to 2010. There was an additional statewide survey in July 2009, immediately after the upgrade went into effect. In addition to these statewide observational surveys, smaller 45-site surveys were conducted in the northern part of the State as part of a Rural Seat Belt Demonstration Program (RDP). These surveys were conducted in February, March, June, October, and November 2009 and in June 2010. Florida gathered public awareness surveys to monitor drivers’ awareness and perceptions of the seat belt law and its enforcement at 16 Department of Motor Vehicle (DMV) licensing centers. These one-page, paper-and-pencil surveys were conducted in July 2009, immediately after the law change. Because the upgrade was not expected, there was no opportunity to conduct such a survey prior to the law change. As was the case with observational surveys, a subsample of (6) DMV licensing centers was selected for awareness surveys in the northern part of the State as part of the State’s RDP evaluation. These surveys were conducted at the same time the RDP observational surveys were conducted (i.e., February, March, June, October, and November 2009 and June 2010). Statewide indices of media and enforcement activity that were part of Florida’s participation in annual statewide Click It or Ticket mobilizations were used to gauge the level of media and enforcement activity for three years prior to the law change (2006-2008); the year of the change (2009), and the year following the change (2010). Each year, all of the States enter these data into NHTSA’s Mobilizations, Crackdowns, and Sustained Enforcement database. These data include: dollars spent for paid media; number of ads run on radio and television; number of news stories run on radio and television; number and percent of total enforcement agencies participating in CIOT mobilizations; and number of citations issued for seat belt and child passenger safety violations. Researchers also examined activity associated with the four rural mobilizations conducted in north Florida prior to the law change (March and May 2009) and after the change (November 2009 and May 2010). Data were examined in order to accurately describe the statewide level of non-legislative activity immediately preceding, accompanying, and following the law change. Florida uses a uniform traffic citation (UTC) system routing all traffic citations issued by law enforcement through the Florida Department of Highway Safety and Motor Vehicles. UTC data for seat belt violations from January 2005 to January 2010 identified trends in such citations issued over time by relevant variables such as age, race, and ethnicity, and urban versus rural conditions. The objective was to identify any shifts in enforcement activity associated with the law change.

10
B. Observational Survey Procedures
1. Statewide Surveys Florida conducted statewide seatbelt surveys before and after CIOT (April and July) in 2006, 2008, 2009, and 2010 and a statewide survey in September 2007, three months after the end of the CIOT. The results of these surveys provide the primary data for evaluating the impact of the Florida primary law on observed usage. Each of these surveys met the requirements NHTSA set for measuring statewide seat belt use, under TEA-21. The design of the surveys was as follows.
2. Sub-Sample Observational Surveys Six waves of 45-site surveys were conducted in north Florida from February 2009 to June 2010 as part of an evaluation of Florida’s RDP. These surveys were conducted according to uniform procedures in February, March, June, October, and November 2009 and in June 2010. They were not statistically representative probability samples of the 36-county region that was targeted by the RDP. Rather, they provided an index of seat belt usage that was used to estimate change in the targeted area from one wave to another and from just prior to the law upgrade (March and June 2009) to just after the upgrade (October and November 2009). Selected counties were distributed across the targeted area, from the northwest to the northeast (see map of RDP targeted area in Appendix B). Observation counties included Santa Rosa, Walton, Jackson, and Gadsen in the northwestern part of the State; and Suwanee, Columbia, Dixie, Putnam, and Marion in the northeast. Only Marion County was included both the statewide and the RDP samples. Once the counties were selected for observation, 5 sites within each county were randomly selected in a manner that included both secondary and local, rural roads. Interstate highways were excluded. Observational procedures followed the parameters and guidelines described for statewide surveys. RDP surveys were generally completed within five consecutive days, with each observation period lasting 60 minutes. The data collection form used for these surveys is the same as that used for the statewide surveys (Appendix A). Data collected from rural observational surveys were entered into an SPSS database for organization and analysis. Changes in usage were examined from baseline to post-RDP for waves 1 and 3 and from baseline to post-CIOT for waves 2 and 4. Changes in odds of use (i.e., seat-belt-used/seat-belt-not-used) were tested for significance using Pearson’s Chi-square. Changes were examined wave to wave for the total group and for various subgroups (e.g., gender, age, race, vehicle type, roadway type, and region).

11
3. DMV Awareness Surveys Statewide. The Florida DMV conducted awareness surveys in July 2009, immediately after the primary law had been put into effect, and in July 2010, one full year after the law was implemented. Sixteen DMV license stations distributed one-page, pen-and-paper surveys to motorists waiting for service. These surveys included questions about the new primary seat belt law. These questions asked whether or not an officer could stop a vehicle based only upon a seat belt violation and whether or not an officer should be able to stop a vehicle based only on a seat belt violation. Appendix C has a copy of the survey form. Six of the licensing stations were located in primarily urban counties and 10 were located in more rural counties (6 RDP target locations and 4 RDP control locations). Each licensing center was asked to collect up to 200 surveys, with a goal of 1,600 surveys collected across all 16 sites. The following DMV centers were located in urban counties (cities in parentheses): Leon (Tallahassee); Duval (Jacksonville); Orange (Orlando); Pinellas (Tampa); Dade (Miami); Palm Beach. The remainder were located in the following rural counties (and cities): Columbia (Lake City); Dixie (Cross City); Gadsden (Quincy); Hardee (Wauchula); Highlands (Sebring); Jackson (Marianna); Okeechobee (Okeechobee); Polk (Lake Wales); Putnam (East Palatka); and Santa Rosa (Milton). There were 8 centers in the northern part of the State and 8 centers in the central and southern part of Florida. The initial wave of surveys was conducted immediately after the effective date of the new primary law in 2009 (following the July 4th holiday weekend). There was not sufficient lead time to conduct a survey prior to the law change. In general, key questions were:
• Do drivers know that Florida has a primary enforcement law? • Are drivers receptive towards the seat belt law in Florida? • Did awareness of primary enforcement vary relative to race or ethnicity, age, gender,
vehicle type, or urban versus rural areas? • Did awareness of the law increase or decline in the 12-month period after the law
change? • Were drivers aware of special seat belt enforcement efforts and seat belt messages?
What were the media sources? • Did drivers’ perception of risk of getting a ticket for not buckling up change?
The significance of changes in mutually exclusive, dichotomous responses (from 2009 to 2010) was tested by means of 2x2 contingency tables (comparing one period to another) and Pearson’s chi-square. Rural Demonstration Program (RDP). Six of the 16 licensing centers also conducted awareness surveys as part of the RDP. Originally, these surveys were scheduled for February, March, June, and November 2009, and June, 2010 (one baseline and 4 post-mobilization surveys). This schedule was modified to include a sixth survey, conducted in October 2009, after the primary law was in effect but prior to the November RDP mobilization.

12
These rural surveys were conducted in the following counties and cities (cities in parentheses): Santa Rosa (Milton); Jackson (Marianna); Gadsden (Quincy); Dixie (Cross City); Columbia (Lake City); and Putnam (East Palatka). The 4 central Florida counties (and cities) that participated in these surveys were: Polk (Lake Wales); Hardee (Wauchula); Highlands (Sebring); and Okeechobee (Okeechobee) served as control counties for the RDP evaluation that overlapped with this case study. The public awareness survey forms used at these RDP sites were identical to the statewide survey, except that those conducted before July 2009 did not include primary enforcement questions. As with the statewide surveys, the post-law surveys, conducted in October 2009, November 2009, and June 2010, sought to determine if:
• Drivers knew that the State of Florida had a primary enforcement law; • Drivers were receptive towards the primary law; and • Whether or not awareness of the law varied relative to race or ethnicity, age, gender,
vehicle type, urban versus rural areas. • Drivers were aware of special seat belt enforcement efforts and seat belt messages?
What were the media sources? • Drivers’ perception of risk of getting a ticket for not buckling up changed?
Changes in mutually exclusive, dichotomous responses to questions were tested by means of Pearsons chi-square to determine significance of any shifts.

13
III. Results
A. Enforcement and Media Activity In order to understand the environment in which the primary law upgrade occurred, it is important to examine the enforcement and media activity about seat belt use that occurred before, during, and after the law change. Florida provided reasonably complete media and enforcement data associated with the statewide May CIOT mobilizations and the 4 RDP waves in northern Florida including monthly UTC data on seat belt citations from 2005 to January 2010.
1. Enforcement Activity
a. CIOT Enforcement Based on four years of participation in CIOT mobilizations prior to the law change (2006 to 2009), and one year after the law change (2010), Florida reported a relatively high percentage of total enforcement agencies participating in the mobilizations. Table 3 summarizes data reported to NHTSA’s Mobilization and Crackdown activity data system. An average of 75% of total Florida law enforcement agencies participated in the 5 years of mobilizations, with increases in 2009 and 2010. This compares with an average of about 47% across the United States.
Table 3. Florida Indices of CIOT Enforcement Activity: 2006-2010
Enforcement Indices
May 2006
May 2007
May 2008
May 2009
May 2010
FL Ave
U.S. Ave**
Agency Participation (% of all agencies)
82.3 36.3 80.7 87.0 90.8 75.4 46.6
Hours Worked (# per 10K population)
n/a 225 274 36 21 139 36
Checkpoints Conducted (# per 1 million population)
0 0 0 0 0 0 28.0
OP Citations (SB + CR) (# per 10K population)
18.8 15.8 20.0 14.0 34.0
20.5 22.6
Florida averages are generally for five years (2006 to 2010); U.S. averages are for four years (2006 to 2009). **U.S. data were not available for 2010 at this time.
States also reported the number of officer hours expended by participating agencies on mobilization activity. These are imperfect indices of enforcement level because of reporting differences between the States. They can provide a within-State index of activity, however, to the extent that a State uses consistent reporting criteria over time. Over the 4-year period, Florida reported an average of 139 hours worked per 10,000 residents, with large declines in 2009 and 2010. Across the United States, the 4-year average was 36 hours per 10,000 residents. Within Florida there was a dramatic decline from 2008 to 2009, the year of the law change. It is not known whether this represents a real decline or a change in agency reporting.

14
States reported the use of checkpoints as an enforcement approach. Prior to July 2010, Florida did not conduct seat belt checkpoints during CIOT mobilizations in part due to its status as a secondary law State. Florida did not conduct checkpoints during the 2010 mobilization after enactment of primary enforcement. By comparison, nationally, there was an average of about 28 checkpoints per million residents conducted during the two-week CIOT mobilizations. The occupant protection citation rate is the most commonly used index of enforcement intensity. This is the number of seat belt and child passenger safety citations issued per 10,000 residents over a two-week CIOT enforcement period. Florida issued an average of 20.5 OP citations from 2006 to 2010, with a decline from 2008 to 2009 (from 20 to 14 citations/10K) and a substantial increase in 2010 (from 14 to 34 citations/10K). The 4-year average across the United States was 22.6 citations/10K, similar to the rate in Florida. In summary, there was a consistently high percentage of agencies participating in annual CIOT mobilizations in Florida. There was a decline in occupant protection citations from 2008 to 2009, which was followed by an increase with the 2010 CIOT. Florida did not conduct seat belt checkpoints.
b. Annual OP Citations (UTC Data) Figure 5 shows the annual citation data (State, county, and local law enforcement agencies) for the 5 years from 2005 to January 2010. These data show an annual peak in citations each May, associated with May CIOT mobilizations. Prior to the law change, these peaks gradually declined, with the largest decline occurring in May 2009. There is a large additional increase in citations in July 2009, immediately following the law change. The general decline in May mobilization UTC citations from 2008 to 2009 is consistent with State reported hours worked and citations, although the State reported data did not show a decline from 2007 to 2008 as the UTC data did. Also, because the CIOT data were specific to May, they did not show the previously unseen increase in citations in July 2010. The monthly data in Figure 5 show an elevated number of citations through October 2009 compared with same period in 2008. By year’s end, however, citations had declined to nearly the same level as in December 2008. Thus, the law change appears to have resulted in a brief (4-month) increase in seat belt citations, compared with prior years. This increase diminished to near normal levels by January 2010. Table 4 shows the results of an autoregressive integrated moving average (ARIMA) analysis of these data. The ARIMA indicates that there was a significant upward change in the series associated with the implementation of the primary law (t = 4.305; p < 0.0001).

15
Figure 5. Citations Issued for OP Violations in Florida, by Month: 2005-2009
re 6. Citations Issued for OP Violations in Florida, by Month: 2005-2009 Law Change _
2005 2006 2007 2008 2009
Law Change _
Table 4. Parameters of Time Series Analysis of Florida OP Citation Data (2005-2009) (interruption @ July 2009, with July data included in post-law period)
Parameter Estimate Std. Error t
Approx. Signif.
Non-Seasonal Lags AR1 .761 .067 11.442 .000 Seasonal Lags Seasonal AR1 .891 .043 20.912 .000 Regression Coefficients VAR00001 12993.706 3017.987 4.305 .000 Constant 14169.538 8587.081 1.650 .104
Melard's algorithm was used for estimation.
c. OP Citations by Subgroup (UTC Data) ARIMA analyses were also conducted on citation data for various subgroups of motorists and conditions. Analyses by age group (under 18, 18-20, 21-34, 35-64, and 65+); race and ethnicity (White, African-American, and Hispanic); and Urban versus Rural areas (as designated by rural-urban continuum [RUC] codes) found significant increases in ticketing associated with the law change for all subgroups except drivers under 18. The increase for this relatively small group of young drivers was not statistically significant. For each group, there was a typical peak in citations associated with the May CIOT mobilization and an atypical peak in citations in July 2009, one month after the new law went into effect. The majority of tickets were issued to motorists 21 to 64 years old, to Whites, and to motorists in urban areas. Concern has frequently been expressed that a primary law upgrade could result in greater ticketing of minorities. As in other States (e.g., in Louisiana, Georgia, Illinois, Mississippi, South

16
Carolina, and Tennessee) where this hypothesis has been studied, it was not supported by the monthly citation data in Florida. Figure 6 shows the monthly proportions of OP citations issued to Whites, Blacks, and Hispanics from January 2005 to December 2010. White drivers received the greatest proportion of seat belt citations across all years. Over time, there was a slight downward trend in citations among Whites and a slight upward trend in citations among those in the Black population, possibly associated with increased usage among Whites and decreased usage among the Black population. This trend was reversed following implementation of the primary enforcement legislation. ARIMA analyses of these data found a significant increase in the proportion of tickets issued to Whites (t = 2.784; p = 0.007) and a significant decline in the proportion of tickets issued to the Black population (t = -2.428; p = 0.018). The results for the Hispanic population did not reach statistical significance (t = -1.385; p = 0.172).
Figure 6. Monthly Proportion of OP Citations by Race/Ethnicity
Primary law upgrade --->
d. RDP Enforcement Activity Table 5 shows that, in the 36 northern counties where the RDP was conducted, there was an increase in enforcement activity in 2009, from March (Wave 1) to May (Wave 2), as measured by agency participation, hours worked, checkpoints conducted, and citations issued. This increase was measured just prior to the effective date of the law upgrade and it likely resulted from Florida “gearing up” its RDP effort. Activity increased again in November, after the law went into effect, as indicated by 3 of the 4 indices (hours, checkpoints, and citations). Most indices (all except checkpoints) suggested lower levels of activity during the one-week RDP waves than during CIOT, which targeted the entire State for two weeks. Finally, Wave 4 of the RDP took place in May 2010, one year after the new law went into effect. As with the previous

17
May mobilization there was an increase in agency participation and a substantial increase in citations issued. Thus, there was generally greater enforcement in the RDP area after the primary law upgrade than in the months prior to the upgrade. In fact, looking at the average of the two RDP waves conducted prior to the upgrade and the two waves conducted after the law change, every index of enforcement increased after the primary law was in effect. This may have resulted from increased emphasis on the RDP effort or the environment created by the new law.
Table 5. Indices of RDP Enforcement Levels in 2009 and 2010
Enforcement Indices
W1 Mar 2009
W2 May 2009
W3 Nov 2009
W4 May 2010
Pre-Law Ave
W1&W2
Post-Law Ave
W3&W4 Agency Participation
(% of all agencies in North) 49.2 96.7 54.2 98.3 73.0 76.3
Hours Worked (# per 10K population)
16.4 21.9 44.2 28.1 19.2 36.2
Checkpoints Conducted (# per 1 million population)
0 6.8 21.2 2.7 3.4 12.0
OP Citations (SB + CR) (# per 10K population)
5.8 7.5 21.9 70.4 6.7 46.2
2. Media Activity
a. CIOT Media
Table 6 and Figure 7 summarize the various indices of paid and earned media associated with CIOT from 2006 to 2009 (4 pre-law years), and in 2010 (the first full post-law year). Each of these indices declined precipitously from 2006 to 2009 and the number of news stories (as reported by Florida) continued to decline in 2010. Per capita spending on paid media was much higher than the national average in 2006 and 2007; and was below the national average from 2008 to 2010. As a result, the number of paid ads also declined by about 60%, from well above the national average in 2006 to about one-quarter of the national average in 2010. Thus, these two indices of advertising intensity suggest a sharp decline prior to the law change. Each year, NHTSA airs national CIOT advertising that reaches all States across the country. With regard to earned media, the number of news stories declined from 105 per million residents in 2006 to between 34 and 38 stories per million residents in 2008, 2009, and 2010. There was a large decline in the number of news events associated with each mobilization from 2006 (about 5 events per million residents) to 2007 (about 0.5 events per million residents). There were slight increases in 2009 and 2010 but the number of events remained below the national average. Thus, as with paid media, the indices of earned media show declining publicity for CIOT prior to the law change and low levels after it.

18
Table 6. Florida and U.S. Indices of CIOT Media Activity: 2006-2010
CIOT
Media Indices
May 2006
May 2007
May 2008
May 2009
Pre Law
Average
U.S.
Average
May 2010
Media $ Spent (per capita) $0.12 $0.11 $0.08 $0.04 $0.09 $0.05 $0.04
Paid Ads Run (per 10K pop.) 4.6 n/a 2.8 1.9 3.1 8.8 2.2
News Stories (per 1 mill. Pop.) 105 n/a 34 38 59.1 69.0 39
News Events (per 1 mill. Pop.) 4.9 0.5 1.0 1.1 1.9 1.9 1.3
Figure 7. Change in Indices of CIOT Media Activity Relative to 2006 Levels
0.00
0.20
0.40
0.60
0.80
1.00
1.20
2006 2007 2008 2009 2010
Leve
l Rel
ativ
e to
200
6
Media $
Paid Ads
Stories
Events
Law Change
b. RDP Media
Paid Media and Ad Levels. During each of the three waves of the RDP implemented in 2009, Florida spent approximately half as much per capita in northern Florida as it did on CIOT per capita statewide. Still the RDP provided three additional waves of publicity regarding seat belt usage and enforcement to residents of north Florida and each wave produced several times more ads per 10,000 residents than did the CIOT media effort. This higher yield in RDP ads is likely associated with the less expensive media markets in the northern part of the State, compared with the markets in central and south Florida. Waves 1 and 2 were implemented prior to the law change, with Wave 2 preceding the upgrade by about one month. Wave 3 was implemented in November 2009 and was preceded and followed by observational and awareness surveys. Wave 4 was implemented in May 2010, just prior to the 2010 CIOT mobilization.

19
Table 7. Florida Indices of RDP and CIOT Media Activity: 2009-2010
RDP Media Indices
Mar 2009
May 2009
Nov 2009
2009 Average
2009 CIOT
May 2010
Media $ Spent (per capita)
$0.05 $0.04 $0.03 $0.04 $0.09 n/a
Paid Ads Run (per 10K pop.)
15.1 6.9 6.4 9.5 3.1 n/a
News Stories (per 1 mill. Pop.)
11.7 n/a 27.4 17.9 59.1 21.4
News Events (per 1 mill. Pop.)
2.7 1.4 1.9 2.0 1.9 2.7
May 2010 post-buy is not complete as of this time Earned Media: Stories and Events. The number of reported news stories associated with RDP waves in 2009 increased over time, possibly affected by the law change in June. No May media expenditure data were available at the time of this report. However, the reported number of news events declined by nearly 50% from March 2009 to May 2009. Most stories focused on the RDP enforcement activity, but some may have incorporated the law change into their messaging. The November 2009 RDP had slightly lower media expenditures, compared with May, but a similar number of ads (6.4 per 10,000 residents). The number of news events increased by about one-third to 1.9 per million residents. Finally, the May 2010 wave, which occurred nearly one year after the law change resulted in about 21.4 news stories per million population and about 2.7 news events per million population. Although the paid media dollars and number of ads are not available at this time, it appears that the earned media (news stories and news events) was somewhat greater after the law change than before the law change.
c. Earned Media Associated with the Law Change Earned Media: Stories Associated with the Law Change. There was no formal reporting of media events or news stories associated with the primary law upgrade. A search of the internet identified a substantial number of articles that discussed the law change. Most of these articles focused on the fact that officers could now stop a car and ticket someone who was not buckled up, without having to observe another offense first. The information found on the web came from news outlets and websites of organizations like the Florida Highway Patrol, legal firms, and an Interstate 4 Information Center. Generally, the messaging was supportive of the new law; warned motorists that they can now be stopped; pointed out that the fine plus other costs is near $100; mentioned the safety benefits; provided examples of both survivors and teens killed; and noted the $35 million incentive Florida received for enacting a primary law.

20
B. Awareness of Enforcement and the Law Change
1. Statewide Awareness Surveys
a. July 2009 Post-Law Survey
Awareness surveys conducted at the 16 driver licensing centers measured awareness and driver perceptions (Table 8). Immediately after the law change, 9 of 10 (94%) respondents said that an officer could stop a vehicle and issue a citation simply for observing a seat belt violation. That was the highest level of awareness for any of the issues queried. This perception was highest in Central Florida (95.1%); next highest for North Florida (93.9%); and lowest for South Florida (90.7%). A strong majority (77%) thought that an officer should be able to stop a vehicle and ticket an occupant solely for a seat belt violation: 78.8% in South; 76.4% in North; 77.0% in Central Florida. These are simple (unweighted) averages of the values at each site. Thus, each site had equal representation regardless of number of responses at that site and regardless of the number of sites in a particular region. Just over 59% of respondents thought that they would always or nearly always be stopped and ticketed if they drove without buckling up. This percentage was slightly higher in the north, where about 62% responded that a ticket would always or nearly always be issued, compared with the south and central regions (about 60% and 56%, respectively). About 73% were aware of special seat belt enforcement and about 86% had heard something about seat belts or seat belt use. These percentages were generally lower in the southern region, compared with the northern and central regions, which had higher and nearly equal levels. In summary, the results of this statewide survey indicate that more than 9 out of 10 respondents were aware that an officer could stop and ticket solely for a seat belt violation and nearly 8 out of 10 supported such action.
Table 8. Statewide Post-Law Perceptions Regarding Seat Belt-Related Issues: July 2009
Issue/Perception State- Wide
North FL
Central FL
South. FL
It Is Important to Enforce the SB Law (yes) % 87.5% 88.4% 84.3% 91.5% N 1,650 772 557 321
Chance of Getting Stopped (always or nearly always) % 59.2% 61.6% 55.9% 59.9% N 1,105 535 369 201
Saw or Heard About Enforcement (yes) % 72.6% 73.9% 74.8% 65.1% N 1,365 644 495 226
Saw or Heard About Seat Belts (yes) % 85.5% 85.9% 86.2% 83.1% N 1,608 750 568 290
Officer Can Stop Solely for SB Violation (yes) % 93.7% 93.9% 95.1% 90.7% N 1,743 814 617 312
Officer Should Be Able to Stop for SB Violation % 77.0% 76.4% 77.0% 78.8% N 1,429 659 503 267

21
b. Change in Awareness/Perceptions (July 2009 to June 2010) Table 9 and Figure 8 show statewide change in awareness and perceptions from July 2009 to June 2010. There were no significant shifts in perceived importance of enforcing the seat belt law (about 88% felt that it was either very or somewhat important) or in the perceived likelihood of receiving a ticket if one rode unbuckled (57 to 59% thought that a ticket was either very or somewhat likely). Over this time there were modest but highly significant declines in awareness of special enforcement efforts (down 5.6 points) and seat belt messages (down 6 points). There also were declines in awareness that an officer can stop a vehicle solely for a seat belt violation (down 4 points) and that an officer should be able to stop a vehicle solely for a seat
Table 9. Change in Awareness/Perceptions From July 2009 to June 2010
Issue/Perception 2009 2010 Change Signif. It Is Important to Enforce the Seat Belt Law % 87.5% 87.6% +0.1 pts 0.932
N 1,885 1698 Chance of Getting Stopped (for SB Viol) Is High % 59.2% 56.9% -2.3 pts 0.167
N 1,865 1687 Saw/Read/Heard About Special Enforcement % 72.6% 67.0% -5.6 pts 0.0003
N 1,881 1691 Saw/Read/Heard Something About Seat Belts % 85.5% 79.5% -6.0 pts <0.0001
N 1,881 1690 Officer Can Stop Vehicle Solely for SB Violation % 93.7% 89.7% -4.0 pts <0.0001
N 1,860 1672 Officer Should Be Able to Stop for SB Violation % 77.0% 70.3% -6.7 pts <0.0001 N 1,855 1669
All significance tests were based on 2x2 chi-square analyses with df = 1.
Figure 8. Post-Upgrade Awareness, Perceptions and Opinions About Seat Belt Issues*
88
59 73
86 94
77 88
57 67
80 90
70
0102030405060708090
100
Important Risk of Ticket Special Enforce Seat Belts Can Stop Should Stop
Perc
ent o
f Res
pond
ents
July-09 June-10
*Figure 8 Legend : Important = It is important to enforce the seat belt law; Risk of Ticket = If one drives unbuckled the always or nearly always will receive a ticket; Special Enforce = saw or heard about special enforcement of seat belt law in past 30 days; Seat Belts = saw or heard something about seat belts in the past 30 days; Can Stop = an officer can stop a vehicle and issue a ticket for a seat belt violation; Should Stop = an officer should be able to stop a vehicle and issue a ticket solely for a seat belt violation.

22
belt violation (down 6.7 points). Some of these declines in awareness may have been associated with lower media levels leading up to and immediately following the upgrade. Two key indices of enforcement, agency participation in mobilizations and CIOT citation rate, increased from the 2009 CIOT to the 2010 CIOT.
c. Awareness by Subgroup (July 2009) Awareness and perceptions varied by subgroup after the 2009 CIOT and the primary law upgrade but the patterns were not consistent for all of the key questions. Following is a brief summary of these differences. Appendix D contains complete tables and figures. Gender. The largest differences between males and females were in response to the perceived importance of seat belt law enforcement (82% of males versus 92% of females said that it was important), perceived risk of getting a ticket if one rode unbuckled (55% of males versus 63% of females thought one would always or nearly always get a ticket), and the belief that an officer should be able to stop a vehicle and issue a ticket solely for a seat belt violation (73% of males versus 81% of females held this belief). There was very little difference between males and females in the perceived strictness of enforcement (76% of males and 77% of females thought enforcement was at least somewhat strict), being aware of recent seat belt enforcement (73% and 72%, respectively), aware of recent seat belt messages (85% and 86% respectively), or the perception that an officer could stop and ticket for failure to buckle up (94% each). Males were modestly less supportive of enforcement and less likely to think that a ticket would be issued compared to females. There were very few differences regarding level of enforcement or publicity or of the fact that an officer could stop a vehicle and issue a ticket solely for a seat belt violation. Age. Younger respondents (under 40) were generally less aware and supportive of enforcement than older respondents (40 and older). They were less likely to feel that enforcement of the seat belt law was important (86% versus 89%, respectively); that the law was being strictly enforced (75% versus 78%); that a ticket would be likely if one did not buckle up (56% versus 63%); to be aware of enforcement (72% versus 74%) or aware of seat belt messages (83% versus 88%); to be aware of the ability of an officer to issue a ticket solely for a seat belt violation (93% versus 95%) or to express support for that ability (73% versus 81%). The differences were modest, except for the perceived risk of getting a ticket if one rode unbuckled (7 point difference) and the belief that an officer should be able to stop a vehicle and issue a ticket solely for a seat belt violation (9 point difference). Race. This summary looks only at differences between the White and Black populations, which were the two largest racial groups (about 1,175 White respondents about 380 Black respondents). The number of Asians and Native Americans was small (about 60 and 10, respectively) and the results were highly variable. There was a reasonably large group of about 200 “Other” respondents but the makeup of that group was not easily defined. There were very few
23
differences between the White and Black populations in perceived importance of enforcing the seat belt law, perceived risk of getting a ticket for non-use, or having heard recent seat belt messages. There was a modest difference in perceived strictness of enforcement (75% among the White population, 78% among the Black population). The Black population was more likely than the White population to be aware of recent enforcement (77% and 72%, respectively) but the Black population was less likely than the White population to be aware that officers could stop and ticket solely for a seat belt violation (91% and 95%, respectively). Finally, a smaller proportion of the Black population thought that officers should be able to stop and ticket a motorist simply for a seat belt violation (71% and 76%, respectively). Ethnicity. About 300 respondents indicated that they were of Hispanic ethnicity and about 1,450 indicated that they were not Hispanic. There was very little difference between these two groups in perceived strictness of enforcement or awareness of recent enforcement or seat belt messages (although Hispanics were slightly more aware of both enforcement and messages). There was little or no difference between Hispanics and non-Hispanics in their awareness that officers can stop and ticket for a seat belt violation. There were substantial differences in the importance of enforcing the seat belt law (95% of Hispanics and 86% of non-Hispanics said it was important), in the perceived likelihood of getting a ticket if unbuckled (64% of Hispanics and 58% of non-Hispanics said a ticket would always or nearly always be given), and in the belief that officers should be able to stop and ticket a motorist solely for a seat belt violation (86% of Hispanics and 75% of non-Hispanics). Vehicle Type. The largest group of respondents, about 900, said that they most often drove a passenger car; about 300 drove a pickup; 300 drove an SUV; 100 drove a van; 78 said they drove some other vehicle type; and about 50 checked multiple vehicle types. The patterns in awareness and perceptions associated with these subcategories were not strong or consistent. Perhaps the most consistent pattern was among occupants of pickup trucks. Proportionately fewer of them felt that it was important to enforce the seat belt law (82% versus 88% of non-pickup respondents); a smaller percentage of these occupants thought that a ticket would always or nearly always be issued for a seat belt violation (55% versus 59%); and proportionately fewer thought that an officer should be able to stop a vehicle and issue a ticket solely for a seat belt violation (74% versus 78%). Responses among occupants of pickups and all others were nearly identical in the perceived strictness by which the law was being enforced, recent efforts to enforce the seat belt law, and the fact that an officer can stop and ticket solely for a seat belt violation. Occupants of pickups were more likely to say that they had seen recent messages about seat belt use (90% versus 85%). There was a tendency for lower use groups, such as males, younger occupants, and occupants of pickup trucks to be less supportive of enforcement and to perceive less risk of getting a ticket. These groups generally provided the lowest support for the primary enforcement provisions of the new law. Hispanics, on the other hand, were more likely to be aware of recent enforcement, to believe that it was important, to think that the risk of getting a ticket for not buckling up was higher, and to support primary enforcement provisions.

24
2. RDP Awareness Surveys In northern Florida, the results of DMV surveys conducted at 6 licensing centers showed an increase in awareness of seat belt enforcement, from 55% just prior to the law change to 76% immediately after the change (+21 points); in the perception that officers can stop and ticket solely for a seat belt violation, from 88% to 94% (+6 points); and in the position that officers should be able to stop and ticket solely for a seat belt violation, from 53% to 78% (+25 points). The series of graphs that follow show key trends in the results of the RDP surveys. Figure 9 Perceptions Regarding the Strictness of SBU Law Enforcement and the Likelihood of Being Stopped and Issued a Ticket for a Seat Belt Violation: in North Florida, 2009
Legend for Figure 9: Law Enforced Strictly = The seat belt law in Florida is enforced at least somewhat strictly; Ticket Likely = perception that, if one drives unbuckled, they always or nearly always will receive a ticket. Figure 9 summarizes the trends in public perception that the seat belt law is strictly enforced (very or somewhat strictly) and the perceived likelihood that one would (always or nearly always) receive a ticket if s/he rode unbuckled in a passenger vehicle. It shows that the perception of strict enforcement had been increasing prior to the upgrade in June 2009, likely associated with RDP enforcement and publicity; declined slightly after the law change, and increased again several months after the law upgrade. The perceived likelihood of receiving a ticket if one rode unbuckled showed a similar trend. Figure 10 shows an increase in the percentage of respondents in north Florida who said that they saw or heard something about seat belt or /seat belt use over the past 30 days. The increase began with the first two waves of the RDP (March and June 2009) and continued through the law change (July), before declining slightly in November. The proportion who said that they saw or heard about special efforts by law enforcement officers to enforce the State’s seat belt law increased by about 10 points after the first RDP wave, then remained unchanged through June. After the primary law upgrade went into effect, awareness of
71.2%74.3%
83.2%78.5%
83.9%
54.4%61.2%
65.5%61.8%
71.0%
40%
50%
60%
70%
80%
90%
Feb Mar Jun Oct Nov
perc
ent o
f Res
pond
ents
Law Enforced Strictly Ticket Likely
Law Change

25
special seat belt enforcement increased by more than 20 points, before declining slightly over the next 4 months. Figure 10. Percentage of Respondents Who Said That They Saw/Heard About
Special Seat Belt Enforcement or Seat Belts in Past 30 Days.
62.9%72.9%
83.2%87.6% 84.8%
44.0%54.6% 54.9%
75.5% 73.4%
20%
40%
60%
80%
100%
Feb Mar Jun Oct Nov
Perc
ent
Saw /Heard About Seat Belts Saw /Heard About Enforcement
Law Change
Figure 11 shows a modest increase in the proportion of respondents who thought that an officer could stop a vehicle and issue a citation for a seat belt violation. This percentage increased from about 88% prior to the upgrade to 94% after it (+6 points) and remained at that level after 4 months. Consistent with past literature in this area, the proportion of the public who thought that an officer should be able to stop a vehicle and issue a citation for a seat belt violation also increased. In fact, it increased by more than 25 percentage points, from 53% to 78% and remained level though November 2009. Figure 11. Percentage of Respondents Who Perceived that a Police Officer Can Stop a Vehicle and Issue a Ticket Solely for a Seat Belt Violation and Who Said That a Police Officer Should be Able to Stop a Vehicle and Issue a Ticket Solely for a Seat Belt Violation.
87.9%93.6% 93.5%
52.8%
74.6%77.6%
40%
60%
80%
100%
Feb Mar Jun Oct Nov
Perc
ent
Police Can Stop Should be Able to Stop
Law Change

26
In summary, these changes in northern Florida suggest that the primary law upgrade was perceived and supported by the majority of the respondents.
C. Changes in Observed Seat Belt Usage
1. Statewide Observational Surveys Figure 12 summarizes the results of before and after CIOT observational surveys from 2006 to 2010, except for 2007 when there was only a late summer survey in July instead of June. The figure shows the result of the observations conducted in July 2009 after the law upgrade. In 2006, the gain associated with the CIOT mobilization was 5.5 percentage points, from 75.2% to 80.7%. In 2007, the post-CIOT rate measured several months after the mobilization was at 79%. In 2008, the gain was 4.3 points, from 77.4% to 81.7%. In 2009, just prior to the law change, the gain was 3.0 points, from 77.9% to 80.9%.
Figure 12. Changes in Observed Seat Belt Use: Pre- and Post-CIOT; 2006-2010
75 77 78 84 81 82 81
87 79
85
0102030405060708090
100
2006 2007 2008 2009 2010
April
June
July
The primary seat belt enforcement law took effect on June 30, 2009. Following the 3-point gain associated with the CIOT, the upgrade to primary enforcement was associated with an additional gain of 4.3 points, for a total increase of 7.3 points associated with the two interventions in 2009. This was the largest gain in 5 years. There was a slight (1-point) decline from July 2009 to the next April, immediately followed by another 3-point increase in usage in 2010. Each gain associated with CIOT or with the law change was statistically significant. Following are the estimates, standard errors, and 95% confidence intervals for the 2009 and 2010 surveys:
• April 2009 - estimate of use = 77.9%; (SE = 0.82%; 95% CI: 76.3% to 79.5%); • June 2009 - estimate of use = 80.8%; (SE = 0.79%; 95% CI: 79.3% to 82.4%); • July 2009 - estimate of use = 85.2%; (SE = 0.66%; 95% CI: 84.1% to 86.2%); • April 2010 - estimate of use = 84.3%; (SE = 0.68%; 95% CI: 83.0% to 85.7%); and • June 2010 - estimate of use = 87.4%; (SE = 0.51%; 95% CI: 86.4% to 88.4%).
Consistent with past findings regarding primary law upgrades, Figure 13 shows that the impact of the law change (from June to July of 2009) was greatest for higher-risk, lower belt use groups than for lower-risk, higher-use groups. For example, increases were greater for males (6.1 points) than for females (3.9 points); greater for the Black population (8.0 points) than for the White (4.7 points) or Hispanic (3.8 points) populations; and greater for occupants of pickup trucks (9.1 points) than for occupants of cars (4.3 points), SUVs (4.7 points), or vans (3.5 points).

27
Figure 13. Increase in Observed Seat Belt Use, by Subgroup, From June to July 2009: (Gains Associated With the June 2009 Primary Law Upgrade)
6.1
3.9 4.7
8.0
3.8
5.4 4.4 4.3
9.1
4.7
3.5
0123456789
10
M F * Wh Bl Hisp * '16-59 60+ * Car Trck SUV Van
Pct.P
t. C
hg. i
n U
se
The decay in usage between one intervention period and another was also greatest for these high-risk groups. The fact that the northern region of the State actually experienced a gain between July 2009 (post-law) and April 2010 (pre-CIOT) surveys reinforces this suggestion. During this interval, there were two additional (RDP) interventions that likely affected these high-risk, low-use groups. There were significant gains associated with both the 2009 CIOT and the law change for all days of the week and for all times of day (daylight hours only). Impact was modestly greater for young occupants than for older occupants and for minor arteries and local collectors (5.8-5.9 points) than for interstate highways (3.5 points) and principal arteries (4.9 points).
2. Trends in Usage Among Subgroups The next six figures show 2-year trends among various subgroups, from June 2008 (post-CIOT) to June 2010 (post-CIOT). Within this period are the pre-CIOT, post-CIOT, and post-law results. Tables 10 and 11 summarize the rates and gains for this period (2008-2010).
a. Gender Figure 14 shows changes in seat belt use among males and females. There was substantially lower usage among males than females throughout the survey period, a pattern shown in nearly all studies of usage by gender. Males began this series with a usage rate that was 8.5 percentage points lower than that of females (78.1% and 86.6%, respectively; p < 0.0001). Following a decline in usage prior to the 2009 CIOT, there were modest increases among both males and females associated with the 2009 mobilization (+2.7 points among males and 1.6 points among females; p < 0.0001 for both gains). However, there was a large increase among both males and females associated with the law change (+6.1 pts and +3.9 points, respectively). Both of these gains were highly significant (p < 0.0001).

28
Following a significant decay in usage from July 2009 to April 2010, there was the increase associated with the 2010 CIOT. This time, the increase among females was greater than that among males. The difference between males and females narrowed to 5.4 percentage points immediately after the law change (83.9% and 89.3%, respectively; p < 0.001), then increased slightly to about 6.5 points after the 2010 CIOT mobilization. Over the entire period, from 2008 to 2010, usage increased by 6.1 points among males and by 4.1 points among females.
Figure 14. Trends in Statewide Observed Usage, by Gender: 2008- 2010
70.0
75.0
80.0
85.0
90.0
95.0
Jun-08
Aug-08
Oct-08
Dec-08
Feb-09
Apr-09
Jun-09
Aug-09
Oct-09
Dec-09
Feb-10
Apr-10
Jun-10
Usa
ge (%
)
Females Males
2009 CIOT and Law 2010 CIOT
b. Race and Ethnicity Figure 15 shows trends in usage by race and ethnicity from 2008 to 2010. The Black population had the lowest usage rates throughout the period, starting with a rate of about 70% in June 2008, about 10 points lower than Hispanics (81%) and 16 points lower than Whites (86%). There was a decline in usage from 2008 to pre-CIOT in 2009. While this decline was found to be significant for all three subgroups, it was greater for the Black (down 5.7 points) and Hispanic (down 4.1 points) populations than for the White population (down 3 points). Gains associated with the 2009 CIOT were statistically significant for the Black and Hispanic groups (+6.5 points and +6.2 points, respectively) and approached, but did not reach significance for the White population (+0.6 points; p = 0.08). Thus, Black and Hispanic populations were more affected by the 2009 CIOT than the White population. Following the gains associated with CIOT, all three subgroups experienced significant gains after the primary law upgrade. Gains among the Black population were greater than among the Hispanic or White populations (+8 points, +3.8 points, and +4.7 points, respectively), but all changes were highly significant (see Tables 10 and 11).

29
Figure 15. Trends in Statewide Observed Usage, by Race/Ethnicity: 2008-2010
60.0
65.0
70.0
75.0
80.0
85.0
90.0
95.0
Jun-08
Aug-08
Oct-08
Dec-08
Feb-09
Apr-09
Jun-09
Aug-09
Oct-09
Dec-09
Feb-10
Apr-10
Jun-10
Seat
Bel
t Use
(%)
White Black Hispanic
2009 CIOT and Law 2010 CIOT
From the post-law period in 2009 to pre-CIOT in 2010, there were modest but significant declines in usage among all three groups (-1.2 points among Whites; -4.3 points among African-Americans; -5.9 points among Hispanics). Finally, there were significant gains among all three groups after the 2010 CIOT. The gains among the Black and the Hispanic populations (+6.2 points and +5.9 points, respectively) were greater than the gains among the White population (+2.3 points). Over the entire period of study, usage increased by 10.7 points among the Black population, 5.9 points among the Hispanic population, and 3.4 points among the White population. Both CIOT mobilizations appeared to have a greater impact on minorities than on Whites. In spite of the large gains among the Black population after the 2009 CIOT, the law change that followed had the greatest impact among this subgroup. In between interventions, on the other hand, usage among minorities consistently declined more than among Whites. It should be noted that there was a very small “Other” category which had the highest overall rates but the numbers were too small for analysis.
c. Age Group Data were collected for two estimated age groups, those under 65 and those 65 and older. The trends among these two subgroups were nearly identical to the trends by gender, with younger

30
occupants (like males) having lower rates than older occupants (like females). Also similar to the trends among the two genders, there was some convergence of rates immediately following the 2009 CIOT and the law change. Because the gains were modestly greater among the younger group than among the older group (+5.3 points and +3.3 points, respectively), there was less difference between the two groups in 2010 than in 2008. Both CIOT mobilizations affected younger occupants more than older occupants (+2.9 points versus +0.4 points in 2009; and +3.9 points versus +1.8 points in 2010 for younger and older occupants, respectively). The law change had a similar effect on both groups (about +5 points) and was greater than the effect associated with either mobilization.
Figure 16. Trends in Statewide Observed Usage, by Age Group: 2008- 2010
70
75
80
85
90
95
Jun- 08
Aug- 08
Oct- 08
Dec- 08
Feb- 09
Apr- 09
Jun- 09
Aug- 09
Oct- 09
Dec- 09
Feb- 10
Apr- 10
Jun- 10
Usage (%)
Older Younger
2009 CIOT and Law Change 2010 CIOT
d. Vehicle Type Figure 17 shows trends in usage by occupants in various vehicle types. Occupants of pickup trucks had the lowest usage throughout the 2-year period, followed by passenger vehicles, SUVs, and vans. Usage among occupants of pickup trucks was lowest in June 2008 (74.6%); declined prior to the 2009 CIOT (-6.8 points); reacted modestly to the 2009 CIOT (+2.9 points); and had the largest gain of any subgroup after enactment of the primary law (+9.1 points). Usage increased significantly among all vehicles except vans (+1.9 points, p = 0.063) during the 2009 CIOT and among all vehicles including vans following the law change (see Tables 10 and 11 for declines, gains, and p-values).

31
Figure 17. Trends in Statewide Observed Usage, by Vehicle Type: 2008- 2010
After the substantial increase following the two interventions in 2009, usage among occupants of pickup trucks dropped by 3.9 points, more than among any other subgroup (-3.0 points in SUVs; -2.5 points in cars; and -0.4 points in vans). All of these declines were significant except for the slight change for vans. In 2010, belt usage increased significantly among occupants of all vehicle types. The gains were greatest in pickups (+4.0 points), followed by SUVs and cars (about +3.5 points) and vans (+2.5 points). Declines between interventions were more modest for the high-use vehicle types.
e. Roadway Type Observations were coded for four roadway types: interstates and primary arterials (usually higher speed roads) and secondary arterials and collectors (usually local, lower-speed roads). Figure 18 shows trends in usage for each of these road types. Several things are apparent from these trend lines. One is that collectors (local roadways) have the lowest usage rates. Second, from year to year, collectors have the largest drops from post-CIOT in one year to pre-CIOT in the next year; and third, the local collectors have the largest increases associated with CIOT. The primary law generally had a greater impact on all roadway types than the two CIOT mobilizations did. The effects associated with the primary law were greatest on the local roadways (+5.8 points to +5.9 points on secondary arterials and collectors, respectively). Collectors and secondary arterials had the greatest overall gains from June 2008 to June 2010 (+6.6 points and +5.1 points, respectively) compared with primary arterials and interstates (+4.9 points each).
60
65
70
75
80
85
90
95
Jun-08
Aug-08
Oct-08
Dec-08
Feb-09
Apr-09
Jun-09
Aug-09
Oct-09
Dec-09
Feb-10
Apr-10
Jun-10
Seat
Bel
t Use
(%)
Van SUV Car Pickup
2010 CIOT 2009 CIOT and Law Change

32
Figure 18. Trends in Statewide Observed Usage, by Roadway Type: 2008-2010
60
65
70
75
80
85
90
Jun-08
Aug-08
Oct-08
Dec-08
Feb-09
Apr-09
Jun-09
Aug-09
Oct-09
Dec-09
Feb-10
Apr-10
Jun-10
Seat
Bel
t Use
(%)
Interstate Princ. Art. Minor Art. Collector
2009 CIOT and Law Change 2010 CIOT
Like other category comparisons, the lower use roadways (collectors and secondary arterials) had the greatest variability over time, responding more to interventions and experiencing greater declines in between interventions. Interstate highways and primary arterials consistently had the highest usage rates and were nearly identical under all conditions. They experienced modest decay between mobilization periods (-2 to -3 points); had relatively smaller gains associated with mobilizations (+2 to +3 points); and had a modest gain associated with the primary law (+4 to +5 points).
f. Region Results from the 12 counties were divided into the north, central, and south Florida regions. The substantial number of observations within each county and region provide stable belt use estimates over time but are not representative for individual regions. There were more sites in the south (5), than in the central region (4) or the north region (3). All three regions participated in the CIOT mobilizations and were affected by the law change. Only the northern region participated in the RDP, which ran from February 2009 to May 2010. As Figure 19 shows, usage in the north and the south increased after the 2009 CIOT (+3.8 points and +4.0 points, respectively) while there was a small non-significant decline in the central region (-0.3 points). After the primary law change, gains were greatest in the central and southern regions (+5.9 points and +4.5 points, respectively), compared with the north (+1.3 points; p = 0.08). Interestingly, however, usage in the North did not drop between the 2009 and

33
2010 interventions as it did in the other two regions. In fact, there was a highly significant gain (+5.6 points, p < 0.0001) in the north, compared with declines in both the central and southern regions. Following the 2010 CIOT, usage increased by 2.2 points in the north; 1.9 points in the central region; and 4.9 points in the south.
Figure 19. Trends in Statewide Observed Usage, by Region: 2008-2010
70
72
74
76
78
80
82
84
86
88
90
Jun-08
Aug-08
Oct-08
Dec-08
Feb-09
Apr-09
Jun-09
Aug-09
Oct-09
Dec-09
Feb-10
Apr-10
Jun-10
Usa
ge (%
)
North Central South
2009 CIOT and Law Change 2010 CIOT
Overall, from June 2008 to June 2010, belt usage increased by 5.9 points in the north, 7.1 points in central Florida, and 3.8 points in the south. Looking only from the 2009 pre-CIOT baseline, through June 2010 (the period during which the RDP was operating in the northern part of the State), usage changed by +12.9 points in the north, +5.8 points in central Florida, and +8.6 points in the south. Much of the net gain in the north from April 2009 to June 2010 was realized because there was no decay between July 2009 and April 2010. In fact, an increase during this period (+ 5.6 points) likely was associated with the RDP.
g. Other Subgroups
We also examined changes in usage by day of week, weekends versus weekdays, and by time of day. Although there were similar patterns in terms of decay between mobilization periods and substantial increases associated with both CIOT and the law change, there were no substantial differences between the subgroups themselves. Changes during the week were nearly identical to changes during the weekend and changes during morning, mid-day, and evening were nearly identical. No nighttime observations were made.
In summary. The combination of the 2009 CIOT and the primary law change had a large and significant impact on belt usage in Florida in 2009, with the greatest impact occurring among low use groups (i.e., occupants on local roadways, in pickup trucks, minority occupants, and

34
males). Generally, the gains experienced by the lowest use groups decayed over time. There were additional gains during the 2010 mobilization. By June 2010, the differences between low use groups and other comparison groups were smaller than in 2008 or in April 2009. The CIOT mobilization had an impact each year resulting in significant increases in usage from baseline to post-CIOT levels. Summaries of usage rates, sample sizes, gains and losses, and p-values for each measurement period and each subgroup follow.
Table 10. Percent Observed Usage and Sample Size by Survey Wave:
by Gender, Race/Ethnicity, Age, Vehicle Type, Road Type, and Region
PeriodPost-CIOT
SurveyJun-08
Male78.1
Female86.6
White Black Hisp85.8 70.5 80.7
Young Old81.1 88.3
Car Truck SUV Van82.0 74.6 85.1 86.0
n = 19,665 18,025 21,674 5,957 9,502 32,425 5,274 21,383 4,631 8,522 3,203
Pre-CIOT Apr-09 75.1 83.8 82.8 64.8 76.6 77.3 85.9 79.5 67.8 82.6 82.9n = 20,061 16,924 23,306 4,739 8,354 29,414 7,579 20,747 4,571 8,690 3,013
Post-CIOT Jun-09 77.8 85.4 83.4 71.3 82.8 80.2 86.3 82.4 70.7 83.9 84.8n = 18,744 16,758 20,107 5,696 9,132 28,094 7,397 20,035 4,652 8,339 2,492
Post-Law Jul-09 83.9 89.3 88.1 79.3 86.6 85.3 91.3 86.7 79.8 88.6 88.3n = 21,346 17,945 22,114 5,856 10,699 32,088 7,201 22,175 5,184 9,031 2,916
Pre-CIOT Apr-10 81.3 86.6 86.9 75.0 80.7 82.5 89.8 84.2 75.9 85.6 87.9n = 22,078 19,723 25,809 5,988 9,510 34,277 7,520 23,361 5,053 10,191 3,208
Post-CIOT Jun-10 84.2 90.7 89.2 81.2 86.6 86.4 91.6 87.7 79.9 89.2 90.4n = 19,804 17,346 20,244 5,787 10,622 30,691 6,483 20,918 4,750 8,817 2,698
Table 10. (continued) Percent Observed Usage and Sample Size by Survey Wave:
by Gender, Race/Ethnicity, Age, Vehicle Type, Roadway Type, and Region
PeriodPost-CIOT
SurveyJun-08
Inter83.2
Prim82.5
Second82.1
Collect79.1
North81.7
Central79.0
South84.1
n = 9,208 13,201 10,592 4,744 8,198 10,704 18,843
Pre-CIOT Apr-09 81.6 79.9 78.2 74.4 74.7 80.3 79.3n = 9,193 12,285 10,295 5,248 4,341 10,833 21,847
Post-CIOT Jun-09 83.3 82.2 80.5 78.1 78.5 80.0 83.3n = 8,600 11,633 10,348 4,937 6,346 11,372 17,800
Post-Law Jul-09 86.8 87.1 86.3 84.0 79.8 85.9 87.8n = 9,167 15,933 11,504 5,332 4,805 9,868 24,633
Pre-CIOT Apr-10 84.7 84.5 83.6 80.8 85.4 84.2 83.0n = 9,462 14,712 12,168 5,471 6,719 13,624 21,470
Post-CIOT Jun-10 88.1 87.4 87.2 85.7 87.6 86.1 87.9n = 9,269 12,336 10,697 4,881 7,025 11,380 18,778
35
Table 11. Changes in Seat Belt Use Associated with Interventions: by Gender, Race/Ethnicity, Age Group, Vehicle Type, Road Type, and Region
Period Gender Race/Ethnicity Age Group Vehicle Type2008-09 Male Female White Black Hisp Young Older Car Truck SUV Van
decay -3.0 -2.8 -3.0 -5.7 -4.1 -3.8 -2.4 -2.5 -6.8 -2.5 -3.1p value <0.0001 <0.0001 <0.0001 <0.0001 <0.0001 <0.0001 <0.0001 <0.0001 <0.0001 <0.0001 0.0010
2009 CIOT Male Female White Black Hisp Young Older Car Truck SUV Vangain 2.7 1.6 0.6 6.5 6.2 2.9 0.4 2.9 2.9 1.3 1.9
p value <0.0001 <0.0001 0.0800 <0.0001 <0.0001 <0.0001 0.0900 <0.0001 0.0025 0.0290 0.0630
2009 Law Male Female White Black Hisp Young Older Car Truck SUV Vangain 6.1 3.9 4.7 8.0 3.8 5.1 5.0 4.3 9.1 4.7 3.5
p value <0.0001 <0.0001 <0.0001 <0.0001 <0.0001 <0.0001 0.0019 <0.0001 <0.0001 <0.0001 0.0002
2009-2010 Male Female White Black Hisp Young Older Car Truck SUV Vandecay -2.6 -2.7 -1.2 -4.3 -5.9 -2.8 -1.5 -2.5 -3.9 -3.0 -0.4
p value <0.0001 <0.0001 0.0001 <0.0001 <0.0001 <0.0001 <0.0001 <0.0001 <0.0001 <0.0001 0.6320
2010 CIOT Male Female White Black Hisp Young Older Car Truck SUV Vangain 2.9 4.1 2.3 6.2 5.9 3.9 1.8 3.5 4.0 3.6 2.5
p value <0.0001 <0.0001 <0.0001 <0.0001 <0.0001 <0.0001 0.0002 <0.0001 <0.0001 <0.0001 0.0020
Overall Male Female White Black Hisp Young Older Car Truck SUV Van2008->2010 6.1 4.1 3.4 10.7 5.9 5.3 3.3 5.7 5.3 4.1 4.4
<0.0001 <0.0001 <0.0001 <0.0001 <0.0001 <0.0001 <0.0001 <0.0001 <0.0001 <0.0001 <0.0001

36
Table 11. (continued) Changes in Seat Belt Use Associated With Interventions: by Gender Race/Ethnicity, Age Group, Vehicle Type, Road Type, and Region
Period2008-09 Inter
decay -1.6
RoadwPrim-2.6
ay TypeSecond
-3.9Collect North
-4.7 -7.0
RegionCentral
1.3South-4.8
p value 0.0050 <0.0001 <0.0001 <0.0001 <0.0001 0.0190
Central
<0.0001
South2009 CIOT Inter Prim Second Collect Northgain 1.7 2.3 2.3 3.7 3.8 -0.3 4.0
p value 0.0040 <0.0001 <0.0001 <0.0001 <0.0001 0.5440
Central
<0.0001
South2009 Law Inter Prim Second Collect Northgain 3.5 4.9 5.8 5.9 1.3 5.9 4.5
p value <0.0001 <0.0001 <0.0001 <0.0001 0.0880 <0.0001
Central
<0.0001
South2009-2010 Inter Prim Second Collect Northdecay -2.1 -2.6 -2.7 -3.2 5.6 -1.7 -4.8
p value <0.0001 <0.0001 <0.0001 <0.0001 <0.0001 0.0004 <0.0001
2010 CIOT Inter Prim Second Collect North Central Southgain 3.4 2.9 3.6 4.9 2.2 1.9 4.9
p value <0.0001
Overall Inter
<0.0001
Prim
<0.0001
Second
<0.0001 0.0001
Collect North
<0.0001
Central
<0.0001
South2008->2010 4.9 4.9 5.1 6.6 5.9 7.1 3.8
<0.0001 <0.0001 <0.0001 <0.0001 <0.0001 <0.0001 <0.0001

37
Law Upgrade
67 67 62
77 78
0
10
20
30
40
50
60
70
80
90
Base Mar Jun Sep Nov
Obs
erve
d U
se (%
)
3. North Florida Observational Surveys (RDP) Observational surveys conducted in north Florida where the rural belt program was in progress also showed the impact of the new law. Figure 20 shows that observed usage was 62% in the RDP area in June 2009, just prior to the new law. Several months after the new law went into effect, usage increased to 77% (+15 points) and increased to 78% two month later. The increase from June to September was highly significant (p < 0.0001).
Figure 20. Changes in Observed Seat Belt Use in North Florida (RDP): 2009

38

39
IV. Summary and Discussion
A. Summary On June 30, 2009, when Florida implemented a primary seat belt law, it already had a high baseline usage rate (81%), compared to other law upgrade States. In addition, the State was engaged in a Rural Demonstration Program (RDP) to increase usage in rural areas in the northern part of the State and it was participating in annual CIOT mobilizations. There was some evidence that even though the RDP had been active in the northern part of the State, the May 2009 CIOT effort was less intense than in prior years. Likely associated with this decrease in intensity, the 2009 mobilization was followed by a smaller gain in usage than in prior years. After the primary law went into effect on June 30, awareness surveys indicated that 90% of respondents were aware that officers could stop and ticket a motorist solely for a seat belt violation (i.e., primary enforcement). In addition, about three-quarters of all respondents supported this provision. Taking into account the increase in seat belt use associated with the May 2009 CIOT (about 3 percentage points) and the pre-law rates in the northern part of the State, the law change was associated with an immediate 4.3 point increase in seat belt usage statewide (from 80.9% post-CIOT to 85.2% post-upgrade). Perhaps most importantly, the impact of the law change was greatest among low-use groups, including males, the Black population, and occupants of pickup trucks. There were additional gains with the 2010 CIOT and these gains were greatest among the lowest use subgroups.
B. Discussion As pointed out in the Background section of this report, the Florida upgrade was part of a fourth group of States that upgraded to primary enforcement since 1993. The first group (1993-98) had a median baseline use rate of about 61%, relatively low fines (median = $24) and experienced a median gain of nearly 16 percentage points. The second group (2000-2003) had a median baseline of 69%, a relatively higher median fine level ($34) and experienced a median gain of about 13 points. The third group (2004-2007), the most recent group to be evaluated, had a nearly identical median baseline rate (68%) as the second group, but a lower median fine ($25) and achieved a more modest median gain of 6 points. Florida is the largest State in a fourth group of States that upgraded to primary enforcement and is the first of this group to be evaluated. It had the second highest baseline rate (in observed seat belt use) of any previous upgrade State (81%). This factor likely provided some downward pressure on any gain associated with the law change. Coupled with this high baseline, was the fact that Florida had a relatively high fine amount ($30) for a seat belt violation and its “as practiced” (fine + fee) amount is more than $90. This may have provided some upward pressure on gains associated with the law change. As of July 2010 (i.e., immediately following the law change), the measured 4.3 point gain (7.3 points in conjunction with the CIOT mobilization) should be viewed as a very positive result. Several of the earlier law upgrades included the impact of the mobilization as part of the effect associated with such an upgrade (e.g., Washington State).

40
In the northern part of the State, the results may be even larger, looking only from April 2009 to July 2009 or June 2010. The context for this increase includes several waves of at least modest enforcement and publicity. Only after the upgrade, however, did usage increase in this RDP-targeted area. The North Florida outcome suggests the possibility that: (a) the ongoing enforcement and publicity in these rural counties helped sustain the impact of the law change; and (b) the law change facilitated the effect of modest but repeated enforcement and media efforts in these northern counties.

41
References Bentacourt, R. (1993). Statewide seat belt usage survey and analysis (Fall 1992). Sacramento, CA: California Office of Traffic Safety.
Bentacourt, R. (1992). California state seat belt usage survey and analysis (Fall, 1993). Sacramento, CA: California Office of Traffic Safety.
Bowman, B. L., & Rounds, D. A. (1989). Restraint system usage in the traffic population: 1988 annual report. (Report No. DOT HS 807 447). Washington, DC: National Highway Traffic Safety Administration.
Bowman, B. L., & Rounds, D. A. (1988). Restraint system usage in the traffic population: 1987 annual report. (Report No. DOT HS 807 342). Washington, DC: National Highway Traffic Safety Administration.
Chaudhary, N. (under review). Evaluation of Alabama, Michigan, and New Jersey safety belt law change to primary enforcement. (Report No. DOT HS [TBD]). Washington, DC: National Highway Traffic Safety Administration.
Chen, Y. Y. & Ye, T. J. (2010, May). Seat belt use in 2009 – use rates in the states and territories. Traffic Safety Facts. (Report No. DOT HS 811 324). Washington DC: National Highway Traffic Safety Administration. Available at http://www-nrd.nhtsa.dot.gov/Pubs/811324.pdf. Datta, T. K., & Guzek, P. (1992). Restraint system Use in 19 U.S. cities: 1991 annual report. (Report No. DOT HS 808 148). Washington DC: National Highway Traffic Safety Administration.
Datta, T.K. and Guzek, P. (1991). Restraint system use in 19 U.S. cities: 1990 annual report. (Report No. DOT HS 808 147. Washington DC: National Highway Traffic Safety Administration.
Datta, T. K., & Guzek, P. (1990). Restraint system use in 19 U.S. cities: 1989 annual report. (Report No. DOT HS 807 595). Washington DC: National Highway Traffic Safety Administration.
Eby, D. W., Vivoda, J. M., & Fordyce, T. A. (2002). The effects of standard enforcement on Michigan safety belt use. Accident Analysis and Prevention 34:815-823.
Farmer, C. M., & Williams, A. F. (2004). Effect on fatality risk of changing from secondary to primary seat belt enforcement. Arlington, VA: Insurance Institute for Highway Safety.
Goryl, M. E. (1986). Restraint system usage in the traffic population: 1985 annual report. (Report No. DOT HS 806 978). Washington, DC: National Highway Traffic Safety Administration.
Goryl, M. E., & Bowman, B.L. (1987). Restraint system usage in the traffic population: 1986

42
annual report. (Report No. DOT HS 807 080). Washington, DC: National Highway Traffic Safety Administration.
Goryl, M. E., & Cynecki, M. J. (1985). Restraint system usage in the traffic population. (Report No. DOT HS 806 714). Washington, DC: National Highway Traffic Safety Administration.
Masten, S. (2007, March). The effects of changing to primary enforcement on daytime and nighttime seat belt use. Traffic Safety Facts: Research Note. (Report No. DOT HS 810 743). Washington DC: National Highway Traffic Safety Administration. Available at http://www.nhtsa.gov/people/injury/research/TSF/HS810743/810743.html. Nichols, J. L., & Ledingham, K.A. (2008). The impact of legislation, enforcement, and sanctions on safety belt use. NCHRP Report 601. Washington, D.C.: Transportation Research Board. Available at http://onlinepubs.trb.org/onlinepubs/nchrp/nchrp_rpt_601.pdf. Perkins, D. D., Cynecki, M. J., & Goryl, M. (1984). Restraint system usage in the traffic population. (Report No. DOT HS 806 582. Washington, DC: National Highway Traffic Safety Administration.
Rood, R. H., & Kraichy, P. P. (1986). Evaluation of New York State’s mandatory occupant restraint law: Volume III – Observational surveys of safety restraint use by children in New York State. (Report No. DOT HS 806 972). Washington, DC: National Highway Traffic Safety Administration. Solomon, M. G. (2002, January). Evaluation of NHTSA’s region IV Click It or Ticket campaign, May 2001. (Report No. DOT HS 809 404). Washington, DC: National Highway Traffic Safety Administration. Available at http://ntl.bts.gov/lib/26000/26000/26065/DOT-HS-809-404.pdf.
Solomon, M. G., Preusser, D. F. & Nissen, W. J. (2001, March). Evaluation of Maryland, Oklahoma and the District of Columbia’s seat belt law change to primary enforcement. (Report No. DOT HS 809 213). Washington, DC: National Highway Traffic Safety Administration. Available at http://ntl.bts.gov/lib/26000/26000/26031/DOT-HS-809-213.pdf.
Ulmer, R. G., Preusser, C. W., & Preusser, D. F. (1994, December). Evaluation of California’s safety belt law change to primary enforcement. (Report No. DOT HS 808 205). Washington, DC: National Highway Traffic Safety Administration.
Voas, R. B., Fell, J. C., Tippetts, A. S., Blackman, K., & Nichols, J. L. (2007, September). Impact of primary safety belt laws on alcohol-related front-seat occupant fatalities: five case studies. Traffic Inj Prev.;8(3):232-43.

Appendices

A-1
Appendix A. Florida Seat Belt Observation Form
SITE NUMBER:__________ SITE: NOTES: WEATHER CONDITIONS DATE: _______ - _______ - _______ DAY OF WEEK: _________________ 1 Clear / Sunny 4 Fog 2 Light Rain 5 Wet But Not 3 Cloudy Raining DIRECTION OF TRAFFIC FLOW (Circle one): N S E W START TIME:_____________ (Observation period will last exactly 60 minutes) VEHICLE DRIVER PASSENGER
Veh. #
Vehicle C = car T = truck S = suv V = van
License I = Florida O = Out-of-state
Sex M = male F = female U = unsure
Age Y = 16-59 O = 60 or older U = unknown
Race W = White B = Black H = Hispanic O = Other U = unsure
Use Y = yes N = no U = unsure
Sex M = male F = female U = unsure
Age Y = 16-59 O = 60 or older U = unknown
Race W = White B = Black H = Hispanic O = Other U = unsure
Use Y = yes N = no U = unsure
1
2
3
4
5
6
7
8
9
10
11
12
13
14
15
16
17
18
19
20
21
22
23
24
25
26
27
28
29
30
31
32
33
34
35
FLORIDA SEAT BELT SURVEY FORM 2006

A-2
Summary of Data Types, Sources, and Schedules for the Florida Case Study
I. Data
Type
Statewide Usage
(Annual)
Northern Florida Usage (RDP)
Statewide Awareness
Northern Florida Awareness
(RDP)
Activity Media & Enf.
(CIOT, RDP, UTC)
II. Data
Source
Statewide Obs.
Surveys
RDP Obs.
Surveys
Surveys at 16 DMV Centers
Surveys at Rural
DMV Centers
CIOT Activity
Data
RDP Activity
Data
UTC Citation
Data III.
Data Period
2006- 2010
2009- 2010
July 2009 & June 2010
2009 – 2010
2006- 2010
2009- 2010
2005-
2010 (Jan)
IV.
Data Collection Schedules
Statewide
2006
2007
2008
2009
2010
Obs. Use Surveys
Apr & Jun
Apr & Jun
Apr & Jun
Apr, Jun & Jul
Apr & Jun
Awareness Surveys
-
-
-
July
June
CIOT Media
Activity
May
May
May
May
May
CIOT Enforce. Activity
May
May
May
May
May
Statewide
2006
2007
2008
2009
2010 (UTC)
Citations
monthly
monthly
monthly
monthly
Jan. Northern Florida (RDP)
2006
2007
2008
2009
2010
RDP Obs. Use Surveys
-
-
-
F
M
J
O
N
Jun
RDP DMV
Surveys
-
-
-
F
M
J
O
N
Jun
RDP Media
Activity
M M N May
RDP Enforce. Activity
M M N May
Primary Law Implementation Date was June 30, 2009

B-1
Appendix B. Florida Counties
(Including Designation of RDP-Targeted and Control Counties)

C-1
Appendix C: Florida DMV Survey Form Several Driver Licensing Offices are participating in a study about seat belt use. Your answers are voluntary and anonymous. 1. Your sex: � Male � Female
2. Your age: � Under 21 � 21-24 � 25-34 � 35- 39 � 40-49 � 50-59 � 60 Plus
3. Your race: � White � Black � Asian � Native American � Other
4. Are you of Spanish/Hispanic origin? � Yes � No
5. Your Zip Code: _______________________
6. About how many miles did you drive last year? � Under 5,000 � 5,000 to 10,000 � 10,001 to 15,000 � Over 15,000
7. What type of vehicle do you drive most often? � Passenger car � Pickup � SUV � Mini-van � Full-van � Other 8. How often do you use seat belts when you drive or ride in a (answer for each of the following): Car ............ � Always ....... � Nearly always.......... � Sometimes ........... � Seldom .............. � Never ........ � Don’t drive/ride in one Pickup ...... � Always ....... � Nearly always.......... � Sometimes ........... � Seldom .............. � Never ........ � Don’t drive/ride in one SUV/Van .. � Always ....... � Nearly always.......... � Sometimes ........... � Seldom .............. � Never ........ � Don’t drive/ride in one 9. Do you think that it is important for police to enforce the seat belt law? � Yes � No 10. What do you think the chances are of getting a ticket if you don't wear your seat belt? � Always � Nearly always � Sometimes � Seldom � Never 11. Do you think the seat belt law in Florida is enforced: � Very strictly � Somewhat strictly � Not very strictly � Rarely � Not at all 12. Have you ever received a ticket for not wearing your seat belt? � Yes � No 13. In the past month, have you seen or heard about police enforcement focused on seat belt use? � Yes � No 14. In the past month, have you experienced police enforcement activities looking at seat belt use? � Yes � No 15. Have you recently read, seen or heard anything about seat belts in Florida?
� Yes � No If yes, where did you see or hear about it? (check all that apply): � Newspaper � Radio � TV � Billboards � Brochure � Police Enforcement � Other If yes, what did it say? ___________________________________________________________ 16. Have you recently read, seen or heard anything about wearing a seat belt in rural areas? � Yes � No 17. Can a police officer in Florida stop a vehicle and issue a ticket solely for a seat belt violation? � Yes � No 18. In your opinion, should a police officer be able to stop a vehicle and issue a ticket solely for a seat belt violation? � Yes � No 19. Do you know the name of any seat belt program(s) Florida? (check all that apply): � Buckle Up Florida � Buckle Up in Your Truck � Click It or Ticket � Other 20. In the past month, have you seen or heard anything about police working at night to enforce the seat belt law? � Yes � No

D-1
Appendix D. Results of Awareness Surveys by Subgroup (July 2009 Statewide Survey)
Table D-1. Results of July 2009 Awareness Survey: Key Topics by Subgroup
Male Female 21-39 40+ White Black Asian Native OtherImportant % 82.2% 92.1% 87.4% 86.2% 89.0% 87.4% 85.8% 86.2% 98.4% 75.0% 95.4% 87.3%
to Enforce SB Law n 884 990 1,874 1,029 843 1,872 1,171 385 63 8 197 1,8241,593231
Yes 727 912 1,638 887 750 1,637 1,005 332 62 6 188no 157 78 236 142 93 235 166 53 1 2 9
Male Female 21-39 40+ White Black Asian Native OtherTicket for Non-Use % 55.4% 62.5% 59.2% 55.9% 63.1% 59.2% 58.3% 57.7% 56.5% 62.5% 66.0% 59.0%
Always or n 875 979 1,854 1,012 841 1,853 1,171 376 62 8 191 1,8081,066742
Nearly Always Yes 485 612 1,097 566 531 1,097 683 217 35 5 126no 390 367 757 446 310 756 488 159 27 3 65
Male Female 21-39 40+ White Black Asian Native OtherEnforcement % 76.4% 76.6% 76.5% 75.2% 78.2% 76.6% 75.2% 78.4% 80.3% 87.5% 76.3% 76.2%Very Strict or n 868 982 1,850 1,017 831 1,848 1,161 380 61 8 194 1,804
1,375429
Somewhat Strict Yes 663 752 1,415 765 650 1,415 873 298 49 7 148no 205 230 435 252 181 433 288 82 12 1 46
Male Female 21-39 40+ White Black Asian Native OtherSaw or Heard % 72.8% 72.2% 72.5% 71.6% 73.6% 72.5% 71.9% 77.0% 54.8% 75.0% 73.6% 72.6%
Recent Seat Belt n 878 992 1,870 1,024 844 1,868 1,175 382 62 8 193 1,8201,321499
Enforcement Yes 639 716 1,355 733 621 1,354 845 294 34 6 142no 239 276 515 291 223 514 330 88 28 2 51
Male Female 21-39 40+ White Black Asian Native OtherSaw or Heard % 85.4% 85.5% 85.5% 83.0% 88.3% 85.4% 86.0% 84.8% 79.4% 100.0% 85.6% 85.5%
Recent Seat Belt n 878 992 1,870 1,021 847 1,868 1,175 381 63 8 195 1,8221,559263
Messages Yes 750 848 1,598 847 748 1,595 1,011 323 50 8 167no 128 144 272 174 99 273 165 58 13 0 28
Male Female 21-39 40+ White Black Asian Native OtherOfficer can Stop % 93.8% 93.6% 93.7% 92.9% 94.8% 93.8% 95.0% 91.1% 90.5% 100.0% 92.7% 93.8%
for Seat Belt n 876 973 1,849 1,009 839 1,848 1,156 381 63 8 193 1,8011,689112
Violation Yes 822 911 1,732 938 795 1,733 1,098 347 57 8 179no 54 62 117 71 44 115 58 34 6 0 14
Male Female 21-39 40+ White Black Asian Native OtherOfficer Should be % 72.6% 80.8% 76.9% 73.1% 81.5% 76.9% 76.2% 70.6% 88.5% 75.0% 87.5% 76.6%Able to Stop for n 872 973 1,845 1,008 835 1,843 1,159 378 61 8 192 1,798
1,378420
SB Violation Yesno
633 786 1,419426
737 681 1,418425
883 267 54 6 168239 187 271 154 276 111 7 2 24
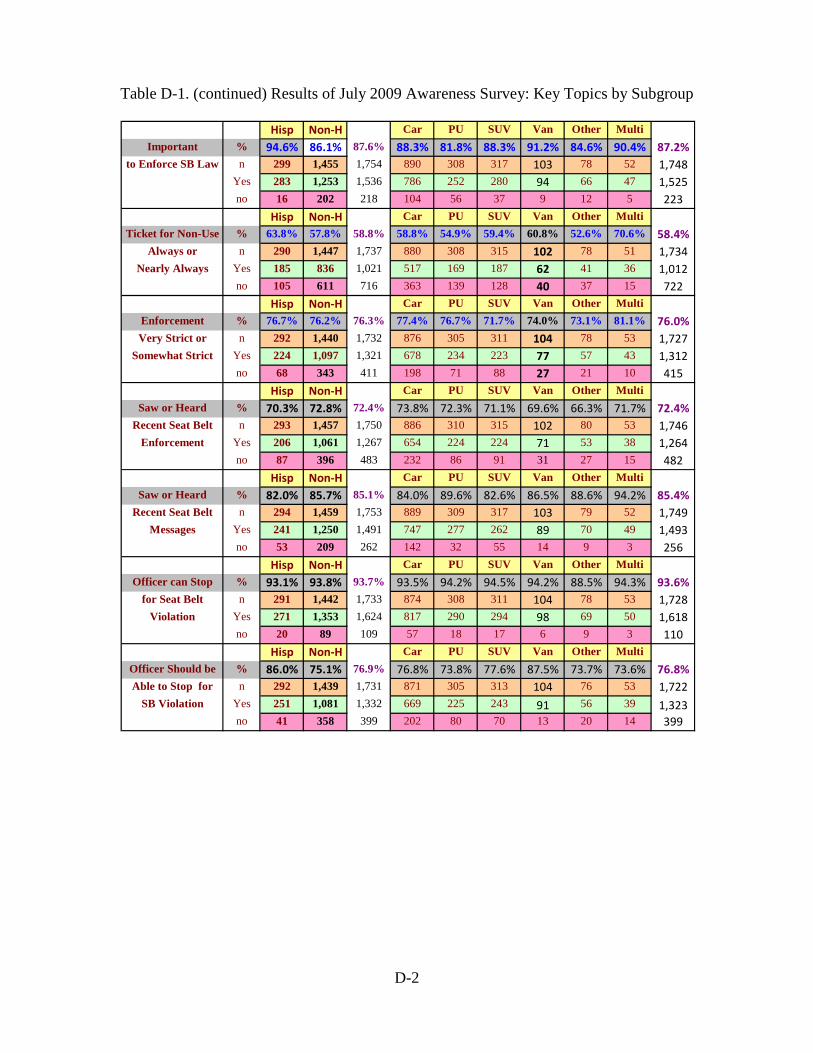
D-2
Table D-1. (continued) Results of July 2009 Awareness Survey: Key Topics by Subgroup
Hisp Non-H Car PU SUV Van Other MultiImportant % 94.6% 86.1% 87.6% 88.3% 81.8% 88.3% 91.2% 84.6% 90.4% 87.2%
to Enforce SB Law n 299 1,455 1,754 890 308 317 103 78 52 1,7481,525223
Yes 283 1,253 1,536 786 252 280 94 66 47no 16 202 218 104 56 37 9 12 5
Hisp Non-H Car PU SUV Van Other MultiTicket for Non-Use % 63.8% 57.8% 58.8% 58.8% 54.9% 59.4% 60.8% 52.6% 70.6% 58.4%
Always or n 290 1,447 1,737 880 308 315 102 78 51 1,7341,012722
Nearly Always Yes 185 836 1,021 517 169 187 62 41 36no 105 611 716 363 139 128 40 37 15
Hisp Non-H Car PU SUV Van Other MultiEnforcement % 76.7% 76.2% 76.3% 77.4% 76.7% 71.7% 74.0% 73.1% 81.1% 76.0%Very Strict or n 292 1,440 1,732 876 305 311 104 78 53 1,727
1,312415
Somewhat Strict Yes 224 1,097 1,321 678 234 223 77 57 43no 68 343 411 198 71 88 27 21 10
Hisp Non-H Car PU SUV Van Other MultiSaw or Heard % 70.3% 72.8% 72.4% 73.8% 72.3% 71.1% 69.6% 66.3% 71.7% 72.4%
Recent Seat Belt n 293 1,457 1,750 886 310 315 102 80 53 1,7461,264482
Enforcement Yes 206 1,061 1,267 654 224 224 71 53 38no 87 396 483 232 86 91 31 27 15
Hisp Non-H Car PU SUV Van Other MultiSaw or Heard % 82.0% 85.7% 85.1% 84.0% 89.6% 82.6% 86.5% 88.6% 94.2% 85.4%
Recent Seat Belt n 294 1,459 1,753 889 309 317 103 79 52 1,7491,493256
Messages Yes 241 1,250 1,491 747 277 262 89 70 49no 53 209 262 142 32 55 14 9 3
Hisp Non-H Car PU SUV Van Other MultiOfficer can Stop % 93.1% 93.8% 93.7% 93.5% 94.2% 94.5% 94.2% 88.5% 94.3% 93.6%
for Seat Belt n 291 1,442 1,733 874 308 311 104 78 53 1,7281,618110
Violation Yes 271 1,353 1,624 817 290 294 98 69 50no 20 89 109 57 18 17 6 9 3
Hisp Non-H Car PU SUV Van Other MultiOfficer Should be % 86.0% 75.1% 76.9% 76.8% 73.8% 77.6% 87.5% 73.7% 73.6% 76.8%Able to Stop for n 292 1,439 1,731 871 305 313 104 76 53 1,722
1,323399
SB Violation Yes 251 1,081 1,332 669 225 243 91 56 39no 41 358 399 202 80 70 13 20 14

D-3
Figure D-1. Results of July 2009 Awareness Survey: Key Topics by Subgroup
Perceive that it is Important to Enforce the SB Law (July 2009)
40%
50%
60%
70%
80%
90%
100%
Male
Female
*21
-39 40+ *
White
Black
Asian
Native
Other *
HispNon
-H *Car PU
SUVVan
% Y
es
Will Always or Nearly Always Get a Ticket for Riding Unbuckled (July 2009)
40%
50%
60%
70%
Male
Female
*21
-39 40+ *
White
Black
Asian
Native
Other *
HispNon
-H *Car PU
SUVVan
% P
erce
ivin
g
Perceive that SB Law is Very or Somewhat Strictly Enforced (July 2009)
40%
50%
60%
70%
80%
90%
Male
Female
*21
-39 40+ *
White
Black
Asian
Native
Other *
HispNon
-H *Car PU
SUVVan
% P
erce
ivin
g

D-4
Figure D-1. (continued) Results of July 2009 Awareness Survey: Key Topics by Subgroup
Have Read or Heard About SB Enforcement (July 2009)
40%
50%
60%
70%
80%
90%
100%
Male
Female
*21
-39 40+ *
White
Black
Asian
Native
Other *
HispNon
-H *Car PU
SUVVan
% Y
es
Have Read or Heard about Seat belts (July 2009)
40%
50%
60%
70%
80%
90%
100%
Male
Female
*21
-39 40+ *
White
Black
Asian
Native
Other *
HispNon
-H *Car PU
SUVVan
% Y
es

D-5
Figure D-1. (continued) Results of July 2009 Awareness Survey: Key Topics by Subgroup
Perceive that Officer Can Stop for SB Violation (July 2009)
40%
50%
60%
70%
80%
90%
100%
Male
Female
*21
-39 40+ *
White
Black
Asian
Native
Other *
HispNon
-H *Car PU
SUVVan
% Y
es
Feel that Officer Should be Able to Stop for SB Violation (July 2009)
40%
50%
60%
70%
80%
90%
100%
Male
Female
*21
-39 40+ *
White
Black
Asian
Native
Other *
HispNon
-H *Car PU
SUVVan
% Y
es


Impact of Implementing a Primary Enforcement Seat Belt Law in Florida: A Case Study
DOT HS 811 656August 2012
8947-082412-v2a