Attachment K - Data Assumptions Report -...
143
Report 12 July 2013 Distributional and Cost Benefit Analysis for the Packaging Impacts Decision Regulation Impact Statement Data Assumptions
Transcript of Attachment K - Data Assumptions Report -...

Report 12 July 2013
Distributional and Cost Benefit Analysis for the Packaging Impacts Decision Regulation Impact Statement
Data Assumptions

Marsden Jacob AssociatesFinancial & Economic Consultants
ABN 66 663 324 657ACN 072 233 204
Internet: http://www.marsdenjacob.com.auE-mail: [email protected]
Melbourne office:Postal address: Level 3, 683 Burke Road, CamberwellVictoria 3124 AUSTRALIATelephone: +61 3 9882 1600Facsimile: +61 3 9882 1300
Brisbane office:Level 14, 127 Creek Street, BrisbaneQueensland, 4000 AUSTRALIATelephone: +61 7 3229 7701Facsimile: +61 7 3229 7944
Perth office:Level 1, 220 St Georges Terrace, Perth Western Australia, 6000 AUSTRALIATelephone: +61 8 9324 1785Facsimile: +61 8 9322 7936
Sydney office:119 Willoughby Road Crows Nest Sydney NSW 2065 AUSTRALIA Telephone: +61 418 765 393
Copyright © Marsden Jacob Associates Pty Ltd 2013

TABLE OF CONTENTSPage
1. Introduction and overview.............................................................41.1 Introduction.........................................................................................................41.2 Overview of data assumptions review.................................................................4
2. Background and general assumptions............................................92.1 Options development and timing........................................................................92.2 Infrastructure requirements..............................................................................102.3 General assumptions.........................................................................................13
3. Consumption, recycling and litter projections...............................143.1 Packaging consumption.....................................................................................143.2 Recycling projections.........................................................................................163.3 Litter projections...............................................................................................26
4. Cost assumptions........................................................................404.1 Scheme design and implementation.................................................................404.2 Scheme administration, industry PSOs or equivalent........................................454.3 Household participation costs...........................................................................484.4 Business participation costs..............................................................................544.5 Collection and transport costs...........................................................................574.6 Processing costs at MRF facilities......................................................................604.7 Infrastructure and operating costs....................................................................614.8 Business compliance costs................................................................................754.9 Loss of producer surplus....................................................................................77
5. Benefit assumptions....................................................................825.1 Value of recovered resources............................................................................825.2 Avoided landfill costs.........................................................................................865.3 Avoided costs of litter........................................................................................92
6. Distributional analysis assumptions.............................................94
References.......................................................................................95

1. Introduction and overview1.1 IntroductionAustralian environment ministers, through the Standing Council on Environment and Water, have agreed to develop a Decision Regulation Impact Statement (DRIS) in 2013 on a range of national options to increase packaging resource recovery rates and decrease packaging litter. The Packaging Impacts Decision RIS will continue a process progressed through the ‘Packaging Impacts Consultation RIS’. A ‘Distributional and Cost Benefit Analysis’, entailing financial and economic analysis of the options, will provide an important input to development of the Decision RIS. In general terms, the Distributional and Cost Benefit Analysis (CBA) will involve:
a comprehensive review of the methods and assumptions employed for the Consultation Regulatory Impact Statement (CRIS) analysis, especially in light of stakeholder feedback received through the consultation process;
expanded and more in-depth analysis to meet the requirements for a DRIS, especially of the distributional (financial) impacts; and
consideration of an expanded number of options.
The project team has undertaken a review of data assumptions contained in the CRIS. The aim of this review was to identify assumptions that need updating due either to:
a greater level of detail being required to facilitate the distributional analysis (detail which was not required in the CRIS) and therefore varying assumptions by state or territory, by metropolitan (metro) or non-metropolitan (non-metro) region and/or by stakeholder; or
the project team’s assessment (informed by additional research and consideration of stakeholder input) that an alternative assumption or methodology used to derive that assumption is required.
This document presents outcomes of the review.
1.2 Overview of data assumptions reviewThe data assumptions review has been structured in line with the classification of assumptions as presented in the cost benefit analysis report for the CRIS (PWC & WCS 2011 at Attachment C in the CRIS). Assumptions in that report are presented in four broad categories:
background general assumptions relating to the base year, structure and timing of options and the discount rate applied to future revenues and costs;
consumption, recycling, landfill and litter projections for the base case and options;
cost assumptions – incremental costs to businesses, households, the packaging industry and governments associated with the options; and
benefit assumptions – benefits and avoided costs associated with the options.
Additional data assumptions required for the DRIS but not estimated in the CRIS are also identified and discussed.
National Environment Protection CouncilDistributional and Cost Benefit Analysis for the Packaging Impacts Decision RIS: Data assumptions
4.

There are also assumptions relevant to financial impacts on stakeholder groups examined through the distributional analysis. These are discussed briefly in a separate distributional analysis assumptions section.
In summary, outcomes from the review have been classified as follows:
the project team agrees with the CRIS assumption and recommends its use in the DRIS; or
the project team recommends revising the assumption as identified, noting that revisions to assumptions could include:
- changes to the totality of the assumption as presented in the CRIS;
- changes to a part but not all of the assumption; and
- changes to how the assumption is applied - over time, with changes to rates of recycling, or between jurisdictions and regions.
Table 1 summarises outcomes of the review of CRIS data assumptions, focussing on key revised assumptions, which can be defined as “assumptions that have the potential to significantly affect outcomes of the analysis”.
Full discussion of these key assumptions and all other assumptions is provided in the main report.
National Environment Protection CouncilDistributional and Cost Benefit Analysis for the Packaging Impacts Decision RIS: Data assumptions
5.
Table 1: Overview of key assumptions
Data variable CRIS assumption Proposed DRIS assumption Comment
Consumption recycling and litter
Base case consumption projections
Split of packaging consumption by packaging type:
- beverage 25%- non-beverage 8%- flexible 67%
Split of packaging consumption by packaging type:- beverage 30%- non-beverage 8%- flexible 62%
Total packaging consumption estimates for base year and subsequent years remain unchanged.
Base case recycling projections
79% overall recycling rate by 2030
70% beverage recycling rate by 2030
73% overall recycling rate by 2030
63% beverage recycling rate by 2030
DRIS recycling rates are assumed to be significantly lower post 2020 than are assumed in the CRIS. This has implications for recycling rates under the options.
Litter rates 6% littered as a proportion of total packaging available to be littered
Propensity to litter (base case):
24% littered as a proportion of public place1 packaging available to be littered, decreasing over time at different rates for different options (see comment)
1.3% littered as a proportion of all other packaging available to be littered, decreasing over time at different rates for different options (see comment)
Option 1: propensity rates decrease by 5% relative to base case reflecting impact of litter programs.
Options 2a-2e, 3: propensity rates decrease by approximately 5-15% over the period 2015-2020, reflecting impact of litter programs.
Options 4a, 4b, 4c: reduction in propensity rates of up to 37% over time reflecting significant impact of container refund on beverage container litter rates.
Costs
Government administration costs
Development costs < $1m for options
Ongoing admin. costs < $0.2m for options
Development costs $1m – 47 m for options
Ongoing admin. costs $1m – 43m for optionsDRIS assumes substantially greater administration costs for all options.
1 ‘Public places’ are deemed to include ‘LGA public places’ (such as streets, recreation reserves and public parks and gardens) and ‘commercial public places’ (such as shopping centres and hotels, bars and restaurants).
National Environment Protection CouncilDistributional and Cost Benefit Analysis for the Packaging Impacts Decision RIS: Methodology
6.

Data variable CRIS assumption Proposed DRIS assumption Comment
Household participation costs
Value of time $13.01/ hour
Significant accumulation costs
4a, 4b, 4c are assumed to involve the same frequency and proportion of new trips
Value of time $7.67/ hour
Accumulation costs assumed to be zero
4a, 4b, 4c are assumed to involve different frequency and proportion of new trips
The value of time is assessed as non-business/ leisure time at 30% of the average Australian wage in 2011.
The number of trips per year and proportion of new trips have been altered to reflect an increased number of trips to RVMs (26/ year) compared to non-RVM infrastructure (3.55/ year), but a lower proportion of new (purpose-specific) trips.
Collection and transport costs
Household kerbside: $187/ tonne
Commercial and industrial: $26/ tonne
Load to MRF: 10 tonnes/ truck
Recyclables: (metro) $ 97/ tonne; (non-metro) $173/ tonne
Garbage: (metro) $132/ tonne; (non-metro)
$177/ tonne
Load to MRF: 5 tonnes/ truck
The key distinction in cost of kerbside waste collection is not between household and commercial but between metro areas and non-metro areas.
Changes to collection and transport tonnages under options are ‘discounted’ by 15% to reflect fixed costs.
Processing costs at MRF facilities
Cost to landfill residual waste: $200/ tonne Cost to landfill residual waste: variable Variable between jurisdictions and regions but generally
lower than $200/ tonne
Infrastructure and operating costs: Options 2a-2e, 3
Predetermined costs/ investments, not linked to recycling levels
Costs determined by recycling targets and type of recyclate
‘Premium’ applied to reduce risk of options not meeting beverage container recycling targets
Costs derived through application of ‘Marginal recycling cost curves’.
Premium applied to fund an extensive and ongoing education & information campaign to complement infrastructure & service investments. Applied exponentially in proportion to beverage container recycling targets (i.e. greatest premium applied to Options 2b, 2c/3 and 2d).
Infrastructure and operating costs: Options 4a, 4b, 4c
Infrastructure, coordination and handling costs/ tonne (averaged across all regions):
Option 4a: $689/ tonne
Option 4b: $749/ tonne
Infrastructure and handling (excluding co-ordination costs) costs/ tonne:
Option 4a: $537/ tonne (average all regions)
Option 4b: $557/ tonne (average all regions)
Option 4c: $648/ tonne (average all regions)
Lower costs for Option 4a relative to 4b and 4c reflect assumed lower operating and capital costs for RVMs compared with collection centres. Costs estimated to be approximately 17%, 16% and 14% higher in non-metro regions relative to metro regions for options 4a, 4b and 4c respectively, reflecting higher rental fees (for RVMs) and higher transport and operating costs in non-metro regions.
National Environment Protection CouncilDistributional and Cost Benefit Analysis for the Packaging Impacts Decision RIS: Methodology
7.

Data variable CRIS assumption Proposed DRIS assumption Comment
Business compliance costs Annual costs < $1m for all options
Upfront costs of $25m Options 4a and 4b and $12.5m for Option 4c.
Annual costs of $2.25m, Options 2a-2c, 2e & 3; $3.0m Options 4a, 4b; $1.5m Option 4c.
Retailer compliance costs of $0.5m assumed for Option 4a
DRIS assumes substantially greater annual compliance costs for most options.
Option 4a retailer compliance costs are associated with a requirement on large retailers to establish convenience points in all stores over a certain size.
Loss of producer surplus Not assessed
Assessed for beer, bottled water, fruit juice, milk, soft drink, spirit and wine manufacturers for Options 4a, 4b and 4c. Indicative impact - $148 m over the period of study (present value) for Option 4a
Estimates for Options 4b and 4c will be provided with the CBA report.
Estimates for other options will also be provided, but due to lack of data about product categories and industries affected these estimates will be order of magnitude.
Benefits
Value of materials
Glass: $30/ tonne general; $100/ tonne premium
Plastics: $560/ tonne beverage; $560/ tonne non-beverage
LPB: $150/tonne general
Glass: $0/ tonne general; $40/ tonne premium
Plastics: $676/ tonne beverage; $349/ tonne non-beverage
LPB: $150/tonne general; $220/tonne premium
Proposed changes reflect discussions with industry sources
Avoided costs of litter
Reduced litter clean-up costs in proportion with % reduction in packaging litter tonnes relative to base case and packaging litter as a proportion (37%) of all litter
$501/ tonne of all public place packaging litter reduced relative to base case
$501/ tonne represents a shadow price for the economic cost of litter
National Environment Protection CouncilDistributional and Cost Benefit Analysis for the Packaging Impacts Decision RIS: Methodology
8.

2. Background and general assumptions
The CRIS details a number of background and general assumptions relating to:
options development and timing;
infrastructure requirements for the options; and
general assumptions aimed at ensuring consistent assessment of the costs and benefits of options relative to the base case.
Each of these sub-categories is discussed in turn below.
2.1 Options development and timing2.1.1 CRIS assumptionsThe CRIS specifies development periods, a commencement year and indicative years of operation for each of the options in the model. It also specifies initiatives that will be implemented under Options 1, 2a, 2b, 2c and 3, in line with the years of operation.
2.1.2 DiscussionThe length of time allowed in the CRIS for developing each of the options appears to be reasonable, as does the indicative years of operation.
The CRIS assumes however, that the DRIS will be completed in 2012, with development of options commencing after 30 June 2012. It is now apparent that development of options is unlikely to commence until after 30 June 2013 at the earliest. To maintain consistency with the CRIS and with description of policy options provided in the options paper, however, the development periods and commencement period have been left unchanged. The fact that an option, if selected, would not actually commence implementation until at least one year after the date indicated should not materially affect the outcomes of the analysis.
2.1.3 DRIS assumptionsRecommended development periods and commencement years are provided in Table 2. Development periods and commencement years are also provided for the new options, 2d, 2e and 4c. Indicative years of operation for each of the options are also in line with those presented in the CRIS.
Initiatives assumed in the CRIS for Option 1 will be maintained in the DRIS. The general nature of initiatives assumed in the CRIS will also be maintained in the DRIS. Specific aspects of these initiatives will be updated however, to reflect analysis of scheme infrastructure and operating costs undertaken for Options 2a, 2b, 2c, 2d, 2e and 3 using ‘Marginal recycling cost curves’. This approach is discussed in Section 4.7.
.
National Environment Protection CouncilDistributional and Cost Benefit Analysis for the Packaging Impacts Decision RIS: Data assumptions
9.

Table 2: Option development and commencement timing assumptions
Category Application CRIS assumption DRIS assumption
Development period
Commencement year
Development period
Commencement year
Options development and timing
Option 1 2012-2013 2014 2013-2014 2015
Option 2a
2013-2014 2015 2013-2015 2016
Option 2bOption 2cOption 2dOption 2eOption 3
Option 4a 2012-2015 2016 2013-2015 2016 Option 4b
Option 4c
2.2 Infrastructure requirementsAll options examined in the cost benefit and distributional analysis will require recycling infrastructure. The discussion below focuses on infrastructure that is embodied in the design of specific options, notably Options 2b, 2c and 4a, 4b and 4c.
2.2.1 CRIS assumptionsInfrastructure requirements are pertinent to Options 2b and 2c (the National Bin Network) and Options 4a and 4b (container deposit infrastructure). The National Bin Network is a core element of Options 2b and 2c under the CRIS, with the National Bin Network requiring the installation of 30000 additional bins between 2016 and 2020 (5000-6000 bins per year), targeting away from home recycling. Container deposit infrastructure required for Option 4a consists of a mix of hubs, collection depots, reverse vending machines (RVMs) and rural/ remote collection centres, entailing 1900 collection points in total (see Table 3). Option 4b also consists of 1900 collection points but has a greater proportion of collection depots compared with Option 4a and a lower proportion of RVMs.
2.2.2 DiscussionThe National Bin Network will remain a core element of Options 2b and 2c under the DRIS.
In line with the revised container deposit scheme (CDS) model provided by the Boomerang Alliance (December 2012), significant changes to infrastructure requirements are proposed for Option 4a. These will entail:
a greater emphasis on the use of RVMs; 2
a reduction in the number of hubs, from 250 to 165; and
2 Note the ability of Option 4a to operate effectively as a RVM based system is dependent on the capacity of RVMs to accept the full range of container and material types proposed for recycling under this option including glass, plastics (PET, HDPE), aluminium, steel and LPB. Information provided on behalf of RVM manufacturers indicates that machines are capable of processing these material types.
.
National Environment Protection CouncilDistributional and Cost Benefit Analysis for the Packaging Impacts Decision RIS: Data assumptions
10.

an increase in the total number of collection points in metro and regional centres, from 1200 to 1565 (including 1400 RVMs and 165 hubs).
Further, to achieve parity with Option 4a, it is recommended that the number of collection points in Option 4b also be changed to a total of 1565 across areas (except remote areas) and that the new Option 4c also have a total of 1565 collection points across metro and regional areas. For both options, the increase in collection points is assumed to come through a greater use of RVMs, reflecting the likely cost effectiveness of RVMs (relative to collection depots), especially in densely populated urban centres.
An important point to consider regarding the use of RVMs in a container deposit or container refund scheme, but especially Option 4a which is predicated almost entirely on the use of RVMs for container redemption, is whether RVM infrastructure is capable of handling the required quantities of beverage containers. Analysis for the DRIS on container numbers to be recycled is presented in Table 3. The data reveals that the quantity of containers recycled through RVMs is expected to rise from about 774,000 tonnes in 2020 to 930,000 tonnes in 2035. This represents an estimated 6.7 million containers/ RVM/ year in 2020, rising to 8.1 million containers/ RVM/ year in 2035. Although this appears to be an unrealistically large quantity, data provided by industry sources indicates that RVMs in use elsewhere and modelled in the DRIS are capable of handling more than 8 million containers per year.
Table 3: Containers recycled through RVMs under Option 4a
2020 2025 2030 2035
Recycling rate 77.50% 82.50% 85.00% 85.00%
Beverage consumption tonnes 1,421,421 1,466,214 1,513,993 1,555,799
Beverage recycling tonnes 1,101,601 1,209,626 1,286,894 1,322,429
Recycling tonnes via RVMs 774,426 850,367 904,686 929,668
Number of RVMS 1,400 1,400 1,400 1,400
Av. tonnes/ RVM/ year 553 607 646 664
Av. Containers/ RVM3 6,584,278 7,229,944 7,691,772 7,904,168
Additionally, a reduced number of remote collection points is recommended, declining from 700 to 100. The reduced number still provides for 1.5% of all redemptions to take place through remotely located centres (proportional to the total population living in remote locations4), but the average container throughput at each remote collection point is now assumed to be about one quarter of the container throughput at collection points located in metropolitan and regional areas. This compares with container throughput at each remote collection point of less than 4% of metropolitan and regional collection points under the CRIS assumption of 700 remote collection points.
2.2.3 DRIS assumptionsApplying the recommended changes, discussed above, the three options can now be broadly defined (in infrastructure terms) as follows: 3 Assuming an average of 11,903 containers/ tonne. 4 Note an additional 0.8% of Australia’s population currently resides in ‘very remote’ locations..
National Environment Protection CouncilDistributional and Cost Benefit Analysis for the Packaging Impacts Decision RIS: Data assumptions
11.

4a – predominantly RVMs, but with some collection through hubs;
4b – a mix of RVMs and other types of collection points; and
4c – predominantly drive-through depots, but with RVMs in densely populated urban areas.
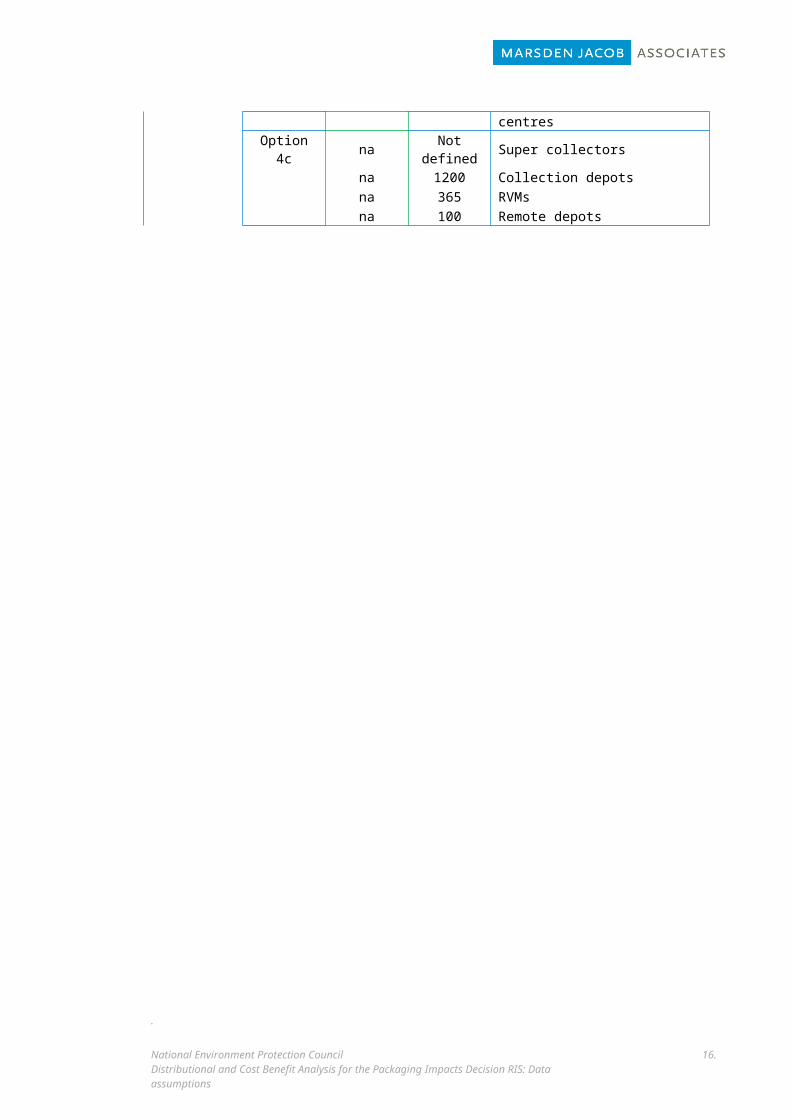
The new Option ‘4c’, modelled on the South Australian container refund scheme, is consistent with the most recent published options description. The network of drive-through collection depots, RVMs and remote collection depots, implemented through this option, will be supported by a number of super collectors. The total number of super collectors is not defined for this analysis, but for the purpose of efficiency should be kept to a relatively small number (e.g. 1 to 3) for each jurisdiction.
Recommended infrastructure assumptions for Options 4a, 4b and 4c are summarised in Table 4.
Table 4: Infrastructure assumptions Options, 4a, 4b and 4c
Category ApplicationCRIS
assumption (no.)
DRIS assumption
(no.)Infrastructure
Infrastructure requirements
Option 4a 250 165 Hubs310 0 Collection depots640 1400 RVMs700 100 Remote collection centres
Option 4b 250 165 Consolidation depots 600 600 Collection depots 350 800 RVMs 700 100 Remote collection centres
Option 4c na Not defined Super collectorsna 1200 Collection depotsna 365 RVMsna 100 Remote depots
.
National Environment Protection CouncilDistributional and Cost Benefit Analysis for the Packaging Impacts Decision RIS: Data assumptions
12.

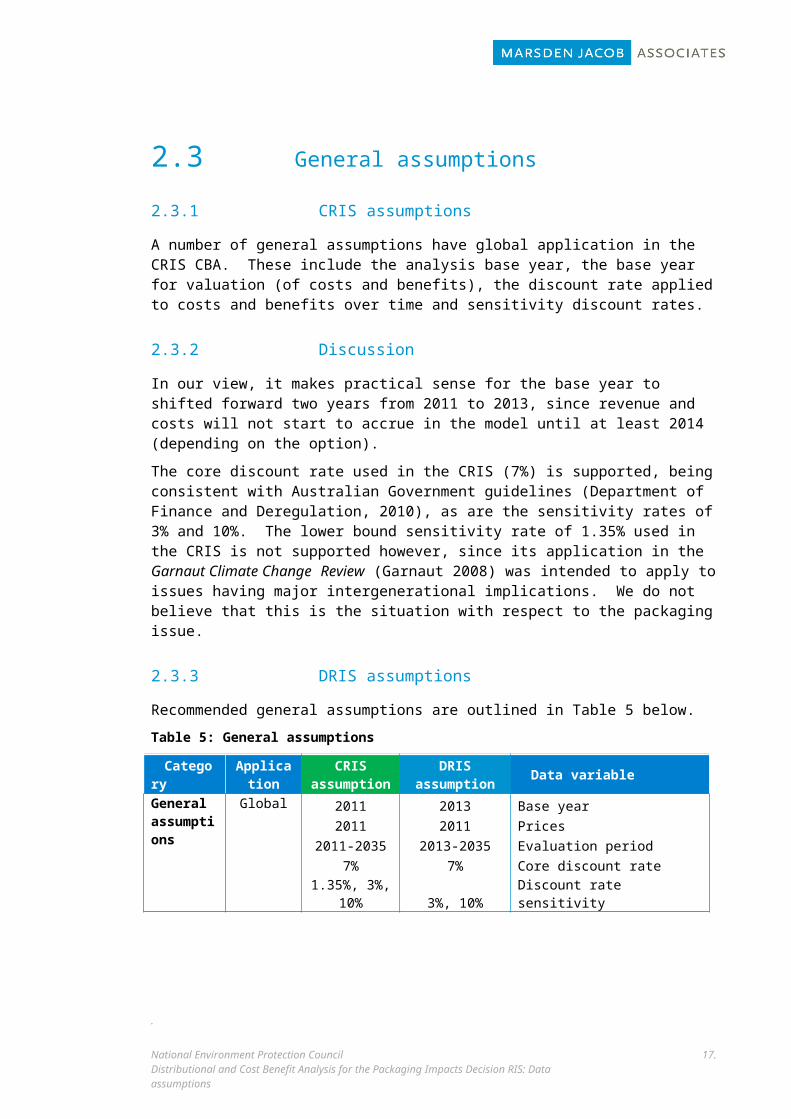
2.3 General assumptions2.3.1 CRIS assumptionsA number of general assumptions have global application in the CRIS CBA. These include the analysis base year, the base year for valuation (of costs and benefits), the discount rate applied to costs and benefits over time and sensitivity discount rates.
2.3.2 DiscussionIn our view, it makes practical sense for the base year to shifted forward two years from 2011 to 2013, since revenue and costs will not start to accrue in the model until at least 2014 (depending on the option).
The core discount rate used in the CRIS (7%) is supported, being consistent with Australian Government guidelines (Department of Finance and Deregulation, 2010), as are the sensitivity rates of 3% and 10%. The lower bound sensitivity rate of 1.35% used in the CRIS is not supported however, since its application in the Garnaut Climate Change Review (Garnaut 2008) was intended to apply to issues having major intergenerational implications. We do not believe that this is the situation with respect to the packaging issue.
2.3.3 DRIS assumptionsRecommended general assumptions are outlined in Table 5 below.
Table 5: General assumptions
Category Application
CRIS assumption DRIS assumption Data variable
General assumptions
Global 2011 2013 Base year 2011 2011 Prices
2011-2035 2013-2035 Evaluation period 7% 7% Core discount rate
1.35%, 3%, 10% 3%, 10% Discount rate sensitivity
.
National Environment Protection CouncilDistributional and Cost Benefit Analysis for the Packaging Impacts Decision RIS: Data assumptions
13.

3. Consumption, recycling and litter projections
3.1 Packaging consumption3.1.1 CRIS assumptionsProjected growth in packaging consumption
Projections of growth in packaging consumption in the CRIS are linked on the one hand to population growth and, on the other hand, to a slight reduction in the ratio of consumption to population to reflect light weighting of packaging material. Application of this approach, outlined in Table 5, results in estimated annual growth of packaging consumption of 0.75% in the period 2011-2015, falling gradually to annual growth of 0.54% by 2031-2035. Total packaging consumption in the base year (2010) is approximately 4.4 million tonnes.
Material composition of packaging
The CRIS adopts 2010 estimates of packaging material composition and assumes that these will remain unchanged over the study period 2011-2035. Drawing on Australian Packaging Covenant (APC) data (APC 2011), the CRIS notes that there has been a small increase in glass consumption (as a proportion of total packaging) in the period for which reliable national data is available (2003-2010) and a correspondingly small decrease in plastics consumption. The CRIS also references trends in packaging technology, materials and design noted by the APC (APC 2011), which could affect future plastic consumption, but it is unclear from these trends what the overall impact will be over time.
Product composition and location of packaging consumption
The CRIS assumes that the distribution of packaging materials by product type (beverage containers, non-beverage containers, flexible packaging) will remain unchanged over time at approximately 25%, 8% and 67% respectively. It also assumes that the split of consumption by location (at-home versus away-from-home) remains unchanged.
3.1.2 DiscussionSince completion of the CRIS new packaging consumption and recycling data has been compiled drawing on primary sources (Industry Edge and Equilibrium 2013). The new data suggests that while total base year packaging consumption data used in the CRIS is appropriate, the beverage container component of that total is likely to be understated by approximately 5 percentage points and the flexible packaging component overstated by approximately 5 percentage points. Given the robust basis for compilation of the Industry Edge data, we propose therefore to revise base year beverage container consumption data for the DRIS so that it is in line with primary sourced data. The effect of this change is to alter the proportionate split of beverage containers, non-beverage containers and flexible packaging to 30%, 8% and 62%
.
National Environment Protection CouncilDistributional and Cost Benefit Analysis for the Packaging Impacts Decision RIS: Data assumptions
14.

respectively, held constant over time (see Table 7)5. Total packaging consumption estimates are largely unaffected.
The approach used in the CRIS to develop packaging consumption growth projections appears to be soundly based. The approach produces a contestable outcome, however, in that per capita consumption of packaging falls, albeit slightly, over the period of the analysis. Nevertheless, in the absence of specific evidence or a rationale to challenge this outcome, we have accepted the CRIS packaging assumptions for the purpose of the DRIS analysis.
3.1.3 DRIS assumptionsDRIS assumptions for packaging consumption growth and composition of packaging consumption are outlined in Table 6 and Table 7 respectively.
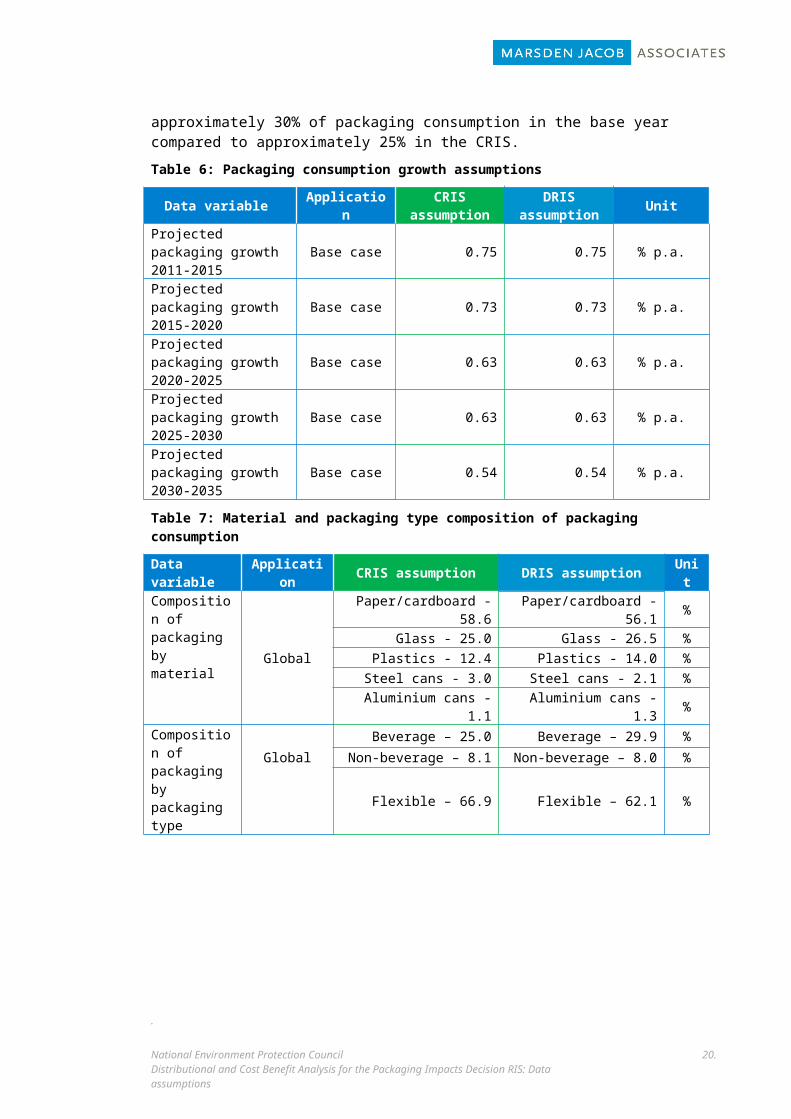
As previously noted, all assumptions on packaging consumption growth that are applied in the CRIS are recommended for use in the DRIS. However, the split between beverage container and other packaging has been revised to reflect the new primary sourced packaging consumption data discussed earlier. Thus beverage containers are estimated in the DRIS to represent approximately 30% of packaging consumption in the base year compared to approximately 25% in the CRIS.
Table 6: Packaging consumption growth assumptions
Data variable Application CRIS assumption DRIS assumption Unit
Projected packaging growth 2011-2015 Base case 0.75 0.75 % p.a.
Projected packaging growth 2015-2020 Base case 0.73 0.73 % p.a.
Projected packaging growth 2020-2025 Base case 0.63 0.63 % p.a.
Projected packaging growth 2025-2030 Base case 0.63 0.63 % p.a.
Projected packaging growth 2030-2035 Base case 0.54 0.54 % p.a.
Table 7: Material and packaging type composition of packaging consumption
Data variable Application CRIS assumption DRIS assumption Unit
Composition of packaging by material
Global
Paper/cardboard - 58.6 Paper/cardboard - 56.1 %
Glass - 25.0 Glass - 26.5 %Plastics - 12.4 Plastics - 14.0 %
Steel cans - 3.0 Steel cans - 2.1 %Aluminium cans - 1.1 Aluminium cans - 1.3 %
Composition of packaging by packaging type
Beverage – 25.0 Beverage – 29.9 %
Global Non-beverage – 8.1 Non-beverage – 8.0 %Flexible – 66.9 Flexible – 62.1 %
5 Available Industry Edge data is consistent with APC data, confirming that non-beverage containers represent approximately 8% of all packaging. Instead, it is flexible packaging that appears to have been overstated (in proportionate terms).
.
National Environment Protection CouncilDistributional and Cost Benefit Analysis for the Packaging Impacts Decision RIS: Data assumptions
15.
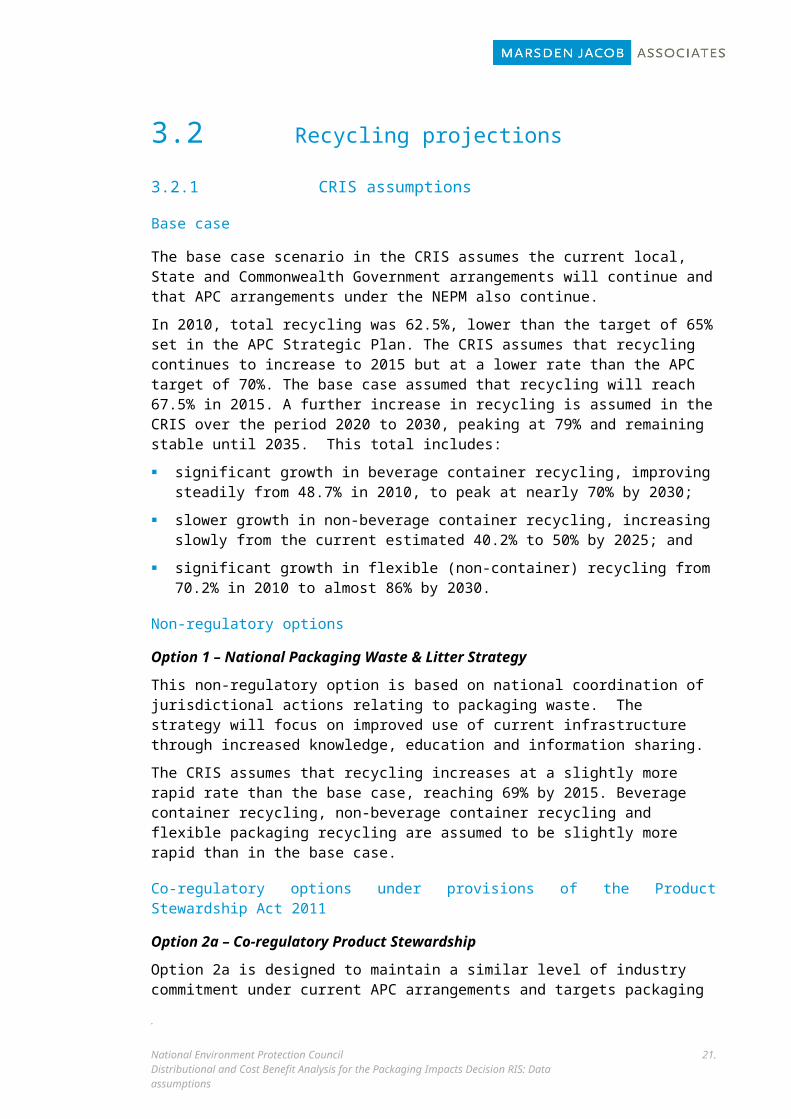
3.2 Recycling projections3.2.1 CRIS assumptionsBase case
The base case scenario in the CRIS assumes the current local, State and Commonwealth Government arrangements will continue and that APC arrangements under the NEPM also continue.
In 2010, total recycling was 62.5%, lower than the target of 65% set in the APC Strategic Plan. The CRIS assumes that recycling continues to increase to 2015 but at a lower rate than the APC target of 70%. The base case assumed that recycling will reach 67.5% in 2015. A further increase in recycling is assumed in the CRIS over the period 2020 to 2030, peaking at 79% and remaining stable until 2035. This total includes:
significant growth in beverage container recycling, improving steadily from 48.7% in 2010, to peak at nearly 70% by 2030;
slower growth in non-beverage container recycling, increasing slowly from the current estimated 40.2% to 50% by 2025; and
significant growth in flexible (non-container) recycling from 70.2% in 2010 to almost 86% by 2030.
Non-regulatory options
Option 1 – National Packaging Waste & Litter Strategy
This non-regulatory option is based on national coordination of jurisdictional actions relating to packaging waste. The strategy will focus on improved use of current infrastructure through increased knowledge, education and information sharing.
The CRIS assumes that recycling increases at a slightly more rapid rate than the base case, reaching 69% by 2015. Beverage container recycling, non-beverage container recycling and flexible packaging recycling are assumed to be slightly more rapid than in the base case.
Co-regulatory options under provisions of the Product Stewardship Act 2011
Option 2a – Co-regulatory Product Stewardship
Option 2a is designed to maintain a similar level of industry commitment under current APC arrangements and targets packaging ‘brand owners’ as the liable parties. This would involve enforceable targets based on overall achievement of targets identified in the APC Strategic Plan 2010-2015. The CRIS assumes that recycling rates under this option would increase at a slightly faster pace than in the base case, with a 75% recycling rate achieved by 2020. The slightly increased recycling rate is due to the potential for additional recycling targets being established under the Product Stewardship Act 2011, as well as greater industry/PSO responsibility. Over time, however, the CRIS assumes that the difference between the base case and Option 2a will decline, reflecting an increase in APC membership under the base case. Beverage container recycling is assumed to be more rapid than in the base case, reaching 70% by 2025, and 75% by 2030. This is assumed to be the probable maximum beverage container recycling rate in the absence of financial incentives for beverage consumers or development of alternative markets for used packaging materials..
National Environment Protection CouncilDistributional and Cost Benefit Analysis for the Packaging Impacts Decision RIS: Data assumptions
16.
Option 2b – Industry Packaging Stewardship
Option 2b is based on the development of a new product stewardship scheme to tackle specific issues including beverage container recycling and litter prevention. The option builds on Option 2a and includes an enhanced focus on away-from-home beverage container recycling and packaging litter reduction. It deals with all packaging materials, but with targeted initiatives on beverage containers and glass market development. The National Bin Network proposal made by members of the packaging industry is a core element of the option. The rate of increase in beverage container recycling under this option is assumed to be greater than in the base case and Options 1 and 2a, with an industry claim of 70% beverage container recycling after five years of operation accepted. As a result, overall growth of recycling is slightly more rapid than under Option 2a, with 77% recycling by 2020, 82% by 2025 and 82% maintained to 2035.
Option 2c – Extended Packaging Stewardship
Option 2c is based on a co-regulatory approach, with the APC being regulated under the Product Stewardship Act. It is assumed that this option will have significantly greater industry funding than Option 2b and therefore would involve a significant increase in recycling and litter initiatives and increased recycling rates relative to Option 2b. An overall recycling rate of 83% is assumed to be achieved by 2035, with beverage container recycling reaching 72.5% by 2020 and 80% by 2025.
Mandatory product stewardship options
Option 3 – Advance Disposal Fee
This option is assumed to be funded through the application of a mandatory Advance Disposal Fee (ADF) on packaging, with the funds to be collected and administered by the Commonwealth Government. These funds would be used for similar initiatives to Option 2c. Assumed recycling rates are therefore the same as for Option 2c.
Option 4a – Boomerang Alliance Container Deposit Scheme
The Boomerang Alliance (BA) has proposed a national CDS with a 10 cent upfront deposit (payable by domestic producers and importers of sealed beverages) and a 10 cent refund for redeemed containers.
The CRIS assumes that following implementation of the BA CDS in 2016, beverage container recycling increases to 80% by 2020, climbing further to 85% by 2025 and remaining steady at that level to 2035. This recycling rate is higher than that achieved in SA in 2009/10 (which was 81.4% of containers eligible for redemption6). Outcomes for non-beverage packaging are assumed in the CRIS to be in line with the base case.
Option 4b – Centralised Container Refund Scheme
This option is assumed to be an industry managed, mandatory CDS scheme operating under the Product Stewardship Act. The scheme combines features of the British Columbia CDS and some aspects of the SA CDS. However, it differs from the SA CDS in that option 4b has a single central non-government coordinator, appointed by government, whereas the SA CDS is coordinated by multiple industry-run supercollectors. It also differs from the BA CDS in configuration of infrastructure, notably the revised version submitted by BA, which has a much greater reliance on RVMs (see section 2.2). Nevertheless, the CRIS assumes that recycling rates will be the same as for Option 4a.
6 Note that the SA scheme covers a narrower range of beverage containers than proposed under Options 4a or 4b..
National Environment Protection CouncilDistributional and Cost Benefit Analysis for the Packaging Impacts Decision RIS: Data assumptions
17.
3.2.2 DiscussionBase case
We concur with the view expressed in the CRIS regarding uncertainty about projecting future recycling rates, especially beyond the next 10 to 15 years. Nevertheless, we note that government waste management policies and investments have been the major factors driving growth in recycling in the past. Given this, it is our view that, in the absence of significant additional policy drivers, or additional new government investment above what is already occurring, growth in recycling rates is likely to slow considerably beyond 2015. This slowed rate of growth is not fully reflected in the base case recycling rates presented in the CRIS, which assume annual growth in overall recycling of almost 1% between 2015 and 2030, compared with a growth rate of a little over 1% between 2010 and 2015. Beverage container recycling is assumed to be about 1.7% between 2015 and 2030.
It is recommended, therefore, that the assumed average annual growth rate in recycling between 2015 and 2030 be reduced by half relative to the CRIS to approximately 0.5%, with the average annual growth rate for beverage container recycling also reduced, to approximately 0.7% per annum.7 The higher assumed growth rates for beverage containers reflect:
recent growth in recycling of beverage containers, which has been higher than growth in recycling of non-beverage containers; and
the fact that the current APC has significantly more initiatives targeting beverage container recycling than non-beverage container packaging.
Options
Options 1, 2a, 2b, 2c and 3
It is recommended that the general approach to estimating recycling rates for Options 1, 2a, 2b, 2c and 3, as outlined in the description of policy options and applied in the CRIS, be retained. The focus of the options in terms of proposed recycling and litter programs should also be retained.
Given proposed adjustments to base case recycling rates, however, the absolute recycling rates for these options, as modelled in the CRIS, are likely to be difficult to attain without very substantial increases in investment, especially in the longer term. Given this, recycling rates for these options have been adjusted in proportion to the changes to base case recycling rates, meaning that the ‘recycling effort’ required to achieve increased recycling rates maintains parity with the options as modelled in the CRIS. Modelled in this way, the options will provide a more useful basis for comparison with the new Options 2d and 2e.
Option 2d – Beverage Container Stewardship
Beverage Container Stewardship is a co-regulatory product stewardship scheme under the Product Stewardship Act that makes the beverage industry responsible for achieving an 80% national beverage container recycling rate by 2025. Under the scheme, industry product stewardship organisations (co-regulatory arrangements) must meet outcome requirements specified in regulations relating to sustainable packaging design, beverage container recycling and litter reduction. 7 Note, growth rates are assumed to slow over time. For all recyclates the annual growth rates are approximately
1%, 0.5%, 0.5% and 0.25% for 2013-2015, 2015-2020, 2020-2025 and 2025-2030 respectively. For beverage containers, the annual growth rates are approximately 1.5%, 1.0%, 0.5% and 0.25% for 2013-2015, 2015-2020, 2020-2025 and 2025-2030 respectively.
.
National Environment Protection CouncilDistributional and Cost Benefit Analysis for the Packaging Impacts Decision RIS: Data assumptions
18.

The scheme recycling target for 2020 is approximately 72% of beverage containers consumed nationally, rising to 80% by 2025. This rate of 80% is assumed to be maintained through to 2035. Recycling rates for non-beverage containers and flexible packaging are assumed to increase in line with the base case.
Option 2e – Extended Australian Packaging Covenant
The Extended Australian Packaging Covenant is a co-regulatory scheme modelled broadly on the existing APC but with a greater financial commitment from industry. Under the scheme, the packaging industry would provide funding for substantial litter reduction and recycling projects and initiatives, leading to a substantial increase in recycling and reduction in litter. The scheme aims to deliver an 80% national recycling rate for all packaging and a significant reduction in packaging litter by 2020.
Notwithstanding the stated scheme target of 80% national recycling by 2020, achievability of this target will be substantially influenced by overall industry investment in the scheme. For the DRIS, we propose to model three variations of the scheme based on three different levels of investment: $20 million per annum for five years from 2015 to 2020; $35 million per annum; and $50 million per annum.
The impacts of these respective levels of investment on recycling rates will be determined through the application of the ‘Marginal recycling cost curves’ (see Section 4.7).
Options 4a and 4b
Similar beverage container recycling rates to those assumed in the CRIS are recommended for Options 4a and 4b in the DRIS. It seems unlikely however, that the very rapid growth in beverage container recycling rates assumed for the first five years of operation (from 53.8% in 2015 to 80% by 2020) are achievable given the relatively low refund rate of 10c. Less rapid growth in beverage container recycling is therefore proposed for the 2015-2020 period (from 56% to 77.5%). Furthermore, achieving and maintaining high (80% +) beverage container recycling rates will, in our view, require the refund for eligible containers to increase over time. Evidence from South Australia, prior to and following an increase in the refund rate (from 5c to 10c in 2008) indicates that, prior to the increase in refund, the beverage container recycling rate had stagnated at less than 70% overall (EPA South Australia, 2012). Following the increase, the recycling rate grew rapidly to greater than 80% in two years, a level that appears to be holding.
Option 4c – South Australian Container Refund Scheme
The South Australian container refund scheme allows consumers to receive a 10c refund for eligible containers they return to approved depots. Under the proposed scheme, the arrangements currently applied in South Australia would be introduced nationally. Legislation would set out arrangements for authorisation by the government of depots and super-collectors. While legislation would not dictate a particular configuration or type of infrastructure, it is here assumed that depots would be the primary redemption point and their collections would go to super collectors for recycling.
The scheme would cover all beverages sold in Australia in pre-sealed containers of between 100 and 3000mL, with the exception of:
all containers of plain milk;
containers of 1L or more of flavoured milk;
glass containers used for containing wine or spirits;.
National Environment Protection CouncilDistributional and Cost Benefit Analysis for the Packaging Impacts Decision RIS: Data assumptions
19.
containers of 1000mL or more used for pure fruit or vegetable juice (comprising at least 90 per cent fruit juice or vegetable juice, or a mixture of the two);
containers made of cardboard and plastic, or cardboard and foil, that are 1000mL or more, and used for containing wine, wine based beverage, or water; and
containers made of plastic or foil, or plastic and foil, used for the purpose of containing 250mL of wine.
If the South Australian model is adopted nationally, there would be an opportunity to consider extending its coverage to include containers for milk, wine and fruit juice.
3.2.3 DRIS assumptionsBase case
Table 8 and Table 9 provide overviews of base case recycling rate assumptions under the CRIS and proposed for the DRIS respectively. Bearing in mind that a different base year is proposed for use in the DRIS compared with the CRIS (2013 versus 2010), 2015 recycling rates are higher in DRIS than the CRIS, particularly for beverage containers. This reflects revised packaging recycling data used for the baseline analysis (Industry Edge and Equilibrium 2013 – see section 3.1.2). The recycling rates proposed for the DRIS in later periods reflect the revised annual growth rates post 2015 discussed above. Application of the revised growth rates gives an overall national recycling rate of 72.5% in 2030 compared with the rate of 79% used in the CRIS. Recycling rates for beverage containers, non-beverage containers and non-container packaging in 2035 are all lower accordingly.
Table 8: Base Case packaging recycling rate assumptions (CRIS)
2010 2015 2020 2025 2030 2035Overall 62.5% 67.5% 72.5% 77.1% 79.0% 79.0%Beverage 48.7% 53.8% 58.1% 66.8% 69.7% 69.7%Non-beverage 40.2% 44.2% 49.2% 50.0% 50.0% 50.0%Flexible 70.2% 75.4% 80.7% 84.1% 85.9% 85.9%
Table 9: Base Case packaging recycling rate assumptions (DRIS)
2013 2015 2020 2025 2030 2035
Overall 65.1% 67.0% 70.0% 71.6% 72.5% 72.5%Beverage 55.1% 56.8% 60.2% 62.1% 63.0% 63.0%Non-beverage 39.8% 41.1% 42.9% 43.8% 44.2% 44.2%Flexible 73.1% 75.3% 78.2% 79.8% 80.6% 80.6%
Options
Table 10 and Table 11 provide recycling rate assumptions for each of the options under the CRIS and proposed for the DRIS respectively. Projected recycling rates for each option in the DRIS were developed on a five-year basis, with projections to be interpolated between these periods. As in the CRIS, consideration was given to the types of products/materials targeted by the option and the likely yield of the initiatives assumed to be included in the option given their proposed funding.
Table 10: CRIS packaging recycling rate assumptions
.
National Environment Protection CouncilDistributional and Cost Benefit Analysis for the Packaging Impacts Decision RIS: Data assumptions
20.
2010 2015 2020 2025 2030 2035Option 1 Overall 62.5% 68.8% 74.0% 79.0% 81.1% 81.1%Beverage 48.7% 58.8% 63.5% 70.0% 75.0% 75.0%Non-beverage 40.2% 44.9% 50.0% 50.0% 50.0% 50.0%Flexible pack. 70.2% 75.4% 80.7% 85.9% 87.1% 87.1%Option 2a Overall 62.5% 67.5% 75.4% 79.4% 80.6% 80.6%Beverage 48.7% 53.8% 62.3% 70.0% 75.0% 75.0%Non-beverage 40.2% 44.2% 50.0% 50.0% 50.0% 50.0%Flexible pack. 70.2% 75.4% 83.3% 86.4% 86.4% 86.4%Option 2b Overall 62.5% 67.5% 77.3% 81.9% 81.9% 81.9%Beverage 48.7% 53.8% 70.0% 80.0% 80.0% 80.0%Non-beverage 40.2% 44.2% 50.0% 50.0% 50.0% 50.0%Flexible pack. 70.2% 75.4% 83.3% 86.4% 86.4% 86.4%Option 2c Overall 62.5% 67.5% 80.0% 83.2% 85.7% 86.4%Beverage 48.7% 53.8% 72.5% 80.0% 82.5% 85.0%Non-beverage 40.2% 44.2% 55.0% 60.0% 60.0% 60.0%Flexible pack. 70.2% 75.4% 85.7% 87.1% 90.0% 90.0%Option 3 Overall 62.5% 67.5% 80.0% 83.2% 85.7% 86.4%Beverage 48.7% 53.8% 72.5% 80.0% 82.5% 85.0%Non-beverage 40.2% 44.2% 55.0% 60.0% 60.0% 60.0%Flexible pack. 70.2% 75.4% 85.7% 87.1% 90.0% 90.0%Option 4a Overall 62.50% 67.50% 77.90% 81.60% 82.80% 82.80%Beverage 48.70% 53.80% 80.00% 85.00% 85.00% 85.00%Non-beverage 40.20% 44.20% 49.20% 50.00% 50.00% 50.00%Flexible pack. 70.20% 75.40% 80.70% 84.10% 85.90% 85.90%Option 4b Overall 62.50% 67.50% 77.90% 81.60% 82.80% 82.80%Beverage 48.70% 53.80% 80.00% 85.00% 85.00% 85.00%Non-beverage 40.20% 44.20% 49.20% 50.00% 50.00% 50.00%Flexible pack. 70.20% 75.40% 80.70% 84.10% 85.90% 85.90%
.
National Environment Protection CouncilDistributional and Cost Benefit Analysis for the Packaging Impacts Decision RIS: Data assumptions
21.

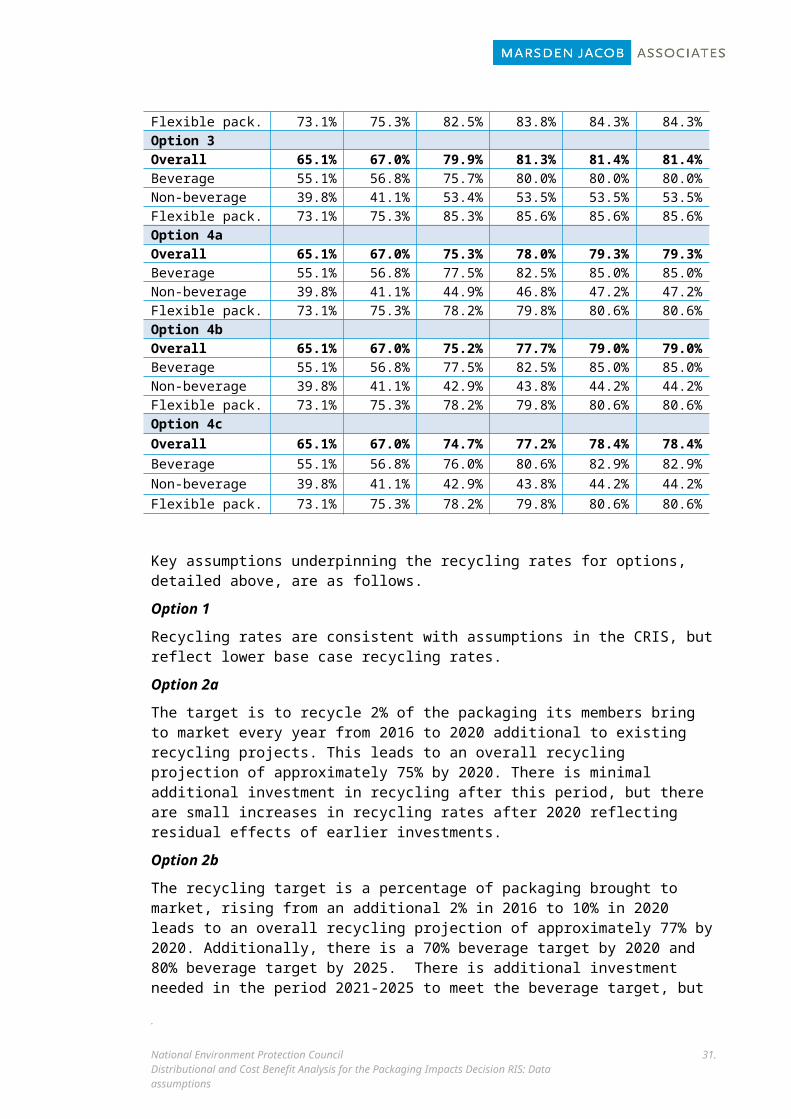
Table 11: DRIS packaging recycling rate assumptions
2013 2015 2020 2025 2030 2035Base case Overall 65.1% 67.0% 70.0% 71.6% 72.5% 72.5%Beverage 55.1% 56.8% 60.2% 62.1% 63.0% 63.0%Non-beverage 39.8% 41.1% 42.9% 43.8% 44.2% 44.2%Flexible pack. 73.1% 75.3% 78.2% 79.8% 80.6% 80.6%Option 1 Overall 65.1% 67.0% 72.0% 74.0% 74.6% 74.6%Beverage 55.1% 56.8% 64.6% 64.9% 65.3% 65.3%Non-beverage 39.8% 41.1% 43.9% 44.6% 45.0% 45.0%Flexible pack. 73.1% 75.3% 79.2% 82.1% 82.9% 82.9%Option 2a Overall 65.1% 67.0% 74.8% 75.0% 75.0% 75.0%Beverage 55.1% 56.8% 67.0% 67.0% 67.0% 67.0%Non-beverage 39.8% 41.1% 45.8% 45.8% 45.8% 45.8%Flexible pack. 73.1% 75.3% 82.3% 82.6% 82.6% 82.6%Option 2b Overall 65.1% 67.0% 77.0% 78.9% 79.0% 79.0%Beverage 55.1% 56.8% 73.8% 80.0% 80.0% 80.0%Non-beverage 39.8% 41.1% 46.6% 46.6% 46.6% 46.6%Flexible pack. 73.1% 75.3% 82.4% 82.6% 82.6% 82.6%Option 2c Overall 65.1% 67.0% 79.9% 81.3% 81.4% 81.4%Beverage 55.1% 56.8% 75.7% 80.0% 80.0% 80.0%Non-beverage 39.8% 41.1% 53.4% 53.5% 53.5% 53.5%Flexible pack. 73.1% 75.3% 85.3% 85.6% 85.6% 85.6%Option 2d Overall 65.1% 67.0% 74.8% 78.6% 79.8% 79.8%Beverage 55.1% 56.8% 72.5% 80.0% 82.0% 82.0%Non-beverage 39.8% 41.1% 44.4% 46.0% 46.6% 46.6%Flexible pack. 73.1% 75.3% 79.8% 82.1% 83.0% 83.0%Option 2e ($20 m) Overall 65.1% 67.0% 74.5% 76.0% 76.7% 76.7%Beverage 55.1% 56.8% 69.5% 71.0% 71.7% 71.7%Non-beverage 39.8% 41.1% 47.5% 49.8% 51.4% 51.4%Flexible pack. 73.1% 75.3% 80.4% 81.7% 82.3% 82.3%Option 2e ($35 m) Overall 65.1% 67.0% 75.6% 77.0% 77.7% 77.7%Beverage 55.1% 56.8% 70.9% 72.4% 73.1% 73.1%Non-beverage 39.8% 41.1% 48.4% 50.7% 52.3% 52.3%Flexible pack. 73.1% 75.3% 81.3% 82.6% 83.2% 83.2%Option 2e ($50 m) Overall 65.1% 67.0% 76.4% 77.8% 78.5% 78.5%Beverage 55.1% 56.8% 70.9% 72.4% 73.1% 73.1%Non-beverage 39.8% 41.1% 49.6% 51.8% 53.4% 53.4%Flexible pack. 73.1% 75.3% 82.5% 83.8% 84.3% 84.3%
.
National Environment Protection CouncilDistributional and Cost Benefit Analysis for the Packaging Impacts Decision RIS: Data assumptions
22.
Option 3Overall 65.1% 67.0% 79.9% 81.3% 81.4% 81.4%Beverage 55.1% 56.8% 75.7% 80.0% 80.0% 80.0%Non-beverage 39.8% 41.1% 53.4% 53.5% 53.5% 53.5%Flexible pack. 73.1% 75.3% 85.3% 85.6% 85.6% 85.6%Option 4a Overall 65.1% 67.0% 75.3% 78.0% 79.3% 79.3%Beverage 55.1% 56.8% 77.5% 82.5% 85.0% 85.0%Non-beverage 39.8% 41.1% 44.9% 46.8% 47.2% 47.2%Flexible pack. 73.1% 75.3% 78.2% 79.8% 80.6% 80.6%Option 4b Overall 65.1% 67.0% 75.2% 77.7% 79.0% 79.0%Beverage 55.1% 56.8% 77.5% 82.5% 85.0% 85.0%Non-beverage 39.8% 41.1% 42.9% 43.8% 44.2% 44.2%Flexible pack. 73.1% 75.3% 78.2% 79.8% 80.6% 80.6%Option 4c Overall 65.1% 67.0% 74.7% 77.2% 78.4% 78.4%Beverage 55.1% 56.8% 76.0% 80.6% 82.9% 82.9%Non-beverage 39.8% 41.1% 42.9% 43.8% 44.2% 44.2%Flexible pack. 73.1% 75.3% 78.2% 79.8% 80.6% 80.6%
Key assumptions underpinning the recycling rates for options, detailed above, are as follows.
Option 1
Recycling rates are consistent with assumptions in the CRIS, but reflect lower base case recycling rates.
Option 2a
The target is to recycle 2% of the packaging its members bring to market every year from 2016 to 2020 additional to existing recycling projects. This leads to an overall recycling projection of approximately 75% by 2020. There is minimal additional investment in recycling after this period, but there are small increases in recycling rates after 2020 reflecting residual effects of earlier investments.
Option 2b
The recycling target is a percentage of packaging brought to market, rising from an additional 2% in 2016 to 10% in 2020 leads to an overall recycling projection of approximately 77% by 2020. Additionally, there is a 70% beverage target by 2020 and 80% beverage target by 2025. There is additional investment needed in the period 2021-2025 to meet the beverage target, but there is minimal further investment in non-beverage recycling in that period. After 2025, small increases in recycling rates reflect residual effects of earlier investments.
Option 2c
The recycling target is a percentage of packaging brought to market, rising from an additional 3% in 2016 to 16% in 2020 leads to an overall recycling projection of approximately 80% by 2020. Additionally, there is a 70% beverage target by 2020 and 80% beverage target by 2025. There is additional investment needed in the period 2021-2025 to meet the beverage target, but
.
National Environment Protection CouncilDistributional and Cost Benefit Analysis for the Packaging Impacts Decision RIS: Data assumptions
23.

there is minimal further investment in non-beverage recycling in that period. After 2025, small increases in recycling rates reflect residual effects of earlier investments.
Option 2d
There is a 72.5% beverage recycling target by 2020 and 80% by 2025. Incremental growth in beverage container recycling rates after 2025 reflect residual impacts of investments up to 2025. Non-beverage recycling rates experience a small degree of growth due to projects that collect a mix of beverage and non-beverage materials.
Option 2e
Recycling rates have been determined through application of the Marginal Recycling Cost Curves at three different levels of investment: $20 million per annum for five years, $35 million per annum for five years and $50 million per annum for five years.
Option 3
Outcomes are assumed to match Option 2c.
Option 4a
Rapid growth in beverage container recycling rates are assumed for the period from 2015 to 2020, although less rapid than assumed in the CRIS. Growth slows after 2020, reaching 82.5% in 2025 (assumed to be maximum feasible with a 10c refund). As previously noted, changes to the refund rate are proposed under the DRIS for Option 4a, as well as for Options 4b and 4c. These are set out in Table 12 below. Increases are in 5c increments approximately in line with projected increases in CPI.
Table 12: Proposed beverage container refund for Options 4a, 4b and 4c
2015 2020 2025 2030 2035
Refund rate 10c 10c 15c 15c 20c
An increase in the refund to 15c in 2025 leads to further growth in the beverage container recycling rate to 85% in 2030. An increase in the refund to 20c in 2035 will be necessary to maintain the recycling rate at this level.
Non-beverage rates are consistent with the base case except that some interest earned on funds from the scheme’s operating surplus in the early years of operation are assumed to be used for a rural recycling grants program. This increases recycling rates for non-beverage containers above the base case.
Option 4b
Recycling rates for beverage containers are the same as for Option 4a. There is a rapid growth in beverage recycling rates between 2015 and 2020. Growth slows after 2020, reaching 82.5% in 2025 (assumed to be maximum feasible with a 10c refund). An increase in the refund to 15c in 2025 leads to further growth to 2030. Non-beverage rates are consistent with the base case.
Option 4c
As per Options 4a and 4b, except that a smaller range of beverage containers covered by 4c results in beverage container recycling rates of approximately 2 to 2.5 percentage points lower than Options 4a and 4b over the life of the assessment. Wine, fruit juice and milk containers are the principal container types assumed to be excluded from Option 4c. Drawing on industry
.
National Environment Protection CouncilDistributional and Cost Benefit Analysis for the Packaging Impacts Decision RIS: Data assumptions
24.

data, estimates of wine, milk and fruit juice consumption in Australia indicate that wine containers represent approximately 2% of all beverage containers covered by Options 4a and 4b8. Fruit juice containers represent a further 2% of containers and milk 9% of containers. Drawing on this data, estimates of beverage container recycling rates have been made assuming base case recycling rates for milk, wine and fruit juice containers respectively and the same recycling rates as for Options 4a and 4b for all other containers. Results of this process are presented in Table 13.
Table 13: Estimated recycling rates for beverage containers, Option 4c
2015 2020 2025 2030 2035
Milk containers % of total recycled beverage containers 8.1% 8.2% 8.4% 8.5% 8.7%
Weighted average recycling rate milk containers 68.1%
69.0%
70.0%
70.5%
70.5%
Wine & fruit juice containers % of total beverage containers 4.0% 3.9% 3.9% 3.8% 3.8%
Weighted average recycling rate wine and fruit juice containers
56.0%
58.2%
60.5%
61.8%
61.8%
All other containers % of total beverage containers 87.9%
87.8%
87.7%
87.6%
87.5%
Weighted average recycling rate all other containers 54.9%
77.5%
82.5%
85.0%
85.0%
Option 4c beverage container recycling rates 57.7%
76.1%
80.6%
82.9%
82.9%
8 DRIS calculations drawing on industry consumption and sales data including from ABS 2012, Dairy Australia 2013 and Fruit Juice Australia 2012
.
National Environment Protection CouncilDistributional and Cost Benefit Analysis for the Packaging Impacts Decision RIS: Data assumptions
25.

3.3 Litter projections3.3.1 CRIS assumptionsLitter projections used in the CRIS are based on an estimate of the proportion of packaging that may end up as litter. Drawing on the Problem Report for Packaging (PWC 2012), this was estimated to be around 1 million tonnes in 2010. Total litter per annum was estimated to be between 40,000-160,000 tonnes, implying litter rates of 4%-16% of total packaging that may be littered.
The CRIS assumes that packaging litter quantities were approximately 60,000 tonnes in 2010, based on an assumed littering rate of 6% of the estimated 1 million tonnes of packaging that may be littered.
Litter reduction estimates are provided in the CRIS for the base case and each of the options as set out in the table below.
Table 14: CRIS litter reduction assumptions
Litter reduction assumption (%)
Year Option 1
Option 2a
Option 2b
Option 2c
Option 3
Option 4a
Option 4b
2010 0 0 0 0 0 0 0
2015 5 5 5 5 5 5 5
2020 10 10 11.1 11.1 11.1 7.2 7.2
2025 15 15 15.4 15.4 15.4 11.5 11.5
2030 15 15 15.4 15.4 15.4 12.4 12.4
2035 15 15 15.4 15.4 15.4 12.4 12.4
3.3.2 DiscussionAs noted in the CRIS, estimation of litter levels is problematic given the limited availability of litter data nationally. Even so, minimal information is provided in the CRIS to support the litter reduction estimates for each of the options presented. Thus it should be possible to provide more robust estimates than are provided there. Three steps need to be taken before litter rates can be estimated for the base case and options though:
1. The current (baseline) litter rate must be estimated.
2. This rate can then be used to estimate consumers’ ‘propensity to litter’.
3. Estimates of potential changes to consumers’ propensity to litter under the different options must then be made.
These steps are discussed below.
Step 1 – current litter rate
An estimate of current annual litter rates can be made by developing estimates of the quantities of litter cleaned up each year (QLC), the change in the stock of litter on land (∆ LLS) and the .
National Environment Protection CouncilDistributional and Cost Benefit Analysis for the Packaging Impacts Decision RIS: Data assumptions
26.

quantity of litter ending up in the marine environment each year (QML) – see Box 1, equations (1) to (6).
Box 1. Litter stocks and flowsLitter can be measured in terms of litter stocks and litter flows. The change in the stock of litter from one year to the next (∆LS) is the sum of the change in the land based stock of litter (∆LLS) and marine based stock of litter (∆MLS), expressed as:
(1) ∆ LS = ∆ LLS + ∆ MLS
The change in land based stock of litter is in turn the sum of the quantity littered on land and remaining on land (QLL) less the quantity cleaned up on land (QLC), expressed as:
(2) ∆ LLS = QLL-QLC
Similarly, the change in marine based stock of litter is the sum of the quantity littered on land and transported to the marine environment (QML(LB)) and the quantity littered at sea (QML(MB) - noting that the quantity of litter cleaned up in the marine environment is assumed to be zero since little if any marine litter is cleaned up9). This is expressed as:
(3) ∆ MLS = QML(LB)+QML(MB)
Drawing on equations (1) to (3), the total littered in any one year (QL) can be expressed in the following three equations:
(4) QLL = QLC + ∆ LLS
(5) QML =QML(LB) + QML(MB)
(6) QL = QLL + QML
Although there are no specific data available for QLC, ∆ LLS and QML, it is possible to interpolate from available data to provide estimates for each of these variables.
Quantity of litter clean up (QLC)
An estimate of annual packaging litter clean up in Australia has been made drawing on Clean Up Australia data (Clean Up Australia 2010) and Victorian Local Government data (Sustainability Victoria 2011).
The data, presented in Table 15, extrapolates Victorian local government litter clean up data to a national basis based on population and assuming roughly equivalent litter levels between Victoria and other jurisdictions. Litter collection associated with the annual Clean Up Australia day has been added to the local government total to arrive at an estimate of total litter clean up for Australia. This total is then adjusted to exclude non-packaging litter, with estimated proportions (on a weight basis) of packaging litter to total litter being as follows:
litter traps – packaging litter 66%;
illegally dumped rubbish – packaging litter 15%;
roadside litter – packaging litter 90%; and
Clean Up Australia – packaging litter 90%.
9 Except for litter that has been washed onto beaches, which is counted in estimates of QLC. Also, litter in freshwater environments (lakes, rivers, drains) is accounted for when it flows to marine environments or is cleaned up on land (e.g. litter traps).
.
National Environment Protection CouncilDistributional and Cost Benefit Analysis for the Packaging Impacts Decision RIS: Data assumptions
27.

Data for the two years has been averaged to 67,706 tonnes/ year.
Table 15: Estimates of packaging litter clean up in Australia (tonnes)
2008/09 Estimated 2009/10 Estimated
ActivityAll litter
(t)Packaging
(t)All litter
(t)Packaging
(t)
Litter traps 11,175 7,376 10,877 7,179
Illegally dumped rubbish 64,763 9,714 61,061 9,159
Roadside litter 41,228 37,105 40,378 36,340
Clean Up Australia 15,560 14,004 16,150 14,535
All activities 132,726 68,199 128,466 67,213
Sources: Clean Up Australia 2010; Sustainability Victoria 2011
Change in land based litter stock (∆LLS)
Estimating the change in land based litter stock is more problematic there being no reliable data on the stock of litter nationally. National Litter Index (NLI) data (Keep Australia Beautiful, 2010) provides estimates of litter stock by undertaking a litter count at approximately 1000 sites across Australia each year. There are a number of potential problems with this data though, including that:
the data is provided on a per item and volume basis rather than by weight;
sample sites do not account for population densities;
sample sites only cover land based litter; and
the same sample sites are used each year.
Noting these shortcomings, it is feasible to calculate an indicative estimate of the land based litter stock in Australia by extrapolating from the NLI to all built up areas in Australia and then converting the NLI volumetric data to tonnes. A similar method was adopted in the CRIS. Data from this exercise is presented in Table 16 below.
Table 16: Estimated stock of land based packaging litter, built up areas
Packaging litterglass metal paper/
paperboard plastic Total
Total volume/ NLI survey sites (litres) 685.6 1272.7 2056.9 2528.4 6543.6Total area of survey sites (m2)
983,000
983,000
983,000
983,000
983,000
Area of built environment, Australia (m2)
26,313,000,000
26,313,000,000
26,313,000,000
26,313,000,000
26,313,000,000
Site volumes extrapolated across built up areas (m3)
18,352
34,068
55,059
67,680
175,159
Conversion factor (m3 to tonnes) 0.347 0.039 0.1 0.013
Estimated land based litter stock built up areas (tonnes)
6,368
1,329
5,506
880
14,083
.
National Environment Protection CouncilDistributional and Cost Benefit Analysis for the Packaging Impacts Decision RIS: Data assumptions
28.

Sources: Geosciences Australia, Bureau of Rural Sciences 2010; Keep Australia Beautiful 2010; Sustainability Victoria 2011
Due to uncertainties with the extrapolation process and shortcomings with the NLI data, the estimate provided in this table should be regarded as having a wide margin of error. Nevertheless it provides a useful basis for estimating changes in litter stock, which can be made by drawing on trends in litter stock established through NLI data. Figure 1 provides a summary of the number of litter items collected at NLI sites, averaged over Australia for the period 2005/06 to 2011/12. The data indicates that there may be a slight downwards trend in the total stock of litter in Australia over time, suggesting that the amount being littered is falling steadily, albeit at uneven rates between jurisdictions; estimated at approximately 3.1% per annum over this period.
Figure 1: Trends in Australian litter count (items)
2005/06 2006/07 2007/08 2008/09 2009/10 2010/11 2011/120
5
10
15
20
25
30
35
40
45
50
AustraliaNSWVictoriaQueenslandSAWATasACTNT
Source: Macgregor Tan Research, National Litter Index Annual Report 2011-12
Drawing on the total stock estimates in Table 16 and the average annual rate of change provided in Figure 1 of -3.1%, the change in land based litter stock from one year to the next has been estimated at – 437 tonnes/ year. 10
Land based litter rate (QLL)
Thus, applying the equation QLL = ∆ LLS + QC we derive an estimate for land based litter, Australia wide, in the base year of 67,269 tonnes where:
- QC = 67,706 tonnes
- ∆ LLS = - 437 tonnes
Marine litter rate (QML)
Data on the quantity of marine litter is also absent. Nevertheless an estimate has been derived by first developing a ‘bottom-up’ estimate of marine litter drawing on NLI data and comparing
10 Although the estimate of total stock of litter is highly uncertain, changing the estimate of land base litter stock , even by a significant quantity, will not greatly affect the estimate of ∆ LLS.
.
National Environment Protection CouncilDistributional and Cost Benefit Analysis for the Packaging Impacts Decision RIS: Data assumptions
29.

this with a ‘top-down’ estimate derived from international marine litter estimates. Both the bottom up and top estimates are presented in Table 17. The bottom up estimate is derived from NLI data (Macgregor Tan research 2012), which can be used to derive an estimate of beach litter. From this estimate, an estimate of marine litter can be derived in turn, with a number of studies (Hardesty & Wilcox 2011, Taffs & Cullen 2005, UNEP 2005) indicating that approximately 15% of litter entering the marine environment (from either land or sea base sources) ends up on beaches. Using this approach, marine litter is estimated to be around 12,000 tonnes per annum. The top down estimate is derived from international data (UNEP 2005), indicating that approximate 6.4 million tonnes of litter enter the world’s oceans each year11. On a per capita basis this represents more than 20,000 tonnes per annum12.
A mid-point between the two estimates of 16,254 tonnes per annum is used as the estimate of total litter entering the marine environment in any one year. It is necessary to estimate the proportion of this total that is packaging litter. This in turn involves understanding the sources of marine litter (land-based versus sea-based) and the proportions of each source that are likely to be packaging litter. Studies indicate that a little under half of all litter entering the marine environment comes from land based sources, but that land based sources are the dominant source of packaging litter, with significant quantities of packaging litter, principally plastics, being washed into bays, estuaries and oceans via stormwater and waterways (Hardesty & Wilcox 2011, Taffs & Cullen 2005, UNEP 2005). In total, it is estimated that 8,712 tonnes of packaging litter enters the marine environment each year, just over half of all marine litter.
Table 17: Estimate of marine packaging litter
‘Bottom up’ marine litter estimate drawing on NLI data Land based litter annual (tonnes) 67,269Beach litter as a proportion of land based litter 2.7%Estimated beach litter (tonnes) 1,791 Beach litter as a proportion of marine litter 15%Annual marine litter (tonnes) 11,937
‘Top down’ marine litter estimate drawing on UNEP data Annual quantity of marine litter globally 6,400,000
Annual marine litter (tonnes) 20,571
Marine litter as packaging Marine litter (mid-point estimate) (tonnes) 16,254 Proportion as land-based 48%Proportion as sea-based 52%
Proportion of land-based as packaging (principally plastics) 90%Proportion of sea-based as packaging 20%Land based litter as packaging (tonnes) 7,022 Sea based litter as packaging (tonnes) 1,690 Total packaging litter entering marine environment (tonnes) 8,712
Sources: Hardesty & Wilcox 2011; Macgregor Tan research 2012; Taffs & Cullen 2005; UNEP 200511 The UNEP notes that this estimate is highly uncertain.12 There are arguments in favour of Australia having higher per capita rates or lower per capita rates of marine
litter than the global average. Arguments in favour of Australia having higher rates include relatively high per capita consumption levels and a lengthy coastline. Arguments in favour of Australia having lower than average rates include relatively advanced waste management and litter control practices in Australia and low population density along large stretches of its coast.
.
National Environment Protection CouncilDistributional and Cost Benefit Analysis for the Packaging Impacts Decision RIS: Data assumptions
30.
Total litter rate (QL)
Drawing on the data presented above, the total litter rate is estimated currently to be 75,981 tonnes per year, comprising 67,269 tonnes of land based litter and 8,712 tonnes of packaging marine litter (of which 7,022 tonnes is littered on land but ends up in the marine environment). This total is used as the baseline figure for the purpose of estimating future litter rates in Australia under the base case and options.
The data presented above also provides the following summary information on the status of litter stocks and flows in Australia:
Of the 67,269 tonnes of land based litter flowing into the environment in a year, 67,706 tonnes are cleaned up each year. This means that the total stock of land based litter is falling gradually from one year to the next.
On the other hand, little if any of the marine litter is cleaned up (except for the litter that is washed ashore and counted in the land based litter clean up). This means that the stock of marine litter is likely to be increasing substantially from one year to the next.
It is acknowledged that the litter data presented here has a high degree of uncertainty. Even so, because this uncertainty applies both to base case litter rates and litter rates under options, it should be feasible to develop reasonably robust estimates of the impact of options on litter rates relative to the base case.
Nevertheless, the uncertainty points to the desirability of improving information on land and marine litter rates, clean up and stocks in Australia.
Step 2 – Propensity to litter, base case
CRIS estimate
Table 18 outlines the approach used in the CRIS to estimate waste littered as a proportion of total packaging waste (6%). How this estimate is used to derive estimates of litter reductions under the base case and each of the options is unclear. Nevertheless, the CRIS appears to be on the right track in using changes to the ‘quantity of material available to be littered’ as the basis for estimating ‘propensity to litter’ under the base case.
Table 18: CRIS approach to estimating litter (tonnes)
CRIS approach to estimating litter and litter reductions
Packaging consumption (tonnes) 4,428,224 less total recycled 2,764,407 Waste landfilled or littered (tonnes) 1,663,817 less distribution packaging 663,817 Packaging available to be littered (tonnes) 1,000,000 Annual litter 60,000 Propensity to litter (packaging littered as a proportion of total packaging available to be littered) 6.0%
.
National Environment Protection CouncilDistributional and Cost Benefit Analysis for the Packaging Impacts Decision RIS: Data assumptions
31.

DRIS estimates
Rather than deriving estimates of the quantity of material available to be littered from total packaging consumption and total recycling, we suggest that this estimate would be better derived by differentiating ‘public place’ packaging consumption from packaging consumption in other places, with available evidence indicating that it is public place packaging consumption that is the principal source of litter (Beverage Industry Environment Council 2004).
Public places are defined in the material flows analysis for this project to include:
LGA public places including public parks, gardens, public recreational facilities and streets; and
commercial public places including shopping centres, commercial recreational facilities and commercial venues open to the public (e.g. hotels and restaurants).
Transfer of flexible paper and cardboard packaging from ‘public place’ packaging to ‘other’ packaging (for the purpose of calculating public place propensity to litter only) is also proposed, since the major sources of this type of packaging (e.g. cardboard boxes used for storing consumer items sold at shopping centres) are likely to be the back of shops, hotels etc., meaning that very little of it is likely to be littered.13
Estimates of the propensity to litter for ‘public place packaging’ and ‘other packaging’ are presented in Table 19 and Table 20 respectively.
The public place propensity is derived by estimating the total amount of public place packaging available to be littered (excluding paper and cardboard flexible packaging - approximately 244,000 tonnes) and the proportion of this waste that is actually littered (approximately 59,000 tonnes), producing a propensity to litter estimate for public place packaging consumption of 24.2%.14 The litter rate used to calculate the propensity to litter estimate is derived from the total annual litter rate previously described (75,981 tonnes), with a proportional breakdown between public place and other litter derived from National Litter Index data (see Table 21).
The propensity to litter for other packaging consumption is calculated using the same approach, producing an estimate of 1.3%.
13 It is acknowledged that this approach leaves out paper and cardboard containers used in fast food outlets, which are a significant source of public place packaging litter. Therefore, the estimate of ‘propensity to litter, public place packaging consumption’ (Table 19) is likely to be slightly understated. It is not feasible to separate out paper and cardboard food containers from other public place paper and cardboard in the material flows analysis though, and including all paper and cardboard in the public place propensity to litter estimates is likely to be a greater source of error than overlooking paper and cardboard food containers. Importantly, public place paper and cardboard packaging is included in the estimate of ‘propensity to litter other packaging consumption’ (see Table 20), with the result that the estimate of ‘propensity to litter other packaging’ is likely to be slightly overstated.
14 Note this estimate is consistent with observational data of littering behaviour undertaken for the Victorian Litter Report between 2003 and 2010 (Sustainability Victoria 2011b). In most years between 2003 and 2010 25% to 30% of people consuming items in public places were observed to litter (with the remainder disposing of waste correctly in bins). In one of the years the observed littering rate was significantly higher than this range (35%), and in another of the years it was significantly lower (16%). It is also consistent with earlier surveys undertaken as part of the Littering Behaviour Study (Curnow & Spehr 2005). These found that just under a third (33%) of people littered in public places in 2004, with littering rates falling slowly but steadily over the 1997-2004 period.
.
National Environment Protection CouncilDistributional and Cost Benefit Analysis for the Packaging Impacts Decision RIS: Data assumptions
32.
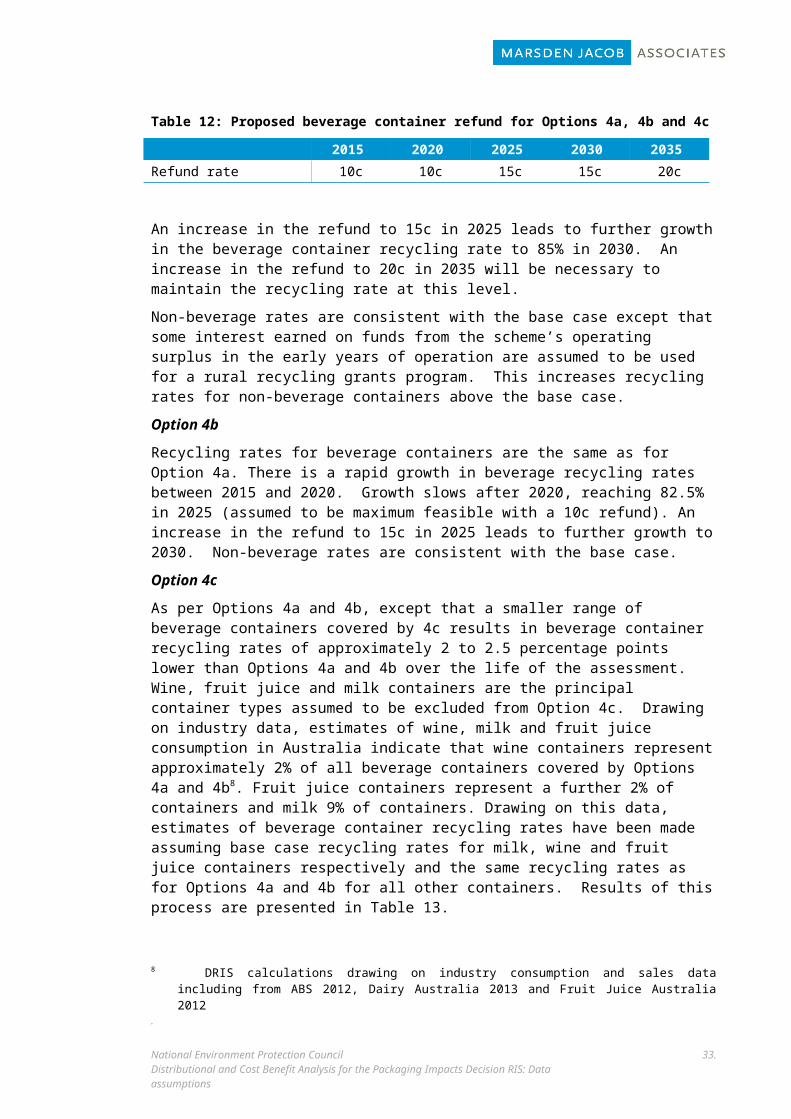
Table 19: DRIS propensity to litter, public place packaging (base case)
Propensity to litter, public place packagingPublic place packaging consumption excluding flexible paper (tonnes) (tonnes)Beverage 255,548 Non Beverage 82,532 Flexible 25,020 Total 363,100 Recycling of public place packaging excluding flexible paper (tonnes)Beverage 86,484 Non Beverage 24,017 Flexible 8,934 Total 119,434 Public place packaging available to be littered (tonnes) Beverage 169,064 Non Beverage 58,515 Flexible 16,087 Total 243,666 Annual packaging litter (public places) 58,862
Propensity to litter, public place packaging consumption 24.2%
Table 20: DRIS propensity to litter, other packaging (base case)
Propensity to litter, other packaging (including public place paper and cardboard)Other packaging consumption (tonnes)Beverage 1,095,424 Non Beverage 280,071 Flexible 2,784,733 Total 4,160,228 Recycling of other packaging Beverage 658,170 Non Beverage 120,274 Flexible 2,045,408 Total 2,823,852
Other packaging available to be littered (tonnes)
Beverage 437,254 Non Beverage 159,797 Flexible 739,325 Total 1,336,376 Annual packaging litter (other locations) 17,119
Propensity to litter, other packaging consumption 1.3%
Note: All tonnages in Tables 19 and 20 are for 2013 and have been derived from the material flows model developed for this study.
.
National Environment Protection CouncilDistributional and Cost Benefit Analysis for the Packaging Impacts Decision RIS: Data assumptions
33.

Table 21: National Litter Index, estimated sources of litter across survey sites
Source percentage
Public placeBeach 2.7%Car park 10.3%Highway (excludes illegal dumping) 52.5%Recreational park 5.6%Retail 3.6%Shopping centre 2.8%Total public place 77.5%Other Residential 8.7%Industrial 13.9%Total other 22.5%
Source: Macgregor Tan Research 2012
Step 3 – Propensity to litter, options
As indicated in Table 19, beverage containers represent a major share of public place packaging consumption (approximately 65%). Thus, options that solely or substantially target recycling of beverage containers will achieve better litter outcomes than options that have a greater emphasis on recycling of other packaging. Significantly increased recycling rates, even of beverage containers, will have only a moderate impact on litter rates though. To achieve more substantial changes to litter rates requires drivers that impact on litter propensities over time. To varying degrees those drivers are in place for the options.
Options 1, 2a, 2b, 2c, 2d, 2e, 3
Options 1, 2b, 2c and 3 all involve investment in litter programs including: litter prevention and education programs (Options 1, 2b, 2c); improving the approach to counting litter (Option 1); financial incentives for litter clean-up (Options 2b, 2c); and improved litter enforcement (Options 2b, 2c). Options 2a, 2d and 2e refer to litter prevention programs but do not provide details on investment levels in those programs. Litter program investments are therefore assumed to match program investments for Options 2b, 2c and 3 (see section 4.7.2).
The key question is ‘what impact if any these programs will have on packaging consumers’ propensity to litter?’ Financial incentives for litter clean-up and improved litter count methodology are assumed to have little direct impact on propensity to litter. With respect to litter prevention and education programs though, it is difficult to answer the question, since minimal ex-ante and ex-poste data on the impact of past litter programs is available. Uncertainty about the effectiveness of litter programs is highlighted by behavioural theory, which indicates that the success of public policy in achieving sustained behavioural change is influenced by a multiplicity of factors including social and personal norms and facilitating conditions (Nyborg 2003, Triandis 1977). Furthermore, evidence from waste and other environmental programs and policies indicates that while information and education can play a significant complementary role in facilitating behavioural change, incentives are needed to spur behavioural change (Gardner & Stern 2002, OECD 2008, 2011). Without the right incentives, (with well-designed economic incentives and/ or investments in services and capacity building being regarded as vital), behavioural change tends be spasmodic or short lived.
.
National Environment Protection CouncilDistributional and Cost Benefit Analysis for the Packaging Impacts Decision RIS: Data assumptions
34.

Bearing these points in mind it is useful to examine available evidence on the outcomes of litter programs (noting an earlier point that this information is limited).
The report ‘Educating the Community about Litter’ (Department of Environment and Conservation (DEC) NSW 2005) provides perhaps the most comprehensive relevant review. It examined the outcomes of the NSW Government’s 2000 to 2003 program of litter education program and fines in the context of earlier litter education programs and research into litter and disposal behaviour. The review found that the campaign lead to strong growth in people’s awareness about the impacts of litter, an increase in the social unacceptability of littering and a significant increase in awareness of fines for littering, including beyond the end of the program. The review also found that there was an increase in the proportion of people in NSW who say they never litter from just over 50% before the program commenced to just over 60% at the end of the program. If responses could be taken at face value this would represent a substantial 20% reduction in respondents’ propensity to litter. However, the report correctly notes that “self-reported non-littering behaviour is not a reliable indicator of people’s actual behaviour” (DEC NSW 2005, p.25). Furthermore, the number of people who said they made changes to reduce littering, which rose from 9% to 16% from the beginning to the middle of the program, fell again to pre-program levels after the program concluded. The program collected insufficient ex-poste and ex-ante litter and littering behaviour data to get a reliable estimate of the impact of the program on actual littering behaviour.
The Littering Behaviour Study (Curnow & Spehr 2005) provides comprehensive surveys of littering behaviour over the period 1997 to 2004 and also examines factors influencing littering behaviour, including bin numbers, placement and signage, education and awareness campaigns and site factors (i.e. their appearance, cleanliness and how well cared for they are). Little information is provided on the impacts of specific programs and campaigns though, other than indicating a gradual but generally steady decline in littering rates over the period. Survey data also indicated that community awareness of litter prevention and education campaigns declined substantially once the campaigns had concluded.
Finally, the Environment Protection and Heritage (EPHC) report ‘Litter Management in Australia’ (EPHC 2008) provides information on the legislative, administrative and enforcement arrangements for littering in each jurisdiction including data on littering fines and revenue collected through those fines. The main picture to emerge from this information is that fines, enforcement (number of fines issued) and revenue collected through litter fines increased substantially in most jurisdictions between the late 1990s and 2007. Jurisdictions also made significant (and generally ongoing) investments in litter awareness and educations campaigns, complementing campaigns and programs provided by non-government organisations such as Keep Australia Beautiful and Clean Up Australia. Information is not provided however, on the effectiveness of fines, enforcement regimes, campaigns and programs on packaging litter propensities or rates. Information is provided on the impact of the Butt Littering Trust campaign though, which combined a national media campaign with the distribution of personal ashtrays and public cigarette butt litter bins. Averaged nationally, there was a reduction in cigarette butt littering of 15.6% over the course of the program.
Taken together, the information presented above suggests that the impact of litter prevention and education programs on propensities to litter will depend significantly on the design of the programs including on whether they are integrated with incentives and initiatives aimed at improving the capacity of the community to avoid littering. The longevity of the programs is also an important factor. With these factors in mind, the following impact of litter investments on propensities to litter are assumed for Options 1, 2b, 2c and 3 (noting that the impacts of
.
National Environment Protection CouncilDistributional and Cost Benefit Analysis for the Packaging Impacts Decision RIS: Data assumptions
35.
recycling investments, such as the National Bin Network, are already factored into the estimates of litter rates):
Option 1. Propensities to litter (public place and other) are assumed to decrease steadily to 5% less than the base (i.e. 5% of 24.2% in the case of public place) from 2016 to 2020 and then remain at that level for the entire period of the study, assuming ongoing program investments under this option.
Option 2a-2e, 3. Propensities to litter are assumed to decrease steadily to 12.5% less than the base case from 2016 to 2020, noting that litter education and prevention program investments are substantially greater than for Option 1 and that Options 2a-2e and 3 also include improved litter enforcement.
Outcomes of these assumptions are presented in Table 22 and Table 23 below.
Table 22: Propensity to litter Option 1
Option 1 2013 2015 2020 2025 2030 2035
Public place Propensity to litter, base case 24.2% 24.2% 24.2% 24.2% 24.2% 24.2%Assumed reduction in propensity to litter na na 5% 5% 5% 5%Adjusted propensity to litter 24.2% 24.2% 22.9% 22.9% 22.9% 22.9%
Other Propensity to litter, base case 1.3% 1.3% 1.3% 1.3% 1.3% 1.3%Assumed reduction in propensity to litter na na 5% 5% 5% 5%Adjusted propensity to litter 1.3% 1.3% 1.2% 1.2% 1.2% 1.2%
Table 23: Propensity to litter Options 2a-2e, 3
Options 2a -2e, 3 2013 2015 2020 2025 2030 2035
Public place Propensity to litter, base case 24.2% 24.2% 24.2% 24.2% 24.2% 24.2%Assumed reduction in propensity to litter na na 12.5% 12.5% 12.5% 12.5%Adjusted propensity to litter 24.2% 24.2% 21.1% 21.1% 21.1% 21.1%
Other Propensity to litter, base case 1.3% 1.3% 1.3% 1.3% 1.3% 1.3%Assumed reduction in propensity to litter na na 12.5% 12.5% 12.5% 12.5%Adjusted propensity to litter 1.3% 1.3% 1.1% 1.1% 1.1% 1.1%
Options 4a, 4b, 4c
As discussed earlier, past studies indicate that financial incentives play an important role in spurring behavioural change with respect to environmental programs (Gardner & Stern 2002, OECD 2008, 2011). Evidence from overseas indicates that the financial incentive provided by containers refunds can have a significant impact on propensity to litter under container refund schemes, with beverage container litter rates falling substantially following the introduction of deposit/ refund schemes in Germany and some states in the USA (Albrecht et al. 2011).
.
National Environment Protection CouncilDistributional and Cost Benefit Analysis for the Packaging Impacts Decision RIS: Data assumptions
36.

A detailed breakdown of NLI data from two years (2011 and 2012) was undertaken for this study separating beverage container15, non-beverage container packaging and non-packaging litter data for South Australia and the rest of Australia. That data was used to develop estimates of beverage container and other packaging litter rates in South Australia compared to the rest of Australia. The estimates, presented in Table 24, indicate that the over the two years for which disaggregated data is available beverage container litter rates were only 41% of beverage container litter rates Australia wide (on a weight basis)16. Litter rates of other packaging were similar in South Australia to the rest of Australia.
Table 24: Packaging litter by volume and tonnes, NLI sites South Australia and Australia, 2011-2012
Volume (litres) Weight (tonnes)
Beverage container
s
Other packaging Total
Beverage container
s
Other packaging Total
Australia Glass 1109.7 129.4 1239.1 385.1 44.9 430.0Metal 2083.1 422.7 2505.8 81.2 16.5 97.7Paper 555.0 3393.9 3948.9 55.5 339.4 394.9Plastic 2734.9 2366.5 5101.4 35.6 30.8 66.3Total 6482.7 6312.5 12795.2 557.4 431.5 988.9South Australia Glass 79.6 22.2 101.8 27.6 7.7 35.3Metal 125.9 59.5 185.4 4.9 2.3 7.2Paper 30.9 482.1 513.0 3.1 48.2 51.3Plastic 144.1 551.3 695.4 1.9 7.2 9.0Total 380.5 1115.1 1495.6 37.5 65.4 102.9National survey area (m2)
1,499,791
1,499,791
1,499,791
1,499,791
1,499,791
1,499,791
South Australian survey area (m2)
247,052
247,052
247,052
247,052
247,052
247,052
Ratio of litter South Australia/ Australia - survey area weighted
36% 107% 71% 41% 92% 63%
Source: Reworked from Macgregor Tan Research 2011, 2012
This data has been used to derive adjusted propensity to litter rates for Options 4a, 4b and 4c. The adjusted propensity to litter rates assume that beverage container littering will approximate the littering rates in South Australia (with an adjustment for beverage container recycling rates), but that litter rates of other packaging will be the same as under the base case (i.e. as for the rest of Australia currently). The adjusted rates are presented in Table 25 and Table 26.
15 Beverage containers as defined under the SA container refund scheme.16 Beverage container litter were also compared between South Australia and individual jurisdictions. Beverage
container litter rates in South Australia are lower than all other jurisdictions. .
National Environment Protection CouncilDistributional and Cost Benefit Analysis for the Packaging Impacts Decision RIS: Data assumptions
37.

Table 25: Propensity to litter Options 4a, 4b
Options 4a & 4b 2013 2015 2020 2025 2030 2035
Public place
Propensity to litter, base case24.2
%24.2
%24.2
%24.2
%24.2
%24.2
%Assumed beverage container litter relative to base case na na 41% 41% 41% 41%
Beverage containers proportion of litter (by weight) na na 0.56 0.56 0.56 0.56
Other packaging proportion of litter (by weight) na na 0.44 0.44 0.44 0.44Container recycling rate na na 0.78 0.83 0.85 0.85Proportional to current SA rate (80%) na na 0.97 1.03 1.06 1.06Assumed reduction in propensity relative to base case na na 31% 35% 37% 37%
Adjusted propensity to litter 24.2%
24.2%
16.6%
15.6%
15.2%
15.2%
Other
Propensity to litter, base case 1.3% 1.3% 1.3% 1.3% 1.3% 1.3%Assumed beverage container litter relative to base case na na 41% 41% 41% 41%
Beverage containers proportion of litter (by weight) na na 0.56 0.56 0.56 0.56Other packaging proportion of litter (by weight) na na 0.44 0.44 0.44 0.44Container recycling rate na na 0.78 0.83 0.85 0.85Proportional to current SA rate (80%) na na 0.97 1.03 1.06 1.06Assumed reduction in propensity relative to base case na na 31% 35% 37% 37%Adjusted propensity to litter 1.3% 1.3% 0.9% 0.8% 0.8% 0.8%
Table 26: Propensity to litter Option 4c
Option 4c 2013 2015 2020 2025 2030 2035
Public place
Propensity to litter, base case24.2
%24.2
%24.2
%24.2
%24.2
%24.2
%Assumed beverage container litter relative to base case na na 41% 41% 41% 41%
Beverage containers proportion of litter (by weight) na na 0.56 0.56 0.56 0.56
Other packaging proportion of litter (by weight) na na 0.44 0.44 0.44 0.44Container recycling rate na na 0.76 0.80 0.82 0.82Proportional to current SA rate (80%) na na 0.95 1.00 1.03 1.03Assumed reduction in propensity relative to base case na na 30% 33% 35% 35%
Adjusted propensity to litter 24.2%
24.2%
17.0%
16.1%
15.6%
15.6%
Other
Propensity to litter, base case 1.3% 1.3% 1.3% 1.3% 1.3% 1.3%Assumed beverage container litter relative to base case na na 41% 41% 41% 41%
Beverage containers proportion of litter (by weight) na na 0.56 0.56 0.56 0.56Other packaging proportion of litter (by weight) na na 0.44 0.44 0.44 0.44Container recycling rate na na 0.76 0.80 0.82 0.82Proportional to current SA rate (80%) na na 0.95 1.00 1.03 1.03Assumed reduction in propensity relative to base case na na 30% 33% 35% 35%.
National Environment Protection CouncilDistributional and Cost Benefit Analysis for the Packaging Impacts Decision RIS: Data assumptions
38.

Adjusted propensity to litter 1.3% 1.3% 0.9% 0.9% 0.8% 0.8%
3.3.3 DRIS assumptions, litter ratesBase case
Estimates of litter rates under the base are presented in Table 27. The propensity to litter (both public place and other) is assumed to remain constant under the base case. Litter rates under the base case are therefore a function of consumption and recycling levels, with the trend in litter rates presented in the table reflecting the interaction of two countervailing factors – growth in recycling between 2013 and 2025 that is sufficient to more than offset the growth in consumption, followed by a period (after 2025) when growth in recycling slows to the point that it is no longer sufficient to offset growth in consumption and litter rates start to increase again.
Table 27: Estimated litter under base case (tonnes)
Base case 2013 2015 2020 2025 2030 2035Public place Beverage 40,841 39,743 37,500 36,521 36,527 37,535
Non-beverage 14,135 14,067 14,213 14,457 14,821 15,231
Flexible 3,886 3,545 3,040 2,747 2,617 2,690
Total public place 58,862 57,355 54,753 53,725 53,966 55,456
OtherBeverage 5,601 5,477 5,256 5,191 5,237 5,381
Non-beverage 2,047 2,029 2,039 2,069 2,118 2,177
Flexible 9,471 8,839 8,083 7,738 7,668 7,880
Total other 17,119 16,344 15,378 14,997 15,023 15,438
Total 75,981 73,699 70,131 68,722 68,989 70,894
Options
Litter rates under each option will be made by applying the same approach as described above for the base case but with the adjusted propensities to litter (where relevant). Results are presented in the CBA and distributional analysis report.
.
National Environment Protection CouncilDistributional and Cost Benefit Analysis for the Packaging Impacts Decision RIS: Data assumptions
39.

4. Cost assumptionsCost assumptions in the CRIS are divided into a number of broad categories. The same broad categories will be used in the DRIS:
scheme design and administration, including avoided costs;
scheme administration, industry PSOs;
household participation;
business participation;
collection and transport costs;
processing of recycling at MRFs;
scheme infrastructure & operating costs; and
industry compliance costs.
The DRIS will also consider the additional cost category of:
‘loss of producer surplus’.
Each of these categories is discussed in turn below.
4.1 Scheme design and implementationThe CRIS provided calculations of government costs associated with the introduction and administration of the scheme. These were itemised as:
regulation design and implementation;
government participation costs;
communications; and
government costs to administer regulations (including compliance and enforcement).
Although government implementation costs in the CRIS are not substantial, it is important that they are carefully considered, particularly as they may form a key component of a request to central agencies for “Departmental” funding. Departmental funding is required to resource the development and administration of the preferred initiative.
Additionally, the CRIS examined avoided regulatory costs, which were assessed as a benefit. These avoided costs are also discussed here.
4.1.1 CRIS assumptions and discussionRegulation design and implementation
The following table summarises the assumed regulation design and implementation costs.
Table 28: CRIS Regulatory design and implementation costs
Infrastructure Type
Option 1 Option 2A Option 2B Option 2C Option 3 Option 4A Option 4B
.
National Environment Protection CouncilDistributional and Cost Benefit Analysis for the Packaging Impacts Decision RIS: Data assumptions
40.
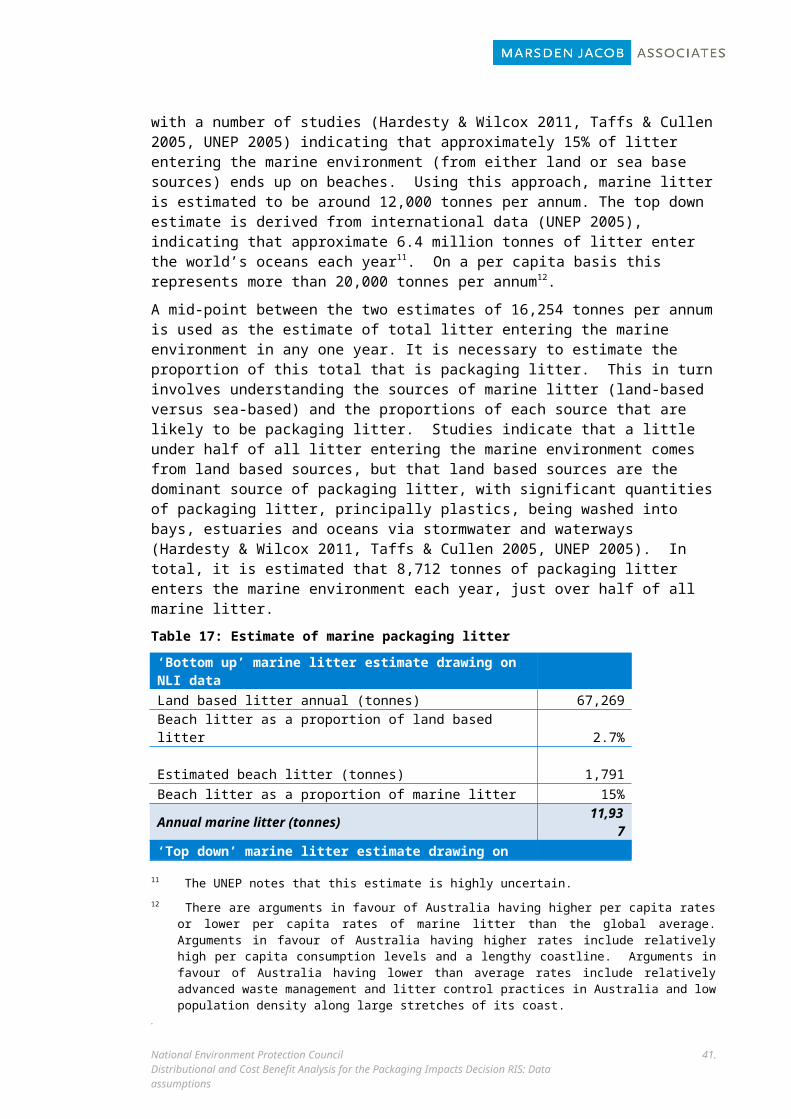
Cost ($m for 2 years)
0.0 0.7 0.7 0.7 1.0 0.7-1.3 0.7-1.3
The legislative development process is complex and challenging. The costs associated with regulatory development, amendment and supporting the government approval process appear to have been significantly under-estimated. These costs need to include:
policy staff with subject matter expertise, for example in waste data and programs, taxation design and administration, grant programs, competition impacts, etc.;
consultants with subject matter expertise;
internal legal advisors; and
legislative drafting (including regulation policy staff and external legal advice).
The current costs appear to only include allowance for minimal policy staff and limited legal advice. They do not appear to include taxation expertise.
Government participation
The CRIS includes estimates of $140,000 (year 1) and $90,000 (year 2) for government to:
develop a National Packaging Waste Strategy;
establish a Compliance Database;
develop a Cost Recovery Impact Statement; and
renegotiate municipal kerbside recycling contracts.
These costs appear to be unrealistically low. The development of a National Packaging Waste Strategy will involve considerable development and negotiation time. Likewise, renegotiation of municipal kerbside recycling contracts is likely to take a considerable amount of time as there are likely to be hundreds of contracts.
Communication
The following table summarises assumed communication costs.
Table 29: CRIS communication costs
Infrastructure Type
Option 1
Option 2A
Option 2B Option 2C Option 3 Option 4A Option
4B
First Year Cost ($m per years)
2.2 2.2 4.4 4.4 4.4 8.8 8.8
Ongoing Cost 0.125 0.125 0.5 0.5 0.5 0.5 0.5
The estimates are based on previous analysis of the National Television and Computer Recycling Scheme (which provides for Extended Producer Responsibility). Arguably, high rates of consumer uptake are required for the CDS schemes to achieve its desired outcomes. As a consequence, it would seem likely that the communication costs have been under-estimated as there will need to be ongoing active communication and engagement with all affected parties.
.
National Environment Protection CouncilDistributional and Cost Benefit Analysis for the Packaging Impacts Decision RIS: Data assumptions
41.

Government costs to implement regulations
The CRIS assumes a flat rate of six hours of labour per liable party (or $380 per annum) associated with Options 2, 3 and 4. The total number of liable parties, based on the NPC, appears to be 272. So the total annual administration cost is around $100,000.
It is not clear why a flat rate has been applied across Options 2, 3 and 4. Depending on the option being considered, the cost of government administration could vary considerably, particularly as the number of parties subject to regulatory compliance will vary by CDS option.
Scheme government implementation costs
The following table summarises the assumed scheme administration costs.
Table 30: CRIS scheme government implementation costs
Infrastructure Type
Base Case Option 1
Option 2A
Option 2B
Option 2C
Option 3 Option 4A Option 4B
$m/yr 0.75 0.75 1.13 1.13 1.13 0.75 1.13 1.13
These costs are derived from a previous EPHC regulatory impact statement for the APC, the administration costs for which are approximately $750,000 per annum in 2008-09.
Rather than depending on previous assessment, the robustness of the results would be improved by developing a ‘bottom-up’ assessment of the likely administration costs, with cost estimates reflecting the functions and number of liable parties. This approach has been adopted by the NEPC Working Group which has provided the estimates detailed in Tables 21 and 22. Our review and discussions with the working group have confirmed these estimates.
Avoided administration and regulatory costs
There is a broad regulatory failure stemming from fragmented and inconsistent resource recovery and litter management frameworks. Each jurisdiction has its own waste minimisation legislation or policies. The CRIS, drawing on the National Waste Policy Regulatory Impact Statement estimated the costs of this duplication at around $50,000 annually for regulatory design & implementation and $2.9 million per annum for direct administration costs, with implementation of a national approach through any of the options avoiding these costs. These estimates were drawn from a comparison of state based co-regulatory approaches to product stewardship for TVs and computers with a nationally co-ordinated approach, in other words by comparing two new product stewardship alternatives. In reality, it is not clear that implementation of any of the options examined in this analysis will significantly reduce waste management costs for individual jurisdictions. For the most part programs initiated under these options will be additional to established state and territory programs. Two exceptions are as follows:
Options 2a, 2b, 2c, 2e and 3 will effectively replace the current APC thus avoiding annual government administrative and regulatory costs associated with the APC of approximately $1.16 million17.
Options 4a, 4b and 4c will replace the South Australian and Northern Territory container refund schemes, thus avoiding annual administrative costs associated with those schemes of
17 Estimate of administration costs undertaken for the mid-term review of the NPC (Allen & Cain 2008) inflated to 2011 values.
.
National Environment Protection CouncilDistributional and Cost Benefit Analysis for the Packaging Impacts Decision RIS: Data assumptions
42.

approximately $3.7 million. For Options 4a and 4b, all of these avoided costs are assumed to apply to government, whereas for Option 4c, most of the avoided costs are assumed to apply to the scheme coordinator.
4.1.2 DRIS assumptionsTable 31 and Table 32 provide an overview of government implementation costs proposed for inclusion in the DRIS. These costs were provided by the NEPC Working Group, based on internal calculations, but are consistent with our assessment that administration costs in the CRIS were substantially under estimated. The revised estimates reflect:
revised assumptions regarding numbers of liable parties affected by the various options (noting that the number of liable parties affected by Options 4a, 4b and 4c is estimated to be very substantial - see Section 4.9), which in turn has significant implications for government administration costs; and
recent experience with implementation of comparable government regulations in Australia, which indicate that most options will entail significant additional administrative effort.
While each one of the itemised assumptions was reviewed, the costs for each option have been aggregated into a ‘development’ component (which includes legislative drafting as well as preparation, education, system-creation costs for the year prior to the first year of the option’s substantive operation ) and an ‘ongoing administration’ component. This is a sufficient level of aggregation for the purposes of the DRIS. Development costs (Table 31) are assumed to occur over two years (Option 1) or three years (Options 2, 3 and 4).
Government costs associated with Options 4a, 4b and 4c are assumed to include the following:
Option 4a. Cost of revenue collection, maintaining a container registry, regulation enforcement/ compliance, contract management and grants program administration.
Option 4b. Cost of revenue collection, maintaining a container registry, and regulation enforcement/ compliance. Contract management costs are borne by the single coordinator (industry PSO) under this option (see Section 4.2).
Option 4c. Maintaining a container registry, regulation enforcement/ compliance and approving super collectors. Cost of collecting fees and managing contracts are borne by the super collectors (industry PSOs) under this option (see Section 4.2).
Under Option 4a all costs associated with scheme administration are assumed to reside with government. Even though Option 4a involves a CDS coordinator, its costs are all passed through to government. Total annual administration costs of $42.6 million are equivalent to approximately 0.4c/ container over the life of the scheme.
Government administration costs of Options 4b and 4c are lower than for Option 4a because costs associated with depot contract management are borne by the coordinator or super collector (in the case of Options 4b and 4c) and revenue collection costs are borne by the super collector (in the case of Option 4c). See following section.
As previously noted, avoided annual administration costs are assumed to be as follows:
$ -1.16 million associated with administering the APC, avoided for Options 2a, 2b, 2c, 2e and 3;
$ -3.7 million associated with administering the South Australian and Northern Territory container refund schemes, avoided for Options 4a, 4b;
.
National Environment Protection CouncilDistributional and Cost Benefit Analysis for the Packaging Impacts Decision RIS: Data assumptions
43.

$ -0.8 million associated with administering the South Australian and Northern Territory container refund schemes, avoided for Option 4c.18
Table 31: Proposed DRIS scheme government implementation - design and preparation costs
Sub-category Data variable Application
CRIS assumpti
on
DRIS assumption
Unit
Government administration (design & implementation)
Development costs Option 1 0 1.2 $ million
Development costs Option 2a 0.7 4.0 $ million
Development costs Option 2b 0.7 4.0 $ million
Development costs Option 2c 0.7 4.0 $ million
Development costs Option 2d na 2.6 $ million
Development costs Option 2e na 0.8 $ million
Development costs Option 3 1 4.0 $ million
Development costs Option 4a 0.7 47.1 $ million
Development costs Option 4b 0.7 31.6 $ million
Development costs Option 4c na 14.2 $ million
Table 32: Proposed DRIS scheme government implementation - ongoing costs
Sub-category Data variable Application CRIS
assumption
DRIS assumption
Unit
Government administration (ongoing)
Ongoing administration costs Option 1 0 1.0 $ million/
year Ongoing administration costs Option 2a 0.14 3.8 $ million/
yearOngoing administration costs Option 2b 0.14 4.7 $ million/
yearOngoing administration costs Option 2c 0.14 5.6 $ million/
yearOngoing administration costs Option 2d na 2.5 $ million/
yearOngoing administration costs Option 2e na 3.2 $ million/
yearOngoing administration costs Option 3 0.14 11.2 $ million/
yearOngoing administration costs Option 4a 0.14 42.6 $ million/
yearOngoing administration costs Option 4b 0.14 34.2 $ million/
yearOngoing administration costs Option 4c na 11.3 $ million/
year
18 An additional $2.9 million of avoided annual PSO administration costs are included in the following section for Option 4c.
.
National Environment Protection CouncilDistributional and Cost Benefit Analysis for the Packaging Impacts Decision RIS: Data assumptions
44.

4.2 Scheme administration, industry PSOs or equivalent
4.2.1 CRIS assumptionsThis cost item relates to administrative costs of an industry-run Product Stewardship Organisation (PSO) that is assumed to administer the program initiatives in all schemes except for Option 3 and 4a (where the Australian Government will fulfil this function).
Option 1 assumes the establishment of a national body made up of representatives from Commonwealth, State, Territory and local governments. It is envisioned that the body would operate in a broadly similar manner to the APC Industry Association, with comparable administration costs.
For each co-regulatory sub-option (Options 2a to 2c), it is envisioned that industry would establish a body responsible for administering an approved co-regulatory arrangement (often referred to as a PSO). The PSO(s) are assumed to be responsible for implementing and directing initiatives that would be designed to meet the specified outcomes. Scheme regulations are likely to permit multiple approved parties to act as PSOs, which is likely to involve the duplication of fixed costs and increase the scheme administration costs. For these options, scheme administration costs are assumed to increase by 50% when there are multiple PSOs operating.
Option 3 is assumed to involve the government placing a mandatory ADF on packaging. The CRIS expressed uncertainty regarding the costs implications of government administration of this option.
The CDS (Options 4a and 4b) options are assumed to be administered by a PSO(s), with regulations permitting multiple approved parties to act as PSOs, in the same manner as the co-regulatory sub-options.
4.2.2 DiscussionAs with government administration costs, PSO administration costs appear, in many cases, to have been understated in the CRIS. The administration and coordination roles of PSOs under the various options are as follows.
Option1. This option does not involve any additional regulatory requirements. All administration is undertaken by a national body coordinated by governments.
Options 2a to 2d will entail a single or (more likely) multiple co-regulatory arrangements (CAs) to facilitate and administer the designated scheme. Administration costs for each CA are therefore expected to be broadly similar as follows.
Option 2a. Costs for each CA will include overseeing development of recycling and litter action plans by members, record keeping and auditing of consumption and recycling levels against targets, and government reporting.
Option 2b. Similar to Option 2a, but with additional planning and record keeping associated with beverage containers.
Option 2c. Similar to Option 2b, but with strengthened targets and additional program planning required.
Option 2d. Similar to Option 2b, but with a sole focus on beverage containers..
National Environment Protection CouncilDistributional and Cost Benefit Analysis for the Packaging Impacts Decision RIS: Data assumptions
45.

Option 2e is not delivered under the co-regulatory provisions of the Product Stewardship Act 2011. Instead, it builds on existing coordinated arrangements established through the APC, with an industry organisation established to collect and expend member funding contributions.
As a government administered scheme, the costs of administering Option 3 are assumed to be included in the government administration costs for that option, as set out in Table 22.
Options 4a, 4b and 4c are all regulatory options with centrally managed container deposit or container refund schemes and requirements therefore for careful coordination and stringent record keeping and reporting arrangements.
In the CRIS, PSO administration costs associated with Option 4a and 4b were shared between this category and infrastructure and operating costs. All non-government administration costs associated with Options 4a, 4b and 4c are included in this section however, so as to provide a more meaningful comparison of administrative costs between the regulatory options. We note however, that differences in responsibility for administering Options 4a, 4b and 4c between government and the system coordinator mean that a comparison of overall administration costs between the options should also take into account government administration costs (see previous section).
Because Option 4c will replace the SA container refund scheme, coordinator costs associated with administering that scheme, estimated at - $2.9 million/ year, will be avoided.
4.2.3 DRIS assumptionsTable 33 provides an overview of scheme administration cost estimates. Assumptions underpinning the costs estimates are as follows.
Option 1. All additional costs associated with this option are assumed to be covered in government administration costs.
Option 2a. Costs of approximately $1 million per annum for each CA, with an estimated four CAs in place.
Option 2b. Cost of approximately $ 1.25 million per annum for each CA, with an estimated four CAs in place. Added costs relative to 2a reflect additional planning, program development and coordination required to meet beverage targets.
Option 2c. Cost of approximately $ 1.5 million per annum for each CA, with an estimated four CAs in place. Added costs relative to 2b reflect additional planning and program development costs.
Option 2d. Costs of approximately $1.5 million per annum for each CA, with an estimated two CAs in place.
As previously noted, scheme administration costs for Option 3 are assumed to be subsumed into government administration costs for that option.
Option 4a. Costs borne by the single CDS coordinator include managing and coordinating the collection network, achieving service and system efficiency targets, receiving and verifying collection data from redemption points, making refund, handling and other payments to redemption points, managing the sale of recovered materials, and making incentive payments to retailers. All of those costs are passed through to government and are reflected in government administration costs of $42.6 million per annum.
.
National Environment Protection CouncilDistributional and Cost Benefit Analysis for the Packaging Impacts Decision RIS: Data assumptions
46.
Option 4b. A single scheme coordinator is responsible for contracting with collection points (165 consolidation depots and 1500 other collection points), managing and coordinating the collection network, achieving service and system efficiency targets, receiving and verifying collection data from redemption points, making refund, handling and other payments to redemption points and managing the sale of recovered materials. These costs are estimated at $8.25 million per annum. Total administration costs, including government and coordinator costs, are assumed to be $42.5 million per annum.
Option 4c. Multiple super collectors will be required to report to the Government on return rates. Their functions will also include contracting with collection points (165 consolidation depots and 1500 other collection points, each potentially with multiple super collectors), managing and coordinating the collection network, achieving service and system efficiency targets, receiving and verifying collection data from redemption points, making refund, handling and other payments to redemption points and managing the sale of recovered materials. Costs of $39.5 million per annum cover these functions. Total administration costs, including government and super collector (coordinator) costs, are assumed to be $50.8 million per annum, with the higher costs relative to Options 4a and 4b largely reflecting the multiple super collectors and potentially more complex contractual arrangements.
.
National Environment Protection CouncilDistributional and Cost Benefit Analysis for the Packaging Impacts Decision RIS: Data assumptions
47.

Table 33: Proposed DRIS industry (PSO or equivalent) administration costs
Sub-category Data variable Application CRIS assumption
DRIS assumption Unit
Ongoing administration (PSOs or equivalent)
Annual administration costs
Option 1 0 0 $ m/year
Annual administration costs
Option 2a 0.375 4 $ m/year
Annual administration costs
Option 2b 0.375 5 $ m/year
Annual administration costs
Option 2c 0.375 6 $ m/year
Annual administration costs
Option 2d na 3 $ m/year
Annual administration costs
Option 2e na 1.5 $ m/year
Annual administration costs
Option 3 0 0 $ m/year
Annual administration costs
Option 4a 1.125 0 $ m/year
Annual administration costs
Option 4b 1.125 8.25 $ m/year
Annual administration costs
Option 4c na 39.5 $ m/year
As previously noted, coordinator costs associated with administering the South Australian container refund scheme will be avoided with the implementation of Option 4c. These avoided costs are estimated at - $2.9m/ year.
4.3 Household participation costs4.3.1 CRIS assumptionsHouseholds face participation costs due to the time it takes to accumulate packaging and transport it to collection infrastructure points. The CRIS divides these costs into four main sub-categories – accumulation time, vehicle operating costs (VOCs), in-vehicle travel (IVT) time and container deposit redemption time. The nature of these cost categories and the options that they are potentially related to are outlined in the table below.
.
National Environment Protection CouncilDistributional and Cost Benefit Analysis for the Packaging Impacts Decision RIS: Data assumptions
48.
Table 34: Summary of possible household participation costs
Cost Definition Function of Relevant Option
Accumulation time
value of time to physically transfer packaging to accumulation points such as kerbside recycling bins / CDL deposit points. Includes time to sort packaging or containers, walk to the accumulation point and transfer the packaging
Increased sorting time; additional trips per week; walk time per trip; time to transfer contents; behavioural change by households
All options
VOCs involved in transporting packaging to collection infrastructure
VOC per km; distance to infrastructure; trips per week; no. of trips by infrastructure type; proportion of new trips
Options 4a, 4b (and 4c)
In-vehicle travel time
time to transport packaging to collection infrastructure by vehicle
distance travelled converted into hours using average vehicle speed; multiplied by value of time
Options 4a, 4b (and 4c)
Container deposit redemption time
time to walk from vehicle to container deposit collection infrastructure and conduct the transaction
walk time (distance from vehicle to CD infrastructure x average walk speed) and transaction time (to redeem the deposit)
Options 4a, 4b (and 4c)
Source: CRIS.
4.3.2 DiscussionValue of time
In the CRIS, time spent sorting waste, in-vehicle travel and redeeming containers was valued at $13.01/hour. This figure was based on the value of private vehicle passenger time determined by Austroads, and was deemed to be approximately equivalent to the minimum wage.
A review of literature was undertaken for the DRIS to determine an appropriate value for time spent on private/ non-business activities of this nature (Bockstael et al. 1992, Feather & Shaw 1998, Lake & Ferreira 2002, Larson & Shaikh 2004). A wide span of values was suggested by the literature, linked to average or median wage rates, ranging from 0 to 100%. The range of values most commonly applied to non-business or leisure time however was 10% to 50% of the average wage rate. Applying a mid-point estimate of 30% to the average wage rate for all employees in Australia in 2011 of $25.66/ hour (ABS 2013) provides an estimate of $7.67/ hour for estimating the main components of household participation costs in the DRIS19.
Accumulation costs
In the CRIS, it was assumed that household participation costs for all packaging options included “accumulation time” for both at-home and away-from home recycling. This
19 This value of time is also applied to other non-business time costs used elsewhere in the study, notably the value of voluntary labour used in litter clean up (see section 5.3.2).
.
National Environment Protection CouncilDistributional and Cost Benefit Analysis for the Packaging Impacts Decision RIS: Data assumptions
49.

accumulation time consists of the additional time required to sort recyclables, deliver the recyclables to an “accumulation point” and transfer the contents. For the portion of the community deemed to take additional, that is recycling ‘purpose-specific’ trips. For the purposes of the DRIS, we are recommending that accumulation time effectively be costed at zero. There are two reasons for this recommendation:
First, substantial evidence was proffered by a range of stakeholders, drawing on overseas and Australian experience, that accumulation time stemming from implementation of options, either CDS options or programs through other options (e.g. the National Bin Network) would be no greater than the time that is already involved in current waste management practices, whether kerbside recycling or disposal through waste disposal channels.
It is not clear that the CRIS considered accumulation time on a net basis. Further, many of the components of accumulation regarding sorting time, walk time and the proportion of purpose-specific trips are extremely difficult to accurately quantify, and for the CRIS required the use of 'intuitive'/arbitrary estimates that in many cases were measured in seconds.
Second, there is a legitimate question mark over whether, for a significant portion of the community, participation in waste sorting and recycling involves a private cost. As noted by the Productivity Commission (2006), the personal benefit that many members of the community derive from taking part in recycling exceeds the cost to them of the additional effort required. Even if some initial “inconvenience costs” were incurred, it is highly likely that, for a large proportion of the population, inconvenience would decline substantially over time, as people became habituated to the new practice.
Vehicle operating costs and in-vehicle travel time
For Options 4a and 4b (and 4c), key variables underlying vehicle operating costs and in-vehicle travel time costs are the number of trips made per household and the proportion of those trips that are new.
In the CRIS, it was assumed that households undertook 0.04 trips per week, equivalent to 2.0 trips per year, to CDS infrastructure (for both Options 4a and 4b). Of these trips, 10% of trips were assumed to be new (and therefore of relevance to the CBA) in the case of RVMs and regional/remote CDS infrastructure, and 50% of trips were assumed to be new for urban non-RVM CDS infrastructure.
We are recommending that, for the DRIS, the number of trips be altered to reflect the different types of CDS infrastructure (RVMs versus other CDS infrastructure) and the different proportions of CDS infrastructure under each option. Further, we recommend that assumptions about the proportion of new trips should be altered to reflect the different infrastructure types. There is evidence, based on overseas experience, that trips to RVMs are much more frequent than to other types of CDS infrastructure, but that the vast majority of such trips are not purpose specific (i.e., not new trips). Conversely, most households will visit non-RVM infrastructure only rarely, as is assumed in the CRIS, but it is more likely that such trips will be purpose specific. In other words, there is an inverse correlation between the propensity of householders/ consumers to undertake purpose specific trips and the frequency with which they will take those trips.
Proposed revised assumptions for the number of trips are as follows:
.
National Environment Protection CouncilDistributional and Cost Benefit Analysis for the Packaging Impacts Decision RIS: Data assumptions
50.

trips to non-RVM CDS infrastructure: 3.55 times per year (equivalent to the assumption in the CRIS of 2 trips per year, but based on updated South Australian data);20 and
trips to RVMs: 26 trips per year (1 per fortnight).
These revisions aimed to address comments from stakeholders that (a) the number of trips to hubs in the CRIS is too high, whereas those to RVMs were too low; and (b) that the proportion of recycling specific / new trips is too high. Because they vary by infrastructure type and for the packaging /CDS options, depending on the types of infrastructure involved, the proposed new assumptions for the DRIS, we believe, more closely reflect household behaviour/ likely household behaviour.
Container deposit redemption time
Container deposit redemption time is the walk time from a vehicle to CD infrastructure (a function of distance and walk speed) plus the transaction time involved in redeeming containers. The main assumptions that we recommend be altered for container deposit redemption time relate to the number of trips and the proportion of new trips. We are recommending that for the DRIS, the assumption changes suggested for the vehicle-related costs also be applied to the container deposit redemption time - that is, the number of trips be altered to reflect the different types of CDS infrastructure (RVMs versus other CDS infrastructure) and the different proportions of CDS infrastructure types under each option.
We also recommend that assumptions regarding CD redemption time should be changed compared to the CRIS estimates of 1.7 minutes/ trip (RVMs) and 5 mins/ trip (non-RVMs/depots). The revised assumptions recommended for the DRIS are approximately 1.6 minutes for RVMs and 10 minutes for non-RVMs. The RVM time estimate is based on RVM throughput data estimated for this study. This indicates that an average household will redeem about 30 containers per trip, assuming 26 trips per year and 3 seconds per container including queuing time. The non-RVM time estimate takes account of queuing time and the large average number of containers being redeemed in a single trip. It aligns with the estimate in the recent Harrison survey report for EPA South Australia, in which 66% of persons surveyed reported transaction times of less than 15 minutes for CD depots.
Other assumptions relating to walk distance (50m for RVMs, 10m for other urban CDS infrastructure and for rural CDS infrastructure) and walk speed (1.35 m/s) were considered to be reasonable and unlikely to vary significantly between jurisdictions or on a metro/non-metro basis and, therefore, we have not recommended altering them.
Assumptions not revised
In the Data Assumptions Report, it was noted that the assumptions re average distance to each unit of collection infrastructure did not vary by jurisdiction, but were assumed to be 2.0 km (urban trips) and 11.6 km (regional/remote trips) across jurisdictions. While it was flagged that these distances, particularly the rural distance, should vary by jurisdiction, altering these assumptions had virtually no impact on the level of household costs. Therefore, these assumptions were not altered for the DRIS. We recommend that all other assumptions in the CRIS relating to VOCs and IVT are retained in the DRIS (i.e., value of travel time, average vehicle speeds and distances to infrastructure).
20 The most recent South Australian data indicates that 46% of households visit CD infrastructure 2-3 times or more per year; 19% visit 1-2 times per year, 14% visit monthly, 2% visit fortnightly, 1% visit less than yearly and 17% are non-participants. Taking a weighted average of these trips, results in an estimate of 3.55 trips per household per year, which is applied across 100% of households.
.
National Environment Protection CouncilDistributional and Cost Benefit Analysis for the Packaging Impacts Decision RIS: Data assumptions
51.

4.3.3 DRIS assumptionsTable 35 outlines proposed DRIS assumptions on frequency of trips and proportions of new trips under Options 4a, 4b and 4c, which is relevant to the estimation of vehicle-related costs and container deposit redemption time components of household participation costs.
The 30% assumption for new trips to non-RVMs is in line with previous literature (Nolan ITU 2003, ISF 2001). The 10% assumption for new rural trips has been retained from the CRIS. The proportion of new trips for RVMs has been revised downwards from 50% to 5%, reflecting the nature of this infrastructure and usage patterns overseas – noting the trade-off, in that many more such trips take place compared to other types of infrastructure (26 per year, rather than 3.55 per year).
The impact of revised assumptions on the CDS options varies depending on the proportions of infrastructure assumed for each option. For example, under Option 4a 84.9% of redemption trips are assumed to be to RVMs. Thus 84.9% of trips occur 26 times per year (assumption for trips per year for RVMs) but only 5% of these are new trips. For Option 4c, by contrast, 72.5% of redemption trips are to non-RVM infrastructure. Thus 72.5% of trips are taken 3.55 times per year, but 30% of such trips are assumed to be new trips.
Table 35: DRIS assumed frequency of household trips and proportion of new trips to container deposit infrastructure (average of participating and non-participating households)
Proportion of trips by infrastructure types for each CDS option
Type of trip No. of trips per year
(% of new trips)
4a 4b 4c
Metro and non-metro trips to non-RVM infrastructure
3.55(30%)
13.3% 49.8% 72.5%
Metro and non-metro trips to RVMs
26(5%)
84.9% 48.4% 25.7%
Remote trips to all CDS infrastructure
3.55(10%)
1.8% 1.8% 1.8%
DRIS estimates of household participation costs
Table 36 outlines the resulting household participation costs, taking into account variations in the assumptions outlined above. Costs are presented for each jurisdiction, as well as nationally, for Options 4a, b and c. In the case of the Northern Territory and South Australia, adjustments to the proportions of trips have been made to reflect the fact that both jurisdictions have existing CDSs in the base case.21 The tables also distinguish metro and non-metro costs for each option.
21 For Option 4c, which is equivalent to the existing SA system, additional trips were assumed to be zero for SA and NT; other options were adjusted depending on the proportions of RVMs and metro and non-metro non-RVM infrastructure compared with the SA system.
.
National Environment Protection CouncilDistributional and Cost Benefit Analysis for the Packaging Impacts Decision RIS: Data assumptions
52.
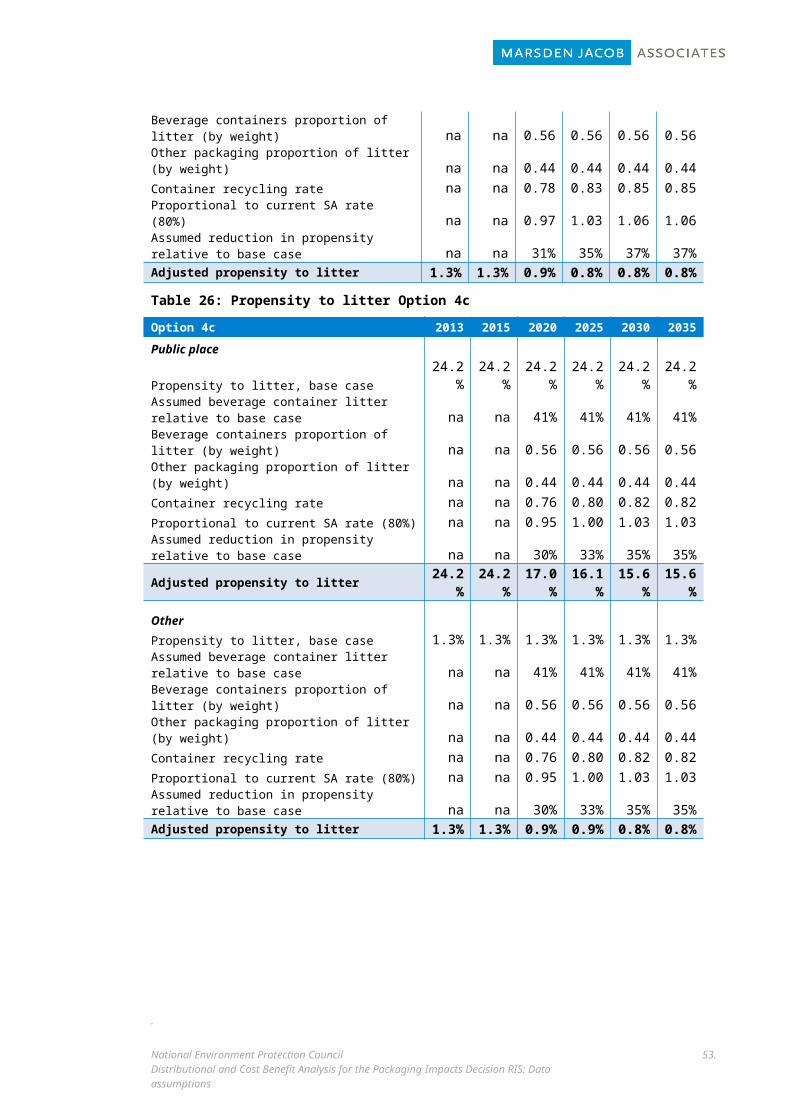
Costs are greatest in jurisdictions with the greatest numbers of households (i.e. NSW and Victoria), but on a per household basis are greatest in jurisdictions that have higher proportions of households in non-metropolitan areas. This reflects the fact that costs are greater for households in non-metropolitan areas than in metropolitan areas because it is assumed that they have to travel greater distances to CDS infrastructure (11.6 km in non-metropolitan areas compared to 2.0 km in metropolitan areas). In addition, non-metropolitan areas are assumed to have different recycling infrastructure configurations compared with metropolitan areas, which affects travel frequency and costs. Total household participation costs are similar between all three options: Option 4a totals $64.3 million for household participation costs in 2035. Option 4b is slightly lower at $60.9 million and Option 4c lower again at $58.5 million.
Table 36: Options 4a, 4b and 4c: DRIS household participation cost estimates aggregated ($m)
Option 4aMetro Non-metro
2020 2025 2030 2035 2020 2025 2030 2035
NSW $9.58 $11.65 $13.05 $13.54 $5.89 $7.06 $7.75 $7.96 Victoria $8.84 $10.86 $12.28 $12.82 $3.25 $3.87 $4.20 $4.31
Queensland $4.52 $5.71 $6.55 $6.92 $5.94 $7.46 $8.59 $9.08
South Aust. $0.05 $0.06 $0.06 $0.06 $0.02 $0.02 $0.02 $0.02
Western Aust. $3.93 $4.98 $5.73 $6.05 $1.35 $1.65 $1.86 $1.94
Tasmania $0.48 $0.56 $0.65 $0.67 $0.64 $0.75 $0.80 $0.82
N. Territory $0.00 $0.01 $0.01 $0.01 $0.00 $0.00 $0.00 $0.00
ACT $0.08 $0.10 $0.11 $0.11 $- $- $- $-
Australia $27.47 $33.92 $38.43 $40.17 $17.10 $20.82 $23.23 $24.13
Option 4bMetro Non-metro
2020 2025 2030 2035 2020 2025 2030 2035
NSW $9.04 $10.99 $12.31 $12.77 $5.57 $6.67 $7.32 $7.52
Victoria $8.34 $10.25 $11.59 $12.09 $3.07 $3.66 $3.97 $4.07
Queensland $4.26 $5.39 $6.18 $6.53 $5.61 $7.05 $8.11 $8.57
South Aust. $0.16 $0.19 $0.19 $0.20 $0.06 $0.07 $0.07 $0.07
Western Aust. $3.71 $4.70 $5.40 $5.71 $1.27 $1.56 $1.76 $1.83
Tasmania $0.45 $0.53 $0.61 $0.63 $0.61 $0.71 $0.76 $0.77
N. Territory $0.02 $0.02 $0.02 $0.02 $0.01 $0.01 $0.01 $0.01
.
National Environment Protection CouncilDistributional and Cost Benefit Analysis for the Packaging Impacts Decision RIS: Data assumptions
53.
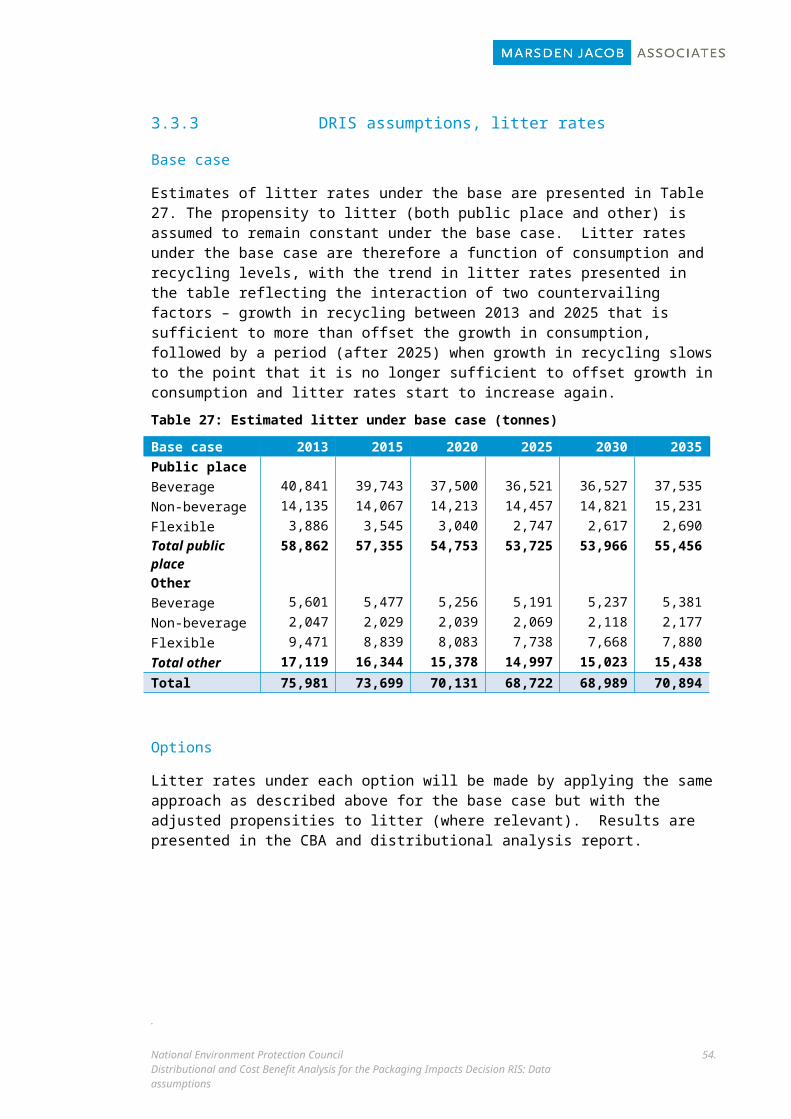
ACT $0.07 $0.09 $0.10 $0.10 $- $- $- $-
Australia $26.05 $32.15 $36.41 $38.06 $16.20 $19.72 $22.00 $22.85
Option 4c Metro Non-metro
2020 2025 2030 2035 2020 2025 2030 2035
NSW $8.84 $10.62 $11.85 $12.30 $5.45 $6.45 $7.05 $7.25
Victoria $8.16 $9.90 $11.15 $11.64 $3.00 $3.54 $3.82 $3.92
Queensland $4.17 $5.21 $5.95 $6.28 $5.50 $6.81 $7.81 $8.26
South Aust. $- $- $- $- $- $- $- $-
Western Aust. $3.63 $4.54 $5.20 $5.50 $1.25 $1.51 $1.69 $1.76
Tasmania $0.44 $0.51 $0.59 $0.61 $0.60 $0.69 $0.73 $0.74
N. Territory $0.08 $0.09 $0.10 $0.11 $- $- $- $-
ACT $0.07 $0.09 $0.10 $0.10 $- $- $- $-
Australia $25.39 $30.96 $34.95 $36.54 $15.79 $18.99 $21.11 $21.93
Notes: ACT non-metro costs are zero, reflecting the very small non-metro population (less than 260 persons according to the ABS). SA and NT costs have been adjusted downwards to reflect the fact that both jurisdictions have existing CDSs in the base case. Costs were calculated for 2035 based on the assumptions outlined, with costs for earlier years based on (updated) recycling quantities for each option proportionate to 2035 levels.
.
National Environment Protection CouncilDistributional and Cost Benefit Analysis for the Packaging Impacts Decision RIS: Data assumptions
54.

4.4 Business participation costs4.4.1 CRIS assumptionsBusiness / workplace participation costs are defined as costs incurred by employees taking packaging to temporary storage infrastructure and cleaners/other staff consolidating packaging in larger storage infrastructure such as skip bins. Cost items and CRIS assumptions are shown in Table 24.
4.4.2 DiscussionConcerns about the uncertain and potentially arbitrary nature of costs, raised in relation to household accumulation costs also apply to business participation costs. In particular, estimates of the number of trips and transfer times are subject to uncertainty because they are based on what the CRIS acknowledges are “intuitive assumptions”. Other concerns include that estimates of the number of employees are assumption based and subject to uncertainty - only full-time employees counted for estimates of number of employees; and the value of time is much higher than household participation time and does not vary between general employees and cleaners, which may lead to understatement of employee costs. In any case, however, there is a strong argument that the employee costs (incurred in taking packaging to temporary storage infrastructure) should not be included in the DRIS, on the grounds that:
there is a significant rationale supporting the insignificance of these costs, as discussed in relation to the accumulation time component of household participation costs - that is, these employee costs are likely to be no greater than the time that is already involved in current waste management practices, are likely to decline significantly over time as employees habituate to the recycling practice, and may in any case be less than the personal (‘feel good’) benefits that employees derive from taking part in recycling; and
to the extent that any such employee costs are significant, they are likely to have been captured in the MRCCs for Options 2a-e (the industry-run options for which such costs are likely to be greatest), and to calculate them separately under business participation costs therefore risks double-counting.
Therefore, it has been proposed for the DRIS, that the employee costs category of business participation costs is excluded.
The other component of business participation costs in the CRIS is cleaner/other staff costs, which involve transferring the contents of temporary storage infrastructure to large accumulation points (e.g. skip bins). Concerns in relation to the CRIS assumptions for cleaner /other staff costs include:
.
National Environment Protection CouncilDistributional and Cost Benefit Analysis for the Packaging Impacts Decision RIS: Data assumptions
55.
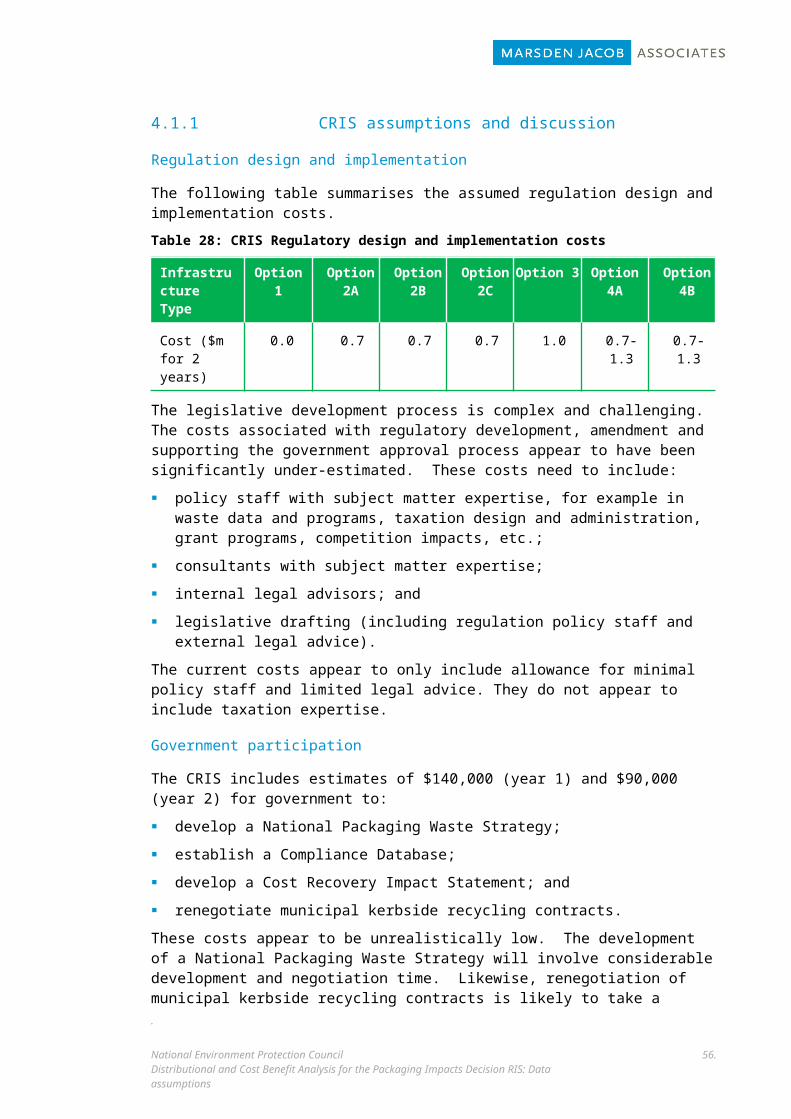
the assumed additional time spent by cleaners transferring the contents of temporary storage infrastructure to large accumulation points (assumed in the CRIS to be 5 seconds/trip) appears to be too low, with a guide produced by Resource NSW (2002) on calculating waste reduction costs in office buildings estimating this time to be between 1 and 5 minutes/trip;
the employee and cleaner costs are calculated for Option 2c and 3, which yield the highest recycling quantities under the CRIS, with these costs for being proportionate to the total recycling quantities compared with 2c and 3 - however, the quantity of C&I recycling rather than the total quantity of recycling would be a more relevant benchmark.
While it would be desirable to obtain a grounded basis for the estimates of number of trips and transfer times in particular, this would probably require well designed business surveys to obtain. Given this, and the fact that business / workplace participation costs are less material to the overall results of the assessment than, say, household participation costs, (accounting for less than 10% of total costs for any of the options – Table 27), we propose to adjust the CRIS assumptions on business participation costs in relation to the time taken for each trip to a midpoint in the range of estimates assumed in the NSW guide (Resource NSW 2002). We also propose to make the costs for the various options proportionate to C&I recycling quantities (rather than total recycling quantities).
Table 37: Business participation costs as a % of total costs in CRIS (PV basis)
Option PV Business participation costs ($m)
% of total PV Total costs($m)
Option 1 $20 6.4% $311
Option 2a $20 7.8% $258
Option 2b $37 6.7% $552
Option 2c $61 6.2% $982
Option 3 $61 6.2% $979
Option 4a $7 0.3% $2,125
Option 4b $7 0.3% $2,471
4.4.3 DRIS assumptionsAs noted above, the employee costs in the CRIS relating to business participation costs are proposed to be excluded in the DRIS; adjustments to the assumptions in relation to cleaner/other staff costs are outlined in Table 38. Key changes to the assumption are:
.
National Environment Protection CouncilDistributional and Cost Benefit Analysis for the Packaging Impacts Decision RIS: Data assumptions
56.
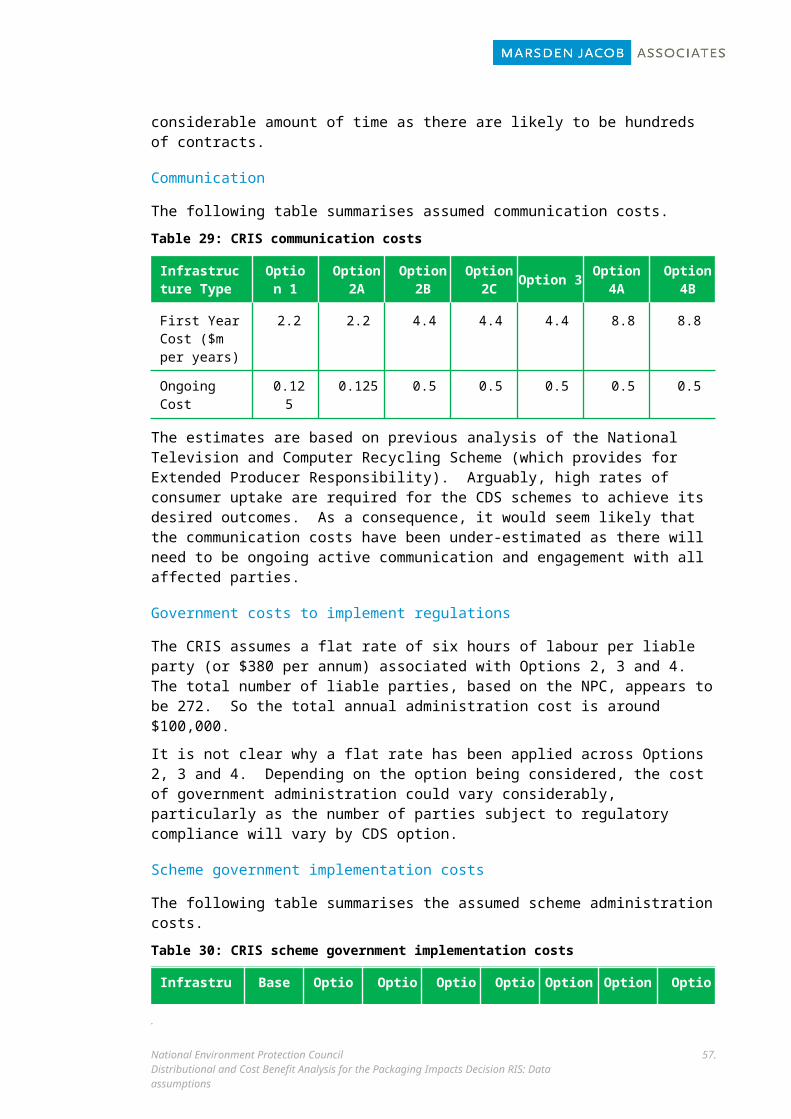
Employee costs are excluded from the analysis.
The number of trips is still estimated to be 0.5 trips per day, with this estimate based on a weighted average of 0.2 trips/day (i.e. once a week) for 40% of businesses, 0.5 trips/day (i.e. once every two days) for 40% of business, 1 trip/day for 9% of businesses and 20 trips per day for 1% of businesses (e.g. airports, large shopping centres).
However, the additional time each trip transferring the cleaners / other staff are involved in transferring the contents of recyclate from temporary storage infrastructure to large accumulation points is assumed to 2.5 minutes/ trip.
The value of time for cleaning has been reduced from $42.75/ hour to $35/ hour. This adjustment follows a review of award rates and charges for commercial cleaning services. The national award rate for cleaners is currently about $17/ hour but once allowances, benefits, insurance and normal profits are added to these costs the typical charge out rate for commercial cleaning services is in the order of $30-40/ hour.
The overall effects of changes are that employee costs are reduced to zero, whereas cleaner/staff costs are substantially increased.
Based on the new assumptions, business participation costs for whichever option yields the highest recycling quantity as determined by the MFA (likely to be 2c), will be in the order of $12 million per year in 2035. Costs for other options will be proportionate to the volumes of C&I recycling.
Table 38: CRIS business participation costs (relevant to all Options)
Cost Function of CRIS assumptions DRIS assumptions
Employee costs
additional trips
1 trip / day for Options 2c and 3, other non-CDS options trips proportional to recycling levels relative to 2c and 3; 0.5 trips / day for CDS
Employee costs are excluded from the DRIS
sorting time 1 sec / employee / trip
no. of employees
8 million FT (ABS Labour Force Stats)
value of time $42.75/hour (Austroads value of time for business vehicles)
employee participation
50% for options 2C and 310% for CDS
additional walk time
zero - temporary waste and recycling bins assumed to be co-located in workplaces
Cleaners / other staff
no. of businesses that employ cleaners
1/2 of the 125,000 businesses with a turnover of more than $2M/a (ABS data)
retained
additional trips
1 trip every 2nd day for Options 2c and 3 by 2035, other non-CDS options, time proportional to
0.5 trips per day based on weighted average of 0.2 trips/ day for 40% of businesses, 0.5
.
National Environment Protection CouncilDistributional and Cost Benefit Analysis for the Packaging Impacts Decision RIS: Data assumptions
57.

recycling quantities relative to 2c and 3
trip/ day for 40% of businesses; 1 trip/ day for 9% of businesses and 20 trips/ day for 1% of businesses (e.g. airports, large shopping centres)
additional transfer and walk time
5 seconds per trip 150 seconds (2.5 minutes) per trip
value of time $42.75/hour $35/ hour
Note: cleaners / other staff are involved in transferring the contents of temporary storage infrastructure to large accumulation points, whereas employee costs relate to taking packaging to temporary storage infrastructure.
4.5 Collection and transport costs4.5.1 CRIS: AssumptionsThe CRIS cost-benefit assessment assumes the following collection costs:
Household kerbside: $187 per tonne; and
Commercial and industrial: $26 per tonne.
These collection types are assumed to occur in all options, although to varying extents based on recycling projections. As a result the CBA assumes that in the base case all recycled packaging is recycled using either kerbside or C&I services; and in the CDS option cases, 7.1% of recycled beverage containers are recycled via kerbside recycling, 10.1% via C&I recycling and 82.8% at CDS infrastructure.
Finally, the CRIS cost-benefit assessment assumes that the CDS will reduce the number of times the kerbside collection trucks have to “return a load to the MRF”, the avoided cost is up to $10 million per year (by 2035). This is calculated as a function of:
projected at home recycling with a CDS: 7%;
truck capacity: 10 tonne capacity per truck;
estimated time of average return trip: 1.5 hours; and
truck operating cost: $120 per hour.
4.5.2 Discussion Introducing a container deposit or refund scheme will reduce the yield of recyclate through household kerbside systems. It is possible that, as a consequence of this reduced yield, councils could decide to reduce the frequency of their kerbside collection services if practical and had the effect of reducing kerbside collection costs. This would only be the case if the reduced service frequency did not lead to substantially increased yield/household/collection relative to the current situation22. To test this estimates have been made of the impact of a container deposit or
22 If this were to happen reduced service frequency is unlikely to be practical or cost effective since it would require larger recycling bins and an increase in the size and/or number of collection vehicles.
.
National Environment Protection CouncilDistributional and Cost Benefit Analysis for the Packaging Impacts Decision RIS: Data assumptions
58.

refund scheme on the yield of recyclate through the kerbside system, comparing yields relative to the base case and also on a per household basis relative to the base year (2013).
These estimates are presented in Table 39. The estimates indicate that although the introduction of a CDS will reduce the throughput of recyclate through the kerbside system, the change relative to the base year (2013) is unlikely to be substantial enough for councils to reduce the frequency of the kerbside collection service in a practical and cost effective manner. Indeed, reducing the frequency of the service from fortnightly (the most common frequency of service around Australia) to monthly in conjunction with the introduction of a CDS would lead to a 53% increase in the recyclate yield/household/collection by 2020 and 73% by 2035. This is unlikely to be a practical or cost effective outcome. Reducing the frequency of service from fortnightly to three weekly would still lead to a significant increase in recyclate yield/household/collection also raising a question mark over its feasibility.
Table 39: Impact of Options 4a and 4b on kerbside recycling (tonnes)
2015 2020 2025 2030 2035Total kerbside collection base case (including packaging & non-packaging)
1,460,720 1,640,929 1,736,628 1,816,799 1,866,967
Kerbside recycling with CDS 1,460,720 1,155,294 1,183,699 1,217,817 1,251,445
Percentage change in kerbside collection with CDS relative to base case
0.0% -29.6% -31.8% -33.0% -33.0%
Percentage change per household, relative to base year(2013)
0.0% -22.7% -22.1% -20.7% -18.6%
Impact of change in service frequency to kerbside recyclate yield/household/collection (with CDS system)
Reduce frequency of service from fortnightly to monthly, relative to base year (2013)
152.9% 159.2% 167.1% 174.0% 152.9%
Reduce frequency of service from fortnightly to three weekly, relative to base year (2013)
114.7% 119.4% 125.3% 130.5% 114.7%
4.5.3 DRIS: AssumptionsFor the purpose of the DRIS, we propose that a number of these assumptions be varied.
Regarding collection costs, based on the Sustainability Victoria (2011) Annual Local Government Survey, the DRIS will use the following collection and transport cost estimates:
Recyclables: $97.48 (metro) and $172.84 (non-metro) per tonne.
Garbage: $132.18 (metro) and $176.62 (non-metro) per tonne.
Additionally, we propose to adjust collection and transport cost estimates to reflect the fixed component of these costs. This is estimated to be approximately 15% based on a review of information on the breakdown of municipal waste collection and transport costs (DEC NSW 2004, Nolan ITU et al. 2001, Victorian Jurisdictional Recycling Group 2002). For example, instead of assuming that an increase or decrease in metro household kerbside recycling of one tonne leads to a corresponding increase or decrease of $97.48, the model will assume that the change in costs is only 85% of this amount (i.e. $82.86). The effect of this change is to increase
.
National Environment Protection CouncilDistributional and Cost Benefit Analysis for the Packaging Impacts Decision RIS: Data assumptions
59.

the average unit cost of kerbside collection and transport where options result in reduced yields through kerbside recycling or garbage collection systems.
Regarding the cost of returning a load to the MRF, the DRIS will use the following assumptions:
projected at home recycling with a CDS: 7%;
truck capacity: 5 tonnes capacity per truck, with sensitivity range of 4 to 6.5 tonnes per truck;
estimate of time of average return trip: 1 hour (metro) and 1.5 hours (non-metro), with sensitivity range of 0.75 to 2 hours; and
truck operating costs: $120 per hour.
Truck capacity has changed from 10 tonnes to 5 tonnes per truck. This change was derived both through top down (industry consultation) and bottom up (compaction and vehicle mass limits) assessments. The bottom-up assessment assumes that with an R12 (single axle front and dual axle rear) with vehicle capacity of 29 metres cubed and tare weight of 13 tonnes, the load capacity of the vehicle under different compaction scenarios is 4.4 tonnes (150 kg/m3), 5.1 tonnes (175 kg/m3) and 5.8 tonnes (200 kg/m3). Discussions with industry confirmed that a R12 truck type is most common and the load is typically around 5 tonnes per vehicle. Also, trucks do not operate at maximum capacity as they run the risk of exceeding vehicle mass limits, which would mean they could incur fines and demerits penalties.
Estimated average return trip times also differentiate between metropolitan and non-metropolitan locations. In metropolitan locations, it assumed that vehicles travel to centrally located waste resource facilities (transfer stations or landfills). In non-metropolitan locations, it is assumed that vehicles travel to waste facilities that are located outside of town in abandoned mines pits or construction sites. In this analysis we have used averages, however, we acknowledge that these values will not reflect regional locations that are very long distances from metropolitan regions where recycling services are provided. For instance, stakeholder feedback noted that there are some locations (e.g. Broome) where transport distances for recycles are extremely long (circa 2,000 km to either Perth or Darwin).
Major transport and collection cost assumptions used in the CRIS and proposed for the DRIS are outlined in the table below.
Table 40: CRIS and DRIS transport and collection cost assumptions
Cost item Application CRIS assumption DRIS assumption Unit
Household Kerbside Collection Cost All options 187
Recyclables: 97.48 (metro)
172.84 (non-metro)
Garbage:132.18 (metro)
176.62 (non-metro)
$/tonne
Commercial and Industrial Kerbside Collection Cost
All options 26 $/tonne
% of CDS containers redeemed through kerbside
CDS options 7.1 7.1 %
% of CDS containers redeemed through C&I collections
CDS options 10.1 10.1 %
.
National Environment Protection CouncilDistributional and Cost Benefit Analysis for the Packaging Impacts Decision RIS: Data assumptions
60.

Cost item Application CRIS assumption DRIS assumption Unit
Load to MRF All options 10 5 t/truck
Average return trip All options 1.5 1.5 hours
Vehicle operating cost All options 120 120 $/hr
4.6 Processing costs at MRF facilities4.6.1 CRIS assumptionsThe CRIS estimated a total cost of processing material at an MRF to be $85 per tonne. The components of this cost are shown in the table below.
Table 41: CRIS processing of recyclate at MRFs cost assumptions
$ per tonne
Processing cost for material delivered to MRF ($/t) $45
Assume residual/reject (%) 20%
Assumed cost to landfill residual ($/tonne) $200
Total MRF processing cost (including residual disposal) $85
Source: Table 45, Attachment C, CRIS.
4.6.2 DiscussionThe $45 per tonne processing cost for material delivered to MRF is consistent with previous studies undertaken by Marsden Jacob, reflecting evidence from a number of jurisdictions. The weighted average reject rate of 20% is also consistent with available evidence from the recycling industry. We do not believe, however, that the average cost to landfill of the residual of $200/ tonne is consistent with jurisdictional evidence, which points to substantial differences in landfill operating costs between jurisdictions and regions. Given this, we propose to derive different rates for different regions in the CBA model.
4.6.3 DRIS AssumptionsFor the DRIS, a contamination rate ‘assume residual/reject (%)’ is applied in the Material Flows Analysis and thus the volume of material representing residual from MRF is explicitly included in tonnes to landfill. Therefore, the CBA model will automatically apply the prevailing assumptions relating to landfill operating costs and externalities for this portion (derived based .
National Environment Protection CouncilDistributional and Cost Benefit Analysis for the Packaging Impacts Decision RIS: Data assumptions
61.

on region of MRF operation – see Tables 42 to 46, section 5.2). Those cost assumptions are discussed in section 5.2.
Table 42: Processing of recyclate at MRFs cost assumptions
Data variable CRIS assumption DRIS assumption Unit
Processing cost for material delivered to MRF ($/t) $45 $45 $ / t
Assume residual/reject (%) 20% Applied in the Material Flows Analysis %
Assumed cost to landfill residual ($/tonne) $200 Derived based on region $ / t
4.7 Infrastructure and operating costs4.7.1 Option 1CRIS assumptions
The National Waste Recycling and Litter Strategy is intended to focus on improved use of current infrastructure through increased knowledge, education and information sharing. As such, costs are expected to be primarily in the areas of information, education and co-ordination. Proposed programs and costs assumptions relating to those programs are outlined in Table 43.
Table 43: Option 1 program and cost assumptions
Sub-category Data variable CRIS
assumptionDRIS
assumption Unit
Option 1 initiatives
Government initiatives including:- National recycling education/
advertising initiative- Information sharing between state and
local governments
3 3$ m/year
2016-2020
Development of non-regulatory standards for end products and recycling labelling for packaging
2 2$ m/year
2016-2025
Investment initiatives including:- National program to improve away from
home recycling at mass consumption areas though improved bin labelling
- Consistent recycling of recycling bins- Additional initiatives (yet to be defined –
based on needs at the time of implementation)
7.5
6.4 (as
determined through MRCCs)
$ m/year2021-2035
National education program for litter prevention
2 2 $ m/year2016-2020
National litter count methodology 1 1 $ m2015
Additional litter initiatives (undefined) 2 2 $ m/year2021-
.
National Environment Protection CouncilDistributional and Cost Benefit Analysis for the Packaging Impacts Decision RIS: Data assumptions
62.

2035
Discussion and DRIS assumptions
The cost estimates provided in the CRIS for Option 1 programs appear, on face value, to be reasonable. Rather than accept them at face value however, we tested their veracity and their capacity to deliver the assumed recycling rates (see Tables 10 and 11) through application of marginal recycling cost curves as they apply to Options 2a-2e (see following section). As a result of this application program cost estimates have been revised as set out in Table 43.
4.7.2 Options 2a to 2e and 3CRIS assumptions
Options 2a to 2e and 3 are all based on the implementation of a range of recycling infrastructure and non-infrastructure programs. Table 44 provides an overview of programs under each of the initiatives and (Options 2a, 2b, 2c and 3 only) cost estimates used in the CRIS.
.
National Environment Protection CouncilDistributional and Cost Benefit Analysis for the Packaging Impacts Decision RIS: Data assumptions
63.

Table 44: Program and cost assumptions for options 2a-2e, 3
Sub-category Data variable CRIS assumption DRIS assumption
Option 2a initiatives
Additional recycling initiatives $2m/year ~ $10.1m/ year over project life(approximating $13.5m/year 2016-2020)
Litter initiatives $5m/year $5m/year
Option 2b initiatives
Range of initiatives designed to increase recycling and reduce litter including:
- public place recycling- kerbside recycling
$15m/year ~38.9m/ year over project life(approximating $75.5.m/year 2016-2020)
Litter initiatives $5m/year $5m/year
Option 2c initiatives
Recycling and litter initiatives as proposed for Option 2b plus:- improved regional and remote beverage container recovery
through organised backload arrangements;- extension of recycling opportunities in regional LGAs;- end market development support to create new markets; and- litter enforcement and financial incentives to reduce litter.
$27.1-37.4m/year ~54.9m/ year over project life(approximating $115.2m/year 2016-2020)
Litter initiatives $5m/year $5m/year
Option 2dInitiatives required to meet beverage container recycling targets na ~39.9m/ year over project life
(approximating $71.7m/year 2016-2020)Litter initiatives na $5m/year
Option 2eGrants based program at three different levels of investment: $20m; $35m; $50m na
$20m/year 2016-2020(~13.2m/ year over project life)
$35m/year 2016-2020(~19.3m/ year over project life)
$50m/year 2016-2020(~25.5m/ year over project life)
Litter initiatives na $5m/year
Option 3 initiativesUndefined recycling and litter programs, similar in scale to Option 2C $27.1-37.4m/ year ~54.9m/ year over project life
(approximating $115.2m/year 2016-2020)
Litter initiatives $5m/year $5m/year
.
National Environment Protection CouncilDistributional and Cost Benefit Analysis for the Packaging Impacts Decision RIS: Data assumptions
64.
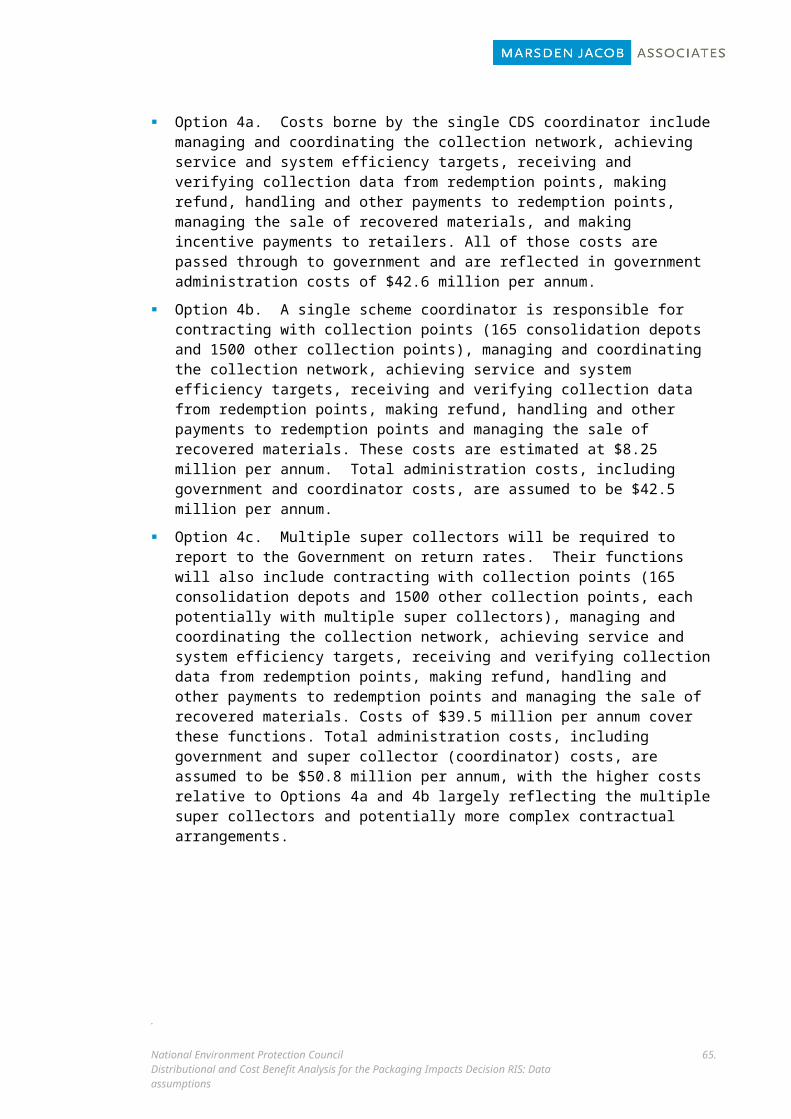
Discussion and DRIS assumptions
Little evidence is provided in the CRIS to substantiate programs and associated costs necessary to achieve recycling levels assumed for Options 2a to 2c and 3. It was therefore necessary to test the veracity of program and cost assumptions by developing and applying marginal recycling cost curves (MRCCs). A similar approach is proposed for the new options 2d and 2e. The method used to develop and apply the MRCCs is discussed below. Costs associated with each of the options estimated through the application of this approach are included in the Regulatory Impacts report.
Application of Marginal Recycling Cost Curves (MRCC)
Marginal Recycling Cost Curves (MRCCs) were constructed by analysing data from the project performance monitoring data supplied by the Product Stewardship Forum (PSF), estimates of cost and recycling outcomes achieved by projects funded under the Australian Packaging Covenant (APC) and estimates of the cost and recycling volumes through implementation of a National Bin Network (NBN) and other initiatives. In the MRCC’s, costs are calculated on a ‘levelised cost’ basis. That is, for each recycling opportunity in the MRCC, the total (capital and operating) costs of that project are apportioned equally over each tonne of recycling achieved over the life of the project. Measuring industry costs in this manner provides a ‘smoothed’ profile of costs to industry with costs increasing (decreasing) as recycling target tonnes increase (decrease) over time.
In practice, industry may fund the total cost of project in a number of ways. Industry participants may use spare capital from their reserves or finance the project through bank debt, with repayments being paid back over the life of the project. However, the CBA analysis does not make assumptions about the profile of spend, or type of financing undertaken by the industry. Rather, the levelised cost approach provides an ‘annual equivalent’ amount that is required by industry for each year of the study period. Doing so, ensures that all of the costs (capital and operating) associated with the target are accounted for in the CBA analysis and if, for example, further investment is required towards the later years of the analysis (due to higher targets in later years), the capital associated with the additional tonnages is adequately accounted for.
Further details of the approach used to develop the MRCCs are provided in Box 2.
Results
Results of the MRCC analysis are summarised in Figure 2, which maps the present value (PV) of costs against additional recycling above the base case (cumulative tonnes) for each option after adjusting for a risk premium. Resulting values are expressed as $/ tonne. The figure indicates that Option 2c achieves the greatest level of recycling of the options, but at highest average cost ($ 114/ tonne). Options 2b, 2d and 2e ($50m), achieve similar overall recycling outcomes, but Option 2e ($50 m) is more cost-effective ($75/ tonne) than either 2b ($103/ tonne) or 2d ($109/ tonne). This is to be expected given that Options 2b and 2d both involve beverage container targets (as well as overall targets), whereas Option 2e has no such constraints.
.
National Environment Protection CouncilDistributional and Cost Benefit Analysis for the Packaging Impacts Decision RIS: Data assumptions
65.
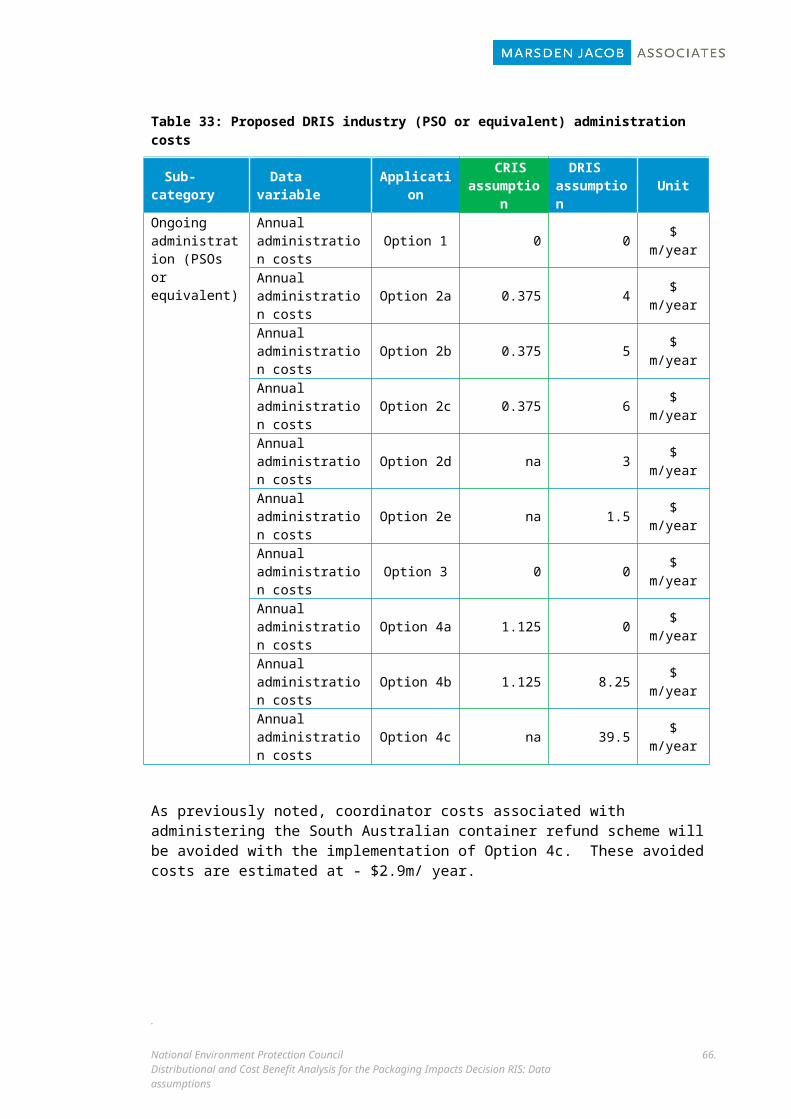
Figure 2: MRCC recycling and cost outcomes, Options 1 and 2a to 2e
Option 1
Option 2a
Option 2b
Option 2cOption 2d
Option 2e - 20 per annum
Option 2e - 35 per annum
Option 2e - 50 per annum
0
20
40
60
80
100
120
140
- 1,000,000 2,000,000 3,000,000 4,000,000 5,000,000 6,000,000 7,000,000 8,000,000 9,000,000
PV $
/ P
V pa
ckag
ing
tonn
es
Cumulative tonnes (2016-2035)
Results Options 2a to 2d
Based on application of the MRCC, achieving the recycling outcomes and targets estimated for Option 2a (see Table 12) will require annual investment of approximately $10.1 million/ year averaged over 20 years from 2016 to 2035. These investment amounts include allowance for additional investment required in later years to upgrade or replace recycling infrastructure (assuming an average life of approximately 15 years for the initial investments).
Achieving the recycling outcomes and targets estimated for Option 2b (see Table 12) will require annual investment of approximately $38.9 million from 2016 to 2035. As with Option 2a, these investment amounts include allowance for additional investment required in later years to upgrade or replace recycling infrastructure.
Achieving the recycling outcomes and targets estimated for Option 2c (see Table 12) will require annual investment of approximately $54.9 million from 2016 to 2035, including allowance for additional investment required in later years to upgrade or replace recycling infrastructure.
Achieving the recycling outcomes and targets estimated for Option 2d (see Table 12) will require annual investment of approximately $39.9 million from 2016 to 2035, including allowance for additional investment required in later years to upgrade or replace recycling infrastructure. Although Option 2d achieves less additional recycling overall than Option 2b (see Figure 2), the greater investment cost reflects constraints associated with slightly more stringent beverage container recycling targets.
Results Option 2e
Application of the MRCC to Option 2e was essentially the reverse of the approach used for Options 2a to 2d. It involved simulating the investments that are expected to occur if additional funding above what is already planned under the Australian Packaging Covenant (APC) is invested. For the DRIS, three levels of additional funding will be modelled, being $20 million per annum for five years from 2016 to 2020; $35 million per annum; and $50 million per annum.
.
National Environment Protection CouncilDistributional and Cost Benefit Analysis for the Packaging Impacts Decision RIS: Data assumptions
66.

While the target is expressed as a certain amount per year (e.g. $35 million), it is assumed that the total amount available (e.g. $175 million in the case of $35 million per year) to be invested is gradually ramped until the pool funding is exhausted. The principle applied to determine this trajectory is the same that would apply to depreciating an asset of the same value (e.g. $175m) over the given term (e.g. 5 years), using a ‘straight line’ depreciation method. In the example of $35m per year, this provides the following investment profile.
Table 45: Profile of investment for option 2e (assuming $35m per year)
2016 2017 2018 2019 2020
New investment ($m) 11.7 23.3 35.0 46.7 58.3
It is also assumed that this funding is predominantly used for capital subsidy for projects that remain active during the modelling period (until at-least 2035) and that under the scheme the optimal (defined as the set of projects that maximise overall tonnes of recycling (not just packaging)) set of projects will be selected through a collaborative industry-government committee.
The estimated additional tonnes of recycling results of applying the MRCC logic to Option 2e are shown in Figure 3 to Figure 5. The data in the figures represent thousands of additional tonnes above the base case each year, for each of the three investment levels of $20m per annum, $35m per annum and $50m per annum. These have been translated into recycling rates, which are shown in Table 12.
Figure 3: Recycling outcomes for Option 2e (above base case, assuming funding of $20m per year)
.
National Environment Protection CouncilDistributional and Cost Benefit Analysis for the Packaging Impacts Decision RIS: Data assumptions
67.

Figure 4: Recycling outcomes for Option 2e (above base case, assuming funding of $35m per year)
Figure 5: Recycling outcomes for Option 2e (above base case, assuming funding of $50m per year)
Application of a risk premium
Numerous Australian and overseas behavioural studies have examined factors influencing recycling (e.g. De Young 2000, Gamba and Oskamp 1994, Hornik et al. 1995, Osbaltson & Schott 2012). Studies indicate that while the ‘convenience’ of recycling is a very important factor influencing levels of recycling (e.g. the number and location of recycling bins), other factors relating to personal behaviour are important complimentary influences. Barriers to recycling linked to personal behaviour include:
.
National Environment Protection CouncilDistributional and Cost Benefit Analysis for the Packaging Impacts Decision RIS: Data assumptions
68.

inadequate instructions to consumers about what can be recycled, where and how;
insufficient or inappropriate prompts reminding consumers about what, where and how to recycle;
(for some groups) a lack of justification on why to recycle; and
social norms and perceptions (e.g. recycling in public places may not yet be ‘standard practice’).
Recycling investments identified through the MRCCs and proposed for implementation through the co-regulatory options (2a-2e) will target significant barriers to public place and C&I recycling, notably the ‘convenience’ factor. It is apparent however, that even where investments provide substantially improved levels of recycling infrastructure and services there is a significant risk that recycling targets will not be met due to the barriers linked to personal behaviour described above. This risk is evident for all options, but more so for the co-regulatory options because (unlike CDS options) the co-regulatory options do not provide consumers with an external financial incentive to recycle or not to litter. The risk is especially evident for Options 2b, 2c and 2d because they require high beverage container recycling rates to be achieved – rates that approach theoretical upper limits – while relying on standard, co-mingled recycling systems23 (e.g. away from home glass and steel beverage containers are required to achieve beverage recycling rates of over 80%, a difficult proposition considering typical contamination rates of 20% for co-mingled recycling systems).
In the absence of an external incentive therefore, it is assessed that substantial and sustained investment in education and information programs will be required to facilitate behavioural change, thereby reducing the risk of co-regulatory options not meeting recycling and litter targets to a level that is comparable with the CDS options. Education and information programs will need to focus on improving knowledge and understanding of away from home recycling facilities and practices and to provide the necessary prompts to consumers to recycle packaging materials that are consumed away from home. Programs are likely to include (but not be limited to):
a mass media advertising campaign;
information packages presented in variety of formats; and
on the ground staff providing audits, education and follow-up monitoring at targeted locations.
The proposed education and information programs will need to be additional to the nominal levels of information and education implemented as part of the infrastructure and service investments identified through the MRCCs. As such, the programs can be regarded as a ‘risk premium’.
It is estimated that up to $20 million/year nationally will be needed for the highest risk options - to be scaled up in early years in line with infrastructure investments, scaled down again after 2025, but still maintained at level necessary to maintain an ongoing education and information program. The premium would be applied in full to the co-regulatory options that have very high beverage container recycling targets for 2025 (i.e. 80% - Options 2b, 2c and 2d). The premium would be applied to other co-regulatory options in proportion to their beverage container 23 In practice, recycling rates are constrained to much less than 100% because of practical difficulties of
recovering all packaging waste. Indeed it may be difficult to achieve a recycling rate much greater than 80% for some material types and waste streams due to the relatively high contamination rates associated with most co-mingled recovery systems (assumed to be 20%). Certainly, it will be difficult to achieve a beverage container recycling rate of much more than 80% when the system relies predominantly on co-mingled recovery.
.
National Environment Protection CouncilDistributional and Cost Benefit Analysis for the Packaging Impacts Decision RIS: Data assumptions
69.

recycling rates in 2025, but only if their overall beverage container recycling rates exceed a threshold of 70%24. Thus Option 2a would not attract a risk premium and Options 2e-20, 2e-35 and 2e-50 would attract a premium but at a relatively low level.
The proposed premiums for the each of the co-regulatory options are presented in Figure 6. The premiums are applied externally to the MRCC process as they are assumed to have no additional impact on recycling levels, but are necessary to provide a high level of confidence that each of the options meets its intended/ targeted beverage container recycling rate (see Table9).
Figure 6: Education and information ‘risk premium’ applied to co-regulatory options
24 To achieve an overall beverage container recycling rate of 75% or greater requires recycling rates for some materials to approach or exceed 80% from some sources (e.g. public place) or in some regions. Once the overall beverage container recycling rate reaches 80% exceedances become far more common.
.
National Environment Protection CouncilDistributional and Cost Benefit Analysis for the Packaging Impacts Decision RIS: Data assumptions
70.

Box 2. Application of Marginal Recycling Cost Curves to derive estimates of costs Under the base case, it is assumed that investments in recycling infrastructure are adopted by industry where it is financially viable for them to do so. A corollary of this is that if recycling rates over and above the base case are desired then this would require a financial outlay from industry which may be in the form of financial incentives (e.g. grants, subsidies etc.) or through mandates (e.g. obligations to invest in measures to achieve a certain recycling target).
In the latter (which is the model adopted in Options 2a to 2d) the industry would seek to meet their obligations at least cost. This is consistent with economic theory for profit maximising firms. Also consistent with economic theory (law of diminishing returns), the greater the volume of recycling desired, the greater the marginal cost (cost for an additional tonne of recycling) and determining the total cost of meeting a given target may be estimated by calculating the area under a marginal cost curve.
To facilitate this analysis, MRCCs (reflecting the marginal financial cost to industry25 for cumulative volumes of recycling) were constructed using the following sources:
Estimates of the cost and recycling volumes through implementation of a National Bin Network provided by the Product Stewardship Forum (PSF);
Project performance monitoring data supplied by the PSF; and
Estimates of cost and recycling outcomes achieved by projects funded under the Australian Packaging Covenant (APC).
The project data from these sources were analysed to produce data points for the MRCC. As the data was not available in a standardised format and included gaps and uncertainties, the project team undertook a process to ‘cleanse’ and standardise the data base. This involved excluding projects where there was significant uncertainty as to cost, recycling outcomes and/or projects that may not actually lead to incremental recycling outcomes (referred to as ‘additionality’) and adjusting the estimated cost of some projects to reflect a likely ‘actual’ cost (based on outcomes of other projects of a similar nature) as opposed to a ‘projected’ cost. It also involved making assumptions about the characteristics of the project (e.g. sector targeted, lifetime, annual operating expenditure etc.) where this data was not provided. A final list of projects was then extrapolated to provide a list of potentially national scale projects, including commercial and industrial (C&I), public place (LGA or commercial), kerbside or mixed. In undertaking the extrapolation the following factors were taken into account:
the feasibility of implementing projects in different jurisdictions including, for example, that the relevant packaging consumption sources (C&I, public place etc.) are available and that similar initiatives are not already being applied in those jurisdictions;
the feasibility of implementing the projects in metropolitan and/or non-metropolitan areas;
the likely material mix (e.g. glass, plastics, mixed); and
the potential life of the project.
Through this process, for each project (‘measure’) the following were estimated.
25 There is a distinction between the financial cost to industry (the funds that industry expend to support recycling activity) and the economic cost to society. The former will only include packaging industry expenditure. The latter includes the full set of economic costs and benefits associated with increased recycling (e.g. benefit of avoided landfill, market value of resources etc.). The ‘ranking’ of recycling measures on a financial cost curve will be different to their ‘economic efficiency’ (benefits less costs).
.
National Environment Protection CouncilDistributional and Cost Benefit Analysis for the Packaging Impacts Decision RIS: Data assumptions
71.

Table 46: Proposed DRIS market value assumptions
Unit Method used to estimate
Total for measure
Cost effectiveness $/t Apportionment of capital and operating costs of the project over the total tonnes of recycling delivered by the project over its lifetime (i.e. a ‘levelised cost’).
Tonnes per annum t.p.a Tonnes of recycling achieved per year
Sector C&I, Public Place or Mix (not focussed on a given sector)
Material composition Material targeted (or a mix of material)
Container type Whether the measure targets packaging, beverage containers or any type of material
Metro/Non-metro Whether the measure may be implemented in metro areas, non-metro areas or all
Finally, a ‘cut-off’ point on the MRCC was determined, with this point being the point at which projects are likely to be additional to the base case (i.e. it is anticipated that the lower cost projects below this point will be implemented as part of the base case). The cut-off point was determined by considering growth in recycling under the base, net of ‘natural growth’ in recycling under the base due to growth in consumption.
Figure 6 shows the results of this analysis, with the supply curve of investable opportunities sorted in rank of annualised $/t of total recycling26. The expected recycling outcome for a given year is taken as the corresponding x-axis (tonnes per annum) value where the area under the curve is equal to the annualised amount of funding provided ($m).
Figure 7: Investable opportunities for Options 2a to 2e (above base case)
$-
$100
$200
$300
$400
$500
$600
$700
$800
$900
$1,000
- 100,000 200,000 300,000 400,000 500,000 600,000 700,000
$/to
nne
tonnes of recycling per year
These results have inherently large margins of uncertainty. Due to this uncertainty recycling project infrastructure costs for Options 2a-2e will be an important aspect of sensitivity analysis.
26 There are in fact three versions of the MRCCs as there are varying targets for particular types of material in each option. For options that contain a beverage target (or sub-target) the MRCC ordered by $/t of beverage recycling is used first. Following this step (or if the target is only a packaging target) the MRCC, ordered by $/t of packaging, is used for any residual packaging volumes. Finally, Option 2e uses the MRCC ordered by $/t of total recycling (packaging and non-packaging).
.
National Environment Protection CouncilDistributional and Cost Benefit Analysis for the Packaging Impacts Decision RIS: Data assumptions
72.

4.7.3 Options 4a, 4b, 4cCRIS assumptions
The CRIS adopted a widely accepted approach to estimating the cost of CDS arrangements, with estimates made of the various cost elements on a per container basis. Each unit cost provided is fully inclusive of both capital and operating costs.
In developing its cost estimates, the CRIS assessed a Boomerang Alliance (BA) model but ultimately used different estimates for unit costs, which it deemed to be more representative of current unit costs. As outlined in Table 30, the costs adopted in the CRIS for Option 4a are assumed to be 4.5 cents/container, rising to 6.0 cents/container in rural and remote locations. Co-ordination across the system is 0.4 cents/container, baling and transport from collection centres, RVMs and rural and remote collection points to hubs (urban and rural) is 0.72 cents/container, and rural and remote transport from hubs to reprocessors is estimated at $106.30 per tonne.
The handling cost adopted for Option 4b in the CRIS was 5.0 cents/container, reflecting the smaller number of RVMs proposed for this option, and 6.0 cents/container for rural and remote locations. Co-ordination across the system is also assumed to be 0.4 cents/container. Baling for transport is 0.3 cents/ container, transport (rural and remote collection point to consolidation depot) is 0.5 cents/container, allowing for backloading efficiencies. Transport from collection depots and RVMs to consolidation depots is 0.4 cents/container. Remote transport from consolidation depots to reprocessors is estimated at $106.30 per tonne.
Discussion and DRIS assumptionsSimilar to the CRIS project team, the DRIS project team was provided with modelling of Option 4a on a confidential basis. However, the model provided to the DRIS team differed from the earlier model, in that it modelled the revised Option 4a, which is based entirely around RVMs as collection points. The model also provided a range of estimates for capital and operating costs, assuming different sizes and configurations of RVM collection points. A key argument advanced through the model is that an RVM-based scheme provides efficiencies relative to a depot-based system, with those efficiencies reflected in lower capital and operating costs. We accepted this argument in part, adopting a capital and operating cost estimate for RVMs of 3.9 c/container in metropolitan areas and 4.5 c/container in non-metropolitan areas. This is at the conservative (high) end of the range of estimates provided by its proponent but is lower than the 4.5c/ container cost assumed in the CRIS for RVMs.
Infrastructure and cost assumptions proposed in the DRIS are set out in Table 47. Other important points to note about these cost estimates are as follows:
Capital and operating costs estimate for RVMs includes an assumed rental/ incentive payment to retailers of 0.2c/ container in metropolitan areas and 0.3c/ container in non-metropolitan areas.
Capital and operating cost differences between metropolitan and non-metropolitan areas include assumed higher operating costs in non-metropolitan areas due to smaller scale of operation and, in the case of RVMs, higher rental costs (mentioned above).
.
National Environment Protection CouncilDistributional and Cost Benefit Analysis for the Packaging Impacts Decision RIS: Data assumptions
73.

Transport costs are assumed to be lower in metropolitan areas than regional areas, which in turn are lower than transport costs in remote areas.
System administration and coordination costs are addressed in the section on PSO administration costs (see section 4.2).
Table 47: Options 4a, 4b, 4c CRIS and DRIS cost assumptions
Option Data variable CRIS assumption
DRIS assumption Unit
Option 4a (Boomerang CDS)
Capital and operating costs – Hubs 4.5 4.0 (metro)4.2 (non-metro) c/container
Capital and operating costs – RVMs 4.5 3.9 (metro)4.5 (non-metro) c/container
Capital and operating costs – remote collection points 6 6 c/container
Baling for transport 0.3 0.3 c/container
Transport: RVM and collection points to Hubs 0.4 0.5 (metro)
0.7 (non-metro) c/container
Transport: remote RVM and collection points to Hubs 0.6 0.9 c/container
Option 4b (Centralised CRS)
Capital and operating costs – Consolidation points 5 4.0 (metro)
4.2 (non-metro) c/container
Capital and operating costs – Collection depots 5 4.5 (metro)
5.0 (non-metro) c/container
Capital and operating costs – RVMs 4.5 3.9 (metro)4.5 (non-metro) c/container
Capital and operating costs – remote collection points 6 6 c/container
Baling for transport 0.3 0.3 c/containerTransport: collection depot and RVM to consolidation depot
0.4 0.5 (metro)0.7 (non-metro)
c/container
Transport: remote collection point to consolidation depot
0.5 0.9 c/container
Option 4c (SA CRS)
Capital and operating costs – super collectors
na 0.5 c/container
Capital and operating costs – collection depots
na 4.5 (metro)5.0 (non-metro)
c/container
Capital and operating costs – RVMs na 3.9 (metro)4.5 (non-metro)
c/container
Capital and operating costs – Remote collection points
na 6 c/container
Baling for transport na 0.3 c/containerTransport: collection depot to super collector
na 0.5 (metro)0.7 (non-metro)
c/container
Transport: remote collection point to super collector na 0.9 $/tonne
.
National Environment Protection CouncilDistributional and Cost Benefit Analysis for the Packaging Impacts Decision RIS: Data assumptions
74.

As discussed in the CRIS, industry practice is to express scheme costs on a unit (i.e. ‘per container’) basis, but because recycling projections have been estimated on a weight (i.e. ‘per tonne’) basis, it is necessary to convert unit costs to a weight basis. The approach and assumptions used in the CRIS to undertake this conversion have been applied with the revised cost estimates, revised configurations for Options 4a and 4b and the new Option 4c. Results of this process are set out in Table 48, providing a weighted average of costs for metropolitan and non-metropolitan areas.
The estimated costs of $537/ tonne, $557/ tonne and $648/ tonne respectively for Options 4a, 4b and 4c compare with costs of $689/ tonne and $749/ tonne estimated in the CRIS respectively for Options 4a and 4b.27 On a per container basis, the weighted average costs of Options 4a, 4b and 4c proposed for the DRIS are 4.5 c/ container, 4.7c/ container, 5.4 c/ container respectively.
As noted, the costs outlined in Table 47 are weighted averages for metropolitan and non-metropolitan areas. However, metropolitan and non-metropolitan cost will be differentiated in the CBA and distributional analysis. Infrastructure and operating costs in metropolitan areas are estimated to be $510/ tonne, $526/ tonne and $608/ tonne for Options 4a, 4b and 4c respectively. This compares with infrastructure and operating costs in non-metropolitan areas of $595/ tonne, $609/ tonne and $692/ tonne respectively for Options 4a, 4b and 4c.
Table 48: Options 4a, 4b, 4c DRIS cost estimates
Option 4a - Weighted infrastructure & handling cost per tonne
Cost itemCost
($/tonne)Proportion of
infrastructure (%)Weighted cost
($/tonne)
Capital and operating costs – Hubs28 484.3 21.1% 102.1
Capital and operating costs – RVMs 486.8 70.3% 342.3
Capital and operating costs – Remote collection points 714.2 1.5% 10.7
Baling for transport 35.7 92.9% 33.2
Transport: RVM to Hubs, metro & regional 66.8 70.3% 47.0
Transport: Remote collection point to Hubs 106.3 1.5% 1.6
Total weighted metro & non-metro Option 4a 536.9
Option 4b - Weighted infrastructure & handling cost per tonne
27 Note the DRIS costs exclude administration and coordination costs which were estimated at approximately $50/ tonne in the CRIS.
28 Capital and operating costs Hubs include handling fees (3.7c/ container) and compaction fees (0.4 c/container). Capital and operating costs collection depots include handling fees (4.25c/ container) and compaction fees (0.4c/container). Capital and operating costs RVMs include handling fees (3.5c/ container), compaction fees (0.4c/ container) and retailer incentive payment (0.25c/ container). Capital and operating costs include handling fees (5.6c/ container) and compaction fees (0.4c/ container). Capital and operating costs remote collection points include handling fees (5.6c/ container) and compaction fees (0.4c/ container).
Handling fees are assumed not to apply to material recovered through the kerbside system (7.1%). .
National Environment Protection CouncilDistributional and Cost Benefit Analysis for the Packaging Impacts Decision RIS: Data assumptions
75.
Cost itemCost
($/tonne)Proportion of
infrastructure (%)Weighted cost
($/tonne)Capital and operating costs – Consolidation points 484.3 21.1% 102.1
Capital and operating costs – Collection depots 554.0 30.2% 167.2
Capital and operating costs – RVMs 486.8 40.1% 195.4
Capital and operating costs – Remote collection point 714.2 1.5% 10.7
Baling for transport 35.7 92.9% 33.2
Transport: collection depot and RVM to consolidation depot, metro & regional 66.8 70.3% 47.0
Transport: Remote collection point to consolidation depot 106.3 1.5% 1.6
Total weighted metro & non-metro Option 4b 557.2
Option 4c - Weighted infrastructure & handling cost per tonne
Cost itemCost
($/tonne)Proportion of
infrastructure (%)Weighted cost
($/tonne)Capital and operating costs – super collectors 53.6 92.9% 49.8
Capital and operating costs – collection depots 554.0 70.1% 388.1
Capital and operating costs – RVMs 486.8 21.3% 103.9
Capital and operating costs – Remote collection points 714.2 1.5% 10.7
Baling for transport 35.7 92.9% 33.2
Transport: collection depot to super collector, metro & regional 66.8 91.4% 61.1
Remote transport: collection point to super collector 106.3 1.5% 1.6
Total weighted metro & non-metro Option 4c 648.3
.
National Environment Protection CouncilDistributional and Cost Benefit Analysis for the Packaging Impacts Decision RIS: Data assumptions
76.

4.8 Business compliance costs4.8.1 CRIS assumptions Businesses that exceed the threshold for inclusion in a packaging scheme could incur compliance costs related to preparing action plans and reporting. Drawing on information provided by the Environment Protection and Heritage Council (2010), these costs are estimated to be around $11,000-12,000 annually per medium-sized liable party to the APC.
The CRIS applied costs estimates of this magnitude to parties for Options 2a, 2b, 2c and 3 but assumed that there would only be a very small number of additional liable parties under these options relative to the (estimated) more than 850 liable parties that are currently covered by the APC. The CRIS did not estimate any compliance costs for Options 4a or 4b.
4.8.2 Discussion Data compiled by the NEPC Working group suggests that, with the exception of Option 1, each of the options will involve compliance costs including plan development, reporting and labelling for substantial numbers of additional parties. As well, a small number of major retailers will face compliance costs associated with a requirement to establish a convenience point in their car park or building for all outlets with a retail floor area of greater than 800m2.29
Table 49 provides an overview of estimated compliance costs.
Compliance costs for Options 2a to 2c, 2e and 3 are based on an estimated weighted average cost of $15,000 per year per liable party for action planning and reporting. It is assumed that there are no additional liable parties under Option 2d compared with the current situation.
Compliance costs for Options 4a, 4b and 4c are estimated to be $5,000 per liable party at startup for labelling. Additionally there are ongoing compliance costs of $3 million per annum for Options 4a and 4b and $1.5 million per annum for Option 4c. Ongoing costs are based on one additional hour per month required for: data reconciliation and reporting to the tax collection agency (4a, 4b) or super collector (4c), checking and processing of those entities’ notices of assessment/invoices (4a, 4b, 4c), occasional audit management and dispute resolution (4a, 4b, 4c) and periodic review/renewal of commercial relationship with super collector (4c). Retailer compliance costs, associated with the need to maintain a register of outlets that are required to establish a convenience point, have been estimated at $0.5 million per annum assuming that only major retail chains are liable under the scheme30.
29 Note this requirement raises potential competition policy issues that will need to be explored fully in the DRIS.30 These costs are only for Option 4a and are additional to the incentive payment to retailers to cover
administration and other costs associated with the housing of RVMs in stores. It is possible that other independent retailers would exceed the 800m2 threshold and also become liable.
.
National Environment Protection CouncilDistributional and Cost Benefit Analysis for the Packaging Impacts Decision RIS: Data assumptions
77.

Table 49: DRIS proposed compliance costs
Category Application CRIS assumption
DRIS assumption
Additional liable parties Unit
Plan development and reporting
Option 1 0 0 0 $ m/ year
Option 2a 0.69 2.25 150 $ m/ year
Option 2b 0.69 2.25 150 $ m/ year
Option 2c 0.69 2.25 150 $ m/ year
Option 2d na 0 0 $ m/ year
Option 2e na 2.25 150 $ m/ year
Option 3 0.69 2.25 150 $ m/ year
Labelling design, plates and printing
Option 4a 0 25.0 5000 $m
Option 4b 0 25.0 5000 $m
Option 4c 0 12.5 2500 $m
Data reconciliation and reporting
Option 4a 0 3.0 5000 $ m/ year
Option 4b 0 3.0 5000 $ m/ year
Option 4c 0 1.5 2500 $ m/ year
Retailer compliance Option 4a 0 0.5 5 $ m/ year
.
National Environment Protection CouncilDistributional and Cost Benefit Analysis for the Packaging Impacts Decision RIS: Data assumptions
78.

4.9 Loss of producer surplus4.9.1 CRIS assumptions and discussionThe CRIS did not estimate the potential impact to industry (or consumers) from lower sales associated with the price impacts of options. In the DRIS however, these price impacts will be assessed as estimated loss of producer surplus.
4.9.2 Loss of producer surplus, Options 4a, 4b and 4cLoss of producer surplus for manufacturers of beverage container products is assumed to result from the price impacts of implementing a CDS scheme. The loss results because fewer beverages are assumed to be purchased (due to higher prices faced by customers) and lower sales lead to lower after tax profits for the manufacturers.
Loss of producer surplus is estimated by segmenting the market in two ways and then summing the results of each of the segments to obtain a total. The first segmentation is undertaken by product category, because the responsiveness of items sold to price (price elasticity of demand) and the profit margin per item is estimated to vary across the categories. The product categories are:
beer manufacturing;
bottled water manufacturing;
milk and cream production;
soft drink manufacturing;
spirit manufacturing;
fruit juice drink manufacturing (relevant to Options 4a and 4b only); and
wine manufacturing (relevant to Options 4a and 4b only).
The second segmentation is undertaken by customer segment. This is required as each of the following segments experiences a different effective price increase (depending on whether they redeem or not):
customers who redeem their own containers;
customers who do not redeem - their containers are either redeemed by a third party or are not redeemed at all.
For each of the product and customer segments, the process of estimating loss of producer surplus essentially involves four steps:
1. Estimate an absolute average product price impact per container31.
31 For Option 4a, this is just the deposit rate. For Options 4b and Option 4c, this is the expected costs of refunds (this in turn depends on expectations of redemption rates) plus net costs of the scheme operation, divided by the number of containers.
.
National Environment Protection CouncilDistributional and Cost Benefit Analysis for the Packaging Impacts Decision RIS: Data assumptions
79.

2. Determine effective price impact on each customer segment32 [this is the absolute average produce price impact from step 1 minus refund amount (for customers redeeming their own containers only)].
3. Determine the change in volume (applying the relevant price elasticity of demand) due to the change in price.
4. Determine the change in after tax profit, multiplying change in volume by profit margin.
Average price and profit margin by industry
The assumptions used for price and profit margins are listed in Table 50.
Table 50: Producer surplus assumptions, Options 4a, 4b and 4c
Product Category / Industry
Average price per container
Price elasticity of demand
(closer to zero is more inelastic)
Industry revenue
Gross Margins
($) ($m) (% of revenue)
Beer 2.72 -0.27 5,178 21%
Bottled water 1.28 601 21%
Fruit juice 2.87 -0.55 to -0 .98 1,639 11%
Milk 2.08 -0.23 to -0.79 1,965 6%
Soft drink 1.80 -0.33 to -1.24 3,472 20%
Spirits 30.30 -0.60 498 13%
Wine 11.50 -0.24 7,180 14%
Sources: Fogarty 2008; Andreyeva 2010; Nghiem 2011; ACIL Tasman, 2012; IBIS World 2013
Average prices for each product category are based on ACIL Tasman (2012). Industry data published by IBISWorld were used to estimate industry revenue and gross margins (as a proxy for producer surplus33 expressed as Earnings Before Interest and Tax (EBIT) + Depreciation + Rent) per product category.
Price elasticities of demand are used to determine the change in quantity of beverages sold and are based on a number of Australian and international studies on the demand for food and beverages.
In reality, there may be substitution between product categories (as relative prices change) or even a response towards larger container sizes within the same product category (as larger container sizes experience a smaller percentage price increase), however such effects are not included in our model as this would require far more detailed analysis and data.
32 The effective price impact for redeeming customers will be zero under Option 4a and could possibly be negative under Options 4b and 4c.
33 Theoretically this margin should exclude normal profit. However, we assume that capital and fixed costs are not changed (scale of impacts is minimal) and therefore any change to gross margin comes off the bottom line.
.
National Environment Protection CouncilDistributional and Cost Benefit Analysis for the Packaging Impacts Decision RIS: Data assumptions
80.
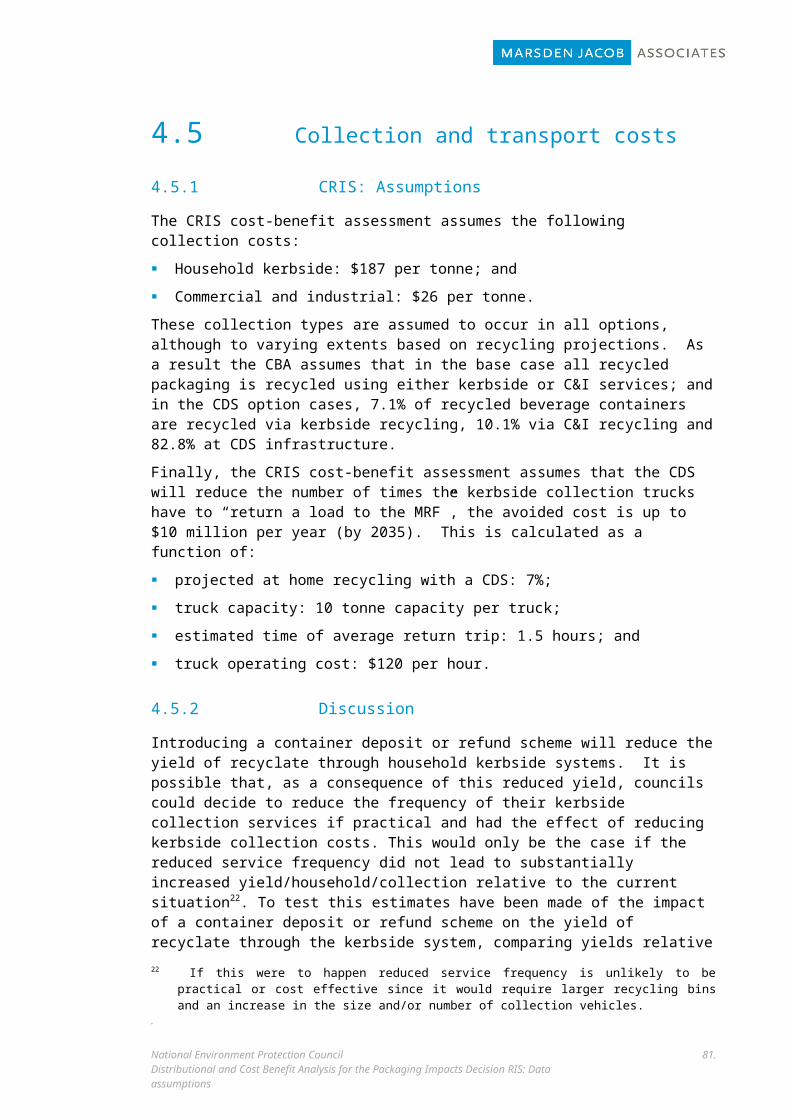
Estimating the proportion of customers in each segment
Assumed redemptions rates are shown in Table 41. The proportion of customers that redeem their own containers are shown in the ‘Purchaser redemption’ row, whereas the proportion in the residual segment is shown in ‘total not redeemed by purchaser’.
.
National Environment Protection CouncilDistributional and Cost Benefit Analysis for the Packaging Impacts Decision RIS: Data assumptions
81.
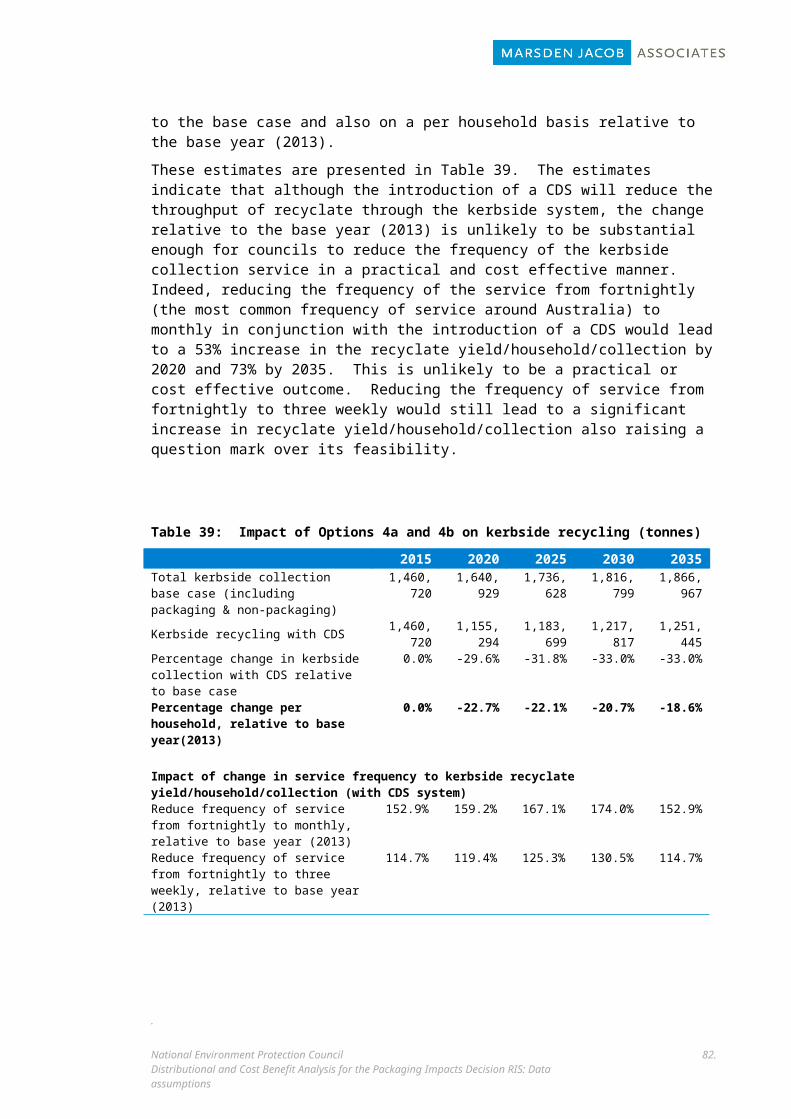
Table 51: Assumed redemption rates, Options 4a, 4b and 4c
2016 2017 2018 2019 2020 2021 2022 2023 2024 2025 2026 2027 2029 2030 2035
Purchaser redemption 46.9% 50.2% 53.6% 56.9% 60.3% 61.1% 61.9% 62.6% 63.4% 64.2% 64.6% 65.0% 65.4% 65.7% 66.1%
3rd party redemption 13.4% 14.3% 15.3% 16.2% 17.2% 17.4% 17.6% 17.9% 18.1% 18.3% 18.4% 18.5% 18.6% 18.8% 18.9%
Total redeemed 60.3% 64.6% 68.9% 73.2% 77.5% 78.5% 79.5% 80.5% 81.5% 82.5% 83.0% 83.5% 84.0% 84.5% 85.0%
Not redeemed 39.7% 35.4% 31.1% 26.8% 22.5% 21.5% 20.5% 19.5% 18.5% 17.5% 17.0% 16.5% 16.0% 15.5% 15.0%
Total not redeemed by purchaser 53.1% 49.8% 46.4% 43.1% 39.7% 38.9% 38.1% 37.4% 36.6% 35.8% 35.4% 35.0% 34.6% 34.3% 33.9%
Notes: The total redeemed estimates are based on beverage container recycling rates as set out in Table 12 for Options 4a and 4b. Although Option 4c has lower beverage recycling rates than Options 4a and 4b, redemptions rates are assumed to be the same but on a smaller range of containers (thus the dairy, wine and fruit juice industries are assumed not to be impacted by Option 4c). 3rd party redemption is assumed to include all redemptions via kerbside (7.1% of total recycling), redemptions via C&I (10.1% of total recycling) and approximately 5% redeemed by other 3rd parties (e.g. community organisations and people sifting through waste bins). The later estimate is drawn from South Australian experience (Harrison Research 2012).
.
National Environment Protection CouncilDistributional and Cost Benefit Analysis for the Packaging Impacts Decision RIS: Data assumptions
82.

Estimating impact on industry profits
The change in surplus to industry is estimated as the average price per container multiplied by the change in volume multiplied by the profit margin. The estimated impact on industry (reduced profits) over the period 2016 to 2035 (expressed as a Present Value using a discount rate of 7%) is shown below for Option 4a.
Table 52: Estimated impact on industry profits under Option 4a
Industry Impact (PV $m) % of surplus34
Soft drinks 59.2 0.98%Fruit Juice 9.0 0.59%Milk 8.4 0.84%Beer 20.3 0.22%Wine 4.0 0.04%Spirits 0.2 0.04%Bottled Water 9.3 0.86%
Total 110.4 0.40%
It should be noted that due to data limitations within these industry categories a somewhat ‘broad brush approach’ is required to determine the loss of producer surplus to specific industries. That is, average figures (e.g., average product price, average change in product price, gross margins) for each industry are applied to determine the average loss of producer surplus per industry. Therefore, our analysis assumes that all companies are affected equally (i.e., in proportion to their revenue). In reality, this is unlikely to be the case.
The annual profit impact for each industry is expected to decline over time. This is because as redemption rates increase, more consumers are obtaining refunds for redemptions of their own used containers (as opposed to those containers being redeemed by a third party or the container not being redeemed at all). As a segment, self-redeeming customers have the lowest impact on sales as it is assumed that they experience a lower effective price impact.
These impact estimates should be considered provisional as they are based on the provisional deposit, refund and redemption rates shown in Table 53 below.
Table 53: Deposit, refund and redemption rates under Option 4a
2016 2020 2025 2030 2035
Deposit (c/container) 10 10 15 15 20
Refund (c/container) 10 10 15 15 20
Redemption rate (%) 58.6% 77.5% 82.5% 85.0% 85.0%
In the final modelling, the deposit rate will be set so as to ensure that the container scheme operator remains financially viable. In this case, the deposit rate can vary from the refund rate in any given year and the ultimate price impact experienced by the consumer will be a function of the two (that is, beverage producers will increase prices based on the deposit rates, whereas consumers will only receive refunds based on the refund rate).34 Gross profit margin as a proxy for producer surplus expressed as Earnings Before Interest and Tax (EBIT) +
Depreciation + Rent (Source: IBIS World 2013).
National Environment Protection CouncilDistributional and Cost Benefit Analysis for the Packaging Impacts Decision RIS: Data assumptions
83.

Estimates of the impacts of Options 4b and 4c on industry profits will be provided in the CBA report. They are expected to be higher but of a similar order of magnitude to Option 4a.
4.9.3 Loss of producer surplus for other optionsEstimates for other policy options cannot be as precisely estimated as for Options 4a, 4b and 4c as the other options have a far more diverse set of product segments. However, the detailed methodology applied to estimate the impact to industry profits under Options 4a, 4b and 4c provide data points that can then be used to estimate the impact of other policy options.
Making the assumption that surplus impact is a function of cost impost to industry, a simple linear regression model can be applied to data points from Options 4a, 4b and 4c to estimate the parameters for the following function:
Surplusimpact=f (cost impost ¿industry )
Specifically, surplus impact is the output from the detailed methodology for Options 4a, 4b and 4c and cost impost is equal to (total scheme costs + deposit/refund costs).
Implicitly, an assumption is being made that profitability and demand response is similar for the industries and product lines affected by other options as it is for Options 4a, 4b and 4c. This is more likely to be the case for option 2d (which is also focused on beverage containers), similarly for options 2b and 2c (which also have a significant focus on beverage containers) and least of all for options 1, 2a and 2e (which are broader in packaging scope). For those options in particular, producer surplus estimates should therefore only be considered order of magnitude.
.
National Environment Protection CouncilDistributional and Cost Benefit Analysis for the Packaging Impacts Decision RIS: Data assumptions
84.

5. Benefit assumptions5.1 Value of recovered resources5.1.1 CRIS AssumptionsThe assumptions for the market value of recycled packaging materials in the CRIS are presented in Table 14 of Attachment A of the CRIS and further explained in Appendix F of Attachment C. These are represented in Table 54 and Table 55 below.
Table 54: CRIS market value of materials assumptions
Material Mark value ($ per tonne)
Premium for material from CDS
Basis for assumption
Paper/cardboard
$181 None PPI Asia for OCC and Mixed Grade (Visy) and Paper Fibre Network
Glass $30 $10035 per tonne
Owens Illinois and BDA/MMA (2007)
Aluminium cans $1,560 None LME and Metals Price Archive (Letsrecycle.com)
Streamed plastics36
$560 $100 premium for PET and HDPE
Streamed plastics (assuming 40% PET, 20% high density polyethylene (HDPE), 20% low density polyethylene (LDPE), 20% mixed) – Recycling industry sources
Plastics – mostly sorted
$530 $100 premium for PET and HDPE
Assuming majority of capital city MRFs undertake some degree of sorting
Plastics – fully mixed
$372 $100 premium for PET and HDPE
Fully mixed plastics (assuming 30% HDPE, 30% PET, 40% mixed) – Recycling industry sources
Steel cans $280 None Recycling industry sourcesLiquid paperboard
$150 None Recycling industry sources
Source: Table 14, Attachment A and Appendix F, Attachment C, CRIS.
35 It was not clear from the discussion in the DRIS whether this is to be interpreted as $100 per tonne for glass from a CDS or $100 premium (i.e. $130 per tonne for glass from a CDS)
36 The market value of plastics varies by polymer type and these values are provided in the next table.
National Environment Protection CouncilDistributional and Cost Benefit Analysis for the Packaging Impacts Decision RIS: Data assumptions
85.

Table 55: CRIS plastic market value by polymer type assumptions (based on recycling industry sources)
Material Mark value ($ per tonne) Premium for material from CDS
PET $750 - $780 $100
PET Coloured $535 - $545 $100
HDPE $660 - $670 $100
HDPE Coloured $640 - $650 $100
LDPE 90% clean film, 10% stickers of labels $500 - $510 None
LDPE 95% clean film, 5% stickers of labels $550 - $570 None
LDPE Colour $290 - $310 None
Mixed Plastics 442 $370 - $400 None
Mixed Plastics 226 $340 - $380 None
Source: Table F.3, Appendix F, Attachment C, CRIS.
5.1.2 DiscussionPaper/cardboard
Feedback was provided to the project team that cardboard prices are expected to be lower than white-paper prices. However, the CRIS assumption price for paper/cardboard already accounts for this by combining two sources (one for cardboard and the other for waste paper). No new information was provided to the project team and no objections specifically relating to the aggregate market value assumptions for paper/cardboard (or for paper and cardboard separately) were raised through stakeholder submissions. The physical modelling of paper/cardboard is also as a single stream (as opposed to two individual streams). This assumption has therefore been retained.
Glass
Stakeholders requested clarification in what the market value of glass in the CRIS was referring to. Specifically, there is a market for glass in a form prepared for glass re-processing (‘pre-processed’) and a market for glass that has not yet been pre-processed. These two markets are effectively operating at two different points in the supply chain. As pre-processing involves a cost, the market value for pre-processed glass would be higher than the market for glass not yet pre-processed.
The description of glass market value in the CRIS implied that the value was based on information relating to the market for pre-processed glass. This would be an incorrect value to ascribe to glass sorted by an MRF or CDS facility and pre-processing costs would need to be incorporated (subtracted).
.
National Environment Protection CouncilDistributional and Cost Benefit Analysis for the Packaging Impacts Decision RIS: Data assumptions
86.
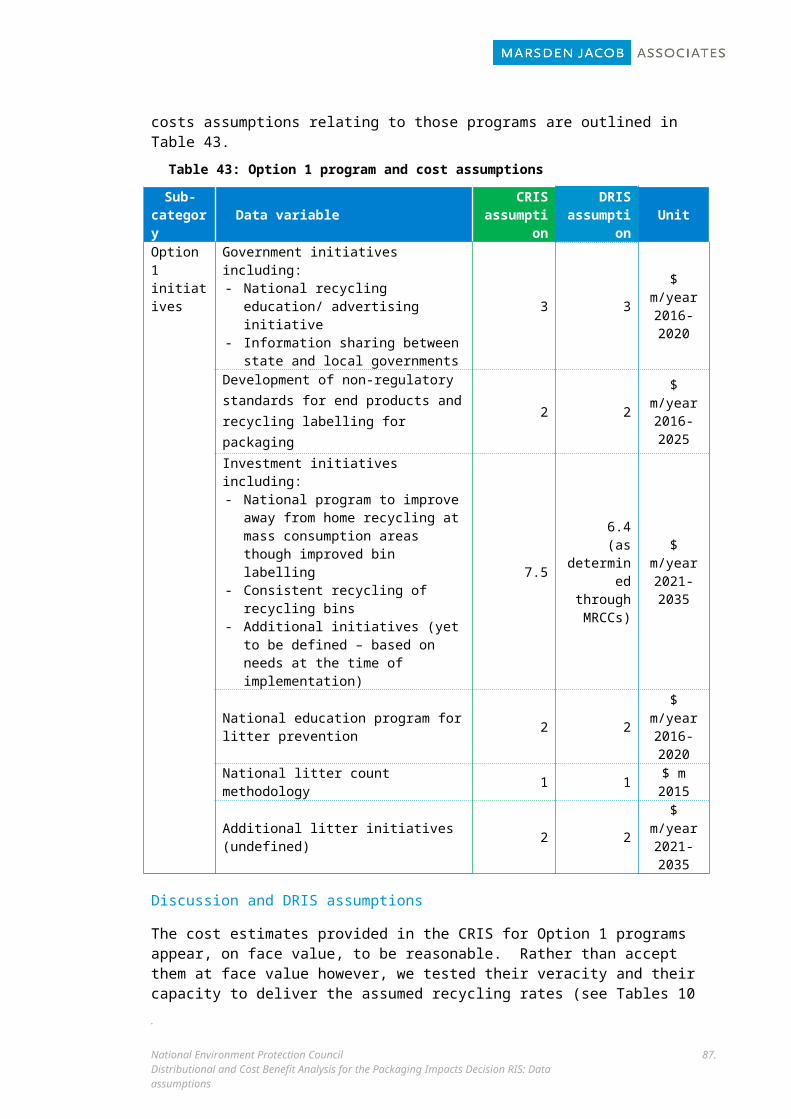
It was also clear from stakeholder discussion that a wide range of values are being observed. This variation stems from the highly concentrated industry structure.
It is recommended that market values are revised based on:
1. Pre-processed material (i.e. pre-processing costs are incorporated);
2. Current values observed by suppliers of the material; and
3. High volume transactions, rather than transactions relating to a small proportion of the market (which can reflect the extremes of the market).
In particular, values have been provided to the project team relating to transactions that represent a small proportion of the market and that would have some degree of pre-processing already undertaken, either manually or through a pre-processing plant. These were not adopted for the DRIS. Rather, values based on recycling industry sources, specifically relating to material not yet pre-processed, representing a large proportion of the market and verified against prices received by suppliers of that material have been adopted. These are:
nil value ($0 per tonne) for glass from non-CDS sources; and
$40 per tonne for glass from CDS sources.
Aluminium cans
The CRIS assumption of $1,560 per tonne is broadly consistent with information provided to the project team relating to current values. However, information from the recycling industry was provided to suggest that this would apply to higher quality material (e.g., from a CDS facility) rather than derived from the kerbside (which would trade at approximately a 10% lower market value owing to the lower quality). This implies a value for non-CDS aluminium of $1,418 per tonne.
Plastics
The CRIS provided significant detail relating to values for individual polymer types but the CRIS was less transparent on how these were combined to derive average values.
Information was provided to the project team that suggested a higher average value for plastics from CDS sources compared with conventional sources. This higher value is based on two factors:
the polymer mix from CDS sources has greater proportions of higher value polymers; and
the material from a CDS is higher quality.
The first factor requires careful consideration in the CBA and distributional analysis.
A portion of this material (under a container deposit policy) is expected, in the counterfactual (base case), to have been littered or sent to landfill. In this case, there is incremental economic value being created.
However, a portion of this material is expected to have been diverted from the kerbside. In this case, the value is being transferred from beneficiaries in the base case (e.g. local councils) to the CDS operators.
Polymer mix assumptions provided by industry sources and cross-checked against proportions experienced in their Northern Territory facility (75% PET, 5% coloured PET and 20% HDPE) and polymer value assumptions from the CRIS result in an average value of plastic of .
National Environment Protection CouncilDistributional and Cost Benefit Analysis for the Packaging Impacts Decision RIS: Data assumptions
87.

approximately $676 per tonne. Note that this still does not incorporate the alleged quality premium for plastics originated from CDS facilities.
It is therefore recommended that $676 per tonne is ascribed to the market value of plastic beverage containers. Using this figure and the average ‘streamed plastics’ figure of $530 per tonne, an average value for non-beverage plastic recyclate of $349 may be back-calculated (applying the assumption that approximately 47% of plastics packaging recycling is beverage containers as per the material flows analysis).
As per the CRIS, which proposes a $100 per tonne premium for PET and HDPE owing to quality, an average value of $776 per tonne for CDS sourced plastic is adopted.
Steel
No new information was provided to the project team and no objections specifically relating to the market value assumptions for steel were raised through stakeholder submissions. This assumption has therefore been retained.
Liquid paper board
No new information was provided to the project team and no objections specifically relating to the market value assumptions for paper/cardboard were raised through stakeholder submissions. This assumption has therefore been retained.
Macroeconomic benefits resulting from increasing material quality
Stakeholder submissions were received relating to potential effects of increasing the quantity of high quality recyclate supplied to the recycling industry in Australia. Specifically, a proportion of the current supply of lower grade aluminium, glass and plastics is either landfilled or exported. Increasing the quantity of high quality material would allow more recyclate to be processed within Australia and, on face value, this would lead to economic benefits of investment, employment and value added.
In response, we note that answering the question of whether introducing a beverage container deposit or refund scheme would increase the level of reprocessing within Australia would depend on establishing whether a regulatory or market failure exists within the reprocessing industry in Australia. Further, even if a market or regulatory failure could be established, assessing the economic benefits that would result from correction of that failure is a macroeconomic question that would require input-input output or general equilibrium modelling.
5.1.3 DRIS AssumptionsBased on the discussion outlined above, the following market value assumptions are recommended for the DRIS.
.
National Environment Protection CouncilDistributional and Cost Benefit Analysis for the Packaging Impacts Decision RIS: Data assumptions
88.

Table 56: Proposed DRIS market value assumptions
CRIS DRISMaterial Market value
($ per tonne)Premium for material from CDS
Market value ($ per tonne)
Premium for material from CDS
Paper/cardboard $181 None $181 None
Glass $30 $10037 per tonne $0 + $40 per tonneAluminium cans $1,560 None $1,418 + $142 per tonnePlastics (Beverage) $560 $100 premium
for PET and HDPE$676 + $100 per tonne
Plastics (Non-beverage) $560 $100 premium for PET and HDPE
$401 Not applicable
Steel cans $280 None $280 NoneLiquid paperboard $150 None $150 + $70 per tonne
5.2 Avoided landfill costs5.2.1 Avoided landfill operating costsCRIS assumption
The CRIS cites BDA (2009) as the source for assumptions on landfill operating costs.38 Operating cost of landfill by size and controls, as presented in the BDA report, are shown below.
Table 57: CRIS Operating cost of landfill ($/tonne)
Best practice controls Poor controls
Small $100 $74Medium $60 $44Large $40 $30
Source: Table 70, Attachment C, CRIS.
The CRIS adopted the simplifying assumption that, since ‘large landfills constituted more than 70% by weight in the National Landfill Survey conducted by the Waste Management Association of Australia, private costs of landfill are expected to range from $30 - $40 per tonne’.
37 It was not clear from the discussion in the CRIS whether this is to be interpreted as $100 per tonne for glass from a CDS or $100 premium (i.e. $130 per tonne for glass from a CDS)
38 The BDA report has also been identified as the recommended source for landfill cost assumptions for the DRIS.
.
National Environment Protection CouncilDistributional and Cost Benefit Analysis for the Packaging Impacts Decision RIS: Data assumptions
89.

Discussion and DRIS assumption
This simplification results in a potentially inaccurate estimate of the average cost of landfill across Australia, particularly in non-metro regions where landfills are typically smaller. For the purposes of the CBA and the distributional analysis, the project team has drawn on additional data available in BDA (2009) and WCS (2010).
Average cost of landfill by state/territory and by metro/non-metro has been determined through information on the size distribution of Australian landfills (WCS, 2010), level of controls in Australian landfills (WCS, 2010) and an assumption that the metro region typically has large landfills while non-metro regions contain a mix of medium and small landfills.
The relevant information drawn from these reports is shown below.
Table 58: Waste disposal to landfill by size-class and jurisdiction
Disposals by licensed landfill size-class (million tonnes per year)
Small Medium Large Total
No. Disposals
(tonnes)
No. Disposals
(tonnes)
No. Tonnes No. Disposals(tonnes)
NSW 30 0.14 40 1.4 15 4.91 85 6.45
Vic 8 0.03 30 1.37 19 3.59 58 4.99
WA 87 0.17 23 0.76 11 2.7 122 3.63
Tas 3 0.01 7 0.29 1 0.12 11 0.42
SA 58 0.11 8 0.25 5 0.92 71 1.28
Qld 63 0.14 22 0.9 12 2.97 100 4.01
ACT Nil Nil Nil Nil 1 0.19 1 0.19
NT 13 0 3 0.3 Nil 0 4 0.3
Australia 262 0.32 133 5.27 64 15.21 459 21.27
% 57% 3% 29% 25% 14% 72%
Source: Table 4-6, WCS (2010).
.
National Environment Protection CouncilDistributional and Cost Benefit Analysis for the Packaging Impacts Decision RIS: Data assumptions
90.

Table 59: Landfills - level of compliance with design and construction requirements
Liner Leachate collection
Water management
Air emissions Landfill gas
NSW Large - moderate to highMedium - low to moderateSmall - low
Large - highMedium - moderate to highSmall - moderate
Large - high Medium - highSmall - moderate to high
Large - highMedium - highSmall - moderate to high
Large - lowMedium - lowSmall - nil
VIC Large - moderate to highMedium - moderate to lowSmall - low
Large - highMedium - moderate to highSmall - moderate
Large - moderate to highMedium - moderateSmall - moderate
Large - highMedium - moderate to highSmall - low to moderate
Large - lowMedium - lowSmall - nil
QLD Large - moderate to highMedium - low to moderateSmall - low
Large - highMedium - moderate to highSmall - low
Large - highMedium - moderate to highSmall - low
Large - highMedium - highSmall - low to moderate
Large - lowMedium - lowSmall - nil
WA Large - lowMedium - lowSmall - low
Large - low to moderateMedium - lowSmall - low
Large - moderateMedium -moderateSmall - low
Large - moderateMedium - moderateSmall - low
Large - lowMedium -lowSmall - low
SA Large - moderate to highMedium - lowSmall - low
Large - highMedium - moderateSmall - low
Large - highMedium - moderate to lowSmall - low
Large - moderate to highMedium - moderateSmall - low to moderate
Large - moderateMedium - lowSmall - low
TAS Medium - moderateSmall - moderate to high
Medium - highSmall - high
Medium - moderateSmall - moderate to high
Medium - highSmall - moderate to high
Medium - lowSmall - low
Source: Table 6-3, WCS (2010)
Resulting estimates of landfill operating costs by state/territory and by metro/non-metro (inflated to 2011 dollars) are provided below.
.
National Environment Protection CouncilDistributional and Cost Benefit Analysis for the Packaging Impacts Decision RIS: Data assumptions
91.

Table 60: Recommended operating cost of landfill39,40 ($/tonne)
Metro Non-metro
NSW 42 57
VIC 42 55
WA 32 52
TAS 37 56
SA 42 56
QLD 42 58
ACT 37 -
NT 55 55
5.2.2 Avoided landfill externality costsGreenhouse gas emissions reductions
The CRIS provides a range of -$5.3 to $13.5 per tonne for greenhouse gas emissions (GHGs) from landfill, with a negative value for the lower bound of the range reflecting the capture of landfill gas, which can be used for fuel. However, the CRIS report was not transparent on the derivation of this range estimate.
The average externality costs of greenhouse gas emissions reductions for a given region depend on five factors:
the extent of landfill gas capture of landfills;
average efficiency rate of landfill gas (LFG) capture;
the extent to which landfills are covered by an emissions trading scheme (ETS) which ‘internalises’ the cost of emissions;41
the ‘emissions factor’42 (EF) of the material being deposited in landfill; and
the monetary value of environmental damage caused by GHGs.
Given these factors, the DRIS model will derive a specific externality cost for GHGs based on the region in which a given tonne of material is being deposited and the material type.43 Assumptions for the above factors (apart for the monetary value of environmental damage caused by GHGs) have been obtained by the project team through discussions with the Australian Landfill Owners Association (ALOA) and DCCEE (2012).
39 Operating costs do not include transport to landfill, which is included under collection and transport costs.40 Operating costs also do not include landfill levies, which are a transfer from one stakeholder group (waste
producers/ managers) to another stakeholder group (state governments) and, as such, do not constitute an economic cost.
41 Emissions reductions from a landfill covered by an ETS does not result in a reduction to Australia’s balance of emissions as emissions increase equally in other covered landfills or in another sectors covered by the ETS.
42 The emissions factor refers to the amount of carbon dioxide equivalent (tCO2e) that are released by a tonne of that material deposited to landfill
43 All materials except for paper/cardboard have an EF of zero (DCCEE, 2012) therefore do not result in any GHG externality cost.
.
National Environment Protection CouncilDistributional and Cost Benefit Analysis for the Packaging Impacts Decision RIS: Data assumptions
92.

Combined, the extent of LFG coverage, the average efficiency rate of LFG capture and the extent to which landfills are covered by an ETS provide the proportion of GHGs to which emissions factors and environmental values should apply. These will be estimated in the DRIS as shown below.
Table 61: Proportion of GHGs to which emissions factors and environmental values should apply, assuming an Emissions Trading Scheme (ETS) is in place
Metro Non-metro
NSW 0% 96%
VIC 0% 96%
WA 0% 96%
TAS 0% 96%
SA 0% 96%
QLD 0% 96%
ACT 0% n/a
NT 40%44 96%
Alternatively, if an ETS is not in place (for example, if the existing ETS is withdrawn by a new government) then the following proportions would apply.
Table 62: Proportion of GHGs to which emissions factors and environmental values should apply, assuming no Emissions Trading Scheme (ETS)
Metro Non-metro
NSW 40% 96%
VIC 40% 96%
WA 40% 96%
TAS 40% 96%
SA 40% 96%
QLD 40% 96%
ACT 40% n/a
NT 40% 96%
Finally, the EF applicable to paper/cardboard based on DCCEE (2012) is 2.5. Other material types (i.e., plastics, metals and glass) are considered to release no or negligible amounts of CO2e
and therefore have an EF of zero.
Valuing the environmental benefit of reductions in GHGs is a highly contested issue and there are several possible approaches. On one end of the spectrum, it is argued that Australia’s GHG emissions represent a miniscule contribution to global emissions and the latter are more important when considering global warming and associated welfare losses. At the other end of
44 NT is the only jurisdiction with a metro proportion of 40%. This is because all landfills in NT are estimated to be of a size where the amount of GHG emissions falls below the facility threshold for liability under the ETS (25,000 tonnes of CO2 equivalent per annum). Therefore any GHG reduced from NT landfills is expected to lead to reductions in Australia’s GHG balance. If 60% is captured on average, avoidance of 1 tCO2-e from NT landfills is expected to lead to 0.4 tCO2-e reductions in Australia’s GHG balance.
.
National Environment Protection CouncilDistributional and Cost Benefit Analysis for the Packaging Impacts Decision RIS: Data assumptions
93.

the spectrum, preliminary estimates of the marginal social cost of carbon in Stern (2006) were US $85/tCO2e. However, the review’s methodology drew some criticism, notably the use of a very low discount rate. The forecast cost of abatement and the traded market price of carbon permits in Australia may also serve as proxies for the value of changes to GHG emissions. The former is expected to increase in line with increasingly stringent pollution caps, ranging from approximately $30/tCO2e to approximately $150 tCO2e (Australian Treasury, 2011). The latter will be heavily influenced by the expected price of carbon in European Union Emissions Trading Scheme (EU ETS), which is uncertain, although current EU ETS permits are trading at approximately $10/ tCO2e or less.
The estimate recommended for the DRIS, consistent with Australian Treasury (2011) is a value of $30/tCO2e.
Other air emissions
The CRIS provided a range estimate of air emissions of $0.2 - $1.0 per tonne. The project team agrees with this range and combining this estimate with the level of air emissions controls in Australian landfills derived from WCS (2010) and inflating to 2011 dollars results in the following estimates of externality cost of air emissions by state/territory and metro/non-metro.
Table 63: Externality costs of air emissions ($/tonne)
Metro Non-metro
NSW 0.21 0.25
VIC 0.21 0.64
WA 0.63 0.71
TAS 0.21 0.22
SA 0.63 0.63
QLD 0.21 0.27
ACT 0.63 0.00
NT 0.63 0.63
Note: Note that the metro externality costs are lower because the greater proportion of large landfills in metro areas generate lower air emissions per tonne of waste.
Leachate
The project team agrees with the CRIS assumption that leachate costs are negligible. In part this stems from the generally low level of hazardous materials susceptible to causing leachate in packaging materials. In any case, leachate control is now generally well established in Australian landfills, especially in metropolitan areas. Therefore, the DRIS model assumes no externality cost for leachate.
Disamenity
The CRIS provided a range estimate of air emissions of $1 - $10. The project team agrees with this range and combining this estimate with the level of litter and odour management practices in Australian landfills derived from WCS (2010) and inflating to 2011 dollars results in the following estimates of externality cost of disamenity by state/territory and metro/non-metro.
.
National Environment Protection CouncilDistributional and Cost Benefit Analysis for the Packaging Impacts Decision RIS: Data assumptions
94.

Table 64: Externality costs of disamenity ($/tonne)
Metro Non-metro
NSW 1.05 1.48
VIC 1.05 1.15
WA 1.05 6.64
TAS 5.78 5.62
SA 1.05 2.50
QLD 1.05 2.32
ACT 1.05 na
NT 5.78 5.78
5.3 Avoided costs of litter5.3.1 CRIS assumptionsCosts associated with littering range from clean up costs through to amenity, health and ecological impacts. The CRIS estimates the benefits of litter clean up by focussing on avoided costs of litter clean up. It does this by estimating total annual litter clean up costs by local councils and then estimating reduced litter clean up costs in proportion to the percentage reduction in litter tonnes relative to 2011 and packaging litter as a proportion of all litter.
5.3.2 DiscussionThe approach taken in the CRIS to estimating avoided costs of litter is questioned on two counts:
first, the approach overlooks a number of litter clean up activities, both local council and litter clean up undertaken by the broader community; and
second by focussing simply on marginal clean-up costs other impacts of litter are overlooked.
We propose therefore to use the costs of a broader range of litter clean up activities to provide a shadow price for the economic cost of packaging litter. A similar approach is used by BDA in a report to Zero Waste South Australia (BDA 2007). This is likely to be a conservative shadow price for the economic costs of litter because:
the fact that the waste is being cleaned up implies that the cost is less than the community’s willingness to pay for its clean up; and
the litter not cleaned up (principally in the marine environment) will have environmental and amenity impacts.
The clean up activities used to derive a shadow price of the economic cost of packaging litter are litter traps, clean up of roadside litter by local councils and community based litter clean up through Clean Up Australia45. The shadow price is derived from the estimated average cost of
45 Two litter clean up activities not included in these estimates are litter clean up undertaken in commercial shopping malls and litter clean up in reserves not under the control of local councils (e.g. national parks). On the basis of the limited data available neither of these activities is likely to substantially change the estimate of
.
National Environment Protection CouncilDistributional and Cost Benefit Analysis for the Packaging Impacts Decision RIS: Data assumptions
95.

these activities46. These are set out in Table 65. Cost estimates for local council activities are based on Victorian council estimates provided in Victorian Local Government Annual Survey (Sustainability Victoria 2011). Costs estimates for the Clean Up Australia activities are derived from estimates of the numbers volunteers involved in Clean Up Australia, their average duration of involvement (Clean Up Australia 2010) and an assumed labour value of $7.67/ hour.
Table 65: Estimated average cost of litter clean up ($/tonne)
Activity Tonnes collected Cost $/tonne 2008-09 2009-10 2008-09 2009-10 2008-09 2009-10
Litter traps 11,175 10,877 7,650,621 10,134,155 685 932
Roadside litter 41,228 40,378 7,516,463
9,268,563 182
230
Clean Up Australia 15,560 16,150 16,346,400
15,299,174
1,086 980
Weighted average all activities
67,963
67,405
31,513,484
34,701,892
462.16
504.20
Sources: Clean Up Australia 2010, Sustainability Victoria 2011
These costs averaged over two years, and adjusted to 2011 prices gives a shadow price of the economic cost of litter of $501/ tonne.
5.3.3 DRIS assumptionTable 66 provides an overview of litter cost assumptions in the CRIS and proposed for the DRIS. Unlike the approach adopted in the CRIS, the shadow price proposed for the DRIS would apply to all public place packaging litter reductions achieved by each option relative to the base case.
Table 66: CRIS and DRIS litter cost assumptions
Data variable Application CRIS assumption
DRIS assumption Unit
Cost of litter clean up All options 305 na $ m/ year
Proportional reduction in litter clean up costs All options 37% na %
Shadow price, economic cost of litter All options na 501 $/ tonne
total litter clean up or the shadow price derived from that clean up. We emphasise again however, that the shadow price used in this analysis is, if anything, likely to be a conservative estimate of community’s willingness to pay to avoid litter.
46 Note, clean up costs associated with litter clean up in Crown land reserves, national parks and state forests are not included in these estimates due to unavailability of relevant data. It is not anticipated that cost of clean up in those areas would substantially affect the weighted average value estimated in Table 65.
.
National Environment Protection CouncilDistributional and Cost Benefit Analysis for the Packaging Impacts Decision RIS: Data assumptions
96.

6. Distributional analysis assumptions
The modelling undertaken for this analysis will facilitate the calculation of overall economic impacts (CBA) or financial impacts for a particular stakeholder group (distributional analysis) by tracking incidence of all cost and benefit items against relevant stakeholder groups at each stage in the chain of physical flows associated with each option. In this way, costs and benefits can be ‘filtered’ by stakeholder group.
In the CBA some of the cost and benefit items offset each other (i.e. one stakeholder group incurs a cost, which is offset by a corresponding benefit to another stakeholder group) and transfers are completely removed. In the distributional analysis however, the scope is restricted to particular stakeholder groups. All financial costs and benefits that affect each stakeholder group (irrespective of whether they are simply transfers to another group) are still included therefore.
Additionally, some cost and benefit items will be ‘uplifted’ in the distributional analysis. The most notable example of this is the cost of operating CDS infrastructure (Option 4a). This is because a CDS operator will have to pay corporate or personal income tax, which is relevant for the financial analysis but not the economic analysis.
Finally, some financial flows are fixed in nominal terms by regulation associated with an option (i.e., the refund value for beverage containers in options 4), which requires that inflation of other financial flows be introduced in order to generate an accurate picture of financial adequacy assessment.
Financial impacts that will accrue to particular stakeholder groups in the distributional analysis are assumed to include:
completely unredeemed deposits (transfers from consumer to scheme operator) [relates to option 4a];
completely unredeemed refunds (transfers from consumer to liable entity) (assuming liable entity had increased the price in the expectation that consumers would redeem some refund in the future) [relates to options 4b, 4c];
third party deposit redemption (transfer from non-redeeming consumer to redeeming consumer or kerbside operator) [relates to option 4a];
third party refund redemption (transfer from non-redeeming consumer to redeeming consumer or kerbside operator) [relates to options 4b, 4c];
tax under option 3 (transfers from consumers to government); and
programs funded under Option 3 (transfer from government to private sector).
.
National Environment Protection CouncilDistributional and Cost Benefit Analysis for the Packaging Impacts Decision RIS: Data assumptions
97.

ReferencesAlbrecht, P., Brodersen, J., Horst, D.W. and Scherf, M. 2011. Reuse and Recycling Systems for
Selected Beverage Packaging from a Sustainability Perspective: An analysis of the ecological, economic and social impacts of reuse and recycling systems and approaches to solutions for further development, PriceWaterhouseCoopers International, Germany.
Allen, P. and Cain, R., 2008. National Packaging Covenant mid-term review: NPC Contextual Review, Hyder Consulting, Melbourne.
Australian Bureau of Statistics (ABS), 2012. ‘Shipments of Wine and Brandy in Australia by Australian Winemakers and Importers’, ABS Catalogue No. 8504.0.
Australian Bureau of Statistics (ABS), 2013. ‘Employee Earnings and Hours Australia’, ABS Catalogue No. 6306.0.
ACIL Tasman, 2012. ‘Broader Impacts of a National CDS’, prepared for Product Stewardship Forum, Australian Food and Grocery Council, March.
Andreyeva, Tatiana, Long, Michael W., Brownell, Kelly D., 2010. ‘The Impact of Food Prices on Consumption: A Systematic Review of Research on the Price Elasticity of Demand for Food’, American Journal of Public Health, Vol. 100, No. 2, February
Australian Packaging Covenant (APC), 2011. The National Packaging Covenant 2010 Annual Report, Australian Packaging Covenant Council.
BDA and MMA, 2007. South Australia’s Waste Strategy 2005-2010 Benefit Cost Assessment Volume 2: Technical Report, Zero Waste South Australia.
BDA and WCS 2009. Beverage container investigation, final report. Prepared for the EPHC Beverage Container Working Group.
Bockstael, N. E., Strand, I. E. and Hanemann, W. M. 1992. ‘Time and the Recreational Demand Model’., pp. 171-183 in: Markandya, A. and Richardson, J. (eds). Environmental economics: A Reader, St. Martin's Press, New York.
Curnow, R. and Spehr, K., 2005. Littering Behaviour Studies VII: National Benchmark 2004, Beverage Industry Environment Council.
Clean Up Australia, 2010. Rubbish Report 2010.
Dairy Australia, 2013. ‘Production and Sales Statistics’. Sourced at: http://www.dairyaustralia.com.au/Statistics-and-markets/Production-and-sales/Latest-statistics.aspx, May 2013.
Department of Climate Change and Energy Efficiency (DCCEE), July 2012. Australian National Greenhouse Accounts - National Greenhouse Account Factors, Commonwealth of Australia, Canberra.
Department of Environment and Conservation (DEC), NSW, 2004. Getting more from our recycling systems: Good practice performance measures for kerbside recycling systems, DEC NSW, Sydney.
Department of Environment and Conservation (DEC), NSW, 2005. Educating the Community about Litter: Changing Knowledge, Attitudes and Behaviour 2000 to 2003, DEC Social Research Series, DEC, Parramatta.
.
National Environment Protection CouncilDistributional and Cost Benefit Analysis for the Packaging Impacts Decision RIS: Data assumptions
98.

DeYoung, R. 2000. ‘Expanding and Evaluating Motives for Environmentally Responsible Behavior’. Journal of Social Issues, 56 (3), pp. 509-526.
Environment Protection Authority, South Australia, 2012. Environment Protection Authority Annual Report 1 July 2011 to 30 June 2012, Environment Protection Authority, Adelaide.
Environment Protection and Heritage Council (EPHC) 20008. Litter Management in Australia, EPHC, Canberra.
Environment Protection and Heritage Council (EPHC) 2010. National Waste Report 2010, EPHC, Canberra.
Feather, P. and Shaw, W.D. 1998. ‘Estimating the Cost of Leisure Time for Recreation Demand Models’, Economic Research Service and Department of Applied Economics and Statistics, University of Nevada.
Fogarty, J, 2008, ‘The Demand for Beer, Wine and Spirits: Insights from a Meta Analysis Approach’, American Association of Wine Economists, Working Paper no. 31, November.
Gamba, R. and Oskamp, S. 1994. ‘Factors Influencing Community Residents’ Participation in Commingled Curbside Recycling Program’. Environment and Behavior, 26 (5), pp.587-612.
Garnaut, R., 2008. The Garnaut Climate Change Review, Commonwealth of Australia, Canberra.
Gardner, G. T. & Stern, P.C. 2002. Environmental problems and human behaviour, second edition, Pearson Custom Publishing, Boston.
Hardesty, B.D. and Wilcox, C. 2011. Understanding the types, sources and at‐sea distribution of marine debris in Australian waters. Final Report to the Department of Sustainability, Environment Water, Population and Communities, CSIRO Ecosystem Sciences.
Harrison Research, 2012. CDL Awareness & Support Research Report, EPA South Australia and Zero Waste SA, Adelaide.
Hornik, J., Cherian, J., Madansky, M., & Narayana, C. 1995. ‘Determinants of recycling behavior: A synthesis of research results’. The Journal of Socio-Economics, 24 (1), pp. 105-127.
IBISWorld, 2013, Industry Reports, Sourced at: http://www.ibisworld.com.au/, April-June, 2013.
Industry Edge and Equilibrium, 2013. Compilation of Contestable Data for 2011-12 on the Consumption and Recycling of Glass, Aluminium, LPB, HPDE and PET Beverage Containers and In Addition Aluminium Aerosol Containers, Report for the Packaging Stewardship Forum of the Australian Food and Grocery Council.
Institute for Sustainable Futures and University of Technology Sydney 2001, Independent Review of CDL for NSW, prepared for the Minister for Environment, NSW.
Lake, M. and Ferreira, L. 2002. Modelling tolls: values of time and elasticities of demand: a summary of evidence. Physical Infrastructure Centre Research Report 02-01, School of Civil Engineering, Queensland University of Technology, Brisbane.
Larson, D.M. and Shaikh, S.L. 2004. ‘Recreation Demand Choices and Revealed Values of Leisure Time’, Economic Inquiry 42 (2), 264-278.
.
National Environment Protection CouncilDistributional and Cost Benefit Analysis for the Packaging Impacts Decision RIS: Data assumptions
99.

Macgregor Tan research, 2011. National Litter Index Annual Report 2010-11. Prepared for Keep Australia Beautiful National Association.
Macgregor Tan research, 2012. National Litter Index Annual Report 2011-12. Prepared for Keep Australia Beautiful National Association.
Nghiem, Nhung, Wilson, Nick, Blakely, Tony, 2011. ‘Price Elasticities for Health Economic Modelling of Food Pricing Interventions in Australia and New Zealand’, Public Health Monograph Series No. 21, November.
Nolan ITU, SKM Economics, Envirosris, 2001. Independent Assessment of Kerbside Recycling in Australia Revised Final Report, National Packaging Covenant Council.
Nolan ITU 2003. Victorian CDL Financial Impact Analysis, EPA Victoria.
Nyborg, K. 2003. ‘The Impact of Public Policy on Social and Moral Norms: Some Examples’ Journal of Consumer Policy, 26(3), 259-277.
OECD, 2008. Household Behaviour and the Environment: Reviewing the Evidence, OECD, Paris.
OECD, 2011. Greening Household Behaviour: The Role of Public Policy, OECD, Paris.
Osbaldiston, R. and Schott, J.P. 2012. ‘Environmental Sustainability and Behavioral Science: Meta-Analysis of Proenvironmental Behavior Experiments’, Environment and Behavior 2012 (44). pp. 257-299.
Parker, G., 2012. ‘Reading the Market Signals, Consumption Trends in the Juice Sector’, Fruit Juice Australia.
PWC and Wright Corporate Strategy (WCS), 2011. Attachment A: Problem statement forPackaging, Standing Council on Environment and Water.
PWC and Wright Corporate Strategy (WCS), 2011. Attachment B: Packaging options report, Standing Council on Environment and Water.
PWC and Wright Corporate Strategy (WCS), 2011. Attachment C: Packaging cost benefit analysis report, Standing Council on Environment and Water.
Resource NSW, 2002. Waste Reduction in Office Buildings – A Guide for Buildings Managers, NSW Government, Parramatta.
Sustainability Victoria, 2011. Victorian Local Government Annual Survey 2009-10, Victorian Government, Melbourne.
Sustainability Victoria 2011b. Victorian Litter Report, 2010, Victorian Government, Melbourne.
Taffs, K.H. & Cullen, M.C. 2005, 'The distribution and abundance of marine debris on isolated beaches of northern New South Wales, Australia', Australasian Journal of Environmental Management, vol. 12, no. 4, pp. 244-250.
Triandis, H. 1977. Interpersonal Behaviour, Brooks/Cole, Monterey California.
UNEP 2005. Marine Litter, an analytical overview, UNEP, Nairobi.
Victorian Jurisdictional Recycling Group, 2002. Best Practice Kerbside Recycling Program Review, National Packaging Covenant, Ecorecycle.
.
National Environment Protection CouncilDistributional and Cost Benefit Analysis for the Packaging Impacts Decision RIS: Data assumptions
100.

WCS (Wright Corporate Strategy) 2010. Review of the Application of Landfill Standards, Report prepared for SEWPaC (then DEWHA), March.
.
National Environment Protection CouncilDistributional and Cost Benefit Analysis for the Packaging Impacts Decision RIS: Data assumptions
101.