ATMS 373C.C. Hennon, UNC Asheville Tropical Cyclone Forecasting Where is it going and how strong...
31
Tropical Cyclone Forecasting Where is it going and how strong will it be when it gets there
-
Upload
annice-carson -
Category
Documents
-
view
216 -
download
3
Transcript of ATMS 373C.C. Hennon, UNC Asheville Tropical Cyclone Forecasting Where is it going and how strong...

Tropical Cyclone Forecasting
Where is it going and how strong will it be when it gets there

Background
• TC forecasting is challenging– Very little known about smaller-scale TC physics– Little if any in situ data since TCs are over water most
of the time– Bad forecast = lives lost
• Forecast centers– National Hurricane Center (NHC – Atlantic, EPAC)– Central Pacific Hurricane Center (Hawaii – Central
Pacific)– Joint Typhoon Warning Center (Guam – WPAC)– India, Australia, China also maintain forecast centers
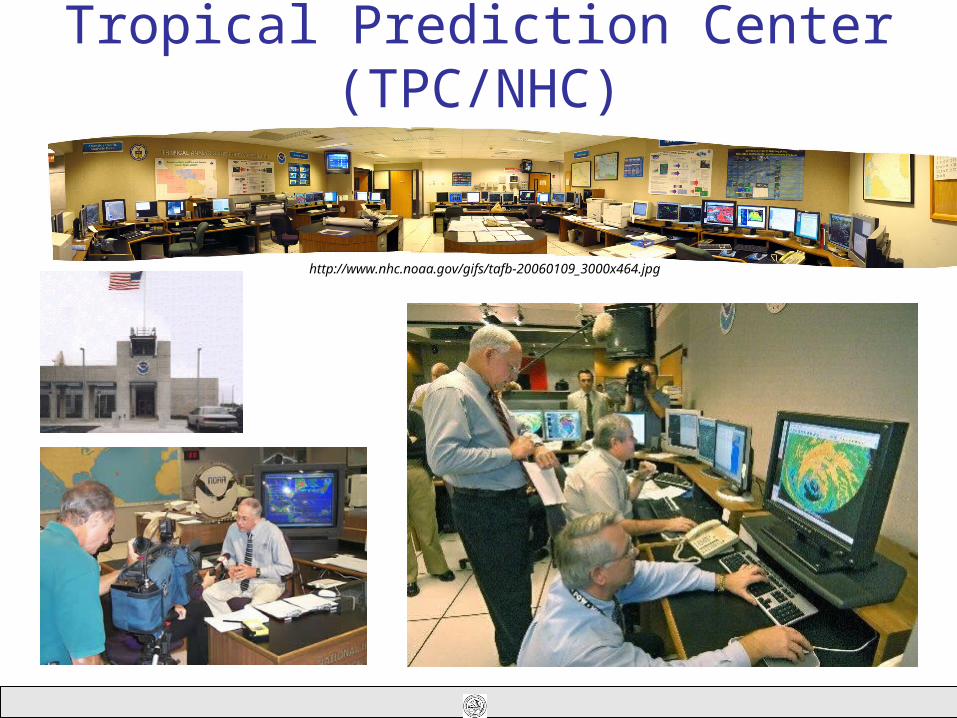
http://www.nhc.noaa.gov/gifs/tafb-20060109_3000x464.jpg
Tropical Prediction Center (TPC/NHC)
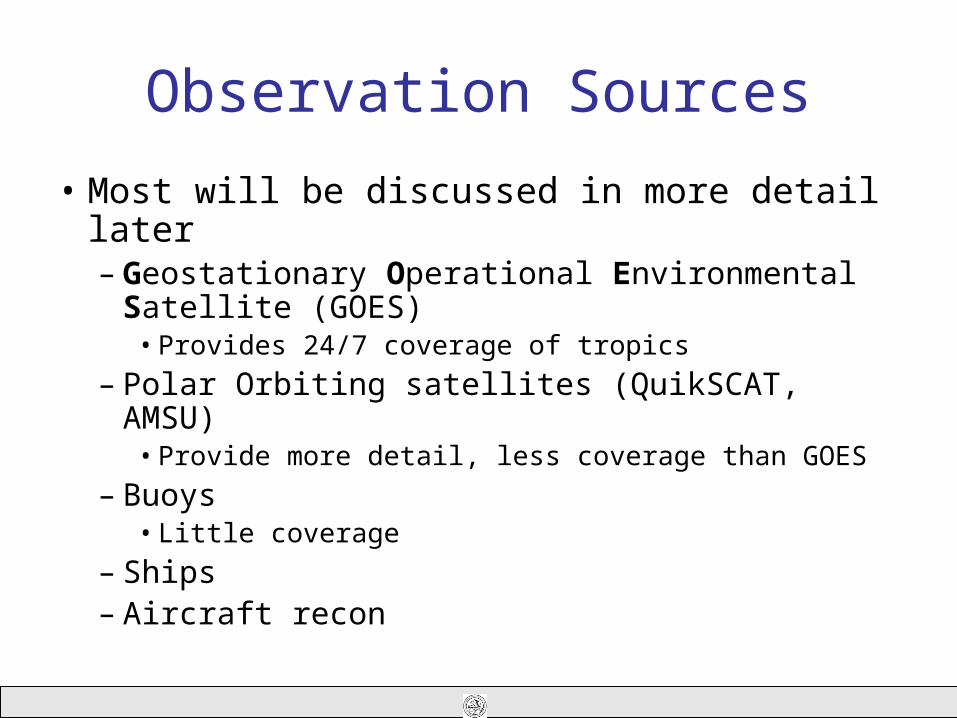
Observation Sources
• Most will be discussed in more detail later– Geostationary Operational Environmental Satellite (GOES)
• Provides 24/7 coverage of tropics
– Polar Orbiting satellites (QuikSCAT, AMSU)• Provide more detail, less coverage than GOES
– Buoys• Little coverage
– Ships– Aircraft recon

NHC Forecast Process
http://www.nhc.noaa.gov/gifs/hps2.gif

TC Model Guidance
• For track forecasting (where the storm is going to go), dynamical models are best
• For intensity forecasting, statistical models do better
• There are also statistical-dynamical models, which usually blend output from a dynamical model with statistics
• More complete model descriptions:– http://www.srh.noaa.gov/ssd/nwpmodel/html/nhcmodel.htm

Track Models
• CLIPER (Climatology and Persistence)– Statistical– Analyzes all tracks from 1931-1970– Least amount of skill – other models are graded
against CLIPER for skill
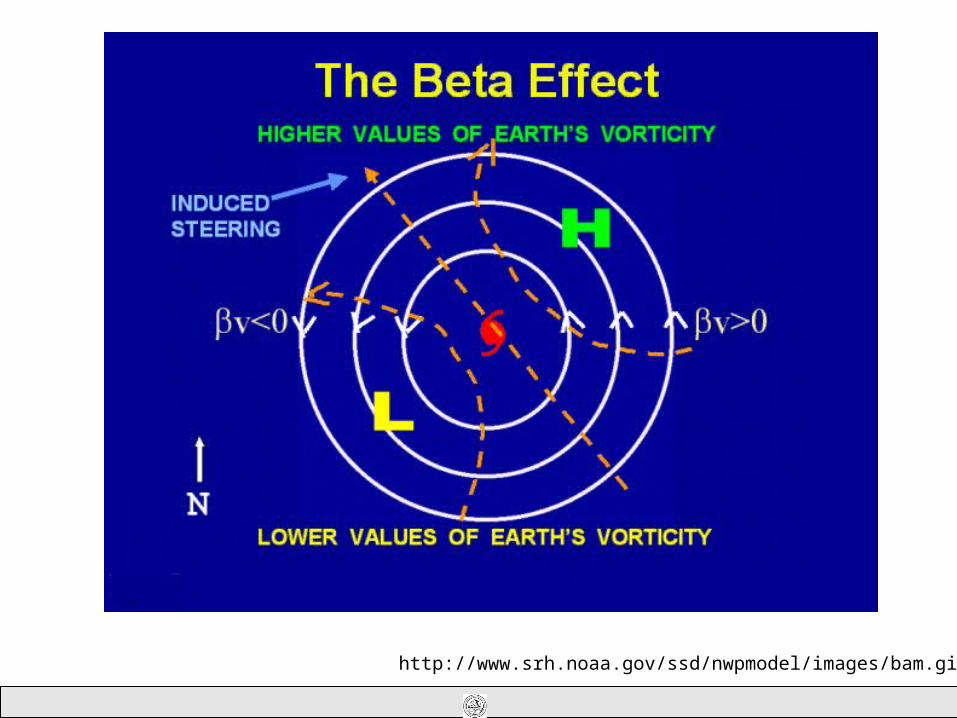
• BAM (Beta Advection Model)– Uses average layer steering flow + “beta” effect– Three averaging levels (deep, medium, shallow)


Beta Effect• Describes the change in Coriolis Force with
latitude (β = df/dy)• Large TCs encounter different Coriolis
accelerations across the storm circulation• In the Northern Hemisphere, TCs will move
northwest in the absence of any steering flow– Smaller TCs with strong steering currents not
influenced by Beta effect
http://www.srh.noaa.gov/ssd/nwpmodel/images/bam.gif
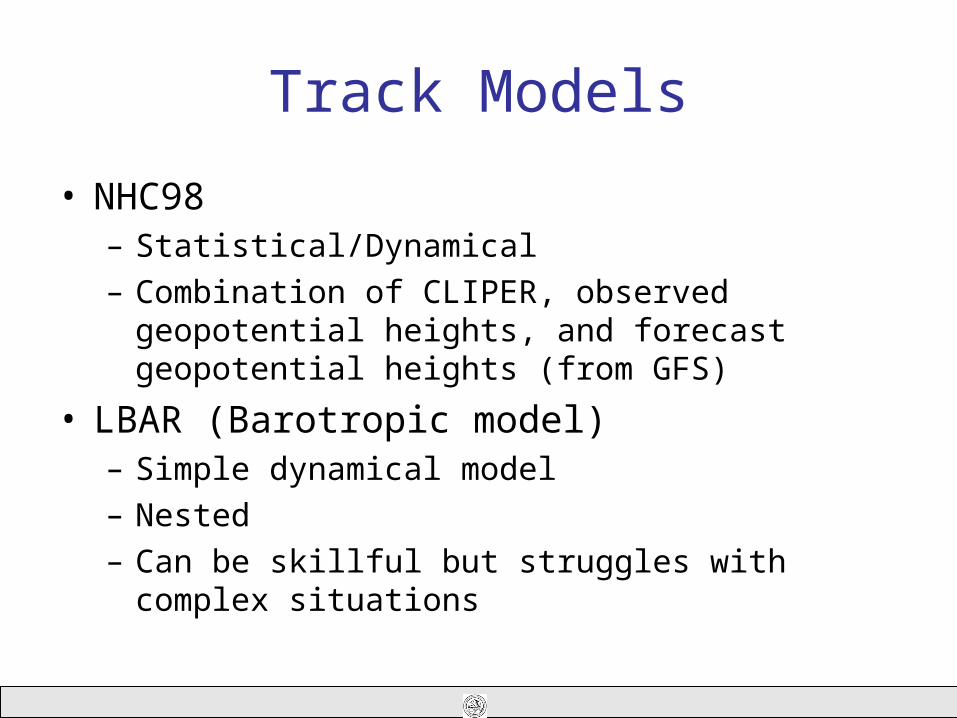
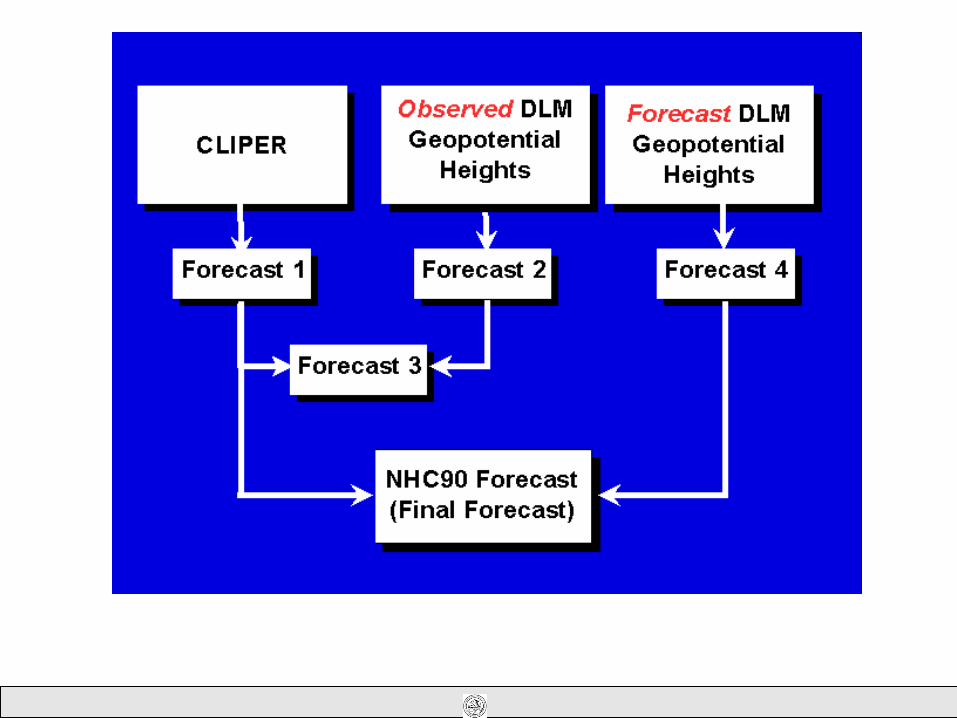
Track Models
• NHC98– Statistical/Dynamical– Combination of CLIPER, observed geopotential
heights, and forecast geopotential heights (from GFS)
• LBAR (Barotropic model)– Simple dynamical model– Nested– Can be skillful but struggles with complex situations

Simple Track Model Verification
Moreskill
Lessskill
** Model performance varies with season

Dynamical Track Models
• GFDL (Geophysical Fluid Dynamics Laboratory model)– Full physics model– Coupled to the sea surface– Best track performance for 2003-2004 season
• GFS (Global Forecast System)– Full physics model (NCEP)– Usually above average for track
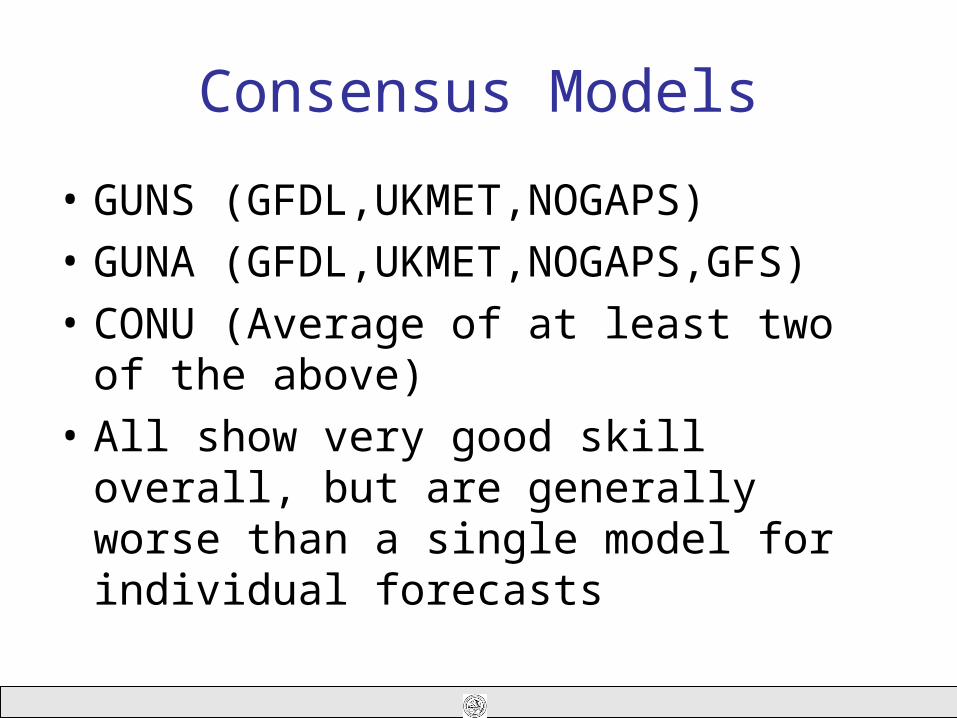
Consensus Models
• GUNS (GFDL,UKMET,NOGAPS)
• GUNA (GFDL,UKMET,NOGAPS,GFS)
• CONU (Average of at least two of the above)
• All show very good skill overall, but are generally worse than a single model for individual forecasts

Dynamical Model Verification
** Updated verification available at NHC website
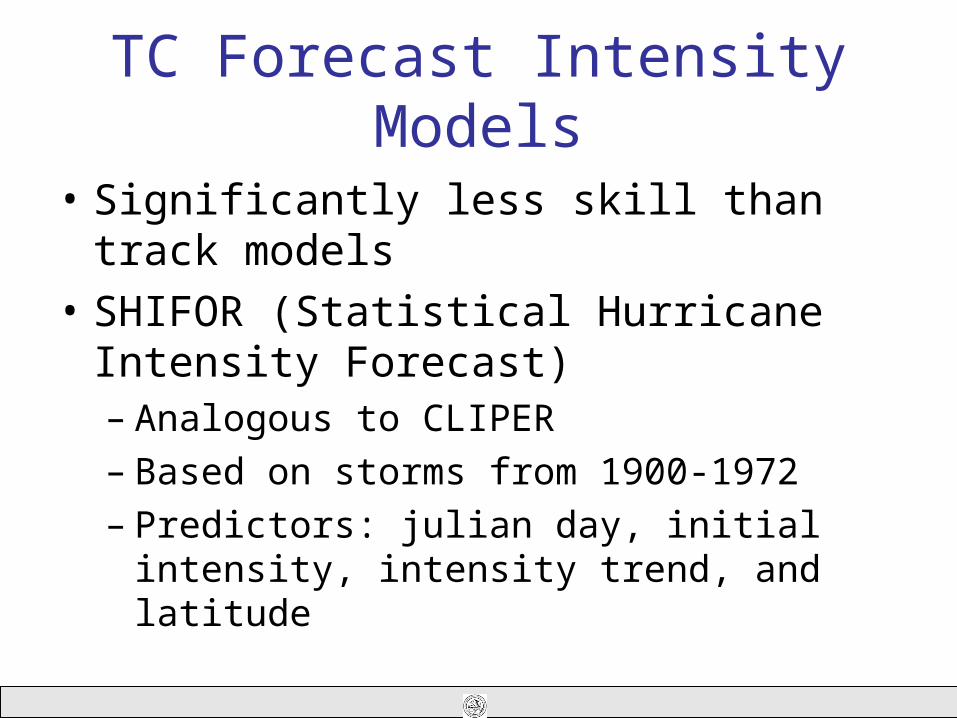
TC Forecast Intensity Models
• Significantly less skill than track models
• SHIFOR (Statistical Hurricane Intensity Forecast)– Analogous to CLIPER– Based on storms from 1900-1972– Predictors: julian day, initial intensity, intensity
trend, and latitude
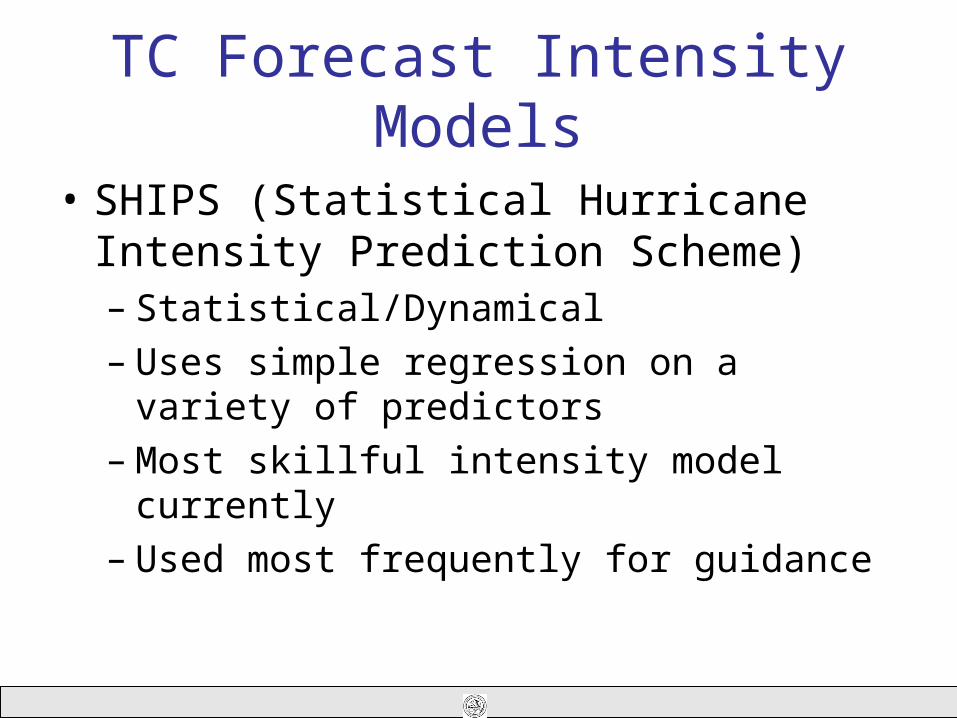
TC Forecast Intensity Models
• SHIPS (Statistical Hurricane Intensity Prediction Scheme)– Statistical/Dynamical– Uses simple regression on a variety of
predictors– Most skillful intensity model currently– Used most frequently for guidance

SHIPS Predictors
From DeMaria et al. 2005

TC Forecast Intensity Models
• GFDL– Usually more aggressive than SHIPS– Full physical model– Considered alongside SHIPS during forecast process
• FSU Superensemble– Experimental model developed at FSU– “Weighted Consensus” approach– Weighs errors in past forecast biases from numerous
sources• NHC forecast
– Has been performing relatively well
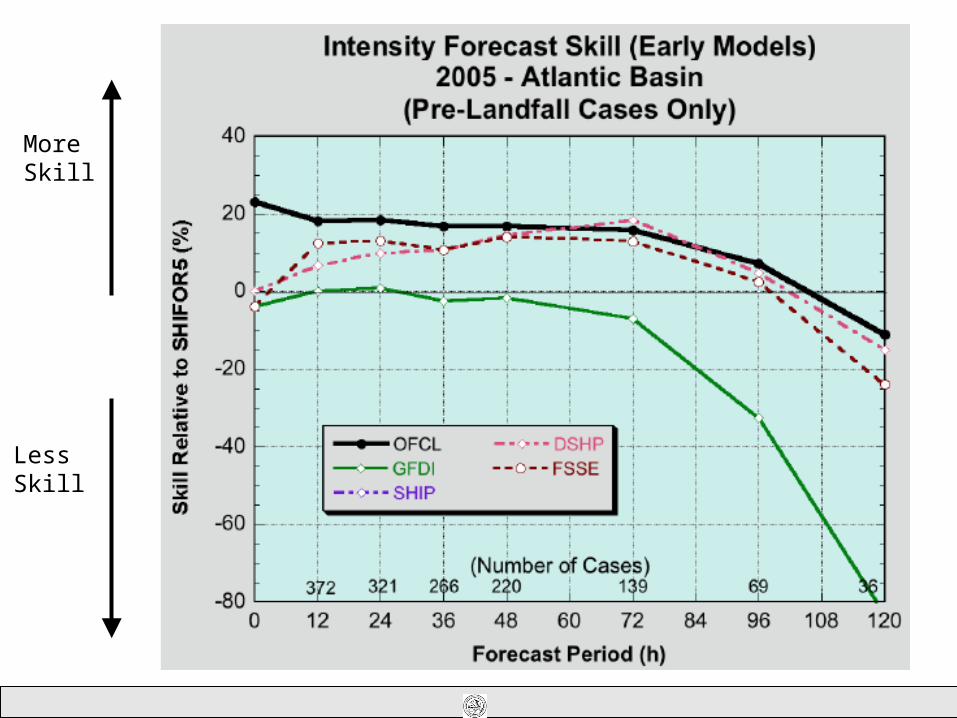
MoreSkill
LessSkill

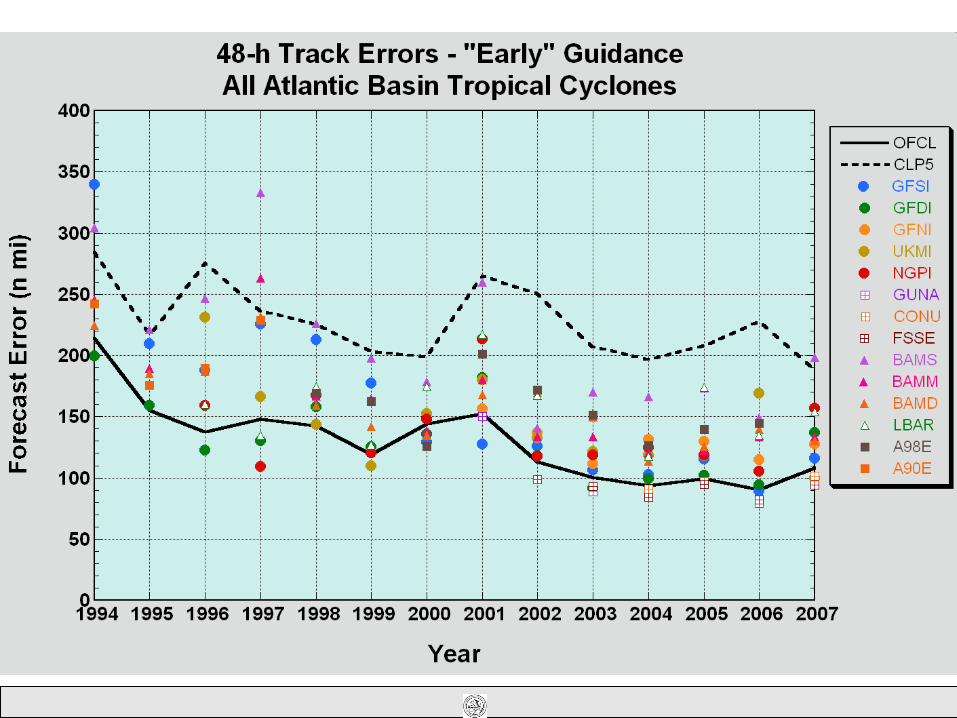
NHC Forecast Track Errors
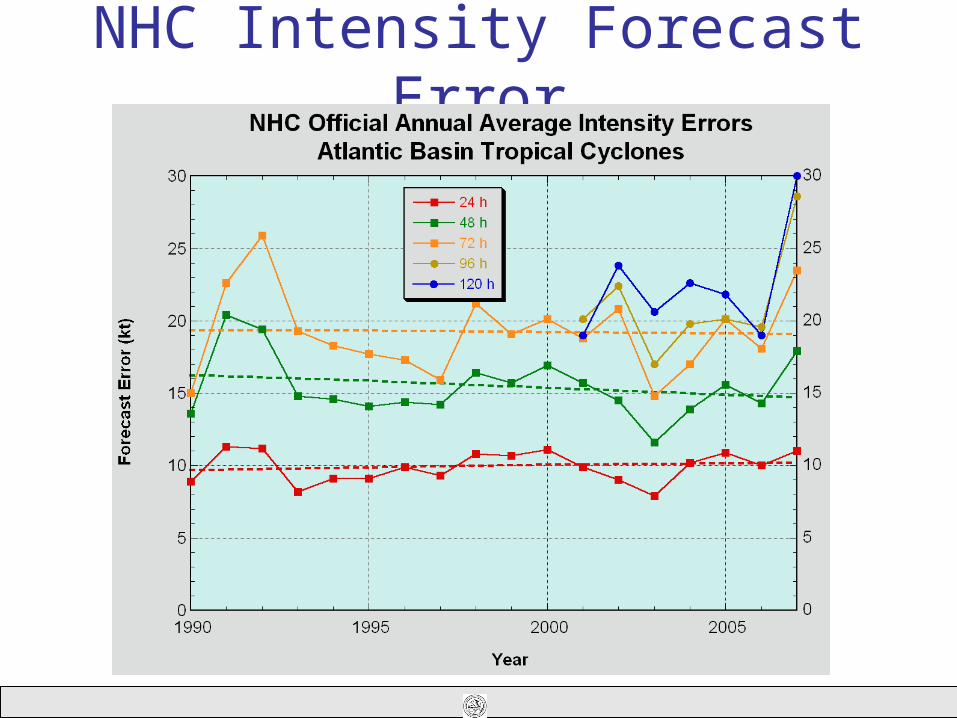
NHC Intensity Forecast Error
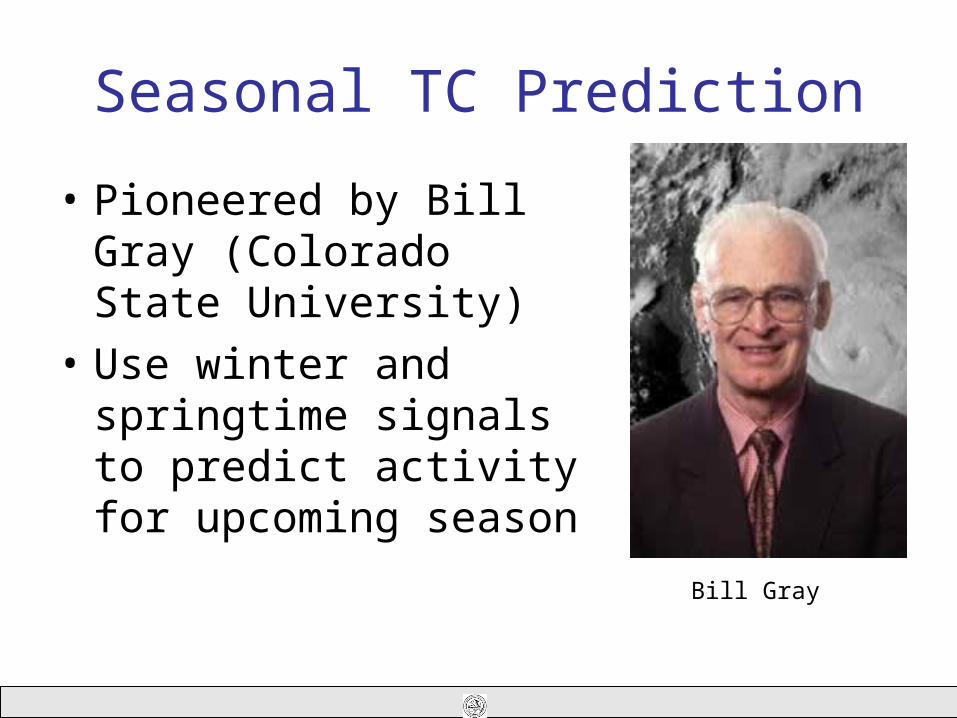
Seasonal TC Prediction
• Pioneered by Bill Gray (Colorado State University)
• Use winter and springtime signals to predict activity for upcoming season
Bill Gray
Gray’s Seasonal Predictors (Initial)
• Quasi-Biennial Oscillation (QBO) phase– Stratospheric wind (10-12 miles) that reverses
phase every 13 months– TC activity suppressed in east phase,
enhanced in west phase– Physical explanation – tied to locations in
convective activity (more equatorial convection in east phase)
Gray’s Seasonal Predictors (Initial)
• West African Rainfall– Intense rainfall produced stronger easterly waves
• Sea level pressure anomaly in Caribbean– Lower = more activity
• 200 mb zonal wind anomaly in Caribbean– If positive, more vertical wind shear over area, less
activity– Tended to persist from spring into hurricane season
• ENSO– Warm phase created more wind shear over Atlantic,
less TC activity

Gray’s Performance
• Fairly good up until 1995
• Since 1995, consistently underpredicted seasonal activity
• Predictors revised since then– ENSO, SLP anomaly, North Atlantic
Oscillation phase
• 2005 June 1 prediction: 15 named storms– 60% too low (others were low too)
NOAA Seasonal TC Prediction
• Consider ENSO phase, SST conditions, and phase of the Atlantic multi-decadal oscillation (AMO)– AMO is a set of atmospheric conditions that
tend to occur together– Active season: warm SST, less vertical wind
shear, favorable upper-atmosphere conditions– Theorized to be driven by decadal (20-30
year) shifts in the Atlantic ocean circulation

AMO
http://www.cpc.noaa.gov/products/outlooks/figure2.gif

http://www.cpc.noaa.gov/products/outlooks/figure4.gif .