Atmospheric validation of high accuracy CO2 absorption ...
13
W&M ScholarWorks W&M ScholarWorks Arts & Sciences Articles Arts and Sciences 2012 Atmospheric validation of high accuracy CO2 absorption Atmospheric validation of high accuracy CO2 absorption coefficients for the OCO-2 mission coefficients for the OCO-2 mission David R. Thompson Linda R. Brown David Crisp D. Chris Benner William & Mary, [email protected] V. Malathy Devi William & Mary, [email protected] Follow this and additional works at: https://scholarworks.wm.edu/aspubs Recommended Citation Recommended Citation Thompson, D. R., Benner, D. C., Brown, L. R., Crisp, D., Devi, V. M., Jiang, Y., ... & Castano, R. (2012). Atmospheric validation of high accuracy CO2 absorption coefficients for the OCO-2 mission. Journal of Quantitative Spectroscopy and Radiative Transfer, 113(17), 2265-2276. This Article is brought to you for free and open access by the Arts and Sciences at W&M ScholarWorks. It has been accepted for inclusion in Arts & Sciences Articles by an authorized administrator of W&M ScholarWorks. For more information, please contact [email protected].
Transcript of Atmospheric validation of high accuracy CO2 absorption ...

W&M ScholarWorks W&M ScholarWorks
Arts & Sciences Articles Arts and Sciences
2012
Atmospheric validation of high accuracy CO2 absorption Atmospheric validation of high accuracy CO2 absorption
coefficients for the OCO-2 mission coefficients for the OCO-2 mission
David R. Thompson
Linda R. Brown
David Crisp
D. Chris Benner William & Mary, [email protected]
V. Malathy Devi William & Mary, [email protected]
Follow this and additional works at: https://scholarworks.wm.edu/aspubs
Recommended Citation Recommended Citation Thompson, D. R., Benner, D. C., Brown, L. R., Crisp, D., Devi, V. M., Jiang, Y., ... & Castano, R. (2012). Atmospheric validation of high accuracy CO2 absorption coefficients for the OCO-2 mission. Journal of Quantitative Spectroscopy and Radiative Transfer, 113(17), 2265-2276.
This Article is brought to you for free and open access by the Arts and Sciences at W&M ScholarWorks. It has been accepted for inclusion in Arts & Sciences Articles by an authorized administrator of W&M ScholarWorks. For more information, please contact [email protected].
Atmospheric validation of high accuracy CO2 absorption coefficientsfor the OCO-2 mission
David R. Thompson a,n, D. Chris Benner b, Linda R. Brown a, David Crisp a, V. Malathy Devi b,Yibo Jiang a, Vijay Natraj a, Fabiano Oyafuso a, Keeyoon Sung a, Debra Wunch c,Rebecca Castano a, Charles E. Miller a
a Jet Propulsion Laboratory, California Institute of Technology, 4800 Oak Grove Dr. Pasadena, CA 91109, USAb Department of Physics, The College of William and Mary, Box 8795, Williamsburg, VA 23187, USAc California Institute of Technology, 1200 East California Boulevard, Pasadena, CA 91125, USA
a r t i c l e i n f o
Article history:
Received 13 March 2012
Received in revised form
25 May 2012
Accepted 29 May 2012Available online 12 June 2012
Keywords:
Fourier transform spectroscopy
Infrared CO2 spectroscopy
Atmospheric CO2 retrievals
Line shapes
Line mixing
Speed dependence
a b s t r a c t
We describe atmospheric validation of 1:61 mm and 2:06 mm CO2 absorption coefficient
databases for use by the Orbiting Carbon Observatory (OCO-2). The OCO-2 mission will
collect the measurements needed to estimate column-averaged CO2 dry air mole
fraction within 1 ppm accuracy without the region- or airmass-dependent biases that
would significantly degrade efforts to understand carbon sources and sinks on a global
scale. To accomplish this, the forward radiative transfer model used to generate
synthetic atmospheric spectra for retrievals must achieve unprecedented spectroscopic
fidelity within the short wave infrared CO2 bands sampled by the sensors. The failure of
Voigt line shapes and conventional line mixing formulations for such objectives has
motivated significant revisions to line shape models used to generate the gas absorption
cross sections for the OCO-2 forward model. In this paper, we test line mixing and speed
dependent line shapes combined with improved experimental line parameters. We
evaluate pre-computed absorption coefficients in the two spectral regions of CO2
absorbtion using high resolution FT-IR laboratory spectra, atmospheric spectra from
the Total Carbon Column Observing Network (TCCON), and medium resolution sound-
ings from the space-based Greenhouse Gases Observing Satellite (GOSAT).
& 2012 Elsevier Ltd. All rights reserved.
1. Introduction
Our current understanding of the atmospheric carboncycle relies mainly on combining CO2 measurements fromground sensor networks with transport models to informflux inversions [1–3]. Space-based measurements of CO2
can make significant contributions by observing areas thatground-based instruments cannot access, such as the openocean or deep rain forest. More importantly, high precisiondata can expand the spatial and temporal coverage to reveal
regional sources and sinks [3–7]. This will be critical forassessing the extent and variability of these fluxes as well astheir sensitivity to future climate change.
Recent advances in space based remote sensing obser-vations of CO2 and other greenhouse gases hold promisefor global monitoring efforts [8–12]. Measurements of theabsorption of reflected sunlight by CO2 can provideestimates of the column averaged CO2 dry air molefraction, XCO2, which are sensitive to CO2 variations nearthe surface where most sources and sinks are located. TheJapanese Greenhouse gases Observing SATellite (GOSAT)and the NASA Orbiting Carbon Observatory (OCO) werethe first two satellites specifically designed to exploit thisapproach. GOSAT was successfully launched in January
Contents lists available at SciVerse ScienceDirect
journal homepage: www.elsevier.com/locate/jqsrt
Journal of Quantitative Spectroscopy &Radiative Transfer
0022-4073/$ - see front matter & 2012 Elsevier Ltd. All rights reserved.
http://dx.doi.org/10.1016/j.jqsrt.2012.05.021
n Corresponding author. þ1 818 354 2200.
E-mail address: [email protected] (D.R. Thompson).
Journal of Quantitative Spectroscopy & Radiative Transfer 113 (2012) 2265–2276

2009 and has been routinely collecting CO2 and methaneobservations over the sunlit hemisphere of the globe sinceApril 2009 [13–15]. OCO was lost in February 2009 whenits launch vehicle malfunctioned and failed to reach orbit.A replacement called OCO-2 is currently under develop-ment in preparation for a late 2014 launch.
Precise XCO2 measurements are needed because sur-face sources and sinks of CO2 produce small spatial andtemporal variations in this quantity [4]. While the atmo-spheric CO2 mixing ratio can vary by as much as 8% nearthe ground, these perturbations decay rapidly with heightsuch that XCO2 variations rarely exceed 2% on regionalscales. Existing data show that XCO2 variations are usuallyno larger than 0.3% on regional scales, and that thesevariations have representative spatial scales that rangefrom 100 km over continents to 1000 km over the ocean.Resolving the most important regional fluxes necessitatesaccuracy to within 0:25% (1 ppm) [4].
To meet these precision requirements, the GOSAT andOCO-2 instruments acquire high resolution spectra inthree spectral ranges: two for estimating CO2 abundanceusing rovibrational absorption bands at 1:61 mm and2:06 mm, and one for simultaneous measurement of theO2 A band at 0:76 mm to determine photon path lengthand surface pressure [16]. The OCO-2 retrieval algorithm[16,17] uses a forward radiative transfer model to simu-late an observed spectrum for a given atmospheric state.An inverse model, based on optimal estimation [17], thenuses the differences between the observed and simulatedspectrum to modify the state properties and improve thefit [8–10]. Because a 0.25% variation in the CO2 columnabundance produces spectral variations that are muchsmaller than this, both high precision measurements anda high fidelity forward model are needed. The forwardmodel must account for all physical phenomena thatcontribute to the atmospheric spectrum such as absorp-tion, gas and aerosol scattering, surface reflectance, sur-face pressure, and the atmospheric temperature andwater vapor profiles [12,16].
Only a small fraction of the uncertainty budgetremains for uncertainties in CO2 and O2 spectroscopy[4,18]. Consequently evaluation and refinement of theretrieval spectroscopic models has been an important partof the OCO-2 preparatory effort. To validate the spectro-scopic molecular line parameters used in the forwardmodel, we must demonstrate a radiometric accuracy of0.1% on laboratory spectra which approaches the peak-to-peak errors of the best fits. Systematic errors are ofparticular concern since they introduce regional biasesthat imitate sources and sinks [4,19].
This paper focuses on the pressing challenge of CO2
absorption at 1:61 mm and 2:06 mm. Ground-based studiesreport inconsistencies in the CO2 total columns retrievedusing these two spectral regions and attribute systematicerrors to the basic line parameters (such as line intensitiesand Voigt pressure broadening coefficients) [12,16,20,21]. Atthe same time, laboratory studies demonstrate that thechoice of molecular line shape impacts the retrieved lineparameters. In addition to Lorentz broadening, one mustconsider the combined effects of Line Mixing (LM), speeddependence and narrowing [18,22–24]. The best line shape
choice is still uncertain, but profiles which model linemixing and speed dependence provide superior fits to CO2
lab data [23] while line mixing improves atmosphericretrievals [25]. Non-Voigt line shapes also provide morephysically plausible values for related line parameters [24].
Several groups have used new LM models for infraredremote sensing of CO2. LM was introduced into the Atmo-spheric Infrared Sounder (AIRS) retrieval algorithm for14 mm spectral soundings [26], and demonstrated in Four-ier Transform Spectrometers on balloon and aircraft plat-forms [27]. New LM models have significantly improvedfits to upward-looking atmospheric spectra in the OCO-2bands [28,29]. However the best fits still show persistentstructured residuals at 2:06 mm [25]. Speed dependent lineshapes remain virtually unused in atmospheric retrievalsdue to their computational complexity and the lack ofstandardized software, atmospheric, and laboratory eva-luation benchmarks. Some combination of the non-Voigtline shapes is needed to achieve the radiometric accuracyrequired for OCO-2.
This work describes the first atmospheric tests of CO2
absorption cross sections derived from new laboratorystudies that combine LM parameters [30] with a speeddependent line shape profile [31–33]. First we apply theproposed database to high-resolution laboratory spectraacquired under homogeneous conditions with controlledgas abundances, temperature, and illumination. We thenperform atmospheric retrievals of XCO2
with solar observa-tions from the Total Carbon Column Observing Network(TCCON) [20,21,34]. These upward-looking spectra are aconceptual bridge between the laboratory and orbitalretrieval scenarios. They are simpler than the downward-looking case due to improved SNR, the lack of significantoptical path length biases associated with scattering, anddirect sensing of atmospheric conditions at the surface. Thepath lengths reveal weak CO2 lines to a degree unattainableunder typical laboratory conditions, providing an indepen-dent validation of the new line parameters. Finally, we testorbital soundings using the OCO-2 retrieval algorithm. Weconsider a representative set of GOSAT orbits with hundredsof soundings acquired by the TANSO-FTS instrument [12].The GOSAT tests use the full OCO-2 Level 2 retrievalalgorithm and the associated challenges of aerosol scatter-ing, surface reflectance, and lower SNR [16]. These demon-strate non-Voigt line shapes in an atmospheric retrievalprocess capable of meeting strict throughput requirementsfor OCO-2, which is expected to yield approximately 105
cloud-free soundings each day.
2. Absorption coefficient models
The new cross sections are based on a multispectrumparameter fitting procedure that combines dozens oflaboratory spectra in a least-squares optimization. Lowpressure spectra provide intensities and line positions,while higher pressure scans characterize line mixing, self-and air-broadened half widths. We refer the interestedreader to a description by Benner et al. [35] and support-ing texts by Vitcu [33] and Predoi-Cross et al. [31]. Wewill review the most important aspects here.
D.R. Thompson et al. / Journal of Quantitative Spectroscopy & Radiative Transfer 113 (2012) 2265–22762266

2.1. Line Mixing
Line Mixing (LM) is a broad topic for which Hartmannet al. provide a comprehensive review [36]. Our specificformulation follows Predoi-Cross et al. and Levy et al.[37,38]. We express the combined absorption from aspectrum of interacting Lorentz lines as a function IðoÞof frequency o:
IðoÞ ¼ 1
pIm½XT
ð1o�o0�iWÞ�1rX� for Xj ¼
ffiffiffiffiffiffiffiffiffiffiffiSj=rj
qð1Þ
Here 1 is the identity matrix and o0 is a diagonal matrixof zero-pressure line positions. The diagonal matrix rholds relative populations for lower energy states, and Xis a vector with an element for each line j given byintensity Sj and the number density rj. The relaxation
matrix W determines the strength of coupling betweeninteracting pairs of lines [36]. Diagonal elements of W
have real and imaginary parts representing Lorentz halfwidths aL and pressure shifts d:
Wjj ¼ aLj�idj ð2Þ
Off-diagonal elements describe mixing between differenttransitions. These are proportional to pressure, and havethe same units as the Lorentz half width. We compute amatrix element Wjk by summing contributions Wjkr foreach broadening gas r in proportion to volume mixingratio wr:
Wjk ¼X
r
wrWjkrðT0ÞT0
T
� �mjkr
ð3Þ
Temperature dependence exponents m are relative to areference temperature T0 (296 K). The off-diagonal relaxa-tion matrix elements satisfy a detailed balance relation-ship:
Wkj ¼X
r
wr
rkr
rjr
!WjkrðT0Þ
T0
T
� �mjkr
ð4Þ
These elements are interdependent with Lorentz widthsand pressure shifts, so it is important to retrieve all para-meters simultaneously.
Evaluating Eq. (1) requires a matrix inversion for eachspectral point. Following Pine [39], we transform Eq. (1)into a more convenient representation using generalized
line parameters [39]. We diagonalize the matrix o0þ iW
using:
A�1ðo0þ iWÞA¼L ð5Þ
The columns of A are normalized eigenvectors whoseeigenvalues correspond to entries in the diagonal matrixL. We further define:
xj ¼ Re½ðXT AÞjðA�1rXÞj� ð6Þ
Zj ¼ Im½ðXT AÞjðA�1rXÞj� ð7Þ
Eq. (1) is then equivalent to the following expression[38,39]:
IðoÞ ¼ 1
pXN
j ¼ 1
xjIm½Ljj�þZjðo�Re½Ljj�Þ
Im½Ljj�2þðo�Re½Ljj�Þ
2ð8Þ
This has the same form as a Rosenkranz first-order LMapproximation:
IRðoÞ ¼1
pXN
j ¼ 1
Sj
aLjþYðo�o0jÞ
a2Ljþðo�o0jÞ
2
24
35 ð9Þ
Consequently we can evaluate Eq. (1) using a sum ofLorentz profiles with first-order line mixing. These‘‘pseudo-profiles’’ use the following generalized para-meters: the intensity Sj becomes xj, the first order linemixing parameter Y times the line intensity Sj becomes Zj,the line spectral position o0j becomes Re½Ljj�, and theLorentz half width aLj
becomes Im½Ljj�. The resultingabsorption cross sections are mathematically equivalentto the complete spectrum of mixed Lorentz lines [39].In principle, many lines are coupled and the magnitude ofthe mixing effect decreases smoothly with increasingseparation [40]. In practice the limited number of labora-tory spectra do not provide enough constraints to fit allthe terms in the full relaxation matrix W. Instead, wedesire a constrained parameterization with appropriateflexibility for our atmospheric application. The OCO-2approach fits all tridiagonal matrix terms, explicitly model-ing interaction between neighbor lines of P- and R-branches[30]. The tridiagonal relaxation matrix uses immediateneighbor coefficients to approximate the influence of themore distant lines. The carbon dioxide lines in these bandsare spaced widely enough that the approximation is effec-tive for atmospheric pressures and temperatures. We setthese parameters directly with simultaneous fits of multiplelab spectra, holding all other off-diagonal relaxation matrixelements to zero [23,30].
2.2. Speed dependent line shapes
Here we extend Eq. (8), which describes a mixed Lorentzprofile, to incorporate Doppler broadening and speeddependence effects. A speed dependent profile [31,32]refines the Lorentz contribution by accounting for variousspeeds at the time of collision. Specifically, it is the con-volution of Doppler and Lorentz profiles integrated overpossible collision speeds. While there is no consensus on thebest physical model or line shape for NIR CO2 spectra,profiles using a quadratic speed dependence have beenshown to fit laboratory data better than a standard Voigtmodel [24]. One can compute a speed dependent line shapeusing a combination of two Voigt profiles [32] or, as in thiswork, by numerical integration. We employ a quadraticspeed dependence relationship first introduced in [41],detailed in Vitcu [33] and further elaborated by Benneret al. [30]. Like the complex Voigt profile, the speeddependent Voigt VsðoÞ has real and imaginary parts:
VsðoÞ ¼ KsðoÞþ iLsðoÞ ð10Þ
We parameterize each collisionally isolated line, j, using theLorentz half width, aLj, spectral line position, o0j, a speeddependence parameter, sj, and a Dicke narrowing para-meter, Hj. Convolving Lorentz and Doppler profiles andintegrating over velocity [42], we have
KsðoÞ ¼2
p
Z 1�1
ve�v2
tan�1ðQsðv,oÞÞ dv ð11Þ
D.R. Thompson et al. / Journal of Quantitative Spectroscopy & Radiative Transfer 113 (2012) 2265–2276 2267

LsðoÞ ¼1
p
Z 1�1
ve�v2
lnð1þQsðv,oÞ2Þ dv ð12Þ
where aD is the Doppler half width and Qsðv,oÞ is given by
Qsðv,oÞ ¼o�o0jþvaD
aLj½1þsjðv2�1:5Þ�þHjð13Þ
We substitute the generalized Lorentz line parametersdefined in Section 2.1 into this expression in order tocapture the combined effects of speed dependence, Dopplerbroadening and line mixing.
In this work the Dicke narrowing parameter Hj is alwaysset to zero because narrowing and speed dependence canboth alter the line shape in similar ways, and distinguishingthe two effects requires very high spectral resolution. In thelaboratory data the CO2 Doppler width is close to the FTSInstrument Line Shape. Consequently, in the spectra whereDicke narrowing is most active, each narrow line provides asingle point measurement with only enough information toretrieve position and intensity. Other ways to estimateDicke narrowing include computing Hj directly from thegas diffusion constant or retrieving it from measurementswith higher spectral resolution.
2.3. Continuum effects
Apart from LM effects, previous researchers have raisedthe possibility that Collision Induced Absorption (CIA) couldplay a role in NIR rovibrational transitions for CO2 [25].Recent results by Lamouroux et al. [28] provide an upperlimit on CIA for NIR CO2 that would be negligible in theatmosphere [28]. Our basic parameterization does notinclude CIA, but continuum-level effects may still arise inatmosphere due to solar lines or unmodeled atmosphericabsorption. We found that we could improve atmosphericretrieval performance with a small ad hoc continuumabsorption. We generate the pressure continuum with apair of Gaussian distributions centered at 4853.5 and4789 cm�1, with respective widths 10 and 8 cm�1 andpeak intensities of 2:1� 10�24 and 4:2� 10�25 cm�1/(molecule cm�2). These parameters were determined byempirical modification to improve fits to atmosphericspectra. This modification is directly proportional to pres-sure, though a ‘‘pressure squared’’ correction yields similarresults. In general, atmospheric tests do not yet providestrong evidence to show if this is caused by physical atmo-spheric effects, modeling error, or a computational artifact.
2.4. Table computation
The OCO-2 mission will produce approximately 105
cloud-free soundings per day. To satisfy retrieval datathroughput requirements we perform all cross sectioncomputations in advance. This is particularly important forcomputationally intensive LM calculations having manypairwise interactions between lines. We cache the absorp-tion coefficients in a lookup table (ABSCO table) indexed bypressure and temperature. The tests that follow use aspectral grid spacing of 0.002 cm�1. We record cross sec-tions at 70 pressures evenly spaced at 1 kilometer altitudeincrements. The 17 temperature levels lie on an evenly
spaced grid centered at the mean vertical temperatureprofile for historical GOSAT retrieval footprints, as givenby the European Centre for Medium-Range Weather Fore-casts (ECMWF). This provides coverage over all physicallyreasonable atmospheric conditions. At runtime, a linearinterpolation provides cross sections.
Table 1 summarizes our spectroscopic data sources forthe proposed databases. A modified version of the multi-spectrum nonlinear least squares fitting technique of Benneret al. [30] computes the main isotopologue for CO2 linesnear 4850 and 6200 cm�1 using a speed dependent lineprofile. As mentioned previously, these parameters originatefrom a least squares multispectrum retrieval processdescribed in [35] with laboratory results reported in [23,30].
Fig. 1 shows a typical fit of the 2:06 mm CO2 band to alaboratory spectrum from the JPL Bruker FTS instrument[46]. Here, a low pressure HCl cell in line with the main cellwas used to characterize the instrumental line shape andprovide an absolute frequency calibration. This spectrumcontributed to the multispectrum fitting procedure. Thesubsequent cross section tables reproduce a good qualityfit, which provides confidence in the calculation. Peakresiduals near 0.1% may be related to line shape, andapproach the limits of laboratory accuracies achievable withthis parameterization. The residuals are expressed in termsof the maximum transmission level. The right panel gives anexpanded view of the residual structure near 4824.5 cm�1.Fig. 2 shows a 1:61 mm spectrum not incorporated into theDevi et al. fits [23]. This is a more challenging case, sincetransmittance is computed without modifying line para-meters to fit the experimental data. Only the volume mixingratio is optimized, and it converges to a value within 2% ofthe recorded estimate. Peak residuals are a small fraction ofa percent, and the retrieved CO2 volume mixing ratio iswithin the uncertainty in laboratory conditions.
3. Atmospheric evaluation and results
3.1. The TCCON uplooking FTS network
TCCON is a global network of upward-looking FTSspectrometers that measures transmittance along a direct
Table 1Parameter sources for the proposed CO2 spectroscopic line list. Note:
only first authors are shown.
Parameter 2:06 mm CO 1:61 mm CO
Positions Benner [30] Devi [23]
Intensities Benner [30] Devi [23]
Air-widths Benner [30] Predoi-Cross [43]
Air-shifts Benner [30] Predoi [43], Devi
[23]
Air-width Tdependence
Benner [30] from Predoi
[43]
Predoi[43]
Line shapes SDþLM SDþLM
Isotopologues Toth [44], Rothman [45]
(text)
Rothman [45]
(text)
Air LM Benner [30] Devi [23]
Speed dependence Benner [30] Devi [23]
Continuum n/a (See text)
Collisionalnarrowing
n/a n/a
D.R. Thompson et al. / Journal of Quantitative Spectroscopy & Radiative Transfer 113 (2012) 2265–22762268

solar path. Each station tracks the sun across a range ofairmasses and seasons. These instruments have importantadvantages for our evaluation. Their high spectral resolutionof 0.014 cm�1 is a stringent test of line shape subtleties.Their SNR is approximately 5000, an order of magnitudebetter than OCO-2. Viewing the solar disk center directlyallows them to neglect atmospheric scattering effects, andthe atmospheric conditions are constrained by sensors atthe surface and occasional aircraft column measurements.They are true atmospheric measurements and observe
phenomena that it is not feasible to measure in the labexperiments.
Here we evaluate performance on upward-looking atmo-spheric FTS spectra from a TCCON site in Park Falls, Wis-consin. We choose an initial dataset of 140 spectra from 22December 2004 that has already been used in previousspectroscopic studies [25]. The soundings comprise a diversedataset with varying SNR and airmasses ranging from lessthan 3 to over 12. Conditions at the ground site were verycold (�20 1C) and dry; this minimizes confounding effects
Fig. 1. Modeling an air-broadened CO2 laboratory spectrum at 2:06 mm (wavenumber¼cm�1) by applying line parameters for a speed dependent profile
with line mixing from [30]. The upper panel shows the residuals obtained for the scan in the lower panel. The plot at right is an expanded view for a
spectral range centered at 4842.5 cm�1, and the red dashed lines mark the 0.1% radiometric accuracy target. The lab spectrum was recorded at
0.00444 cm�1 resolution (optical path difference 112.5 cm) using a multipass absorption cell set at 29.30 m optical path length. The total gas pressure
was 599.8 Torr at 296.1 K with 4.95% being 12C-enriched 16O12C16O. (For interpretation of the references to color in this figure caption, the reader is
referred to the web version of this article.)
Fig. 2. Modeling an air-broadened CO2 laboratory spectrum at 1:61 mm (wavenumber¼cm�1) by applying line parameters for a Speed Dependent profile
with Line Mixing from [23,30]. The right plot shows an expanded view at 6212.5 cm�1, and the red dashed lines mark the 0.1% radiometric accuracy
target. Spectral resolution: 0.00667 cm�1 (optical path difference 75.0 cm); Optical path length: 32.54 m; Total gas pressure: 742.1 Torr at 295.3 K with
9.03% being 12C-enriched 16O12C16O. (For interpretation of the references to color in this figure caption, the reader is referred to the web version of this
article.)
D.R. Thompson et al. / Journal of Quantitative Spectroscopy & Radiative Transfer 113 (2012) 2265–2276 2269

such as H2O broadening of CO2 and drawdown from photo-synthesis. The measured surface pressure ranged from964 hPa to 967 hPa, with a standard deviation of just0.7 hPa. It is likely that XCO2
did not change significantlyduring the day.
The upward-looking retrievals use a variant of the OCO-2Level 2 algorithm with an a priori atmospheric model basedon pressure and temperature profiles for that locale and dayfrom the National Centers for Environmental Prediction(NCEP). These data are re-gridded into 70 atmosphericlevels. A raytracing algorithm uses an oblate spheroid globemodel to compute the path distance through each layer. Itfeeds into a radiative transfer code by Spurr [47] whichperforms computations of direct beam attenuation andrefractive effects to simulate the observed spectrum. Theretrieval rescales the entire vertical a priori abundanceprofile by a single scalar value that is treated as a freeparameter. One can use this scaling factor, along with airpressure and water vapor abundances, to estimate the dryair column averaged mixing ratio of CO2. Separate profilescaling factors are retrieved simultaneously for CH4 and H2Oconcentrations and atmospheric temperature. The retrievalfits these scalar parameters and the linear continuum to themeasured spectrum. We also account for solar lines in thisregion. Our CO2 absorption calculation uses the pre-com-puted cross sections without any online modifications to theindividual line parameters or mixing.
We have found that isotopologue abundances in atmo-spheric retrievals have a slight but consistent offset from thelaboratory-derived values. As compensation, we assumeabundance ratios with an additional 6% enhancement ofthe 16O12C18O isotopologue relative to the HITRAN standard.This is an expedient compromise since the computationalconstraints of OCO-2 retrievals prevent fitting each isoto-pologue’s abundance independently at runtime. The 6%enhancement has proven consistent across multiple sound-ings and path lengths.
During a combined retrieval with both the 1:61 mm and2:06 mm CO2 bands, any disagreement in band strengthscan preclude convergence to an optimal fit because the twobands work against each other producing different values ofXCO2
. Consequently the total absorption cross sections of thetwo bands are scaled for mutual consistency and agreementwith a priori atmospheric predictions from EMCWF profiles.This results in a further scaling factor of 0.99388 applied tothe 2:06 mm band and 1.00539 to the 1:61 mm band.
We compare the proposed spectroscopic database againsta benchmark standard from Lamouroux et al. [28]. TheLamouroux et al. [28] database differs in two ways: it usesa standard Voigt line shape, and computes LM using analternative parametric form of the relaxation matrix. Thisparametric form is based on the Energy Corrected Sudden(ECS) model [48]. The ECS model relates all off-diagonalterms through a power law with four temperature- andperturber-dependent free parameters. A subsequent renor-malization procedure guarantees consistency of the finalresult with detailed balance and the known diagonal ele-ments. This contrasts with the proposed OCO-2 approachthat uses nearest neighbor line mixing. Both databases useinternally self-consistent parameters retrieved using theappropriate line shape assumptions. However we emphasizethat the source data, line shape, and relaxation matrices alldiffer between the two alternatives so this comparisoncannot attribute performance differences to a particularmodel choice. Instead, our test aims to characterize theempirical performance of these two state-of-the-art data-bases on atmospheric data. We will subsequently refer to thetwo methods as the benchmark and proposed approaches. Weuse these two alternative methods to compute cross sectionsfor the P and R branches of the 1:61 mm and 2:06 mm bands.Isotopologue corrections are held constant between the twotest scenarios, as are all other bands and absorbers.
Fig. 3 shows the residual of a typical 2:06 mm bandsounding at 10 airmasses, shown as a percentage of
Fig. 3. Modeling a 10 airmass atmospheric spectrum at 2:06 mm. The spectrum is a ground-based sounding recorded at 0.014 cm�1 resolution with the
TCCON Park Falls FTS station, 22 December 2004. The residuals in red are from the benchmark Line Mixing software and line list from Lamouroux et al.
[28], while the residuals in blue are for the present proposed software and database (applied in Fig. 1) from Benner et al. [30] which combines a speed
dependent profile and tridiagonal line mixing. (For interpretation of the references to color in this figure caption, the reader is referred to the web version
of this article.)
D.R. Thompson et al. / Journal of Quantitative Spectroscopy & Radiative Transfer 113 (2012) 2265–22762270
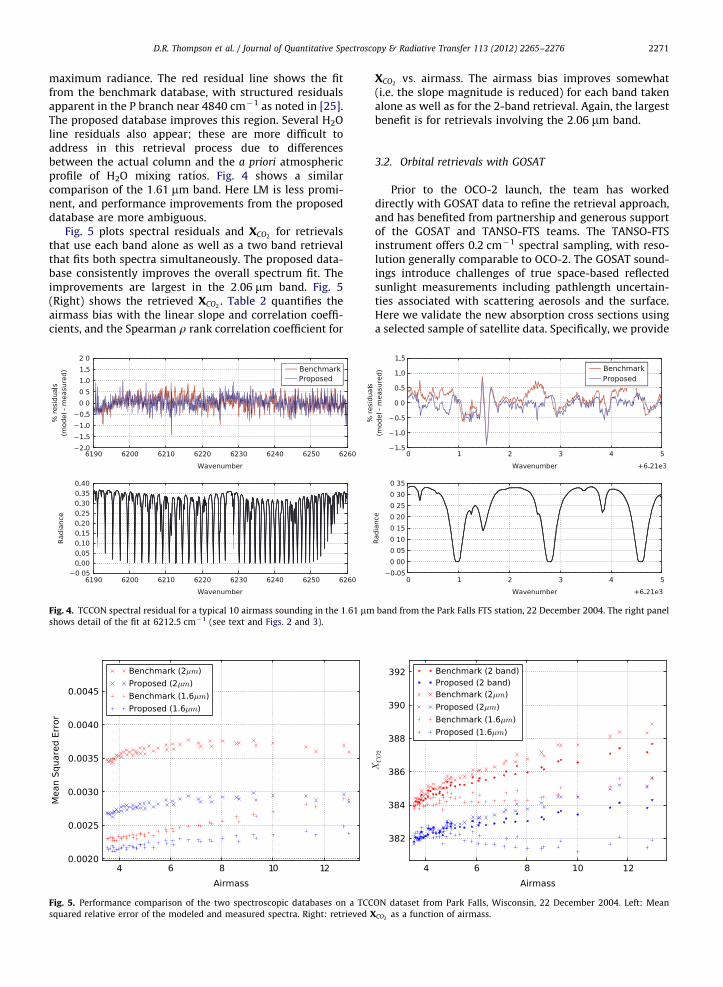
maximum radiance. The red residual line shows the fitfrom the benchmark database, with structured residualsapparent in the P branch near 4840 cm�1 as noted in [25].The proposed database improves this region. Several H2Oline residuals also appear; these are more difficult toaddress in this retrieval process due to differencesbetween the actual column and the a priori atmosphericprofile of H2O mixing ratios. Fig. 4 shows a similarcomparison of the 1:61 mm band. Here LM is less promi-nent, and performance improvements from the proposeddatabase are more ambiguous.
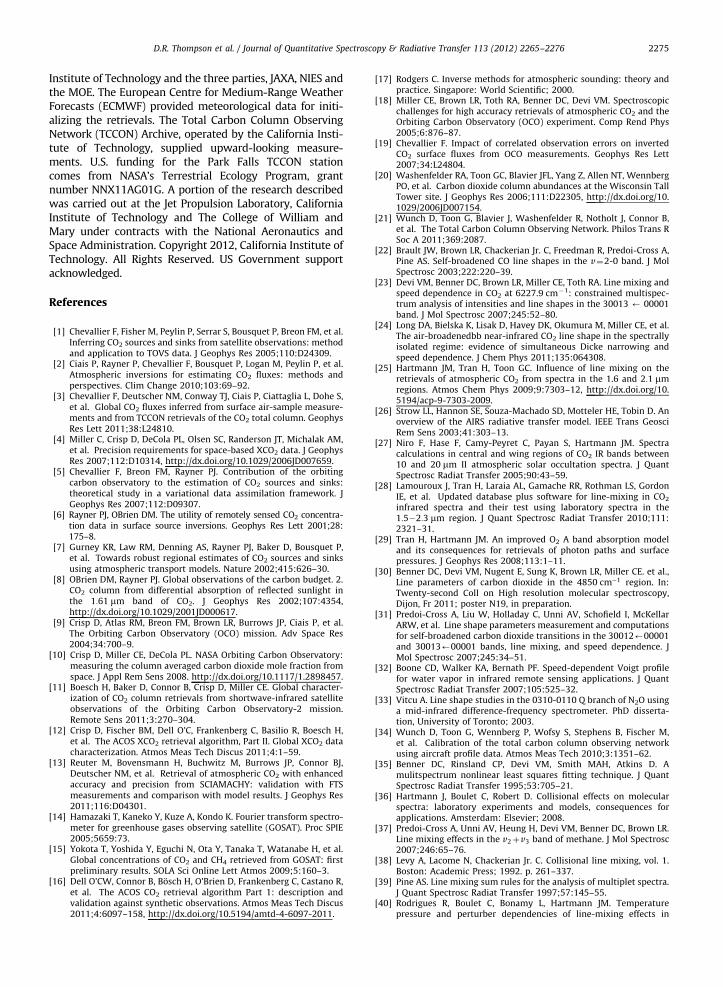
Fig. 5 plots spectral residuals and XCO2for retrievals
that use each band alone as well as a two band retrievalthat fits both spectra simultaneously. The proposed data-base consistently improves the overall spectrum fit. Theimprovements are largest in the 2:06 mm band. Fig. 5(Right) shows the retrieved XCO2
. Table 2 quantifies theairmass bias with the linear slope and correlation coeffi-cients, and the Spearman r rank correlation coefficient for
XCO2vs. airmass. The airmass bias improves somewhat
(i.e. the slope magnitude is reduced) for each band takenalone as well as for the 2-band retrieval. Again, the largestbenefit is for retrievals involving the 2:06 mm band.
3.2. Orbital retrievals with GOSAT
Prior to the OCO-2 launch, the team has workeddirectly with GOSAT data to refine the retrieval approach,and has benefited from partnership and generous supportof the GOSAT and TANSO-FTS teams. The TANSO-FTSinstrument offers 0.2 cm�1 spectral sampling, with reso-lution generally comparable to OCO-2. The GOSAT sound-ings introduce challenges of true space-based reflectedsunlight measurements including pathlength uncertain-ties associated with scattering aerosols and the surface.Here we validate the new absorption cross sections usinga selected sample of satellite data. Specifically, we provide
Fig. 4. TCCON spectral residual for a typical 10 airmass sounding in the 1:61 mm band from the Park Falls FTS station, 22 December 2004. The right panel
shows detail of the fit at 6212.5 cm�1 (see text and Figs. 2 and 3).
Fig. 5. Performance comparison of the two spectroscopic databases on a TCCON dataset from Park Falls, Wisconsin, 22 December 2004. Left: Mean
squared relative error of the modeled and measured spectra. Right: retrieved XCO2as a function of airmass.
D.R. Thompson et al. / Journal of Quantitative Spectroscopy & Radiative Transfer 113 (2012) 2265–2276 2271

retrieval results from a larger dataset consist of GOSATsoundings coincident with the TCCON ground stations,amounting to 425 spectra from orbits spanning multipleyears, continents, and latitudes. These tests utilize thethree-band OCO-2 algorithm which performs a simulta-neous retrieval using both 1:61 mm and 2:06 mm regions.
The O2 spectroscopy is held constant in this experi-ment but we provide details here for completeness(Table 3). Our O2 absorption line parameters are basedon the 2008 HITRAN database detailed by Rothman et al.[45]. Robichaud et al. [49,50] provide line positions andpressure-induced shifts, line intensities, air broadeningand self-broadening parameters. One exception betweenABSCO line parameters and those of the HITRAN 2008are the strong lines of the R branch, for which custompressure-induced shifts were provided by coauthorBrown. We use O2 LM coefficients from the calculationsreferenced in [29]. Collisional narrowing parameters areavailable, but are not used. The OCO-2 retrieval algorithmcurrently exhibits a systematic air pressure error ofapproximately 10 hPa [12]. This is likely related to O2
spectroscopy though retrieval or instrument effects mayalso play a role. As in [51,12], we rescale cross sections bya compensatory factor of 1.025 to remove the mean airpressure bias. This factor was derived from a largerrepresentative dataset and applied to all retrievals in thiscomparison.
Fig. 6 shows the mean spectral residual, e.g. theaverage error combining all soundings. The 2:06 mm bandgenerally corroborates the TCCON result. Fig. 7 shows thatimprovements at 1:61 mm are more ambiguous. Fig. 8compares the goodness of fit scores from each sounding.This plot shows reduced w2 values associated with bothbands of the three-band retrieval. The database with aspeed dependent profile and new LM yields the largestreduction in mean w2 value for the 2:06 mm band, which
drops from 1.09 to 1.00. The change in 1:61 mm isconsistent but the magnitude is much smaller. Dark linesshow the ratio w2 score produced by the proposed para-meters as a fraction of the benchmark score on the samesounding. We plot this distribution on the same axis butwith horizontal values interpreted as a fractional ratio.The proposed parameters reduce the w2 values in the1:61 mm band by about 8% with respect to the benchmark.In the 2:06 mm band, the proposed parameters reduce w2
by 11% with respect to the benchmark.Finally we compare these GOSAT retrievals to coincident
retrievals by the TCCON network. Here we use the dailymean value from the TCCON retrieval algorithm, called GFIT[34], as a reference standard. As noted previously, anupward-looking estimate is intrinsically more accurate thanthe GOSAT result. Moreover, the GFIT TCCON retrievals havebeen extensively validated against in situ profiles providedby aircraft. It is not a perfect ground truth measurementsince diurnal XCO2
variation would cause the GOSAT esti-mate to deviate from the TCCON daily mean even if bothretrievals were perfect. The algorithms also share somepotential sources of bias, such as their a priori atmosphericprofiles. Despite these caveats, a separate retrieval algo-rithm is a valuable check on the orbital XCO2
accuracies.We correct each XCO2
result by a constant factor to zeroout mean bias against TCCON observations. Finally, weapply standard filtering rules from the OCO-2 Level 2algorithm. These rules, detailed by Crisp et al. [12], are aseries of exclusion criteria based on retrieval values suchas w2, retrieved aerosol optical depth and surface pres-sure. These filters exclude data that is contaminated byclouds or other intermittent retrieval failures.
Fig. 9 plots the GOSAT retrievals against the TCCONstandard using each of the spectroscopic databases.Table 4 quantifies the agreement. The overall yield (num-ber of soundings passing the filter rules) increases by 5%,while the average scatter (absolute difference against theTCCON values) decreases from 1.5 to 1.39 ppm. A slightimprovement in the linear correlation score is not sig-nificant for this dataset size. Overall however theseperformance scores are consistent with a slight compara-tive advantage to the new database.
4. Discussion
Benchmark results broadly agree with previous analy-sis of the TCCON dataset that finds persistent structuredresiduals in the 2:06 mm band [25]. The proposed modelparameters further improve the spectrum fit, showingconsistent benefits for multiple instruments and retrievalmethods. These tests span a range of path length,
Table 2Park Falls 22 December 2004 – retrieved XCO2
values vs. airmass, comparing the reference benchmark and proposed line lists.
Result Both bands 2:06 mm 1:61 mm
Benchmark Proposed Benchmark Proposed Benchmark Proposed
Slope 0.355 0.219 0.468 0.376 0.131 �0.101
Corr 0.966 0.941 0.978 0.978 0.972 �0.651
q 0.980 0.962 0.987 0.983 0.738 �0.692
Table 3Parameter sources used for the oxygen A band in GOSAT retrievals.
Parameter 0:76 mm O2
Positions Robichaud [49,50]
Intensities Robichaud [49,50] (see text)
Air-widths Robichaud [49]
Air-shifts Robichaud [49] (see text)
Air-width T dependence Brown [52]
Line shapes Voigt with Line Mixing
Isotopologues Rothman [45]
Air LM Tran [29]
Speed dependence n/a
Continuum CIA via Tran [29]
Collisional narrowing n/a
D.R. Thompson et al. / Journal of Quantitative Spectroscopy & Radiative Transfer 113 (2012) 2265–22762272

Fig. 6. Mean residuals in the 2:06 mm band for 425 GOSAT soundings covering a wide range of latitudes. As in Fig. 3, we compare the benchmark database
of Lamouroux et al. [28] against the multispectrum retrieval of Benner et al. [30] using Speed Dependence with tridiagonal Line Mixing. The right panel
shows a detailed view of the same mean residual.
Fig. 7. Spectral residuals, similar to Fig. 6 but for the 1:61 mm region. The retrieval itself used all three OCO-2 bands.
Fig. 8. Spectral residuals, showing the w2 values for both bands of the three-band retrieval. The mean w2 value drops from 1.09 to 1.00 in the 2:06 mm band
after moving to the proposed database with a speed dependent line profile and tridiagonal mixing. The mean w2 also drops in the 1:61 mm band but the change
is not as significant. Dark lines show the ratio of error scores (specifically, each sounding’s w2 using the proposed parameters as a fraction of the sounding’s w2
score using the benchmark parameters). These are plotted on the same axis, but horizontal values are interpreted as a fractional ratio. The mean ratio in the
1:61 mm band is 0.972 (s¼ 0:011), and the ratio in the 2:06 mm band is 0.882 (s¼ 0:047). The improvement is significant in both bands.
D.R. Thompson et al. / Journal of Quantitative Spectroscopy & Radiative Transfer 113 (2012) 2265–2276 2273

temperature, and atmospheric conditions as well asdifferent instrumental effects like saturation level, spec-tral resolution, and signal to noise ratios. The newdatabase reduces spectral residuals while improving w2
goodness-of-fit. It increases the OCO-2 algorithm retrievalyield, and improves agreement with third-party XCO2
estimates from a network of ground stations. On average,the new GOSAT retrieval predictions differ by 0.234 ppmwhich is a meaningful portion of the OCO-2 error budget.Such tests favor the new database over the alternativescurrently available. Consequently the changes describedhere have been incorporated into the standard OCO-2processing pipeline, where they have produced similarimprovements in converged w2 goodness of fit values.Ultimately sub-percent retrieval accuracy for remotesensing demands significant refinement of existing spec-troscopy, to which non-Voigt line shapes are a first step.
Despite these improvements the model does not fullyachieve OCO-2 spectroscopic goals. First, systematic struc-tures remain in 2:06 mm band retrievals at the 0.5% level,beyond desired accuracy limits. These structures could berelated to unmodeled effects such as Dicke narrowing,temperature dependence of line mixing, or sources ofcontinuum absorption not included here. The multispec-trum fits used to derive line parameters do not yet resolvesuch phenomena. An asymmetric structure at the bandcenter could be related to broad continuum-level effects,but its lack of alignment with known CIA continua [28] may
be more consistent with line shape or line mixing inaccura-cies. Such spectroscopic residuals may contribute to anairmass dependence that remains even under the bestatmospheric retrieval conditions (e.g. TCCON data collectedon dry days). The ‘‘glint’’ mode of OCO-2 will enable high-SNR retrievals with very high airmasses, magnifying anyairmass dependence in CO2 spectroscopy.
The spectral fit improvements described here have donelittle to ameliorate this airmass dependence, which is con-sistent with other bottlenecks in the XCO2
estimate beyondCO2 line shape. Other contributors may include the solarspectrum model, atmospheric profile differences from theECMWF prior, path-dependent differences in isotopic frac-tionation, and continuum-level absorption due to dimers orinterferences. We cannot exclude these other effects, nor canwe ignore line shape inaccuracies while systematic residualsremain.
5. Conclusions
We describe a direct retrieval of tridiagonal relaxationmatrix elements and line shape parameters simultaneously,which significantly reduces the structured residuals seen atatmospheric optical depths. The best fits use a speed depen-dent line shape, which is consistent with laboratory results.
While our comparison cannot conclusively attributeperformance to a specific physical model or line shape, itunderscores the influence of line shapes and line mixingparameterization on the retrieval. For OCO-2, attention tothese factors is crucial to achieve the 1 ppm accuraciesneeded to identify sources and sinks on a global scale. TheTCCON network of FTIR spectrometers provides invalu-able validation because its high SNR and spectral resolu-tion observations can use long optical path lengths toachieve a large range of opacities. Atmospheric spectrafrom both ground-based (upward-looking) and orbiting(downward-looking) sensors can validate the spectro-scopy required for OCO-2 glint observations, providedthe same molecular line profiles are applied in all cases.
The tests described here have implications for spectro-scopic remote sensing in general. The atmospheric com-munity has begun to employ some non-Voigt line shapes,such as the speed dependent Voigt for H2O [53]. It hasalso considered line mixing for CO2 [25]. It is generallyacknowledged that reaching sub-1% accuracies in atmo-spheric retrievals will require substantially improvedlaboratory results [54]. Future progress depends on cor-rect understanding of molecular line shapes and having aconsistent set of accurate line parameters.
Acknowledgments
We thank the OCO-2 ACOS Level 2 algorithm teamincluding Annmarie Eldering, Vivienne Payne and MichaelGunson. We thank the members of the OCO-2 scienceteam including Eli Mlawer and Iouli Gordon. We have alsobenefited from the counsel of Mitchio Okumura, JosephHodges, and David Long. GOSAT TANSO-FTS spectra wereprovided to the ACOS Team through a GOSAT ResearchAnnouncement (RA) agreement between the California
Fig. 9. Comparison of XCO2retrievals from the GOSAT satellite with
estimates by the Total Column Carbon Observing Network (TCCON).
Table 4Comparison of GOSAT soundings against coincident TCCON mean daily
XCO2observations.
Result Benchmark Proposed
Successful retrievals 279 (65.6%) 300 (70.6%)
XCO2scatter 1.50 ppm 1.39 ppm
Correlation 0.767 0.781
D.R. Thompson et al. / Journal of Quantitative Spectroscopy & Radiative Transfer 113 (2012) 2265–22762274
Institute of Technology and the three parties, JAXA, NIES andthe MOE. The European Centre for Medium-Range WeatherForecasts (ECMWF) provided meteorological data for initi-alizing the retrievals. The Total Carbon Column ObservingNetwork (TCCON) Archive, operated by the California Insti-tute of Technology, supplied upward-looking measure-ments. U.S. funding for the Park Falls TCCON stationcomes from NASA’s Terrestrial Ecology Program, grantnumber NNX11AG01G. A portion of the research describedwas carried out at the Jet Propulsion Laboratory, CaliforniaInstitute of Technology and The College of William andMary under contracts with the National Aeronautics andSpace Administration. Copyright 2012, California Institute ofTechnology. All Rights Reserved. US Government supportacknowledged.
References
[1] Chevallier F, Fisher M, Peylin P, Serrar S, Bousquet P, Breon FM, et al.Inferring CO2 sources and sinks from satellite observations: methodand application to TOVS data. J Geophys Res 2005;110:D24309.
[2] Ciais P, Rayner P, Chevallier F, Bousquet P, Logan M, Peylin P, et al.Atmospheric inversions for estimating CO2 fluxes: methods andperspectives. Clim Change 2010;103:69–92.
[3] Chevallier F, Deutscher NM, Conway TJ, Ciais P, Ciattaglia L, Dohe S,et al. Global CO2 fluxes inferred from surface air-sample measure-ments and from TCCON retrievals of the CO2 total column. GeophysRes Lett 2011;38:L24810.
[4] Miller C, Crisp D, DeCola PL, Olsen SC, Randerson JT, Michalak AM,et al. Precision requirements for space-based XCO2 data. J GeophysRes 2007;112:D10314, http://dx.doi.org/10.1029/2006JD007659.
[5] Chevallier F, Breon FM, Rayner PJ. Contribution of the orbitingcarbon observatory to the estimation of CO2 sources and sinks:theoretical study in a variational data assimilation framework. JGeophys Res 2007;112:D09307.
[6] Rayner PJ, OBrien DM. The utility of remotely sensed CO2 concentra-tion data in surface source inversions. Geophys Res Lett 2001;28:175–8.
[7] Gurney KR, Law RM, Denning AS, Rayner PJ, Baker D, Bousquet P,et al. Towards robust regional estimates of CO2 sources and sinksusing atmospheric transport models. Nature 2002;415:626–30.
[8] OBrien DM, Rayner PJ. Global observations of the carbon budget. 2.CO2 column from differential absorption of reflected sunlight inthe 1:61 mm band of CO2. J Geophys Res 2002;107:4354,http://dx.doi.org/10.1029/2001JD000617.
[9] Crisp D, Atlas RM, Breon FM, Brown LR, Burrows JP, Ciais P, et al.The Orbiting Carbon Observatory (OCO) mission. Adv Space Res2004;34:700–9.
[10] Crisp D, Miller CE, DeCola PL. NASA Orbiting Carbon Observatory:measuring the column averaged carbon dioxide mole fraction fromspace. J Appl Rem Sens 2008. http://dx.doi.org/10.1117/1.2898457.
[11] Boesch H, Baker D, Connor B, Crisp D, Miller CE. Global character-ization of CO2 column retrievals from shortwave-infrared satelliteobservations of the Orbiting Carbon Observatory-2 mission.Remote Sens 2011;3:270–304.
[12] Crisp D, Fischer BM, Dell O’C, Frankenberg C, Basilio R, Boesch H,et al. The ACOS XCO2 retrieval algorithm, Part II. Global XCO2 datacharacterization. Atmos Meas Tech Discus 2011;4:1–59.
[13] Reuter M, Bovensmann H, Buchwitz M, Burrows JP, Connor BJ,Deutscher NM, et al. Retrieval of atmospheric CO2 with enhancedaccuracy and precision from SCIAMACHY: validation with FTSmeasurements and comparison with model results. J Geophys Res2011;116:D04301.
[14] Hamazaki T, Kaneko Y, Kuze A, Kondo K. Fourier transform spectro-meter for greenhouse gases observing satellite (GOSAT). Proc SPIE2005;5659:73.
[15] Yokota T, Yoshida Y, Eguchi N, Ota Y, Tanaka T, Watanabe H, et al.Global concentrations of CO2 and CH4 retrieved from GOSAT: firstpreliminary results. SOLA Sci Online Lett Atmos 2009;5:160–3.
[16] Dell O’CW, Connor B, Bosch H, O’Brien D, Frankenberg C, Castano R,et al. The ACOS CO2 retrieval algorithm Part 1: description andvalidation against synthetic observations. Atmos Meas Tech Discus2011;4:6097–158, http://dx.doi.org/10.5194/amtd-4-6097-2011.
[17] Rodgers C. Inverse methods for atmospheric sounding: theory andpractice. Singapore: World Scientific; 2000.
[18] Miller CE, Brown LR, Toth RA, Benner DC, Devi VM. Spectroscopicchallenges for high accuracy retrievals of atmospheric CO2 and theOrbiting Carbon Observatory (OCO) experiment. Comp Rend Phys2005;6:876–87.
[19] Chevallier F. Impact of correlated observation errors on invertedCO2 surface fluxes from OCO measurements. Geophys Res Lett2007;34:L24804.
[20] Washenfelder RA, Toon GC, Blavier JFL, Yang Z, Allen NT, WennbergPO, et al. Carbon dioxide column abundances at the Wisconsin TallTower site. J Geophys Res 2006;111:D22305, http://dx.doi.org/10.1029/2006JD007154.
[21] Wunch D, Toon G, Blavier J, Washenfelder R, Notholt J, Connor B,et al. The Total Carbon Column Observing Network. Philos Trans RSoc A 2011;369:2087.
[22] Brault JW, Brown LR, Chackerian Jr. C, Freedman R, Predoi-Cross A,Pine AS. Self-broadened CO line shapes in the v¼2-0 band. J MolSpectrosc 2003;222:220–39.
[23] Devi VM, Benner DC, Brown LR, Miller CE, Toth RA. Line mixing andspeed dependence in CO2 at 6227.9 cm�1: constrained multispec-trum analysis of intensities and line shapes in the 30013 ’ 00001band. J Mol Spectrosc 2007;245:52–80.
[24] Long DA, Bielska K, Lisak D, Havey DK, Okumura M, Miller CE, et al.The air-broadenedbb near-infrared CO2 line shape in the spectrallyisolated regime: evidence of simultaneous Dicke narrowing andspeed dependence. J Chem Phys 2011;135:064308.
[25] Hartmann JM, Tran H, Toon GC. Influence of line mixing on theretrievals of atmospheric CO2 from spectra in the 1.6 and 2:1 mmregions. Atmos Chem Phys 2009;9:7303–12, http://dx.doi.org/10.5194/acp-9-7303-2009.
[26] Strow LL, Hannon SE, Souza-Machado SD, Motteler HE, Tobin D. Anoverview of the AIRS radiative transfer model. IEEE Trans GeosciRem Sens 2003;41:303–13.
[27] Niro F, Hase F, Camy-Peyret C, Payan S, Hartmann JM. Spectracalculations in central and wing regions of CO2 IR bands between10 and 20 mm II atmospheric solar occultation spectra. J QuantSpectrosc Radiat Transfer 2005;90:43–59.
[28] Lamouroux J, Tran H, Laraia AL, Gamache RR, Rothman LS, GordonIE, et al. Updated database plus software for line-mixing in CO2
infrared spectra and their test using laboratory spectra in the1:522:3 mm region. J Quant Spectrosc Radiat Transfer 2010;111:2321–31.
[29] Tran H, Hartmann JM. An improved O2 A band absorption modeland its consequences for retrievals of photon paths and surfacepressures. J Geophys Res 2008;113:1–11.
[30] Benner DC, Devi VM, Nugent E, Sung K, Brown LR, Miller CE. et al.,Line parameters of carbon dioxide in the 4850 cm�1 region. In:Twenty-second Coll on High resolution molecular spectroscopy,Dijon, Fr 2011; poster N19, in preparation.
[31] Predoi-Cross A, Liu W, Holladay C, Unni AV, Schofield I, McKellarARW, et al. Line shape parameters measurement and computationsfor self-broadened carbon dioxide transitions in the 30012’00001and 30013’00001 bands, line mixing, and speed dependence. JMol Spectrosc 2007;245:34–51.
[32] Boone CD, Walker KA, Bernath PF. Speed-dependent Voigt profilefor water vapor in infrared remote sensing applications. J QuantSpectrosc Radiat Transfer 2007;105:525–32.
[33] Vitcu A. Line shape studies in the 0310-0110 Q branch of N2O usinga mid-infrared difference-frequency spectrometer. PhD disserta-tion, University of Toronto; 2003.
[34] Wunch D, Toon G, Wennberg P, Wofsy S, Stephens B, Fischer M,et al. Calibration of the total carbon column observing networkusing aircraft profile data. Atmos Meas Tech 2010;3:1351–62.
[35] Benner DC, Rinsland CP, Devi VM, Smith MAH, Atkins D. Amulitspectrum nonlinear least squares fitting technique. J QuantSpectrosc Radiat Transfer 1995;53:705–21.
[36] Hartmann J, Boulet C, Robert D. Collisional effects on molecularspectra: laboratory experiments and models, consequences forapplications. Amsterdam: Elsevier; 2008.
[37] Predoi-Cross A, Unni AV, Heung H, Devi VM, Benner DC, Brown LR.Line mixing effects in the v2þv3 band of methane. J Mol Spectrosc2007;246:65–76.
[38] Levy A, Lacome N, Chackerian Jr. C. Collisional line mixing, vol. 1.Boston: Academic Press; 1992. p. 261–337.
[39] Pine AS. Line mixing sum rules for the analysis of multiplet spectra.J Quant Spectrosc Radiat Transfer 1997;57:145–55.
[40] Rodrigues R, Boulet C, Bonamy L, Hartmann JM. Temperaturepressure and perturber dependencies of line-mixing effects in
D.R. Thompson et al. / Journal of Quantitative Spectroscopy & Radiative Transfer 113 (2012) 2265–2276 2275

CO2 infrared spectra. II. Rotational angular momentum relaxationand spectral shift in S’S bands. J Chem Phys 1998;109:3037–47.
[41] Priem D, Rohart F, Colmont JM, Wlodarczak G, Bouanich JP. Line-shape study of the J¼ 3’2 rotational transition of CO perturbed byN2 and O2. J Mol Struct 2000;517:435–54.
[42] Pine AS, Ciurylo R. Multispectrum fits of Ar-broadened HF with ageneralized asymmetric lineshape: effects of correlation, hardness,speed dependence, and collision duration. J Mol Spectrosc2001;208:180–7.
[43] Predoi-Cross A, McKellar ARW, Benner DC, Devi VM, Gamache RR,Miller CE, et al. Temperature dependences for air-broadenedLorentz half-width and pressure shift coefficients in the30013’00001 and 30012’00001 bands of CO2 near 1600 nm.Can J Phys 2009;87:517–35.
[44] Toth RA, Brown LR, Miller CE, Devi VM, Benner DC. Spectroscopicdatabase of CO2 line parameters: 4300–7000 cm�1. J Quant Spec-trosc Radiat Transfer 2008;109:906–21.
[45] Rothman LE, Gordon IE, Barbe A, Benner DC, Bernath PF, Birk M,et al. HITRAN 2008 molecular spectroscopic database. J QuantSpectrosc Radiat Transfer 2009;110:533–72.
[46] Sung K, Brown LR, Toth RA, Crawford TJ. FT-IR measurements ofH2O-broadened half-widths of CO2 at 43 mm. Can J Phys 2009;87:469–84.
[47] Spurr R. Code for Direct Beam Attenuation.Jet Propulsion Labora-tory, California Institute of Technology, Personal Communicationvia Vijay Natraj; 2011.
[48] Niro F, Boulet C, Hartmann JM. Spectra calculations in central andwing regions of CO2 IR bands between 10 and 20 mm. I: Model and
laboratory measurements. J Quant Spectrosc Radiat Transfer2004;88:483–98.
[49] Robichaud DJ, Hodges JT, Brown LR, Lisak D, Maslowski P, Yeung LY,et al. Experimental intensity and lineshape parameters of theoxygen A-band using frequency-stabilized cavity ring-down spec-
troscopy. J Mol Spectrosc 2008;248:1–13.[50] Robichaud DJ, Hodges JT, Maslowski P, Yeung LY, Okumura M,
Miller CE, et al. High-accuracy transition frequencies for the O2 A-band. J Mol Spectrosc 2008;251:27–37.
[51] Butz A, Guerlet S, Hasekamp O, Schepers D, Galli A, Aben I, et al.Toward accurate CO2 and CH4 observations from GOSAT. GeophysRes Lett 2011;38:L14812.
[52] Brown LR, Plymate C. Experimental line parameters of the oxygen Aband at 760 nm. J Mol Spectrosc 2000;199:166–79.
[53] Schneider M, Hase F, Blavier JF, Toon GC, Leblanc T. An empiricalstudy on the importance of a speed-dependent voigt line shape
model for tropospheric water vapor profile remote sensing. J QuantSpectrosc Radiat Transfer 2010;112:465–74.
[54] Harrison JJ, Bernath PF, Kirchengast G. Spectroscopic requirementsfor accurate, a microwave and infrared-laser occultation satellitemission. J Quant Spectrosc Radiat Transfer 2011;112:2347–54.
D.R. Thompson et al. / Journal of Quantitative Spectroscopy & Radiative Transfer 113 (2012) 2265–22762276