Atmospheric Mercury Measurements and Modeling at NOAA’s ...
69
Atmospheric Mercury Measurements and Modeling at NOAA’s Air Resources Laboratory Mark Cohen, Winston Luke, Paul Kelley, Roland Draxler, Fantine Ngan, and Richard Artz NOAA Air Resources Laboratory, Silver Spring, MD, http://www.arl.noaa.gov/mercury.php Presentation at: NCAS Annual Science Meeting April 15, 2010 at the NOAA Silver Spring Campus
Transcript of Atmospheric Mercury Measurements and Modeling at NOAA’s ...

Atmospheric Mercury Measurements and Modeling
at NOAA’s Air Resources Laboratory
Mark Cohen, Winston Luke, Paul Kelley,
Roland Draxler, Fantine Ngan, and Richard Artz
NOAA Air Resources Laboratory, Silver Spring, MD, http://www.arl.noaa.gov/mercury.php
Presentation at:
NCAS Annual Science Meeting
April 15, 2010
at the NOAA Silver Spring Campus
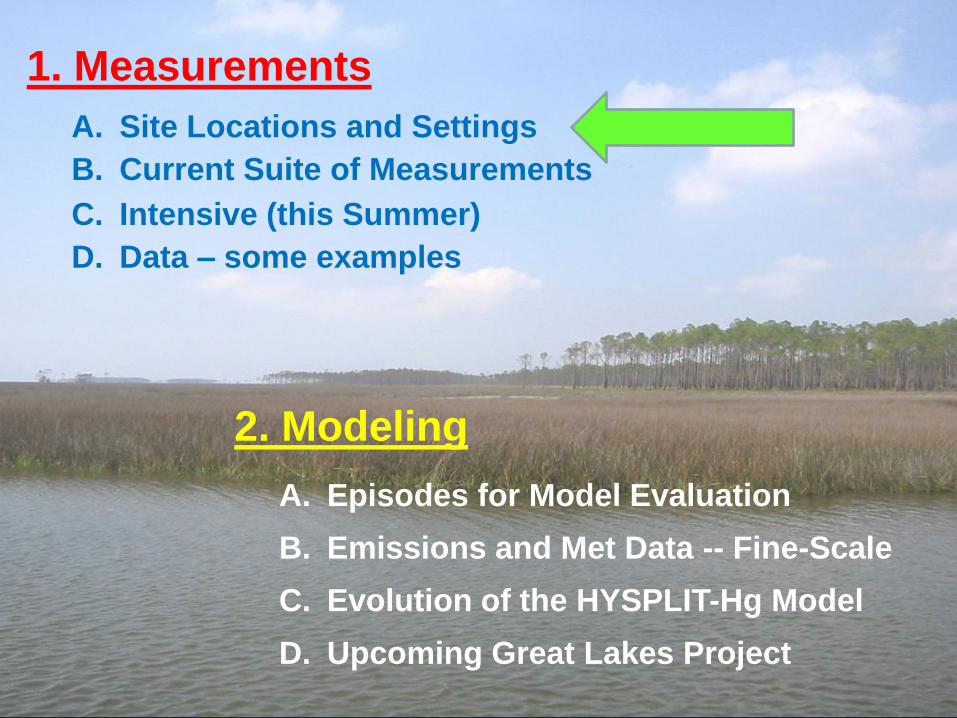
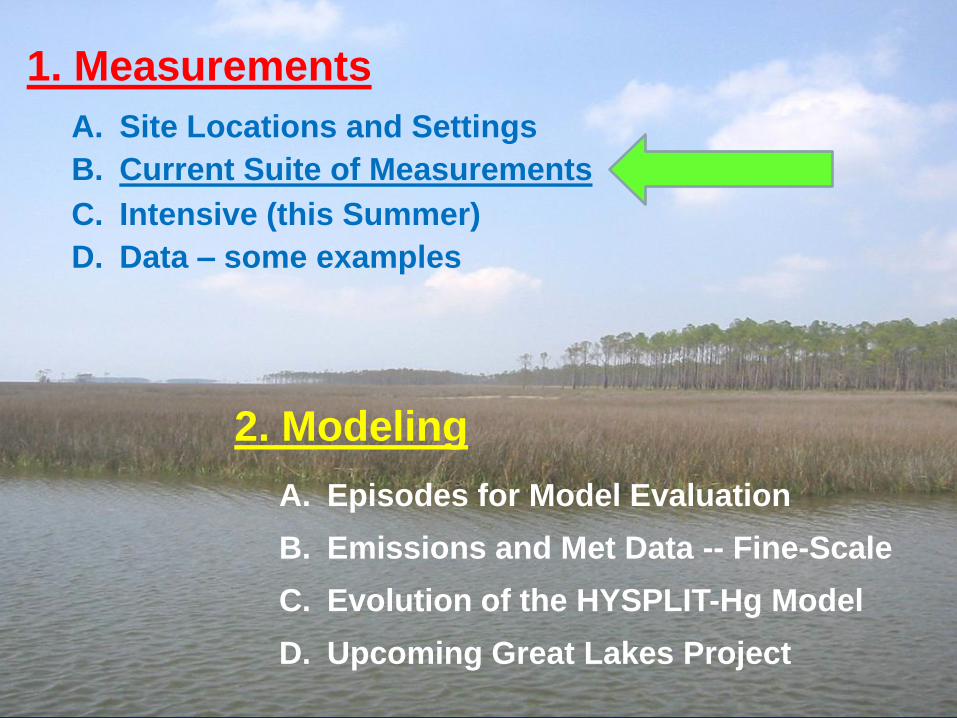
1. Measurements
A. Site Locations and Settings
B. Current Suite of Measurements
C. Intensive (this Summer)
D. Data – some examples
2. Modeling
A. Episodes for Model Evaluation
B. Emissions and Met Data -- Fine-Scale
D. Upcoming Great Lakes Project
C. Evolution of the HYSPLIT-Hg Model
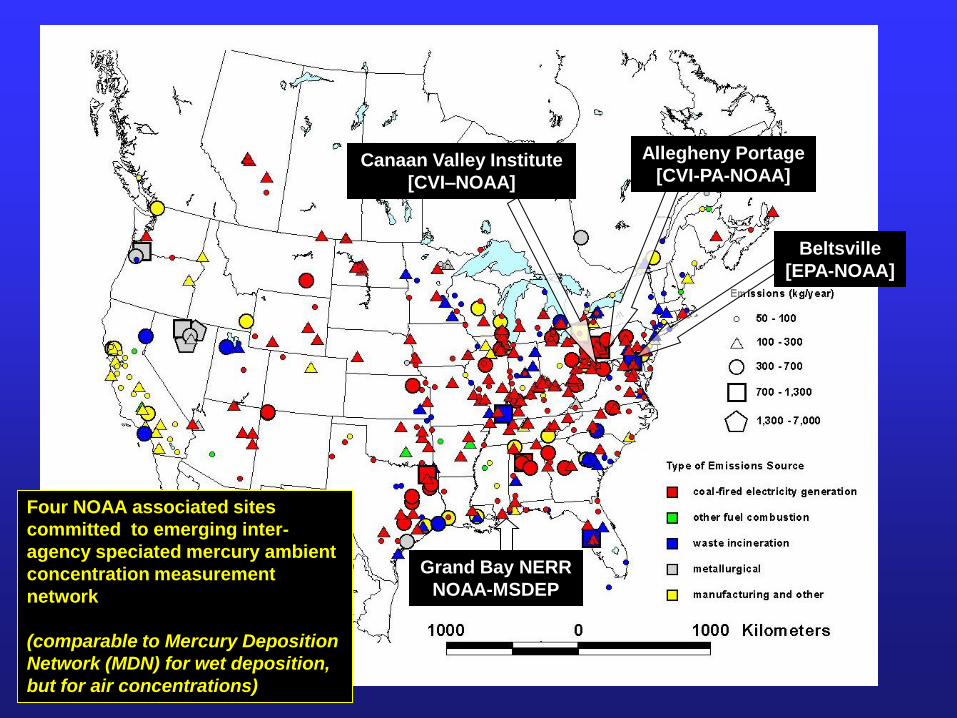
Canaan Valley Institute
[CVI–NOAA]
Beltsville
[EPA-NOAA]
Four NOAA associated sites
committed to emerging inter-
agency speciated mercury ambient
concentration measurement
network
(comparable to Mercury Deposition
Network (MDN) for wet deposition,
but for air concentrations)
Grand Bay NERR
NOAA-MSDEP
Allegheny Portage
[CVI-PA-NOAA]
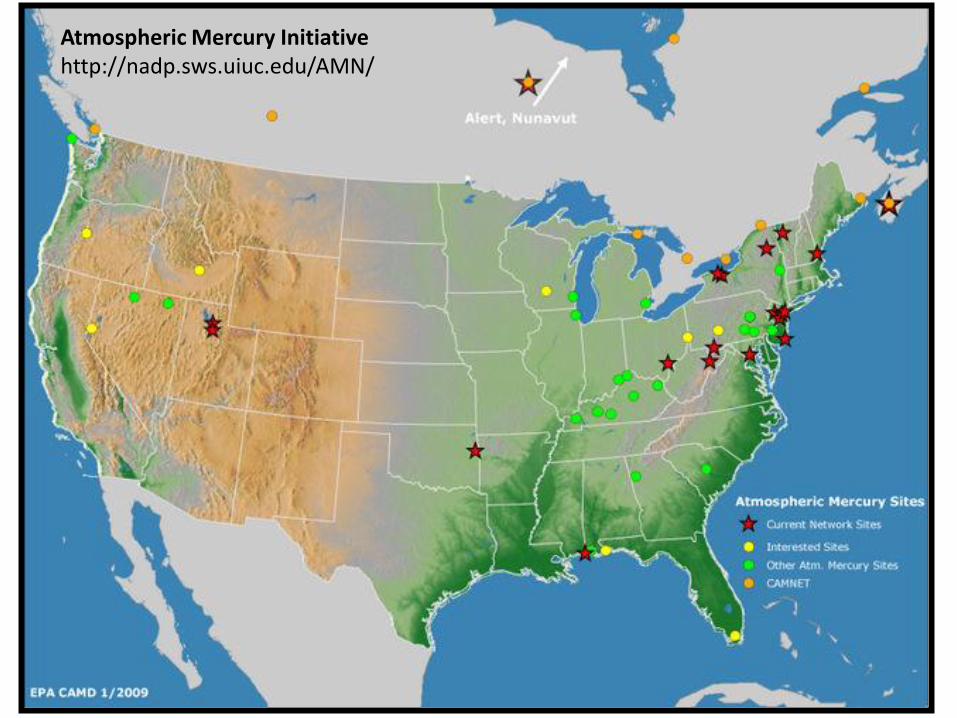
Atmospheric Mercury Initiativehttp://nadp.sws.uiuc.edu/AMN/

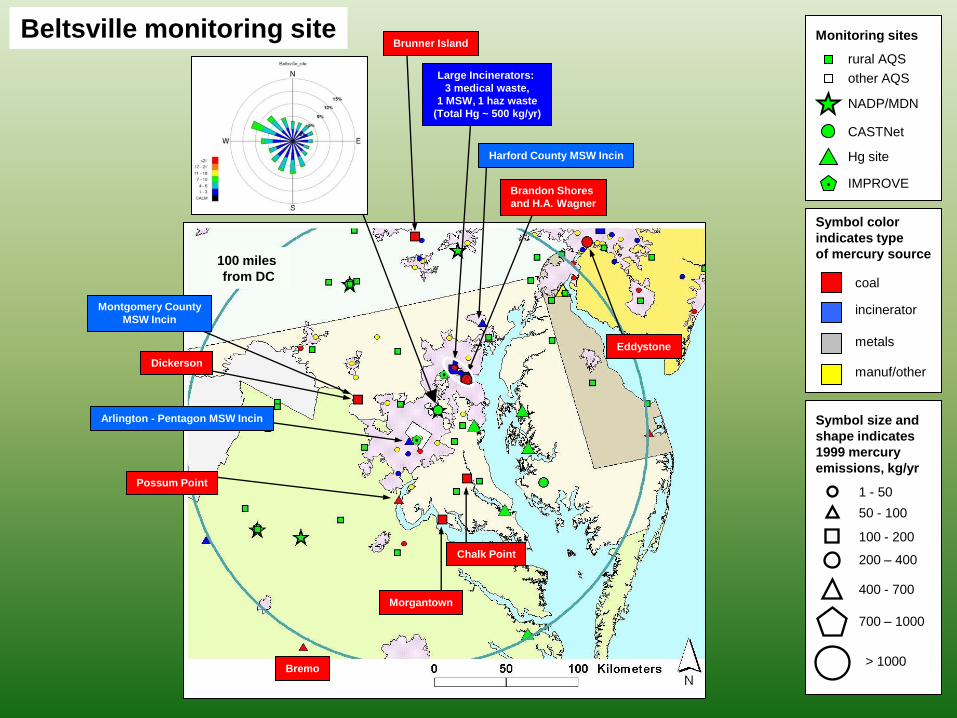
Beltsville, Maryland
Co-located with the EPA’s CASTNet site,
and the Beltsville NTN and MDN sites
coal
incinerator
metals
manuf/other
Symbol color
indicates type
of mercury source
1 - 50
50 - 100
100 - 200
200 – 400
400 - 700
700 – 1000
> 1000
Symbol size and
shape indicates
1999 mercury
emissions, kg/yr
rural AQS
NADP/MDN
CASTNet
IMPROVE
Monitoring sites
other AQS
Hg site
100 miles
from DC
Bremo
Beltsville monitoring site
Morgantown
Chalk Point
Dickerson
Possum Point
Large Incinerators:
3 medical waste,
1 MSW, 1 haz waste
(Total Hg ~ 500 kg/yr)
Brunner Island
Eddystone
Arlington - Pentagon MSW Incin
Brandon Shores
and H.A. Wagner
Montgomery County
MSW Incin
Harford County MSW Incin
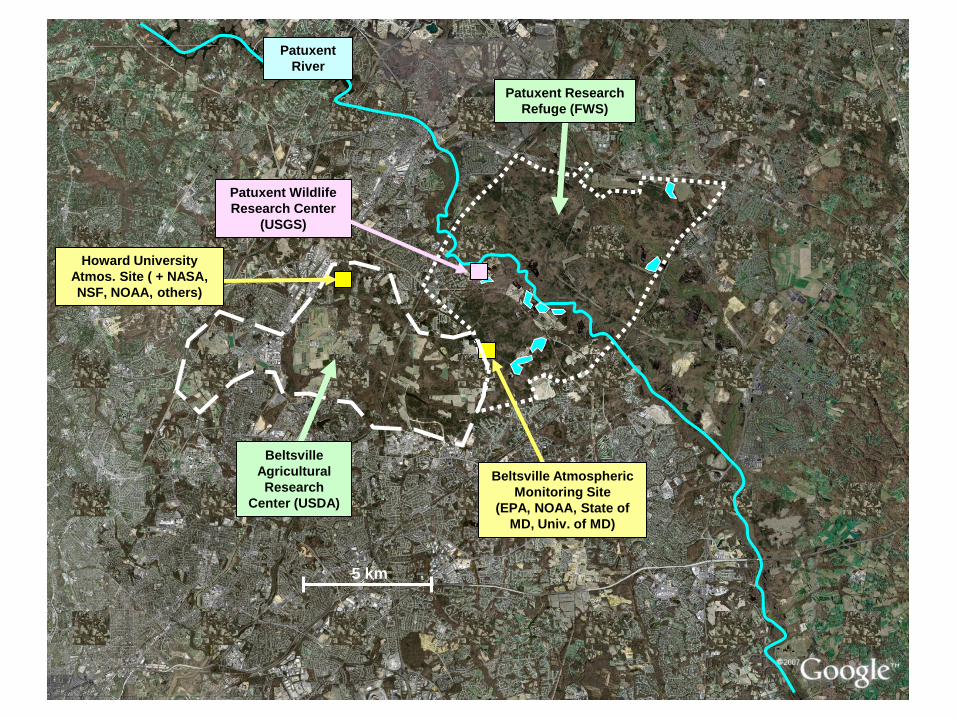
5 km
Patuxent
River
Beltsville Atmospheric
Monitoring Site
(EPA, NOAA, State of
MD, Univ. of MD)
Patuxent Research
Refuge (FWS)
Patuxent Wildlife
Research Center
(USGS)
Beltsville
Agricultural
Research
Center (USDA)
Howard University
Atmos. Site ( + NASA,
NSF, NOAA, others)

ARL’s Winston Luke working with
RGM and Hg(p) collectors
Atmospheric Mercury Measurement Site at Beltsville, MD
mercury and trace gas
monitoring tower (10 meters)
After RGM and Hg(p) is
collected, it is desorbed
and analyzed inside the
trailer, along with Hg(0)
Top of tower (close-up)
with two sets of RGM
and Hg(p) collectors
Precipitation measurements (left to right):
Mercury Deposition Network,
Major Ions (e.g.”acid rain”),
Precipitation Amount
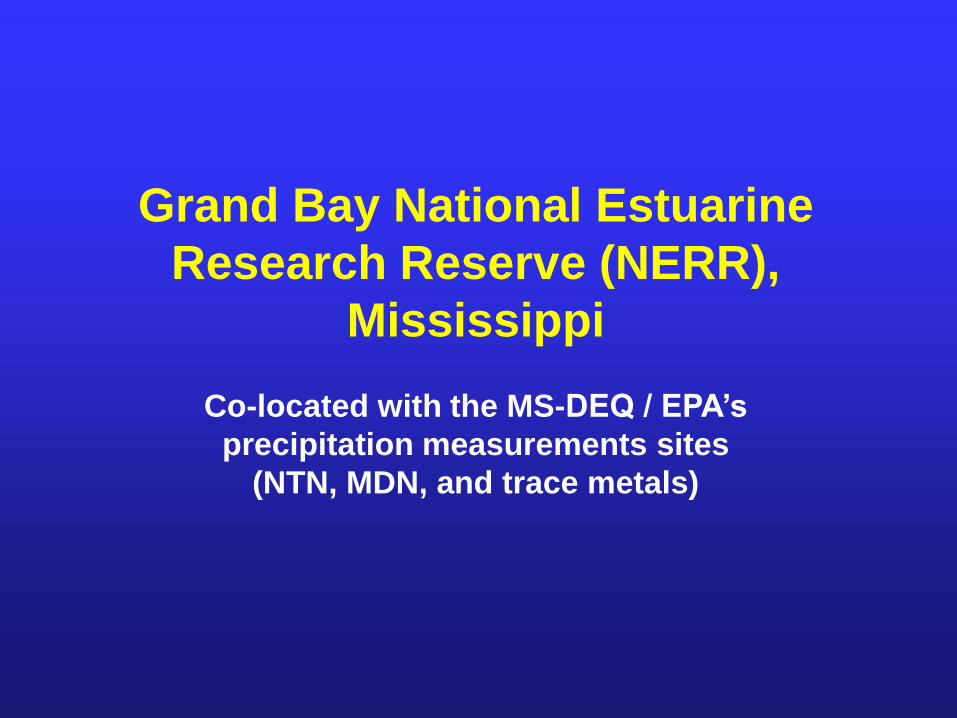
Grand Bay National Estuarine
Research Reserve (NERR),
Mississippi
Co-located with the MS-DEQ / EPA’s
precipitation measurements sites
(NTN, MDN, and trace metals)

color of symbol denotes
type of mercury source
coal-fired power plants
other fuel combustion
waste incineration
metallurgical
manufacturing & other
size/shape of symbol
denotes amount of Reactive
Gaseous Mercury (RGM)
emitted during 2002 (kg/yr)
10 - 50
50 - 100
100 – 300
5 - 10
urban areas
Grand Bay
NERR
monitoring site
Watson
Daniel
Barry
Lowman
CristMobile
Pensacola
Mississippi Alabama
Florida
Louisiana
Pascagoula
MSW
incinerator **
Brewton
paper mill*
* Brewton paper mill mercury emissions included in 2002 NEI, but do not appear to be in 2000-2008 TRI
** Pascagoula MSW incinerator mercury emissions included in 2002 NEI but incineration ceased in Jan 2001
*** Ipsco Steel had significant mercury emissions in 2002 NEI, but negligible emissions reported in 2008 TRI
Eaton
Gaylord
Container
Bogalusa
IPSCO Steel ***
Biloxi-
Gulfport
New Orleans
Hattiesburg
Slidell
Pascagoula
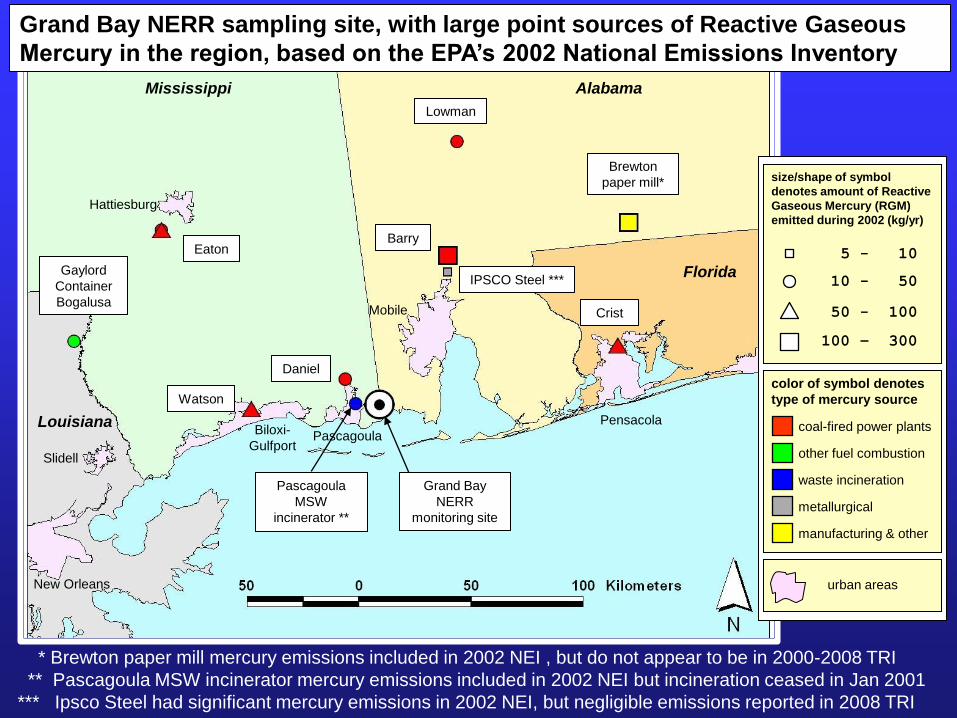
Grand Bay NERR sampling site, with large point sources of Reactive Gaseous
Mercury in the region, based on the EPA’s 2002 National Emissions Inventory
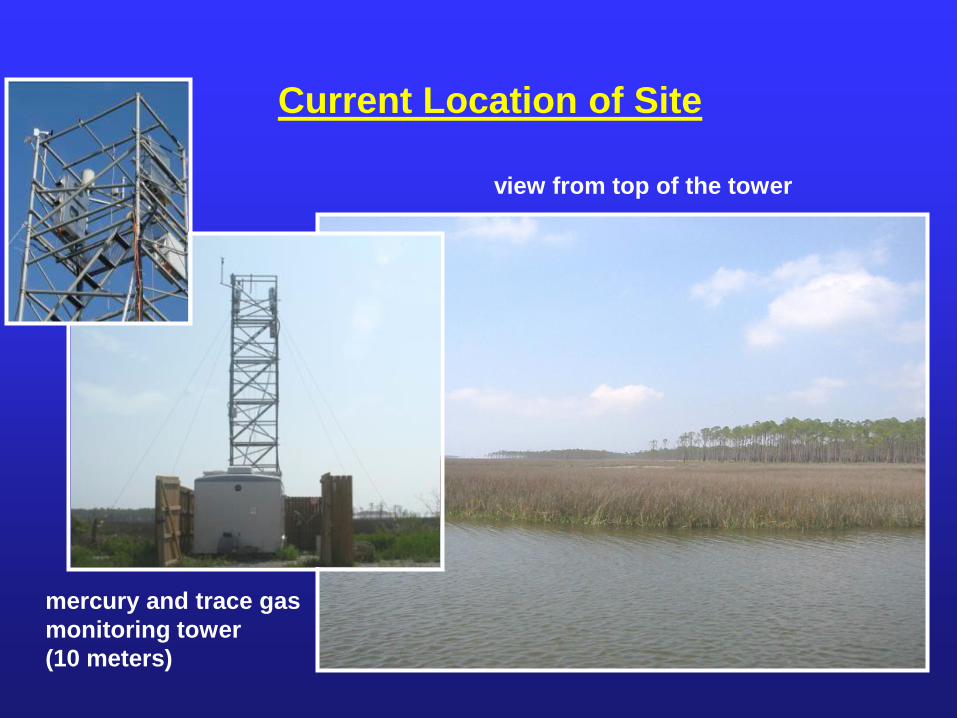
view from top of the tower
mercury and trace gas
monitoring tower
(10 meters)
Current Location of Site

Winston Luke (Principal Investigator, NOAA – Air Resources Laboratory) and
Jake Walker (site operator, Grand Bay National Estuarine Research Reserve)
“Hmmm…maybe it would work better if we have the tower go vertical?”

Elemental mercury (two instruments)
Fine particulate mercury (two instruments)
Reactive gaseous mercury (two instruments)
Sulfur dioxide
Ozone
Carbon Monoxide
Nitrogen Oxides (NO, NOy)
Aerosol Black Carbon
Wind speed, Wind Direction
Temperature, Relative Humidity
Precipitation Amount
“Speciated”
Atmospheric Mercury
Concentrations
Trace gases and other
measurements to help
understand and
interpret mercury data
Meteorological Data
Current Atmospheric Measurements
at the Grand Bay NERR

Instrumentation inside the trailer
at the Grand Bay NERR site

2005
2006
2007
2008
2009
2010
2005-2006:
site selection
Jan 2008:
NO/NOy
added
Feb 2007: Meteorological
measurements added
Aug 21 – Oct 5, 2008:
site shut down due to
threat of hurricanes
2010: Wet
Deposition
measurements
being added
Summer 2010:
Field Intensive
(being planned)
Jan 2010:
Black
Carbon
added
Oct 2007:
Move to “coastal”
site near Pavillion;
2nd Tekran speciated Hg
measurement suite added
Sept 2006:
Speciated Hg,
SO2, O3, and CO
measurements begin
at “inland” site
Timeline of Site Activities at the Grand Bay NERR

Wet Deposition Measurements Being Added in 2010
by the Mississippi Department of Environmental Protection
(Henry Folmar, Becky Comyns, others), with funding from the EPA
PrecipitationContinuous digital measurement of
precipitation amount
Major IonspH, SO4
-2, NO3-, PO4
-3, Cl-,
NH4+, Ca+2, Mg+2, K+, Na+
Weekly measurements of concentrations in
precipitation (NADP-NTN)
Total MercuryWeekly measurements of concentration in
precipitation (NADP-MDN)
Methyl MercuryMonthly measurements of concentration in
precipitation (composite)
Selected Trace MetalsAs, Cd, Cr, Cu, Pb, Ni, Se, Zn
Weekly measurements of concentrations in
precipitation
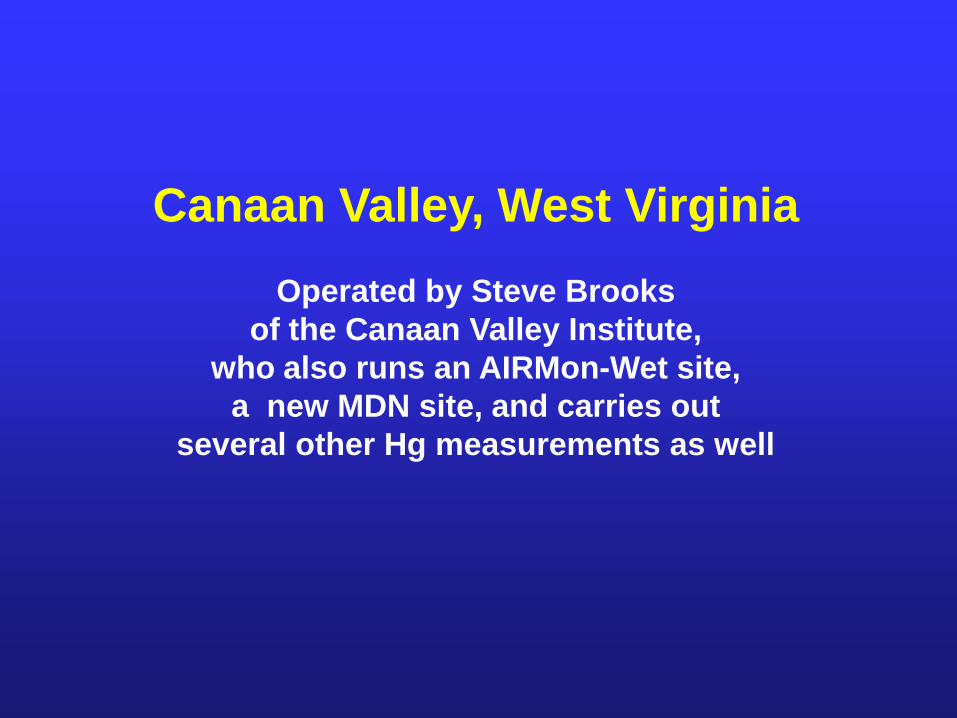
Canaan Valley, West Virginia
Operated by Steve Brooks
of the Canaan Valley Institute,
who also runs an AIRMon-Wet site,
a new MDN site, and carries out
several other Hg measurements as well

CVI’s Research Area is
the Mid-Atlantic
Highlands
NOAA performs the
Mercury and Air
Quality Studies

Canaan Valley non-Network
Mercury Measurements
• Continuous gaseous elemental mercury surface fluxes (modified-Bowen ratio)
• Weekly total mercury snow pack and stream outflow (calibrated stream gauge)
• Monthly groundwater
• Total mercury in Throughfall (event/campaign)
• Weekly Cat-ion exchange membrane surrogate surfaces

Rain and Snow collectors for
Mercury and Acid Rain
Mercury chemical
composition sensors
Shelter for sensors measuring
mercury, ozone, carbon
dioxide and other trace gases
Vertical profilers for mercury
Air-surface exchange
Ultrasonic anemometer
for wind turbulence
Charge dissipater for
Lightning protection
Canaan Valley Hg Site

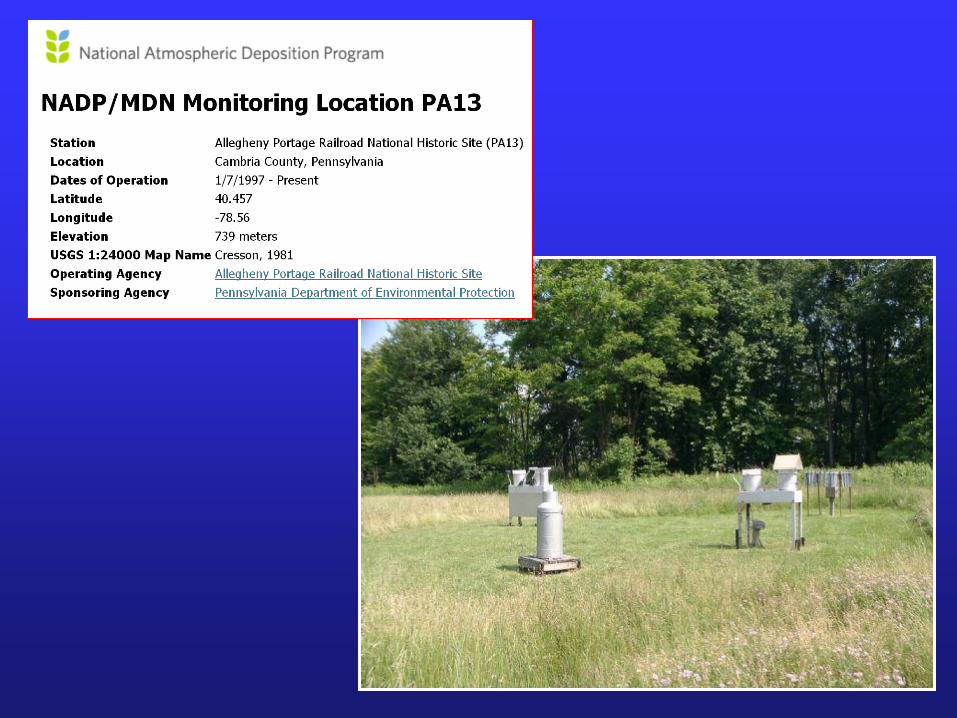
Allegheny Portage Railroad
National Historic Site,
Pennsylvania
Co-located with the MS-DEQ / EPA’s
precipitation measurements sites
(NTN, MDN, and trace metals)

PA13
Allegheny
Portage

Cambria Cogenco
e10, r10, p14
Numbers in facility labels are kg/yr emissions of elemental, reactive gaseous, and particulate mercury, respectively
Interpower Colver
e10, r10, p15
Homer City
e080, r213, p019
Keystone
e203, r537, p048
Armstrong
e039, r102, p009
Shawville
e096, r255, p023
Conemaugh
e213, r018, p001
Reliant Seward
e10, r13, p03
PA13
Allegheny
Portage

PA13
Allegheny
Portage
1. Measurements
A. Site Locations and Settings
B. Current Suite of Measurements
C. Intensive (this Summer)
D. Data – some examples
2. Modeling
A. Episodes for Model Evaluation
B. Emissions and Met Data -- Fine-Scale
D. Upcoming Great Lakes Project
C. Evolution of the HYSPLIT-Hg Model

SiteCollaborators / Co-locators
Ambient Air Measurements PrecipitationDry
DepositionOther
Mer
cury
Spec
iati
on
SO2
O3
NO
/NO
y
CO
Car
bo
n b
lack
Maj
or
Ion
s (N
TN
)
Mer
cury
(MD
N)
Trac
e M
etal
s
Surr
oga
te
Surf
ace
Thro
ugh
fall
Met
eo
rolo
gy
Beltsville(MD)
PI = Winston Luke (NOAA) EPA Clean Air Markets Division Univ of Maryland Maryland DNR MACTEC USGS
• • • • • • • •
Grand Bay (MS)
PI = Winston Luke (NOAA) Grand Bay NERR MS Dept Envr Quality U.S. EPA U.S. Fish & Wildlife Agency
• • • • • • • • •Canaan Valley (WV)
PI = Steve Brooks(CVI/NOAA Canaan Valley Institute Univ Md Frostburg
Appalachian Lab USGS
• • • • • • •Allegheny Portage (PA)
PI = Steve Brooks (CVI/NOAA) Canaan Valley Institute Pennsylvania DEP National Park Service
• • •
NOAA-led measurement
Co-located measurementSummary of NOAA ARL
Mercury Measurement Sites

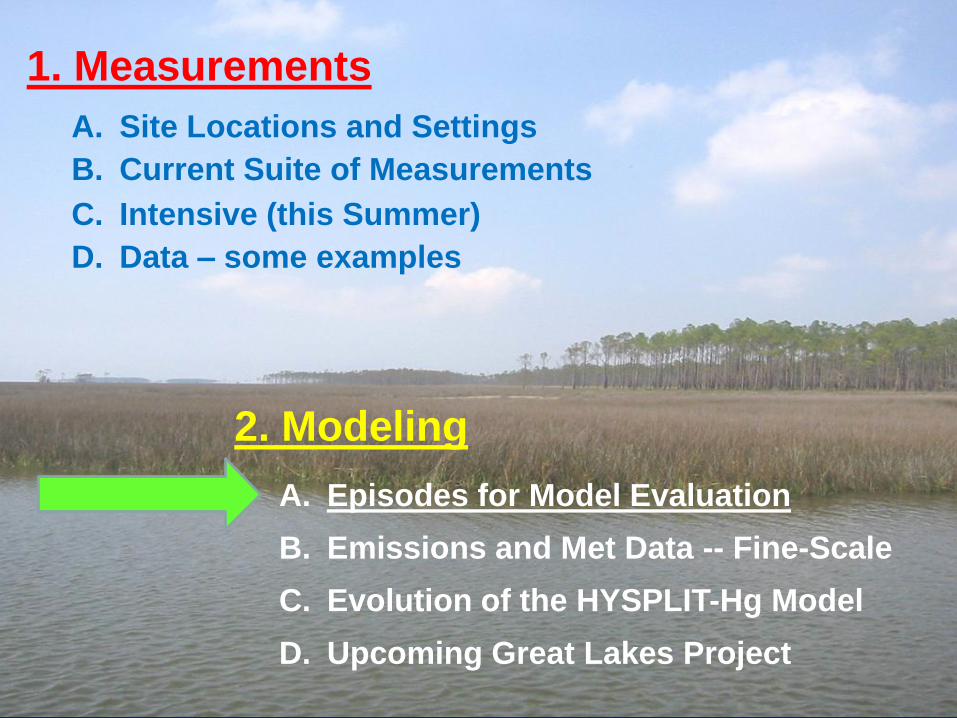
1. Measurements
A. Site Locations and Settings
B. Current Suite of Measurements
C. Intensive (this Summer)
D. Data – some examples
2. Modeling
A. Episodes for Model Evaluation
B. Emissions and Met Data -- Fine-Scale
D. Upcoming Great Lakes Project
C. Evolution of the HYSPLIT-Hg Model

Plans for Atmospheric Field Intensive, July-Aug 2010 at the Grand Bay NERR
Ground-Based Measurements
(ongoing) speciated mercury, trace gas, black carbon, and
meteorological measurements
• Winston Luke and Paul Kelley (NOAA ARL)
• Jake Walker (Grand Bay NERR)
(ongoing) wet deposition: major ions, mercury, methylmercury, metals
Will try to switch to event-based during intensive
• Mississippi State Dept of Env Protection/EPA
• Jake Walker (Grand Bay NERR)
ambient concentrations of BrO at the surface via Chemical Ionization
Mass Spectrometry (possibly other Br compounds, e.g., Br2, BrCl, and HOBr• Greg Huey (Georgia Tech)
isotopic mercury analysis of event-based precipitation and aerosols • Bill Landing, Flip Froelich (Florida State Univ)
trace metal analysis of size-segregated aerosol
Spring 2010 and possibly during intensive• Mark Engle (USGS)
Aircraft and Above Surface Measurements
aircraft flights measuring concentrations of Hg0 (Tekran),
total and “speciated” RGM (coated/uncoated denuders),
O3, SO2, and particle count
•Stephen Corda, John Muratore, & colleagues
(Univ. of Tennessee Space Institute – UTSI)
• Hynes and Swartzendruber (Univ of Miami)
• Luke and Kelley (NOAA ARL)
vertical distribution of O3 and met data above the site (ozonesondes)• Luke and Kelley (NOAA ARL)
• Jake Walker (Grand Bay NERR)
Details are still being worked out…

1. Measurements
A. Site Locations and Settings
B. Current Suite of Measurements
C. Intensive (this Summer)
D. Data – some examples
2. Modeling
A. Episodes for Model Evaluation
B. Emissions and Met Data -- Fine-Scale
D. Upcoming Great Lakes Project
C. Evolution of the HYSPLIT-Hg Model


Beltsville site is impacted by a variety of local-regional sources with unique emissions characteristics.
Coupled chemical-meteorological analysis will yield important insights into mercury emissions, transport, transformation, and removal at the site.

D4 vs D3 RGM
y = 0.9526x + 1.4949
R2 = 0.9774
0
50
100
150
200
250
0 50 100 150 200 250
D3 RGM (pg m-3)
D4
RG
M (
pg
m-3
)
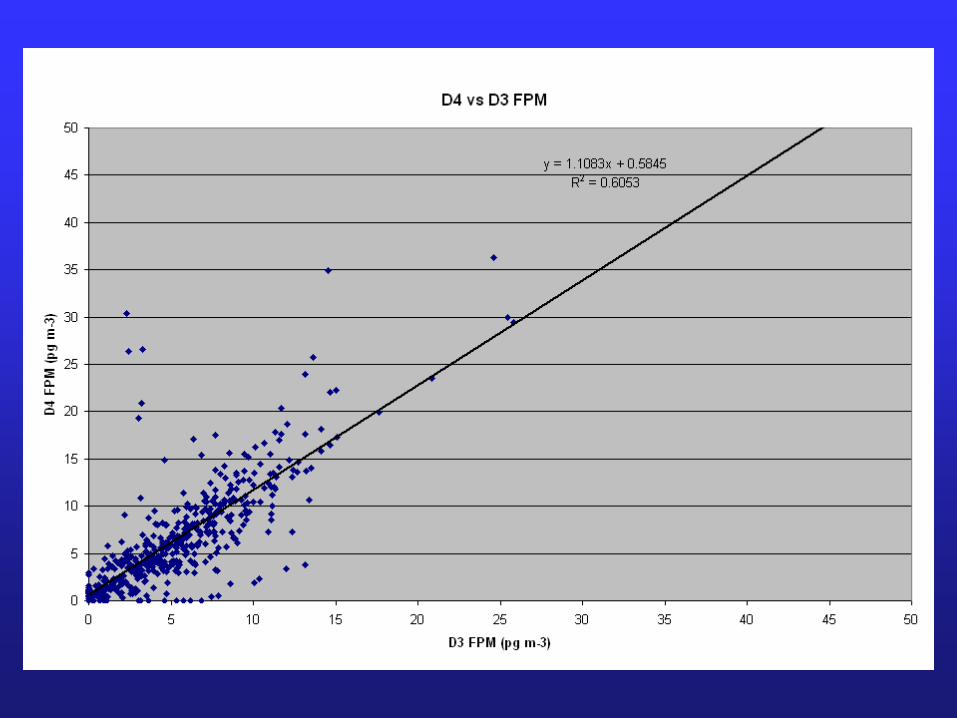

Two systems were configured identically (pink), then System 2 was fitted with a 10-micron cut point elutriator (blue) over the course of several days.
Results suggest that there may be as much mercury in the coarse (sea salt) aerosol fraction as in the fine fraction.
Studies will be repeated periodically at the site.

1. Measurements
A. Site Locations and Settings
B. Current Suite of Measurements
C. Intensive (this Summer)
D. Data – some examples
2. Modeling
A. Episodes for Model Evaluation
B. Emissions and Met Data -- Fine-Scale
D. Upcoming Great Lakes Project
C. Evolution of the HYSPLIT-Hg Model
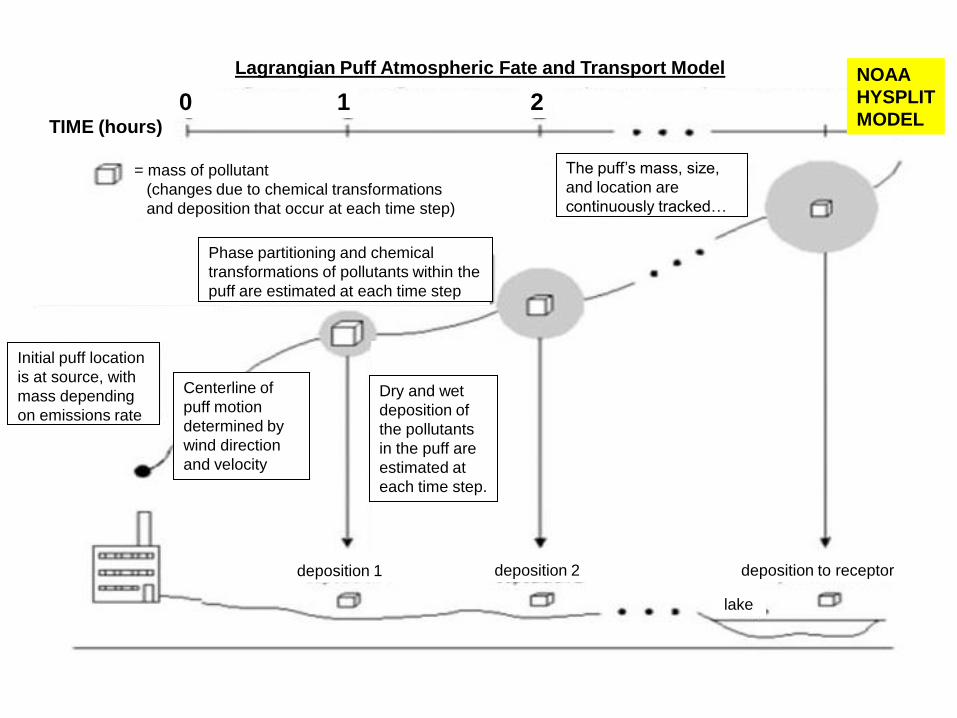
Dry and wet
deposition of
the pollutants
in the puff are
estimated at
each time step.
The puff’s mass, size,
and location are
continuously tracked…
Phase partitioning and chemical
transformations of pollutants within the
puff are estimated at each time step
= mass of pollutant
(changes due to chemical transformations
and deposition that occur at each time step)
Centerline of
puff motion
determined by
wind direction
and velocity
Initial puff location
is at source, with
mass depending
on emissions rate
TIME (hours)
0 1 2
deposition 1 deposition 2 deposition to receptor
lake
Lagrangian Puff Atmospheric Fate and Transport Model NOAA
HYSPLIT
MODEL


1. Measurements
A. Site Locations and Settings
B. Current Suite of Measurements
C. Intensive (this Summer)
D. Data – some examples
2. Modeling
A. Episodes for Model Evaluation
B. Emissions and Met Data -- Fine-Scale
D. Upcoming Great Lakes Project
C. Evolution of the HYSPLIT-Hg Model

Hg from
other sources:
local, regional
& more distant
Measurement
of ambient air
concentrations
Measurement
of wet
deposition

initial emphasis is
model evaluation
focusing on episodes

December 24, 2007:
Large peaks in RGM and SO2
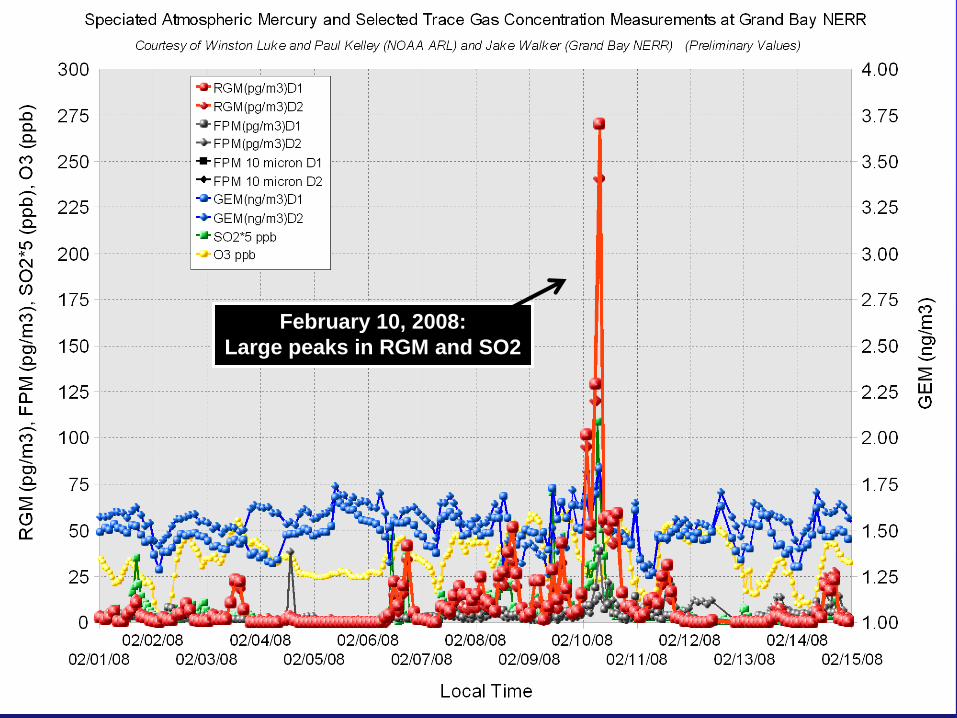
February 10, 2008:
Large peaks in RGM and SO2

45
April 20-23, 2008:
Large peaks in RGM and SO2

1. Measurements
A. Site Locations and Settings
B. Current Suite of Measurements
C. Intensive (this Summer)
D. Data – some examples
2. Modeling
A. Episodes for Model Evaluation
B. Emissions and Met Data -- Fine-Scale
D. Upcoming Great Lakes Project
C. Evolution of the HYSPLIT-Hg Model

atmospheric
deposition
to the water
surface
atmospheric
deposition
to the
watershed
Measurement
of ambient air
concentrations
Measurement
of wet
deposition
Hg from
other sources:
local, regional
& more distant
An essential factor in carrying
out a meaningful model
evaluation in cases where
local/regional sources may be
important is to have accurate
emissions data for
local/regional sources, valid
for the time of the episode
being studied
color of symbol denotes
type of mercury source
coal-fired power plants
other fuel combustion
waste incineration
metallurgical
manufacturing & other
size/shape of symbol
denotes amount of Reactive
Gaseous Mercury (RGM)
emitted during 2002 (kg/yr)
10 - 50
50 - 100
100 – 300
5 - 10
urban areas
Grand Bay
NERR
monitoring site
Watson
Daniel
Barry
Lowman
CristMobile
Pensacola
Mississippi Alabama
Florida
Louisiana
Pascagoula
MSW
incinerator **
Brewton
paper mill*
* Brewton paper mill mercury emissions included in 2002 NEI , but do not appear to be in 2000-2008 TRI
** Pascagoula MSW incinerator mercury emissions included in 2002 NEI but incineration ceased in Jan 2001
*** Ipsco Steel had significant mercury emissions in 2002 NEI, but negligible emissions reported in 2008 TRI
Eaton
Gaylord
Container
Bogalusa
IPSCO Steel ***
Biloxi-
Gulfport
New Orleans
Hattiesburg
Slidell
Pascagoula
Grand Bay NERR sampling site, with large point sources of Reactive Gaseous
Mercury in the region, based on the EPA’s 2002 National Emissions Inventory

Mercury Air Emissions from the Victor J. Daniel Power Plant
as reported to the Toxic Release Inventory

Mercury Air Emissions from Charles R. Lowman Power
Plant as reported to the Toxic Release Inventory
atmospheric
deposition
to the water
surface
atmospheric
deposition
to the
watershed
Measurement
of ambient air
concentrations
Measurement
of wet
deposition
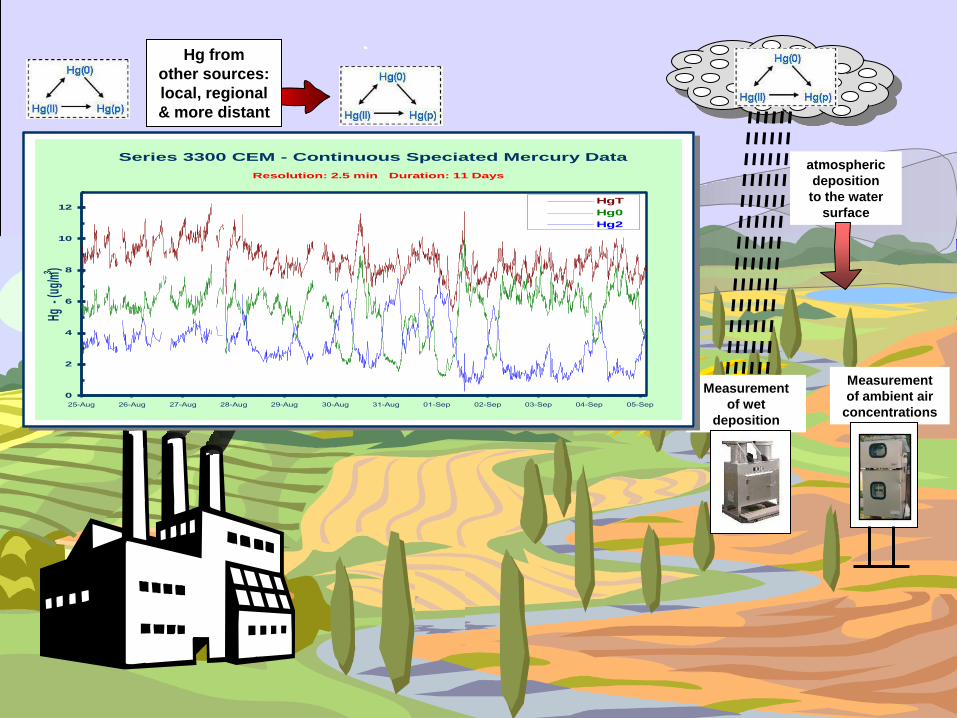
Resolution: 2.5 min Duration: 11 Days
0
2
4
6
8
10
12
25-Aug 26-Aug 27-Aug 28-Aug 29-Aug 30-Aug 31-Aug 01-Sep 02-Sep 03-Sep 04-Sep 05-Sep
Hg -
(ug/
m3 )
HgT
Hg0
Hg2
Series 3300 CEM - Continuous Speciated Mercury Data
Hg from
other sources:
local, regional
& more distant
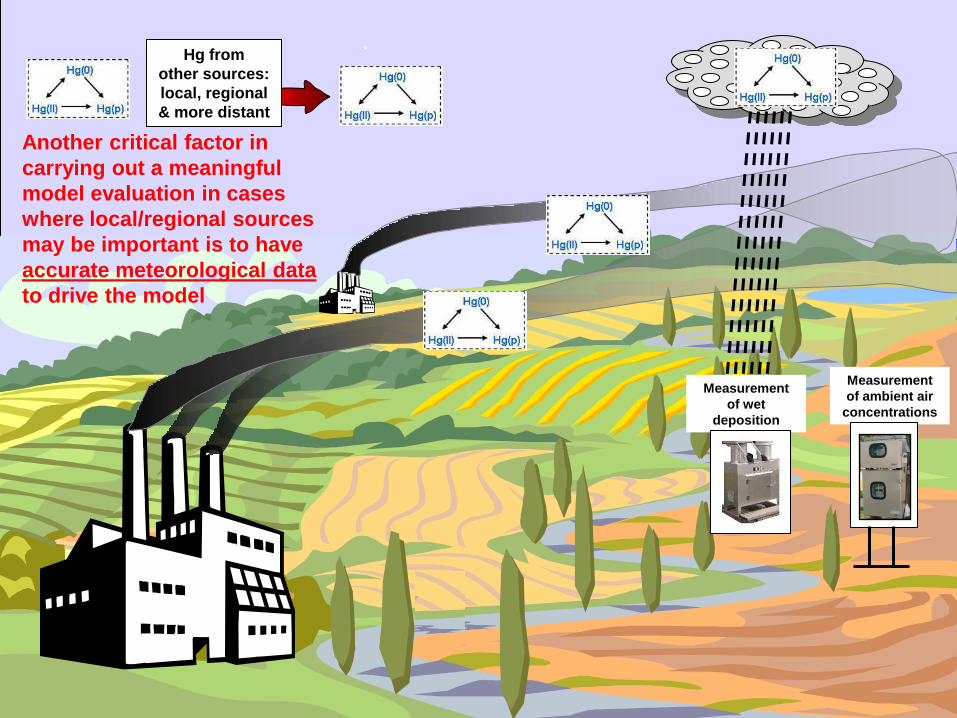
Measurement
of ambient air
concentrations
Measurement
of wet
deposition
Another critical factor in
carrying out a meaningful
model evaluation in cases
where local/regional sources
may be important is to have
accurate meteorological data
to drive the model
Hg from
other sources:
local, regional
& more distant

4 km
grid
36 km
grid
12 km
grid
High-resolution meteorological simulations being carried out for episodes at
the Grand Bay NERR [ ] by Dr. Fantine Ngan, a post-doc at NOAA ARL,
and independently by Dr. Rao Dodla of Jackson State University
Terrain height
of 3 domainsFantine Ngan, NOAA ARL

1. Measurements
A. Site Locations and Settings
B. Current Suite of Measurements
C. Intensive (this Summer)
D. Data – some examples
2. Modeling
A. Episodes for Model Evaluation
B. Emissions and Met Data -- Fine-Scale
D. Upcoming Great Lakes Project
C. Evolution of the HYSPLIT-Hg Model

When puffs grow to
sizes large relative to
the meteorological
data grid, they split,
horizontally and/or
vertically
Ok for regional
simulations,
but for global
modeling,
puff splitting
overwhelms
computational
resources

0 168 336 504 672 840 1008 1176 1344 1512 1680
hour of simulation
1
10
100
1,000
10,000
100,000
1,000,000
Nu
mbe
r o
f P
uffs
100K, 1.0x,
spitting not
age-limited
Evolution of Number of Puffsas a function of MAXPAR and merge parameter multiplication factor
elem emit; growth not stopped; splitting not age-limited; source at lat = 30, long = 105 (China)
In this example, the maximum number of puffs was set to 100,000, so
when it got close to that number, the splitting was turned off
Exponential puff growth
Due to puff splitting, the number of puffs quickly
overwhelms numerical resources
0 168 336 504 672 840 1008 1176 1344 1512 1680
hour of simulation
1
10
100
1,000
10,000
100,000
1,000,000
Nu
mbe
r o
f P
uffs
100K, 1.0x, spitting not stopped,
zcycle = 7
4K, 1.5x, zcycle = 7
10K, 1.5x, zcycle = 7
20K, 1.5x, zcycle = 2
1000K, 1.0x, splitting not age limited,
zcycle = 7
Evolution of Number of Puffsas a function of MAXPAR and merge parameter multiplication factor
elem emit; growth not stopped; splitting stopped after 168 hours; source at lat = 30, long = 105 (China)
In each test, the number of puffs rises to the maximum
allowable within ~ one week (and then splitting stops…)
This line is the example
from the last slide

In the new version of
HYSPLIT (4.9), puffs
are “dumped” into
an Eulerian grid after
a specified time (e.g.,
96 hrs), and the
mercury is simulated
on that grid from
then on…

We are discovering that with puffs
and very fine scale meteorology,
splitting is still a difficult challenge in
the near field, long before one would
necessarily want to switch to an
Eulerian grid
With puffs and very fine
scale meteorology,
splitting is still a difficult
challenge, so, may use
“particles” for dispersion
simulation rather than
puffs.
The particles would still be transferred to
an Eulerian grid after a given time

1. Measurements
A. Site Locations and Settings
B. Current Suite of Measurements
C. Intensive (this Summer)
D. Data – some examples
2. Modeling
A. Episodes for Model Evaluation
B. Emissions and Met Data -- Fine-Scale
D. Upcoming Great Lakes Project
C. Evolution of the HYSPLIT-Hg Model

Have done a lot of source-receptor
modeling work for the Great Lakes.
New, expanded study of source
attribution for atmospheric
mercury deposition to the
Great Lakes, as part of the
Great Lakes Restoration Initiative

Geographical Distribution of 1999 Direct
Deposition Contributions to Lake Michigan


Figure 44. Largest modeled contributors to Lake Michigan (close-up).
(same legend as previous slide)

Atmospheric Deposition Flux to Lake Michigan from Anthropogenic
Mercury Emissions Sources in the U.S. and Canada

Pleasant Prairie
Joliet 29
J.H. Campbell
Waukegan
MARBLEHEAD LIME CO.
Will County
JERRITT CANYON
LWD
South Oak Creek
Powerton
Superior Special Services
CLARIAN HEALTH
Crawford
R.M. Schahfer
Joliet 9
Rockport
Marblehead Lime (South Chicago)
BALL MEMORIAL
Fisk
State Line
Edgewater
VULCAN MCCOOK LIME
Monroe Power Plant
Monticello
Parkview Mem. Hosp.
WI
IL
MI
IL
IL
IL
NV
KY
WI
IL
WI
IN
IL
IN
IL
IN
IL
IN
IL
IN
WI
IL
MI
TX
IN
0% 20% 40% 60% 80%
Cumulative Fraction of Hg Deposition
0
5
10
15
20
25
Ran
k
coal-fired elec gen
other fuel combustion
waste incineration
metallurgical
manufacturing/other
Top 25 modeled sources of atmospheric mercury to Lake Michigan
(based on 1999 anthropogenic emissions in the U.S. and Canada)
0 - 100
100 - 200
200 - 400
400 - 700
700 - 1000
1000 - 1500
1500 - 2000
2000 - 2500
> 2500
Distance Range from Lake Michigan (km)
0
10
20
30
40
50
Em
iss
ion
s (
metr
ic t
on
s/y
ear)
0
1
2
3
4
5
De
po
sit
ion
Flu
x (
ug
/m2-y
ear)
Emissions Deposition Flux
Emissions and deposition to Lake Michigan
arising from different distance ranges (based on 1999 anthropogenic emissions in the U.S. and Canada)
Only a small fraction
of U.S. and Canadian
emissions are emitted
within 100 km of Lake
Michigan…
… but these
“local” emissions
are responsible
for a large
fraction of the
modeled
atmospheric
deposition
Thanks!


![NOAA’s Atmospheric Mercury Monitoring in the Gulf of Mexico Region [April 2007 summary] This summary is updated periodically, and the current version is.](https://static.fdocuments.us/doc/165x107/56649e7b5503460f94b7c9e4/noaas-atmospheric-mercury-monitoring-in-the-gulf-of-mexico-region-april.jpg)