ATLAS on substance use 2017 - World Health Organization · WHO World Health Organization ... the...
35
1 WHO Forum on alcohol, drugs and addictive behaviours Enhancing public health actions through partnerships and collaboration ATLAS on substance use 2017: resources for the prevention and treatment of substance use disorders
Transcript of ATLAS on substance use 2017 - World Health Organization · WHO World Health Organization ... the...

1
WHO Forum on alcohol, drugs and addictive behaviours Enhancing public health actions through partnerships and collaboration
Addictive Behaviours
WHO activities Addictive Behaviours
WHO activities
ATLAS on substance use 2017: resources for the prevention and treatment of
substance use disorders
2
Contents Abbreviations ............................................................................. 3
Introduction ............................................................................... 4
Societal responses to substance use and substance use
disorders..................................................................................... 6
1. Government administration and budget ........................ 6
2. Service organization and delivery ................................... 9
3. Special legislative provisions for treatment .................. 10
4. Types and location of service providers ....................... 12
Main psychoactive substances of concern ...................... 13
5. Service coverage, capacity and utilization .................... 14
Pharmacological treatment ............................................. 16
6. Special programmes and services ................................. 19
HIV and hepatitis services ................................................ 19
Harm reduction ................................................................ 20
Open-access services ....................................................... 21
Mutual support/self-help groups ..................................... 22
7. Prevention ..................................................................... 23
School-based substance use prevention ......................... 23
Targeted prevention ........................................................ 24
Screening and brief interventions .................................... 25
8. Workforce ..................................................................... 26
Education ......................................................................... 28
Postgraduate training ...................................................... 29
Continuing professional education .................................. 30
Health Information Systems ............................................ 31

3
Abbreviations
AFR WHO African Region
AMR WHO Region of the Americas
ATLAS-SU WHO ATLAS on Substance Use survey
AUDs Alcohol use disorders
DUDs Drug use disorders
EMR WHO Eastern Mediterranean Region
EUR WHO European Region
NGO Non-governmental organization
SEAR WHO South-East Asia Region
WHO World Health Organization
WPR WHO Western Pacific Region
4
Introduction
This document presents information on the availability of a range of resources for the prevention of substance use and treatment of substance use disorders based on the information collected within WHO ATLAS-SU survey from 162 countries, territories and areas that represent 98% of the world population. The report with all results of the survey is in the preparation. The information had been collected through the questionnaire survey using the questionnaire specifically developed for this purpose. The questionnaire was sent to focal points nominated by the governments upon request from WHO, with an objective to gather information on a wide range of available resources that contribute to the prevention and treatment of substance use disorders, including: a) Availability of administrative and financial resources
for prevention and treatment of substance use disorders such as the responsible government entities and funding sources.
b) The availability of different types of treatment
services and interventions such as pharmacological treatment and services for women and children, and estimates of capacity of treatment systems and coverage of populations in need.

5
c) Interaction between specialized and non-specialized services for treatment of substance use disorders such as primary care and mental health services, level of integration across different sectors, and linkages with mutual support/self-help groups.
d) Human resources such as involvement of various types of health professionals for the treatment of substance use disorders, educational attainment possibilities and availability of continuing professional development.
e) Relevant legislation and policy governing treatment
of substance disorders, such as voluntary versus coerced treatment options, availability of drug courts, confidentiality of treatment information, and standards of care.
f) Resources for prevention of substance use disorders, such as availability and coverage of different types of prevention services, implementation of screening and brief interventions in primary care and ante-natal services.
g) Availability of special programmes or services such as harm reduction and open-access programmes.
h) National systems for monitoring epidemiological
trends in substance use, substance-related mortality and morbidity, the use of treatment services, and regular reporting of such data.

6
0
20
40
60
80
100
AFRO(N=34)
AMRO(N=25)
EMRO(N=21)
EURO(N=48)
SEARO(N=7)
WPRO(N=20)
Global(N=155)P
erc
en
tage
of
cou
ntr
ies
Ministry of Health Ministry of Education
Ministry of Interior Ministry of Justice
Ministry of Social Welfare Ministry of the Prime Minister/President
0
20
40
60
80
100
AFRO(N=34)
AMRO(N=26)
EMRO(N=21)
EURO(N=48)
SEARO(N=8)
WPRO(N=19)
Global(N=156)
Pe
rce
nta
ge o
f co
un
trie
s
Ministry of Health Ministry of Education
Ministry of Interior Ministry of Justice
Societal responses to substance use and
substance use disorders
1. Government administration and budget Figure 1. Ministry with primary responsibility for treatment of alcohol use
disorders, by WHO regions
Figure 2. Ministry with primary responsibility for treatment of drug use
disorders, by WHO regions
COMMENT to Figures 1 and 2: Almost all countries (95%) report the Ministry of
Health as the primary ministry responsible for policy related to the treatment of
substance use disorders.

7
0
20
40
60
80
100
AFRO(N=34)
AMRO(N=28)
EMRO(N=21)
EURO(N=48)
SEARO(N=8)
WPRO(N=20)
Global(N=159)
Pe
rce
nta
ge o
f co
un
trie
s
None One unit/official for drugs only
Two separate units/officials for alcohol and drugs One unit/official for alcohol and drugs
0
20
40
60
80
100
Low income(N=24)
Lower middleincome (N=41)
Higher middleincome (N=42)
High income(N=51)
Pe
rce
nta
ge o
f co
un
trie
s
None One unit/official for drugs only
Two separate units/officials for alcohol and drugs One unit/official for alcohol and drugs
Figure 3: Structural organization of government unit/official responsible
for prevention of substance use, by WHO region
Figure 4: Structural organization of government unit/official responsible
for treatment of substance use disorders, by WHO region
COMMENT to Figures 3 and 4: In all regions, except the WPR, the majority of
countries report having a single unit or official responsible for both alcohol and drugs
– globally, 68% of countries report having a single unit/official for prevention and 70%
for treatment policy

8
0102030405060708090
100
AFRO(N=24)
AMRO(N=26)
EMRO(N=11)
EURO(N=45)
SEARO(N=6)
WPRO(N=17)
Global(N=129)
Pe
rce
nta
ge o
f co
un
trie
s
Decreased Increased No change
Figure 5: Changes in the allocation of government resources for prevention of drug use in the last five years, by WHO region
Figure 6: Changes in the allocation of government resources for prevention of alcohol use in the last five years, by WHO region
COMMENT to Figures 5 and 6: In the last five years, government resources for
substance use prevention have increased significantly in all WHO regions except in
EURO.
0102030405060708090
100
AFRO(N=23)
AMRO(N=26)
EMRO(N=16)
EURO(N=46)
SEARO(N=8)
WPRO(N=16)
Global(N=135)
Pe
rce
nta
ge o
f co
un
trie
s
Decreased Increased No change

9
0
20
40
60
80
100
PublicHealthSector
NGOs PrivateHealthSector
PublicSocialCare
Sector
PrivateSocialCare
Sector
Criminaljusticesector
Pe
rce
nta
ge o
f co
un
trie
s
Treatment for alcohol use disorders (N=137) Treatment for drug use disorders (N=137)
Rehabilitation for alcohol use disorders (N=132) Rehabilitation for drug use disorders (N=100)
0
20
40
60
80
100
AFRO(N=27)
AMRO(N=25)
EMRO(N=18)
EURO(N=45)
SEARO(N=6)
WPRO(N=16)
Global(N=137)
Pe
rce
nta
ge o
f co
un
trie
s
Public Health Sector NGOs Private Health Sector
Public Social Care Sector Private Social Care Sector Criminal justice sector
2. Service organization and delivery Figure 7: Main sector providing treatment and rehabilitation services for alcohol and drug use disorders, global
Figure 8: Main sector providing treatment for drug use disorders by WHO region
COMMENT to Figures 7 and 8: Worldwide, and across all regions and income groups,
the public health sector is the most common provider of treatment and
rehabilitation for alcohol and drug use disorders. Globally, NGOs are reported as
providers of rehabilitation services (about 20%), but not treatment. In contrast, the
private sector is responsible for the delivery of treatment in some countries but not
typically for rehabilitation services.

10
0102030405060708090
100
Low income Lower middle-income
Higher middle-income
High income Global
Pe
rce
nta
ge o
f co
un
trie
s
For people with alcohol use disorders For people with drug use disorders
3. Special legislative provisions for
treatment
Figure 9: Existence of a law which protects the confidentiality of people in treatment for substance use disorders, by income group. Low income: (a) N=22, (b) N=21; Lower middle-income: (a) N=37, (b) N=38; Higher middle-income: (a) N=39, (b) N=40; High income: (a) N=49, (b) N=50; Global: (a) N=148, (b) N=150.
COMMENT to Figure 9: Countries in the low-income groups were much less likely to report having a law in place to protect confidentiality with just over 30% of countries reporting provisions for people with either drug or alcohol problems. This is compared to almost 100% of countries in the high-income group. In terms of special legislative provisions for treatment, the majority of countries responded that they have special provisions for the confidentiality of people in treatment (76% - alcohol and 77% - drugs).

11
0
10
20
30
40
50
60
70
80
90
100
Low income Lower middle-income Higher middle-income
High income
Pe
rce
nta
ge o
f co
un
trie
s
As an alternative for alcohol use disorders In addition for alcohol use disorders
As an alternative for drug use disorders In addition for drug use disorders
Figure 10: Existence of legislative or administrative provisions for offering voluntary treatment as an alternative or in addition to criminal sanctions, by income group. Low income: (a) N=20, (b) N=16, (c) N=18, (d) N=16; Lower middle-income: (a) N=34, (b) N=33, (c) N=33, (d) N=36; Higher middle-income: (a) N=38, (b) N=34, (c) N=37, (d) N=36; High income: (a) N=46, (b) N=41, (c) N=48, (d) N=44.
COMMENT to Figure 10: There is more common that high-income countries offer
voluntary treatment as an alternative to, or in addition criminal sanctions as
compared to low or lower income countries. This is especially the case for alternative
treatment for drug use disorders where 92% of the high-income countries offer this
provision as compared to just over 40% of the low-income countries.
The global percentage of countries reporting provisions for voluntary treatment is
higher for drug use disorders (66%) than for alcohol use disorders (50%).

12
0102030405060708090
100
Low income(N=18)
Lower middle-income (N=32)
Higher middle-income (N=38)
High income(N=47)
Global (N=134)
Pe
rce
nta
ge o
f co
un
trie
s
In the capital city and in rural areasIn rural areas onlyIn other major cities onlyIn the capital city and in other major citiesIn the capital city onlyIn the capital city, in other major cities and in rural areas
4. Types and location of service providers
Figure 11: Location of public specialized facilities for substance use disorders, by income group
COMMENT to Figure 11: Substance use services tend to be concentrated in the capital city and large urban areas in lower income countries, whereas in high-income countries the distribution is more balanced. This is particularly concerning low-income countries where, for example, needs may be high in rural/remote areas and limited communication and transportation systems may restrict access to the urban-based facilities and services
13
Main psychoactive substances of concern
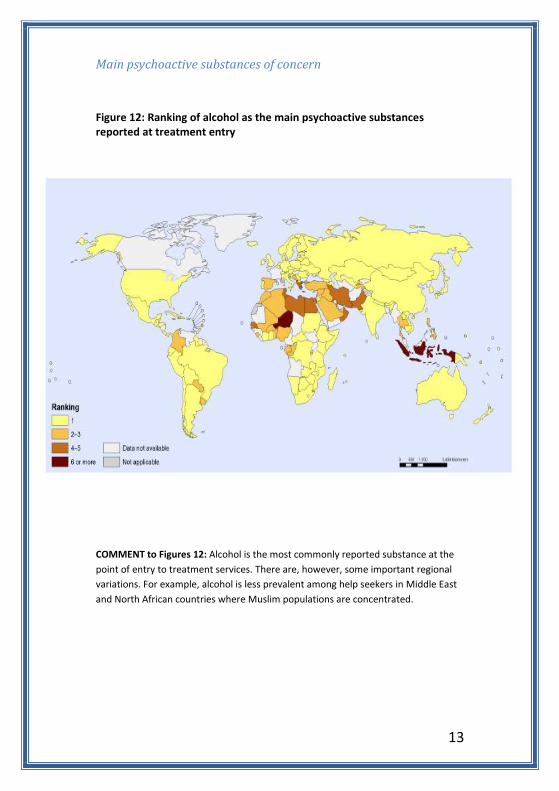
Figure 12: Ranking of alcohol as the main psychoactive substances reported at treatment entry
COMMENT to Figures 12: Alcohol is the most commonly reported substance at the
point of entry to treatment services. There are, however, some important regional
variations. For example, alcohol is less prevalent among help seekers in Middle East
and North African countries where Muslim populations are concentrated.
14
Cannabisdepende
nce(N=146)
Opioiddepende
nce(N=146)
Cocainedepende
nce(N=136)
Alcoholdepende
nce(N=150)
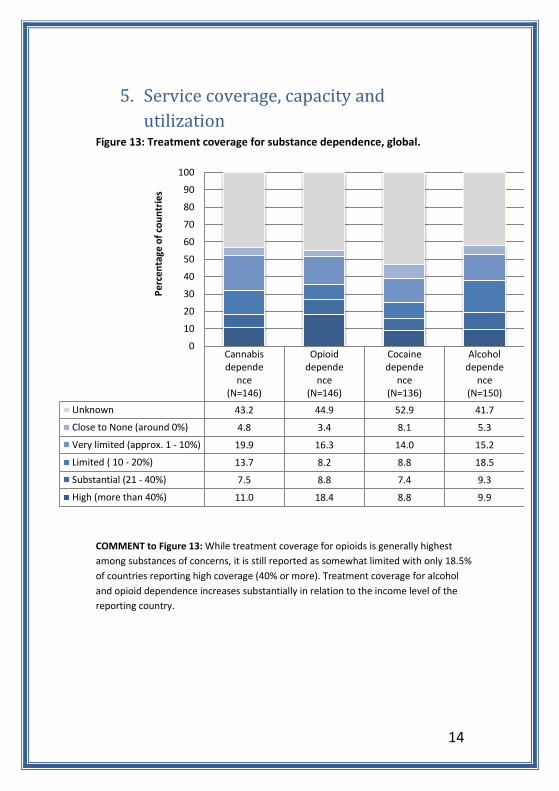
Unknown 43.2 44.9 52.9 41.7
Close to None (around 0%) 4.8 3.4 8.1 5.3
Very limited (approx. 1 - 10%) 19.9 16.3 14.0 15.2
Limited ( 10 - 20%) 13.7 8.2 8.8 18.5
Substantial (21 - 40%) 7.5 8.8 7.4 9.3
High (more than 40%) 11.0 18.4 8.8 9.9
0
10
20
30
40
50
60
70
80
90
100
Pe
rce
nta
ge o
f co
un
trie
s
5. Service coverage, capacity and
utilization Figure 13: Treatment coverage for substance dependence, global.
COMMENT to Figure 13: While treatment coverage for opioids is generally highest
among substances of concerns, it is still reported as somewhat limited with only 18.5%
of countries reporting high coverage (40% or more). Treatment coverage for alcohol
and opioid dependence increases substantially in relation to the income level of the
reporting country.
15
0
5
10
15
20
25
Lowincome
Lowemiddleincome
Highermiddleincome
Highincome
Global
Nu
mb
er
of
be
ds
pe
r 1
00
'00
0
po
pu
lati
on
Public general health carefacilities
Private general health carefacilities
Public mental health care facilities
Private mental health carefacilities
Public specialized health carefacilities
Private specialized health carefacilities
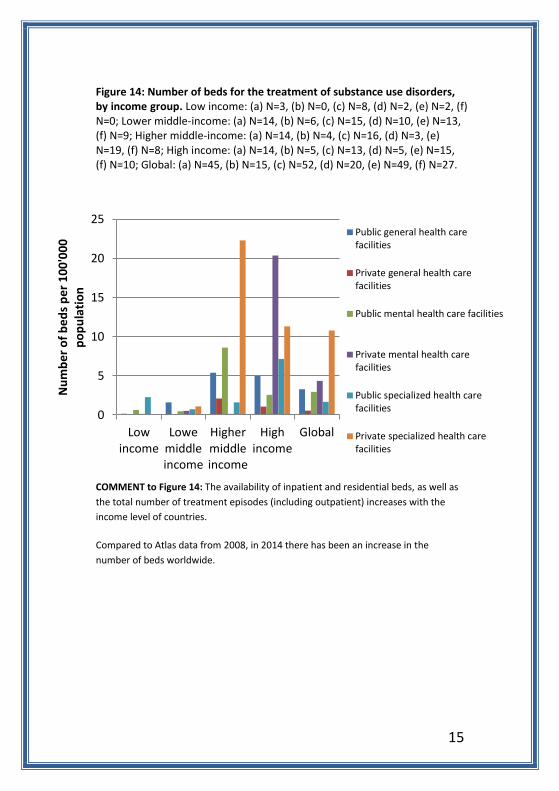
Figure 14: Number of beds for the treatment of substance use disorders, by income group. Low income: (a) N=3, (b) N=0, (c) N=8, (d) N=2, (e) N=2, (f) N=0; Lower middle-income: (a) N=14, (b) N=6, (c) N=15, (d) N=10, (e) N=13, (f) N=9; Higher middle-income: (a) N=14, (b) N=4, (c) N=16, (d) N=3, (e) N=19, (f) N=8; High income: (a) N=14, (b) N=5, (c) N=13, (d) N=5, (e) N=15, (f) N=10; Global: (a) N=45, (b) N=15, (c) N=52, (d) N=20, (e) N=49, (f) N=27.
COMMENT to Figure 14: The availability of inpatient and residential beds, as well as
the total number of treatment episodes (including outpatient) increases with the
income level of countries.
Compared to Atlas data from 2008, in 2014 there has been an increase in the
number of beds worldwide.

16
0
10
20
30
40
50
60
70
80
90
100
Low income Lower middle-income
Higher middle-income
High income Global
Pe
rce
nta
ge o
f co
un
trie
s
Registration
Availability
Pharmacological treatment
Figure 15: Registration and availability of medications for alcohol dependence in publicly funded treatment services, by income group. Low income: (a) N=19, (b) N=14; Lower middle-income: (a) N=37, (b) N=33; Higher middle-income: (a) N=38, (b) N=33; High income: (a) N=51, (b) N=50; Global: (a) N=146, (b) N=131.
COMMENT to Figure 15: Globally, about 35% of countries have none of relapse
prevention medications available, and 30% have none of them registered. Overall,
rates of registration and availability increase from lower to higher income countries.
Less than 30% of lower income countries have one or more of these medications
available. Even in high-income countries, just over 20% of countries do not have
these medications either registered or available.

17
0
20
40
60
80
100
AFRO(N=32)
AMRO(N=27)
EMRO(N=22)
EURO(N=48)
SEARO(N=8)
WPRO(N=18)
Global(N=155)
Pe
rce
nta
ge o
f co
un
tie
s
0
20
40
60
80
100
AFRO AMRO EMRO EURO SEARO WPRO Global
Methadone
Buprenorphine
Buprenorphine/naloxone
Figure 16: Availability of at least one medication for maintenance treatment of opioid dependence, by WHO region.
Figure 17: Availability of specific medications for maintenance treatment of opioid dependence in publicly funded treatment services, by WHO region. AFRO: (a) N=32, (b) N=31, (c) N=31; AMRO: (a) N=26, (b) N=26, (c) N=26; EMRO: (a) N=22, (b) N=22, (c) N=22; EURO: (a) N=47, (b) N=40, (c) N=42; SEARO: (a) N=7, (b) N=3, (c) N=4; WPRO: (a) N=18, (b) N=16, (c) N=17; Global: (a) N=152, (b) N=138, (c) N=142.
COMMENT to Figures 16 and 17: 62% of countries report the availability of any
opiate maintenance treatment. WHO regions EURO, AMRO and SEARO report more
than 50% availability (EURO (98%); SEARO (87%) and AMRO (55%)). Availability is
lowest in AFRO, with only 25% of countries in this region reporting availability.
Globally, methadone is the most available maintenance medication, but it is
available in only 50% of reporting countries, compared to 30% for buprenorphine
and about 35% for buprenorphine/ naloxone. Comparing the availability of
methadone and buprenorphine across regions, these medications are less available
in AFRO, AMRO and EMRO regions. Buprenorphine is most common in EURO (75%)
and buprenorphine/naloxone in EURO (91%) and SEARO (75%).

18
0
10
20
30
40
50
60
70
80
90
100
AFRO(N=34)
AMRO(N=28)
EMRO(N=22)
EURO(N=46)
SEARO(N=7)
WPRO(N=18)
Global(N=155)
Pe
rce
nta
ge o
f co
un
trie
s
0
20
40
60
80
100
Low income(N=23)
Lower middleincome (N=40)
Higher middleincome (N=41)
High income(N=50)
Pe
rce
nta
ge o
f co
un
trie
s Figure 18: Existence of national guidelines on the pharmacological treatment of substance use disorders, by WHO region
Figure 19: Existence of national guidelines on the pharmacological treatment of substance use disorders, by income group
COMMENT to Figures 18 and 19: One of key steps in making pharmacological
treatment available within a country is the development of national guidelines
concerning their use. At present, such guidelines are available in 2 out of 3 countries
(about 70%). This has increased substantially since 2008, when only 1 out of 3
countries reported the availability of national guidelines. Higher income countries
are more likely to have developed guidelines.

19
0
10
20
30
40
50
60
AFRO(N=33)
AMRO(N=27)
EMRO(N=21)
EURO(N=48)
SEARO(N=6)
WPRO(N=19)
Global(N=154)
Pe
rce
nta
ge o
f co
un
trie
s
None (0) Few (1-10%) Some (11 - 30%)Many (31 - 60%) Most (61 - 100%) Unknown
0
10
20
30
40
50
60
AFRO(N=32)
AMRO(N=26)
EMRO(N=18)
EURO(N=47)
SEARO(N=4)
WPRO(N=18)
Global(N=145)P
erc
en
tage
of
cou
ntr
ies
None (0) Few (1-10%) Some (11 - 30%)
Many (31 - 60%) Most (61 - 100%) Unknown
6. Special programmes and services
HIV and hepatitis services
Figure 20: Percentage of specialized treatment facilities and services for substance use disorders that provide HIV testing and counselling, by region.
Figure 21: Percentage of specialized treatment facilities and services for substance use disorders that provide HIV treatment, by region.
COMMENT to Figures 20 and 21: Globally, 14% of countries report that none of their
specialized services provide HIV testing and counselling; a further 20% of countries
report provision in only a few of their substance use services. An even higher
proportion of countries (26%) report no provision of HIV treatment.
20
0
20
40
60
80
100
AFRO AMRO EMRO EURO SEARO WPRO GlobalPe
rce
nta
ge o
f co
un
trie
s
Condom distribution "Drop-in" services
Needle/syringe exchange programmes Outreach services
0
20
40
60
80
100
Low income Lower middleincome
Higher middleincome
High income
Pe
rce
nta
ge o
f co
un
trie
s
Condom distribution "Drop-in" servicesNeedle/syringe exchange programmes Outreach services
Harm reduction
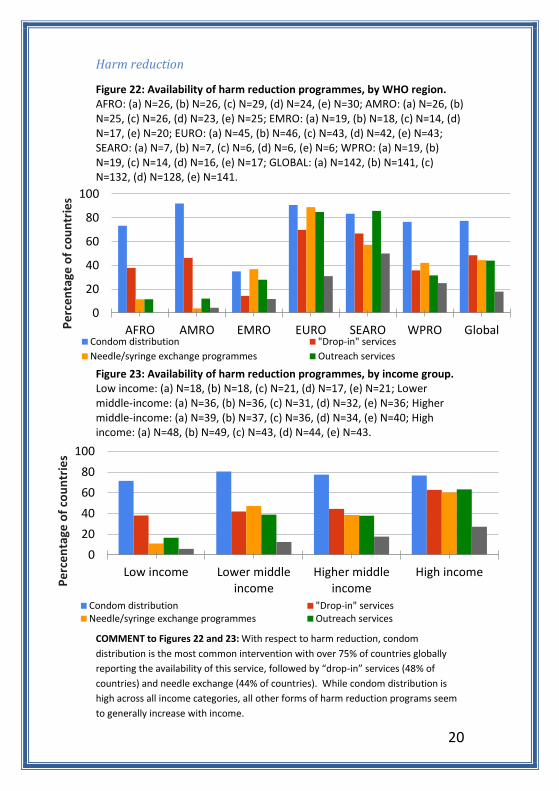
Figure 22: Availability of harm reduction programmes, by WHO region. AFRO: (a) N=26, (b) N=26, (c) N=29, (d) N=24, (e) N=30; AMRO: (a) N=26, (b) N=25, (c) N=26, (d) N=23, (e) N=25; EMRO: (a) N=19, (b) N=18, (c) N=14, (d) N=17, (e) N=20; EURO: (a) N=45, (b) N=46, (c) N=43, (d) N=42, (e) N=43; SEARO: (a) N=7, (b) N=7, (c) N=6, (d) N=6, (e) N=6; WPRO: (a) N=19, (b) N=19, (c) N=14, (d) N=16, (e) N=17; GLOBAL: (a) N=142, (b) N=141, (c) N=132, (d) N=128, (e) N=141.
Figure 23: Availability of harm reduction programmes, by income group. Low income: (a) N=18, (b) N=18, (c) N=21, (d) N=17, (e) N=21; Lower middle-income: (a) N=36, (b) N=36, (c) N=31, (d) N=32, (e) N=36; Higher middle-income: (a) N=39, (b) N=37, (c) N=36, (d) N=34, (e) N=40; High income: (a) N=48, (b) N=49, (c) N=43, (d) N=44, (e) N=43.
COMMENT to Figures 22 and 23: With respect to harm reduction, condom
distribution is the most common intervention with over 75% of countries globally
reporting the availability of this service, followed by “drop-in” services (48% of
countries) and needle exchange (44% of countries). While condom distribution is
high across all income categories, all other forms of harm reduction programs seem
to generally increase with income.
21
0
20
40
60
80
100
AFRO AMRO EMRO EURO SEARO WPRO GlobalPe
rce
nta
ge o
f co
un
trie
s
Telephone help-lines Web-based interventions Mobile phone based interventions
0
20
40
60
80
100
Low income Lower middle-income
Higher middle-income
High income Global
Pe
rce
nta
ge o
f co
un
trie
s
Telephone help-lines Web-based interventions Mobile phone based interventions
Open-access services
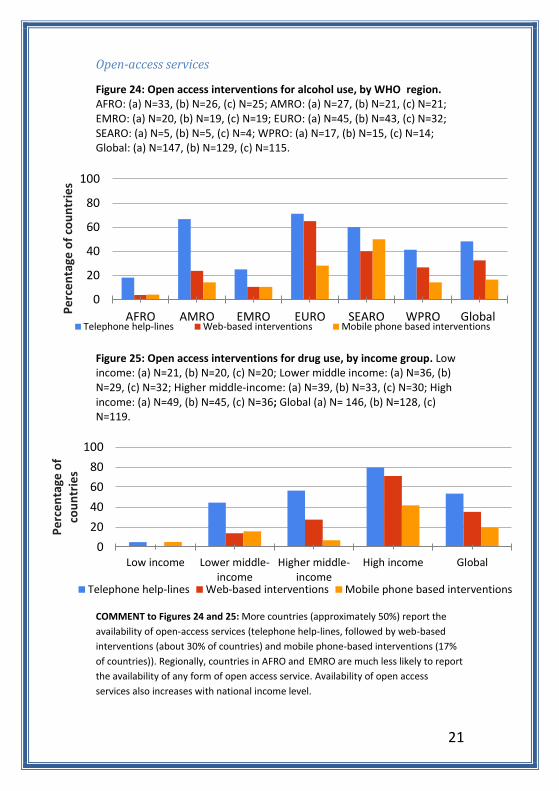
Figure 24: Open access interventions for alcohol use, by WHO region. AFRO: (a) N=33, (b) N=26, (c) N=25; AMRO: (a) N=27, (b) N=21, (c) N=21; EMRO: (a) N=20, (b) N=19, (c) N=19; EURO: (a) N=45, (b) N=43, (c) N=32; SEARO: (a) N=5, (b) N=5, (c) N=4; WPRO: (a) N=17, (b) N=15, (c) N=14; Global: (a) N=147, (b) N=129, (c) N=115.
Figure 25: Open access interventions for drug use, by income group. Low income: (a) N=21, (b) N=20, (c) N=20; Lower middle income: (a) N=36, (b) N=29, (c) N=32; Higher middle-income: (a) N=39, (b) N=33, (c) N=30; High income: (a) N=49, (b) N=45, (c) N=36; Global (a) N= 146, (b) N=128, (c) N=119.
COMMENT to Figures 24 and 25: More countries (approximately 50%) report the
availability of open-access services (telephone help-lines, followed by web-based
interventions (about 30% of countries) and mobile phone-based interventions (17%
of countries)). Regionally, countries in AFRO and EMRO are much less likely to report
the availability of any form of open access service. Availability of open access
services also increases with national income level.

22
0102030405060708090
100
Lowincome(N=10)
Lowermiddleincome(N=22)
Highermiddleincome(N=30)
Highincome(N=48)
Pe
rce
nta
ge o
f co
un
trie
s In other areas only
In other major cities only
In other major cities and in otherareas
In the capital city and in otherareas
In the capital city, in other majorcities and in other areas
In the capital city and in othermajor cities
In the capital city only
Mutual support/self-help groups
Figure 26: Location of Alcoholics Anonymous groups in countries by income group
COMMENT to Figure 26: Mutual support/self-help groups for individuals with
substance use disorders, like Alcoholics Anonymous and Narcotics Anonymous, are
now available in most parts of the world, as are groups designed for the relatives and
friends of individuals with substance use disorders, such as Al-Anon and Alateen.
Atlas results show these groups mainly concentrated in capital cities. Unlike other
services, however, there is better distribution of mutual support/self-help groups in
more peripheral areas of reporting countries.

23
0
10
20
30
40
50
60
70
80
90
100
Low income(N=20)
Lower middleincome (N=35)
Higher middleincome (N=41)
High income(N=48)
Global(N=145)
Pe
rce
nta
ge o
f co
un
trie
s
Very high (61-100%) High (31-60%) Some (1-30%) None (0%)
7. Prevention
School-based substance use prevention
Figure 27: Coverage of school based programmes for prevention of substance use, by income group
COMMENT to Figure 27: School based universal prevention is reported to be
implemented in the majority of Countries with varying levels of coverage. While
most countries report providing some form of school based prevention, more than
80% of countries have less than 60% national school-based prevention coverage.
Furthermore, among the low- and lower middle-income countries, less than 6% of
countries report having a very high coverage of school-based prevention, and 35% of
the low-income countries report having no national coverage at all.

24
0
20
40
60
80
100
AFRO(N=24)
AMRO(N=26)
EMRO(N=14)
EURO(N=43)
SEARO(N=3)
WPRO(N=14)
Global(N=124)
Pe
rce
nta
ge o
f co
un
trie
s
People with tuberculosis Children and adolescents
Pregnant women Parents
0
20
40
60
80
100
AFRO(N=22)
AMRO(N=26)
EMRO(N=18)
EURO(N=45)
SEARO(N=6)
WPRO(N=17)
Global(N=134)
Pe
rce
nta
ge o
f co
un
trie
s
Children and adolescents Parents People with HIV/AIDS Pregnant women
Targeted prevention
Figure 28: Availability of prevention programmes for alcohol use for target populations, by WHO region
Figure 29: Availability of prevention programmes for drug use for target populations, by WHO region
COMMENT to Figures 28 and 29: In most cases, the main focus of targeted alcohol
prevention is people with tuberculosis (80%) followed by programs targeting
children and adolescents (38%). This contrasts with drug use prevention where
children and adolescents are more commonly targeted (78% of countries) followed
by 60% of countries targeting parents.
25
0
10
20
30
40
50
60
Low income(N=22)
Lower middleincome (N=41)
Higher middleincome (N=42)
High income(N=48)
Global (N=154)
Pe
rce
nta
ge o
f co
un
trie
s
None (0) Few (1-10%) Some (11 - 30%) Many (31 - 60%) Most (61 - 100%)
0
10
20
30
40
50
60
Low income(N=23)
Lower middleincome (N=41)
Higher middleincome (N=42)
High income(N=49)
Global (N=156)
Pe
rce
nta
ge o
f co
un
trie
s
None (0) Few (1-10%) Some (11 - 30%) Many (31 - 60%) Most (61 - 100%)
Screening and brief interventions (ante-natal services)
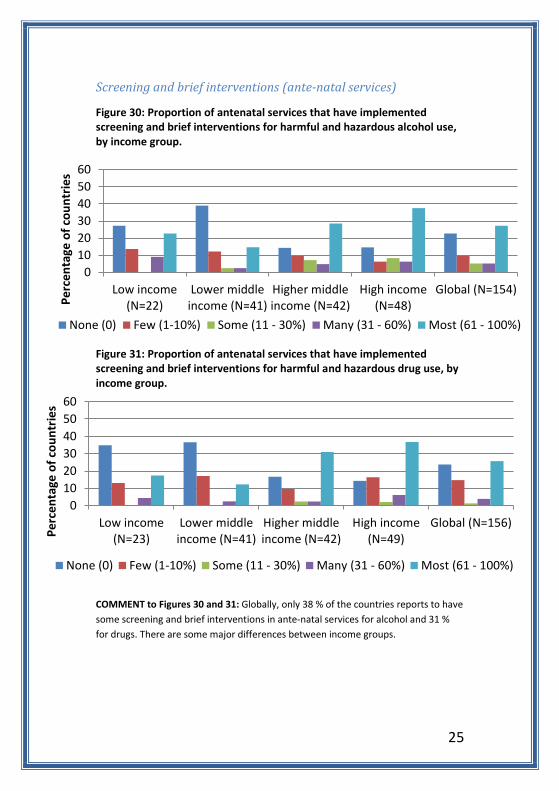
Figure 30: Proportion of antenatal services that have implemented screening and brief interventions for harmful and hazardous alcohol use, by income group.
Figure 31: Proportion of antenatal services that have implemented screening and brief interventions for harmful and hazardous drug use, by income group.
COMMENT to Figures 30 and 31: Globally, only 38 % of the countries reports to have
some screening and brief interventions in ante-natal services for alcohol and 31 %
for drugs. There are some major differences between income groups.

26
0
10
20
30
40
50
60
70
80
90
100
AFRO(N=34)
AMRO(N=28)
EMRO(N=22)
EURO(N=48)
SEARO(N=8)
WPRO(N=20)
Global(N=160)
Pe
rce
nta
ge o
f co
un
trie
s
Psychiatrists
Psychologists
Psychiatric nurses
Social workers
Medical doctors notspecialized in psychiatryor addiction medicine
Nurses not specialized inpsychiatry
addiction medicinespecialists
Community healthworkers
Addiction counsellors
8. Workforce Figure 32: Professionals providing treatment and care for substance use disorders, by WHO region.
COMMENT to Figure 32: Globally, 95% of countries report that psychiatrists are
involved in the treatment of substance use disorders, followed by 86% for
psychologists.
27
0
10
20
30
40
50
60
70
80
90
100
Low income(N=23)
Lower middleincome (N=43)
Higher middleincome (N=42)
High income(N=51)
Pe
rce
nta
ge o
f co
un
trie
s
Psychiatrists
Psychologists
Psychiatric nurses
Social workers
Medical doctors notspecialized in psychiatry oraddiction medicine
Nurses not specialized inpsychiatry
addiction medicinespecialists
Community healthworkers
Addiction counsellors
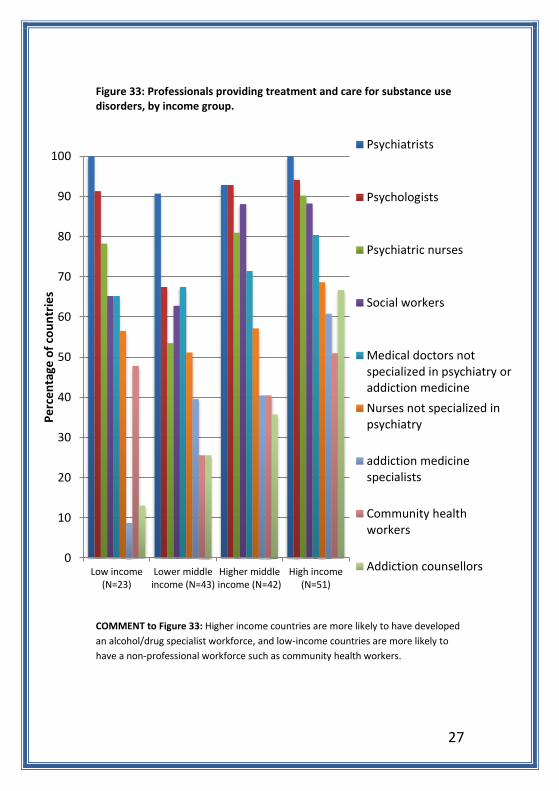
Figure 33: Professionals providing treatment and care for substance use disorders, by income group.
COMMENT to Figure 33: Higher income countries are more likely to have developed
an alcohol/drug specialist workforce, and low-income countries are more likely to
have a non-professional workforce such as community health workers.

28
0
20
40
60
80
100
Low income(N=23)
Lower middle-income (N=38)
Higher middle-income (N=40)
High income(N=49)
Global (N=150)Pe
rce
nta
ge o
f co
un
trie
s
Short-cycle tertiary education Bachelor’s level Master’s level Doctoral levelNone
0102030405060708090
100
Low income(N=23)
Lower middle-income (N=39)
Higher middle-income (N=40)
High income(N=50)
Global (N=153)Pe
rce
nta
ge o
f co
un
trie
s
Short-cycle tertiary education Bachelor’s level
Master’s level Doctoral level
None
Education
Figure 34: Level of educational attainment in treatment of substance use disorders, by income group
Figure 35: Level of educational attainment in prevention of substance use, by income group
COMMENT to Figures 34 and 35: Almost 30% of countries reported no training
programmes for treatment of substance use disorders (52% of low-income countries
vs 16% of high-income countries) with short cycle tertiary education programmes
being the most common globally (48%). Similarly, 31% of countries report no
professional development/education in substance use prevention (57% in low-
income countries and 17% in high-income countries).
29
0
10
20
30
40
50
60
70
80
90
100
AFRO(N=32)
AMRO(N=28)
EMRO(N=20)
EURO(N=48)
SEARO(N=7)
WPRO(N=20)
Global(N=155)
Pe
rce
nta
ge o
f co
un
trie
s
Psychiatrists
Medical doctors
Nurses
Psychologists
Social workers
Counsellors
Community healthworkers
None
0
20
40
60
80
100
Low income(N=23)
Lower middle-income (N=41)
Higher middle-income (N=37)
High income(N=45)
Global (N=147)Pe
rce
nta
ge o
f co
un
trie
s
Psychiatrists Medical doctors Nurses
Psychologists Social workers Counsellors
Postgraduate training
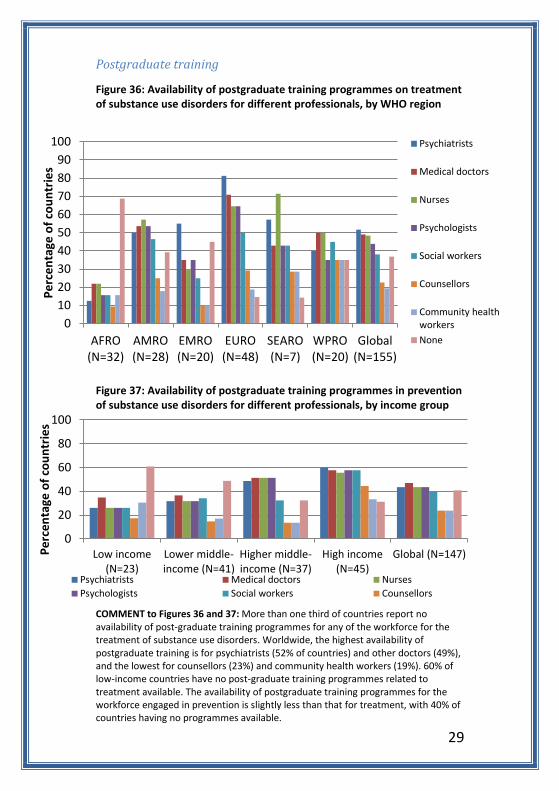
Figure 36: Availability of postgraduate training programmes on treatment of substance use disorders for different professionals, by WHO region
Figure 37: Availability of postgraduate training programmes in prevention of substance use disorders for different professionals, by income group
COMMENT to Figures 36 and 37: More than one third of countries report no availability of post-graduate training programmes for any of the workforce for the treatment of substance use disorders. Worldwide, the highest availability of postgraduate training is for psychiatrists (52% of countries) and other doctors (49%), and the lowest for counsellors (23%) and community health workers (19%). 60% of low-income countries have no post-graduate training programmes related to treatment available. The availability of postgraduate training programmes for the workforce engaged in prevention is slightly less than that for treatment, with 40% of countries having no programmes available.

30
0102030405060708090
100
Low income(N=23)
Lower middle-income (N=40)
Higher middle-income (N=38)
High income(N=49)
Global (N=151)
Pe
rce
nta
ge o
f co
un
trie
s
Psychiatrists NursesMedical doctors PsychologistsSocial workers Addiction medicine specialists/narcologistsAddiction counsellors Community health workersNone
0
20
40
60
80
100
Low income(N=23)
Lower middle-income (N=39)
Higher middle-income (N=37)
High income(N=47)
Global (N=147)
Pe
rce
nta
ge o
f co
un
trie
s
Psychiatrists NursesMedical doctors PsychologistsSocial workers Addiction medicine specialists/narcologistsAddiction counsellors Community health workersNone
Continuing professional education
Figure 38: Availability of continuing professional education for professionals working in treatment of substance use disorders, by income group
Figure 39: Availability of continuing professional education for professionals working in prevention of substance use, by income group
COMMENT to Figures 38 and 39: For both treatment and prevention, continuing professional education programmes for psychiatrists and medical doctors, nurses, psychologists and social workers are generally available in between 50 and 60% of countries, with programmes for addiction medicine specialists, counsellors and community health workers close to 30%. The low rates of programmes for addiction medicine specialists probably relates to the lack of this professional category in many countries. Europe, which has a high proportion of countries with this cadre, also has a high proportion receiving continuing professional education in this area.

31
0
10
20
30
40
50
60
70
80
90
100
AFRO(N=28)
AMRO(N=28)
EMRO(N=19)
EURO(N=48)
SEARO(N=8)
WPRO(N=17)
Global(N=148)
Pe
rce
nta
ge o
f co
un
trie
s
None
One data collectionsystem for alcohol useonly
One data collectionsystem for drug useonly
Two separate datacollection systems foralcohol and drug use
One data collectionsystem for bothalcohol and drug use
0102030405060708090
100
Low income(N=19)
Lowermiddleincome(N=39)
Highermiddleincome(N=40)
High income(N=49)
Pe
rce
nta
ge o
f co
un
trie
s None
One data collectionsystem for alcohol useonly
One data collectionsystem for drug use only
Two separate datacollection systems foralcohol and drug use
One data collectionsystem for both alcoholand drug use
Health Information Systems
Figure 40: Existence of an epidemiological data collection system, by WHO region
Figure 41: Existence of an epidemiological data collection system, by income group
COMMENT to Figures 40 and 41: Globally, 76% of countries report having an
epidemiological data collection system, either for drug use, alcohol use or both.
Lower income countries are less likely to have any epidemiological system with only
48% of countries reporting having a system, compared to 94% of high-income
countries.
32
0
20
40
60
80
100
AFRO AMRO EMRO EURO SEARO WPRO Global
Pe
rce
nta
ge o
f co
un
trie
s
For alcohol use For drug use
0
20
40
60
80
100
AFRO AMRO EMRO EURO SEARO WPRO Global
Pe
rce
nta
ge o
f co
un
trie
s Alcohol
Drugs
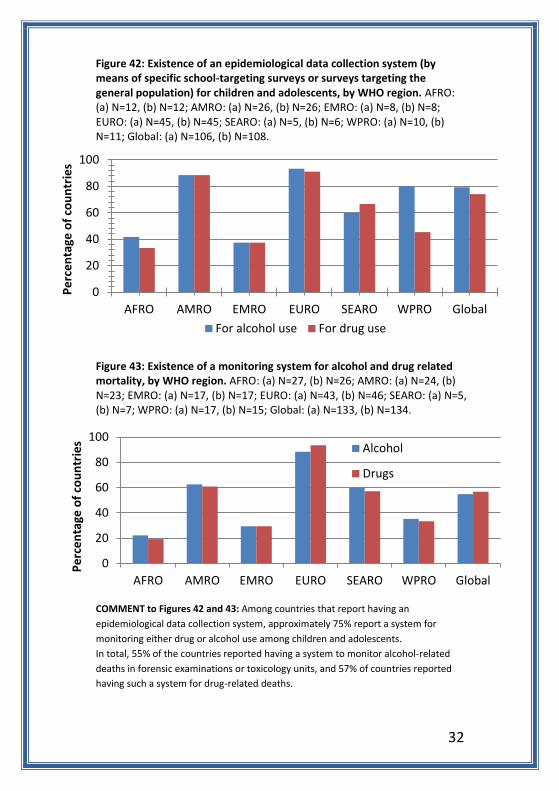
Figure 42: Existence of an epidemiological data collection system (by means of specific school-targeting surveys or surveys targeting the general population) for children and adolescents, by WHO region. AFRO: (a) N=12, (b) N=12; AMRO: (a) N=26, (b) N=26; EMRO: (a) N=8, (b) N=8; EURO: (a) N=45, (b) N=45; SEARO: (a) N=5, (b) N=6; WPRO: (a) N=10, (b) N=11; Global: (a) N=106, (b) N=108.
Figure 43: Existence of a monitoring system for alcohol and drug related mortality, by WHO region. AFRO: (a) N=27, (b) N=26; AMRO: (a) N=24, (b) N=23; EMRO: (a) N=17, (b) N=17; EURO: (a) N=43, (b) N=46; SEARO: (a) N=5, (b) N=7; WPRO: (a) N=17, (b) N=15; Global: (a) N=133, (b) N=134.
COMMENT to Figures 42 and 43: Among countries that report having an
epidemiological data collection system, approximately 75% report a system for
monitoring either drug or alcohol use among children and adolescents.
In total, 55% of the countries reported having a system to monitor alcohol-related
deaths in forensic examinations or toxicology units, and 57% of countries reported
having such a system for drug-related deaths.

33
0
10
20
30
40
50
60
70
80
90
100
Pe
rce
nta
ge o
f co
un
trie
s
None
One data collection system foralcohol use disorders only
One data collection system fordrug use disorders only
Two separate data collectionsystems alcohol and drug usedisorders
One data collection system forboth alcohol and drug usedisorders
Figure 44: Existence of a data collection system based on health services delivery, by WHO region
COMMENT to Figure 44: Globally, 72% of countries reported having a national data
collection system for services to people with either alcohol or drug use disorders.
The most common system, reported by over 50% of countries, is one that collects
data on both alcohol and drug use disorders.

34
0
10
20
30
40
50
60
70
80
90
100
AFRO(N=22)
AMRO(N=23)
EMRO(N=13)
EURO(N=47)
SEARO(N=4)
WPRO(N=14)
Global(N=123)
Pe
rce
nta
ge o
f co
un
trie
s
Not reported in the last five years
Compiled but not in a specific substance use report
Compiled in a specific substance use report
Figure 45: Inclusion of epidemiological data in national reports, by WHO region
COMMENT to Figure 45: Globally, data have been reported in the last five years in
78% of the countries, and 53% of countries report having compiled data on
substance use in a specific substance use report.

35
0
10
20
30
40
50
60
70
80
90
100
AFRO(N=22)
AMRO(N=21)
EMRO(N=16)
EURO(N=44)
SEARO(N=6)
WPRO(N=14)
Global(N=123)
Pe
rce
nta
ge o
f co
un
trie
s
Not reported in the last five years
Compiled but not in a specific substance use report
Compiled in a specific substance use report
Figure 46: Inclusion of data based on health services delivery in national reports, by WHO region
COMMENT to Figure 46: Reporting on the delivery of services is largely similar to
reporting of epidemiological data, with 78% of countries reporting health service
data in the last five years.