ASX Release · 2017-10-19 · ASX Release / 20 October 2017 Investor Relations Mr Alistair Reid...
99
ASX Release / 20 October 2017 Investor Relations Mr Alistair Reid Manager Investor Relations +61 3 8660 1959 Media Relations Mr Tim Duncan Hinton & Associates +61 3 9600 1979 St Barbara Limited Level 10, 432 St Kilda Road, Melbourne VIC 3004 T +61 3 8660 1900 F +61 3 8660 1999 ACN 009 165 066 Locked Bag 9, Collins Street East, Melbourne VIC 8003 W www.stbarbara.com.au 2017 Annual Report and Notice of Annual General Meeting The 2017 Annual General Meeting of St Barbara Limited will be held at 11:00 am Melbourne time (UTC + 11 hours) on Wednesday 29 November 2017, in the Royce Conference Room, Royce Hotel, 379 St Kilda Road, Melbourne. The 2017 Annual Report, Notice of Annual General Meeting and sample Proxy Form are attached, as distributed to shareholders today. A live audio webcast of the Annual General Meeting will be available at St Barbara’s website at www.stbarbara.com.au/investors/webcast, or by clicking here. The audio webcast is ‘listen only’ and does not enable questions. The audio webcast will subsequently be made available on the website. For personal use only
Transcript of ASX Release · 2017-10-19 · ASX Release / 20 October 2017 Investor Relations Mr Alistair Reid...

ASX Release / 20 October 2017
Investor Relations Mr Alistair Reid Manager Investor Relations +61 3 8660 1959
Media Relations Mr Tim Duncan Hinton & Associates +61 3 9600 1979
St Barbara Limited Level 10, 432 St Kilda Road, Melbourne VIC 3004 T +61 3 8660 1900 F +61 3 8660 1999 ACN 009 165 066 Locked Bag 9, Collins Street East, Melbourne VIC 8003 W www.stbarbara.com.au
2017 Annual Report and Notice of Annual General Meeting
The 2017 Annual General Meeting of St Barbara Limited will be held at 11:00 am Melbourne time (UTC
+ 11 hours) on Wednesday 29 November 2017, in the Royce Conference Room, Royce Hotel, 379 St Kilda
Road, Melbourne.
The 2017 Annual Report, Notice of Annual General Meeting and sample Proxy Form are attached, as
distributed to shareholders today.
A live audio webcast of the Annual General Meeting will be available at St Barbara’s website at
www.stbarbara.com.au/investors/webcast, or by clicking here. The audio webcast is ‘listen only’ and does
not enable questions. The audio webcast will subsequently be made available on the website.
For
per
sona
l use
onl
y

Annual Report 2017
For
per
sona
l use
onl
y

ST BARBARA LIMITED 2017Annual Report
i
St Barbara at a glance
St Barbara was established in 1969 and is an ASX 200listed gold mining company (ASX:SBM).
St Barbara has two mining operations:
Leonora Operations in Western Australia, and
Simberi Operations in Papua New Guinea.
Leonora Operations comprise the Gwalia undergroundmine and associated processing plant. The Gwaliaunderground mine is St Barbara’s cornerstone asset.The Gwalia deposit has an average Ore Reserve grade of7.8 g/t Au down to 2,140 metres below surface, a mineplan to at least FY 24, and remains open at depth.Gwalia compares favourably against other ASX listedgold mines on grade, reserve size, mine life, annualproduction and cost per ounce.
SimberiOperations has an open pit mine and associatedprocessing plant. Simberi produced 116 koz of gold inFY 17 with the remaining oxide project life extended toFY 20. Existing sulphide reserves and exploration on theneighbouring Tabar Islands provide the potential forSimberi Operations to extend mine life.
At 30 June 2017, St Barbara had Mineral Resources of9.63 million ounces of contained gold, including OreReserves of 4.31 million ounces of contained gold.
Growth initiatives planned for FY 18 include:
The Gwalia Extension Projectwill extend mining atGwalia to at least 2,000 mbs. The Project has anoverall budget of A$100 million and is expected totake two and a half to three years to construct. Theproject consists of two main components; aventilation upgrade and paste aggregate fill.
Deep drilling at Gwalia below the existing OreReserves (which remain open at depth) with theobjective of increasing Resources and Reserves.
Exploration utilising new seismic geophysics atGwalia and the Leonora region.
Drilling of prospective sulphide oxide and coppergold targets on Tatau and Big Tabar Islands, nearSimberi Operations in PNG, and drilling for oxidesulphide targets on Simberi Island.
Drilling at Pinjin in Western Australia, and
Systematic evaluation of sensible, value accretiveinorganic growth opportunities.
St Barbara’s primary safety measure, total recordableinjury frequency rate, was a record low 1.2 for the yearto June 2017, an excellent result for a mixed jurisdictioncombination of underground and open pit operations.
FY 17 at a glance
Record operational performance
Record safety
Record production from continuing operations
Record low All In Sustaining Cost (AISC)
Achieved or exceeded guidance at both operations
Record financial results
Record underlying profit
Record cash flow from operating activities
US$ senior secured debt repaid in full
Positive growth outcomes
A$100M Gwalia extension project commenced
Reserves and Resources increased at Gwalia
Simberi oxide mine life extended
$0.06 per share fully franked dividend for year
0
2
4
6
2013 2014 2015 2016 2017
Record Low Total Recordable InjuryFrequency Rate 1.2
0
100,000
200,000
300,000
400,000
2013 2014 2015 2016 2017Gwalia Simberi
Record Production from continuing operations381,101 ounces
0
500
1,000
1,500
2013 2014 2015 2016 2017
Record Low All in Sustaining CostA$907/oz
For
per
sona
l use
onl
y

ST BARBARA LIMITED 2017Annual Report
ii
St Barbara at a glance
4.55.7
4.63.9
9.19.6
FY 16 FY 17Leonora Simberi
Mineral Resources(Moz)
SimberiLeonora (Gwalia mine)
• Gwalia underground mine• FY17 production 265 koz• FY18F production
245 260 koz• 2.1 Moz Ore Reserve
(open at depth)• Mine plan to FY24
Growth initiatives• $100 million Gwalia
Extension Project to extendmining to at least 2,000mbs
• Deep drilling targetingReserve and Resourceadditions to extend mine life
Ore Reserves as at 30 June 2017
Ore Reserves Mt g/t Au Moz
Leonora, Western Australia
Gwalia 8.6 7.8 2.1
Tower Hill 2.5 3.7 0.3
Simberi, Papua New Guinea
Oxide 10.9 1.3 0.5
Sulphide 12.5 3.5 1.4
Total Reserves all Regions 34.6 3.9 4.3
Leonora
Australia
Notes: All in Sustaining Cost is a non IFRS measure, refer page 5. Total Recordable Injury Frequency Rate is measured for each million hours worked on a 12 month rollingbasis. All Ore Reserves and Mineral Resources figures are as at 30 June 2017, refer to pages 74 to 80 for details. Mineral Resources are reported inclusive of OreReserves. Mine lives based on Ore Reserves at 30 June 2017. FY18 guidance figures per June 2017 Quarterly Report released to ASX on 26 July 2017. Data is roundedas displayed in charts, discrepancies in totals may occur due to rounding.
Western Australia Gwalia deep drilling, adjacent and below
existing Reserves Gwalia and Leonora region seismic exploration Pinjin drilling
Papua New Guinea Simberi oxide near mine drilling Tatau and Big Tabar Islands copper gold drilling Tatau Island oxide and sulphide drilling
FY18 planned exploration
2,250 km2 of prospective tenements across Western Australia and Papua New Guinea
• Open pit mine• FY17 production 116 koz• FY18F production
105 – 115 koz• 0.5 Moz oxide and 1.4 Moz
sulphide Ore Reserve(sulphide open at depth)
• Mine life extended to midFY20
Growth initiatives• Exploration of near mine
targets and on adjacentTatau and Big Tabar Islands
• Copper gold porphyryexploration with Newcrest
Simberi
PNG
2.1 2.4
1.9 1.9
4.0 4.3
FY 16 FY 17
Leonora Simberi
Total
Ore Reserves(Moz)
For
per
sona
l use
onl
y

ST BARBARA LIMITED 2017Directors’ Report
Page 2
Contents Page
Directors’ Report 2
Directors 2Principal activities 2Overview of group results 3Overview of operating results 4Analysis of Australian operations 5Analysis of Simberi operations 6Discussion and analysis of the income statement 7Discussion and analysis of the cash flow statement 8Discussion and analysis of the balance sheet 8Business strategy and future prospects 9Material business risks 10Risk management 12Regulatory environment 12Information on Directors 13Meetings of Directors 14Directors’ Interests 14Remuneration report 15Indemnification and insurance of officers 35Proceedings on behalf of the company 35Environmental management 35Non audit services 35Auditor independence 35Events occurring after the end of the financial year 35Rounding of amounts 36Auditor’s independence declaration 37
Financial Report 38
Ore Reserves and Mineral Resources Statement 74
Shareholder Information 81
Corporate Governance Statement
The Company’s 2017 Corporate Governance Statement wasreleased to the ASX on 20 October 2017 and is available atwww.stbarbara.com.au/profile/governance
Sustainability Report
The Company’s 2017 Sustainability Report was released to theASX on 20 October 2017 and is available atwww.stbarbara.com.au/sustainability
Directors’ Report
Directors
The Directors present their report on the “St Barbara Group”,consisting of St Barbara Limited and the entities it controlled at theend of, or during, the financial year ended 30 June 2017.
The following persons were Directors of St Barbara Limited at anytime during the year and up to the date of this report:
T C NetscherNon Executive Chairman
R S VassieManaging Director & CEO
K J GleesonNon Executive Director
D E J MoroneyNon Executive Director
The qualifications, experience and special responsibilities of theDirectors are presented on page 13.
Principal activities
During the year the principal activities of the Group were miningand the sale of gold, mineral exploration and development. Therewere no significant changes in the nature of activities of the Groupduring the year.
Dividends
There were no dividends paid or declared during the financial year.
Subsequent to year end, the Board declared a fully franked dividendof 6 cents per ordinary share.
For
per
sona
l use
onl
y

ST BARBARA LIMITED 2017Directors’ Report
Page 3
Overview of group results
The consolidated result for the year is summarised as follows:
2017$’000
2016$’000
EBITDA(3)(6) 293,302 298,106
EBIT(2)(6) 207,719 217,191
Profit before tax(4) 189,706 183,402
Statutory profit (1) after tax 157,572 169,388
Total net significant items aftertax
(2,794) 42,031
EBITDA (6) (excluding significantitems)
320,575 284,050
EBIT (6) (excluding significantitems)
234,992 203,135
Profit before tax (excludingsignificant items)
216,979 169,346
Underlying net profit after tax(5)(6) 160,366 127,357
Details of significant items included in the statutory profit for theyear are reported in the table below. Descriptions of each item areprovided in Note 3 to the Financial Report.
2017$’000
2016$’000
Asset impairments and writedowns
(27,273)
Gain on sale of KOTH and Kailis 14,056
Significant items before tax (27,273) 14,056
Income tax 24,479 27,975
Significant items after tax (2,794) 42,031
(1) Statutory profit is net profit after tax attributable to owners of theparent.
(2) EBIT is earnings before interest revenue, finance costs and income taxexpense.
(3) EBITDA is EBIT before depreciation and amortisation.(4) Profit before tax is earnings before income tax expense.(5) Underlying net profit after income tax is net profit after income tax
(“statutory profit”) excluding significant items as described in Note 3 tothe financial statements.
(6) EBIT, EBITDA and underlying net profit after tax are non IFRS financialmeasures, which have not been subject to review or audit by the Group’sexternal auditors. These measures are presented to enableunderstanding of the underlying performance of the Group by users.
During the 2017 financial year the Group recorded another year ofstrong financial performance, with key achievements over the yearbeing:
• Statutory net profit after tax of $157,572,000 (2016:$169,388,000) for the year ended 30 June 2017.
Repayment of the U.S. debt that commenced in June 2015resulted in a significant reduction in interest paid. Total financecosts of $19,961,000 (2016: $35,749,000) reflected the benefitof the lower interest expense.
Cash flows from operations of $301,314,000 (2016:$269,199,000) reflecting the strong performance of both Gwaliaand Simberi.
• Full repayment of the U.S. senior secured notes and otherfacilities totalling $228,564,000 (2016: $142,096,000),strengthening the Group’s balance sheet.
To provide additional clarity into the performance of the operationsunderlying measures for the year are reported, together with thestatutory results. Underlying net profit after tax, representing netprofit excluding significant items, was $160,366,000 for the year(2016: $127,357,000).
Cash on hand at 30 June 2017 was $160,909,000 (2016:$136,689,000). Total interest bearing borrowings were $547,000(2016: $226,318,000). US$167,975,000 US senior secured notes at30 June 2016 were repaid during the year, with the final principalrepayment made on 15 March 2017.
The key shareholder returns for the year are presented in the tablebelow.
2017 2016
Basic earnings per share(cents per share) 31.71 34.21
Return on capital employed 55% 49%
Change in closing share price (1)% 418%
Underlying shareholder returns for the year are presented in thetable below.
2017 2016
Basic earnings per share(cents per share)
32.27 25.72
Return on capital employed 61% 48%
For
per
sona
l use
onl
y

ST BARBARA LIMITED 2017Directors’ Report
Page 4
The table below provides a summary of the underlying profit beforetax from operations in Australia and at Simberi.
Year ended 30 June2017$’000
AustralianOperations
SimberiOperations Group
Revenue 441,947 199,755 641,702
Mine operating costs (143,107) (124,137) (267,244)
Gross Profit 298,840 75,618 374,458
Royalties (17,303) (4,471) (21,774)
Depreciation andamortisation
(61,903) (19,838) (81,741)
Underlying profitfrom operations(1)
219,634 51,309 270,943
(1) Excludes impairment losses, corporate costs, exploration expenses,interest and tax and is non IFRS financial information, which has notbeen subject to review or audit by the Group’s external auditors. Themeasure is presented to enable an understanding of the underlyingperformance of the operations.
The table below provides a summary of the cash contribution fromoperations in Australia and at Simberi.
Year ended 30 June2017$’000
AustralianOperations
SimberiOperations Group
Operating cashcontribution
279,040 73,454 352,494
Capital expenditure –sustaining
(30,206) (3,711) (33,917)
Capital expendituregrowth(2)
(9,402) (9,402)
Capital expenditure –Gwalia ExtensionProject
(7,861) (7,861)
Cash contribution(1) 231,571 69,743 301,314(1) Cash contribution is non IFRS financial information, which has not been
subject to audit by the Group’s external auditors. This measure isprovided to enable an understanding of the cash generatingperformance of the operations.
(2) Growth capital at Gwalia represents deep drilling expenditure.
Overview of operating results
During the 2017 financial year the Group’s operations continued toachieve record production, cost and safety performance.
Safety of people working across the Group is of paramountimportance and this focus has been demonstrated through theimprovement in the total recordable injury frequency rate (TRIFR) toa new record of 1.2 as at 30 June 2017 (2016: 2.1), calculated as arolling 12 month average.
Total production for the Group in the 2017 financial year was381,101 ounces of gold (2016: 386,564 ounces), and gold salesamounted to 380,173 ounces (2016: 381,761 ounces) at an averagegold price of $1,685 per ounce (2016: $1,595 per ounce). The prioryear gold production and sales included 9,112 ounces from King ofthe Hills which was disposed of in October 2015.
Consolidated All In Sustaining Cost (AISC) for the Group was $907per ounce in 2017 (2016: $933 per ounce), reflecting the benefits ofstrong results achieved at Gwalia and Simberi.
Total net cash contribution from the operations was $301,314,000(2016: $269,199,000) as a result of the record performance fromGwalia and Simberi, which was after capital expenditure and fundingof growth capital related to the extension project and deep drillingprogram at Gwalia.
For
per
sona
l use
onl
y

ST BARBARA LIMITED 2017Directors’ Report
Page 5
Analysis of Australian operations
Total sales revenue from the Leonora operations of $441,947,000(2016: $440,333,000) was generated from gold sales of 260,828ounces (2016: 276,210 ounces) in the year at an average achievedgold price of $1,692 per ounce (2016: $1,592 per ounce). During the2017 year, revenue benefitted from the significantly higher averagegold price. The decrease in gold ounces sold was mainly attributableto the King of the Hills mine, which contributed 9,112 ounces in theprior year before its divestment in October 2015.
A summary of production performance for the year ended 30 June2017 is provided in the table below.
Details of 2017 production performance
Gwalia King of the Hills
2017 2016 2017 2016
Underground oremined (kt) 790 924
Grade (g/t) 10.7 9.3
Ore milled (kt) 828 951 76
Grade (g/t) 10.3 9.1 3.9
Recovery (%) 97 96 95
Gold production(oz)
265,057 267,166 9,112
Cash cost (1)
(A$/oz)592 609 893
All In SustainingCost (AISC) (2)(A$/oz)
785 783 964
(1) Cash operating costs are mine operating costs including government
royalties, and after by product credits. This is a non IFRS financialmeasure which has not been subject to review or audit by the Group’sexternal auditors. It is presented to provide meaningful information toassist management, investors and analysts in understanding the resultsof the operations. Cash operating costs are calculated according tocommon mining industry practice using The Gold Institute (USA)Production Cost Standard (1999 revision).
(2) All In Sustaining Cost (AISC) is based on cash operating costs, and addsitems relevant to sustaining production. It includes some but not all, ofthe components identified in World Gold Council’s Guidance Note onNon GAAP Metrics – All In Sustaining Costs and All In Costs (June 2013),which is a non IFRS financial measure.
Gwalia
Gwalia produced 265,057 ounces of gold in 2017 (2016: 267,166ounces). The consistent high performance at Gwalia reflects thepositive impact of improvements in productivity and successfulimplementation of innovations in mining achieved since 2015.
Ore tonnes mined from the Gwalia underground mine decreased to790,000 tonnes in 2017 from 924,000 tonnes in 2016, largely due tomine sequencing issues and weather related delays in the March2017 quarter.
Ore mined grades increased from 9.3 grams per tonne in 2016 to10.7 grams per tonne in 2017, mainly due to reduced dilution andhigh grade shoots present in stopes that cannot be reliablyestimated by production drilling. Ore milled grade increased from9.1 grams per tonne in 2016 to 10.3 grams per tonne in line with thehigher grade of ore mined. The Gwalia mill continued to performstrongly in 2017, with the average recovery improving to 97% (2016:96%).
Gwalia unit cash operating costs(1) for the year were $592 per ounce(2016: $609 per ounce), reflecting the benefit of higher averagegrade and sustained production efficiencies through innovations.The unit All In Sustaining Cost (AISC)(2) for Gwalia was $785 perounce in 2017 (2016: $783 per ounce). Total cash operating costs atGwalia of $156,914,000 were lower compared with the prior year(2016: $162,704,000) due mainly to the lower production volumes.
In 2017 Gwalia generated net cash flows, after capital and deepdrilling expenditure, of $231,571,000 (2016: $223,616,000). Thedeep drilling program in 2017 targeted extensions to the Gwalia lodesystem below 2,000 metres below surface with expenditure in theyear totalling $9,402,000 (2016: $9,006,000 – targeted extensionsdown to 2,000 metres below surface).
During the year the Board approved capital expenditure relating tothe Gwalia extension project. The project will enable undergroundmining at Gwalia to extend to at least 2,000 metres below surface,as well as providing the foundation for potential further extensions.The project has an overall budget of $100,000,000 and will take twoand a half to three years to construct. Expenditure incurred duringthe year totalled $7,861,000 (2016: $Nil)
109131
185 183
214
248267 265
FY10 FY11 FY12 FY13 FY14 FY15 FY16 FY17
Gwalia gold production(koz)
For
per
sona
l use
onl
y

ST BARBARA LIMITED 2017Directors’ Report
Page 6
Analysis of Simberi operation
During 2017 the Simberi operation continued to build on thesuccessful turnaround achieved in 2016. Total sales revenue fromSimberi in 2017 was $199,755,000 (2016: $169,782,000), generatedfrom gold sales of 119,345 ounces (2016: 105,551 ounces) at anaverage achieved gold price of A$1,669 per ounce (2016: A$1,604per ounce).
A summary of production performance at Simberi for the year ended30 June 2017 is provided in the table below.
Details of 2017 production performance
Simberi
2017 2016
Open pit ore mined (kt) 4,020 3,372
Grade (g/t) 1.13 1.26
Ore milled (kt) 3,690 3,315
Grade (g/t) 1.19 1.26
Recovery (%) 82 82
Gold production (oz) 116,044 110,286
Cash cost(1) (A$/oz) 1,092 1,143
All In Sustaining Cost (AISC)(2)(A$/oz)
1,187 1,293
(1) Cash operating costs are mine operating costs including governmentroyalties, and after by product credits. This is a non IFRS financialmeasure which has not been subject to review or audit by the Group’sexternal auditors. It is presented to provide meaningful information toassist management, investors and analysts in understanding the resultsof the operations. Cash operating costs are calculated according tocommon mining industry practice using The Gold Institute (USA)Production Cost Standard (1999 revision).
(2) All In Sustaining Cost (AISC) is based on cash operating costs, and addsitems relevant to sustaining production. It includes some but not all, ofthe components identified in World Gold Council’s Guidance Note onNon GAAP Metrics – All In Sustaining Costs and All In Costs (June 2013),which is a non IFRS financial measure.
Simberi
Simberi production of 116,044 ounces of gold was the highest sincethe Group acquired the operations in September 2012 (2016:110,286 ounces).
Ore tonnes mined and total volume of material moved has increasedsignificantly since 2015. Ore mined in 2017 totalled 4,020,000tonnes, whichwas an increase of 19% on the prior year. The increasein mining performance in the 2017 financial year was largelyattributable to continuous improvements introduced during theprior year and further operating efficiencies across the operations.
Ore mined grades were generally lower than the prior year at 1.13grams per tonne gold (2016: 1.26 grams per tonne). The overallgrade in 2017 was impacted by the new Pigibo pit in the first quarterof the year, where the upper area of the pit comprised ore with lowdensity. Ore mined grades over the remainder of 2017 improved aswaste stripping efforts successfully exposed higher grade ore areas.
Ore milled increased to 3,690,000 tonnes (2016: 3,315,000 tonnes),reflecting improvements in both Aerial Rope Conveyor and millthroughput.
Simberi unit cash operating costs for the year were $1,092 per ounce(2016: $1,143 per ounce), reflecting the positive impact of increasedproduction and lower operating costs. The unit All In Sustaining Cost(AISC) for Simberi for the year was $1,187 per ounce (2016: $1,293per ounce). Total cash operating costs at Simberi during the 2017year were consistent with prior year at $126,720,000 (2016:$126,057,000) despite the significant increase in mining activity andore milled.
In 2017 Simberi generated positive net cash flows, after capitalexpenditure, of $69,743,000 (2016: $33,808,000).
4,1516,294
9,899
14,335
FY14 FY15 FY16 FY17
Simberi annual total material moved(kt)
44
80
110 116
FY14 FY15 FY16 FY17
Simberi gold production(koz)
For
per
sona
l use
onl
y

ST BARBARA LIMITED 2017Directors’ Report
Page 7
Discussion and analysis of the income statement Revenue
Total revenue increased from $610,115,000 in 2016 to $641,702,000in 2017. Revenue from Leonora and Simberi was higher than theprevious year due to the higher average gold price and an increasein ounces sold at Simberi.
Mine operating costs
Mine operating costs in 2017 were $267,244,000 compared with$280,927,000 in the prior year. The decrease in operating costs wasmainly due to lower mining volumes at Gwalia, together with thefact that the prior year included some costs related to King of theHills.
Other revenue and income
Interest revenuewas $1,948,000 (2016: $1,960,000), earned on cashheld.
Other income for the year was $86,000 (2016: $3,564,000).
Exploration
Total exploration expenditure incurred during the 2017 yearamounted to $20,083,000 (2016: $15,792,000), with an amount of$9,436,000 (2016: $9,006,000) capitalised, relating to drillingexpenditure at Gwalia. Exploration expenditure expensed in theincome statement in the year was $10,647,000 (2016: $6,786,000).Exploration activities during the year focused on investigating highlyprospective near mine high grade oxide targets at Simberi,undertaking an extensive deep drilling program at Gwalia, 3DSeismic programs at Gwalia and regional exploration in WesternAustralia.
Corporate costs
Corporate costs for the year of $20,977,000 (2016: $19,184,000)comprised mainly expenses relating to the corporate office andcompliance related costs. Expenditure in 2017wasmarginally higherthan in the prior year as a result of increased business developmentactivities.
Royalties
Royalty expenses for the year were $21,774,000 (2016:$21,455,000). Royalties paid in Western Australia are 2.5% of goldrevenues, plus a corporate royalty of 1.5% of gold revenues.Royalties paid in Papua New Guinea are 2.25% of gold revenuesearned from the Simberi mine. The increase in royalty expenses in2017 was attributable to increased gold revenue from Leonora andSimberi.
Depreciation and amortisation
Depreciation and amortisation of fixed assets and capitalised minedevelopment amounted to $85,583,000 (2016: $80,915,000) for theyear. Depreciation and amortisation attributable to the Australianoperations was $61,903,000 (2016: $63,492,000). The expense atSimberi was $19,838,000 (2015: $12,098,000), with the highercharge due to increased production and alignment of remainingasset lives with the current life of mine following the completion ofthe strategic review during the year.
Impairment losses and asset write downs
At 31 December 2016, an impairment loss of $27,273,000 wasrecognised against the Group’s Simberi cash generating unit (2016:$Nil) and further information is provided in Note 7 to the financialstatements.
Other expenses
Other expenditure of $3,608,000 (2016: $1,967,000) includedamounts associated with share based payments and charges forCompany projects.
Net finance costs
Finance costs in the year were $19,961,000 (2016: $35,749,000).Finance costs comprised interest paid and payable on borrowingsand finance leases of $7,444,000 (2016: $28,608,000), borrowingcosts relating to the senior secured notes amortised and premiumpaid for early repayment of $10,859,000 (2016: $5,434,000) and theunwinding of the discount on the rehabilitation provision of$1,658,000 (2016: $1,707,000).
Net foreign exchange gain
A net foreign exchange gain of $3,037,000 was recognised for theyear (2016: net gain of $142,000), which included a realised foreigncurrency gain of $2,125,000 (2016: loss of $7,899,000) onrepayments of US denominated debt during the year and a netrealised/unrealised currency gain of $1,390,000 (2016: net gain of$7,993,000) related to Australian and US intercompany loans andthird party balances.
Income tax
An income tax expense of $32,134,000 was recognised for the 2017year (2016: income tax expense of $14,014,000). Income taxexpense of $58,905,000 on Australian taxable income included aprovision of $10,478,000 for research and development creditspreviously recognised by the Company for projects whichAusIndustry reviewed during the year and assessed as ineligible inaccordance with research and development legislation.Management maintain that the projects are eligible and haverequested a review of AusIndustry’s findings. Thematter is currentlyfollowing the statutory review process.
A tax credit of $26,775,000 has been booked relating to previouslyunrecognised PNG deferred tax assets. This amount has beenbooked based on the current life of mine plan for the Simberioperations.
For
per
sona
l use
onl
y

ST BARBARA LIMITED 2017Directors’ Report
Page 8
Discussion and analysis of the cash flow statement
Operating activities
Cash flows from operating activities for the year were $303,226,000(2016: $242,788,000), reflecting the benefit of higher receipts fromcustomers and significantly lower payments to suppliers andemployees compared to the prior year.
Receipts from customers of $640,354,000 (2016: $615,244,000)reflected the higher achieved gold price in 2017 and increased goldsales from Simberi. Payments to suppliers were $309,097,000 (2016:$336,805,000), with the reduction mainly attributable to lowermining volumes at Gwalia.
Payments for exploration expensed in the year amounted to$10,647,000 (2016: $6,786,000). Interest paid in the year was$11,304,000 (2016: $30,405,000), with the lower expense due torepayment of the US senior secured notes. Borrowing costs of$8,017,000 in the year (2016: $145,000) related to the premiumspaid to retire the US senior secured notes prior to the 15 April 2018maturity date.
Investing activities
Net cash flows used in investing activities amounted to $53,108,000(2016: $46,122,000) for the year. Higher mine developmentexpenditure of $32,036,000 (2016: $21,071,000) includedexpenditure related to the extension project at Gwalia.
Lower expenditure on property, plant and equipment of $9,796,000in 2017 (2016: $16,057,000) was mainly due to lower expenditure atSimberi.
Exploration expenditure capitalised during the year totalled$9,436,000 (2016: $9,006,000), which related to the deep drillingprogram at Gwalia.
Investing expenditure during the year was in the following majorareas:
Underground mine development and infrastructure at Gwalia –$24,175,000 (2016: $23,285,000)
Gwalia extension project – $7,861,000 (2016: $Nil)
Purchase of property, plant and equipment at Gwalia –$5,554,000 (2016: $3,780,000)
Purchase of property, plant and equipment at Simberi –$3,711,000 (2016: $9,402,000)
Investments in Catalyst Metals Limited and Peel Mining Limitedshares totalling $4,540,000 (2016: $Nil)
During the 2017 year the deferred proceeds related to the saleof King of the Hills amounting to $2,700,000 was received
Financing activities
Net cash flows related to financing activities in 2017 were a netoutflow of $228,446,000 (2016: net outflow of $140,130,000). Themain movements in financing cash flows included:
Full repayment of the US senior secured notes of $225,409,000(2016: $37,798,000).
Premium funding payments of $2,209,000 (2016: $Nil). Repayment of finance leases amounting to $946,000 (2016:
$2,225,000). In the prior year the Red Kite facility was fully repaid giving rise
to a cash outflow of $102,073,000.
During the year cash backed banking guarantees of $118,000 werereleased (2016: $1,966,000).
Discussion and analysis of the balance sheet
Net assets and total equity
St Barbara’s net assets and total equity increased substantiallyduring the year by $160,513,000 to $461,127,000 as a result of thestrong profit result and significant reduction in total liabilities withthe full repayment of the US senior secured notes in 2017.
Non current assets decreased during the year by $32,508,000mainlydue to the impairment and asset write down at Simberi at 31December 2016, together with depreciation and amortisation duringthe year.
Current trade and other payables decreased to $36,480,000 at 30June 2017 (2016: $39,768,000), reflecting the reduction inoperational expenditure during the year.
The deferred tax balance was a net liability of $1,822,000 (2016: netasset of $1,098,000). A current provision for tax payable of$29,692,000 was recognised at 30 June 2017 (2016: $Nil).
Debt management and liquidity
The available cash balance at 30 June 2017 was $160,909,000 (2016:$136,689,000), with no amounts held on deposit as restricted cashand reported within trade receivables (2016: $118,000).
Total interest bearing liabilities reduced to $547,000 at 30 June 2017(2016: $226,318,000) representing lease liabilities.
The AUD/USD exchange rate as at 30 June 2017 was 0.7695 (30 June2016: 0.7452).
79 77
137161
(340) (347)
(226)
(1)
(400)
(300)
(200)
(100)
100
200
2014 2015 2016 2017
Cash and debt(A$M)
Cash Debt
For
per
sona
l use
onl
y

ST BARBARA LIMITED 2017Directors’ Report
Page 9
Business strategy and future prospects
St Barbara’s strategic focus is on mining lower cost gold deposits inAustralia and at Simberi in Papua New Guinea. Currently the Grouphas a diversified asset portfolio spanning underground and open cutmines, and exploration projects in Australia and Papua New Guinea.A successful turnaround was completed at the Simberi operationsduring the prior year through optimisation of the processing plant,improving the mining fleet, and productivity improvements inmining operations, which has continued in the 2017 year.
St Barbara’s strategy is to generate shareholder value through thediscovery and development of gold deposits and production of gold.The Group aligns its decisions and activities to this strategy byfocusing on key value drivers: relative total shareholder returns,growth in gold ore reserves, return on capital employed andexploration success.
During the 2017 financial year the Group achieved a number ofstrategic milestones:
Record annual gold production was achieved at Simberi, andGwalia continued its consistent strong performance. At Gwaliaperformance was broadly in line with the prior year’s recordproduction. At Simberi the turnaround of the operations thatcommenced in the prior year was further consolidated in 2017.
Record safety performance for the Group, reporting a TotalRecordable Injury Frequency Rate (TRIFR) of 1.2 (2016: 2.1).
Through strong cash generation from the operations the Groupreduced its debt by $228,564,000 (2016: $142,096,000),repaying the US senior secured notes in full, twelve monthsahead of schedule.
During the year the deep drilling program at Gwalia resulted inan increase to Mineral Resources and Ore Reserves, and theexploration programs in Western Australia and Simberi on theneighbouring islands were advanced.
Subsequent to year end the Board declared a fully frankeddividend of 6 cents per ordinary share to be paid on 28September 2017.
Strategic drivers for the business include:
Optimising cash flow and reducing the cost base: The Group isfocused on optimising cash flow from operations throughmaximising production and managing costs at its existingoperations, enhancing operating capabilities and incorporatingnew technologies across St Barbara. The Group will continue toidentify opportunities to enhance productivity and improveoperating performance in a volatile gold market.
Improving productivity: The Group is focused on maintainingconsistent operations at Gwalia and Simberi. St Barbaracontinues to invest to improve infrastructure, mining fleets andcapability to ensure consistent and reliable production at itsoperations.
Growing the ore reserve base through the development ofexisting Mineral Resources and exploration activities: A numberof potential organic growth opportunities have been identified,which could increase production and extend the life of theGwalia and Simberi operations. During 2017 a deep drillingprogram continued at Gwalia with the objective to extend theGwalia mineral resource and develop the case for mining belowthe current reserve. At Simberi, a sulphide ore reserve, whichhas been estimated at 1.4 Moz, provides an opportunity tocreate a long life production centre at Simberi, while incrementalextensions to the oxide mine life at Simberi is also a focus. Inaddition the Group is generating and evaluating explorationtargets in the Tabar Island Group in Papua New Guinea and onits tenements in regional Western Australia.
Maintaining a conservative financial profile: The Group willcontinue to maintain prudent financial management policieswith the objective of maintaining liquidity to ensure appropriateinvestments in the operations. The Group’s financialmanagement policies are aimed at generating net cash flowsfrom operations to meet financial commitments and fundexploration to the extent viable and appropriate. The Group’scapital management plan is reviewed and discussed with theBoard on a regular basis. During 2017 the Company successfullyrepaid all of its US debt ahead of schedule using the strong cashflows generated by the operations.
Continue and strengthen the Group’s commitment to employeesand local communities: The Group considers the capability andwellbeing of its employees as key in delivering the businessstrategy. Creating and sustaining a safe work environment andensuring that operations conform to applicable environmentaland sustainability standards are an important focus for theGroup. The Group invests in the training and development of itsemployees, talent management and succession planning.
The Company views such efforts as an important component ofinstilling St Barbara’s values throughout the organisation andretaining continuity in the workforce. The Group hasimplemented a comprehensive talent management frameworkto strengthen the capacity to attract, motivate and retaincapable people. The Group also has an ongoing commitment towork with local communities to improve infrastructure,particularly in health and education, support local businesses,and provide venues for leisure activities, and other opportunitiesfor developing communities in which the Group operates.
Within Australia, the Gwalia underground mine with ore reserves of2.1 million ounces remains the flagship asset of the Group,generating strong cash flows. To optimise the value of ongoing truckhaulage at Gwalia the extension project was approved by the Boardin March 2017 with a budget of $100 million; truck haulage withadditional ventilation was identified as the preferred long termmaterials movement solution for the mine. The Project consists oftwomain components, a ventilation upgrade and paste aggregate fillinvolving mixing paste from surface with waste crushedunderground to fill stope cavities.
In Papua New Guinea, a prefeasibility study (PFS) for the Simberisulphide project was completed during 2016. A strategic review ofthe PNG assets, including the Simberi mine, was completed inSeptember 2016. As a result of the review it was decided that StBarbara would retain ownership and continue to operate theSimberi mine. In addition the St Barbara Group entered into anOption and Farm in Agreement with Newcrest PNG ExplorationLimited for copper gold porphyry exploration on the tenements onthe Tatau and Big Tabar Islands.
The Group’s 2018 financial year budget was developed in thecontext of a volatile gold market and strengthening Australian dollaragainst the United States dollar. The Group’s priorities in the 2018financial year are to continue consistent production fromGwalia andSimberi, drive productivity improvements at both operations andcontain capital expenditure. For the 2018 financial year the Group’soperational and financial outlook is as follows:
Gold production is expected to be in the range 350,000 to375,000 ounces.
All In Sustaining Cost is expected to be in the range of $970 perounce to $1,035 per ounce.
Sustaining capital expenditure is expected to be in the range of$40 million to $45 million.
Growth capital at Gwalia is anticipated to be between $50million to $55 million.
For
per
sona
l use
onl
y

ST BARBARA LIMITED 2017Directors’ Report
Page 10
Exploration expenditure is anticipated to be between $16millionand $20 million.
The focus for the exploration program in 2018will be to continue thedeep drilling at Gwalia, continued exploration at Pinjin in WesternAustralia and to drill targets on the Tatau and Big Tabar islands inPapa New Guinea.
Material business risks
St Barbara prepares its business plan using estimates of productionand financial performance based on a business planning system anda range of assumptions and expectations. There is uncertainty inthese assumptions and expectations, and risk that variation fromthem could result in actual performance being different to plannedoutcomes. The uncertainties arise from a range of factors, includingthe Group’s international operating scope, nature of the miningindustry and economic factors. The material business risks faced bythe Group that may have an impact on the operating and financialprospects of the Group as at 30 June 2017 are:
Fluctuations in the United States Dollar (“USD”) spot gold price:Volatility in the gold price creates revenue uncertainty andrequires careful management of business performance toensure that operating cash margins are maintained despite a fallin the spot gold price.
Declining gold prices can also impact operations by requiring areassessment of the feasibility of a particular exploration ordevelopment project. Even if a project is ultimately determinedto be economically viable, the need to conduct such areassessment could cause substantial delays and/or interruptoperations, which may have a material adverse effect on theresults of operations and financial condition.
In assessing the feasibility of a project for development, theGroup may consider whether a hedging instrument should beput in place in order to guarantee aminimum level of return. Forexample, the Group put in place a gold collar structure when theKing of the Hills project was commissioned, and used goldforward contracts to secure revenues during the completion ofthe turnaround at Simberi.
The Group has a centralised treasury function that monitors therisk of fluctuations in the USD gold price and impacts onexpenditures from movements in local currencies. Wherepossible, the exposure to movements in the USD relative to USDdenominated expenditure is offset by the exposure to the USDgold price (a natural hedge position).
Government regulation: The Group’s mining, processing,development and exploration activities are subject to variouslaws and statutory regulations governing prospecting,development, production, taxes, royalty payments, labourstandards and occupational health, mine safety, toxicsubstances, land use, water use, communications, land claims oflocal people and other matters.
No assurance can be given that new laws, rules and regulationswill not be enacted or that existing laws, rules and regulationswill not be applied in a manner which could have an adverseeffect on the Group’s financial position and results of operations.Any such amendments to current laws, regulations and permitsgoverning operations and activities of mining and explorationcompanies, or more stringent implementation thereof, couldhave a material adverse impact on the Group. Failure to complywith any applicable laws, regulations or permitting requirementsmay result in enforcement actions against the Group, includingorders issued by regulatory or judicial authorities causingoperations to cease or be curtailed, and may include corrective
measures requiring capital expenditures, installation ofadditional equipment, or remedial actions.
Operating risks and hazards: The Group’s mining operations,consisting of open pit and underground mines, generally involvea high degree of risk, and these risks increase when miningoccurs at depth. The Group’s operations are subject to all thehazards and risks normally encountered in the exploration,development and production of gold. Processing operations aresubject to hazards such as equipment failure, toxic chemicalleakage, loss of power, fast moving heavy equipment, failure ofdeep sea tailings disposal pipelines and retaining dams aroundtailings containment areas, rain and seismic events which mayresult in environmental pollution and consequent liability. Theimpact of these events could lead to disruptions in productionand scheduling, increased costs and loss of facilities, which mayhave a material adverse impact on the Group’s results ofoperations, financial condition and prospects. These risks aremanaged by a structured operations risk managementframework.
Reliance on transportation facilities and infrastructure: TheGroup depends on the availability and affordability of reliabletransportation facilities and infrastructure (e.g. roads, bridges,airports, power sources and water supply) to deliverconsumables to site, and final product to market. Interruptionin the provision of such infrastructure (e.g. due to adverseweather; community or government interference) couldadversely affect St Barbara's operations, financial condition andresults of operations. The Group’s operating procedures includebusiness continuity plans which can be enacted in the event aparticular piece of infrastructure is temporarily unavailable.
Production, cost and capital estimates: The Group preparesestimates of future production, operating costs and capitalexpenditure relating to production at its operations. The abilityof the Group to achieve production targets, or meet operatingand capital expenditure estimates on a timely basis cannot beassured. The assets of the Group are subject to uncertainty withregards to ore tonnes, grade, metallurgical recovery, groundconditions, operational environment, funding for development,regulatory changes, accidents and other unforeseencircumstances such as unplannedmechanical failure of plant andequipment. Failure to achieve production, cost or capitalestimates, or material increases to costs, could have an adverseimpact on the Group’s future cash flows, profitability andfinancial condition. The development of estimates is managedby the Group using a rigorous budgeting and forecasting process.Actual results are compared with forecasts to identify driversbehind discrepancies which may result in updates to futureestimates.
Gwalia Extension Project: The project to install an undergroundpaste aggregate fill plant and ventilation upgrade are critical toenabling mining at depth. Any material delays in completing theproject, or material defects in the design or construction of theproject, may have an adverse impact on the productivity of themine due to ineffective handling of waste, or prevent mining atdepth due to inadequate ventilation. The Group is managingthese risks through the establishment and oversight of adedicated project team, thorough procurement processes toensure appropriate qualified and expert suppliers are engagedto design and construct each component, and regular reviews bysenior management of project progress on critical pathelements.
Changes in input costs: Mining operations and facilities areintensive users of electricity, gas and carbon based fuels. Energyprices can be affected by numerous factors beyond the Group's
For
per
sona
l use
onl
y

ST BARBARA LIMITED 2017Directors’ Report
Page 11
control, including global and regional supply and demand,carbon taxes, inflation, political and economic conditions, andapplicable regulatory regimes. The prices of various sources ofenergy may increase significantly from current levels.
The Group's production costs are also affected by the prices ofcommodities it consumes or uses in its operations, such asdiesel, lime, sodium cyanide and explosives. The prices of suchcommodities are influenced by supply and demand trendsaffecting themining industry in general and other factors outsidethe Group's control. Increases in the price for materialsconsumed in St Barbara's mining and production activities couldmaterially adversely affect its results of operations and financialcondition.
Certain of the Group's operations use contractors for the bulk ofthe mining services at those operations, and some of itsconstruction projects are conducted by contractors. As a result,the Group's operations are subject to a number of risks,including:
- negotiation and renewal of agreements with contractors onacceptable terms;
- failure of contractors to perform under their agreements,including failure to comply with safety systems and standards,contractor insolvency and failure to maintain appropriateinsurance;
- failure of contractors to comply with applicable legal andregulatory requirements; and
- changes in contractors.
In addition, St Barbara may incur liability to third parties as aresult of the actions of its contractors. The occurrence of one ormore of these risks could have a material adverse effect on itsresults of operations and financial position.
The Group manages risks associated with input costs through acentralised procurement function which analyses market trends,supply environment, and operational demand planning, toestablish appropriate sourcing strategies for spend categories.
Exploration and development risk: Although the Group’sactivities are primarily directed towards mining operations andthe development of mineral deposits, its activities also includethe exploration for mineral deposits and the possibility of thirdparty arrangements including joint ventures, partnerships, tolltreating arrangements or other third party contracts. An abilityto sustain or increase the current level of production in thelonger term is in part dependent on the success of the Group’sexploration activities and development projects, and theexpansion of existing mining operations.
The exploration for and development of mineral depositsinvolves significant risks that even a combination of carefulevaluation, experience and knowledge may not eliminate. Whilethe discovery of an ore body may result in substantial rewards,few properties that are explored subsequently have economicdeposits of gold identified, and even fewer are ultimatelydeveloped into producing mines. Major expenses may berequired to locate and establish mineral reserves, to establishrights to mine the ground, to receive all necessary operatingpermits, to develop metallurgical processes and to constructmining and processing facilities at a particular site. It isimpossible to ensure that the exploration or developmentprograms the Group plans will result in a profitable miningoperation.
Whether a mineral deposit will be commercially viable dependson a number of factors.
The Group has a disciplined approach to allocating budget toexploration projects. The Group also has investment criteria toensure that development projects are only approved if anadequate return on the investment is expected.
Ore Reserves and Mineral Resources: The Group's estimates ofOre Reserves and Mineral Resources are based on differentlevels of geological confidence and different degrees of technicaland economic evaluation, and no assurance can be given thatanticipated tonnages and grades will be achieved, that theindicated level of recovery will be realised or that Ore Reservescould be mined or processed profitably. The quality of any OreReserve or Mineral Resource estimate is a function of thequantity of available technical data and of the assumptions usedin engineering and geological interpretation, and modifyingfactors affecting economic extraction. Such estimates arecompiled by experienced and appropriately qualifiedgeoscientists using mapping and sampling data obtained frombore holes and field observations, and subsequently reported byCompetent Persons under the JORC Code.
Fluctuation in gold prices, key input costs to production, as wellas the results of additional drilling, and the evaluation ofreconciled production and processing data subsequent to anyestimate may require revision of such estimate.
Actual mineralisation or ore bodies may be different from thosepredicted, and any material variation in the estimated OreReserves, including metallurgy, grade, dilution, ore loss, orstripping ratio at the Group's propertiesmay affect the economicviability of its properties, and this may have a material adverseimpact on the Group's results of operations, financial conditionand prospects.
There is also a risk that depletion of reserves will not be offsetby discoveries or acquisitions or that divestitures of assets willlead to a lower reserve base. The reserve base of the Group maydecline if reserves aremined without adequate replacement andthe Groupmay not be able to sustain production beyond currentmine lives, based on current production rates.
Political, social and security risks: St Barbara has production andexploration operations in a developing country that is subject topolitical, economic and other risks and uncertainties. Theformulation and implementation of government policies in thiscountry may be unpredictable. Operating in developingcountries also involves managing security risks associated withthe areas where the Group has activities. The Group hasestablished policies and procedures to assist in managing andmonitoring government relations. The Group’s operatingprocedures at its mine in Papua New Guinea includes detailedsecurity plans.
Foreign exchange: The Group has an Australian dollarpresentation currency for reporting purposes. However, gold issold throughout the world based principally on the U.S. dollarprice, and most of the Group's revenues are realised in, or linkedto, U.S. dollars. The Group is also exposed to U.S. dollars andPapua New Guinea Kina in respect of operations located inPapua New Guinea as certain of its operating costs aredenominated in these currencies. There is a "natural" (but notperfect) hedgewhichmatches to some degree U.S. denominatedrevenue and obligations related to U.S. dollar expenditure. TheGroup is therefore exposed to fluctuations in foreign currencyexchange rates. The Group monitors foreign exchange exposureand risk on a monthly basis through the centralised treasuryfunction and a Management Treasury Risk Committee.
For
per
sona
l use
onl
y

ST BARBARA LIMITED 2017Directors’ Report
Page 12
Community relations: A failure to adequately managecommunity and social expectations within the communities inwhich the Group operates may lead to local dissatisfactionwhich, in turn, could lead to interruptions to production andexploration operations. The Group has an establishedstakeholder engagement framework to guide the managementof the Group’s community relations efforts. At Simberi there isa dedicated community relations team to work closely with thelocal communities and government.
Insurance: The Group maintains insurance to protect againstcertain risks. However, the Group’s insurance will not cover allthe potential risks associated with a mining company’soperations. The Groupmay also be unable tomaintain insuranceto cover these risks at economically feasible premiums.Insurance coverage may not continue to be available or may notbe adequate to cover any resulting liability. Moreover, insuranceagainst risks such as loss of title to mineral property,environmental pollution, or other hazards as a result ofexploration and production is not generally available to theGroup, or to other companies in the mining industry onacceptable terms. The Group might also become subject toliability for pollution or other hazards which may not be insuredagainst, or which it may elect not to insure against because ofpremium costs or other reasons. Losses from these events maycause the Group to incur significant costs that could have amaterial adverse effect upon its financial performance andresults of operations.
Weather and climactic conditions: The effects of changes inrainfall patterns, changing storm patterns and intensities havefrom time to time adversely impacted, and may in the futureadversely impact, the cost, production levels and financialperformance of the Group's operations. The Group's miningoperations have been, and may in the future be, subject fromtime to time to severe storms and high rainfalls leading toflooding and associated damage, which has resulted, and mayresult in delays to, or loss of production at its mines (e.g. due towater ingress and flooding at the base of the mine). Seismicactivity is of particular concern to mining operations. TheSimberi mine in Papua New Guinea is in an area known to beseismically active and is subject to risks of earthquakes and therelated risks of tidal surges and tsunamis.
Risk of impairment: If the gold price suffers a significant decline,or the operations are not expected to meet future productionlevels, there may be the potential for future impairment writedowns at any of the operations.
Risk management
The Groupmanages the risks listed above, and other day to day risksthrough an established enterprise wide risk managementframework, which conforms to Australian and internationalstandards and guidance. The Group’s risk reporting and controlmechanisms are designed to ensure strategic, safety, environment,operational, legal, financial, reputational and other risks areidentified, assessed and appropriately managed.
The financial reporting and control mechanisms are reviewed duringthe year bymanagement, the Audit and Risk Committee, the internalaudit function and the external auditor.
Senior management and the Board regularly review the risk portfolioof the business and the effectiveness of the Group’s management ofthose risks.
During July 2014, the Company announced that by operation of itsinternal reporting mechanisms, the provision of benefits to a foreignpublic official that may violate its Anti Bribery and Anti CorruptionPolicy or applicable laws in Australia or in foreign jurisdictions were
identified. The amount of the benefits provided to the foreign publicofficial was not material to the Company. The Company selfreported the matter to relevant authorities, including the AustralianFederal Police, and thematter is being assessed and investigated. Todate, there has been no action taken against the Company,consequently, the range of potential penalties, if any, cannot bereliable estimated. Should there be any prosecution, potentialpenalties if any are governed by laws in various jurisdictionsincluding Criminal Code 1995 (Cth) in Australia and/or the UK BriberyAct.
Regulatory environment
Australia
The Group’s Australianmining activities are inWestern Australia andgoverned byWestern Australian legislation, including theMining Act1978, the Mines Safety and Inspection Act 1994, Dangerous GoodsSafety Act 2004 and other mining related and subsidiary legislation.The Mining Rehabilitation Fund Act 2012 took effect from 1 July2013. The Mining Rehabilitation Fund replaces unconditionalenvironmental performance bonds for companies operating underthe Mining Act 1978.
The Group is subject to significant environmental regulation,including, inter alia, the Western Australian EnvironmentalProtection Act 1986, Contaminated Sites Act 2003, WildlifeConservation Act 1950, Aboriginal Heritage Act 1972 and theCommonwealth Environmental Protection and BiodiversityConservation Act 1999, as well as safety compliance in respect of itsmining and exploration activities.
The Group is registered pursuant to the National Greenhouse andEnergy Reporting Act 2007 under which it is required to reportannually its energy consumption and greenhouse gas emissions. StBarbara also reports to Government pursuant to both the EnergyEfficiency Opportunities Act 2006 and the National EnvironmentalProtection (National Pollutant Inventory) Measure (subsidiarylegislation to the National Environmental Protection Measures(Implementation) Act 1998). The Group has established datacollection systems and processes to meet these reportingobligations. The Group’s Australian operations are also required tocomply with the Australian Federal Government’s Clean Energy Act2011, effective from 1 July 2012.
Papua New Guinea
The primary Papua New Guinea mining legislation is the Mining Act1992, which governs the granting and cessation of mining rights.Under the Mining Act, all minerals existing on, in or below thesurface of any land in Papua New Guinea, are the property of theState. The Mining Act establishes a regulatory regime for theexploration for, and development and production of, minerals and isadministered by the Minerals Resources Authority. Environmentalimpact is governed by the Environment Act 2000, administered bythe Department of Environment and Conservation. The PNGgovernment has been reviewing the Mining Act since 2014. There isno public timeframe for completion of the review.
For
per
sona
l use
onl
y

ST BARBARA LIMITED 2017Directors’ Report
Page 13
Information on Directors
Tim C NetscherBSc (Eng) (Chemical), BCom, MBA, FIChE, CEng, MAICD
Independent Non Executive ChairmanAppointed as a Director 17 February 2014Appointed as Chairman 1 July 2015
Mr Netscher is an experienced international mining executive withextensive operational, project development, and transactionalexperience and expertise in senior executive management roles.Mr Netscher’s experience covers a wide range of resources includingnickel, coal, iron ore, uranium and gold and regions including Africa,Asia and Australia.
Other current listed company directorships:
Gold Road Resources Limited Western Areas Limited
Former listed company directorships in last 3 years:
Toro Energy Limited (resigned September 2016) Deep Yellow Limited (resigned December 2015) Gindalbie Metals Limited (resigned October 2014) Aquila Resources Limited (resigned July 2014)
Special responsibilities:
Chair of the Health, Safety, Environment and CommunityCommittee
Member of the Audit and Risk Committee Member of the Remuneration Committee
Robert S (Bob) VassieB. Mineral Technology Hons (Mining), GAICD, MAUSIMM
Managing Director and Chief Executive OfficerAppointed as Managing Director and CEO 1 July 2014
Mr Vassie is a mining engineer with over 30 years’ internationalmining industry experience and has 18 years’ experience in a rangeof senior management roles with Rio Tinto. He has particularexperience in operations management, resource developmentstrategy, mine planning, feasibility studies, business improvement,corporate restructuring and strategic procurement.
Other current listed public company directorships:
Tawana Resources NL (appointed 1 August 2017)
Former listed company directorships in last 3 years: Nil
Special responsibilities:
Member of the Health, Safety, Environment and CommunityCommittee
Kerry J GleesonLLB (Hons), FAICD
Independent Non Executive DirectorAppointed as a Director 18 May 2015
Ms Gleeson is an experienced corporate executive with over 20years’ boardroom and senior management experience acrossAustralia, UK and the US, in a variety of industries including mining,agriculture, chemicals, logistics and manufacturing. A qualifiedlawyer in both UK and Australia, she has significant expertise incomplex corporate finance and transactional matters, and incorporate governance in Australian and internationalbusinesses. She was a member of the Group Executive at IncitecPivot Limited for 10 years until 2013, including as Company Secretaryand General Counsel. Previously, she was a corporate finance andtransactional partner in an English law firm, and practised as a seniorlawyer at the Australian law firm, Ashurst.
Ms Gleeson is a Non Executive Director of Trinity College, Universityof Melbourne.
Other current listed company directorships: Nil
Former listed company directorships in last 3 years:
McAleese Limited (resigned September 2016)
Special responsibilities:
Chair of Remuneration Committee Member of the Audit and Risk Committee Member of the Health, Safety, Environment and Community
Committee
David E J MoroneyBCom, FCA, FCPA, GAICD
Independent Non Executive DirectorAppointed as a Director 16 March 2015
Mr Moroney is an experienced finance executive with more than 20years’ experience in senior corporate finance roles, including 15years in the mining industry, and extensive international workexperience with strong skills in finance, strategic planning,governance, risk management and leadership.
Mr Moroney is an independent non executive director of non ASXlisted Geraldton Fishermen’s Co operative Ltd (the southernhemisphere’s largest exporter of lobster) and chair of its Audit andRisk Management Committee and member of its Performance andNomination Committee. Mr Moroney is also an independent nonexecutive director of WA Super, Western Australia’s largest publicoffer superannuation fund (and Chair of the Risk Committee, and amember of the Compliance & Audit and Human ResourcesCommittees). Mr Moroney is also an independent non executivefinance director of Hockey Australia Ltd, the peak national sportingbody for hockey in Australia, and Chair of its Finance, Audit and RiskManagement Committee.
Other current listed company directorships: Nil
Former listed company directorships in last 3 years: Nil
Special responsibilities:
Chair of the Audit and Risk Committee Member of the Health, Safety, Environment and Community
Committee Member of the Remuneration Committee
For
per
sona
l use
onl
y
ST BARBARA LIMITED 2017Directors’ Report Remuneration Report (audited)
Page 14
Qualifications and experience of the Company Secretary
Rowan ColeB.Comm, CA, CIA, MBA, GAICD, Grad. Dip AGC, Dip Inv RelCompany Secretary
Mr Cole joined St Barbara in 2010 as General Manager CorporateServices and was appointed as Deputy Company Secretary in 2012and as Company Secretary in 2014.
He has over 30 years’ experience across chartered accounting, retailbanking, private and public companies. Mr Cole's experienceincludes external, internal and IT audit, risk management, customerservice delivery, marketing, strategy formulation, execution andmeasurement, process and business improvement, financial andbusiness reporting in senior roles including general manager, headof risk and compliance, chief audit executive and chief financial andrisk officer.
Information on Executives
Robert S (Bob) VassieB. Mineral Technology Hons (Mining), GAICD, MAUSIMManaging Director and Chief Executive Officer
Mr Vassie joined St Barbara as Managing Director and CEO in July2014. Mr Vassie is a mining engineer with over 30 years’international mining industry experience and has 18 years’experience in a range of senior management roles with Rio Tinto. Hehas particular experience in operations management, resourcedevelopment strategy, mine planning, feasibility studies, businessimprovement, corporate restructuring and strategic procurement.
Garth Campbell CowanB.Comm, Dip Applied Finance & Investments, FCAChief Financial Officer
Mr Campbell Cowan is a Chartered Accountant with over 30 years’experience in senior management and finance positions across anumber of different industries. He was appointed to the position ofChief Financial Officer in September 2006 and is responsible for theGroup’s Finance function, covering financial reporting andaccounting, treasury, taxation, internal audit, capital management,procurement and information technology. Mr Campbell Cowan alsohas executive responsibility for business development. Prior tojoining the Group, he was Director of Corporate Accounting atTelstra and has held senior leadership roles with WMC, NewcrestMining and ANZ.
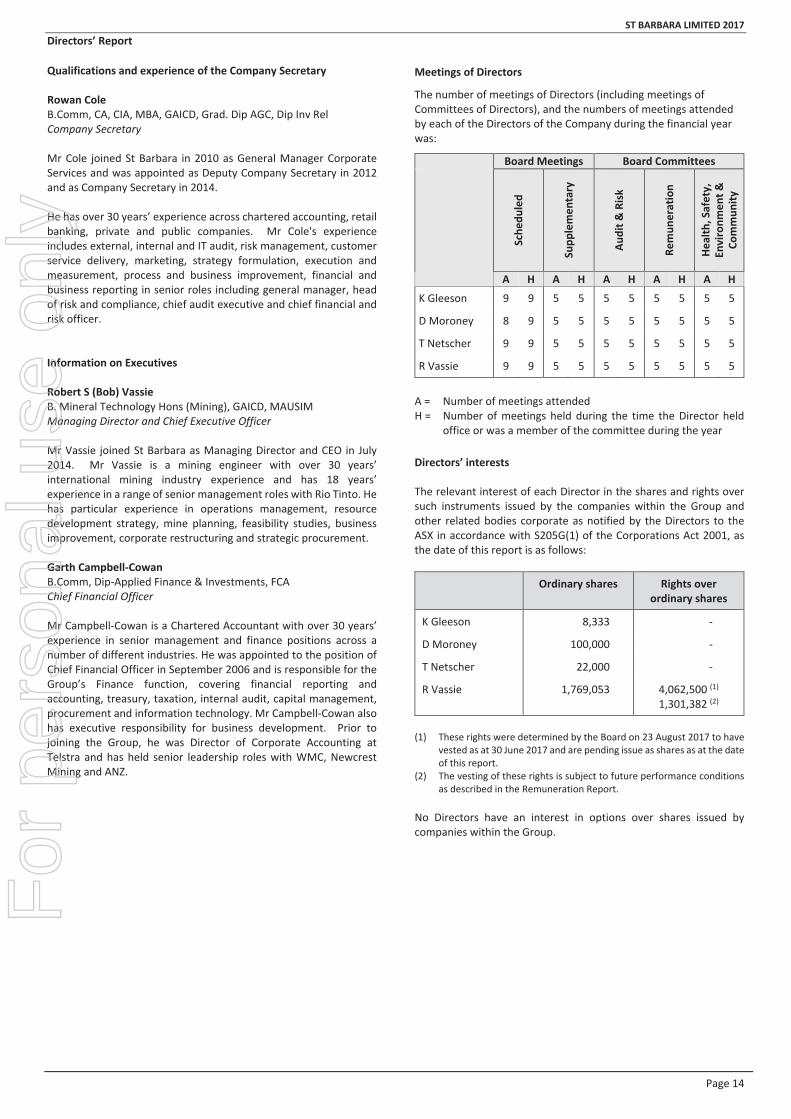
Meetings of Directors
The number of meetings of Directors (including meetings ofCommittees of Directors), and the numbers of meetings attendedby each of the Directors of the Company during the financial yearwas:
Board Meetings Board Committees
Sche
duled
Supp
lemen
tary
Audit&
Risk
Remun
eration
Health
,Safety,
Environm
ent&
Commun
ity
A H A H A H A H A H
K Gleeson 9 9 5 5 5 5 5 5 5 5
D Moroney 8 9 5 5 5 5 5 5 5 5
T Netscher 9 9 5 5 5 5 5 5 5 5
R Vassie 9 9 5 5 5 5 5 5 5 5
A = Number of meetings attendedH = Number of meetings held during the time the Director held
office or was a member of the committee during the year
Directors’ interests
The relevant interest of each Director in the shares and rights oversuch instruments issued by the companies within the Group andother related bodies corporate as notified by the Directors to theASX in accordance with S205G(1) of the Corporations Act 2001, asthe date of this report is as follows:
Ordinary shares Rights overordinary shares
K Gleeson 8,333
D Moroney 100,000
T Netscher 22,000
R Vassie 1,769,053 4,062,500 (1)
1,301,382 (2)
(1) These rights were determined by the Board on 23 August 2017 to havevested as at 30 June 2017 and are pending issue as shares as at the dateof this report.
(2) The vesting of these rights is subject to future performance conditionsas described in the Remuneration Report.
No Directors have an interest in options over shares issued bycompanies within the Group.
For
per
sona
l use
onl
y

ST BARBARA LIMITED 2017Directors’ Report Remuneration Report (audited)
Page 15
Remuneration Report (Audited)
Contents
1. Introduction and Key Management Personnel
2. 2017 Remuneration Summary
3. Executive Remuneration Strategy
4. Remuneration Governance
5. Remuneration Structure
6. Relationship between Group Performance and Remuneration
7. Remuneration Disclosure and Executive RemunerationOutcomes
8. Non Executive Director Remuneration
9. Additional Statutory Information
1. Introduction and Key Management PersonnelThis Remuneration Report describes the remuneration strategy andpractices that applied for the 2017 financial year. The reportprovides details of remuneration paid for the 2017 financial year toNon Executive Directors and the Executives named in this reportwith the authority and responsibility for planning, directing andcontrolling the activities of the Group, collectively referred to as KeyManagement Personnel (KMP).
Key Management Personnel during 2017
Non Executive Directors
Tim Netscher Independent Non Executive ChairmanKerry Gleeson Independent Non Executive DirectorDavid Moroney Independent Non Executive Director
Executives
Robert (Bob) Vassie Managing Director & Chief ExecutiveOfficer
Garth Campbell Cowan Chief Financial Officer
2. 2017 Remuneration Summary
The Group’s record operational and financial performance for the2017 financial year is reflected in the STI1 outcomes awarded toExecutives.
The Group’s outstanding transformation over the last three years isclearly demonstrated by a corresponding total shareholder return of2,308%,which ismany times the return of its comparator companiesand the ASX Gold Index for the same period. During this time, theGroup’s market capitalisation increased from $56 million to$1.4 billion, and the closing share price increased from $0.115 at30 June 2014 to $2.91 at 30 June 2017.
The Board considers that the Executive remuneration structure inplace during this period has been appropriate and aligned withincreasing shareholder wealth, and that Executives have justifiablyearned the at risk incentives awarded this year.
1 Short term incentive2 Long term incentive
2.1 Key remuneration outcomes for the 2017 financial year(details in Section 7)
STI1 Outcomes The average STI outcome for Executives was 90%of the maximum potential STI based on anassessment of Group and individual measures.This reflects the Group’s record safety, operatingand financial performance during 2017.
LTI2 Outcomes 100% of the 3 year LTI performance rightsassessed at 30 June 2017 vested. This isconsistent with the operational and strategicturnaround during the corresponding 3 yearperiod which resulted in total shareholderreturns of 2,308%, well above the return of anyof its comparator companies and the ASX GoldIndex for the same period.
ExecutiveRemuneration
Executive fixed remuneration increased by anaverage of 1% from 2016 to 2017.
NEDRemuneration
Overall NED fees increased by 1% from 2016to 2017.
2.2 Changes in the Executive remuneration framework during the2017 financial year (details in Section 5)
STI Composition The proportion of at risk remuneration forLevel 5 (CFO) was increased at target levelfrom 40% in 2016 to 45% in 2017.
2.3 Changes to Executive remuneration for the 2018 financial year(details in Section 5)
STI Composition The mix of Group and Individual STI targets isproposed to change weighting from 70%Group targets and 30% Individual targets in2017, to 80% Group targets and 20%Individual targets in 2018.
Executive fixedremuneration
Following a review of relevant marketremuneration data, the Board has approvedincreases in Executive fixed remuneration ofbetween 2.5% and 10% for the 2018 financialyear.
2.4 Changes to Non Executive Director Remuneration for the 2018financial year (details in Section 8)
Non ExecutiveDirectors fees
Following a review of comparable resourceindustry remuneration levels for NonExecutive Directors, the Board resolved toincrease Non Executive Directors fees by anaverage 10% for 2018.
The Board actively monitors market practices and recommendationsfrom industry participants on remuneration structure anddisclosure, and may amend the remuneration frameworkaccordingly at any time. The Board needs to ensure that the
For
per
sona
l use
onl
y
ST BARBARA LIMITED 2017Directors’ Report Remuneration Report (audited)
Page 16
remuneration framework attracts, retains and encourages highperformance by its key employees, whilst remaining aligned withshareholder experience.
3. Executive Remuneration StrategyThe Group’s Executive remuneration strategy is designed to attract,reward and retain high calibre, high performing, and teamorientated individuals capable of delivering the Group strategy. Theremuneration strategy and related employment policies andpractices are aligned with the Group strategy.
The objectives of the remuneration strategy for the 2017 financialyear were to ensure that:
total remuneration for Executives and each level of theworkforce was market competitive;
key employees were retained; total remuneration for Executives and managers comprised an
appropriate proportion of fixed remuneration andperformance linked at risk remuneration;
performance linked at risk remuneration encouraged andrewarded high performance aligned with value creation forshareholders, through an appropriate mix of short and longterm incentives;
the integrity of the remuneration review processes deliveredfair and equitable outcomes.
The Group’s remuneration strategy and practices are influenced bythe Australian gold mining industry and the peer companies withwhich it competes for talent.
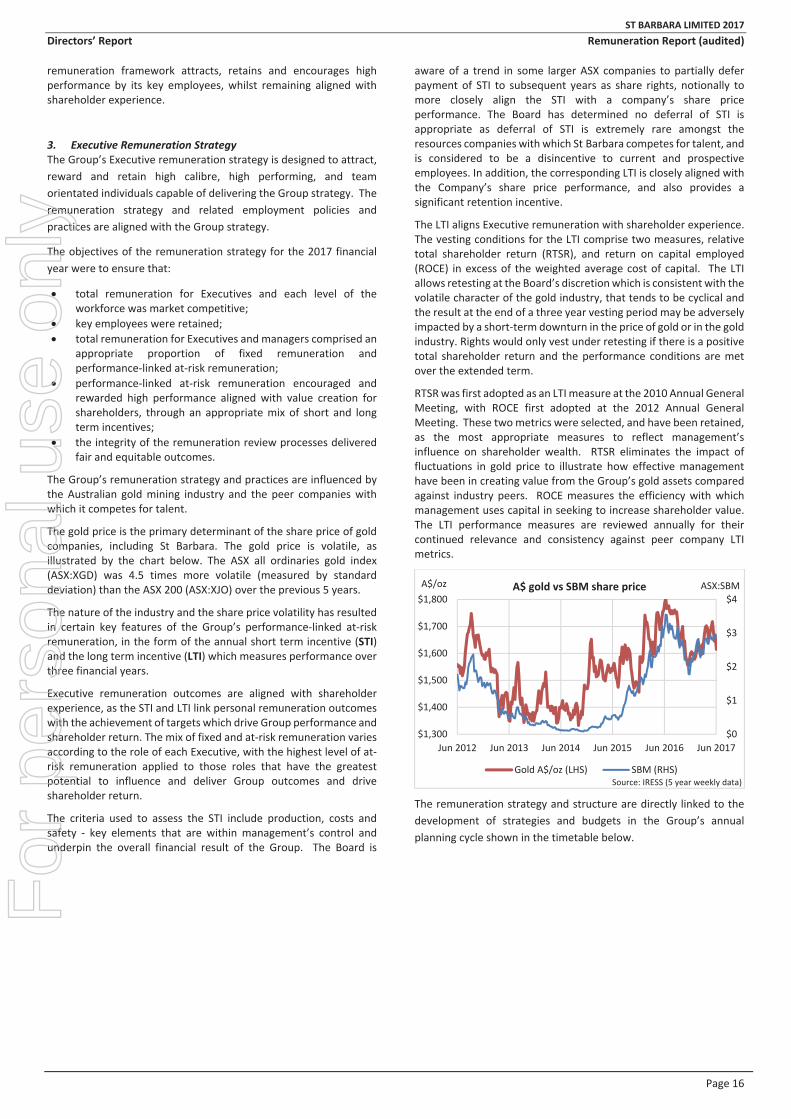
The gold price is the primary determinant of the share price of goldcompanies, including St Barbara. The gold price is volatile, asillustrated by the chart below. The ASX all ordinaries gold index(ASX:XGD) was 4.5 times more volatile (measured by standarddeviation) than the ASX 200 (ASX:XJO) over the previous 5 years.
The nature of the industry and the share price volatility has resultedin certain key features of the Group’s performance linked at riskremuneration, in the form of the annual short term incentive (STI)and the long term incentive (LTI) which measures performance overthree financial years.
Executive remuneration outcomes are aligned with shareholderexperience, as the STI and LTI link personal remuneration outcomeswith the achievement of targets which drive Group performance andshareholder return. The mix of fixed and at risk remuneration variesaccording to the role of each Executive, with the highest level of atrisk remuneration applied to those roles that have the greatestpotential to influence and deliver Group outcomes and driveshareholder return.
The criteria used to assess the STI include production, costs andsafety key elements that are within management’s control andunderpin the overall financial result of the Group. The Board is
aware of a trend in some larger ASX companies to partially deferpayment of STI to subsequent years as share rights, notionally tomore closely align the STI with a company’s share priceperformance. The Board has determined no deferral of STI isappropriate as deferral of STI is extremely rare amongst theresources companies with which St Barbara competes for talent, andis considered to be a disincentive to current and prospectiveemployees. In addition, the corresponding LTI is closely aligned withthe Company’s share price performance, and also provides asignificant retention incentive.
The LTI aligns Executive remuneration with shareholder experience.The vesting conditions for the LTI comprise two measures, relativetotal shareholder return (RTSR), and return on capital employed(ROCE) in excess of the weighted average cost of capital. The LTIallows retesting at the Board’s discretionwhich is consistent with thevolatile character of the gold industry, that tends to be cyclical andthe result at the end of a three year vesting period may be adverselyimpacted by a short term downturn in the price of gold or in the goldindustry. Rights would only vest under retesting if there is a positivetotal shareholder return and the performance conditions are metover the extended term.
RTSRwas first adopted as an LTImeasure at the 2010 Annual GeneralMeeting, with ROCE first adopted at the 2012 Annual GeneralMeeting. These twometrics were selected, and have been retained,as the most appropriate measures to reflect management’sinfluence on shareholder wealth. RTSR eliminates the impact offluctuations in gold price to illustrate how effective managementhave been in creating value from the Group’s gold assets comparedagainst industry peers. ROCE measures the efficiency with whichmanagement uses capital in seeking to increase shareholder value.The LTI performance measures are reviewed annually for theircontinued relevance and consistency against peer company LTImetrics.
The remuneration strategy and structure are directly linked to thedevelopment of strategies and budgets in the Group’s annualplanning cycle shown in the timetable below.
$0
$1
$2
$3
$4
$1,300
$1,400
$1,500
$1,600
$1,700
$1,800
Jun 2012 Jun 2013 Jun 2014 Jun 2015 Jun 2016 Jun 2017
ASX:SBMA$/oz A$ gold vs SBM share price
Gold A$/oz (LHS) SBM (RHS)Source: IRESS (5 year weekly data)
For
per
sona
l use
onl
y

ST BARBARA LIMITED 2017Directors’ Report Remuneration Report (audited)
Page 17
Annual Planning Timetable
Month Strategy & Reporting Remuneration
October Annual strategy update
January Review STI & LTI design framework
February Half Year Financial Report
April to June Budget setting framework Set remuneration review framework
July Measure STI outcomes and determine award
August Annual Financial Report Measure LTI outcomes (in conjunction with audited financialreport) and action any vested entitlements
Set STI targets for following financial year
October Annual Report
November Annual General Meeting Shareholder approval of LTI to be issued to MD & CEO
4. Remuneration GovernanceRemuneration strategy and policies are approved by the Board. Theyare aligned with, and underpin, the Group strategy. On behalf of theBoard, the Remuneration Committee oversees and reviews theeffectiveness of the remuneration strategy, policies and practices toensure that the interests of the Group, shareholders and employeesare taken into account. The charter for the RemunerationCommittee is approved by the Board and is available on the Group’swebsite at www.stbarbara.com.au.
The Remuneration Committee is responsible for makingrecommendations to the Board on all aspects of remunerationarrangements for Key Management Personnel.
In addition, the Remuneration Committee oversees and reviewsproposed levels of annual remuneration for the Group as a whole aswell as other key employee related policies for the Group. It alsoreceives reports on organisation capability and effectiveness, skills,training and development and succession planning for key roles.
The members of the Remuneration Committee are all independent,Non Executive Directors and as at the date of this report comprised:
K Gleeson Non Executive DirectorChair of the Committee since 1 July 2015Member of the Committee since 18 May 2015
D Moroney Non Executive DirectorMember of the Committee since 16 March 2015
T Netscher Non Executive ChairmanMember of the Committee since 23 February 2015
In forming remuneration recommendations, each year theRemuneration Committee obtains and considers industry specificindependent data and professional advice as appropriate. All reportsand professional advice relating to the Managing Director and CEO’sremuneration are commissioned and received directly by theRemuneration Committee. The Remuneration Committee reviewsall other contracts with remuneration consultants and directlyreceives the reports of those consultants. Information was receiveddirectly by the Committee from Godfrey Remuneration Groupduring the financial year regarding aspects of remuneration designand equity plans. The information provided by GodfreyRemuneration Group did not include a remunerationrecommendation as defined in the Corporations Act 2001 (Cth).
The Remuneration Committee has delegated authority to theManaging Director and CEO for approving remunerationrecommendations for employees other than Key ManagementPersonnel, within the parameters of approved Group wideremuneration levels and structures.
For
per
sona
l use
onl
y

ST BARBARA LIMITED 2017Directors’ Report Remuneration Report (audited)
Page 18
5. Remuneration Structure
Executive remuneration comprises:
Fixed remuneration A performance linked at risk short term incentive (STI) A performance linked at risk long term incentive (LTI).
Each of these components is considered in more detail below.Composition of Executive Remuneration
The mix of fixed and at risk remuneration for Executives for 2017 is as follows:
Figures are rounded to nearest whole percent and may not add.
(1) STI as a % of Fixed Remuneration at ‘target’ is: Level 6 (CEO) 50%, Level 5 (CFO) 45%. STI at ‘maximum’ = 2 x ‘target’. The proportion of at risk remunerationfor Level 5 (CFO) was increased at target level from 40% in 2016 to 45% in 2017.
‘Target’ is the mid point (50%) of the ‘maximum’ (100%) STI available for the rated performance of each individual. Less than target performance will result inless than the target allocation, potentially down to zero, and significant outperformance can lead to achieving ‘maximum’ (100%) of the STI.
See Section 7.4 for STI earned in 2017.
(2) LTI as a % of Fixed Remuneration at ‘target’ is: Level 6 (CEO) 37.5%, Level 5 (CFO) 30%. LTI at ‘maximum’ = 2 x ‘target’.
‘Target’ is the mid point (50%) of the maximum (100%) LTI available. The LTI allocation is fixed at grant, but the proportion of the grant that ultimately vests,if any, is subject to performance measurement under the relevant LTI plan.
See Section 7.5 for LTI vested during 2017.
The relationship between ‘target’ and ‘maximum’ remuneration of the CEO for 2017 is as follows:
Figures are rounded to nearest whole percent and may not add.
40%
57%
36%
53%
36%
26%
36%
27%
24%
17%
27%
20%
0% 20% 40% 60% 80% 100%
Level 5 (CFO) at maximum
Level 5 (CFO) at target
Level 6 (CEO) at maximum
Level 6 (CEO) at target
Fixed Remuneration STI (at risk) LTI (at risk) Total
100%
100%
100%
100%
53%
53%
53%
27%
40%
20% 100%
0% 20% 40% 60% 80% 100% 120% 140%
Level 6 (CEO) at maximum
Level 6 (CEO) at target
Fixed Remuneration STI (at risk) LTI (at risk) Total
147%
For
per
sona
l use
onl
y

ST BARBARA LIMITED 2017Directors’ Report Remuneration Report (audited)
Page 19
Payment profile of Executive Remuneration
The timing of payments of Executive remuneration for 2017 is as follows (illustrated using Level 6 (CEO) at target):
Fixed remuneration for 2017 was paid during 2017.
STI performance is assessed as part of this report after the end of the 2017 financial year and is paid in the 2018 financial year.
LTI performance is assessed after the end of the 3 year performance period (1 July 2016 to 30 June 2019) and, if determined to have vested, the correspondingperformance rights vest in 2020.
5.1 Fixed Remuneration = Base salary + superannuation + benefits
Fixed remuneration is paid in cash, superannuation and benefitsduring the financial year.
The base salary for each Executive is influenced by the nature andresponsibilities of the role, the knowledge, skills and experiencerequired for the position, and the Group’s need to compete in themarket place to attract and retain the right person for the role.
Each Executive undergoes an annual performance appraisal as partof the Group’s work performance system, in which individual andGroup performance is assessed in detail against their respective predetermined measures. The performance appraisal for the ChiefFinancial Officer is assessed by the Managing Director and CEO andreported to the Remuneration Committee and subsequently to theBoard for review, including recommended remuneration outcomesthat flow from that appraisal. The performance appraisal for theManaging Director and CEO is undertaken by the Chairman, reportedto the Remuneration Committee and subsequently to the Board, forreview.
Benefits vary between Executives and include car parking, certainprofessional memberships and living away from home and travelexpenses, plus any associated fringe benefits tax.
In considering remuneration for Executives for the 2017 financialyear, the Remuneration Committee considered reports from AonHewitt, as well as industry trend data and other relevantremuneration information.
5.2 Performance Linked Remuneration – STI
The STI is linked to specific personal and corporate objectives overthe financial year. Performance of the STI objectives is assessedsubsequent to the end of the financial year, with the amountdetermined to be achieved paid in cash or shares.
The Remuneration Committee is responsible for recommending tothe Board Executive STIs and then later assessing the extent to whichthe Group STI measures and the individual KPIs of the Executiveshave been achieved, and the amount to be paid to each Executive.To assist in making this assessment, the Committee receives detailedreports and presentations on the performance of the business from
the Managing Director & CEO. The Board retains overall discretionon whether a STI should be paid in any given year.
As noted earlier in this report, deferral of STI is extremely rareamongst the resources companies with which the Group competesfor talent, and is considered to be a disincentive to current andprospective employees. The current weighting between STI and LTIis considered to provide appropriate alignment with long term shareprice performance and retention of Executives.
The STI is an annual “at risk” component of remuneration forExecutives. It is payable based on performance against keyperformance indicators (KPI) set at the beginning of the financialyear.
For each KPI there are defined “threshold”, “target” and “stretch”measures which are capable of objective assessment:
Thresholdperformance
represents the minimum level of acceptableperformance acknowledging extrinsic risksassumed in achievement of the full year budget(where the budget is normally more demandingyear on year) for quantifiable measures whichare within the control of STI participants such assafety, production and all in sustaining cost (asproxies for profitability and cash generation), aswell as the achievement of near term goalslinked to the annual strategy.
Targetperformance
represents challenging but achievable levels ofperformance beyond achievement of budgetmeasures.
Stretch(or maximum)performance
requires significant performance above andbeyond normal expectations and if achieved isanticipated to result in a substantialimprovement in key strategic outcomes,operational or financial results, and/or thebusiness performance of the Group.
53% 53%
27% 27%
20% 20%
Level 6 (CEO) at target(for illustration)
FY 2017(FY17 FR paid)
FY 2018(FY17 STI paid)
FY 2019 FY 2020(FY17 LTI vested)
LTI (at risk)
STI (at risk)
Fixed remuneration(FR)
FY17 LTI measurement period 3 yrs from 1 Jul 2016 to 30 Jul 2019
FY17 STImeasurement period
For
per
sona
l use
onl
y

ST BARBARA LIMITED 2017Directors’ Report Remuneration Report (audited)
Page 20
STIs are structured to remunerate Executives for achieving annualGroup targets as well as their own individual performance targetsdesigned to favourably impact the business. The proportion of theSTI earned is calculated by adding the average result of the Grouptargets with the average result of an individual’s performancetargets, where target performance equals one. For the FY17 STI, theresults are weighted to 70% Group targets and 30% individualtargets. Group and individual targets are established by referenceto the Group Strategy. The net amount of any STI after allowing forapplicable taxation, is payable in cash.
The calculation of STI earned can be summarised as follows:
STI earned = STI value at risk x [(70% x average result of Group STItargets) plus (30% x average result of Individual STI targets)], wheretarget performance = 1.
Details of the 2017 financial year STI are set out in Section 7.4 of thisreport.
5.3 Performance Linked Remuneration – LTI
LTIs are structured to remunerate Executives for the long termperformance of the Group relative to its peers. The LTIs involve thegranting of rights which only vest upon achievement of performancemeasures over a three year period. Performance rights on issue carryno dividend or voting rights. On vesting each performance right isconvertible into one ordinary share.
As noted earlier, the gold industry is much more volatile than theeconomy in general. The gold industry tends to be cyclical and theresult at the end of a three year vesting period may be adverselyimpacted by a short term downturn in the price of gold or in the goldindustry. Unlike other industries where matching revenues andexpenses may have long lead times, in the gold industry goldproduced is sold at arm’s length at the market price (unless it is soldinto a hedge) within a matter of days from production, withcorresponding revenue and expenses recorded. The primary LTIperformance measure of relative total shareholder return meansthat LTI awards will not increase merely due to an increase in goldprice, but only on better than average industry performance.
These characteristics of the gold industry, and comparison with longterm incentive structures of other resource companies with whichthe Group competes for talent, have led to certain characteristics ofthe current LTI plan, including retesting. The Board introduced‘retesting’ to performance rights issued from September 2015.Should no rights from a tranche vest at the conclusion of ameasurement period, at its discretion, the Board may choose toretest the relevant performance rights for the same performanceconditions (e.g. above 50th percentile Relative Total ShareholderReturn) one year after the original vesting period (and potentiallyagain one year later). Performance rights would only vest, withBoard discretion, if there was positive total shareholder return, andminimum threshold performance achieved for Relative TotalShareholder Return and Return on Capital Employed for theextended vesting period (of four or five years), which should onlycorrespond with a positive shareholder experience.
Vesting conditions of each tranche of performance rights issued areapproved by the Board and set out in the relevant Notice of AnnualGeneral Meeting. Details of the LTI relevant to the 2017 financialyear are set out in Section 7.5 of this report.
5.4 Summaries of service agreements for Executives
Remuneration and other terms of employment for the ManagingDirector and CEO and the Chief Financial Officer are formalised inservice agreements. These agreements provide, where applicable,for the provision of performance related cash payments, otherbenefits including allowances, and participation in the St BarbaraLimited Performance Rights Plan.
All service agreements with Executives comply with the provisions ofPart 2 D.2, Division 2 of the Corporations Act.
These service agreements may be terminated early by either partygiving the required notice and subject to termination paymentsdetailed in the agreement. Other major provisions of theagreements relating to remuneration are set out below.
R S Vassie – Managing Director and CEO
Term of agreement – permanent employee, commenced 1 July2014.
Other than for serious misconduct or serious breach of duty,the Company or Mr Vassie may terminate employment at anytime with 6 months’ notice.
G Campbell Cowan – Chief Financial Officer
Term of agreement – permanent employee, commenced 1September 2006.
Other than for gross misconduct or for poor performance asjudged by the Company in its absolute discretion, the Companymay terminate the employment at any time with payment of atermination benefit equal to 8 months’ notice. Mr CampbellCowan may terminate employment at any time with 6 weeks’notice.
5.5 Future Developments in Remuneration
The Group continuously monitors its remuneration structure,practices and disclosure in light of market developments to ensurethat collectively they continue to:
attract, reward and retain high performing, team orientedindividuals capable of delivering the Group strategy;
encourage and reward individual and team performance alignedwith value creation for shareholders;
appropriately inform shareholders of what remuneration is paidand why.
Almost exclusively, the Group competes with Australian goldindustry peer companies to attract and retain the individualsnecessary to maintain its success. This drives the need to closelymonitor and respond to the remuneration practices of its peers, andoffer a competitive and comparable remuneration packages. Thismeans the Group’s remuneration practices are consistent with theAustralian gold mining industry and the peer companies with whichit competes for talent, rather than practices that may be used bybroader industrial companies.
There are no planned changes to the remuneration structure forExecutives at the time of this report, other than for the mix of Groupand Individual STI targets, which is proposed to change theweightingfrom 70% Group targets and 30% Individual targets in 2017, to 80%Group targets and 20% Individual targets in 2018.
Following a review of various resource industry marketremuneration data from a number of sources, for the 2018 financialyear the Board has approved a 10% increase in total fixedremuneration for the MD & CEO and a 2.5% increase for the CFO.
The Board identified that the CEO’s fixed remuneration was notcommensurate with the market. The Board noted that the marketcapitalisation of the Group had increased over 20 times (and theGroup had re joined the ASX 300 and ASX 200) in the three yearssince the CEO was appointed on 1 July 2014.
The FY18 total fixed remuneration of both Executives is between P50and P75 of the benchmark data, which is consistent with theCompany’s remuneration strategy.
For
per
sona
l use
onl
y
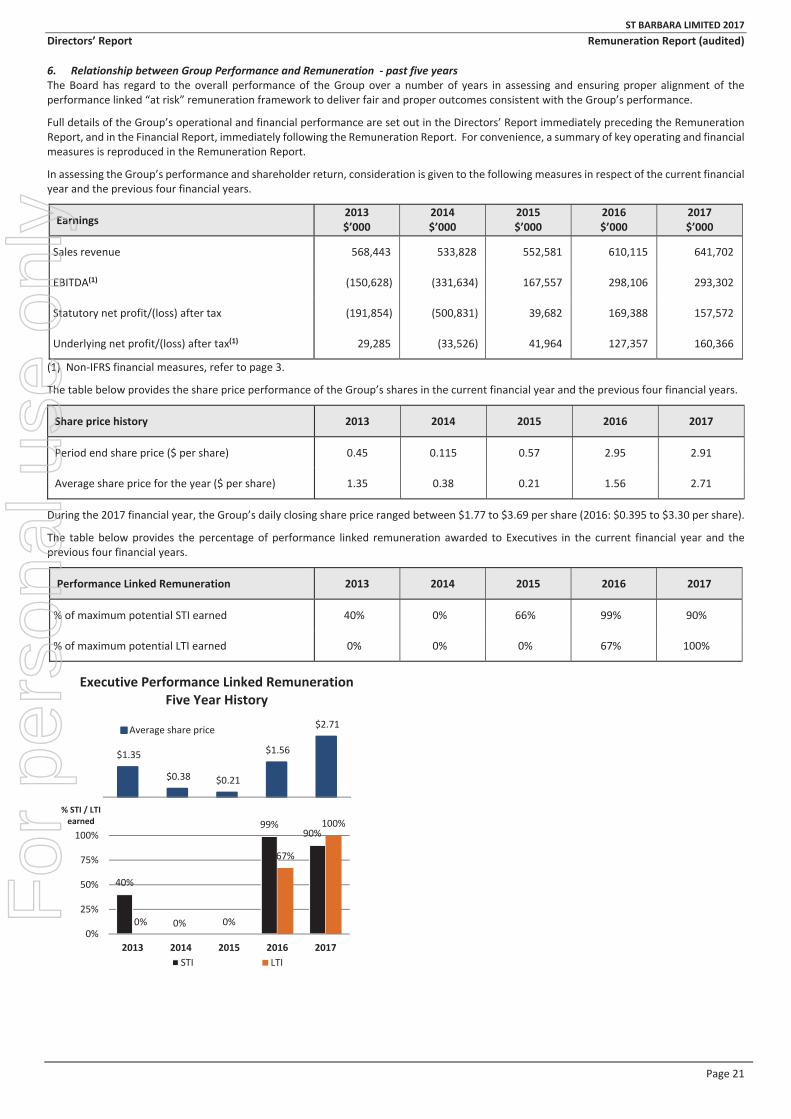
ST BARBARA LIMITED 2017Directors’ Report Remuneration Report (audited)
Page 21
6. Relationship between Group Performance and Remuneration past five yearsThe Board has regard to the overall performance of the Group over a number of years in assessing and ensuring proper alignment of theperformance linked “at risk” remuneration framework to deliver fair and proper outcomes consistent with the Group’s performance.
Full details of the Group’s operational and financial performance are set out in the Directors’ Report immediately preceding the RemunerationReport, and in the Financial Report, immediately following the Remuneration Report. For convenience, a summary of key operating and financialmeasures is reproduced in the Remuneration Report.
In assessing the Group’s performance and shareholder return, consideration is given to the following measures in respect of the current financialyear and the previous four financial years.
Earnings2013$’000
2014$’000
2015$’000
2016$’000
2017$’000
Sales revenue 568,443 533,828 552,581 610,115 641,702
EBITDA(1) (150,628) (331,634) 167,557 298,106 293,302
Statutory net profit/(loss) after tax (191,854) (500,831) 39,682 169,388 157,572
Underlying net profit/(loss) after tax(1) 29,285 (33,526) 41,964 127,357 160,366
(1) Non IFRS financial measures, refer to page 3.
The table below provides the share price performance of the Group’s shares in the current financial year and the previous four financial years.
Share price history 2013 2014 2015 2016 2017
Period end share price ($ per share) 0.45 0.115 0.57 2.95 2.91
Average share price for the year ($ per share) 1.35 0.38 0.21 1.56 2.71
During the 2017 financial year, the Group’s daily closing share price ranged between $1.77 to $3.69 per share (2016: $0.395 to $3.30 per share).
The table below provides the percentage of performance linked remuneration awarded to Executives in the current financial year and theprevious four financial years.
Performance Linked Remuneration 2013 2014 2015 2016 2017
% of maximum potential STI earned 40% 0% 66% 99% 90%
% of maximum potential LTI earned 0% 0% 0% 67% 100%
40%
99%90%
0% 0% 0%
67%
100%
0%
25%
50%
75%
100%
2013 2014 2015 2016 2017
% STI / LTIearned
STI LTI
Executive Performance Linked RemunerationFive Year History
$1.35
$0.38 $0.21
$1.56
$2.71Average share price
For
per
sona
l use
onl
y

ST BARBARA LIMITED 2017Directors’ Report Remuneration Report (audited)
Page 22
5 Year Group Performance
1. Underlying net profit after tax is statutory net profit after tax excluding significant items. EBITDA is earnings before interest revenue, finance costs,depreciation and amortisation and income tax expense, and includes revenues and expenses associated with discontinued operations. These are nonIFRS financial measures which have not been subject to review or audit by the Group’s external auditors. These measures are presented to enableunderstanding of the underlying performance of the Group.
2. Total recordable injury frequency rate for each million hours worked on a 12 month rolling basis.
0
100
200
300
400
500
600
700
2013 2014 2015 2016 2017
$MSales Revenue
500
400
300
200
100
0
100
200
300
2013 2014 2015 2016 2017
$MStatutory Net Profit/(Loss) After Tax
50
0
50
100
150
200
2013 2014 2015 2016 2017
$MUnderlying Net Profit/(Loss) After Tax1
050100150200250300350400450
2013 2014 2015 2016 2017
kozGold Production
Gwalia KOTH Southern Cross Simberi Gold Ridge
0
1
2
3
4
5
6
7
2013 2014 2015 2016 2017
Total Recordable Injury Frequency Rate2measured on a 12 month rolling basis
400
300
200
100
0
100
200
300
400
2013 2014 2015 2016 2017
$MEBITDA1
For
per
sona
l use
onl
y

ST BARBARA LIMITED 2017Directors’ Report Remuneration Report (audited)
Page 23
7. Remuneration Disclosure and Executive Remuneration Outcomes
7.1 STIThe STI was assessed for the financial year ended 30 June 2017.
Highlights of the Group’s achievements in 2017 include:
Records Record safety performance of 1.2 TRIFR1, well below the comparable industry rate of 2.52
Record annual production from continuing operations of 381,101 oz (2016: 377,452 oz) Record annual production from the Simberi mine of 116,044 oz (2016: 110,286 oz) Record low AISC3 of A$907 per ounce (2016: A$933 per ounce)4
Safety and PeopleIn addition to record safety performance noted above:
WGEA Employer of Choice for Gender Equality for the 3rd year running Winner of the Company Diversity Program in the Victorian Women in Resources Awards Winners CME WA Underground Mine Emergency Response Team Competition Winner of Digger of the year award Leonora Operations employee turnover of 5.5% (compared to Western Australian average of 15.3%5)
OperationsOutperformed original (and subsequently amended) FY17 market guidance for all published metrics:
Production achieved 381 koz, initial guidance 340 370 koz All In Sustaining Cost achieved A$907/oz, initial guidance A$985/oz –A$1,075/oz Capital expenditure achieved A$43 million, initial guidance A$45 53 million (sustaining and growth capex)
Financial Increase underlying net profit after tax and cash flow from operations Early repayment of the remaining A$225 million of US s144A Senior Secured Notes simultaneously with
cash at bank increased to $161 million (2016: $137 million) $0.06 per share fully franked divided in respect of full financial year announced (first dividend since 1995)
Strategy $100 million Gwalia Expansion Project approved in March 2017. The project consists of two main components,a ventilation upgrade and paste aggregate fill and will take two and a half to three years to complete. Thisproject extends mining at Gwalia to at least 2,000 mbs in FY 2024
Simberi strategic review concluded, production and cash flow increased year on year, together with an optionand farm in agreement established with Newcrest Mining Limited 6 for copper gold porphyry exploration
Strategic investments in highly prospective explorers Catalyst Metals Ltd (ASX:CYL) and Peel Mining Ltd(ASX:PEX)
Ore Reserves andMineral Resources
599 koz of contained gold added to Ore Reserves at Gwalia7
1,467 koz of contained gold added to Mineral Resources at Gwalia6
The two Executives were awarded an average 90% of available STIs in 2017, as a result of the Group’s operational and financial performance,and an assessment against their respective Group and individual STI objectives. Refer to Section 7.4 of this report for details.
7.2 LTI
The three year performance period for the FY15 Performance Rights ended on 30 June 2017.
The last three years have been transformational period for the Group, with outstanding performance in share price growth, return on capitalemployed and total shareholder returns of 2,308%. Market capitalisation increased from $56 million to $1.4 billion over the three year periodand the closing share price increased from $0.115 at 30 June 2014 to $2.91 at 30 June 2017.
Consistent with the outstanding performance of the Group over the last three years, and an assessment against the performance measures,100% of the rights held by Executives under the FY15 LTI that matured on 30 June 2017 were assessed to have vested. Refer to Section 7.5 ofthis report for details.
1 Total Recordable Injury Frequency Rate calculated on a rolling 12 month average2 Gold mining industry TRIFR data per the Department of Mines and Petroleum report titled ‘Safety Performance in the Western Australian Mineral Industry’
for 2014 2015 FY, available at: www.dmp.wa.gov.au/Documents/Safety/MSH_Stats_Posters_SafetyPerfWA_1415.pdf3 All In Sustaining Cost is a Non IFRS financial measure, refer to page 34 AISC for continuing operations5 Mackie Resources Industry Turnover Analysis www.mesolutions.com.au6 Option and Farm in Agreement between the St Barbara group (through its wholly owned PNG subsidiary Nord Australex Nominees (PNG) Ltd) and Newcrest
PNG Exploration Limited (a wholly owned subsidiary of Newcrest Mining Limited).7 Refer Ore Reserves and Mineral Resources Statements as at 30 June 2017 released 23 August 2017
For
per
sona
l use
onl
y

ST BARBARA LIMITED 2017Directors’ Report Remuneration Report (audited)
Page 24
Selected highlights of the Group’s performance during the 3 year performance period from 1 July 2014 to 30 June 2017 are set out below:
30 June 20141 30 June 2017 Change Change (%)
Share price (10 day VWAP) $ $0.12 $2.89 +$2.77 +2,308% increase
Net profit/(loss) after tax (underlying) $M $(34)M $160M +$194M turnaround
Debt $M $374M $374M 100% reduction
Dividend for financial year cents Nil $0.062 +$0.06 new
Safety TRIFR1 4.1 1.2 2.9 71% improvement
Additional highlights of the Group’s achievements during the three year FY15 Performance Rights vesting period include:
Year on year record safety performance Sustained increased production from the Gwalia mine Year on year record production from the Simberi mine Gwalia extension project approved, extends life of mine to 2024 Deep drilling intersected the Gwalia mine sequence at 2200 metres below surface Simberi strategic review concluded, option and farm in agreement established with Newcrest Increase in mineral resources at Gwalia by 2,405,000 ounces before depletion, and increase in ore reserves at Gwalia by 1,089,000
before depletion. Early repayment of A$374 million debt Divestment of the closed King of the Hills mine in Western Australia Divestment of the suspended Gold Ridge Project in the Solomon Islands
1 30 June 2014 figures used to illustrate ‘starting’ balances for the 3 year LTI performance period from 1 July 2014 to 30 June 2017 (e.g. from the correspondingNotice of 2014 Annual General Meeting, total shareholder return for the period is calculated from ‘the 10 day VWAP calculation up to, and including, the lastbusiness day of the financial period immediately preceding the period that the performance rights relate to’.
2 Dividend announced 7 August 2017 in respect of the full 2017 financial year.
0100020003000400050006000
$
$1.00
$2.00
$3.00
$4.00
2014 2015 2016 2017
Absolute performance overFY15 LTI vesting period
ASX:XGD Gold Price(A$/oz)
SBM(10 day VWAP)
Source: IRESS (5 year weekly data)
+2,308%
100%0%
500%
1,000%
1,500%
2,000%
2,500%
2014 2015 2016 2017
Relative performance overFY15 LTI vesting period
SBM(10 day VWAP)
ASX:XGD Gold Price(A$/oz)
Source: IRESS (5 year weekly data)
XGD +86%
A$/oz +15%
+$1,391M
0
500
1,000
1,500
2,000
2014 2015 2016 2017 increase2014 to2017
A$M Market cap overFY15 LTI vesting period
M'Cap
$0.00$0.50$1.00$1.50$2.00$2.50$3.00$3.50$4.00
Jun 2012 Jun 2013 Jun 2014 Jun 2015 Jun 2016 Jun 2017
ASX: SBM
SBMSource: IRESS (5 year weekly data)
FY15 LTI vesting period
For
per
sona
l use
onl
y

STBA
RBAR
ALIMITED
2017
Dire
ctors’Re
port
Remun
erationRe
port(aud
ited)
Page
25
7.3
Remun
erationDisclosure
Details
oftheremun
erationof
KeyManagem
entP
ersonn
elof
theGroup
durin
gtheyear
ende
d30
June
2017
areseto
utinthefollowingtables:
(1)Leaveinclud
eslong
serviceleaveandannu
alleaveen
titlemen
ts.
(2)Thevalueof
performance
rightsdisclosedas
remun
erationisthepo
rtionof
thefairvalueof
thepe
rformance
rightsrecognise
din
therepo
rtingpe
riodin
accordance
with
theCo
rporations
Act2
001andrelevant
AustralianAccoun
tingStandards.
Thisvaluemay
nota
lwaysreflectwhata
nexecutivehasreceivedintherepo
rtingpe
riod.
(3)Non
mon
etarybe
nefitsfor
Executives
comprise
carp
arking,professionalm
embe
rships
and,forM
rVassie
,livingaw
ayfrom
hometravelexpe
nses
includ
ingassociated
fringe
bene
fitstax.
(4)Calculated
as‘STIpaym
ent’plus
‘Share
basedpaym
ents’divided
by‘Total’rem
uneration.
2017
Shortterm
bene
fits
Post
employmen
tbe
nefits
Long
term
bene
fits
Nam
eCash
salary
&fees
STI
paym
ent
Non
mon
etary
bene
fits(3
)Supe
rannu
ation
Leave(
1)Sharebased
paym
ents
(2)
Term
ination
paym
ents
Total
Prop
ortio
nof
total
performance
$$
$$
$$
$$
related(
4)
Non
ExecutiveDirectors
TCNetsche
r(Ch
airm
an)
208,38
419
,616
228,00
0n/a
KJG
leeson
116,89
511
,105
128,00
0n/a
DEJM
oron
ey11
6,89
511
,105
128,00
0n/a
TotalN
onExecutiveDirectors
442,17
441,826
484,00
0n/a
ExecutiveDirector
RSVa
ssie
746,23
468
9,26
556
,548
19,616
68,083
495,82
22,07
5,56
857
%
Executives
GCampb
ellC
owan
478,69
439
9,14
66,30
319
,616
41,571
285,18
31,23
0,51
356
%To
talExecutiv
es1,22
4,92
81,08
8,41
162
,851
39,232
109,65
478
1,00
53,30
6,08
157
%
For
per
sona
l use
onl
y

STBA
RBAR
ALIMITED
2017
Dire
ctors’Re
port
Remun
erationRe
port(aud
ited)
Page
26
(1)Theam
ount
represen
tslong
serviceleaveandannu
alleaveen
titlemen
ts.
(2)Thevalueof
performance
rightsdisclosedas
remun
erationisthepo
rtionof
thefairvalueof
thepe
rformance
rightsrecognise
din
therepo
rtingpe
riodin
accordance
with
theCo
rporations
Act2
001andrelevant
AustralianAccoun
tingStandards.
Thisvaluemay
nota
lwaysreflectwhata
nexecutivehasreceivedintherepo
rtingpe
riod.
(3)Non
mon
etarybe
nefitsfor
Executives
comprise
carp
arking,professionalm
embe
rships
and,forM
rVassie
,livingaw
ayfrom
hometravelexpe
nses.Including
associated
fringe
bene
fitstax.
(4)Calculated
as‘STIpaym
ent’plus
‘Share
basedpaym
ents’divided
by‘Total’rem
uneration.
2016
Shortterm
bene
fits
Post
employmen
tbe
nefits
Long
term
bene
fits
Nam
eCash
salary
&fees
STI
paym
ent
Non
mon
etary
bene
fits(3
)Supe
rannu
ation
Leave(
1)Sharebased
paym
ents
(2)
Term
ination
paym
ents
Total
Prop
ortio
nof
total
performance
$$
$$
$$
$$
related(
4)
Non
ExecutiveDirectors
TCNetsche
r(Ch
airm
an)
204,39
219
,308
223,70
0n/a
KJG
leeson
110,54
810
,502
121,05
0n/a
DEJM
oron
ey11
0,54
810
,502
121,05
0n/a
TotalN
onExecutiveDirectors
425,48
840,312
465,80
0n/a
ExecutiveDirector
RSVa
ssie
731,21
775
0,52
554
,771
19,308
63,298
294,24
01,91
3,35
955
%
Executives
GCampb
ellC
owan
478,68
738
2,77
26,28
819
,308
39,713
217,64
81,14
4,41
652
%To
talExecutiv
es1,20
9,90
41,13
3,29
761
,059
38,616
103,01
151
1,88
83,05
7,77
554
%
For
per
sona
l use
onl
y

ST BARBARA LIMITED 2017Directors’ Report Remuneration Report (audited)
Page 27
7.4 Performance Linked Remuneration STIThe table below describes the STIs available to, and achieved by, Executives during the year. Amounts shown as “Actual STI” represent theamounts accrued in relation to the 2017 financial year, based on achievement of the specified performance criteria. No additional amounts vestin future years in respect of the STI plan for the 2017 financial year. The Board has discretion whether to pay the STI in any given year, irrespectiveof whether Company and individual STI targets have been achieved. The Board also has discretion to pay the STI in cash or shares. The Boarddid not apply discretion to the calculation of the 2017 STI. The Board last applied discretion to the STI calculation in 2014, when it applied itsdiscretion not to award an STI to Executives due to financial underperformance, even though one of the targets had been achieved at maximum.
2017 Maximum potential STI Actual STI included inremuneration
% of maximumpotential total STI
earned(2)
% of maximumpotential total STI
foregoneTarget
$Stretch(1)
$ $ % %
R S Vassie 382,925 765,850 689,265 90% 10%G Campbell Cowan 224,240 448,480 399,146 89% 11%
(1) Inclusive of STI “Target”.(2) The total STI % comprises 70% Group STI measures plus 30% Individual STI measures.
The Group’s STI measures for the 2017 financial year were equally weighted and comprised the following:
STI Measure Target Weighting Result % ofmax.
achieved
Threshold
Target
Maxim
um
(a) Total RecordableInjury FrequencyRate
2.2 and nofatalities
33 % TRIFR of 1.2 achieved withno fatalities,between target (2.2) andmaximum (1.0)
92%
(b) Gold production 367,000ounces
33 % 381,101 ounces produced,between target (367,000oz) and maximum(390,000 oz)
81%
(c) All In SustainingCosts
A$1,001/oz 33 % AISC A$907/oz achieved,outperformed maximum(A$947/oz)
100%
(d) Board discretion(1)
n/a Discretion not applied
Overall Group STI Performance 91%
(1) Discretionary factor determined by the Board, designed to take into account unexpected events and achievements during the year.
Individual STI performance measures were aligned with the Group strategy and varied according to the individual Executive’s responsibilities,and for the 2017 financial year are set out below. STI performance for Executives is assessed by the Board against objective and subjectivemeasures. Some of the detailed measures and outcomes are commercially sensitive and are described in general terms only.
Executive Individual STI performance measures Summary of performance assessed by Board % ofmaximumachieved
MD & CEO Leadership in design and execution ofstrategy and key strategic projects
Leadership of organic and inorganic growthopportunities
Successful execution against Board approved strategicplan, including: Gwalia extension project approved Successful Simberi strategic review process and
outcome Additions to resources and reserves Organic and inorganic growth options, including
option and farm in agreement with Newcrest
88%
CFO Effective capital management and debtreduction
Lead business development strategy andexecution
Lead financial, procurement and projectgovernance of Gwalia extension project
Judicious early repayment of A$225 million inprincipal of US Senior Secured Notes, reducinginterest expense for year by A$13 million
Creation of an appropriately resourced and focussedbusiness development function
Successful Simberi strategic review process and anumber of business development outcomes
Successful governance of Gwalia extension projectand realisation of procurement benefits
85% For
per
sona
l use
onl
y
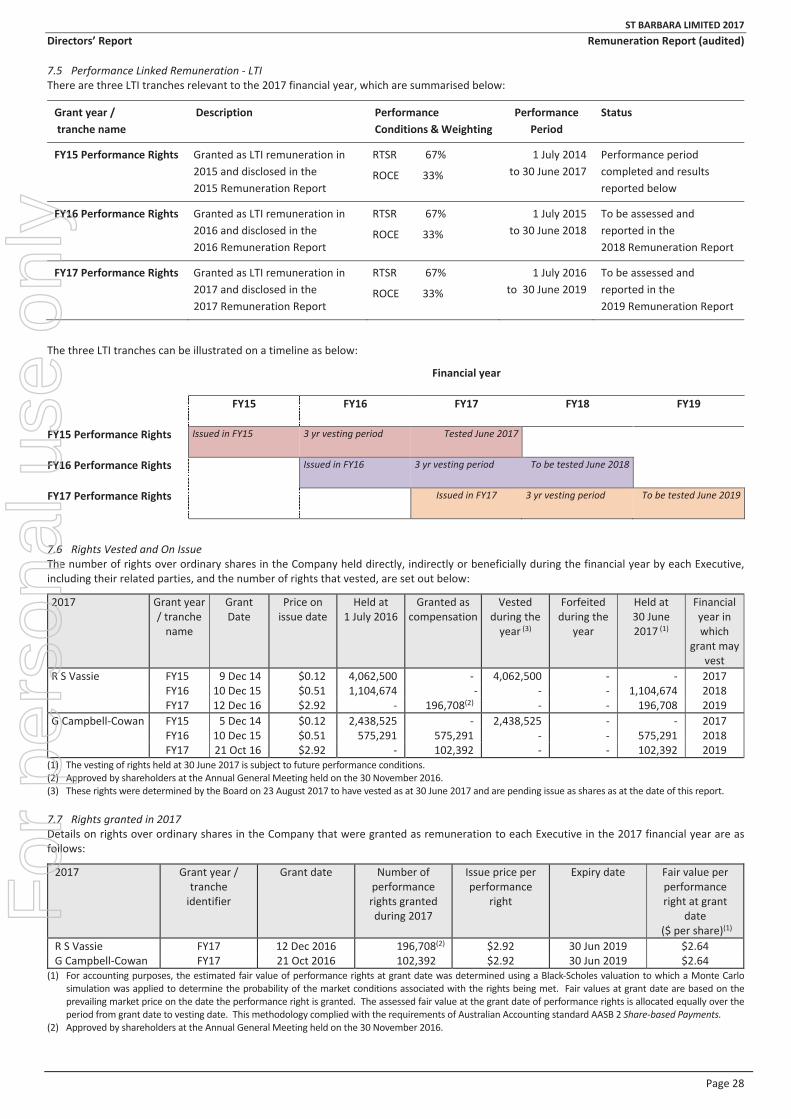
ST BARBARA LIMITED 2017Directors’ Report Remuneration Report (audited)
Page 28
7.5 Performance Linked Remuneration LTIThere are three LTI tranches relevant to the 2017 financial year, which are summarised below:
Grant year /tranche name
Description PerformanceConditions &Weighting
PerformancePeriod
Status
FY15 Performance Rights Granted as LTI remuneration in2015 and disclosed in the2015 Remuneration Report
RTSR 67%
ROCE 33%
1 July 2014to 30 June 2017
Performance periodcompleted and resultsreported below
FY16 Performance Rights Granted as LTI remuneration in2016 and disclosed in the2016 Remuneration Report
RTSR 67%
ROCE 33%
1 July 2015to 30 June 2018
To be assessed andreported in the2018 Remuneration Report
FY17 Performance Rights Granted as LTI remuneration in2017 and disclosed in the2017 Remuneration Report
RTSR 67%
ROCE 33%
1 July 2016to 30 June 2019
To be assessed andreported in the2019 Remuneration Report
The three LTI tranches can be illustrated on a timeline as below:
Financial year
FY15 FY16 FY17 FY18 FY19
FY15 Performance Rights Issued in FY15 3 yr vesting period Tested June 2017
FY16 Performance Rights Issued in FY16 3 yr vesting period To be tested June 2018
FY17 Performance Rights Issued in FY17 3 yr vesting period To be tested June 2019
7.6 Rights Vested and On IssueThe number of rights over ordinary shares in the Company held directly, indirectly or beneficially during the financial year by each Executive,including their related parties, and the number of rights that vested, are set out below:
2017 Grant year/ tranchename
GrantDate
Price onissue date
Held at1 July 2016
Granted ascompensation
Vestedduring theyear (3)
Forfeitedduring the
year
Held at30 June2017 (1)
Financialyear inwhich
grant mayvest
R S Vassie FY15 9 Dec 14 $0.12 4,062,500 4,062,500 2017FY16 10 Dec 15 $0.51 1,104,674 1,104,674 2018FY17 12 Dec 16 $2.92 196,708(2) 196,708 2019
G Campbell Cowan FY15 5 Dec 14 $0.12 2,438,525 2,438,525 2017FY16 10 Dec 15 $0.51 575,291 575,291 575,291 2018FY17 21 Oct 16 $2.92 102,392 102,392 2019
(1) The vesting of rights held at 30 June 2017 is subject to future performance conditions.(2) Approved by shareholders at the Annual General Meeting held on the 30 November 2016.(3) These rights were determined by the Board on 23 August 2017 to have vested as at 30 June 2017 and are pending issue as shares as at the date of this report.
7.7 Rights granted in 2017Details on rights over ordinary shares in the Company that were granted as remuneration to each Executive in the 2017 financial year are asfollows:
2017 Grant year /trancheidentifier
Grant date Number ofperformancerights grantedduring 2017
Issue price perperformance
right
Expiry date Fair value perperformanceright at grant
date($ per share)(1)
R S Vassie FY17 12 Dec 2016 196,708(2) $2.92 30 Jun 2019 $2.64G Campbell Cowan FY17 21 Oct 2016 102,392 $2.92 30 Jun 2019 $2.64
(1) For accounting purposes, the estimated fair value of performance rights at grant date was determined using a Black Scholes valuation to which a Monte Carlosimulation was applied to determine the probability of the market conditions associated with the rights being met. Fair values at grant date are based on theprevailing market price on the date the performance right is granted. The assessed fair value at the grant date of performance rights is allocated equally over theperiod from grant date to vesting date. This methodology complied with the requirements of Australian Accounting standard AASB 2 Share based Payments.
(2) Approved by shareholders at the Annual General Meeting held on the 30 November 2016.
For
per
sona
l use
onl
y

ST BARBARA LIMITED 2017Directors’ Report Remuneration Report (audited)
Page 29
7.8 Calculation of the number of FY15 Performance Rights vested in 20176,501,025 (100%) of the 6,501,025 FY15 Performance Rights available to Executives vested at 30 June 2017. No FY15 Performance Rights lapsedat 30 June 2017. The Performance Rights vested represent 1.3% of total shares on issue at 30 June 2017, and 1.3% of the increase in marketcapitalisation over the corresponding three year measurement period. The FY15 rights were issued in December 2014 at a 10 day VWAP pricecalculated under the Rights Plan Rules and Notice of 2014 Annual General Meeting of $0.12 each, representing an at risk value of $780,123 forthe aggregate FY15 Executive remuneration.
Proportion of rights to vest
The FY15 Performance Rights were assessed as follows: Min(50%)
Max(100%)
(a) RTSRWeighting: 67%Actual score: highest recorded TSR of comparator
group of 2,308% (100th percentile)(details below)
Calculation: 100% (for achieving above the 75thpercentile)
(b) ROCEWeighting: 33%Actual ROCE: 45.2% (details below)Calculation: 100% (for achieving above upper
threshold of WACC 7.6% +7% = 14.6%
(c) Combined score(100% x 67%)
+ (100% x 33%)= 100%
RTSR Calculation for FY15 Performance Rights
The result of the RTSR component of the FY15 Performance Rights for the period 1 July 2014 to 30 June 2017 was:
Relative TSR Performance Percentage of Performance Rights to vest Result
Below 50th percentile 0%
50th percentile 50%
Between 50th & 75th percentiles Pro rata from 50% to 100%
75th percentile and above 100%
Chart of TSR results for comparator companies (table next page) Chart of ROCE (calculated on the next page)
500%
0%
500%
1,000%
1,500%
2,000%
2,500%
StBa
rbara
Co.S
Co.R
Co.Q
Co.P
Co.O
Co.N
Co.MCo.L
Co.K
Co.J
Co.I
Co.H
Co.G
Co.F
Co.E
Co.D
Co.C
Co.B
Co.A
TSR over LTI vesting period75th percentile
29%
51% 55%
45%
15%
0%
10%
20%
30%
40%
50%
60%
FY15 FY16 FY17
ROCE over LTI vesting period
ROCE (1 yr) ROCE (3 yr) 100% threshold
St Barbara achieved a TSR of 2,308% for theperiod, and ranked at the 100th percentile ofthe comparator group of companies for theperiod, above the 75th percentile upperthreshold.As a result, 100% of the Performance Rightslinked to RTSR vested.
For
per
sona
l use
onl
y

ST BARBARA LIMITED 2017Directors’ Report Remuneration Report (audited)
Page 30
The comparator group of companies for FY15 Performance Rights comprised:
Alacer Gold Corp. (ASX: AQG) Kingsrose Mining Limited (ASX: KRM)1 Resolute Mining Limited (ASX: RSG)
Beadell Resources Limited (ASX: BDR) Medusa Mining Limited (ASX: MML) Saracen Mineral Holdings Limited (ASX: SAR)
Evolution Mining Limited (ASX: EVN) Northern Star Resources Ltd (ASX: NST) Silver Lake Resources Limited (ASX: SLR)
Focus Minerals Ltd (ASX: FML) OceanaGold Corporation (ASX: OGC) Tanami Gold NL (ASX: TAM)
Gryphon Minerals Limited (ASX: GRY)2 Perseus Mining Limited (ASX: PRU) Troy Resources Limited (ASX: TRY)
Intrepid Mines Limited (ASX: IAU) Ramelius Resources Limited (ASX: RMS)
Kingsgate Consolidated Limited (ASX: KCN) Regis Resources Limited (ASX: RRL)
ROCE Calculation for FY15 Performance Rights
The result of the ROCE component over the three year vesting period commencing 1 July 2014 and ending on 30 June 2017 was:
ROCE Percentage of Performance Rightsto vest
Result
Less than or equal to the average annual WACCover the three year period commencing on 1 July2014 0%WACC (calculated as above) + 3% 50%WACC (calculated as above) + between 3% and 7% Pro rata from 50% to 100%WACC (calculated as above) + 7% 100%
ROCE is calculated as EBIT before significant items expressed as a percentage of average total capital employed (net debt and total equity)3.
Measure 2015 20164 2017EBIT (excluding significant items) 99,010 204,585 234,992EBIT (discontinued operations) 5EBIT (sum of above)
18,528117,538
_____204,585
_____234,992
Capital employed – opening balanceTotal equityNet debt6Capital employed – opening balance
131,812260,169391,981
140,429270,090410,519
300,61489,629
390,243Capital employed– closing balance
Total equityNet debt6Capital employed– closing balance
140,429270,090410,519
300,61489,629
390,243
461,127
461,127Capital employed – average for period 401,250 400,381 425,685ROCE (EBIT ÷ average total capital employed) for year 29.3% 51.1% 55.2%ROCE average of the 3 years in the vesting period n/a 25.6% 45.2%WACC average of the 3 years in the vesting period n/a 13.9% 7.6%
WACC is calculated using the widely available formula of (relative weight of equity x required rate of return) + (relative weight of debt x cost ofdebt)7. In this instance, WACC is calculated on a pre tax basis to match the pre tax nature of EBIT. The full calculation of WACC is not disclosedas it is considered to be commercial in confidence, however, the primary variables include:
reported balance sheet figures for debt and equity. government 10 year bond rate as proxy for risk free premium. ASX All Ordinaries Index as proxy for market portfolio and to determine relative volatility.
On this basis, average WACC of the 3 years commencing 1 July 2014 and ending on 30 June 2017 is 7.6% (2016: 13.9%). The reason for thereduction in WACC is primarily due to the lower proportion of debt in FY17, and lower market returns over the 3 year period.
1 Kingsrose Mining Limited went into trading halt on 12 December 2016, was suspended from trading on 13 December 2016, and appointed a voluntaryadministrator on 28 December 2016. The RTSR assessment incorporates a pro rata calculation of Kingsrose TSR to the last day of trade, 9 December 2016.
2 GryphonMinerals Limited was acquired by Teranga Gold Corporation (TSX: TGZ, ASX: TGZ) under a scheme of arrangement and was suspended from quotationat close of trade on 29 September 2016 and subsequently delisted from the ASX on 13 October 2016. The RTSR assessment incorporates a pro rata calculationcomprising Gryphon TSR to the last day of trade, 29 September 2016, and the arithmetic average of the remaining comparator companies (excluding Kingsrose)for the remainder of the vesting period.
3 ROCE is not an IFRS measure and is calculated in the table above.4 2016 calculation as reported in 2016 Remuneration Report.5 EBIT for discontinued operations calculated as profit or loss on discontinued operations before tax excluding impairments.6 Net debt comprises cash and cash equivalents, interest bearing borrowings – current and interest bearing borrowings – non current. The minimum net debt
figure applied to the calculation is nil (i.e. where the Company is in a net cash position).7 WACC is not an IFRS measure. The above parameters can be used to calculate WACC using commonly available formula.
St Barbara achieved a ROCE for the period of45.2% (see calculation below), which is abovethe upper threshold of WACC for the periodof 7.6% +7% = 14.6%.As a result, 100% of the Performance Rightslinked to ROCE vested
For
per
sona
l use
onl
y

ST BARBARA LIMITED 2017Directors’ Report Remuneration Report (audited)
Page 31
7.9 Details of FY16 Performance Rights granted during 2016FY16 Performance Rights were granted under the St Barbara LimitedRights Plan (2015), and details of the performance conditions wereset out in the Notice of 2015 Annual General Meeting and 2016Remuneration Report. Performance rights issued to Mr Vassie,Managing Director and CEO, were also approved by shareholders atthe 2015 Annual General Meeting.
Key Features of FY16 Performance Rights
Performanceconditions
Relative Total Shareholder Returns (67%weighting);Return on capital employed in excess of theweighted average cost of capital (33%weighting).
Otherconditions
Include continuing employment
Issue price 10 day VWAP at start, 30 June 2015, $0.5092Measurementperiod
1 July 2015 to 30 June 2018
Vesting date 30 June 2018
(i) RTSRRTSR is measured against a defined peer group of companies whichthe Board considers compete with the Company for the sameinvestment capital, both in Australia and overseas, and which by thenature of their business are influenced by commodity prices andother external factors similar to those that impact on the TSRperformance of the Company. At the discretion of the Board, thecomposition of the comparator group may change from time totime.The comparator group of companies for FY16 Performance Rightscomprises:
Alacer Gold Corp(ASX: AQG)
OceanaGold Corporation(ASX: OGC)
Beadell Resources Limited(ASX: BDR)
Perseus Mining Limited(ASX: PRU)
Evolution Mining Limited(ASX: EVN)
Ramelius Resources Limited(ASX: RMS)
Focus Minerals Ltd(ASX: FML)
Regis Resources Limited(ASX: RRL)
Gryphon Minerals Limited(ASX: GRY)
Resolute Mining Limited(ASX: RSG)
Intrepid Mines Limited(ASX: IAU)
Saracen Mineral HoldingsLimited (ASX: SAR)
Kingsgate ConsolidatedLimited (ASX: KCN)
Silver Lake Resources Limited(ASX: SLR)
Kingsrose Mining Limited(ASX: KRM)
Tanami Gold NL(ASX: TAM)
Medusa Mining Limited(ASX: MNL)
Troy Resources Limited(ASX: TRY)
Northern Star Resources Ltd(ASX: NST)
Oz Minerals Limited(ASX: OZL)
The proportion of the FY16 Performance Rights that vest will beinfluenced by the Company’s TSR relative to the comparator groupover the three year vesting period commencing 1 July 2015 andending 30 June 2018 as outlined below:
Relative TSR Performance % Contribution to theNumber ofPerformance Rights to Vest
Below 50th percentile 0%
50th percentile 50%
Between 50th & 75th percentiles Pro rata from 50% to 100%
75th percentile and above 100%
(ii) ROCEThe proportion of FY16 Performance Rights that vest will beinfluenced by the ROCE achieved by the Company over the threeyear vesting period commencing 1 July 2015 and ending 30 June2018.
Return on Capital Employed(ROCE)
% Contribution to theNumber ofPerformance Rights toVest
Less than or equal to the averageannual weighted average cost ofcapital (WACC) over the three yearperiod commencing on 1 July 2015
0%
WACC (calculated as above) + 3%WACC (calculated as above) +between 3% and 7%
50%Pro rata from 50% to100%
WACC (calculated as above) + 7% 100%
The outcome of FY16 Performance Rights will be reported in the2018 Remuneration Report.
For
per
sona
l use
onl
y

ST BARBARA LIMITED 2017Directors’ Report Remuneration Report (audited)
Page 32
7.10 Details of FY17 Performance Rights granted during 2017FY17 Performance Rights were granted under the St Barbara LimitedRights Plan (2015), and details of the performance conditions wereset out in the Notice of 2016 Annual General Meeting. Performancerights issued to Mr Vassie, Managing Director and CEO, were alsoapproved by shareholders at the 2016 Annual General Meeting.
Key Features of FY17 Performance Rights
Performanceconditions
Relative Total Shareholder Returns (67%weighting);Return on capital employed in excess of theweighted average cost of capital (33%weighting).
Otherconditions
Include continuing employment
Issue price 10 day VWAP at start, 30 June 2016, $2.92Measurementperiod
1 July 2016 to 30 June 2019
Vesting date 30 June 2019
(i) RTSRRTSR is measured against a defined peer group of companies whichthe Board considers compete with the Company for the sameinvestment capital, both in Australia and overseas, and which by thenature of their business are influenced by commodity prices andother external factors similar to those that impact on the TSRperformance of the Company. At the discretion of the Board, thecomposition of the comparator group may change from time totime.
The comparator group of companies for FY17 Performance Rightscomprises:
Alacer Gold Corp(ASX: AQG)
OceanaGold Corporation(ASX: OGC)
Beadell Resources Limited(ASX: BDR)
Perseus Mining Limited(ASX: PRU)
Evolution Mining Limited(ASX: EVN)
Ramelius Resources Limited(ASX: RMS)
Focus Minerals Ltd(ASX: FML)
Regis Resources Limited(ASX: RRL)
Gryphon Minerals Limited(ASX: GRY)
Resolute Mining Limited(ASX: RSG)
Intrepid Mines Limited(ASX: IAU)
Saracen Mineral HoldingsLimited (ASX: SAR)
Kingsgate ConsolidatedLimited (ASX: KCN)
Silver Lake Resources Limited(ASX: SLR)
Kingsrose Mining Limited(ASX: KRM)
Tanami Gold NL(ASX: TAM)
Medusa Mining Limited(ASX: MNL)
Troy Resources Limited(ASX: TRY)
Northern Star ResourcesLtd (ASX: NST)
Oz Minerals Limited(ASX: OZL)
The proportion of the FY17 Performance Rights that vest will beinfluenced by the Company’s TSR relative to the comparator groupover the three year vesting period commencing 1 July 2016 andending 30 June 2019 as outlined below:
Relative TSR Performance % Contribution to theNumber ofPerformance Rights to Vest
Below 50th percentile 0%
50th percentile 50%
Between 50th & 75th percentiles Pro rata from 50% to 100%
75th percentile and above 100%
(ii) ROCEThe proportion of FY17 Performance Rights that vest will beinfluenced by the ROCE achieved by the Company over the threeyear vesting period commencing 1 July 2016 and ending 30 June2019.
Return on Capital Employed(ROCE)
% Contribution to theNumber ofPerformance Rights toVest
Less than or equal to the averageannual weighted average cost ofcapital (WACC) over the three yearperiod commencing on 1 July 2016
0%
WACC (calculated as above) + 3%WACC (calculated as above) +between 3% and 7%
50%Pro rata from 50% to100%
WACC (calculated as above) + 7% 100%
The outcome of FY17 Performance Rights will be reported in the2019 Remuneration Report.
For
per
sona
l use
onl
y

ST BARBARA LIMITED 2017Directors’ Report Remuneration Report (audited)
Page 33
8. Non Executive Director RemunerationNon Executive Directors’ fees are reviewed annually by the Board toensure fees are appropriate to reflect the responsibilities and timecommitments required of Non Executive Directors and is consistentwith the market to ensure that the Group continues to attract andretain Non Executive Directors of a high calibre.
The level of fees paid to Non Executive Directors is set by the Board,within the aggregate pool approved by shareholders (which is$1,200,000 per annum in aggregate, approved by shareholders atthe Annual General Meeting in November 2012) and reported toshareholders in this report each year.
Separate fees are paid for the following roles:
Chair of the Board (this fee is inclusive of all BoardCommittee commitments)
Member of the Board Chair of a Board Committee Member of a Board Committee
In order to maintain their independence and impartiality, the feespaid to Non Executive Directors are not linked to the performanceof the Group.
Superannuation contributions, in accordance with legislation, areincluded as part of each Director’s total remuneration. Directorsmayelect to increase the proportion of their remuneration taken assuperannuation subject to legislative limits. Non Executive Directorsare not entitled to retirement benefits, bonuses or equity basedincentives.
The Chairman’s fee was determined independently, based on rolesand responsibilities in the external market for companiescomparable with St Barbara Limited. The Chairman was not presentat any discussions relating to the determination of his ownremuneration.
The estimated aggregate Non Executive Directors’ fees for 2018 iswell within the shareholder approved aggregate of $1,200,000 perannum.
Following a review of comparable resource industry remuneration levels for non executive directors, the Board resolved to increase NonExecutive Directors fees for 2018 as follows:
July 2012 to Feb 2014 March 2014 to June 2016 2017 2018
Director fee $ 100,000 90,000 92,000 101,200
Committee Chair $ 17,500 15,750 16,000 20,000
Committee Member $ 8,500 7,650 10,000 10,000
Chairman1 $ 248,000 223,200 228,000 250,800
2015 2016 2017 2018
Annual aggregate fees $ 594,945 465,800 484,000 est. 533,200 2
(1) The Chairman’s fee is inclusive of all Board Committee commitments.(2) Aggregate fees for 2018 is estimated on the number of Directors and composition of Board Committees at the date of this report.
The Directors in office and the composition of Board Committees at the date of this report are:
Director Appointed Length ofservice 2
Board Audit & RiskCommittee
Health, Safety,Environment &CommunityCommittee
RemunerationCommittee
T C Netscher 17 Feb 20141 3 years Chairman Member Chair Member
R S Vassie 1 Jul 2014 3 years MD & CEO Member
D E J Moroney 16 Mar 2015 2 years Director Chair Member Member
K J Gleeson 18 May 2015 2 years Director Member Member Chair(1) Appointed as Director 17 February 2014, appointed as Chairman 1 July 2015.(2) Whole years to 30 June 2017.
For
per
sona
l use
onl
y

ST BARBARA LIMITED 2017Directors’ Report Remuneration Report (audited)
Page 34
9. Additional Statutory InformationKey Management Personnel Shareholdings
The numbers of shares in the Company held directly, indirectly or beneficially during the year by each Key Management Personnel, includingtheir related parties, are set out below. There were no shares granted during the year as compensation.
Name NoteBalance at the start
of the year
Issued uponexercised ofperformance
rights
Purchased Sold Other changesBalance at theend of the
year
Non Executive DirectorsT C Netscher 22,000 22,000D E J Moroney 100,000 100,000K J Gleeson 8,333 8,333
Executive DirectorR S Vassie 1,769,053 1,769,053 1
ExecutivesG Campbell Cowan 15,000 400,117 415,117 2
(1) In addition, 4,062,500 employee rights were determined by the Board on 23 August 2017 to have vested as at 30 June 2017 and are pending issue as sharesas at the date of this report.
(2) In addition, 2,438,525 employee rights were determined by the Board on 23 August 2017 to have vested as at 30 June 2017 and are pending issue as sharesas at the date of this report.
Shareholding guidelines for Non Executive Directors and Executives
The Group encourages Non Executive Directors, Executives and employees to own shares (subject to the Group’s Securities Dealing Policy).
The Group does not specify target volumes for such shareholdings, as it does not know the personal preferences and objectives, financial situationor risk profile of individuals. The Group acknowledges that goldmining equities would normally only comprise a small proportion of an individual’sbalanced investment portfolio, and that gold mining equities are generally considered to be volatile and counter cyclical to economic cycles. TheGroup has not identified any of its key peers with which it competes for talent to have shareholding guidelines.
Loans to Directors and Executives
There were no loans to Directors or Executives during the financial year 2017.
END OF REMUNERATION REPORT
For
per
sona
l use
onl
y

ST BARBARA LIMITED 2017Directors’ Report
Page 35
Indemnification and insurance of officers
The Company’s Constitution provides that, to the extent permittedby law, the Companymust indemnify any personwho is, or has been,an officer of the Company against any liability incurred by thatperson including any liability incurred as an officer of the Companyor a subsidiary of the Company and legal costs incurred by thatperson in defending an action.
The Constitution further provides that the Company may enter intoan agreement with any person who is, or has been, an officer of theCompany or a subsidiary of the Company to indemnify the personagainst such liabilities.
The Company has entered into Deeds of Access, Indemnity andInsurance with current and former officers. The Deeds address thematters set out in the Constitution. Pursuant to those deeds, theCompany has paid a premium in respect of a contract insuringcurrent and former officers of the Company and current and formerofficers of its controlled entities against liability for costs andexpenses incurred by them in defending civil or criminal proceedingsinvolving them as such officers, with some exceptions where theliability relates to conduct involving lack of good faith.
During the year the Company paid an insurance premium forDirectors’ and Officers’ Liability and Statutory Liability policies. Thecontract of insurance prohibits disclosure of the amount of thepremium and the nature of the liabilities insured under the policy.
Proceedings on behalf of the company
No person has applied to the Court under section 237 of theCorporations Act 2001 for leave to bring proceedings on behalf ofthe Company, or to intervene in any proceedings to which theCompany is a party, for the purpose of taking responsibility on behalfof the Company for all or part of those proceedings.
No proceedings have been brought or intervened in on behalf of theCompany with leave of the Court under section 237 of theCorporations Act 2001.
Environmental management St Barbara regards compliance with environmental legislation,regulations and regulatory instruments as the minimumperformance standard for its operations. The Group’s operations inWestern Australia are subject to environmental regulation underboth Commonwealth and State legislation. In Papua New Guinea,the Group ensures compliance with the relevant National andProvincial legislation and where appropriate standards or legislationare not available, the Group reverts to the standard ofenvironmental performance as stipulated in the Western Australianlegislation.
A Group wide Environmental Management System (EMS) has beenimplemented to facilitate the effective and responsiblemanagement of environmental issues to the same high standardacross all sites in both Australia and Papua New Guinea. Adoptionof the EMS at all operations has contributed to further reductions inthe number of minor environmental incidents, and an improvementin internal compliance rates for environmental audits andinspections. There were no externally reportable environmentalincidents during the year ended 30 June 2017 at any of the Group’sAustralian and Pacific sites.
Non audit services
During the year the Company did employ the auditor to provideservices in addition to their statutory audit duties. Details of theamounts paid or payable to the auditor, PricewaterhouseCoopers,for non audit services provided during the 2017 financial year are setout in Note 18 to the financial statements.
The Board of Directors has considered the position and, inaccordance with the advice received from the Audit & RiskCommittee, is satisfied that the provision of non audit servicesduring the year as set out in Note 18 did not compromise the auditorindependence requirements of the Corporations Act 2001 for thefollowing reasons:
All non audit services were reviewed by the Audit & RiskCommittee to ensure they do not impact the impartiality andobjectivity of the auditor; and
The Audit & Risk Committee annually informs the Board of thedetail, nature and amount of any non audit services rendered byPricewaterhouseCoopers during the financial year, giving anexplanation of why the provision of these services is compatiblewith auditor independence. If applicable, the Audit & RiskCommittee recommends that the Board take appropriate actionin response to the Audit & Risk Committee’s report to satisfyitself of the independence of PricewaterhouseCoopers.
Auditor independence
A copy of the Auditor’s Independence Declaration required undersection 307C of the Corporations Act 2001 is set out on page 37 andforms part of this Directors’ Report.
Events occurring after the end of the financial year
Subsequent to year end, the directors have declared a fully frankedfinal dividend of 6 cents per ordinary share to be paid on the 28September 2017. A provision for this dividend has not beenrecognised in the 30 June 2017 financial statements.
For
per
sona
l use
onl
y

ST BARBARA LIMITED 2017Directors’ Report
Page 36
Rounding of amounts
St Barbara Limited is a Company of the kind referred to in ASICCorporations (Rounding in Financial/Directors’ Report) Instrument2016/191 issued by the Australian Securities and InvestmentCommission (ASIC). As a result, amounts in this Directors’ Report andthe accompanying Financial Report have been rounded to thenearest thousand dollars, except where otherwise indicated.
This report is made in accordance with a resolution of Directors.
For and on behalf of the Board
Dated at Melbourne this 23rd day of August 2017
Bob Vassie
Managing Director and CEO
For
per
sona
l use
onl
y

ST BARBARA LIMITED 2017Directors’ Report
Page 37
Auditors Independence DeclarationF
or p
erso
nal u
se o
nly

ST BARBARA LIMITED 2017
Page 38
Financial Report
Contents
Financial Statements Page
About this report 38Income statement 39Statement of comprehensive income 40Balance sheet 41Statement of changes in equity 42Cash flow statement 43
Notes to the financial statementsA. Key results1 Segment information 442 Tax 463 Significant items 484 Earnings per share 48
B. Mining operations5 Property, plant and equipment 496 Deferred mining costs 507 Mine properties and mineral rights 518 Exploration and evaluation 549 Rehabilitation provision 55
C. Capital and risk10 Working capital 5611 Financial risk management 5712 Net debt 6113 Contributed equity 62
D. Business Portfolio14 Parent entity disclosures 6315 Controlled entities 63
E. Remunerating our people16 Employee benefit expenses and provisions 6417 Share based payments 65
F. Other disclosures18 Remuneration of auditors 6619 Events occurring after the balance sheet date 6620 Contingencies 6621 Basis of preparation 6622 Accounting standards 67
Signed reportsDirectors’ declaration 68Independent auditor’s report 69
About this report
St Barbara Limited (the “Company” or “Parent Entity”) is a companylimited by shares incorporated in Australia whose shares arepublicly traded on the Australian Stock Exchange. The consolidatedfinancial statements of the Company as at and for the year ended30 June 2017 comprise the Company and its subsidiaries (togetherreferred to as the “Group”). The Group is a for profit entityprimarily involved in mining and sale of gold, mineral explorationand development.
The financial report is a general purpose financial report, which hasbeen prepared in accordance with Australian Accounting Standards(AASBs) (including Australian Interpretations) adopted by theAustralian Accounting Standards Board (AASB) and theCorporations Act 2001. Where required by accounting standardscomparative figures have been adjusted to conform to changes inpresentation in the current year. The consolidated financial reportof the Group complies with International Financial ReportingStandards (IFRSs) and interpretations issued by the InternationalAccounting Standards Board.
The consolidated financial statements have been presented inAustralian dollars and all values are rounded to the nearestthousand dollars ($000) as specified in the ASIC CorporationInstrument 2016/191 unless otherwise stated.
The Board of Directors approved the financial statements on 23August 2017.
What’s in this reportSt Barbara’s Directors have included information in this report thatthey deem to be material and relevant to the understanding of thefinancial statements and the Group.
A disclosure has been considered material and relevant where:
the dollar amount is significant in size (quantitative);
the dollar amount is significant in nature (qualitative);
the Group’s result cannot be understood without the specificdisclosure; and
it relates to an aspect of the Group’s operations that isimportant to its future performance.
Accounting policies and critical accounting judgements andestimates applied to the preparation of the financial statements arerepresented where the related accounting balance or financialstatement matter is discussed. To assist in identifying criticalaccounting judgements and estimates, we have highlighted them inthe following manner:
Accounting judgements and estimates
For
per
sona
l use
onl
y

ST BARBARA LIMITED 2017Financial Report
Page 39
Income statementfor the year ended 30 June 2017
CONSOLIDATED2017 2016
Notes $'000 $'000Operations
Revenue 1 641,702 610,115Mine operating costs 1 (267,244) (280,927)Gross profit 374,458 329,188
Interest revenue 1,948 1,960Other revenue 34Other income 86 3,564Exploration expensed (10,647) (6,786)Corporate costs (20,977) (19,184)Royalties 1 (21,774) (21,455)Depreciation and amortisation 5 (85,583) (80,915)Other expenses (3,608) (1,967)Net gain on disposal of assets 14,570Impairment losses and asset write downs 3 (27,273)Operating profit 206,630 219,009
Finance costs 12 (19,961) (35,749)Net foreign exchange gain 3,037 142
Profit before income tax 189,706 183,402
Income tax expense 2 (32,134) (14,014)
Profit from operations 157,572 169,388
Profit attributable to equity holders of the Company 157,572 169,388
Earnings per share for operations:Basic earnings per share (cents per share) 4 31.71 34.21Diluted earnings per share (cents per share) 4 30.42 32.70
The above income statement should be read in conjunction with the notes to the financial statements.
For
per
sona
l use
onl
y

ST BARBARA LIMITED 2017Financial Report
Page 40
Statement of comprehensive incomefor the year ended 30 June 2017
CONSOLIDATED2017 2016
Notes $'000 $'000
Profit for the year 157,572 169,388
Other comprehensive income
Items that may be reclassified subsequently to profit:
Changes in fair value of available for sale financial assets (8) (13)
Income tax on other comprehensive income 1,204
Foreign currency translation differences foreign operations 904 (11,322)
Other comprehensive profit/(loss) net of tax(1) 896 (10,131)
Total comprehensive income attributable to equity holders of the Company 158,468 159,257
(1) Other comprehensive income comprises items of income and expense that are recognised directly in reserves or equity. These items are not recognised in theconsolidated income statement in accordance with the requirements of the relevant accounting standards. Total comprehensive profit comprises the result forthe year adjusted for the other comprehensive income.
The above statement of comprehensive income should be read in conjunction with notes to the financial statements.
For
per
sona
l use
onl
y

ST BARBARA LIMITED 2017Financial Report
Page 41
Balance sheetas at 30 June 2017
CONSOLIDATED2017 2016
Notes $'000 $'000
AssetsCurrent assetsCash and cash equivalents 12 160,909 136,689Trade and other receivables 10 9,270 8,286Inventories 10 55,340 58,164Deferred mining costs 6 5,608 4,446Total current assets 231,127 207,585
Non current assetsTrade and other receivables 10 2,366Property, plant and equipment 5 126,493 162,448Financial assets 4,569 56Deferred mining costs 6 9,253 11,271Mine properties 7 159,859 179,884Exploration and evaluation 8 35,411 25,975Mineral rights 7 7,560 19,785Deferred tax assets 2 29,399 3,267Total non current assets 372,544 405,052Total assets 603,671 612,637
LiabilitiesCurrent liabilitiesTrade and other payables 10 36,480 39,768Interest bearing borrowings 12 507 3,201Rehabilitation provision 9 488 493Other provisions 16 12,154 10,519Current tax liability 2 29,692Total current liabilities 79,321 53,981
Non current liabilitiesInterest bearing borrowings 12 40 223,117Rehabilitation provision 9 27,750 28,095Deferred tax liabilities 2 31,221 2,169Other provisions 16 4,212 4,661Total non current liabilities 63,223 258,042
Total liabilities 142,544 312,023
Net Assets 461,127 300,614
EquityContributed equity 13 887,254 887,216Reserves (55,736) (58,639)Accumulated losses (370,391) (527,963)
Total equity 461,127 300,614
The above balance sheet should be read in conjunction with notes to the financial statements.
For
per
sona
l use
onl
y

ST BARBARA LIMITED 2017Financial Report
Page 42
Statement of changes in equityfor the year ended 30 June 2017
The above statement of changes in equity should be read in conjunction with notes to the financial statements.
CONSOLIDATED
Note
ContributedEquity$'000
ForeignCurrencyTranslationReserve$'000
OtherReserves$'000
AccumulatedLosses$'000
Total$'000
Balance at 1 July 2015 887,216 (49,459) 23 (697,351) 140,429Transactions with owners of the Company recognised directlyin equity:Share based payments expense 17 928 928Total comprehensive income for the yearProfit attributable to equity holders of the Company 169,388 169,388Other comprehensive loss (10,118) (13) (10,131)Balance at 30 June 2016 887,216 (59,577) 938 (527,963) 300,614
Transactionswith owners of the Company recognised directlyin equity:Share based payments expense 17 38 2,007 2,045Total comprehensive income for the yearProfit attributable to equity holders of the Company 157,572 157,572Other comprehensive gain/(loss) 904 (8) 896Balance at 30 June 2017 887,254 (58,673) 2,937 (370,391) 461,127
For
per
sona
l use
onl
y

ST BARBARA LIMITED 2017Financial Report
Page 43
Cash flow statementfor the year ended 30 June 2017
Consolidated2017 2016
Notes $'000 $'000Cash Flows From Operating Activities:Receipts from customers (inclusive of GST) 640,354 615,244
Payments to suppliers and employees (inclusive of GST) (309,097) (336,805)
Payments for exploration and evaluation (10,647) (6,786)
Interest received 1,948 1,910
Interest paid (11,304) (30,405)
Finance charges – finance leases (11) (225)
Borrowing costs paid (8,017) (145)
Net cash inflow from operating activities 12 303,226 242,788
Cash Flows From Investing Activities:Proceeds from sale of property, plant and equipment 12
Proceeds from deferred settlement relating to sale of asset 2,700
Payments for property, plant and equipment (9,796) (16,057)
Payments for development of mining properties (32,036) (21,071)
Payments for exploration and evaluation (9,436) (9,006)
Investments in shares (4,540)
Net cash outflow used in investing activities (53,108) (46,122)
Cash Flows From Financing Activities:Movement in restricted cash 118 1,966
Premium funding repayments (2,209)
Red Kite loan repayments (102,073)
US senior secured notes repayments (225,409) (37,798)
Principal repayments finance leases (946) (2,225)
Net cash outflow used in financing activities (228,446) (140,130)
Net increase in cash and cash equivalents 21,672 56,536
Cash and cash equivalents at the beginning of the year 136,689 76,871
Net movement in foreign exchange rates 2,548 3,282
Cash and cash equivalents at the end of the year 12 160,909 136,689
Cash flows are included in the statement of cash flows on a gross basis. The GST component of cash flows arising from investing or financing activities, whichare recoverable from, or payable to, the taxation authority are classified as part of operating cash flows.
The above cash flow statement should be read in conjunction notes to the financial statements.
For
per
sona
l use
onl
y

ST BARBARA LIMITED 2017Notes to the Financial Report
Page 44
A. Key results
1 Segment information
Leonora Simberi Total segment2017$’000
2016$’000
2017$’000
2016$’000
2017$’000
2016$’000
Gold Revenue 441,394 439,593 199,319 169,277 640,713 608,870Silver Revenue 553 740 436 505 989 1,245Total Revenue 441,947 440,333 199,755 169,782 641,702 610,115Mine operating costs (143,107) (161,117) (124,137) (119,810) (267,244) (280,927)Gross profit 298,840 279,216 75,618 49,972 374,458 329,188
Royalties (1) (17,303) (17,608) (4,471) (3,847) (21,774) (21,455)Impairment losses and asset write downs (27,273) (27,273)Depreciation and amortisation (61,903) (63,492) (19,838) (12,098) (81,741) (75,590)Net gain/(loss) on disposal of assets 14,673 (103) 14,570Segment profit before income tax 219,634 212,789 24,036 33,924 243,670 246,713Capital expenditure
Sustaining (30,206) (27,065) (3,711) (9,402) (33,917) (36,467)Growth(3) (9,402) (9,006) (9,402) (9,006)Gwalia Extension Project (7,861) (7,861)
Total capital expenditure (47,469) (36,071) (3,711) (9,402) (51,180) (45,473)
Segment assets(2) 304,904 317,514 123,963 146,666 428,867 464,180Segment non current assets(2) 279,276 285,786 86,148 101,119 365,424 386,905Segment liabilities(2) 26,130 22,670 29,775 35,428 55,905 58,098
(1) Royalties include state and government royalties and corporate royalties.(2) Represents the reportable segment balances after impairment and asset write down charges.(3) Growth capital at Gwalia represents deep drilling expenditure reported as part of exploration.
The Group has two operational business units: Leonora operationsand Simberi Operations. The operational business units aremanagedseparately due to their separate geographic regions.
A reportable segment is a component of the Group that engages inbusiness activities from which it may earn revenues or incurexpenses, including revenues and expenses that relate totransactions with any of the Group’s other components. Theoperating results (including production, cost per ounce and capitalexpenditure) of all reportable segments are regularly reviewed bythe Group’s Executive Leadership Team (“ELT”) to make decisionsabout resources to be allocated to the segment and assess itsperformance.
Performance is measured based on segment profit before incometax, as this is deemed to be the most relevant in assessingperformance, after taking into account factors such as cost perounce of production.
Segment capital expenditure represents the total cost incurredduring the year for mine development and acquisitions of property,plant and equipment. Growth capital at Gwalia represents deepdrilling exploration expenditure to extend mineral resources.
Sales revenueRevenue from the sale of gold and silver in the course of ordinaryactivities is measured at the fair value of the consideration receivedor receivable. The Group recognises revenue when the significantrisks and rewards of ownership have been transferred to the buyer,the amount of revenue can be reliably measured and the associatedcosts can be estimated reliably, and it is probable that futureeconomic benefits will flow to the Group.
RoyaltiesRoyalties are payable on gold sales revenue, based on gold ouncesproduced and sold, and are therefore recognised as the sale occurs.
Major CustomersMajor customers to whom the Group provides goods that aremore than 10% of external revenue are as follows:
Revenue % of externalrevenue
2017$’000
2016$’000
2017%
2016%
Customer A 217,305 296,399 33.9 48.7Customer B 250,736 262,384 39.2 43.1Customer C 106,774 16.7
For
per
sona
l use
onl
y

ST BARBARA LIMITED 2017Notes to the Financial Report
Page 45
1 Segment information (continued)
Consolidated
Operations2017$’000
2016$’000
Total profit for reportable segments 243,670 246,713
Other income and revenue 2,034 5,558
Exploration expensed (10,647) (6,786)
Unallocated depreciation andamortisation (3,842) (5,325)
Finance costs (19,961) (35,749)
Corporate costs (20,977) (19,184)
Net foreign exchange gain 3,037 142
Other expenses (3,608) (1,967)
Consolidated profit before income tax 189,706 183,402
Assets
Total assets for reportable segments 428,867 464,180
Cash and cash equivalents 160,106 134,081
Trade and other receivables (current) 7,578 7,500
Trade and other receivables (non current) 2,366
Financial assets 4,569 56
Property, plant & equipment 2,551 4,454
Consolidated total assets 603,671 612,637
Liabilities
Total liabilities for reportable segments 55,905 58,098
Trade and other payables 14,542 16,049
Interest bearing liabilities (current) 436 3,030
Provisions (current) 9,125 8,051
Interest bearing liabilities (non current) 11 223,117
Provisions (non current) 1,612 1,509
Current tax liability 29,692
Deferred tax liabilities 31,221 2,169
Consolidated total liabilities 142,544 312,023
Segment results that are reported to the ELT include items directlyattributable to a segment and those that can be allocated on areasonable basis. Unallocated items comprise mainly corporateassets and related depreciation, exploration expense, finance costsand corporate costs.
For
per
sona
l use
onl
y

ST BARBARA LIMITED 2017Notes to the Financial Report
Page 46
2 Tax
Income tax expenseConsolidated2017 2016$'000 $'000
Current tax expense 47,424 41,277Under/(over) provision in respect of theprior year
(2,474) 233
Deferred income tax benefit (12,816) (27,496)Total income tax expense 32,134 14,014
Numerical reconciliation of income tax expense to prima facie taxpayable
2017 2016$'000 $'000
Profit before income tax 189,706 183,402Tax at the Australian tax rate of 30% 56,912 55,021Tax effect of amounts notdeductible/(taxable) in calculating taxableincome:Equity settled share based payments 613 279Sundry items 281 (129)Recognition of previously unbookeddeferred tax assets in PNG (26,775) (3,344)Permanent differences on taxable income (361) (1,162)Research and development incentive (580) (630)Use of tax losses not previously recognised (3,341) (7,474)Interest expense previously treated as nondeductible (2,289)Deferred tax assets recognised as a resultof tax consolidation (18,796)Permanent differences arising from foreignexchange within the tax consolidatedgroup (2,804) (9,751)Provision for R&D tax credits previouslyrecognised 10,478Income tax expense 32,134 14,014
Income tax
Income tax expense comprises current and deferred tax. Current taxand deferred tax is recognised in the income statement, except tothe extent that it relates to a business combination, or itemsrecognised directly in equity or in other comprehensive income.
Current tax is the expected tax payable or receivable on the taxableprofit for the year, using tax rates enacted or substantively enactedat the reporting date, and any adjustment to tax payable in respectof previous years.
Tax exposure
In determining the amount of current and deferred tax the Grouptakes into account the impact of uncertain tax positions andwhetheradditional taxes and interest may be due. This assessment relies onestimates and assumptions and may involve a series of judgementsabout future events. New information may become available thatcauses the Group to change its judgement regarding the adequacyof existing tax liabilities; such changes to tax liabilities will impact taxexpense in the period that such a determination is made.
Tax consolidation
Entities in the tax consolidated group at 30 June 2017 included:St Barbara Ltd (head entity), Allied Gold Mining Ltd, Allied Gold PtyLtd, and Allied Gold Finance Pty Ltd. Current and deferred taxamounts are allocated using the “separate taxpayer within group”method.
A tax sharing and funding agreement has been established betweenthe entities in the tax consolidated group. The Company recognisesdeferred tax assets arising from the unused tax losses of the taxconsolidated group to the extent that it is probable that futuretaxable profits of the tax consolidated group will be available againstwhich the asset can be utilised.
Current tax liability
As at 30 June 2017 the Company recognised a current tax liability of$29,692,000 (2016: $Nil) which included the provision for R&D taxcredits.
Accounting judgements and estimates
During the year, AusIndustry performed a review of certain researchand development projects previously claimed by the Company inrelation to the research and development tax credit benefit scheme.Following their review, AusIndustry deemed the projects to beineligible in accordance with research and development taxlegislation.While the Company believes the projects are eligible, andhas requested an independent review of the AusIndustry findings, aprovision has been raised to reflect the impact of the projectspotentially being finally disallowed as research and development,and the ATO issuing an amended assessment as a result.
For
per
sona
l use
onl
y

ST BARBARA LIMITED 2017Notes to the Financial Report
Page 47
2 Tax (continued)
Deferred tax balancesConsolidated2017 2016$'000 $'000
Deferred tax assetsTax losses 41,722Provisions and accruals 41,699 40,169Investments at fair value 224Unrealised foreign exchange losses 64,560Property, plant and equipment 113,384 21,105Other 630 3,326Total 155,713 171,106Tax effect @ 30% 46,714 51,332
Deferred tax liabilitiesAccrued income 255 229Mine properties – exploration 38,595 30,209Mine properties – development 57,131 81,976Consumables 46,033 52,123Capitalised convertible notes costs 3,347 2,908Unrealised foreign exchange gains 16,426Total 161,787 167,445Tax effect @ 30% 48,536 50,234
Net deferred tax balance (1,822) 1,098
Comprising of:Australia – net deferred tax liabilities (31,221) (2,169)PNG – net deferred tax assets 29,399 3,267
Deferred tax assets have not beenrecognised in respect of thefollowing items:Tax losses – PNG Operations 53,079 74,283Property, plant and equipment – PNGOperations
48,159 192,433
Total 101,238 266,716Tax effect @ 30% 30,371 80,015
Deferred tax
Deferred tax is recognised in respect of temporary differencesbetween the carrying amounts of assets and liabilities for financialreporting purposes and the amounts used for taxation purposes.Deferred tax is not recognised for:
Temporary differences on the initial recognition of assets orliabilities in a transaction that is not a business combination andthat affects neither accounting nor taxable profit or loss;
Temporary differences related to investments in subsidiariesand jointly controlled entities to the extent that it is probablethat they will not reverse in the foreseeable future; and
Taxable temporary differences arising on the initial recognitionof goodwill.
Deferred tax is measured at the tax rates that are expected to beapplied to temporary differences when they reverse, based on thelaws that have been enacted or substantively enacted by thereporting date.
A deferred tax asset is recognised for unused tax losses, tax creditsand deductible temporary differences, to the extent that it isprobable that future taxable profits will be available against whichthey can be utilised. Deferred tax assets are reviewed at eachreporting date and are reduced to the extent that it is no longerprobable that the related tax benefit will be realised.
Tax benefits acquired as part of a business combination, but notsatisfying the criteria for separate recognition at that date, arerecognised subsequently if new information about facts andcircumstances change.
Deferred tax assets and liabilities are offset if there is a legallyenforceable right to offset current tax liabilities and assets, and theyrelate to income taxes levied by the same tax authority on the sametaxable entity, or on different tax entities, but they intend to settlecurrent tax liabilities and assets on a net basis or their tax assets andliabilities will be realised simultaneously.
Accounting judgements and estimatesAt each reporting date, the Group performs a review of the probablefuture taxable profit in each jurisdiction. The assessments are basedon the latest life of mine plans relevant to each jurisdiction and theapplication of appropriate economic assumptions such as gold priceand operating costs. Any resulting recognition of deferred tax assetsis categorised by type (e.g. tax losses or temporary differences) andrecognised based on which would be utilised first according to thatparticular jurisdiction’s legislation.
At 30 June 2017 tax losses not recognised amounted to $15,924,000(tax effected) relating to entities associated with Simberi operationsin PNG and Australia. These tax losses have not been recognised asit is not deemed probable at the reporting date that future taxableprofits will be available against which they can be utilised. Deferredtax balances recognised are based on taxable profit forecasts fromcurrent life of mine models.F
or p
erso
nal u
se o
nly

ST BARBARA LIMITED 2017Notes to the Financial Report
Page 48
3 Significant items
Significant items are those items where their nature or amount isconsidered material to the financial report. Such items includedwithin the consolidated results for the year are detailed below.
Consolidated2017 2016$'000 $'000
Included within profit on disposal ofasset
Gain on sale of King of the Hills andKailis 14,056
Impairment losses(1) (27,273)
Total significant items – pre tax (27,273) 14,056
Tax EffectTax effect of pre tax significant items 8,182 (3,839)Tax effect of the impact of taxconsolidation 28,547PNG deferred tax asset recognised(2) 26,775 3,267Provision for R&D tax credits(3) (10,478)
Total significant items – post tax (2,794) 42,031
4 Earnings per share
Consolidated2017 2016Cents Cents
Basic earnings per share 31.71 34.21Diluted earnings per share 30.42 32.70
Reconciliation of earnings used in calculating earnings per share
Consolidated2017 2016$'000 $'000
Basic and diluted earnings per share:Profit after tax for the year fromoperations 157,572 169,388
Weighted average number of shares
Consolidated2017 2016
Number NumberWeighted average number of ordinaryshares used in calculating basic earningsper share 496,990,112 495,102,525
Weighted average number of ordinaryshares and potential ordinary sharesused in calculating diluted earnings pershare 517,994,473 519,136,813
(1) Impairment losses
Represents the impairment loss booked at 31 December 2016 inrelation to the Simberi cash generating unit. Refer to note 7 forfurther information.
(2) PNG deferred tax asset recognised
Prior to 30 June 2016, there had been no deferred tax assetrecognised in relation to the PNG jurisdiction, as it had beenpreviously determined that it was not probable that the Simberioperation would generate future taxable profits. At 30 June 2016,following the successful completion of the turnaround inperformance of the Simberi operation, a net deferred tax asset wasrecognised of $3,267,000. At 30 June 2017 a further $26,775,000was recognised as a deferred tax asset based on the current life ofmine plan.
(3) Provision for R&D tax credits
Provision arising from AusIndustry review of certain rereseach anddevelopment projects as discussed in Note 2.
Performance rights
Performance rights granted to employees under the St BarbaraPerformance Rights Plan are considered to be potential ordinaryshares and are included in the determination of diluted earnings pershare to the extent to which they are dilutive. The rights are notincluded in the determination of basic earnings per share.
Basic earnings per share
Basic earnings per share is calculated by dividing the profitattributable to equity holders of the Company, excluding any costsof servicing equity other than ordinary shares, by the weightedaverage number of ordinary shares outstanding during the reportingperiod, adjusted for bonus elements in ordinary shares issued duringthe reporting period.
Diluted earnings per share
Diluted earnings per share adjusts the figures used in thedetermination of basic earnings per share to take into account theafter income tax effect of interest and other financing costsassociated with dilutive potential ordinary shares, and the weightedaverage number of shares assumed to have been issued for noconsideration in relation to dilutive potential ordinary shares.F
or p
erso
nal u
se o
nly

ST BARBARA LIMITED 2017Notes to the Financial Report
Page 49
B. Mining operations
5 Property, plant and equipment
Consolidated2017 2016$'000 $'000
Land and buildingsAt the beginning of the year 17,864 18,100Additions 746 1,529Depreciation (average 3 15 years) (4,899) (1,937)Disposals (507)Effects of movement in foreignexchange rates (126) 172At the end of the year 13,078 17,864
Plant and equipmentAt the beginning of the year 144,584 151,945Additions 9,557 14,687Disposals (342) (1,703)Depreciation (average 3 10 years) (20,180) (22,180)Asset impairment and write downs (1) (19,750)Effects of movement in foreignexchange rates (454) 1,835At the end of the year 113,415 144,584Total 126,493 162,448
(1) Refer to Note 7
Security
As at 30 June 2017, plant and equipment with a carrying value of$547,000 (2016: $1,542,000) was pledged as security for financeleases.
Reconciliation of depreciation and amortisation to incomestatement
Consolidated2017 2016$'000 $'000
DepreciationLand and buildings (4,899) (1,937)Plant and equipment (20,180) (22,180)
Amortisation (Note 7)Mine properties (52,061) (53,176)Mineral rights (8,443) (3,622)Total (85,583) (80,915)
Capital commitmentsConsolidated2017 2016$’000 $’000
Gwalia Extension ProjectPurchase orders raised on contractedcapital expenditure. 5,316
Buildings, plant and equipment are stated at historical cost lessaccumulated depreciation. Historical cost includes expenditure thatis directly attributable to the acquisition of the items.
Subsequent costs are included in the asset’s carrying amount orrecognised as a separate asset, as appropriate, only when it isprobable that future economic benefits associated with the itemwillflow to the Group and the cost of the item can be measured reliably.All other repairs and maintenance are charged to the incomestatement during the financial period in which they are incurred.
Depreciation of assets is calculated using the straight line method toallocate the cost or revalued amounts, net of residual values, overtheir estimated useful lives.
Where the carrying value of an asset is less than its estimatedresidual value, no depreciation is charged. The assets’ residualvalues and useful lives are reviewed, and adjusted if appropriate, ateach balance sheet date.
An asset’s carrying amount is written down immediately to itsrecoverable amount, if the asset’s carrying amount is greater thanits estimated recoverable amount.
Gains and losses on disposal are determined by comparing proceedswith the carrying amount. These gains and losses are included in theincome statement when realised.
For
per
sona
l use
onl
y

ST BARBARA LIMITED 2017Notes to the Financial Report
Page 50
6 Deferred mining costs
Consolidated2017 2016$'000 $'000
CurrentDeferred operating mine development 5,608 4,446
Non currentDeferred operating mine development 9,253 11,271
Certain mining costs, principally those that relate to the stripping ofwaste and operating development in underground operations,which provide access so that future economically recoverable orecan be mined, are deferred in the balance sheet as deferred miningcosts.
Underground operations
In underground operations mining occurs progressively on a levelby level basis. Underground mining costs in the period are deferredbased on the metres developed for a particular level. Previouslydeferred underground mining costs are amortised to the incomestatement based on the recoverable ounces produced over the lifeof mine recoverable ounces. Deferred costs are released to theincome statement as ounces are produced from the related mininglevels.
Open pit operations
Overburden and other mine waste materials are often removedduring the initial development of a mine site in order to access themineral deposit and deferred. This activity is referred to as deferredstripping.
Removal of waste material normally continues throughout the life ofan open pit mine. This activity is referred to as production stripping.
The Group has no deferred waste costs associated with open pitoperations at 30 June 2017.
Accounting judgements and estimatesThe Group applies the units of production method for amortisationof underground operating development. The amortisation rates aredetermined on a level by level basis. In underground operations anestimate ismade of the life of level average undergroundmining costper recoverable ounce to expense underground costs in the incomestatement. Underground mining costs in the period are deferredbased on the metres developed for a particular level.
Grade control drilling is deferred to the statement of financialposition on a level by level basis. These amounts are released to theincome statement as ounces are produced from the related mininglevels.
For
per
sona
l use
onl
y

ST BARBARA LIMITED 2017Notes to the Financial Report
Page 51
7 Mine properties and mineral rights
Consolidated2017 2016
Mine properties $'000 $'000At beginning of the year 179,884 211,989Direct expenditure 32,036 21,071Amortisation for the year (52,061) (53,176)At end of the year 159,859 179,884
Consolidated2017 2016
Mineral rights $'000 $'000At the beginning of the year 19,785 23,407Amortisation (8,443) (3,622)Impairment losses and write downs (3,782)At the end of the year 7,560 19,785
Mine propertiesMine development expenditure represents the acquisition costand/or accumulated exploration, evaluation and developmentexpenditure in respect of areas of interest in which mining hascommenced.
When further development expenditure is incurred in respect of amine, after the commencement of production, such expenditure iscarried forward as part of the mine development only whensubstantial future economic benefits are thereby established,otherwise such expenditure is classified as part of production andexpensed as incurred.
Mine development costs are deferred until commercial productioncommences, at which time they are amortised on a unit ofproduction basis over mineable reserves. The calculation ofamortisation takes into account future costs which will be incurredto develop all the mineable reserves. Changes to mineable reservesare applied from the beginning of the reporting period and theamortisation charge is adjusted prospectively from the beginning ofthe period.
Accounting judgements and estimatesThe Group applies the units of production method for amortisationof its life of mine specific assets, which results in an amortisationcharge proportional to the depletion of the anticipated remaininglife of mine production. These calculations require the use ofestimates and assumptions in relation to reserves and resources,metallurgy and the complexity of future capital developmentrequirements; changes to these estimates and assumptions willimpact the amortisation charge in the income statement and assetcarrying values.
Mineral rights
Mineral rights comprise identifiable exploration and evaluationassets, mineral resources and ore reserves, which are acquired aspart of a business combination or a joint venture acquisition, and arerecognised at fair value at the date of acquisition. Mineral rights areattributable to specific areas of interest and are amortised whencommercial production commences on a unit of production basisover the estimated economic reserves of the mine to which therights relate.
The Group’s mineral rights are associated with the Simberioperations and PNG interests. The assets impairment and writedown recognised at 31 December 2016 included a write down ofmineral rights.
For
per
sona
l use
onl
y

ST BARBARA LIMITED 2017Notes to the Financial Report
Page 52
7. Mine properties and mineral rights(continued)
Impairment of assetsAll asset values are reviewed at each reporting date to determinewhether there is objective evidence that there have been events orchanges in circumstances that indicate that the carrying value maynot be recoverable. Where an indicator of impairment exists, aformal estimate of the recoverable amount is made. An impairmentloss is recognised for the amount by which the carrying amount ofan asset or a cash generating unit (‘CGU’) exceeds the recoverableamount. Impairment losses are recognised in the income statement.
The Group assesses impairment of all assets at each reporting dateby evaluating conditions specific to the Group and to the particularassets that may lead to impairment.
The identified CGUs of the Group are: Leonora and Simberi. Thecarrying value of the Leonora and Simberi CGUs are assessed usingfair value less costs of disposal (‘Fair Value’).
Fair Value is determined as the net present value of the estimatedfuture cash flows. Future cash flows are based on life of mine plansusing market based commodity price and exchange assumptions forboth Australian Dollar (AUD) and United States Dollar (USD) goldprice, estimated quantities of ore reserves, operating costs andfuture capital expenditure. Costs to sell have been estimated bymanagement.
Accounting judgements and estimates ImpairmentAt 30 June 2017, the Group determined that there were noindicators of impairment for either the Leonora or Simberi cashoperating units due to strong spot and forward gold prices at 30 June2017 and increases in mine life at both operations. Although goldprices were stronger, and there was an extension to mine life atSimberi, taking all factors into consideration there were noindicators to reverse prior impairments booked.
At 31 December 2016, the Group determined that there wereindicators of impairment for the Simberi CGU given its sensitivity togold price and the weakening of the USD spot gold price from 30June 2016 to 31 December 2016. The Group conducted the carryingvalue analysis of the Simberi CGU resulting in an impairment chargeof $19,091,000 after tax at the 31 December 2016 half year reportingdate, as summarised in the table below.
Simberi$’000
Write down of assetsInventories 3,741ImpairmentsProperty plant and equipment 19,750Mineral rights 3,782Total impairment and asset write downs 27,273Tax effect (8,182)Total impairment and asset write downs after tax 19,091
Significant judgements and assumptions are required in makingestimates of Fair Value. The CGU valuations are subject to variabilityin key assumptions including, but not limited to: long term goldprices, currency exchange rates, discount rates, production,operating costs and future capital expenditure. An adverse changein one or more of the assumptions used to estimate Fair Value couldresult in a reduction in a CGU’s recoverable value. This could lead tothe recognition of impairment losses in the future. The interrelationship of the significant accounting assumptions upon whichestimated future cash flows are based, however, are such that it is
impractical to disclose the extent of the possible effects of a changein a key assumption in isolation.
The assumptions used for the impairment of the Simberi CGU at 31December 2016 were:
2017 2022Gold (Real US$ per ounce) $1,098/oz $1,335/ozAUD:USD exchange rate 0.74Post tax real discount rate (%) – PNG 10.2
Commodity prices and exchange rates
Commodity prices and foreign exchange rates are estimated withreference to external market forecasts and updated at leastannually. The rates applied to the valuation have regard toobservable market data, including spot and forward values.
Discount rate
In determining the Fair Value of CGUs, the future cash flows arediscounted using rates based on the Group’s estimated real post taxweighted average cost of capital for each functional currency usedin the Group, with an additional premium applied having regard tothe geographic location of the CGU.
Operating and capital costs
Life of mine operating and capital cost assumptions are based onthe Group’s latest life of mine plans. The projections do not includeexpected cost improvements reflecting the Group’s objectives tomaximise free cash flow, optimise and reduce activity, applytechnology, improve capital and labour productivity.
Unmined resources and exploration values
Unmined resources are not included in a CGU’s life of mine plan fora number of reasons, including the need to constantly re assess theeconomic returns on and timing of specific production options in thecurrent economic environment. In our determination of Fair Value,there are no unmined resources or exploration estimates includedwithin the valuation.
Any variation in the key assumptions used to determine Fair Valuewill result in a change of the assessed fair value. If the variation inassumption had a negative impact on Fair Value it could indicate arequirement for additional impairment of non current assets in thefuture.
It is estimated that changes in the key assumptions would have thefollowing approximate impact on the Fair Value of the CGU in itsfunctional currency that was subject to impairment as at 31December 2016:
SimberiDecrease in Fair Value resulting from: $’000US$100/oz decrease in gold price 17,1120.50% increase in discount rate 280
The sensitivities above assume that the specific assumption movesin isolation, while all other assumptions are held constant. In reality,a change in one of the aforementioned assumptions is usuallyaccompanied with a change in another assumption, which may havean offsetting impact (for example, a decline in the USD gold pricecould be accompanied by a decline in the AUD compared to theUSD). Action is also usually taken to respond to adverse changes ineconomic assumptions that may mitigate the financial impact of anysuch change.
For
per
sona
l use
onl
y

ST BARBARA LIMITED 2017Notes to the Financial Report
Page 53
Ore Reserves
The Group determines and reports Ore Reserves under the 2012edition of the Australian Code for Reporting of Mineral Resourcesand Ore Reserves, known as the JORC Code. The JORC Code requiresthe use of reasonable investment assumptions to calculate reserves.Due to the fact that economic assumptions used to estimatereserves change from period to period, and geological data isgenerated during the course of operations, estimates of reservesmay change from period to period.
Accounting judgements and estimates– Ore ReservesReserves are estimates of the amount of gold product that can beeconomically extracted from the Group’s properties. In order tocalculate reserves, estimates and assumptions are required about arange of geological, technical and economic factors, includingquantities, grades, production techniques, recovery rates,production costs, future capital requirements, short and long termcommodity prices and exchange rates.
Estimating the quantity and/or grade of reserves requires the size,shape and depth of ore bodies to be determined by analysinggeological data. This process may require complex and difficultgeological judgements and calculations to interpret the data.
Changes in reported reservesmay affect the Group’s financial resultsand financial position in a number of ways, including:
Asset carrying values may be impacted due to changes inestimated future cash flows.
The recognition of deferred tax assets.
Depreciation and amortisation charged in the income statementmay change where such charges are calculated using the units ofproduction basis.
Underground capital development deferred in the balance sheetor charged in the income statement may change due to arevision in the development amortisation rates.
Decommissioning, site restoration and environmental provisionsmay change where changes in estimated reserves affectexpectations about the timing or cost of these activities.
For
per
sona
l use
onl
y

ST BARBARA LIMITED 2017Notes to the Financial Report
Page 54
8 Exploration and evaluation
Consolidated2017 2016
Non current $'000 $'000At beginning of the year 25,975 16,969Additions 9,436 9,006DisposalsAt end of the year 35,411 25,975
Commitments for explorationConsolidated
2017$’000
2016$’000
ExplorationIn order to maintain rights of tenure tomining tenements, the Group is committedto tenement rentals and minimumexploration expenditure in terms of therequirements of the relevant stategovernment mining departments inWestern Australia. This requirement willcontinue for future years with the amountdependent upon tenement holdings. 4,779 4,898
All exploration and evaluation expenditure incurred up toestablishment of resources is expensed as incurred. From the pointin time when reserves are established, or where there is areasonable expectation for reserves, exploration and evaluationexpenditure is capitalised and carried forward in the financialstatements, in respect of areas of interest for which the rights oftenure are current and where such costs are expected to berecouped through successful development and exploitation of thearea of interest, or alternatively, by its sale. Capitalised costs aredeferred until commercial production commences from the relevantarea of interest, at which time they are amortised on a unit ofproduction basis.
Exploration and evaluation expenditure consists of an accumulationof acquisition costs and direct exploration and evaluation costsincurred, together with an allocation of directly related overheadexpenditure.
Feasibility expenditures represents costs related to the preparationand completion of a feasibility study to enable a developmentdecision to be made in relation to that area of interest. Feasibilityexpenditures are expensed as incurred until a decision has beenmade to develop the area of interest.
Exploration and evaluation assets are assessed for impairment if (i)sufficient data exists to determine technical feasibility andcommercial viability, and (ii) facts and circumstances suggest thatthe carrying amount exceeds the recoverable amount. For thepurpose of impairment testing, exploration and evaluation assetsare allocated to cash generating units to which the explorationactivity relates.
When an area of interest is abandoned, or the Directors determineit is not commercially viable to pursue, accumulated costs in respectof that area are written off in the period the decision is made.
Accounting judgements and estimatesExploration and evaluation expenditure is capitalisedwhere reserveshave been established for an area of interest, or where there is areasonable expectation for reserves, and it is considered likely to berecoverable from future exploitation or sale. The accounting policyrequires management to make certain estimates and assumptionsas to future events and circumstances, in particular whether aneconomically viable extraction operation is likely. These estimatesand assumptions may change as new information becomesavailable. If, after having capitalised the expenditure under theaccounting policy, a judgement is made that recovery of theexpenditure is unlikely, the relevant capitalised amount will bewritten off to the income statement.
For
per
sona
l use
onl
y

ST BARBARA LIMITED 2017Notes to the Financial Report
Page 55
9 Rehabilitation provision
Consolidated2017 2016$'000 $'000
CurrentProvision for rehabilitation 488 493
Non currentProvision for rehabilitation 27,750 28,095
28,238 28,588
Movements in ProvisionsRehabilitationBalance at start of year 28,588 42,087Unwinding of discount 1,658 1,707Reduction in net provisions made duringthe year (1)
(14,008)
Effects of movements in the foreignexchange rate
(2,008) (1,198)
Balance at end of year 28,238 28,588
(1) Represents the elimination of the King of the Hills rehabilitation provision($14,008,000) on sale of the tenements to Saracen Metals Pty Ltd inOctober 2015.
Provisions, including those for legal claims and rehabilitation andrestoration costs, are recognised when the Group has a present legalor constructive obligation as a result of past events, it is more likelythan not that an outflow of resources will be required to settle theobligation, and the amount has been reliably estimated. Provisionsare not recognised for future operating losses.
The Group has obligations to dismantle, remove, restore andrehabilitate certain items of property, plant and equipment andareas of disturbance during mining operations.
A provision is made for the estimated cost of rehabilitation andrestoration of areas disturbed during mining operations up toreporting date but not yet rehabilitated. The provision also includesestimated costs of dismantling and removing the assets andrestoring the site on which they are located. The provision is basedon current estimates of costs to rehabilitate such areas, discountedto their present value based on expected future cash flows. Theestimated cost of rehabilitation includes the current cost ofcontouring, topsoiling and revegetation to meet legislativerequirements. Changes in estimates are dealt with on a prospectivebasis as they arise.
As there is some uncertainty as to the amount of rehabilitationobligations that will be incurred due to the impact of changes inenvironmental legislation and many other factors (including futuredevelopments, changes in technology and price increases), therehabilitation liability is remeasured at each reporting date in linewith changes in the timing and /or amounts of the costs to beincurred and discount rates. The liability is adjusted for changes inestimates. Adjustments to the estimated amount and timing offuture rehabilitation and restoration cash flows are a normaloccurrence in light of the significant judgments and estimatesinvolved.
As the value of the provision represents the discounted value of thepresent obligation to restore, dismantle and rehabilitate, theincrease in the provision due to the passage of time is recognised asa borrowing cost. A large proportion of the outflows are expectedto occur at the time the respective mines are closed.
Accounting judgements and estimatesMine rehabilitation provision requires significant estimates andassumptions as there are many transactions and other factors thatwill ultimately affect liability payable to rehabilitate the mine sites.Factors that will affect this liability include changes in regulations,prices fluctuations, changes in technology, changes in timing of cashflows which are based on life of mine plans and changes to discountrates. When these factors change or are known in the future, suchdifference will impact the mine rehabilitation provision in the periodin which it becomes known.
For
per
sona
l use
onl
y
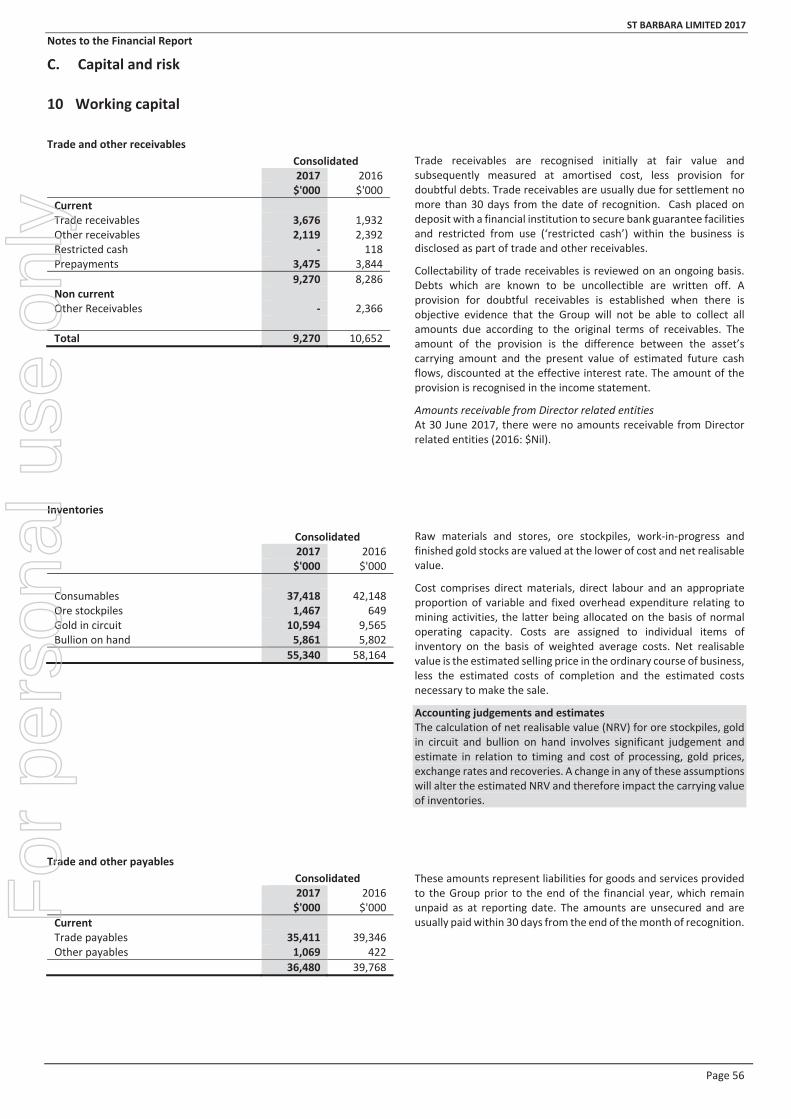
ST BARBARA LIMITED 2017Notes to the Financial Report
Page 56
C. Capital and risk
10 Working capital
Trade and other receivablesConsolidated2017 2016$'000 $'000
CurrentTrade receivables 3,676 1,932Other receivables 2,119 2,392Restricted cash 118Prepayments 3,475 3,844
9,270 8,286Non currentOther Receivables 2,366
Total 9,270 10,652
Inventories
Trade and other payablesConsolidated2017 2016$'000 $'000
CurrentTrade payables 35,411 39,346Other payables 1,069 422
36,480 39,768
Trade receivables are recognised initially at fair value andsubsequently measured at amortised cost, less provision fordoubtful debts. Trade receivables are usually due for settlement nomore than 30 days from the date of recognition. Cash placed ondeposit with a financial institution to secure bank guarantee facilitiesand restricted from use (‘restricted cash’) within the business isdisclosed as part of trade and other receivables.
Collectability of trade receivables is reviewed on an ongoing basis.Debts which are known to be uncollectible are written off. Aprovision for doubtful receivables is established when there isobjective evidence that the Group will not be able to collect allamounts due according to the original terms of receivables. Theamount of the provision is the difference between the asset’scarrying amount and the present value of estimated future cashflows, discounted at the effective interest rate. The amount of theprovision is recognised in the income statement.
Amounts receivable from Director related entitiesAt 30 June 2017, there were no amounts receivable from Directorrelated entities (2016: $Nil).
Raw materials and stores, ore stockpiles, work in progress andfinished gold stocks are valued at the lower of cost and net realisablevalue.
Cost comprises direct materials, direct labour and an appropriateproportion of variable and fixed overhead expenditure relating tomining activities, the latter being allocated on the basis of normaloperating capacity. Costs are assigned to individual items ofinventory on the basis of weighted average costs. Net realisablevalue is the estimated selling price in the ordinary course of business,less the estimated costs of completion and the estimated costsnecessary to make the sale.
Accounting judgements and estimatesThe calculation of net realisable value (NRV) for ore stockpiles, goldin circuit and bullion on hand involves significant judgement andestimate in relation to timing and cost of processing, gold prices,exchange rates and recoveries. A change in any of these assumptionswill alter the estimated NRV and therefore impact the carrying valueof inventories.
These amounts represent liabilities for goods and services providedto the Group prior to the end of the financial year, which remainunpaid as at reporting date. The amounts are unsecured and areusually paid within 30 days from the end of themonth of recognition.
Consolidated2017 2016$'000 $'000
Consumables 37,418 42,148Ore stockpiles 1,467 649Gold in circuit 10,594 9,565Bullion on hand 5,861 5,802
55,340 58,164
For
per
sona
l use
onl
y

ST BARBARA LIMITED 2017Notes to the Financial Report
Page 57
11 Financial risk managementFinancial risk management
The Group’s management of financial risk is aimed at ensuring netcash flows are sufficient to withstand significant changes in cash flowunder certain risk scenarios and still meet all financial commitmentsas and when they fall due. The Group continually monitors and testsits forecast financial position and has a detailed planning processthat forms the basis of all cash flow forecasting.
The Group's normal business activities expose it to a variety offinancial risk, being: market risk (especially gold price and foreigncurrency risk), credit risk and liquidity risk. The Group may usederivative instruments as appropriate to manage certain riskexposures.
Risk management in relation to financial risk is carried out by acentralised Group Treasury function in accordance with Boardapproved directives that underpin Group Treasury policies andprocesses. The Treasury Risk Management Committee assists andadvises the Group Treasury function, Executive Leadership Team,Audit and Risk Committee and Board in discharging theirresponsibilities in relation to forecasted risk profiles, risk issues, riskmitigation strategies and compliance with Treasury policy. GroupTreasury regularly reports the findings to the Treasury RiskManagement Committee and the Board.
(a) Market riskMarket risk is the risk that changes in market prices, such ascommodity prices, foreign exchange rates, interest rates and equityprices will affect the Group’s income or the value of its holdings offinancial instruments, cash flows and financial position. The Groupmay enter into derivatives, and also incur financial liabilities, in orderto manage market risks. All such transactions are carried out withindirectives and policies approved by the Board.
(b) Currency risk
The Group is exposed to currency risk on gold sales, purchases andborrowings that are denominated in a currency other than theCompany’s presentation currency of Australian dollars. Thecurrencies in which transactions primarily are denominated areAustralian Dollars (AUD), US Dollars (USD) and Papua New GuineaKina (PGK).
The exchange rates at the year end were as follows:
Closing rate as at AUD/USD AUD/PGK30 June 2017 0.7695 2.378830 June 2016 0.7452 2.3216
2017 2016
Exposure to currency USD$’000
PGK$’000
USD$’000
PGK$’000
Cash and cash equivalents 8,606 1,637 58,625 4,747Trade receivables 356 297 216 288Trade payables (4,095) (7,805) (6,054) (5,415)Interest bearing liabilities (77) (168,102)Net exposure 4,790 (5,871) (115,315) (380)
Sensitivity analysis:The following table details the Group's sensitivity to a 10%movement (i.e. increase or decrease) in the Australian dollar againstthe US dollar and PNG Kina at the reporting date, with all othervariables held constant. The 10% sensitivity is based on reasonablypossible changes, over a financial year, using the observed range ofactual historical rates for the preceding five year period:
Impact on Profit After Tax(Increase profit)/decrease
profit2017 2016$'000 $'000
AUD/USD +10% (487) 11,522
AUD/USD 10% 487 (11,522)
PGK against the AUD has been reviewed and considered an immaterialcurrency risk.
Significant assumptions used in the foreign currency exposuresensitivity analysis above include:
Reasonably possible movements in foreign exchange rates.
The translation of the net assets in subsidiaries with a functionalcurrency other than the Australian dollar has not been includedin the sensitivity analysis as part of the equity movement.
The net exposure at the reporting date is representative of whatthe Group is expected to be exposed to in the next 12 months.
The sensitivity analysis only includes the impact on the balanceof financial assets and financial liabilities at the reporting date.
(c) Interest rate risk exposures
The Group’s main interest rate risk arises from long termborrowings. Borrowings issued at variable rates expose the Groupto cash flow interest rate risk. Borrowings issued at fixed ratesexpose the Group to fair value interest rate risk. The Group Treasurymanages the interest rate exposures according to the Boardapproved Treasury policy. Any decision to hedge interest rate risk isassessed in relation to the overall Group exposure, the prevailinginterest rate market, and any funding counterparty requirements.As at 30 June 2017, interest rates on interest bearing liabilities werefixed.
The Group’s exposure to interest rate risk and the effective weightedaverage interest rate by maturity periods is set out in the followingtables. Exposures arise predominantly from assets and liabilitiesapplying variable interest rates, as the Group intends to hold fixedrate assets and liabilities to maturity.
For
per
sona
l use
onl
y

ST BARBARA LIMITED 2017Notes to the Financial Report
Page 58
11 Financial risk management (continued)(d) Capital management
The Group’s total capital is defined as total shareholders’ funds plusnet debt. The Group aims to maintain an optimal capital structureto reduce the cost of capital and maximise shareholder returns. TheGroup has a capital management plan that is reviewed by the Boardon a regular basis.
Consolidated capital 2017$’000
2016$’000
Total shareholders’ funds 461,127 300,614Borrowings 547 226,318Cash and cash equivalents(1) (547) (136,689)Total capital 461,127 390,243(1) Cash and cash equivalents are included to the extent that the net debt
position is nil.
The Group does not have a target net debt/equity ratio. There wereno changes in the Group’s approach to capital management duringthe year, with the focus on the reduction in borrowings using surpluscash flows.
The Group is not subject to externally imposed capital requirementsother than normal banking requirements.
Investments and other financial assets
The Group classifies its investments and other financial assets in thefollowing categories: financial assets at fair value through profit andloss, loans and receivables, and available for sale financial assets.The classification depends on the purpose for which the investmentswere acquired. Management determines the classification of itsinvestments at initial recognition and re evaluates this designationat each reporting date.
Investments and other financial assets are recognised initially at fairvalue plus, for assets not at fair value through profit and loss, anydirectly attributable transaction costs.
(e) Credit risk
Credit risk is the risk that a counter party will not meet its obligationsunder a financial instrument or customer contract, with a maximumexposure equal to the carrying amount of the financial assets asrecorded in the financial statements. The Group is exposed to creditrisk from its operating activities (primarily customer receivables) andfrom its financing activities, including deposits with banks andfinancial institutions and derivatives.
Credit risks related to receivables
The Group’s most significant customer accounts for $2,586,000 ofthe trade receivables carrying amount at 30 June 2017 (2016:$1,714,000), representing receivables owing from gold sales. Basedon historic rates of default, the Group believes that no impairmenthas occurredwith respect to trade receivables, and none of the tradereceivables at 30 June 2017 were past due.
Credit risks related to cash deposits and derivatives
Credit risk from balances with banks, financial institutions andderivative counterparties is managed by the centralised GroupTreasury function in accordance with the Board approved policy.Investments of surplus funds are only made with approved
counterparties with a minimum Standard & Poor’s credit rating, andthere is a financial limit on funds placed with any singlecounterparty.
Derivative transactions are only made with approved counterpartiesin accordance with the Board approved Treasury Policy. Derivativetransactions do not cover a major proportion of total Groupproduction, with maturities occurring over a relatively short periodof time.
(f) Cash flow hedges
The Group’s revenue is exposed to spot gold price risk. Based uponsensitivity analysis, a movement in the average spot price of goldduring the year of $100 per ounce and all other factors remainingconstant, would have changed post tax profit by $26,612,000.
In accordance with the Group’s financial risk management policies,the Group has managed commodity price risk from time to timeusing gold forward contracts as described below.
In April 2017, the Company entered into gold forward contracts for50,000 ounces of gold at $1,725 per ounce with maturity over atwelve month period from July 2017 to June 2018.
In June 2017, the Company entered into further gold forwardcontracts for 50,000 ounces of gold at $1,730 per ounce withmaturity over a twelve month period from July 2017 to June 2018.The forward contracts protect Simberi operating margins.
As physical delivery of gold is used to close out forward contracts,the standard provides an own use exemption under which the Groupis not subject to the requirements of AASB 139 for these contracts.
The maturity profile of the gold forward contracts remaining as at30 June 2017 is provided in the table below.
StrikePrice
Totalounces
6monthsor lessounces
6 – 12monthsounces
1 – 2yearsounces
2 – 5yearsounces
$1,725/oz 50,000 24,000 26,000
$1,730/oz 50,000 24,000 26,000
Cash flow hedge sensitivity
The relationship between currencies, spot gold price andvolatilities is complex and changes in the spot gold price caninfluence volatility, and vice versa.
At 30 June 2017, the Group did not hold any gold options tohedge against movements in the gold price, however this isreviewed by the Board as part of the risk managementframework.
For
per
sona
l use
onl
y

ST BARBARA LIMITED 2017Notes to the Financial Report
Page 59
11 Financial risk management (continued)(g) Fair value estimation
The fair value of cash and cash equivalents and non interest bearing monetary financial assets and financial liabilities of the Group approximatescarrying value. The fair value of other monetary financial assets and financial liabilities is based upon market prices.
The fair value of financial assets and financial liabilities must be estimated for recognition and measurement, or for disclosure purposes.
The fair value of financial instruments traded in active markets (such as publicly traded derivatives, and trading and available for sale securities)is based on quoted market prices at the balance sheet date. The quoted market price used for financial assets held by the Group is the currentbid price; the appropriate quoted market price for financial liabilities is the current ask price.
The fair value of financial instruments that are not traded in an active market (for example, over the counter derivatives) is determined usinggenerally accepted valuation techniques. The Group uses a variety of methods and makes assumptions that are based on market conditionsexisting at each balance date.
The nominal value less estimated credit adjustments of trade receivables and payables are assumed to approximate their fair values. The fairvalue of financial liabilities for disclosure purposes is estimated by discounting the future contractual cash flows at the current market interestrate that is available to the Group for similar financial instruments.
Fixed Interest Maturing in 2017
Financial assets
FloatingInterest rate
$’000
1 year orless$’000
Over 1 to 5years$’000
Noninterestbearing$’000
Total$’000
Fair value
Cash and cash equivalents 40,909 120,000 160,909 160,909Receivables 5,795 5,795 5,795Available for sale financial assets(1) 4,569 4,569 4,569
40,909 120,000 10,364 171,273 171,273Weighted average interest rate 1.06% 2.48% n/a n/a
Financial liabilitiesTrade and other payables 36,480 36,480 36,480Finance lease liabilities 507 40 547 547
507 40 36,480 37,027 37,027Weighted average interest rate n/a 6.49% 8.00% n/aNet financial assets/(liabilities) 40,909 119,493 (40) (26,116) 134,246 134,246
Fixed Interest Maturing in 2016Financial assetsCash and cash equivalents 101,689 35,000 136,689 136,689Restricted cash and cash equivalents 118 118 118Receivables 6,690 6,690 6,690Available for sale financial assets 56 56 56
101,689 35,118 6,746 143,553 143,553Weighted average interest rate 0.63% 2.84% n/a n/a
Financial liabilitiesTrade and other payables 39,768 39,768 39,768Finance lease liabilities 992 550 1,542 1,542Loans from other entities 2,209 2,209 2,209Senior secured notes(2) 222,567 222,567 228,227
3,201 223,117 39,768 266,086 271,746Weighted average interest rate n/a 4.99% 8.87% n/aNet financial assets/(liabilities) 101,689 31,917 (223,117) (33,022) (122,533) (128,193)
(1) Fair value is determined based on Level 1 inputs as the balance represents investments in listed securities.
(2) Senior secured notes amount excludes $2,551,000 of capitalised transaction cost and $287,000 discount on notes in 2016.
For
per
sona
l use
onl
y

ST BARBARA LIMITED 2017Notes to the Financial Report
Page 60
11 Financial risk management (continued)
(h) Liquidity risk
Prudent liquidity riskmanagement requiresmaintaining sufficient cash andmarketable securities, the availability of funding through an adequateamount of committed credit facilities and the ability to close out market positions. During the financial year the primary objective was to fullyrepay the senior secured notes and to maintain sufficient cash to provide financial flexibility.
The Group manages liquidity risk by continuously monitoring forecast and actual cash flows, and matching maturity profiles of financial assetsand liabilities. The Group undertakes sensitivity analysis to stress test the operational cash flows, which are matched with capital commitmentsto assess liquidity requirements. The capital management plan provides the analysis and actions required in detail for the next twelve monthsand longer term. The maturity of non current liabilities is monitored within the cash management plan.
Surplus funds are invested in instruments that are tradeable in highly liquid markets.
Maturities of financial liabilities
The table below analyses the Group’s financial liabilities. The amounts disclosed in the table are the contractual undiscounted cash flows, whichincludes interest obligations over the term of the facilities.
Maturity of financial liabilities – 2017
Less than12 months
$‘000
Between 1and 5 years
$‘000
Over 5years$‘000
Totalcontractualcash flows$‘000
Carryingamount$‘000
Finance lease liabilities 521 41 562 547Trade and other payables 36,480 36,480 36,480
37,001 41 37,042 37,027
Maturity of financial liabilities – 2016
Senior Secured Notes(1) 20,004 245,410 265,414 222,567Premium insurance funding 2,297 2,297 2,209Finance lease liabilities 1,059 565 1,624 1,542Trade and other payables 39,768 39,768 39,768
63,128 245,975 309,103 266,086
(1) Excluding amortisation of capitalised transaction costs and discount.
For
per
sona
l use
onl
y
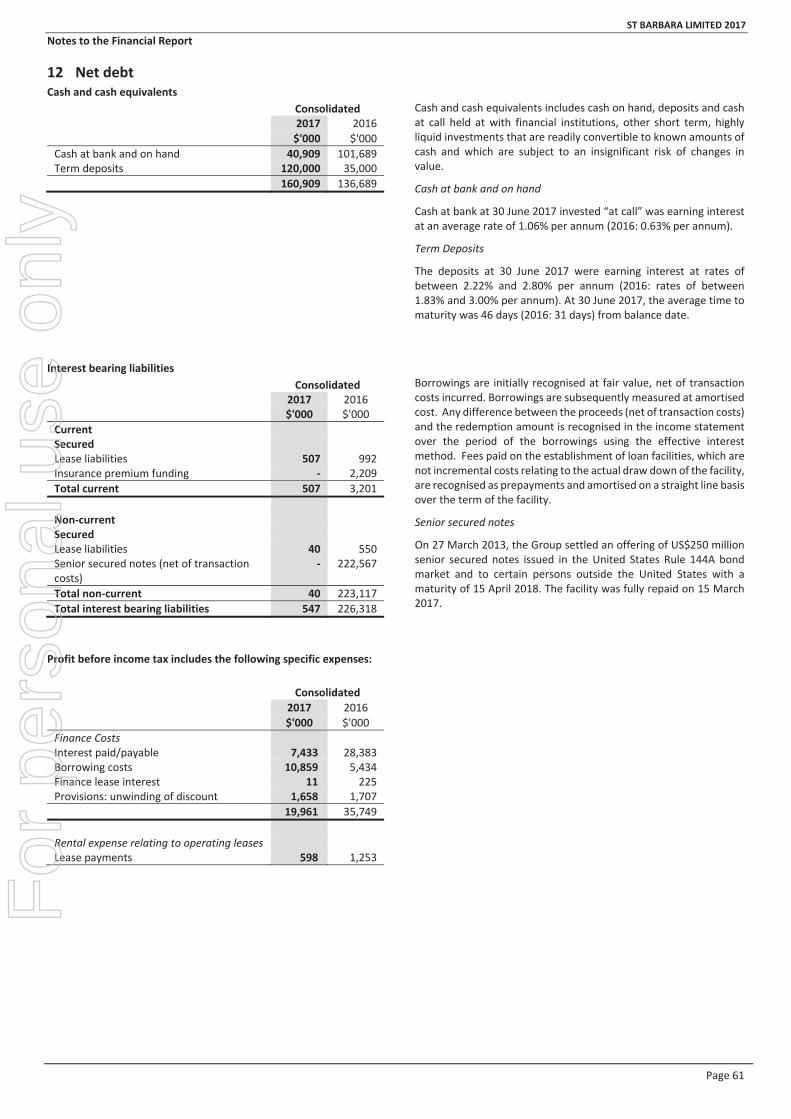
ST BARBARA LIMITED 2017Notes to the Financial Report
Page 61
12 Net debtCash and cash equivalents
Consolidated2017 2016$'000 $'000
Cash at bank and on hand 40,909 101,689Term deposits 120,000 35,000
160,909 136,689
Interest bearing liabilitiesConsolidated
2017 2016$'000 $'000
CurrentSecuredLease liabilities 507 992Insurance premium funding 2,209Total current 507 3,201
Non currentSecuredLease liabilities 40 550Senior secured notes (net of transactioncosts)
222,567
Total non current 40 223,117Total interest bearing liabilities 547 226,318
Profit before income tax includes the following specific expenses:
Consolidated2017 2016$'000 $'000
Finance CostsInterest paid/payable 7,433 28,383Borrowing costs 10,859 5,434Finance lease interest 11 225Provisions: unwinding of discount 1,658 1,707
19,961 35,749
Rental expense relating to operating leasesLease payments 598 1,253
Cash and cash equivalents includes cash on hand, deposits and cashat call held at with financial institutions, other short term, highlyliquid investments that are readily convertible to known amounts ofcash and which are subject to an insignificant risk of changes invalue.
Cash at bank and on hand
Cash at bank at 30 June 2017 invested “at call” was earning interestat an average rate of 1.06% per annum (2016: 0.63% per annum).
Term Deposits
The deposits at 30 June 2017 were earning interest at rates ofbetween 2.22% and 2.80% per annum (2016: rates of between1.83% and 3.00% per annum). At 30 June 2017, the average time tomaturity was 46 days (2016: 31 days) from balance date.
Borrowings are initially recognised at fair value, net of transactioncosts incurred. Borrowings are subsequently measured at amortisedcost. Any difference between the proceeds (net of transaction costs)and the redemption amount is recognised in the income statementover the period of the borrowings using the effective interestmethod. Fees paid on the establishment of loan facilities, which arenot incremental costs relating to the actual draw down of the facility,are recognised as prepayments and amortised on a straight line basisover the term of the facility.
Senior secured notes
On 27 March 2013, the Group settled an offering of US$250 millionsenior secured notes issued in the United States Rule 144A bondmarket and to certain persons outside the United States with amaturity of 15 April 2018. The facility was fully repaid on 15 March2017.
For
per
sona
l use
onl
y

ST BARBARA LIMITED 2017Notes to the Financial Report
Page 62
12 Net debt (continued)Leases
Leases of property, plant and equipment, where the Group hassubstantially all the risks and rewards of ownership, are classified asfinance leases. Finance leases are capitalised at inception of thelease at the lower of the fair value of the leased property and thepresent value of the minimum future lease payments. Thecorresponding rental obligations, net of finance charges, areincluded in interest bearing liabilities. Each lease payment isallocated between the liability and finance charges so as to achievea constant rate on the finance balance outstanding. The interestelement of the finance cost is charged to the income statement overthe lease period so as to produce a constant periodic rate of intereston the remaining balance of the liability for each period.
The property, plant and equipment acquired under finance leasesare depreciated over the asset’s useful life, or the lease term ifshorter where there is no reasonable certainty that the Group willobtain ownership by the end of the lease term.
Leases in which a significant portion of the risks and rewards ofownership are retained by the lessor are classified as operatingleases. Payments made under operating leases (net of anyincentives received from the lessor) are charged to the incomestatement on a straight line basis over the period of the lease.
Commitments for leases
The finance lease commitments displayed in the table below relateto vehicles and plant and equipment, are based on the cost of theassets and are payable over a period of up to 48 months at whichpoint ownership of the assets transfers to the Group.
Consolidated
Finance Lease Commitments2017$'000
2016$'000
Payable not later than one year 521 1,059Payable between one year andfive years
41 565
562 1,624Future finance charges (15) (82)Total lease liabilities 547 1,542
Current 507 992Non current 40 550
547 1,542Analysis of Non Cancellable OperatingLease Commitments
Payable not later than one year 405 396Payable between one year and fiveyears
846 899
1,251 1,295
Reconciliation of profit from ordinary activities after income taxto net cash flows from operating activities
Consolidated2017 2016$'000 $'000
Profit after tax for the year 157,572 169,388
Depreciation and amortisation 85,583 80,915
Asset impairments and write downs 27,273
Income tax expense 32,134 14,014
Unwinding of rehabilitation provision 1,658 1,707
Net finance costs amortised 2,842 5,289
Unrealised/realised foreign exchange gain 3,037 142
Equity settled share based payments 2,045 928
Change in operating assets and liabilities
Receivables and prepayments (1,436) (728)
Inventories (916) (5,892)
Other assets (1,145) (1,019)
Trade creditors and payables (3,288) (3,127)
Provisions and other liabilities (2,133) (18,829)
Net cash flows from operating activities 303,226 242,788
13 Contributed equity
DetailsNumber ofshares $'000
Opening balance 1 July 2016 495,102,525 887,216
Vested performance rights 2,228,570 38
Closing balance 30 June 2017 497,331,095 887,254
Contributed equity
Ordinary shares are classified as equity. Incremental costs directlyattributable to the issue of ordinary shares and performance rights arerecognised as a deduction from equity, net of any tax effects.
Ordinary shares
Ordinary shares entitle the holder to participate in dividends and theproceeds on winding up of the Company in proportion to the numberof and amounts paid on the shares held.
On a show of hands every holder of ordinary shares present at ameeting in person or by proxy, is entitled to one vote, and upon a polleach share is entitled to one vote.
For
per
sona
l use
onl
y

ST BARBARA LIMITED 2017Notes to the Financial Report
Page 63
D. Business portfolio
14 Parent entity disclosures
As at, and throughout, the financial year ended 30 June 2017, theparent company of the Group was St Barbara Limited.
Financial statements
Parent Entity2017 2016$'000 $'000
Results of the parent entity
Profit after tax for the year 134,430 65,702
Other comprehensive loss (147) (2,821)
Total comprehensive income for theyear
134,283 62,881
Other comprehensive income is set out in the ConsolidatedStatement of Comprehensive Income.
Parent Entity
2017 2016
Financial position of the parent entityat year end
$'000 $'000
Current assets 204,213 173,591
Total assets 423,046 442,357
Current liabilities 67,051 38,548
Total liabilities 122,803 276,582
Total equity of the parent entitycomprising:
Share capital 887,254 887,216
Reserves 2,987 2,840
Accumulated losses (589,998) (724,281)
Total equity 300,243 165,775
Transactions with entities in the wholly owned group
St Barbara Limited is the parent entity in the wholly owned groupcomprising the Company and its wholly owned subsidiaries. It is theGroup’s policy that transactions are at arm’s length.
During the year the Company charged management fees of$4,893,000 (2016: $4,717,000), operating lease rents of $375,000(2016: $969,000), and interest of $14,182,000 (2016: $25,889,000)to entities in the wholly owned group.
Net loans payable to the Company amount to a net receivable of$204,781,000 (2016: net receivable $242,446,000).
Balances and transactions between the Company and itssubsidiaries, which are related parties of the Company, have beeneliminated on consolidation.
15 Controlled entitiesThe consolidated financial statements incorporate the assets,liabilities and results of the following subsidiaries in accordancewith the accounting policy on consolidation.
All subsidiaries are 100% owned at 30 June 2017 and 30 June 2016and are incorporated in Australia unless otherwise stated.
Country ofIncorporation
Parent entity
St Barbara Limited Australia
Subsidiaries of St Barbara Limited
Allied Gold Mining Ltd UK
Subsidiaries of Allied Gold Mining Ltd
Allied Gold Pty Ltd(1) Australia
Subsidiaries of Allied Gold Pty Ltd
Advance R&D Pty Ltd Australia
AGL (ASG) Pty Ltd Australia
AGL (SGC) Pty Ltd Australia
Allied Gold Finance Pty Ltd Australia
Allied Gold Services Pty Ltd Australia
Allied Tabar Exploration Pty Ltd Australia
Aretrend Pty Ltd Australia
Nord Pacific Limited Canada
Subsidiaries of AGL (SGC) Pty Ltd
Subsidiaries of Allied Tabar Exploration Pty Ltd
Tabar Exploration Company Ltd PNG
Subsidiaries of Nord Pacific Limited
Nord Australex Nominees (PNG) Ltd PNG
Simberi Gold Company Limited PNG
(1) Converted from Allied Gold Ltd to Allied Gold Pty Ltd on 1 August 2014.
For
per
sona
l use
onl
y

ST BARBARA LIMITED 2017Notes to the Financial Report
Page 64
E. Remunerating our people
16 Employee benefit expenses and provisionsExpenses
Consolidated2017 2016$'000 $'000
Employee related expensesWages and salaries 69,875 62,396Contributions to defined contributionsuperannuation funds 5,288 4,904Equity settled share based payments 2,045 928
77,208 68,228
Directors and key management personnelConsolidated2017 2016$'000 $'000
Short term employee benefits 2,376 2,404Post employment benefits 39 39Leave 110 103Share based payments 781 512
3,306 3,058
ProvisionsConsolidated2017 2016$'000 $'000
CurrentEmployee benefits – annual leave 4,063 3,486Employee benefits – long service leave 3,014 2,392Other provisions 5,077 4,641
12,154 10,519
Non currentEmployee benefits long service leave 2,010 1,859Other provisions 2,202 2,802
4,212 4,661
Wages and salaries, and annual leave
Liabilities for wages and salaries, including non monetary benefitsand annual leave expected to be paid within 12 months of thereporting date, are recognised in other payables in respect ofemployees' services up to the reporting date and are measured atthe amounts expected to be paid, including expected on costs, whenthe liabilities are settled.
Retirement benefit obligations
Contributions to defined contribution funds are recognised as anexpense as they are due and become payable. Prepaid contributionsare recognised as an asset to the extent that a cash refund or areduction in future payments is available. The Group has noobligations in respect of defined benefit funds.
Executive incentives
Senior executives may be eligible for short term incentive payments(“STI”) subject to achievement of key performance indicators, asrecommended by the Remuneration Committee and approved bythe Board of Directors. The Group recognises a liability and anexpense for STIs in the reporting period during which the service isprovided by the employee.
Disclosures relating to Directors and key management personnel areincluded within the Remuneration Report, with the exception of thetable opposite.
Employee related and other provisions are recognised when theGroup has a present legal or constructive obligation as a result ofpast events, it is more likely than not that an outflow of resourceswill be required to settle the obligation, and the amount has beenreliably estimated.
Where there are a number of similar obligations, the likelihood thatan outflow will be required in settlement is determined byconsidering the class of obligations as a whole. A provision isrecognised even if the likelihood of an outflow with respect to anyone item included in the same class of obligations may be small.
Wages and salaries, and annual leave
Liabilities for wages and salaries, including non monetary benefitsand annual leave expected to be paid within 12 months of thereporting date, are recognised in other payables in respect ofemployees' services up to the reporting date and are measured atthe amounts expected to be paid, including expected on costs, whenthe liabilities are settled.
Long service leave
The liability for long service leave is recognised in the provision foremployee benefits and measured as the present value of expectedfuture payments to be made, plus expected on costs, in respect ofservices provided by employees up to the reporting date.Consideration is given to the expected future wage and salary levels,experience of employee departures and periods of service. Expectedfuture payments are discounted with reference to market yields oncorporate bonds with terms to maturity and currency that match, asclosely as possible, the estimated future cash outflows.
For
per
sona
l use
onl
y

ST BARBARA LIMITED 2017Notes to the Financial Report
Page 65
17 Share based payments
Employee Performance Rights
During the year ended 30 June 2017, there was no amount transferred as a gain for performance rights that expired during the year (2016: $Nil).Accounting standards preclude the reversal through the income statement for amounts, which have been booked in the share based paymentsreserve for performance rights and satisfy service conditions but do not vest due to market conditions.
Set out below are summaries of performance rights granted to employees under the St Barbara Limited Performance Rights Plan approved byshareholders:
Consolidated and parent entity 2017
Grant Date Expiry Date Issue price
Balance atstart of the
yearNumber
Grantedduring the
yearNumber
Vested duringthe yearNumber
Expiredduring the
yearNumber
Balance atend of the
yearNumber
Exercisableat end of the
yearNumber
5 Dec 2014 30 Jun 2017 $0.12 15,953,028 (15,953,028)10 Dec 2015 30 Jun 2018 $0.51 3,974,617 3,974,61721 Oct 2016 30 Jun 2019 $2.92 837,568 837,56812 Dec 2016 30 Jun 2019 $2.92 196,708 196,70831 Mar 2017 30 Jun 2019 $2.92 42,440 42,440Total 19,927,645 1,076,716 (15,953,028) 5,051,333
Consolidated and parent entity 201629 Nov 2013 30 Jun 2016 $0.49 2,908,469 (1,809,209) (1,099,260)5 Dec 2014 30 Jun 2017 $0.12 17,151,202 (419,361) (778,813) 15,953,02810 Dec 2015 30 Jun 2018 $0.51 3,974,617 3,974,617Total 20,059,671 3,974,617 (2,228,570) (1,878,073) 19,927,645
The weighted average remaining contractual life of performancerights outstanding at the end of the year was 1.2 years (2016: 1.3years). Conditions associated with rights granted during the yearended 30 June 2017 included:i. Rights are granted for no consideration. The vesting of rights
granted in FY2017 is subject to a continuing service conditionas at the vesting date, Return on Capital Employed over a threeyear period, and relative Total Shareholder Return over a threeyear period measured against a peer group.
ii. Performance rights do not have an exercise price.iii. Any performance right which does not vest will lapse.iv. Grant date varies with each issue.The fair value of rights issued was adjusted according to estimatesof the likelihood that the market conditions will be met. A MonteCarlo simulation was performed using data at grant date to assistmanagement in estimating the probability of the rights vesting.
As a result of the Monte Carlo simulation results, the assessed fairvalue of rights issued during the year was $2,846,000. This outcomewas based on the likelihood of the market condition being met as atthe date the rights vest.
Expenses arising from share based payment transactions
Total expenses arising from equity settled share based paymenttransactions recognised during the year as part of the employeebenefit expenses were as follows:
Consolidated2017
$2016
$Performance rights issued underperformance rights plan 2,045,000 928,000
Accounting judgements and estimatesThe Group measures the cost of equity settled transactions withemployees by reference to the fair value of the equity instrumentsat the date at which they are granted.
Where the vesting of share based payments contain marketconditions, in estimating the fair value of the equity instrumentsissued, the Group assesses the probability of the market conditionsbeing met, and therefore the probability of fair value vesting, byundertaking a Monte Carlo simulation. The simulation performssensitivity analysis on key assumptions in order to determinepotential compliance with the market performance conditions. Thesimulation specifically performs sensitivity analysis on share pricevolatility based on the historical volatility for St Barbara Limited andthe peer group companies. The results of the Monte Carlosimulation are not intended to represent actual results, but are usedas an estimation tool by management to assist in arriving at thejudgment of probability.F
or p
erso
nal u
se o
nly

ST BARBARA LIMITED 2017Notes to the Financial Report
Page 66
F. Other disclosures
18 Remuneration of auditors
During the year the following fees were paid or payable for servicesprovided by PricewaterhouseCoopers, the auditor of the parententity, and its related practices:
Consolidated2017 2016(1)
$ $Audit and review of financial reports 295,000 358,500
Non audit servicesTax advisory and assurance services(2) 211,196Tax advice in relation to AusIndustryreview(2)
337,772
Accounting advice and other assurancerelated services
95,000
Total remuneration for audit and nonaudit related services
843,968 453,500
(1) KPMG were the appointed auditors for the Group for the year ended 30 June 2016(2) $409,772 of the total tax advisory fees related to non recurring services
19 Events occurring after the balance sheet date
The Directors are not aware of any matter or circumstance that hasarisen since the end of the financial year that, in their opinion, hassignificantly affected or may significantly affect in future years theCompany’s or the Group’s operations, the results of thoseoperations or the state of affairs, except as described in this note:
Subsequent to year end, the directors have declared a fully frankedfinal dividend in relation to the 2017 financial year of 6 cents perordinary share, to be paid on 28 September 2017. A provision for thisdividend has not been recognised in the 30 June 2017 financialstatements.
20 Contingencies
During July 2014, the Company announced that by operation of itsinternal reporting mechanisms, the provision of benefits to a foreignpublic official that may violate its Anti Bribery and Anti CorruptionPolicy or applicable laws in Australia or in foreign jurisdictions wereidentified. The amount of the benefits provided to the foreign publicofficial was not material to the Company. The Company selfreported the matter to relevant authorities, including the AustralianFederal Police, and thematter is being assessed and investigated. Todate, there has been no action taken against the Company,consequently, the range of potential penalties, if any, cannot bereliably estimated. Should there be any prosecution, potentialpenalties are governed by laws in various jurisdictions includingCriminal Code 1995 (Cth) in Australia and/or the UK Bribery Act.
As a result of the Australian Taxation Office’s (ATO) program ofroutine and regular tax reviews and audits, the Group anticipatesthat ATO reviews and audits may occur in the future. The ultimateoutcome of any future reviews and audits cannot be determinedwith an acceptable degree of reliability at this time. Nevertheless,the Group believes it is making adequate provision for its taxliabilities, including amounts shown as deferred tax liabilities, andtakes reasonable steps to address potentially contentious issueswith the ATO.
21 Basis of preparationBasis of measurement
The consolidated financial statements have been prepared on thehistorical cost basis, except for the following material items:
Derivative financial instruments are measured at fair value; Share based payment arrangements are measured at fair value; Available for sale assets are measured at fair value; Rehabilitation provision is measured at net present value; Long service leave provision is measured at net present value.
Principles of consolidation Subsidiaries
The consolidated financial statements incorporate the assets andliabilities of all subsidiaries of St Barbara Limited as at 30 June 2017and the results of all subsidiaries for the year then ended.
Subsidiaries are all those entities (including special purpose entities)over which the Group has the power to govern the financial andoperating policies, and as a result has an exposure or rights tovariable returns, generally accompanying a shareholding of morethan one half of the voting rights. The existence and effect ofpotential voting rights that are currently exercisable or convertibleare considered when assessing whether the Group controls anotherentity. Subsidiaries are consolidated from the date on which controlcommences until the date control ceases.
Intercompany transactions, balances and unrealised gains ontransactions between Group companies are eliminated. Unrealisedlosses are also eliminated unless the transaction provides evidenceof the impairment of the asset transferred. Accounting policies ofsubsidiaries have been changed where necessary to ensureconsistency with the policies adopted by the Group.
Foreign currency translation
Both the functional and presentation currency of St Barbara Limitedand its Australian controlled entities are Australian dollars (AUD).The functional currency of the Group’s foreign operations is USdollars (USD).
Foreign currency transactions are translated into the functionalcurrency using the exchange rates prevailing at the dates of thetransactions. Foreign exchange gains and losses resulting from thesettlement of such transactions, and from the translation at year endexchange rates of monetary assets and liabilities denominated inforeign currencies, are recognised in the income statement, exceptwhen deferred in equity as qualifying cash flow hedges andqualifying net investment hedges.
Translation differences on non monetary financial assets andliabilities are reported as part of the fair value gain or loss.Translation differences on non monetary financial assets andliabilities, such as equities held at fair value through profit or loss,are recognised in the income statement as part of the fair value gainor loss. Translation differences on non monetary financial assets,such as equities classified as available for sale financial assets, areincluded in the fair value reserve in equity.
The assets and liabilities of controlled entities incorporated overseaswith functional currencies other than Australian dollars aretranslated into the presentation currency of St Barbara Limited(Australian dollars) at the year end exchange rate and the revenueand expenses are translated at the rates applicable at thetransaction date. Exchange differences arising on translation aretaken directly to the foreign currency translation reserve in equity.
For
per
sona
l use
onl
y

ST BARBARA LIMITED 2017Notes to the Financial Report
Page 67
21 Basis of preparation (continued)Critical accounting judgement and estimates
The preparation of financial statements in conformity with AASB andIFRS requires management to make judgements, estimates andassumptions that affect the application of accounting policies andthe reported amount of assets, liabilities, income and expenses.Actual results may differ from these estimates. The estimates andunderlying assumptions are reviewed on an ongoing basis. Revisionsto accounting estimates are recognised in the period in which theestimate is revised and in any future periods affected.
22 Accounting standards
New Standards adopted
The accounting policies applied by the Group in this 30 June 2017 consolidated financial report are the same as those applied by the Group in itsconsolidated financial report as at and for the year ended 30 June 2016. These accounting policies are consistent with Australian AccountingStandards.
Accounting policies are applied consistently by each entity in the Group.
New accounting standards not yet adopted
ReferenceApplication ofStandard
AASB 9 Financial Instruments (December 2014) and AASB 2009 11 Amendments to Australian Accounting Standardsarising from AASB 9
1 January 2018
AASB 16 Leases 1 January 2019AASB 15 Revenue from Contracts with Customers which supersedes AASB 111 Construction contracts, AASB 118 Revenue,interpretation 12 Customer loyalty programmes, Interpretation 15 Agreements for the construction of Real Estate,Interpretation 18 Transfer of Assets from Customers, interpretation 131 Revenue Barter transactions involving Advertisingservices and Interpretation 1042 Subscriber Acquisition Costs in the Telecommunications Industry.
1 January 2018
AASB 2014 10 (2015 101) Amendments to Australian Accounting Standards Sale or Contribution of Assets between anInvestor and its Associate or Joint Venture.
1 January 2018
AASB 2016 1 Amendments to Australian Accounting Standards –Recognition of Deferred Tax Asset for Unrealised Losses. 1 January 2017AASB 2016 2 Amendments to Australian Accounting Standards – Disclosure Initiative: Amendments to AASB 107 1 January 2017
After a review of the above accounting standards the company has assessed that there is unlikely to be a material impact on the recognition,measurement and disclosure of the financial report.
For
per
sona
l use
onl
y

ST BARBARA LIMITED 2017Financial Report
Page 68
Directors’ declaration
1 In the opinion of the directors of St Barbara Limited (the Company):
(a) the consolidated financial statements and notes that are contained in pages 38 to 67 and the remuneration report in theDirectors’ report, set out on pages 15 to 34, are in accordance with the Corporations Act 2001, including:
(i) giving a true and fair view of the Group’s financial position as at 30 June 2017 and of its performance for the financialyear ended on that date; and
(ii) complying with Australian Accounting Standards and the Corporations Regulations 2001; and
(b) there are reasonable grounds to believe that the Company will be able to pay its debts as and when they become due andpayable.
2 The directors have been given the declarations required by Section 295A of the Corporations Act 2001 from the chief executive officerand chief financial officer for the financial year ended 30 June 2017.
3 The directors draw attention to page 38 of the financial statements, which includes a statement of compliance with InternationalFinancial Reporting Standards.
Signed in accordance with a resolution of the Directors:
Bob Vassie
Managing Director and CEO
Melbourne23 August 2017
For
per
sona
l use
onl
y

ST BARBARA LIMITED 2017Financial Report
Page 69
Independent auditor’s report
Independent auditor’s report page 1
For
per
sona
l use
onl
y

ST BARBARA LIMITED 2017Financial Report
Page 70
Independent auditor’s report page 2
For
per
sona
l use
onl
y

ST BARBARA LIMITED 2017Financial Report
Page 71
Independent auditor’s report page 3
For
per
sona
l use
onl
y
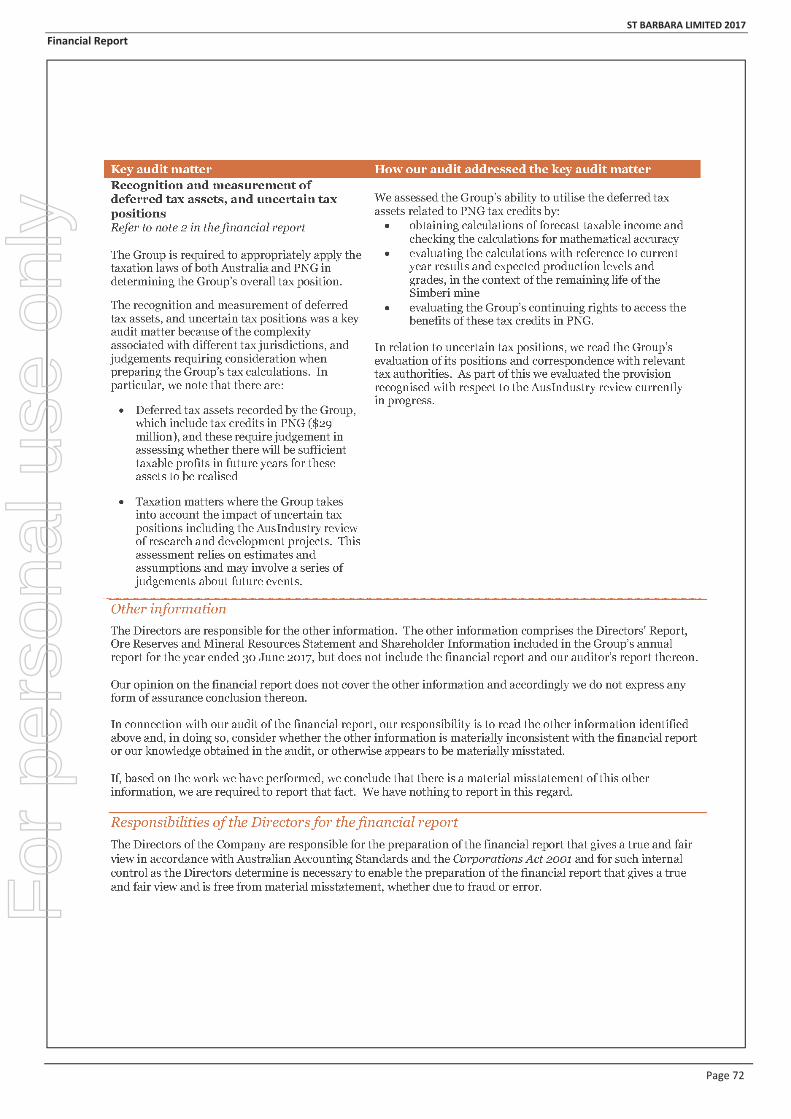
ST BARBARA LIMITED 2017Financial Report
Page 72
Independent auditor’s report page 4
For
per
sona
l use
onl
y

ST BARBARA LIMITED 2017Financial Report
Page 73
Independent auditor’s report page 5
For
per
sona
l use
onl
y

ST BARBARA LIMITED 2017
Page 74
Ore Reserves and Mineral Resources Statement as at 30 June 2017
Overview
Successful drilling program extended Gwalia Ore Reserves to 2,140 metres below surface (mbs) and Mineral Resources to 2,200 mbs
Additional reserves at Simberi offset depletion allowing mine life to extend a further year
Group Ore Reserves increased from 4.01 Moz of contained gold to 4.31 Moz, net after depletion
Company Summary at 30 June 2017
Total Ore Reserves are estimated at: 34.6 Mt @ 3.9 g/t Au for 4.31 Moz of contained gold, comprising:
Leonora Operations: 11.1 Mt @ 6.8 g/t Au for 2.44 Moz of contained gold
Simberi Operations: 23.4 Mt @ 2.5 g/t Au for 1.90 Moz of contained gold
Total Mineral Resources1 are estimated at: 104.6 Mt @ 2.9 g/t Au for 9.63 Moz of contained gold, comprising:
Leonora Operations: 28.8 Mt @ 6.2 g/t Au for 5.71 Moz of contained gold
Simberi Operations: 75.8 Mt @ 1.6 g/t Au for 3.92 Moz of contained gold
The 30 June 2017 Ore Reserves and Mineral Resources Statements released to the ASX on 23 August 2017 follow.
1 Mineral Resources are reported inclusive of Ore Reserves
For
per
sona
l use
onl
y

ST BARBARA LIMITED 2017Ore Reserves and Mineral Resources Statement as at 30 June 2017
Page 75
St Barbara's Mineral Resources and Ore Reserves position as at 30 June 2017 is summarised and compared with the 2016 statement in Table 1.
Table 1: St Barbara 2016 and 2017 Ore Reserves and Mineral Resources Summary
Project2016 Ore Reserves 2017 Production 2017 Ore Reserves
Tonnes (‘000)Grade(g/t) Ounces (‘000) Ounces (‘000) Tonnes (‘000)
Grade(g/t) Ounces (‘000)
Gwalia (WA) 6,795 8.3 1,808 265 8,556 7.8 2,133
Tower Hill (WA) 2,572 3.7 306 2,572 3.7 306
Total Leonora 9,367 7.0 2,114 265 11,128 6.8 2,439
Simberi (Oxide) 14,094 1.3 576 116 10,907 1.3 472
Simberi (Sulphide) 13,556 3.0 1,321 12,537 3.5 1,402
Total Simberi 27,650 2.1 1,897 116 23,444 2.5 1,873
Grand Total 37,017 3.4 4,011 381 34,572 3.9 4,312
2016 Mineral Resources 2017 Mineral Resources
Tonnes (‘000)Grade(g/t) Ounces (‘000)
Tonnes(‘000)
Grade(g/t) Ounces (‘000)
Gwalia (WA) 17,294 7.0 3,896 23,753 6.7 5,087
Tower Hill (WA) 5,093 3.8 625 5,093 3.8 625
Total Leonora 22,387 6.3 4,521 28,846 6.2 5,712
Simberi (Oxide) 29,428 1.0 951 21,288 1.1 744
Simberi (Sulphide) 67,850 1.7 3,607 54,517 1.8 3,179
Total Simberi 97,278 1.5 4,558 75,805 1.6 3,923
Grand Total 119,665 2.4 9,079 104,651 2.9 9,635Data is rounded to thousands of tonnes and thousands of ounces. Discrepancies in totals may occur due to rounding.
The Company’s Ore Reserves and Mineral Resources have increased above net depletion primarily as a consequence of resource extensiondrilling at Gwalia (Figures 2 & 3). Extension drilling is continuing and the additional reserves will be included in an updated Life of Mine plan thatis anticipated to increase mine life past 2024. The outcome of this planning work will be available in FY18 Q2. At Simberi, Ore Reserves havereduced marginally after mining depletion, however, a reduction in operating costs benefitted reserve estimation for this cycle. The additionaloxide reserves allow Simberi’s oxide operation to extend a further year. A review of the Simberi geology model has resulted in an overallreduction of Mineral Resources for this operation, but this has largely impacted Inferred sulphide resources.
For
per
sona
l use
onl
y
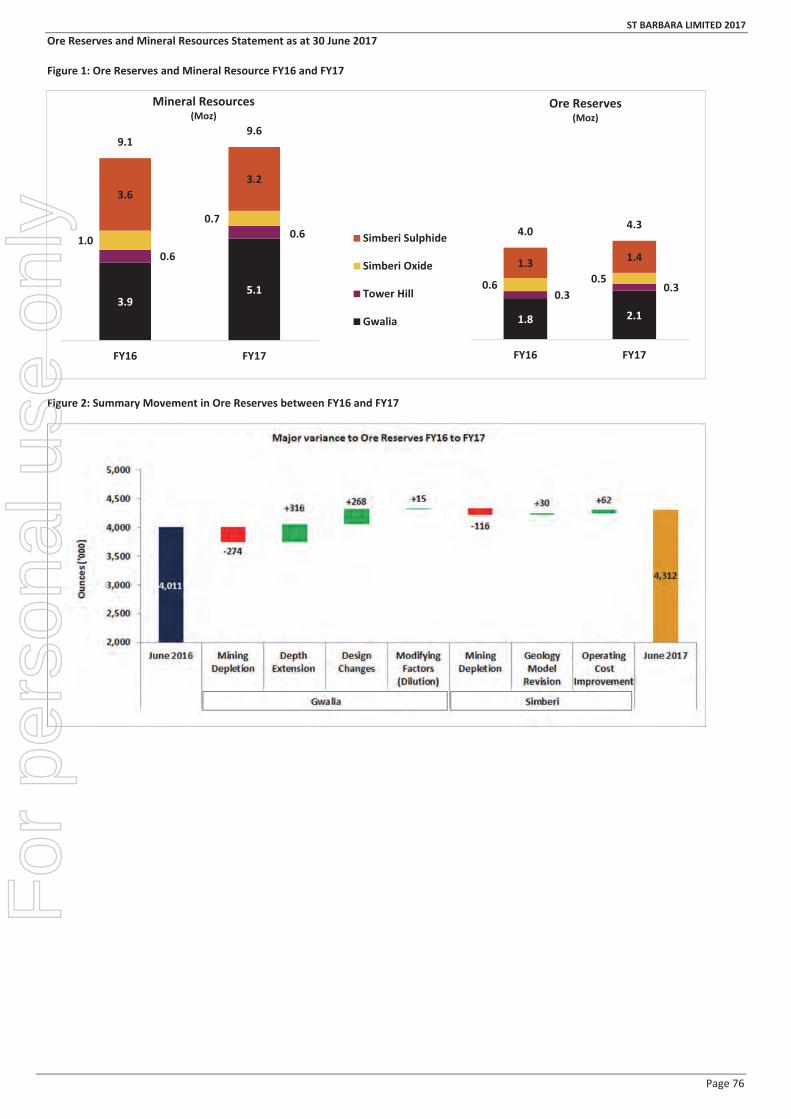
ST BARBARA LIMITED 2017Ore Reserves and Mineral Resources Statement as at 30 June 2017
Page 76
Figure 1: Ore Reserves and Mineral Resource FY16 and FY17
Figure 2: Summary Movement in Ore Reserves between FY16 and FY17
3.95.1
0.6
0.61.0
0.7
3.63.2
9.19.6
FY16 FY17
Mineral Resources(Moz)
Simberi Sulphide
Simberi Oxide
Tower Hill
Gwalia
total
1.8 2.1
0.3 0.30.6 0.51.3 1.4
4.0 4.3
FY16 FY17
Ore Reserves(Moz)
For
per
sona
l use
onl
y

ST BARBARA LIMITED 2017Ore Reserves and Mineral Resources Statement as at 30 June 2017
Page 77
Figure 3: Summary Movement in Mineral Resources between FY16 and FY17
Mineral Resources Revisions
Gwalia (+1,191,000 ounces)
The Gwalia Mineral Resource has been updated following the completion of a surface drilling program targeting extensions to all lodes down to2,200 mbs and underground grade control and resource definition drilling targeting mineralisation between 1,420 mbs and 1,800 mbs. Theprevious Measured, Indicated and Inferred Mineral Resource Estimate reported at 30 June 2016 was 17,294 kt @ 7.0 g/t Au containing 3,896 kozof gold. This has increased by 1,191 koz of gold to 23,753 kt @ 6.7 g/t Au containing 5,087 koz of gold; the increase before depletion andsterilisation was 1,467 koz. Variances between the two estimates are primarily due to:
Resource extensions down to 2,200 mbs due to surface drilling and changes to local geological models as a result of undergrounddrilling; and
Depletion through mining and sterilisation of non recoverable resources.
Simberi Oxide ( 207,000 ounces)
A revisedMineral Resource estimate was completed for Simberi Oxide using improved geological models that incorporated grade control drillingand mapping data. The previous publicly reported Measured, Indicated and Inferred Oxide Mineral Resource Estimate reported at 30 June 2016was 29,428 kt @ 1.0 g/t Au containing 951 koz of gold. This has decreased by 207 koz of gold to 21,288 kt @ 1.1 g/t Au containing 744 koz ofgold. Variances between the two estimates are primarily due to depletion through mining and changes to geological models.
Simberi Sulphide ( 428,000 ounces)
The Simberi Sulphide Mineral Resource estimate was updated with revised geological models. The previous Measured, Indicated and InferredSulphide Mineral Resource Estimate reported at 30 June 2016 was 67,850 kt @ 1.7 g/t Au containing 3,607 koz of gold. This has decreased by428 koz of gold to 54,517 kt@ 1.8 g/t Au containing 3,179 koz of gold. The changes to geological models have primarily impacted InferredMineralResources.
For
per
sona
l use
onl
y

ST BARBARA LIMITED 2017Ore Reserves and Mineral Resources Statement as at 30 June 2017
Page 78
Ore Reserve Revisions
Gwalia (+325,000 ounces)
The previous Proved and Probable Ore Reserve Estimate reported at 30 June 2016 was 6,795 kt @ 8.3 g/t Au containing 1,808 koz of gold. Thishas increased by a net 325 koz of gold to 8,556 kt @ 7.8 g/t Au containing 2,133 koz of gold. Variances between the two estimates are due to:
Depletion through mining (274 koz); Reserve extensions down to 2,140 mbs as a result of surface drilling (316 koz of reserves), and Geology and design changes primarily
driven by additional drill hole data which increased the existing Mineral Resources between 1,660 mbs and 1,940 mbs (+268 koz inreserves); and
15 koz modifying factors (dilution).Gwalia Reserve grade has decreased from 8.3 g/t Au at 30 June 2016 to 7.8 g/t Au at 30 June 2017, due to FY17 mined grade averaging 10.3 g/tAu, and reserves added from depth extension below 1,940 mbs averaging less than the 30 June 2016 Reserve grade.
Figure 4: Gwalia Ore Reserve grade variance between FY16 and FY17
Data is rounded to the nearest 0.1 g/t Au. Discrepancies in totals may occur due to rounding.
Simberi (oxide and sulphide combined: 24,000 ounces)
The previous Proved and Probable Ore Reserve Estimate reported at 30 June 2016 was 27,650 kt @ 2.1 g/t Au containing 1,897 koz of gold. Thishas reduced by 24 koz of gold to 23,444 kt @ 2.49 g/t Au containing 1,873 koz of gold. Variances between the two estimates are primarily dueto:
Depletion through mining; Changes in the resource model; and Reduced operating costs as mill throughput and mine output has increased.
For
per
sona
l use
onl
y
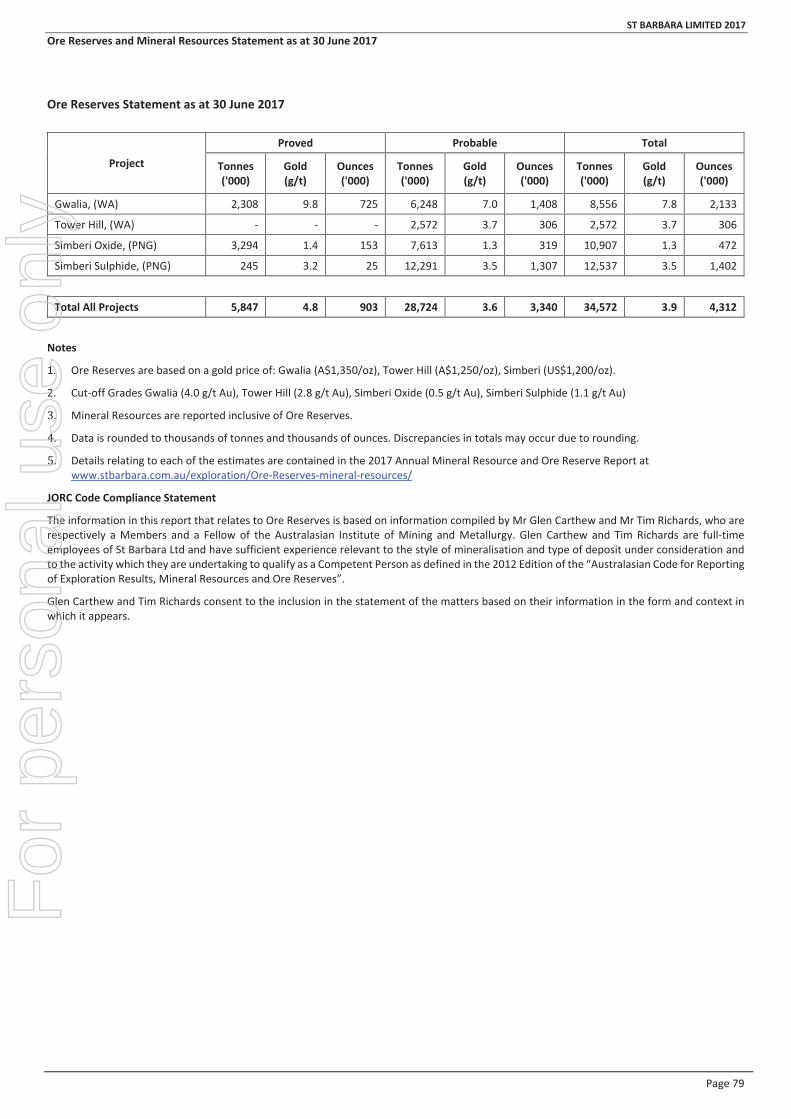
ST BARBARA LIMITED 2017Ore Reserves and Mineral Resources Statement as at 30 June 2017
Page 79
Ore Reserves Statement as at 30 June 2017
Notes
1. Ore Reserves are based on a gold price of: Gwalia (A$1,350/oz), Tower Hill (A$1,250/oz), Simberi (US$1,200/oz).
2. Cut off Grades Gwalia (4.0 g/t Au), Tower Hill (2.8 g/t Au), Simberi Oxide (0.5 g/t Au), Simberi Sulphide (1.1 g/t Au)
Mineral Resources are reported inclusive of Ore Reserves.
Data is rounded to thousands of tonnes and thousands of ounces. Discrepancies in totals may occur due to rounding.
Details relating to each of the estimates are contained in the 2017 Annual Mineral Resource and Ore Reserve Report atwww.stbarbara.com.au/exploration/Ore Reserves mineral resources/
JORC Code Compliance Statement
The information in this report that relates to Ore Reserves is based on information compiled by Mr Glen Carthew and Mr Tim Richards, who arerespectively a Members and a Fellow of the Australasian Institute of Mining and Metallurgy. Glen Carthew and Tim Richards are full timeemployees of St Barbara Ltd and have sufficient experience relevant to the style of mineralisation and type of deposit under consideration andto the activity which they are undertaking to qualify as a Competent Person as defined in the 2012 Edition of the “Australasian Code for Reportingof Exploration Results, Mineral Resources and Ore Reserves”.
Glen Carthew and Tim Richards consent to the inclusion in the statement of the matters based on their information in the form and context inwhich it appears.
Project
Proved Probable Total
Tonnes('000)
Gold(g/t)
Ounces('000)
Tonnes('000)
Gold(g/t)
Ounces('000)
Tonnes('000)
Gold(g/t)
Ounces('000)
Gwalia, (WA) 2,308 9.8 725 6,248 7.0 1,408 8,556 7.8 2,133
Tower Hill, (WA) 2,572 3.7 306 2,572 3.7 306
Simberi Oxide, (PNG) 3,294 1.4 153 7,613 1.3 319 10,907 1.3 472
Simberi Sulphide, (PNG) 245 3.2 25 12,291 3.5 1,307 12,537 3.5 1,402
Total All Projects 5,847 4.8 903 28,724 3.6 3,340 34,572 3.9 4,312
For
per
sona
l use
onl
y
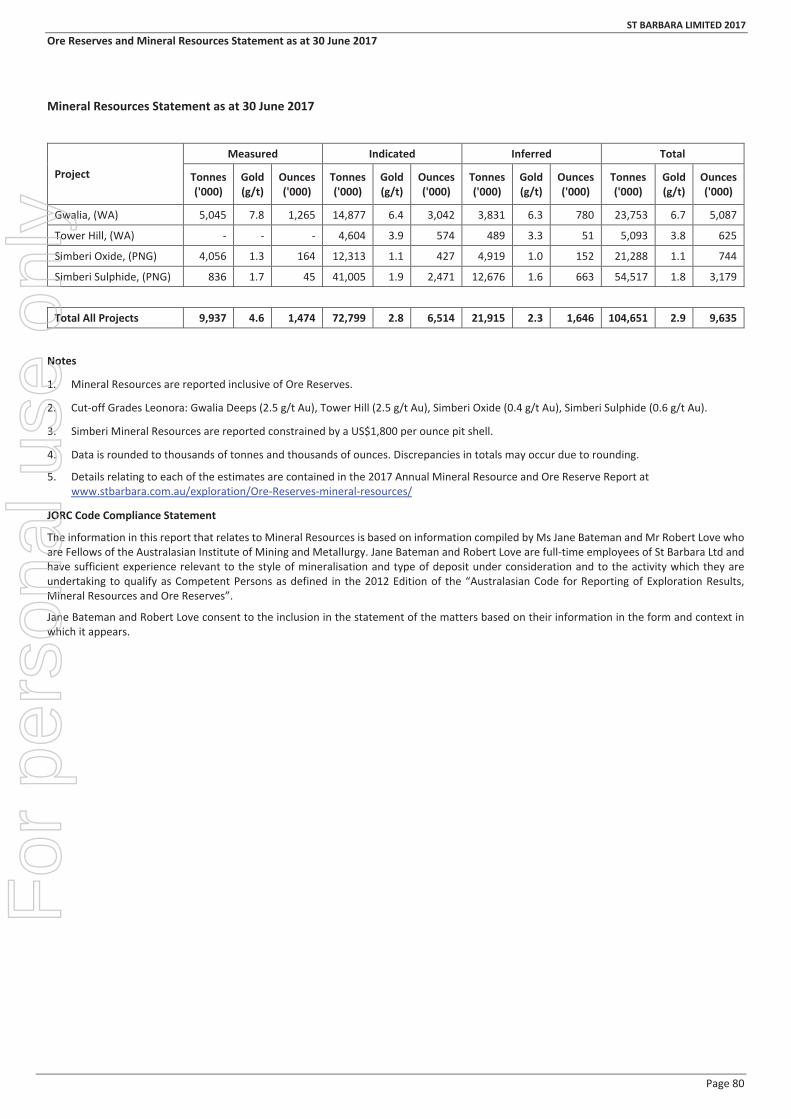
ST BARBARA LIMITED 2017Ore Reserves and Mineral Resources Statement as at 30 June 2017
Page 80
Mineral Resources Statement as at 30 June 2017
Notes
1. Mineral Resources are reported inclusive of Ore Reserves.
2. Cut off Grades Leonora: Gwalia Deeps (2.5 g/t Au), Tower Hill (2.5 g/t Au), Simberi Oxide (0.4 g/t Au), Simberi Sulphide (0.6 g/t Au).
3. Simberi Mineral Resources are reported constrained by a US$1,800 per ounce pit shell.
4. Data is rounded to thousands of tonnes and thousands of ounces. Discrepancies in totals may occur due to rounding.
5. Details relating to each of the estimates are contained in the 2017 Annual Mineral Resource and Ore Reserve Report atwww.stbarbara.com.au/exploration/Ore Reserves mineral resources/
JORC Code Compliance Statement
The information in this report that relates to Mineral Resources is based on information compiled by Ms Jane Bateman and Mr Robert Love whoare Fellows of the Australasian Institute of Mining and Metallurgy. Jane Bateman and Robert Love are full time employees of St Barbara Ltd andhave sufficient experience relevant to the style of mineralisation and type of deposit under consideration and to the activity which they areundertaking to qualify as Competent Persons as defined in the 2012 Edition of the “Australasian Code for Reporting of Exploration Results,Mineral Resources and Ore Reserves”.
Jane Bateman and Robert Love consent to the inclusion in the statement of the matters based on their information in the form and context inwhich it appears.
Project
Measured Indicated Inferred Total
Tonnes('000)
Gold(g/t)
Ounces('000)
Tonnes('000)
Gold(g/t)
Ounces('000)
Tonnes('000)
Gold(g/t)
Ounces('000)
Tonnes('000)
Gold(g/t)
Ounces('000)
Gwalia, (WA) 5,045 7.8 1,265 14,877 6.4 3,042 3,831 6.3 780 23,753 6.7 5,087
Tower Hill, (WA) 4,604 3.9 574 489 3.3 51 5,093 3.8 625
Simberi Oxide, (PNG) 4,056 1.3 164 12,313 1.1 427 4,919 1.0 152 21,288 1.1 744
Simberi Sulphide, (PNG) 836 1.7 45 41,005 1.9 2,471 12,676 1.6 663 54,517 1.8 3,179
Total All Projects 9,937 4.6 1,474 72,799 2.8 6,514 21,915 2.3 1,646 104,651 2.9 9,635
For
per
sona
l use
onl
y

ST BARBARA LIMITED 2017Shareholder Information
Page 81
Twenty Largest Shareholders
Ordinary fully paid shares as at 30 September 2017
Rank Name Shares% of Issued
Capital
1. HSBC CUSTODY NOMINEES (AUSTRALIA) LIMITED 236,063,045 45.80
2. J P MORGAN NOMINEES AUSTRALIA LIMITED 86,157,657 16.72
3. CITICORP NOMINEES PTY LIMITED 58,449,854 11.34
4. NATIONAL NOMINEES LIMITED 18,628,165 3.61
5. BNP PARIBAS NOMINEES PTY LTD <AGENCY LENDING COLLATERAL> 7,604,000 1.48
6. BNP PARIBAS NOMINEES PTY LTD <AGENCY LENDING DRP A/C> 7,412,841 1.44
7. HSBC CUSTODY NOMINEES (AUSTRALIA) LIMITED <NT COMNWLTH SUPER CORP A/C> 4,243,231 0.82
8. BNP PARIBAS NOMS PTY LTD <DRP> 4,154,185 0.81
9. NATIONAL NOMINEES LIMITED <N A/C> 3,500,000 0.68
10. AMP LIFE LIMITED 2,965,359 0.58
11. SANDHURST TRUSTEES LTD <JMFG CONSOL A/C> 2,677,087 0.52
12. SBN NOMINEES PTY LIMITED <10004 ACCOUNT> 2,621,000 0.51
13. NATIONAL NOMINEES LIMITED <DB A/C> 2,546,675 0.49
14. BRISPOT NOMINEES PTY LTD <HOUSE HEAD NOMINEE A/C> 2,473,731 0.48
15. CITICORP NOMINEES PTY LIMITED <COLONIAL FIRST STATE INV A/C> 1,497,848 0.29
16. NORTHCLIFFE HOLDINGS PTY LTD <NORTHCLIFFE HOLDINGS A/C> 1,450,000 0.28
17. UBS NOMINEES PTY LTD 1,314,841 0.26
18. CPU SHARE PLANS PTY LTD <SBM PRV CONTROL A/C> 1,106,250 0.21
19. CS THIRD NOMINEES PTY LIMITED <HSBC CUST NOM AU LTD 13 A/C> 942,864 0.18
20. MERRILL LYNCH (AUSTRALIA) NOMINEES PTY LIMITED 937,500 0.18
Total top 20 holders of ordinary fully paid shares 446,746,133 86.67
Total remaining holders 68,681,059 13.33
Total 515,427,192 100.00
For
per
sona
l use
onl
y

ST BARBARA LIMITED 2017Shareholder Information
Page 82
Distribution of Shareholdings
Ordinary fully paid shares as at 30 September 2017
Range Total Holders Shares% of Issued
Capital
1 – 1,000 4,108 1,725,931 0.33
1,001 – 5,000 3,692 9,158,753 1.78
5,001 – 10,000 931 6,981,616 1.35
10,001 – 100,000 966 27,355,582 5.31
100,001 and over 117 470,205,310 91.23
Total 9,814 515,427,192 100.00
Unmarketable Parcels
Ordinary fully paid shares as at 30 September 2017
Total Holders SharesMinimumParcel Size
Minimum $500.00 parcel at $2.63 per unit 1,196 73,936 191
Substantial Shareholders
Ordinary fully paid shares as at 30 September 2017
Name Shares % of IssuedCapital
Van Eck Associates Corporation 48,006,771 9.7%
M&G Investment Management Ltd 36,543,018 7.3%
Norges Bank 30,336,043 5.9%
Vinva Investment Management 25,862,522 5.2%
For
per
sona
l use
onl
y

This page is intentionally blank
For
per
sona
l use
onl
y

This page is intentionally blank
For
per
sona
l use
onl
y

This page is intentionally blank
For
per
sona
l use
onl
y

BOARD OF DIRECTORST C Netscher Non Executive ChairmanR S Vassie Managing Director & CEOK J Gleeson Non Executive DirectorD E J Moroney Non Executive Director
COMPANY SECRETARYR R Cole
SHARE REGISTRYComputershare Investment Services Pty LtdGPO Box 2975 Melbourne Victoria 3001 AustraliaTelephone (within Australia): 1300 653 935Telephone (international): +61 3 9415 4356Facsimile: +61 3 9473 2500www.investorcentre.com/au
AUDITORPricewaterhouseCoopers2 Riverside QuaySouthbank Victoria 3006 Australia
STOCK EXCHANGE LISTINGShares in St Barbara Limited are quoted on theAustralian Securities Exchange (ASX), Ticker Symbol: SBM
REGISTERED OFFICELevel 10, 432 St Kilda RoadMelbourne Victoria 3004 AustraliaTelephone: +61 3 8660 1900Facsimile: +61 3 8660 1999Email: [email protected]
ABN 36 009 165 066
For
per
sona
l use
onl
y

ABN 36 009 165 066
Notice of 2017 Annual General Meeting
Notice of 2017 Annual General Meeting of St Barbara Limited Notice is given that the 2017 Annual General Meeting of St Barbara Limited will be held:
Date: 29 November 2017
Time: 11:00 am (Melbourne time)
Venue: Royce Conference Room
Royce Hotel
379 St Kilda Road
Melbourne Victoria 3004
Items of Business 1. Annual Reports
To receive and consider the Annual Financial Report of the Company and the reports of the Directors and Auditor for the year ended 30 June 2017.
2. Resolution 1: Adoption of Remuneration Report
To consider and, if thought fit, pass the following as an ordinary resolution:
“That the Remuneration Report for the year ended 30 June 2017 as set out on pages 15 to 34 (inclusive) of the Annual Report be adopted.”
Note – the vote on this resolution is advisory only and does not bind the Directors or the Company.
3. Resolution 2: Re‐election of Director – Mr Tim Netscher
To consider and, if thought fit, pass the following as an ordinary resolution:
“That Mr Tim Netscher, being a Director of the Company who retires pursuant to article 3.6 of the Company’s Constitution, and being eligible, be re‐elected as a Director of the Company.”
4. Resolution 3: Approval of issue of performance rights to Mr Robert (Bob) Vassie, Managing Director and Chief Executive Officer
To consider and, if thought fit, pass the following as an ordinary resolution:
“That, for the purposes of ASX Listing Rule 10.14, sections 200B and 200E of the Corporations Act and for all other purposes, approval be given to issue to Mr Bob Vassie 218,748 performance rights to acquire fully paid ordinary shares in the capital of the Company, on the terms and conditions set out and to provide Mr Vassie the benefits described, in the Explanatory Memorandum accompanying the Notice convening this Annual General Meeting, in part consideration of his employment as Managing Director and Chief Executive Officer of the Company in respect of the current 2018 financial year."
By Order of the Board Rowan Cole Company Secretary 20 October 2017
For
per
sona
l use
onl
y

page 2
Eligibility to attend and vote at the Meeting The Board has determined that the Shareholders entitled to attend and vote at the Meeting are those persons who are the registered holders of Shares on 27 November 2017 at 7:00 pm (Melbourne time).
Voting in Person or by Proxy If you are a shareholder entitled to attend the meeting and vote, you have the right to appoint a proxy to attend and vote on your behalf. A proxy need not be a Shareholder and can be either an individual or a body corporate. If you appoint a body corporate as a proxy, that body corporate will need to ensure that it:
appoints an individual as its corporate representative to exercise its powers at the meeting, in accordance with section 250D of the Corporations Act; and
provides satisfactory evidence of the appointment of its corporate representative prior to commencement of the meeting.
If such evidence is not received before the meeting, then the body corporate (through its representative) will not be permitted to act as a proxy. If you are entitled to cast 2 or more votes, you may appoint 2 proxies and may specify the proportion or number of votes each proxy is appointed to exercise. If no proportion or number is specified, each proxy will exercise half of your votes. A Proxy Form accompanies this Notice of Annual General Meeting. For an appointment of a proxy to be effective for the Meeting, the proxy's appointment, and any authority under which the Proxy Form is signed or otherwise authenticated, must be received by St Barbara’s share registry by no later than 11:00 am on 27 November 2017 (Melbourne time). Proxy Forms received after this time will not be effective for the scheduled commencement of the Annual General Meeting. Proxy appointments and relevant authorities may be delivered to St Barbara's share registrar by one of the following methods:
Mail to: Computershare Investor Services Pty Limited, GPO Box 242, Melbourne, Victoria, 3001
Fax to: 1800 783 447 (within Australia), +61 3 9473 2555 (outside Australia)
Online: login at www.investorvote.com.au using the Control Number found on the front of your accompanying proxy form and follow the instructions. Alternatively, with your mobile device scan the QR code located on the front of the proxy form and follow the instructions. You will be taken to have signed your Proxy Form if you lodge it in accordance with the instructions given on the website.
For details on how to complete and lodge the Proxy Form, please refer to the instructions on the Proxy Form. For intermediary online subscribers only (custodians) please visit www.intermediaryonline.com.
Questions If you have any questions about any matter contained in this Meeting Documentation, please contact Mr Rowan Cole, Company Secretary, at [email protected] or on +61 3 8660 1900.
Webcast A live audio webcast of the Annual General Meeting will be available on St Barbara’s website at www.stbarbara.com.au/investors/webcast/. The audio webcast is ‘listen only’ and does not enable questions. The audio webcast will also be available on the website after the conclusion of the meeting. Voting recommendations of the Board If you wish to appoint a proxy on the enclosed Proxy Form to vote on your behalf in the manner consistent with the voting recommendations of the Board, mark the “FOR” box for Resolutions 1 to 3 as set out in the example below. The background and reasons for these recommendations are set out in the enclosed Explanatory Memorandum.
The Board recommends that Shareholders vote FOR Resolutions 1 to 3
F
or p
erso
nal u
se o
nly

page 3
Voting Exclusion Statement Resolution 1: Adoption of the Remuneration Report The Remuneration Report identifies the Company's Key Management Personnel for the financial year to 30 June 2017. Under the Corporations Act, Key Management Personnel (including Directors) of the Company, details of whose remuneration are included in the Remuneration Report, and their closely related parties (as defined in the Corporations Act), (each a Restricted Person), are prohibited from voting on Resolution 1 in any capacity (e.g.: as a Shareholder, proxy, attorney or corporate representative). However, the prohibition does not apply if:
the Restricted Person is appointed as a proxy for a Shareholder entitled to vote and the proxy appointment specifies the way the Restricted Person is to vote on the resolution; or
the chair of the Meeting (Chairman) has been appointed as a proxy for a Shareholder entitled to vote and the proxy appointment: o does not specify the way the Chairman is to vote on
the resolution; and o expressly authorises the Chairman to exercise the
proxy (notwithstanding that Resolution 1 is connected directly or indirectly with the remuneration of Key Management Personnel).
The Chairman intends to vote undirected proxies (where the Chairman has been appropriately authorised) in favour of Resolution 1. Other Directors and other Key Management Personnel of the Company and their closely related parties must not cast any votes in respect of Resolution 1 that arise from any undirected proxy that they hold. Resolution 3: Approval of issue of performance rights to Mr Bob Vassie In accordance with the ASX Listing Rules (and having regard to the voting restrictions in section 200E(2A) of the Corporations Act as it applies to Resolution 3), the Company will disregard any votes cast on Resolution 3 by Mr Vassie and his associates, other than where the vote:
is cast by a person as proxy for a Shareholder (not being Mr Vassie or any associate) who is entitled to vote, in accordance with the directions on the Proxy Form; or
is cast by the Chairman as proxy for a Shareholder (not being Mr Vassie or any associate) who is entitled to vote, in accordance with a direction on the Proxy Form to vote as the proxy decides.
Further, under the Corporations Act, the Company's Key Management Personnel and their closely related parties are prohibited from voting on resolutions connected directly or indirectly with the remuneration of Key Management Personnel (such as Resolution 3) as a proxy for a Shareholder entitled to vote where the proxy appointment does not specify the way the proxy is to vote on the resolution. However, this Corporations Act prohibition does not apply to the Chairman if the Chairman has been appointed as the proxy and the proxy appointment expressly authorises the Chairman to exercise an undirected proxy. The Chairman intends to vote undirected proxies (where the Chairman has been appropriately authorised) in favour of Resolution 3. Certain capitalised terms used in this document are defined below.
Definitions Annual General Meeting or Meeting means the annual general meeting of St Barbara to be held on Wednesday 29 November 2017 at 11:00 am (Melbourne time) in the Royce Hotel, 379 St Kilda Road, Melbourne, Victoria to consider and, if thought fit, pass the resolutions set out in the Notice of Annual General Meeting Annual Report means the 2017 annual report of St Barbara ASIC means the Australian Securities and Investments Commission ASX means ASX Limited ASX Listing Rules means the official Listing Rules of ASX Limited Board means the board of Directors of St Barbara Chairman means the chairman of the Annual General Meeting of St Barbara Change of Control means that one or more persons acting in concert have acquired or are likely to imminently acquire “control” of the Company as defined in section 50AA of the Corporations Act Corporations Act means the Corporations Act 2001 (Cth) Director means a director of St Barbara Explanatory Memorandum means the explanatory memorandum accompanying the Notice of Annual General Meeting contained in this Meeting Documentation FY17 Performance Rights means the LTI rights granted in respect of the 2017 financial year FY18 Performance Rights means the LTI rights granted in respect of the 2018 financial year (which are subject to the approval of Resolution 3, for the number of performance rights to be issued to Mr Bob Vassie) Key Management Personnel has the meaning given in the Corporations Act KPI means key performance indicator LTI means long term incentive Meeting Documentation means this document, comprising the Notice of Annual General Meeting, Explanatory Memorandum and the Proxy Form Non‐Executive Director means a Director who is not employed by the Company in an executive or management capacity Notice of Annual General Meeting means the notice of meeting which is enclosed in the Meeting Documentation Proxy Form means the proxy form for the Annual General Meeting contained in the Meeting Documentation RP means the rights plan of the Company Share means a fully paid ordinary share in the capital of St Barbara Shareholder means a holder of Shares St Barbara or the Company means St Barbara Limited ABN 36 009 165 066 STI means short term incentive VWAP means volume weighted average priceF
or p
erso
nal u
se o
nly

page 4
Explanatory Notes to Shareholders These Explanatory Notes have been prepared to assist Shareholders to understand the business to be put to Shareholders at the forthcoming Annual General Meeting on 29 November 2017.
Ordinary Business
1. Annual Reports The Corporations Act requires:
the reports of the Directors and Auditor; and
the Annual Financial Report, including the financial statements of the Company for the year ended 30 June 2017,
to be laid before the Annual General Meeting. The 2017 Annual Report is available on the St Barbara website at www.stbarbara.com.au. The Corporations Act does not require a vote of Shareholders on the reports or statements. However, Shareholders will be able to ask questions at the meeting in relation to the reports. Also, a reasonable opportunity will be given to Shareholders to ask the Company’s Auditor for the year ended 30 June 2017, Mr John O’Donoghue, Partner, PricewaterhouseCoopers, questions relevant to the conduct of the audit, the preparation and content of the Auditor’s report, the accounting policies adopted by the Company in relation to the preparation of the financial statements and the independence of the Auditor in relation to the conduct of the audit.
2. Resolution 1: Adoption of Remuneration Report The Remuneration Report sets out details on the remuneration paid to Non‐Executive Directors, the Managing Director and Chief Executive Officer and Chief Financial Officer. The Remuneration Report is set out on pages 15 to 34 (inclusive) of the 2017 Annual Report, and is available on the St Barbara website at www.stbarbara.com.au. The Remuneration Report is required to be considered for adoption in accordance with section 250R of the Corporations Act. Under section 250R(3) of the Corporations Act, the vote on this resolution is advisory only and does not bind the Directors or the Company. Shareholders will be able to ask questions about, and make comments on, the Remuneration Report at the AGM. Board recommendation The Board unanimously recommends that Shareholders vote in favour of this resolution.
3. Resolution 2: Re‐election of Director – Mr Tim Netscher Mr Tim Netscher BSc(Eng) (Chemical), BCom, MBA, FIChE, CEng, MAICD A Director of the Company since 17 February 2014, Mr Netscher is Chairman of the Board, Chair of the Health, Safety, Environment and Community Committee and a member of the Remuneration Committee and Audit & Risk Committee. Mr Netscher is currently the Non‐Executive Chairman of Gold Road Resources Limited and a Non‐Executive Director of Western Areas Limited. Mr Netscher is an experienced international mining executive with extensive operational, project development, and transactional experience and expertise in senior executive management roles. Mr Netscher’s experience covers a wide range of resources including nickel, coal, iron ore, uranium and gold and regions including Africa, Asia and Australia. Mr Netscher was re‐elected at the Company's Annual General Meeting held on 27 November 2015. In accordance with the Company's Constitution, Mr Netscher will retire at the Annual General Meeting and, being eligible, will seek re‐election. Board recommendation The Board, with Mr Netscher abstaining, unanimously recommends that Shareholders vote in favour of this resolution.
4. Resolution 3: Approval of issue of performance rights to Mr Bob Vassie, Managing Director and Chief Executive Officer Introduction The Board has resolved, subject to Shareholder approval, to issue Mr Vassie, Managing Director and Chief Executive Officer, performance rights pursuant to the Rights Plan (RP) to acquire Shares in the capital of the Company, in the quantum and on the terms which are set out below. These performance rights represent the long term incentive (LTI) component of Mr Vassie's total remuneration in respect of the 2018 financial year.
The number of performance rights to be issued in respect of the 2018 financial year (FY18 Performance Rights) is 218,748.
The number of FY18 Performance Rights was determined on the basis of the 10 day VWAP of Shares up to and including 30 June 2017, which was $2.89 per share.
The issue of the FY18 Performance Rights is subject to the terms of the RP approved by the Board on 22 September 2015, the material details of which are summarised in this document.
No cash consideration is payable for the issue, or on vesting or exercise of the FY18 Performance Rights.
For
per
sona
l use
onl
y

page 5
The FY18 Performance Rights will vest subject to prescribed service and performance conditions being met. The number of FY18 Performance Rights that vest will be subject to the Company’s relative performance for each of the performance conditions. 1. The service condition requires continuous
employment for a three year period commencing on 1 July 2017. The Board has discretion in circumstances of death, disability or bona fide redundancy to vary the service condition and reduce the number of performance rights proportionately for a period of service of less than three years.
2. The performance conditions comprise the following: a. a condition based on Relative Total
Shareholder Return; and b. a condition based on the Return On Capital
Employed by the Company, each of which is calculated over the three year period commencing 1 July 2017 and ending on 30 June 2020 and is described in more detail in the attached Schedule. This vesting period may be extended by up to two years if retesting becomes necessary. Retesting is at Board discretion, and rights would only vest over the longer period if there was positive total shareholder return, and minimum threshold performance was achieved for Relative Total Shareholder Return and Return On Capital Employed, over the extended vesting period.
Subject to the satisfaction of the service and performance conditions and the rules of the RP, Mr Vassie will receive one Share for each FY18 Performance Right that vests. Any FY18 Performance Rights which do not vest will lapse.
The FY18 Performance Rights will not be listed on the ASX and will not be transferable, except as permitted under the RP.
In the event of a Change of Control of the Company, the RP provides that the Board may, in its absolute discretion, determine that all or a specified number of FY18 Performance Rights vest, having regard to whether pro‐rata performance is consistent with the performance conditions applicable to those FY18 Performance Rights over the period from the date of grant to the date of the Change of Control.
Shareholder approval Shareholder approval for the issue of the FY18 Performance Rights to Mr Vassie is sought for all purposes under the Corporations Act and the ASX Listing Rules, including in particular, ASX Listing Rule 10.14, and sections 200B and 200E of the Corporations Act. Under ASX Listing Rule 10.14, the acquisition of securities by a director under an employee incentive scheme generally requires Shareholder approval. Shareholder approval is therefore sought for the acquisition by Mr Vassie of the FY18 Performance Rights and Shares should the FY18 Performance Rights subsequently vest. If approval is given under ASX Listing Rule 10.14, the grant of
the rights will not use up the Company's capacity to issue equity under ASX Listing Rule 7.1. Under section 200B of the Corporations Act, a company may only give a person a benefit in connection with their ceasing to hold a managerial or executive office in the company or a related body corporate if it is approved by Shareholders in accordance with section 200E or an exemption applies. Section 200B of the Corporations Act applies to managerial or executive officers of the Company or any of its subsidiaries, which includes Mr Vassie. The term ‘benefit’ has a wide operation and, in effect, includes the automatic or accelerated vesting of the FY18 Performance Rights under the rules of the RP. It is proposed, therefore, that this resolution will also approve, under section 200E of the Corporations Act, any ‘termination benefit’ that may be provided to Mr Vassie under the RP in relation to the FY18 Performance Rights to be granted to him, in addition to any other termination benefits that may be provided to Mr Vassie under the Corporations Act. The termination benefit that may be given under the RP is the early vesting of the FY18 Performance Rights (and the receipt of Shares upon exercise of the FY18 Performance Rights) if Mr Vassie ceases employment with the Company due to death, disability, bona fide redundancy or other reason with the approval of the Board. The value of such benefits cannot presently be ascertained but matters, events and circumstances that will, or are likely to, affect the calculation of that value include: 1. the number of performance rights held by Mr Vassie
prior to cessation of employment; 2. the number of performance rights that vest (which
could be all of the performance rights held by Mr Vassie). The Board's decision as to the number of performance rights that vest will depend on, among other things, the circumstances of Mr Vassie's cessation of employment (for example, whether due to death, disability, redundancy or other reasons approved by the Board), the Board's assessment of Mr Vassie's performance in the period up to cessation of employment, the degree to which the performance conditions have been met at the relevant time, and the duration of Mr Vassie's employment; and
3. the market price of Shares on ASX on the last ten ASX trading days up to and including the date of calculation.
The number of performance rights that could vest upon Mr Vassie ceasing employment, where the Board determines to permit performance rights to vest, will not exceed the maximum number of performance rights held by Mr Vassie. Disclosures made for the purposes of ASX Listing Rule 10.15: In accordance with ASX Listing Rule 10.15, the Company notes that:
the maximum number of securities that can be awarded to Mr Vassie if this resolution is approved is 218,748 FY18 Performance Rights, entitling Mr Vassie to a maximum of 218,748 Shares if all FY18 Performance Rights subsequently vest;
For
per
sona
l use
onl
y

page 6
the price payable on the issue, vesting or exercise of each FY18 Performance Rights is nil;
Mr Vassie was granted 196,708 performance rights for nil cash consideration on 12 December 2016 under the Rights Plan (RP) approved by the Board on 22 September 2015, the material details of which were summarised in the Notice of 2016 Annual General Meeting;
Mr Vassie is the only Director entitled to participate in the RP because he is the only Executive Director and the Company has not declared any Non‐Executive Director as being eligible to participate in the RP;
there have not been any grants made to any Director or associate of a Director under the RP since Shareholder approval was last obtained at the Company’s Annual General Meeting held on 30 November 2016, aside from the issue of 196,708 performance rights (for nil cash consideration and no amount payable on vesting) to Mr Vassie on 12 December 2016, in accordance with Shareholder approval obtained at the Company’s Annual General Meeting held on 30 November 2016;
there is no loan proposed in relation to the proposed award of the FY18 Performance Rights to Mr Vassie; and
Mr Vassie's FY18 Performance Rights are intended to be issued by 31 December 2017 and in any event will not be issued later than 12 months after the date of the Meeting.
Board recommendation The Board, with Mr Vassie abstaining, unanimously recommends the approval of the issue of the performance rights and of the related termination benefits to Mr Vassie and, accordingly, that Shareholders vote in favour of this resolution.
Schedule: Performance rights – Further details Performance rights to be granted to Key Management Personnel in respect of the 2018 financial year (FY18 Performance Rights) will be offered pursuant to the terms of the Rights Plan (RP) approved by the Board on 22 September 2015 and the performance conditions set out below.
1. Performance rights pricing
The issue price of the performance rights is based on the 10 day volume weighted average price (VWAP) on the ASX of the Company’s share price up to, and including, the last business day of the financial period immediately preceding the period that the performance rights relate to.
FY17 Performance Rights are priced at $2.89 per right, based on the 10 day VWAP up to and including 30 June 2017.
2. Performance conditions for performance rights
The performance conditions for FY18 Performance Rights will be measured over a three year vesting period commencing 1 July 2017 and ending on 30 June 2020. This vesting period may be extended by up to two years if retesting becomes necessary. Vesting conditions include satisfying conditions relating to:
Relative Total Shareholder Return (67% weighting); and
Return on Capital Employed (33% weighting).
3. Change of Control
In the event of a Change of Control of the Company, the RP provides that the Board may, in its absolute discretion, determine that all or a specified number of FY18 Performance Rights vest, having regard to whether pro‐rata performance is consistent with the performance conditions applicable to those FY18 Performance Rights over the period from the date of grant to the date of the Change of Control.
4. Percentage of relevant total fixed remuneration offered as LTIs for the 2018 financial year
Managing Director and Chief Executive Officer
75%
Executive General Manager 60%
The Board has the discretion to vary the relevant percentage each year, having regard to external advice and / or relevant market benchmarks.
5. An example of how performance rights are calculated for the 2018 financial year (assuming the maximum award level) is set out below:
Executive Level 5 Total Fixed Remuneration (TFR)
$400,000 (example only)
LTI award value 60% of TFR
$240,000 (i.e. 60% of TFR)
Performance rights issue price (10 day VWAP)
$2.89
Performance rights to be granted ($240,000 ÷ $2.89)
83,045 rights
6. Relative TSR
The Relative Total Shareholder Return (Relative TSR or RTSR) is measured against a defined peer group of companies which the Board considers compete with the Company for the same investment capital, both in Australia and overseas, and which by the nature of their business are influenced by commodity prices and other external factors similar to those that impact on the TSR performance of the Company. The comparator group of companies for FY18 Performance Rights is set out in the table below. At the discretion of the Board, the composition of the comparator group may change from time to time.
For
per
sona
l use
onl
y

page 7
Comparator group of companies for FY18 Performance Rights
Alacer Gold Corp. (ASX: AQG)
Beadell Resources Limited (ASX: BDR)
Evolution Mining Limited (ASX: EVN)
Focus Minerals Ltd (ASX: FML)
Intrepid Mines Limited (ASX: IAU)
Kingsgate Consolidated Limited (ASX: KCN)
Medusa Mining Limited (ASX: MML)
Northern Star Resources Ltd (ASX: NST)
OceanaGold Corporation (ASX: OGC)
Perseus Mining Limited (ASX: PRU)
Ramelius Resources Limited (ASX: RMS)
Regis Resources Limited (ASX: RRL)
Resolute Mining Limited (ASX: RSG)
Saracen Mineral Holdings Limited (ASX: SAR)
Silver Lake Resources Limited (ASX: SLR)
Tanami Gold NL (ASX: TAM)
Troy Resources Limited (ASX: TRY)
Oz Minerals Limited (ASX: OZL)
TSR measures the growth for a financial year in the price of shares plus cash distributions notionally reinvested in shares. Company and comparator TSR performances are measured using the 10 day VWAP calculation up to, and including, the last business day of the financial period immediately preceding the period that the performance rights relate to, and in determining the closing TSR performances at the end of the three year period and, if retesting applies, at the end of the fourth and fifth year. Where a comparator company ceases to be listed on the ASX during the vesting period, the corresponding TSR is adjusted, taking into account the period the ceasing
company was listed and the average TSR of the remaining comparator companies.
Except when otherwise determined in the discretion of the Board, the proportion of a grant that is subject to a TSR vesting condition will not vest unless the Company’s TSR for the vesting period is greater than nil.
The proportion of the FY18 Performance Rights that vest will be influenced by the Company’s TSR relative to the comparator group over the three year vesting period commencing 1 July 2017 and ending on 30 June 2020 as outlined below:
Relative TSR Performance % Contribution to the Number of Performance Rights to Vest
Below 50th percentile 0%
50th percentile 50%
Between 50th & 75th percentiles Pro‐rata from 50% to 100%
75th percentile and above 100%
7. Return on Capital Employed (ROCE)
Return on Capital Employed (ROCE) measures the efficiency with which management uses capital in seeking to increase shareholder value. The proportion of the FY18 Performance Rights that vest will be influenced by the ROCE achieved by the Company over the three year vesting period commencing 1 July 2017 and ending on 30 June 2020 as outlined below:
Return on Capital Employed (ROCE) % Contribution to the Number of Performance Rights to Vest
Less than or equal to the average annual weighted average cost of capital (WACC) over the three year period commencing on 1 July 2017
0%
WACC (calculated as above) + 3% 50%
WACC (calculated as above) + between 3% and 7% Pro‐rata from 50% to 100%
WACC (calculated as above) + 7% 100%
For
per
sona
l use
onl
y

page 8
8. Example of calculation of the number of performance rights to vest
Assuming the following measures over the three year vesting period commencing on 1 July 2017 and ending on 30 June 2020:
Relative TSR: 70% ROCE WACC + 4%
then the following proportion of performance rights will vest:
(a) Relative TSR Weighting: 67% Actual score: 70th percentile Calculation: 50% (for achieving the 50th
percentile) + ((70% ‐ 50%) (75% ‐ 50%)) x (100% ‐ 50%) = 90%
(b) Return on Capital Employed (ROCE) Weighting: 33% Actual ROCE: WACC + 4% Calculation: 50% (for achieving the 50th
percentile) + ((4% ‐ 3%) (7% ‐ 3%)) x (100% ‐ 50%)
= 62.5% (c) Combined score
(90% x 67%) + (62.5% x 33%) = 80.9%
Using the above example of an executive being issued with 83,045 performance rights, based on the above 80.9% combined score, 67,183 (= 80.9% x 83,045) performance rights will vest.
9. Retesting
The 2017 Remuneration Report notes that the gold industry is much more volatile than the economy in general and tends to be cyclical in nature. Consequently, at its discretion the Board may choose to retest the relevant performance rights for the same performance conditions (i.e. RTSR above 50th percentile and ROCE above WACC +3%) one year after the original vesting period (and potentially again one year later).
In the event that none of the rights vest at the end of the three year vesting period, the vesting period will be extended by one year and a second testing for vesting will occur following the end of the extended period using the same vesting scales as at paragraphs 6 and 7 above. If none of the rights vest at the second test, the vesting period will be extended by a further year and a third test for vesting will occur following the end of the extended period using the same vesting scales as at paragraphs 6 and 7 above.
Performance rights would only vest over an extended vesting period (of four or five years), with Board discretion, if there was positive total shareholder return, and minimum threshold performance for RSTR and ROCE, over the extended vesting period.
For
per
sona
l use
onl
y

SRN/HIN: I9999999999
Lodge your vote:
Online:www.investorvote.com.au
By Mail:Computershare Investor Services Pty LimitedGPO Box 242 MelbourneVictoria 3001 Australia
Alternatively you can fax your form to(within Australia) 1800 783 447(outside Australia) +61 3 9473 2555
For Intermediary Online subscribers only(custodians) www.intermediaryonline.com
For all enquiries call:(within Australia) 1300 653 935(outside Australia) +61 3 9415 4356
Proxy Form
For your vote to be effective it must be received by 11:00am (Melbourne time) on Monday, 27 November 2017.
How to Vote on Items of BusinessAll your securities will be voted in accordance with your directions.
Appointment of Proxy
Voting 100% of your holding: Direct your proxy how to vote bymarking one of the boxes opposite each item of business. If you donot mark a box your proxy may vote or abstain as they choose (tothe extent permitted by law). If you mark more than one box on anitem your vote will be invalid on that item.
Voting a portion of your holding: Indicate a portion of yourvoting rights by inserting the percentage or number of securitiesyou wish to vote in the For, Against or Abstain box or boxes. Thesum of the votes cast must not exceed your voting entitlement or100%.
Appointing a second proxy: You are entitled to appoint up to twoproxies to attend the meeting and vote on a poll. If you appoint twoproxies you must specify the percentage of votes or number ofsecurities for each proxy, otherwise each proxy may exercise half ofthe votes. When appointing a second proxy write both names andthe percentage of votes or number of securities for each in Step 1overleaf.
Signing Instructions for Proxy FormsIndividual: Where the holding is in one name, the securityholdermust sign.Joint Holding: Where the holding is in more than one name, all ofthe securityholders should sign.Power of Attorney: If you have not already lodged the Power ofAttorney with the registry, please attach a certified photocopy of thePower of Attorney to this form when you return it.Companies: Where the company has a Sole Director who is alsothe Sole Company Secretary, this form must be signed by thatperson. If the company (pursuant to section 204A of the CorporationsAct 2001) does not have a Company Secretary, a Sole Director canalso sign alone. Otherwise this form must be signed by a Directorjointly with either another Director or a Company Secretary. Pleasesign in the appropriate place to indicate the office held. Delete titlesas applicable.
Attending the MeetingBring this form to assist registration. If a representative of a corporatesecurityholder or proxy is to attend the meeting you will need toprovide the appropriate “Certificate of Appointment of CorporateRepresentative” prior to admission. A form of the certificate may beobtained from Computershare or online at www.investorcentre.comunder the help tab, "Printable Forms".
Comments & Questions: If you have any comments or questionsfor the company, please write them on a separate sheet of paper andreturn with this form.
GO ONLINE TO VOTE, or turn over to complete the form
A proxy need not be a securityholder of the Company.
Control Number: 999999
PIN: 99999
Go to www.investorvote.com.au or scan the QR Code with your mobile device.Follow the instructions on the secure website to vote.
Vote and view the annual report online
Your access information that you will need to vote:
PLEASE NOTE: For security reasons it is important that you keep your SRN/HIN confidential.
••
SBM
MR SAM SAMPLEFLAT 123123 SAMPLE STREETTHE SAMPLE HILLSAMPLE ESTATESAMPLEVILLE VIC 3030
Samples/000001/000001/i12
*S00000112Q01*
For
per
sona
l use
onl
y

I 9999999999
Change of address. If incorrect,mark this box and make thecorrection in the space to the left.Securityholders sponsored by abroker (reference numbercommences with ‘X’) should adviseyour broker of any changes.
Proxy Form Please mark to indicate your directions
Appoint a Proxy to Vote on Your BehalfI/We being a member/s of St Barbara Limited hereby appoint
STEP 1
the Chairman ORPLEASE NOTE: Leave this box blank ifyou have selected the Chairman of theMeeting. Do not insert your own name(s).
or failing the individual or body corporate named, or if no individual or body corporate is named, the Chairman of the Meeting, as my/our proxyto act generally at the Meeting on my/our behalf and to vote in accordance with the following directions (or if no directions have been given, andto the extent permitted by law, as the proxy sees fit) at the Annual General Meeting of St Barbara Limited to be held in the Royce ConferenceRoom, Royce Hotel, 379 St Kilda Road, Melbourne, Victoria on Wednesday, 29 November 2017 at 11.00am (Melbourne time) and at anyadjournment or postponement of that Meeting.
STEP 2 Items of Business PLEASE NOTE: If you mark the Abstain box for a resolution, you are directing your proxy not to vote on yourbehalf on a show of hands or a poll and your votes will not be counted in computing the required majority.
SIGN Signature of Securityholder(s) This section must be completed.Individual or Securityholder 1 Securityholder 2 Securityholder 3
Sole Director and Sole Company Secretary Director Director/Company Secretary
ContactName
ContactDaytimeTelephone Date
of the Meeting
I ND
S B M 9 9 9 9 9 9 A
MR SAM SAMPLEFLAT 123123 SAMPLE STREETTHE SAMPLE HILLSAMPLE ESTATESAMPLEVILLE VIC 3030
/ /
XX
ForA
gainst
Absta
in
Resolution 1 Adoption of Remuneration Report
Resolution 2 Re-election of Director – Mr Tim Netscher
Resolution 3 Approval of issue of performance rights to Mr Robert (Bob) Vassie, Managing Director and ChiefExecutive Officer
Important Note:Chairman authorised to exercise undirected proxies on remuneration related resolutions: Where I/we have appointed the Chairman ofthe Meeting as my/our proxy (or the Chairman becomes my/our proxy by default), I/we expressly authorise the Chairman to exercise my/ourproxy on Resolutions 1 and 3 (except where I/we have indicated a different voting intention below) even though Resolutions 1 and 3 are connected directly or indirectly with the remuneration of a member of key management personnel, which includes the Chairman. If the Chairmanof the Meeting is (or becomes) your proxy you can direct the Chairman to vote for or against or abstain from voting on Resolutions 1 and 3 bymarking the appropriate box in step 2 below.
Please Note: To fully inform shareholders in exercising their right to vote, please note that the Chairman of the Meeting intends to voteundirected proxies in favour of each resolution.
For
per
sona
l use
onl
y