Asthma, chronic obstructive pulmonary disease and other
117
Australian Institute of Health and Welfare Canberra Cat. no. ACM 20 Asthma, chronic obstructive pulmonary disease and other respiratory diseases in Australia May 2010
Transcript of Asthma, chronic obstructive pulmonary disease and other
Australian Institute of Health and Welfare
Canberra
Cat. no. ACM 20
Asthma, chronic obstructive pulmonary disease and other
respiratory diseases in Australia
May 2010

2
© Australian Institute of Health and Welfare 2010
This work is copyright. Apart from any use as permitted under the Copyright Act 1968, no part may be reproduced without prior written permission from the Australian Institute of Health and Welfare. Requests and enquiries concerning reproduction and rights should be directed to the Head, Media and Communications Unit, Australian Institute of Health and Welfare, GPO Box 570, Canberra ACT 2601.
A complete list of the Institute’s publications is available from the Institute’s website <www.aihw.gov.au>.
ISBN 978-1-74249-028-1
Suggested citation
Australian Institute of Health and Welfare 2010. Asthma, chronic obstructive pulmonary disease and other respiratory diseases in Australia. Cat. no. ACM 20. Canberra: AIHW.
Australian Institute of Health and Welfare
Board Chair
Hon. Peter Collins, AM, QC
Director
Penny Allbon
Any enquiries about or comments on this publication should be directed to:
Adrian Webster
Australian Institute of Health and Welfare
GPO Box 570
Canberra ACT 2601
Phone: (02) 6244 1144
Email: [email protected]
Published by the Australian Institute of Health and Welfare
Printed by Bluestar Print Group
The Australian Institute of Health and Welfare is Australia’s national health and welfare statistics and information agency. The Institute’s mission is
better information and statistics for better health and wellbeing.
Please note that there is the potential for minor revisions of data in this report. Please check the online version at <www.aihw.gov.au> for any amendments.
iii
Contents
Acknowledgments.............................................................................................................................vii
Abbreviations................................................................................................................................... viii
Summary .............................................................................................................................................. ix
1. Introduction....................................................................................................................................1
1.1 The respiratory system and disease.......................................................................................2
1.2 Diseases covered.......................................................................................................................2
1.3 Relationships between respiratory diseases.........................................................................5
1.4 The monitoring of respiratory diseases in Australia...........................................................6
1.5 Report structure........................................................................................................................6
1.6 Notes on terms used in this analysis .....................................................................................7
2. Respiratory disease risk and trigger factors ................................................................................9
2.1 Genetic susceptibility.............................................................................................................10
2.1.1 Asthma...........................................................................................................................10
2.1.2 Hayfever and chronic sinusitis...................................................................................10
2.1.3 COPD.............................................................................................................................10
2.1.4 Cystic fibrosis................................................................................................................10
2.1.5 Pneumoconiosis............................................................................................................10
2.1.6 Sleep apnoea .................................................................................................................11
2.2 Behavioural factors ................................................................................................................11
2.2.1 Tobacco smoke .............................................................................................................11
2.2.2 Alcohol...........................................................................................................................13
2.2.3 Exercise ..........................................................................................................................13
2.3 Indoor allergens and air pollutants .....................................................................................14
2.3.1 House dust ....................................................................................................................14
2.3.2 Combustion by-products ............................................................................................15
2.3.3 Volatile organic compounds.......................................................................................15
2.4 Outdoor allergens and air pollutants ..................................................................................15
2.4.1 Pollens............................................................................................................................16
2.4.2 Ambient air pollution ..................................................................................................16
2.4.3 The weather ..................................................................................................................17
2.5 Occupational exposures ........................................................................................................17
2.5.1 Asthma...........................................................................................................................17
2.5.2 Hay fever and chronic sinusitis..................................................................................17
2.5.3 COPD.............................................................................................................................18
2.5.4 Pneumoconiosis............................................................................................................18
iv
2.5.5 Bronchiectasis ...............................................................................................................18
2.5.6 Pneumonia ....................................................................................................................18
2.6 Dietary factors.........................................................................................................................18
2.6.1 Asthma...........................................................................................................................18
2.7 Excess body weight................................................................................................................19
2.7.1 Asthma...........................................................................................................................19
2.7.2 COPD.............................................................................................................................19
2.7.3 Sleep apnoea .................................................................................................................19
2.8 Medication...............................................................................................................................19
2.8.1 Asthma and hayfever ..................................................................................................19
2.9 Infectious diseases..................................................................................................................19
2.9.1 Asthma and COPD ......................................................................................................20
2.9.2 Bronchiectasis and pneumoconiosis..........................................................................20
2.9.3 Sinusitis and hayfever .................................................................................................20
2.9.4 Cystic fibrosis................................................................................................................21
3. Asthma..............................................................................................................................................22
3.1 General epidemiology ...........................................................................................................22
3.1.1 Prevalence .....................................................................................................................22
3.1.2 Mortality........................................................................................................................24
3.2 Health service impacts...........................................................................................................25
3.2.1 GP encounters...............................................................................................................25
3.2.2 Hospitalisations............................................................................................................26
3.3 Comorbidities and complicating factors.............................................................................27
3.3.1 Side effects of asthma medications............................................................................27
3.3.2 The relationship between hayfever (allergic rhinitis), chronic sinusitis and asthma..........................................................................................................................27
4. Hayfever (allergic rhinitis) ...........................................................................................................29
4.1 General epidemiology ...........................................................................................................29
4.1.1 Prevalence .....................................................................................................................29
4.1.2 Mortality........................................................................................................................30
4.2 Health service impacts...........................................................................................................30
5. Chronic sinusitis.............................................................................................................................31
5.1 General epidemiology ...........................................................................................................31
5.1.1 Prevalence .....................................................................................................................31
5.1.2 Mortality........................................................................................................................32
5.2 Health service impacts...........................................................................................................32
5.2.1 General practice............................................................................................................32
5.2.2 Hospitalisations and procedures ...............................................................................32
v
5.3 Comorbidities and complicating factors.............................................................................33
6. Chronic obstructive pulmonary disease ....................................................................................34
6.1 General epidemiology ...........................................................................................................34
6.1.1 Prevalence .....................................................................................................................34
6.1.2 Mortality........................................................................................................................36
6.1.3 Disability .......................................................................................................................39
6.2 Health service impacts...........................................................................................................40
6.2.1 General practice encounters .......................................................................................40
6.2.2 Hospitalisations............................................................................................................40
6.3 Comorbidities and complicating factors.............................................................................44
6.3.1 COPD deaths and respiratory cancers ......................................................................44
6.3.2 COPD deaths and the circulatory system.................................................................44
7. Influenza and pneumonia ............................................................................................................45
7.1 Influenza..................................................................................................................................45
7.2 Pneumonia ..............................................................................................................................46
7.3 General epidemiology ...........................................................................................................46
7.3.1 Incidence........................................................................................................................46
7.3.2 Mortality........................................................................................................................47
7.4 Health service impacts...........................................................................................................48
7.4.1 Hospitalisations............................................................................................................49
7.5 Comorbidities and complicating factors.............................................................................52
7.5.1 Greater risk associated with underlying conditions ...............................................52
7.5.2 Greater risks for those 65 and over............................................................................52
7.5.3 Prevention of exacerbations........................................................................................53
8. Bronchiectasis..................................................................................................................................54
8.1 General epidemiology ...........................................................................................................54
8.1.1 Prevalence in Indigenous communities ....................................................................54
8.1.2 Prevalence in other countries .....................................................................................55
8.1.3 Mortality........................................................................................................................55
8.1.4 Trends ............................................................................................................................56
8.2 Health service impacts...........................................................................................................56
8.2.1 General practice............................................................................................................56
8.2.2 Hospitalisations............................................................................................................56
8.2.3 Trends in hospital separations ...................................................................................57
8.2.4 Management .................................................................................................................57
8.3 Comorbidities and complicating factors.............................................................................58
9. Cystic fibrosis..................................................................................................................................60
9.1 General epidemiology ...........................................................................................................62
vi
9.1.1 Incidence........................................................................................................................62
9.1.2 Prevalence .....................................................................................................................63
9.1.3 Mortality........................................................................................................................64
9.2 Health service impacts...........................................................................................................65
9.2.1 Management .................................................................................................................65
9.3 Comorbidities and complicating factors.............................................................................68
9.3.1 Associated morbidity...................................................................................................69
10. Pneumoconiosis ............................................................................................................................70
10.1 Causes of pneumoconiosis..................................................................................................70
10.1.1 Asbestos.......................................................................................................................70
10.1.2 Silica .............................................................................................................................70
10.1.3 Coal ..............................................................................................................................71
10.2 General epidemiology .........................................................................................................71
10.2.1 Incidence......................................................................................................................71
10.2.2 Mortality......................................................................................................................73
10.3 Health service impacts.........................................................................................................74
10.3.1 Hospitalisations..........................................................................................................74
11. Sleep apnoea..................................................................................................................................75
11.1 General epidemiology .........................................................................................................76
11.1.1 Prevalence ...................................................................................................................76
11.1.2 Mortality......................................................................................................................77
11.2 Health service impacts.........................................................................................................78
11.2.1 Hospitalisations and procedures .............................................................................78
11.3 Comorbidities and complicating factors...........................................................................79
11.3.1 Daytime sleepiness ....................................................................................................79
11.3.2 Cognitive function .....................................................................................................79
11.3.3 Motor vehicle accidents.............................................................................................80
11.3.4 Cardiovascular morbidity.........................................................................................80
11.3.5 Quality of life ..............................................................................................................81
Appendix A: Source tables ...............................................................................................................82
Appendix B: Health care expenditure ............................................................................................83
Appendix C: Fact sheets ....................................................................................................................88
References............................................................................................................................................92
List of tables ......................................................................................................................................104
List of figures ....................................................................................................................................105
List of boxes.......................................................................................................................................107

vii
Acknowledgments
The authors of this report are Malcolm Gall, Katarzyna Krysiak and Vanessa Prescott. They would like to acknowledge the significant contribution and guidance of Kuldeep Bhatia, Adrian Webster and Perri Timmins.
The authors appreciate the valuable input of the members of the Steering Committee of the Australian System for Monitoring Asthma (ASMA).
The Australian Government Department of Health and Ageing funded this publication.
viii
Abbreviations
ABS Australian Bureau of Statistics
ACAM Australian Centre for Asthma Monitoring
ACFDR Australian Cystic Fibrosis Data Registry
AIHW Australian Institute of Health and Welfare
ASPREN Australian Sentinel General Practice Research Network
BAL bronchial alveolar lavage
BEACH Bettering the Evaluation and Care of Health
CF cystic fibrosis
CFTR cystic fibrosis transmembrane conductance regulator
CI confidence interval
COPD chronic obstructive pulmonary disease
CPAP continuous positive airway pressure
CSAS central sleep apnoea syndrome
CURF Confidentialised Unit Record File
DALY disability adjusted life year
ETS environmental tobacco smoke
FEV1 the volume of air that a person can force from their lungs in one second
GORD gastroesophageal reflux
GP general practice/general practitioner
ICD International Classification of Diseases
IgE Immunoglobulin
ILI influenza-like illness
NATSIHS National Aboriginal and Torres Strait Islander Health Survey
NDSCS National Data Set for Compensation-based Statistics
NHMD National Hospital Morbidity Database
NHS National Health Survey
NMD National Mortality Database
NNDSS National Notifiable Disease Surveillance Scheme
NOHSC National Occupational Health and Safety Commission
OSAHS/OSA obstructive sleep apnoea/hypopnoea syndrome
RSV Respiratory syncytial virus
SA sleep apnoea
SABRE Surveillance and Australian Workplace Based Respiratory Events

ix
Summary In 2007–08, general practitioners managed respiratory problems more than any other condition (19% of all encounters) and in 2006, diseases of the respiratory system were the third most common underlying causes of death (8%). In 2004–05, Australia spent $3.3 billion directly on respiratory diseases, making this the sixth highest disease expenditure group.
This report presents the epidemiology of each of the main respiratory diseases and highlights their differences and similarities.
Major findings for each respiratory condition are:
Asthma affected 10% of all Australians (over 2 million people) and 16% of Indigenous Australians in 2004–05. The highest prevalence was among those aged less than 25 years. Asthma is one of the most frequent reasons for hospitalisation of children aged 0–4 years, especially boys.
Hayfever and chronic sinusitis share causative agents with asthma and are often found together. About 3.2 million Australians reported they had hayfever as a long-term condition in 2004–05 and about 1.8 million people reported having chronic sinusitis.
Chronic obstructive pulmonary disease (COPD) is a disease that affects older people more than younger, and males more than females. Most COPD cases are attributable to a history of tobacco smoking. In 2006, 4,761 deaths (4% of the total deaths in Australia) had COPD as an underlying cause. In Australia, a steady decline in tobacco consumption, beginning in the 1970s, has been reflected 15 years later by a steady decline in COPD-related deaths. Hospital separation rates for COPD declined from 258 per 100,000 people in 1998–99 to 241 in 2006–07.
Influenza and pneumonia can worsen symptoms for people with chronic respiratory diseases and lead to serious consequences. Influenza or pneumonia were the underlying causes of 2,715 deaths in 2006, 2% of all deaths in that year. In addition, there were 14,069 deaths where influenza or pneumonia were considered contributory. Influenza and pneumonia were reported as the principal diagnoses during 61,014 stays in hospital in 2006–07.
Bronchiectasis rarely appears in isolation from other respiratory conditions. It is more common in women than men, and more common in older age groups and in Indigenous Australians. In 2006–07, bronchiectasis was the principal diagnosis for 4,019 hospitalisations (1.2% of all respiratory hospitalisations). In addition, there were 8,489 hospitalisations where bronchiectasis was an additional diagnosis.
Cystic fibrosis (CF) is Australia’s most common inherited recessive genetic condition, affecting 2,472 Australians in 2005. There has been a decline in the incidence of CF and a downward trend in CF deaths over the past 9 years.
Pneumoconiosis affects the lungs and results from inhaling certain dusts. It includes the conditions silicosis and asbestosis. Deaths due to pneumoconiosis have become less common since the early 1950s—dropping from 3.9 deaths per 100,000 people in 1950 to 1 per 100,000 people in 2006. In 2006–07, 90% of the 213 pneumoconiosis hospitalisations were for males.
Sleep apnoea (SA) causes impaired mental processes, increased risk of motor vehicle accident and aggravates cardiovascular conditions. It is estimated that 26% of 40 to 65 year- old men have SA. SA related death rates have increased steadily from 0.8 to 1.3 per 100,000 population from 1998 to 2006. In 2006–07, there were approximately 44,500 SA hospitalisations.

1
1. Introduction
Respiratory diseases have a substantial impact on Australian society:
• About 6 million Australians reported suffering from a chronic respiratory disease in 2004–05.
• The Bettering the Evaluation of Care of Health (BEACH) survey of general practice (GP) activity indicated that respiratory problems were managed 19 times per 100 GP encounters in 2007–08, making it the lead group of problems managed (AIHW: Britt et al. 2008).
• In 2006, there were 10,863 deaths where a disease of the respiratory system was the underlying cause. This was 8% of all deaths and the third most common underlying cause group (ABS 2008).
• Chronic respiratory diseases were responsible for 7.1% of the total burden of disease and injury in Australia in 2003 (AIHW: Begg et al. 2007). Cancer, cardiovascular disease, mental health and neurological disorders were the only conditions that caused a greater burden.
• Chronic respiratory diseases were responsible for 8.9% of the total burden of disease and injury among Aboriginal and Torres Strait Islander people in 2003, ranking it third after cancer and mental disorders. COPD and asthma caused 45% and 38% of this disease burden respectively (AIHW: Begg et al. 2007).
• In 2006–07, there were 329,442 hospitalisations where the principal diagnosis was a disease of the respiratory system, about 4% of the total stays. This amounted to 1.4 million days in hospital, about 6% of the total days beds were occupied in the year.
• Hospitalisation rates for respiratory conditions for Aboriginal and Torres Strait Islander people were three times as high compared to other Australians. Respiratory conditions were the second most common reason for hospitalisation in Aboriginal Australians, compared to the sixth most common reason for hospitalisation in other Australians.
• Direct health expenditure due to respiratory conditions is primarily composed of prescription pharmaceuticals that attract subsidies through the Pharmaceutical Benefits Scheme and hospitalisations. In 2004–05, the direct health expenditure allocated to respiratory disease was $3.3 billion, which was 6.3% of the total health system costs allocated to diseases. This made it the sixth highest disease expenditure group. A more complete discussion of respiratory disease health expenditure is included in Appendix B.
Clearly respiratory diseases are an important concern for Australia that requires detailed monitoring. This report aims to contribute to achieving this goal. It follows on from Chronic respiratory diseases in Australia (AIHW 2005).
2
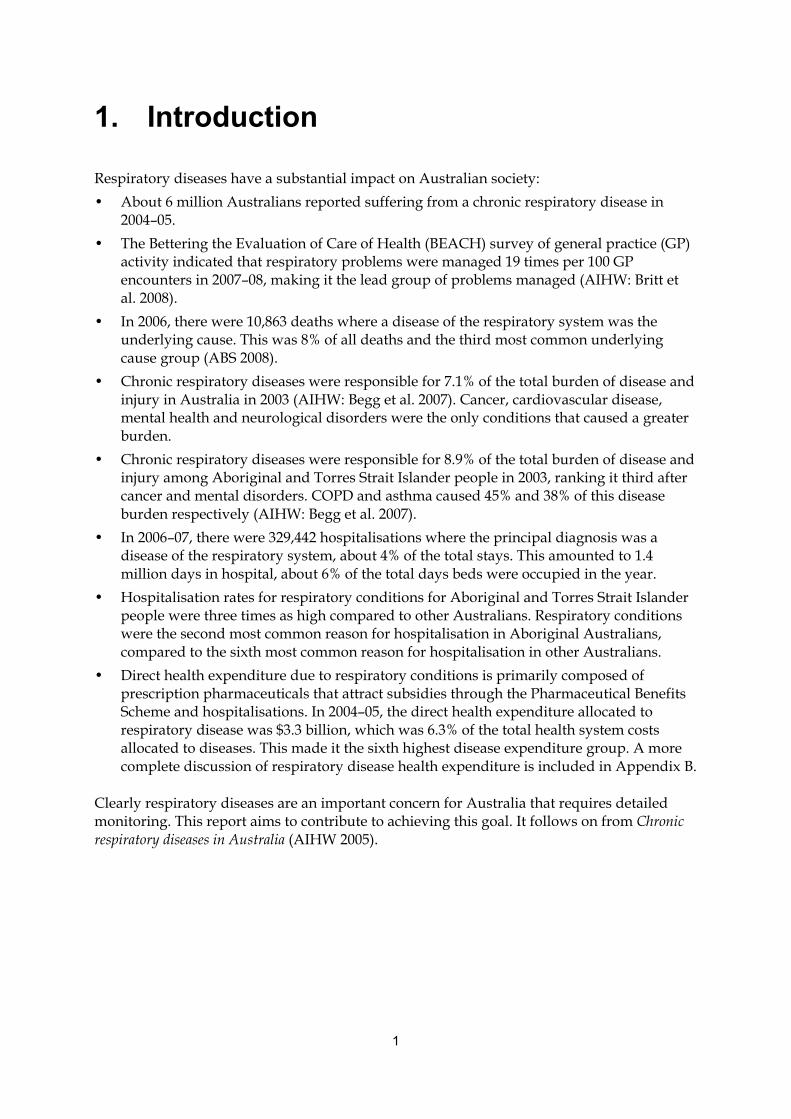
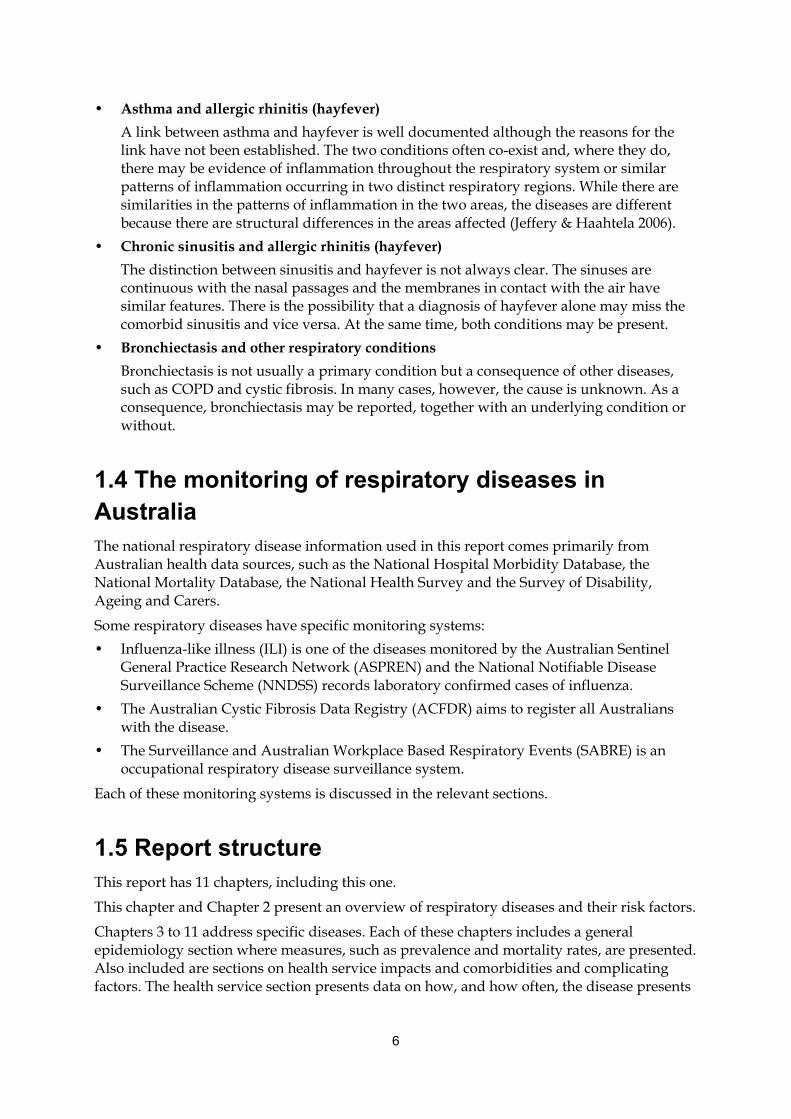
1.1 The respiratory system and disease The respiratory system is responsible for the exchange of gases between the air and the blood. The exchange happens in the alveoli. The other structures of the respiratory system support this exchange by conveying air to and from the alveoli during respiration. Contaminants in the inhaled air, as well as viral and bacterial infection, can adversely affect all of these structures, including the alveoli.
Despite respiratory diseases occurring in different parts of the respiratory system, they often have common features. The surfaces of the respiratory system can be regarded as one continuous membrane. To some extent the diseases are classified according to the part of this continuous membrane affected; however, there are major differences between the aetiology of the diseases (Borrish 2002; Jeffery & Haahtela 2006).
Figure 1.1 shows those parts of the respiratory system relevant to the discussions in this report.
1.2 Diseases covered Asthma and chronic obstructive pulmonary disease (COPD) feature heavily in this report. They account for the majority of the chronic respiratory diseases burden in Australia. According to The burden of disease and injury in Australia 2003, asthma accounts for 34% of the burden from chronic respiratory disease, while COPD accounts for 46%. These estimates of burden are calculated using estimates of the disability and deaths caused by the diseases (AIHW: Begg et al. 2007).
Our discussion begins with asthma, as a reflection of the focus that governments in Australia, at both federal and state levels, have placed on asthma. In 1999, the state government health ministers and the Australian Government recognised asthma as a National Health Priority Area.
COPD accounts for a greater health burden, in terms of disability and death, than asthma and there is considerable overlap between the conditions in the elderly. Other conditions are included for the following reasons:
• Hayfever (allergic rhinitis) and chronic sinusitis are highly prevalent in Australia. The National Health Survey (NHS) estimated that there were 3.2 million Australians with hayfever in 2004–05 and 1.8 million with chronic sinusitis.
• Influenza and pneumonia are acute conditions that can exacerbate chronic respiratory diseases.
Figure 1.1: The respiratory system
3
• Bronchiectasis can occur in severe cases of the conditions described elsewhere in this report. These include asthma, COPD, cystic fibrosis and respiratory infection. Bronchiectasis is a significant problem for Indigenous Australians.
• Cystic fibrosis (CF) has a major impact on an individual’s life and considerable support is needed from the health system to manage the disease.
• Pneumoconiosis is a highly preventable disease, predominantly caused by long-term exposure to large amounts of dust in the workplace. It is important that the incidence of this disease is monitored to ensure that there is an awareness of the disease and to detect any changes in disease patterns that might suggest changes in workplace practices.
• Sleep apnoea is a highly prevalent condition with serious consequences. It also shares risk factors, like smoking and obesity, with the other diseases described.
Respiratory cancers are excluded from this report because their epidemiology, treatment and management approaches are very different from other chronic respiratory diseases.
Box 1.1 provides definitions of the diseases described in this report.
4
Box 1.1: Definitions of the respiratory diseases covered
Asthma—a chronic inflammatory condition of the airways which presents as episodes of wheezing, breathlessness and chest tightness, due to widespread narrowing of the airways. The symptoms can reverse without treatment, but often treatment is required.
Bronchiectasis—an abnormal widening of the lungs’ air passages (the bronchi). This allows infections to start and leads to coughing with pus, and sometimes, blood. It has a number of causes, including cystic fibrosis, low antibody levels and infections such as tuberculosis, whooping cough and measles.
Chronic obstructive respiratory disease (COPD)—a serious, progressive and disabling disease in which destruction of lung tissue and narrowing of the air passages causes shortness of breath and reduced exercise capacity. Cigarette smoking almost always causes COPD. Its main pattern is known as emphysema, although if coughing is a frequent feature the condition may also be labelled as chronic bronchitis.
Chronic sinusitis—chronic inflammation of the membranes lining the large air cavities (sinuses) inside the face bones. It can cause discomfort and pain and is often linked to similar inflammation inside the nose.
Cystic fibrosis—a serious hereditary disease in which mucus from glands is too thick and sticky, affecting the lungs and other organs. The person is prone to frequent chest infections, with related problems such as severe bronchiectasis (see above), and a much-shortened life expectancy.
Hayfever (allergic rhinitis)—an allergic inflammation of the membranes lining the inside of the nose, often due to allergens, such as pollens from grasses and trees. This causes sneezing and a runny nose and is often accompanied by watering eyes.
Influenza—an acute contagious viral respiratory infection marked by fevers, muscle aches, headache, cough and sore throat.
Pneumoconiosis—a lung disease resulting from inhaling certain dusts, mostly in the workplace, such as silica, asbestos and coal dust. The dust particles settle deep in the lungs and the body responds by making scar tissue that leads to progressive shortness of breath.
Pneumonia—inflammation of the lungs as a response to infection by bacteria or viruses, with the air sacs becoming flooded with fluid and inflammatory cells and affected areas of the lung becoming solid. Pneumonia is often quite rapid in onset and a high fever, headache, cough, chest pain and shortness of breath mark its presence.
Sleep apnoea—when a person repeatedly stops breathing during sleep. It has the same cause as snoring—reduced airflow at the back of the mouth—but is more extreme. More common in males and the obese, it leads to poorer mental functioning during the day and a greater risk of accidents.
5
1.3 Relationships between respiratory diseases This report explores the links between respiratory diseases. These links present a number of issues for health monitoring:
• comorbidity: respiratory diseases are often closely linked, with patients suffering multiple diseases at a time.
• misdiagnosis: it is often difficult for clinicians to accurately distinguish one respiratory disease from another.
• underdiagnosis: in many cases respiratory diseases can be present in a patient but not diagnosed.
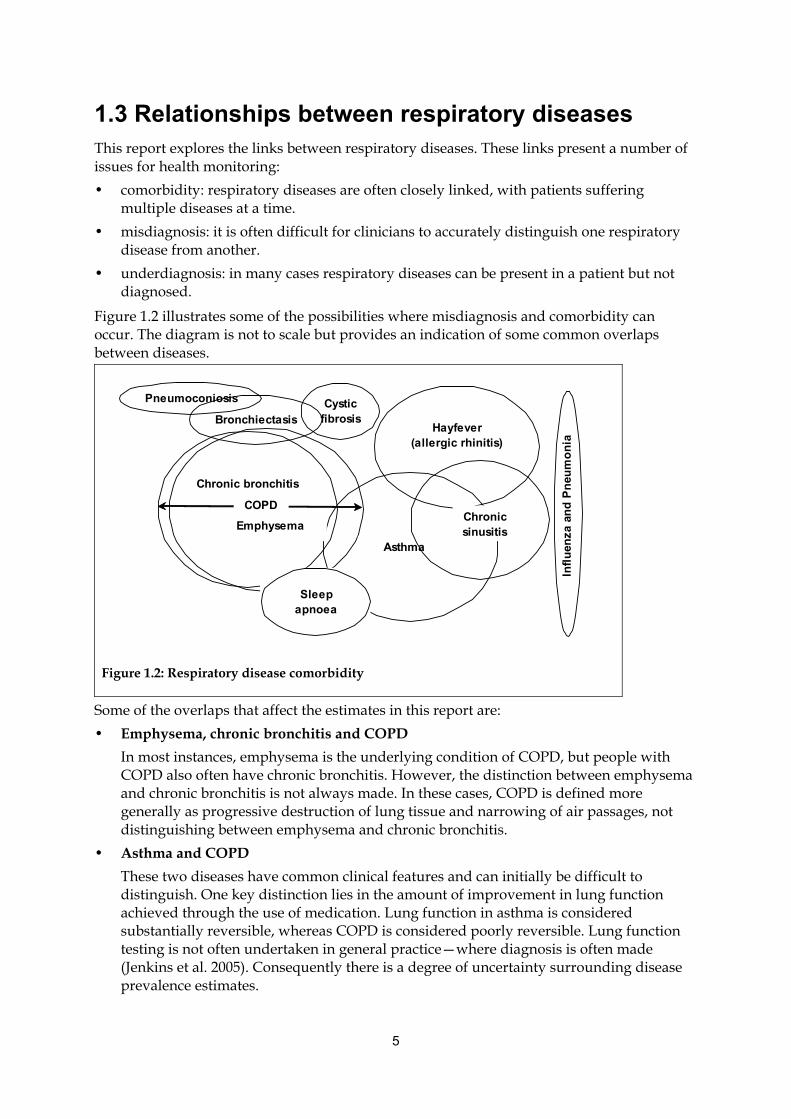
Figure 1.2 illustrates some of the possibilities where misdiagnosis and comorbidity can occur. The diagram is not to scale but provides an indication of some common overlaps between diseases.
Pneumoconiosis Cystic fibrosisBronchiectasis
Hayfever
(allergic rhinitis)
Asthma
Chronic bronchitis
COPD
Infl
uen
za a
nd
Pn
eum
on
ia
EmphysemaChronic sinusitis
Sleep apnoea
Figure 1.2: Respiratory disease comorbidity
Some of the overlaps that affect the estimates in this report are:
• Emphysema, chronic bronchitis and COPD
In most instances, emphysema is the underlying condition of COPD, but people with COPD also often have chronic bronchitis. However, the distinction between emphysema and chronic bronchitis is not always made. In these cases, COPD is defined more generally as progressive destruction of lung tissue and narrowing of air passages, not distinguishing between emphysema and chronic bronchitis.
• Asthma and COPD
These two diseases have common clinical features and can initially be difficult to distinguish. One key distinction lies in the amount of improvement in lung function achieved through the use of medication. Lung function in asthma is considered substantially reversible, whereas COPD is considered poorly reversible. Lung function testing is not often undertaken in general practice—where diagnosis is often made (Jenkins et al. 2005). Consequently there is a degree of uncertainty surrounding disease prevalence estimates.
6
• Asthma and allergic rhinitis (hayfever)
A link between asthma and hayfever is well documented although the reasons for the link have not been established. The two conditions often co-exist and, where they do, there may be evidence of inflammation throughout the respiratory system or similar patterns of inflammation occurring in two distinct respiratory regions. While there are similarities in the patterns of inflammation in the two areas, the diseases are different because there are structural differences in the areas affected (Jeffery & Haahtela 2006).
• Chronic sinusitis and allergic rhinitis (hayfever)
The distinction between sinusitis and hayfever is not always clear. The sinuses are continuous with the nasal passages and the membranes in contact with the air have similar features. There is the possibility that a diagnosis of hayfever alone may miss the comorbid sinusitis and vice versa. At the same time, both conditions may be present.
• Bronchiectasis and other respiratory conditions
Bronchiectasis is not usually a primary condition but a consequence of other diseases, such as COPD and cystic fibrosis. In many cases, however, the cause is unknown. As a consequence, bronchiectasis may be reported, together with an underlying condition or without.
1.4 The monitoring of respiratory diseases in Australia The national respiratory disease information used in this report comes primarily from Australian health data sources, such as the National Hospital Morbidity Database, the National Mortality Database, the National Health Survey and the Survey of Disability, Ageing and Carers.
Some respiratory diseases have specific monitoring systems:
• Influenza-like illness (ILI) is one of the diseases monitored by the Australian Sentinel General Practice Research Network (ASPREN) and the National Notifiable Disease Surveillance Scheme (NNDSS) records laboratory confirmed cases of influenza.
• The Australian Cystic Fibrosis Data Registry (ACFDR) aims to register all Australians with the disease.
• The Surveillance and Australian Workplace Based Respiratory Events (SABRE) is an occupational respiratory disease surveillance system.
Each of these monitoring systems is discussed in the relevant sections.
1.5 Report structure This report has 11 chapters, including this one.
This chapter and Chapter 2 present an overview of respiratory diseases and their risk factors.
Chapters 3 to 11 address specific diseases. Each of these chapters includes a general epidemiology section where measures, such as prevalence and mortality rates, are presented. Also included are sections on health service impacts and comorbidities and complicating factors. The health service section presents data on how, and how often, the disease presents
7
in the general practice and hospital settings. The comorbidities section explores the interrelationship between the disease and other conditions, as well as any other factors of interest.
1.6 Notes on terms used in this analysis The following are the primary measures used in this report:
• Incidence—the number of new cases occurring over a given time period. Incidence data is scarce but is available for some specific diseases. For example, data from the Cystic Fibrosis Data Registry provides the number of people born with cystic fibrosis each year.
• Prevalence—the number or proportion of the population with the disease at a given point in time. The main source of prevalence data is the Australian Bureau of Statistics’ 2004–05 National Health Survey (NHS) and the 2004–05 National Aboriginal and Torres Strait Islander Health Survey.
• General practice encounters—the number, proportion or rate of GP encounters. The primary source is the Bettering the Evaluation and Care of Health (BEACH) survey of general practice activity.
• Hospitalisation—an episode of care in hospital for an admitted patient. The episode can be a total hospital stay (from admission to discharge, transfer or death), or a portion of a hospital stay beginning or ending in a change of care type. A separation is a process that takes place at the end of an episode of care, when the information about the episode is reported. It occurs when there is either a change to a different type of care, a discharge, a transfer to another hospital or death. Hospitalisations are usually shown over a specified time period, usually a financial year. The source in this publication is the AIHW’s National Hospital Morbidity Database.
• Mortality—the number or rate of deaths that the disease causes over a specified time period, usually a calendar year. The source of mortality data is the AIHW National Mortality Database.
• Health burden—is a measure of the total burden of the disease relative to other diseases. The measure used is the years of life lost due to premature death, coupled with the years of ‘healthy’ life lost due to disability. The source is The burden of disease and injury in Australia 2003 (AIHW: Begg et al. 2007).
Rates are expressed as either ‘age-specific’ (where the rate is limited to a specific age group) or ‘age-standardised’ (a statistical modification of the rate to conform to a particular age distribution that minimises the effect of different age distributions in different populations).
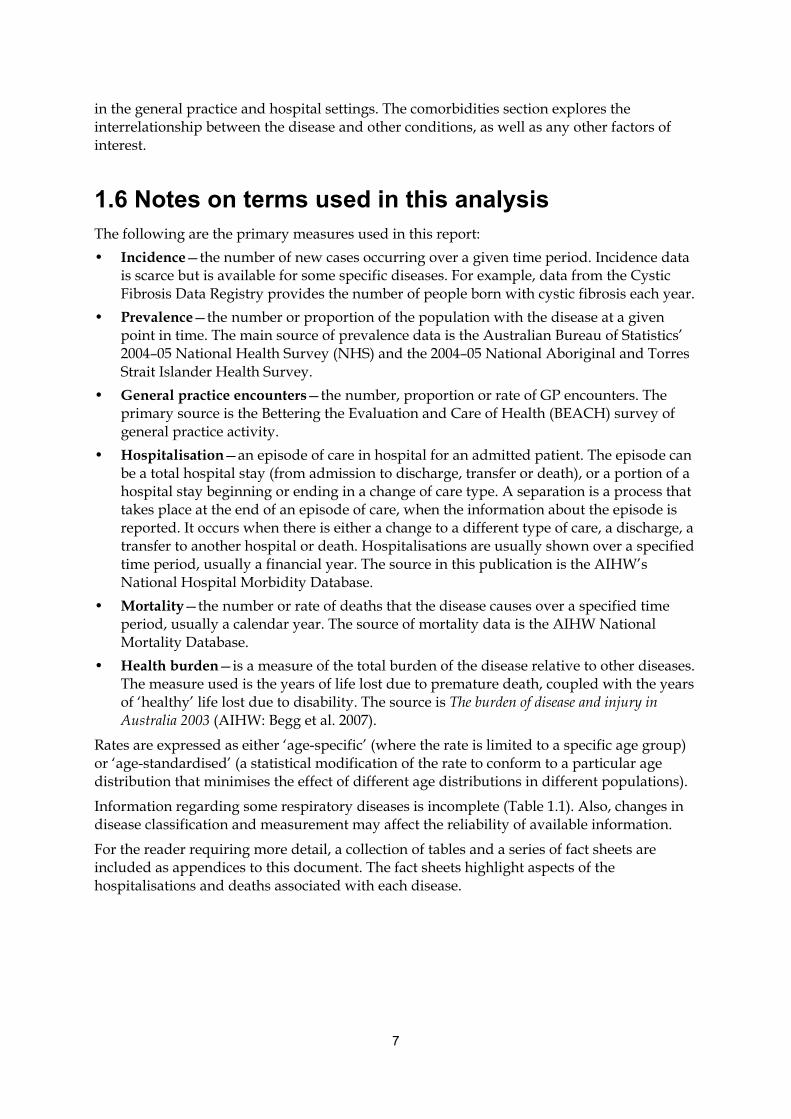
Information regarding some respiratory diseases is incomplete (Table 1.1). Also, changes in disease classification and measurement may affect the reliability of available information.
For the reader requiring more detail, a collection of tables and a series of fact sheets are included as appendices to this document. The fact sheets highlight aspects of the hospitalisations and deaths associated with each disease.
8
Table 1.1: Data sources available for monitoring respiratory diseases in Australia
Measure and most common data source (exceptions footnoted)
Condition Incidence Prevalence (NHS to
2004–05)
GP encounters(BEACH to 2007–08)
Hospitalisations
(to 2006–07)
Disability
SDAC 2003
Mortality (to 2006)
Burden of disease (2003)
Asthma n.a. (a)
Hayfever n.a. n.a. n.a.
Chronic sinusitis n.a. n.a. n.a.
COPD n.a. (b) (c)
Influenza n.a. n.a. (d) (e) n.a.
Pneumonia n.a. n.a. (a) (e) n.a.
Bronchiectasis n.a. n.a. (a) n.a. n.a.
Cystic fibrosis (f) (f) (a) n.a. (a)
Pneumoconiosis (g) (g) (a) n.a. n.a.
Sleep apnoea n.a. (h) ( a) n.a. n.a.
(a) Not included in this report.
(b) Based on estimates for emphysema and bronchitis.
(c) Based on estimates for emphysema and bronchitis/bronchiolitis.
(d) Laboratory-confirmed cases of influenza reported to the National Notifiable Disease Surveillance (NNDS) also included in this report.
(e) Influenza and pneumonia combined.
(f) Australian Cystic Fibrosis Data Registry (ACFDR).
(g) Approximation of incidence (new cases) based on National Occupational Health and Safety Commission data and Surveillance of Australian Workplace Based Respiratory Events (SABRE).
(h) Sleep studies.
n.a. not available or not applicable.
9
2. Respiratory disease risk and trigger factors
A risk factor in this report is any factor that is believed to increase the risk of developing a health condition, including becoming sensitized to certain stimuli. They encompass environmental and inherent factors that cause the individual to develop a condition. This report also looks at trigger factors, which are factors that are believed to increase the severity of the disease or induce exacerbation in those who already have the condition.
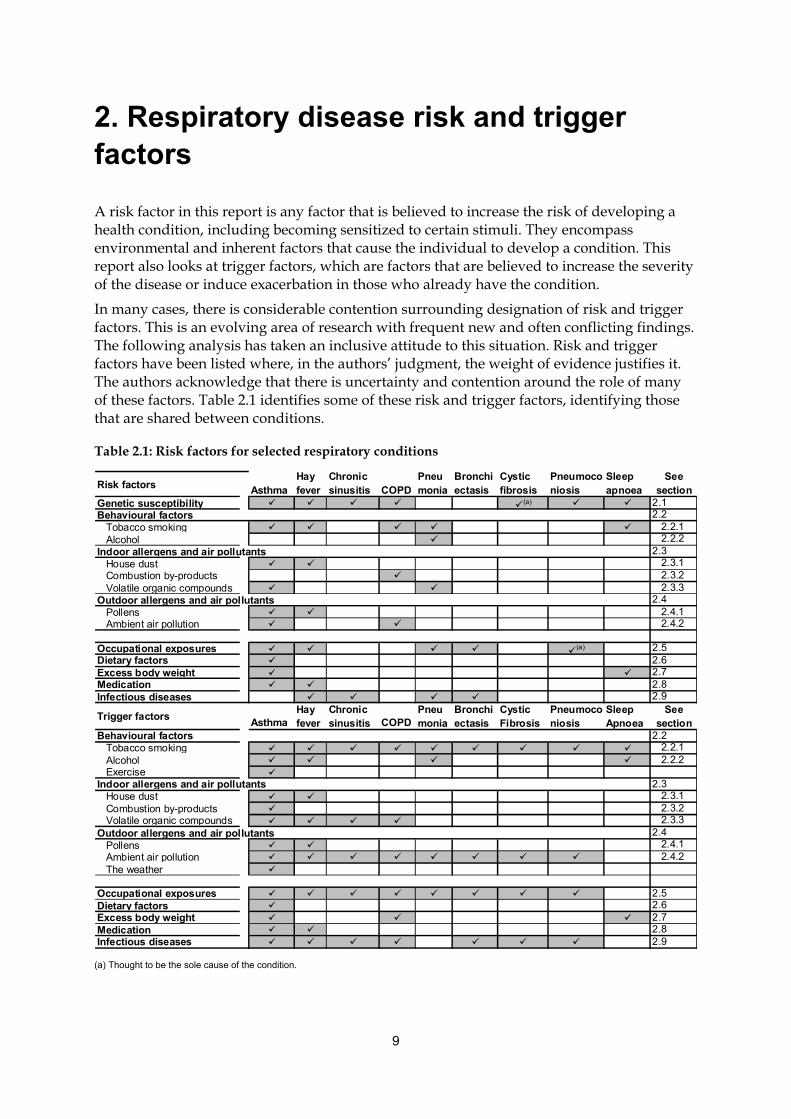
In many cases, there is considerable contention surrounding designation of risk and trigger factors. This is an evolving area of research with frequent new and often conflicting findings. The following analysis has taken an inclusive attitude to this situation. Risk and trigger factors have been listed where, in the authors’ judgment, the weight of evidence justifies it. The authors acknowledge that there is uncertainty and contention around the role of many of these factors. Table 2.1 identifies some of these risk and trigger factors, identifying those that are shared between conditions.
Table 2.1: Risk factors for selected respiratory conditions
Risk factors AsthmaHay fever
Chronic sinusitis COPD
Pneumonia
Bronchiectasis
Cystic fibrosis
Pneumoconiosis
Sleep apnoea
See section
Genetic susceptibility (a) 2.1Behavioural factors 2.2 Tobacco smoking 2.2.1 Alcohol 2.2.2Indoor allergens and air pollutants 2.3 House dust 2.3.1 Combustion by-products 2.3.2 Volatile organic compounds 2.3.3Outdoor allergens and air pollutants 2.4 Pollens 2.4.1 Ambient air pollution 2.4.2
Occupational exposures (a) 2.5Dietary factors 2.6Excess body weight 2.7Medication 2.8Infectious diseases 2.9
Trigger factorsAsthma
Hay fever
Chronic sinusitis COPD
Pneumonia
Bronchiectasis
Cystic Fibrosis
Pneumoconiosis
Sleep Apnoea
See section
Behavioural factors 2.2 Tobacco smoking 2.2.1 Alcohol 2.2.2 Exercise Indoor allergens and air pollutants 2.3 House dust 2.3.1 Combustion by-products 2.3.2 Volatile organic compounds 2.3.3Outdoor allergens and air pollutants 2.4 Pollens 2.4.1 Ambient air pollution 2.4.2 The weather
Occupational exposures 2.5Dietary factors 2.6Excess body weight 2.7Medication 2.8Infectious diseases 2.9
(a) Thought to be the sole cause of the condition.
10
2.1 Genetic susceptibility Genetic factors often play a role in a person’s predisposition to a particular respiratory condition or degree of sensitivity to certain stimuli. The precise genetic links vary for each condition.
2.1.1 Asthma
Atopy is a key predisposing factor for asthma (Holt et al. 1999). Atopy is the propensity to produce abnormal amounts of Immunoglobulin E (IgE), antibodies that trigger powerful immune reactions in response to exposure to allergens. IgE is an antibody that triggers powerful immune reactions. Twin and family studies suggest that it is at least partly an inherited condition (Koeppen-Schomerus et al. 2001; Sandford et al. 1996). The child of two atopic parents has a 75% chance of being atopic, whereas if only one parent is atopic there is a 50% chance of being affected.
It is estimated that up to 85% of people with asthma are atopic, while only a minority of atopic individuals (about 25–30%) develop asthma (Holt et al. 1999). It is not completely understood why some atopic individuals exposed to an allergen experience symptoms of asthma, while others exposed to the same allergen never develop asthma.
2.1.2 Hayfever and chronic sinusitis
The presence of certain genes may increase a person’s susceptibility to hayfever and sinusitis (Pinto et al. 2008; Brasch-Andersen et al. 2006). In particular, genes associated with allergy can influence susceptibility to these conditions (Brasch-Andersen et al. 2006).
2.1.3 COPD
Although the most important risk factor for COPD is tobacco smoking, only a fraction of smokers develop COPD. Multiple candidate genes have been implicated as a risk factor for COPD. The most widely recognised genetic risk factor for COPD is Alpha-1-antitrypsin deficiency (Chappell et al. 2006, Molfino 2004). Others include the MMP1 gene (Joos et al. 2002) and the TGFB1 gene (Celedon et al. 2004).
2.1.4 Cystic fibrosis
Mutations in the CFTR (cystic fibrosis transmembrane conductance regulator) gene cause cystic fibrosis (Brice et al. 2007).
2.1.5 Pneumoconiosis
Genetic factors have been demonstrated to influence susceptibility to pneumoconiosis. Studies have illustrated that individuals with polymorphisms (genes in which distinct forms exist permanently together, controlled by switches which can produce one form or the other) that promote inflammation may be predisposed to the development of the disease (Ni et al. 2009; Harding et al. 2004; Wang et al. 2008).

11
2.1.6 Sleep apnoea
Genetic factors associated with craniofacial structure, body fat distribution, and neural control of the upper airway muscles all may contribute to developing sleep apnoea (Redline & Tishler 2000).
2.2 Behavioural factors A number of behavioural factors may increase the risk of developing or exacerbating chronic respiratory diseases.
2.2.1 Tobacco smoke
Mainstream and environmental tobacco smoke
Smokers directly inhale mainstream smoke. Within the smoke, the smoker is taking nicotine, tar, carbon monoxide, sulphur dioxide and nitrogen dioxide directly to crucial structures within the lungs.
Environmental tobacco smoke (ETS) combines smoke exhaled by the smoker and smoke from the end of a burning cigarette. It contains the same components as mainstream smoke. Passive smoking has become the term commonly used when referring to the inhalation of ETS by non-smokers.
Both active and passive smoking act as risk and trigger factors for respiratory conditions.
Asthma
The role of smoking in the onset of asthma is not clear. It has been suggested that adults who smoke are more sensitive to other agents known to induce asthma because they have higher levels of IgE. In general, smokers who have asthma tend to have more symptoms and worse asthma control (Siroux et al. 2000). However, based on the 2004–05 NHS, the proportion of asthmatics who smoke differs little from the proportion of non-asthmatics who smoke (ACAM 2008). In non-Indigenous Australians aged 18 years and above, 23.8% with current asthma smoked and 22.4% without current asthma smoked. Among Indigenous Australians aged 18 years and above, 48.4% with current asthma smoked and 46.4% without asthma reported being smokers (ACAM 2008).
Exposure to ETS in childhood is a recognised risk and trigger factor for the development of asthma symptoms. In 2004–05, 39% of children aged 0–14 years with asthma lived with one or more cigarette smokers, slightly higher than the 36% of children without asthma who were similarly exposed (ACAM 2008).
A study based in a remote region of Queensland found that 48% of Indigenous children with asthma were exposed to parental tobacco smoke (Chang et al. 2000). Another study in the ACT reported that 64% of Indigenous children were exposed to passive smoke, compared to 32% of non-Indigenous children (Glasgow et al. 2003).
12
Hayfever and chronic sinusitis
Smoking has been identified as a trigger factor for hayfever and sinusitis (Houser & Keen 2009). Additionally, studies have shown an increased risk of hayfever in children of smoking mothers (California Environmental Protection Agency: Air Resources Board 2005).
COPD
About 75% to 85% of COPD cases are attributable to a history of tobacco smoking (Jiménez-Ruiz et al. 2001) and Australia’s success in reducing tobacco smoking is reflected in a downward trend of deaths and hospitalisations from COPD (see Chapter 6 for more detail). In Indigenous Australians, however, the proportion of adults who reported being current smokers has not changed significantly over the past decade (Australian Health Ministers' Advisory Council 2008). In 2004–05, half of Indigenous Australians aged 18 years and over reported they were current smokers. This is twice the proportion of non-Indigenous Australians (ACAM 2008).
COPD can develop in a non-smoker and there is evidence that passive smoking exposure increases the risk of developing COPD (Yin et al. 2007).
Cystic fibrosis
Smoking lessens the lung capacity in cystic fibrosis patients, whose lung function is already greatly compromised (Cystic Fibrosis Foundation 2009).
ETS can also cause worsening of cystic fibrosis symptoms (California Environmental Protection Agency: Air Resources Board 2005).
Pneumoconiosis
Tobacco smoking is noted as a risk factor for worsening of pneumoconiosis symptoms (Welch & Haile 2009).
Sleep apnoea
Smoking can cause increases in sleep instability. Sleep instability may be further increased by overnight reductions in nicotine levels and by a ‘rebound effect’ in which the acute effects of nicotine that cause increased upper airway tone are reversed during overnight nicotine withdrawal (Young et al. 2004).
Wetter et al. found that current smokers were three times more likely to have SA than those who had never smoked but former smokers were no more likely to have the disorder than never-smokers (Wetter et al. 1994).
Pneumonia
Both passive and active smoking increases the risk of developing pneumonia. Possible explanations for the increased risk of infection include increased bacterial adherence, decrease of lung and nasal clearance, and changes in the immune response (Trosini-Desert et al. 2004).
13
2.2.2 Alcohol
Asthma and hayfever
Alcoholic drinks are capable of triggering allergic responses, including hayfever and asthma. This may be due to sensitivities to specific components in alcoholic beverages, such as the sulfite additives in wine (Vally & Thompson 2003).
Sleep apnoea
Alcohol has been demonstrated to increase nasal and pharyngeal resistance in subjects who are awake. Experiments in which patients were given a defined quantity of alcohol prior to bedtime have demonstrated increased resistance and greater levels of nasal pressure from CPAP devices needed to prevent apnoeas (Young et al. 2002a).
Pneumonia
There is increasing evidence that alcohol misuse causes several conditions in the respiratory system that amplify the risk of serious pneumonia (Sisson et al. 2005). The altering of normal respiratory functions includes:
• increased colonisation of the airways by infectious organisms
• blunted cough and gag reflexes that are a protective mechanisms against infectious organisms reaching deeper into the respiratory system
• decreased mucociliary clearance (see Box 2.1)
• impaired alveolar macrophage (see Box 2.1) and functioning of epithelial cells (the cells that line internal surfaces of the lung) (Joshi & Guidot 2007).
Box 2.1: Mucociliary clearance and alveolar macrophages
Mucociliary clearance
Mucociliary clearance is the coordinated rapid, rhythmic beating of cilia (small hair-like projections that line portions of the airway), that propels mucus and particles trapped in the mucus away from the lung.
Alveolar macrophages
Alveolar macrophages are cells within the tissues of the lung, originating from specific white blood cells. They engulf and digest invading micro-organisms and debris. They also stimulate the immune system to respond to the invading micro-organisms.
2.2.3 Exercise
Asthma
Physical exertion involved in exercising is a common trigger of acute episodes of asthma. The exact mechanism involved in exercise-induced asthma is not fully known, although it is believed that heat exchange and/or moisture loss are involved (Lacroix 1999). That is, the

14
drying and/or cooling of the airways leads to changes in the airway mucosa, limitation of the airflow and possibly the release of inflammatory mediators.
2.3 Indoor allergens and air pollutants A dwelling’s internal environment is unique, depending on its location, age, design, constituent and content materials and the number and activities of the inhabitants. Each dwelling contains pollutants that, to varying degrees, may act as allergens, irritants or toxins (Spengler et al. 1994). Major indoor air pollutants include house dust (dust mites, pet dander, cockroaches, fungi and bacteria), combustion by-products (nitrogen and sulphur compounds and fine inhalable particles) and volatile organic compounds (for example, formaldehyde) (Ostro et al. 1994).
2.3.1 House dust
House dust contains numerous organic and inorganic compounds, including hair, smoke, dirt, fibres, mould spores, pollen grains, insects, mites, mammalian danders (small scales from the skin or hair) and the secreta (for example, saliva) and excreta (for example, faeces) of insects, mites and pets.
Asthma and hayfever
A number of house dust constituents act as allergens for asthma and hay fever:
• The most likely sources of dust-induced allergy are the bodies, secreta and excreta of house dust mites. Allergy to house dust mite allergen is a common risk factor for asthma in Australia, particularly when the exposure occurs at an early age (Rutherford & Eigeland 2000).
• The secreta, excreta and dander of domestic pets are allergens that can trigger asthma and hayfever in sensitised people. Cat allergen is widely regarded as a particularly strong allergen (Ostro et al. 1994). Sebum, which is deposited on the skin or fur from the sebaceous glands, causes the allergy. The sebaceous glands are found under the skin of mammals in fur or hair covered areas. Sebum acts to protect and waterproof skin and hair.
• Cockroach allergen exposure is a predisposing and triggering factor for asthma. Exposure to high levels of cockroach allergen has been shown to increase the risk of sensitisation to cockroaches (Sporik et al. 1999) and the development of asthma (Arruda et al. 2001).
• Fungi, such as moulds and yeasts, are potential indoor airborne allergens. Cladosporium and Penicillium are fungi that have been associated with exacerbation of asthma (Dharmage et al. 2001).
15
2.3.2 Combustion by-products
Inhalable particles are produced from cooking and heating activities in the home. Cooking and heating also produce gases, such as sulphur dioxide (SO2) and nitrogen dioxide (NO2) (Katsouyanni 2003; Australian State of the Environment Committee 2001; Denison et al. 2001).
Asthma
Exposure to these pollutants can irritate the airways, triggering asthma episodes (Katsouyanni 2003).
2.3.3 Volatile organic compounds
Volatile organic compounds (VOCs) are organic chemical compounds that have high enough vapor pressures under normal conditions to significantly vaporise and enter the atmosphere. Products that emit VOCs include paint, paint strippers, cleaning supplies, pesticides, glues and adhesives, building materials and furnishings (Samet et al. 1989).
Asthma
Once sensitised, individuals can respond to very low concentrations of VOCs (Arif & Shah 2007). Formaldehyde is a common VOC that has many uses and is found commonly in building materials, furnishings and fabrics. Airborne formaldehyde irritates the upper and lower respiratory tract, causing symptoms that are usually temporary but may be associated with hypersensitivity and asthma exacerbation (Golding & Christensen 2000).
COPD
VOCs have been linked with exacerbating COPD (World Health Organization (WHO) 2007).
Chronic sinusitis and hayfever
Chronic sinusitis and hayfever can be worsened by indoor irritants, such as VOCs (Jedrychowski & Flak 1998; Kunzli et al. 2000; Katsouyanni 2003; Newman 2008).
Pneumonia
A history of regular exposure to fumes from solvents, paints, or petrol at home is associated with a greater risk of pneumonia hospitalisation (Loeb et al. 2009).
2.4 Outdoor allergens and air pollutants Many of the allergens and irritants encountered indoors—such as moulds, sulphur dioxide, nitrogen dioxide and inhalable particles—are also present outdoors. The relative concentrations of these pollutants depend on many factors, including the weather, pollution source and human activities while outdoors. In the case of inhalable particles, the pollution source also influences the size and chemical constitution of the particles. Other allergens, such as pollen, are most likely encountered outdoors.
16
2.4.1 Pollens
Pollen is the term commonly applied to the microspores of seed-producing plants.
Asthma and hayfever
Pollen from trees, grasses and weeds can trigger episodes of hayfever and asthma (Gilmour et al. 2006).
Box 2.2: Perennial and seasonal hayfever
Hayfever that occurs year-round, usually due to exposure to allergens, such as dust mites and pet dander, is referred to as perennial allergic rhinitis. Seasonal allergic rhinitis is allergic rhinitis that occurs as a response to the seasonal release of particular types of pollen. In Australia, most seasonal allergic rhinitis occurs in spring and early summer. In spring, most allergic rhinitis is due to imported exotic grasses, such as perennial ryegrass and couch (Bermuda) grass, rather than to native plants.
2.4.2 Ambient air pollution
Ambient outdoor air pollution consists of a broad range of chemical compounds, as well as coarse and fine inhalable particles.
The fine particles originate from combustion sources, such as motor vehicle exhaust, smoke from bushfires and home heating, and emissions from industry. Diesel engines in particular are a major source of fine-particle pollution.
Larger particles include wind-blown dust and emissions from mining activities (Australian State of the Environment Committee 2001).
Ozone (O3) is a major component of photochemical smog. It is a secondary pollutant that is formed by the reactions of ultraviolet sunlight and primary pollutants, such as NO2 and VOCs (Australian State of the Environment Committee 2001).
Asthma and COPD
Studies have shown a relationship between outdoor ambient air pollution and increasing asthma and COPD episodes (Denison et al. 2001; Morgan et al. 1998).
Hayfever and sinusitis
An association between poorer air quality (increased carbon monoxide, nitrous dioxide, sulfur dioxide, and particulate matter) and worsening of hayfever and sinusitis has been found in some studies (Bhattacharyya 2009; Krämer et al. 2000).
Bronchiectasis and pneumoconiosis
High levels of indoor and outdoor pollutants adversely affect lung function and worsen the symptoms of bronchiectasis and pneumoconiosis (Newman 2008).

17
Cystic fibrosis
Exposure to particulate air pollution has been associated with an increased risk of pulmonary exacerbations and a decline in lung function in cystic fibrosis patients (Goss et al. 2004; Rosenstein 2008).
Pneumonia
There is evidence to suggest that higher levels of ambient air pollutants increase the risk of hospital admissions for pneumonia (Chiu et al. 2009).
2.4.3 The weather
Asthma
The weather can exert an important effect by exacerbating and prolonging periods of air pollution.
Thunderstorm asthma is a phenomenon whereby asthma exacerbations follow severe storms. One theory is that moisture causes pollen grains to break apart and release inhalable starch granules, that may lead to an allergic response in sensitised individuals. Another explanation is that pollen and other inhalable allergens are carried ahead of thunderstorms by gusting winds caused by the outflow of cold air from the storm (Marks et al. 2001).
2.5 Occupational exposures
2.5.1 Asthma
About 9–15% of new cases of adult asthma can be attributed to exposures at work (Kogevinas et al. 2007). This type of asthma is often referred to as occupational asthma. The actual proportion of people in Australia who have occupational asthma is unknown but is likely to vary across the country due to differing work conditions and contexts.
Workplace exposure may aggravate the symptoms of people with pre-existing asthma. There are 300 to 400 substances found in the workplace that can contribute to the onset or exacerbation of asthma. It may occur in direct response to an irritant, such as fumes, vapours, gases, biological enzymes, dusts and fibres, or it may be due to long-term sensitisation to substances such as aldehydes, animal proteins, latex and dust from woods (Lombardo & Balmes 2000).
2.5.2 Hay fever and chronic sinusitis
Occupational exposure has been associated with an increased risk of new-onset allergic rhinitis in adults and aggravating current allergic rhinitis (Radon et al. 2008; Castano & Theriault 2006). These irritants may be in different forms (for example, fumes, dust, vapours and gases) and of different types (for example,. chlorine, ammonia, glutaraldehyde and wood dust) (Castano & Theriault 2006).
18
Cases have also been reported of sinusitis worsening due to exposure to irritants, such as pharmaceuticals and acrylates in the workplace (Savonius et al. 2006).
2.5.3 COPD
Occupational exposure to inhaled irritants can cause an accelerated rate of decline in lung function in patients who already have COPD. Some of the occupations where workers are susceptible to exposures include plastic, textile, rubber, leather and food product manufacturing, transportation, automotive repair, agriculture, construction, cleaning, hairdressing, the armed forces and health care (Buist et al. 2007; Mannino & Buist 2007; Mannino et al. 2001).
2.5.4 Pneumoconiosis
Pneumoconiosis is predominately caused by prolonged exposure to large amounts of dust in the workplace. The causal agent/s, if known, allow differentiation of pneumoconiosis into a number of types. These include coal workers’ pneumoconiosis, asbestosis, silicosis, hard metal lung disease, mixed dust, graphitosis, berylliosis and talcosis (Smith & Leggat 2006; Yucesoy & Luster 2007; Chong et al. 2006).
2.5.5 Bronchiectasis
Inhaling toxic substances that injure the airways, such as noxious fumes, gases, and injurious dust (for example, silica and coal dust) can cause or worsen bronchiectasis (Kilburn 1984).
2.5.6 Pneumonia
Exposure to gases, fumes, or chemicals at work increases the risk of pneumonia hospitalisations (Loeb et al. 2009).
2.6 Dietary factors
2.6.1 Asthma
Asthma symptoms can result from intolerance to chemicals added to food, such as sulfites (added to foods such as wine and sauces as a preservative) (National Asthma Council Australia 2006).
Low levels of antioxidant vitamins, omega-3 fatty acids and magnesium are thought to play a role in the inflammatory reactions and airway hyperconstriction characteristic of asthma. High consumption of omega-6 oils, processed foods and salt may also play roles (Romieu et al. 2002).
Salicylates, made in all plants to fend off soil bacteria and pests, are also implicated.
The evidence for monosodium glutamate (MSG) and tartrazine, implicated as a trigger for asthma, is inconclusive (Food Standards Australia and New Zealand, 2003).
19
2.7 Excess body weight
2.7.1 Asthma
Epidemiological studies have linked obesity with the development and severity of asthma, both in children and adults (Warner 2009; Sin & Sutherland 2008). However, it remains uncertain whether this relationship is causal or based on a common pre-existing cause (Sin & Sutherland 2008).
2.7.2 COPD
For people with COPD, obesity may increase the severity of the disease (Watson et al. 2006).
2.7.3 Sleep apnoea
Excess body weight is thought to affect breathing through changing upper airway structure and function. Several studies have looked at the effect of weight loss on the severity of SA and found that weight loss reduces the number of respiratory disturbances in patients (Young et al. 2002a; Peppard et al. 2000a; Tishler et al. 2003; Yee et al. 2007). In addition, studies looking at weight gain have found that even moderate increases in weight increase the risk of obstructive SA (Newman 2008; Pack 2006).
2.8 Medication
2.8.1 Asthma and hayfever
Some pharmaceuticals, as well as complementary and alternative medicines, can cause allergic reaction, chemical intolerance or an adverse pharmacological reaction leading to asthma symptoms. For example, both royal jelly and echinacea have been linked to allergy-induced asthma (Leung et al. 1997; Mullins & Heddle 2002).
The beta blockers, used in the prevention of heart arrhythmias and attack, are a pharmacological trigger of bronchoconstriction in people with asthma.
Aspirin has been reported to induce allergic rhinitis and asthma, known as aspirin-sensitive asthma/rhinitis (Swierczynska et al. 2003; Morwood et al. 2005).
2.9 Infectious diseases People with chronic respiratory conditions who contract a respiratory infection are at a higher risk of adverse health outcomes. Infection increases the risk of hospitalisations across all age groups and death in older age groups.
20
2.9.1 Asthma and COPD
Specific organisms have been implicated in causing asthma and COPD exacerbations, to a lesser or greater degree in different age groups.
The most common exacerbating infections are (Singh & Busse 2006):
Influenza: people with asthma and COPD are at high risk of complications from influenza. (For more information on influenza and its relationship with asthma and COPD, refer to Chapter 7).
Respiratory syncytial virus (RSV): a cause of lower respiratory tract infection in patients of all ages but most prominently in infancy and childhood (Arruda et al. 2007).
It is the severity of the lower airway injury induced by RSV, such as the development of bronchiolitis, that is thought to influence the emergence of asthma (Lemanske 2003).
Rhinoviruses: the primary cause of the common cold and the most common precipitator of acute asthma in children from 2 years of age (European Respiratory Society and European Lung Foundation 2003).
Mycoplasmas: a genus of bacteria characterised by a lack of a cell wall. Without a cell wall, many common antibiotics that target cell wall synthesis do not affect them.
Chlamydia pneumoniae: bacteria that causes a variety of respiratory tract illnesses, including sore throat, sinusitis, acute bronchitis, and pneumonia.
Asthma and COPD exacerbations rise and fall along with seasonal patterns of respiratory infections. Consistent with this seasonality, older Australians face an increased risk of hospitalisation and death later in winter (ACAM 2008). The relationship between respiratory infections, asthma and COPD is further discussed in chapters 6 and 7.
2.9.2 Bronchiectasis and pneumoconiosis
Respiratory infections, including bacterial, viral and fungal infections, are noted as possible causes of bronchiectasis (Morrissey & Evans 2003).
Infection can also lead to a further loss of functioning lung tissue in bronchiectasis or pneumoconiosis patients (McGuinness & Naidich 2002; Donaldson et al. 2008).
2.9.3 Sinusitis and hayfever
Viral respiratory infections may affect the paranasal sinuses, predisposing infected individuals to the development of subsequent acute bacterial sinusitis (Osur 2002).
Non-allergic rhinitis is usually the result of upper respiratory infection, such as streptococcal, pneumococcal, and staphylococcal infections (Meltzer et al. 2008; Effat & Madany 2009; Desrosiers 2009; Brouard et al. 2009).
Allergic rhinitis symptoms may worsen with viral or bacterial infections (Meltzer et al. 2008; Desrosiers 2009). Additionally, fungal allergies are considered risk factors for rhinitis (Slavin et al. 2005).

21
2.9.4 Cystic fibrosis
Respiratory infections can severely complicate the symptoms in cystic fibrosis patients. The principal cause of death in patients with cystic fibrosis is infection by Pseudomonas aeruginosa bacteria (Drenkard & Ausubel 2002).

22
3. Asthma
Asthma is a chronic disease marked by episodes of wheezing, chest tightness and shortness of breath. These symptoms are associated with widespread narrowing of the airways within the lungs and obstruction of airflow. Symptoms are usually reversible, either spontaneously or with treatment.
The severity of asthma ranges from mild, intermittent symptoms, causing few problems for the individual, to severe and persistent wheezing and shortness of breath. It severely impairs quality of life and may be life-threatening.
Asthma is not a major cause of death, with only about 400 deaths in Australia in 2006. Nevertheless, the disease causes particular problems in children, for whom it is a frequent reason for medication, visits to GPs, admission to hospitals and emergency departments. Older people, in whom the disease often overlaps with COPD, also suffer considerably from asthma. For these reasons, asthma is a substantial contributor to health care expenditure in Australia (more detailed analysis of health care expenditure can be found in Appendix B).
About 50% of asthma cases develop in early childhood (Flattery et al. 2006). Some young children with mild and occasional episodes of wheezing or cough, particularly those who do not have allergies, have a self-limiting disease that resolves in later childhood. For some of the people who develop asthma in adulthood, the disease can be attributed to exposure to specific substances in the workplace. Evidence from overseas suggests that the proportion may be between 9 and 15% (Kogevinas et al. 2007).
The underlying problem in asthma is chronic inflammation of the airways, associated with sensitivity (hyperresponsiveness) to allergens and irritants. When stimulated, the airways tend to overreact by narrowing too easily and too much. This contraction of smooth muscles in the airways, along with the release of secretions or fluid (oedema) from the airway walls, results in narrowed airways and reduced airflow to the lungs.
This chapter provides key statistics relating to asthma in Australia. A more detailed discussion of the disease can be found in the national asthma monitoring report Asthma in Australia 2008 (ACAM 2008).
3.1 General epidemiology
3.1.1 Prevalence
Australia has a high prevalence of asthma compared with other countries (ACAM 2008). The best source of national prevalence estimates are the National Health Surveys (NHS).
A number of state-based surveys to identify people with asthma have also been conducted over the past decade. Studies vary in the type of questions asked and the size and selection of the sample, making it difficult to compare findings.
The 2004–05 NHS asked respondents if they had ever been told by a doctor or nurse they had asthma and, if so, whether or not they still had asthma. Results suggest that the prevalence of asthma in Australia rose from 7.8% in 1989–90 to slightly over 11% in 1995 and 2001 (11.1% and 11.6% respectively) and fell to 10.2% in 2004–05.
23
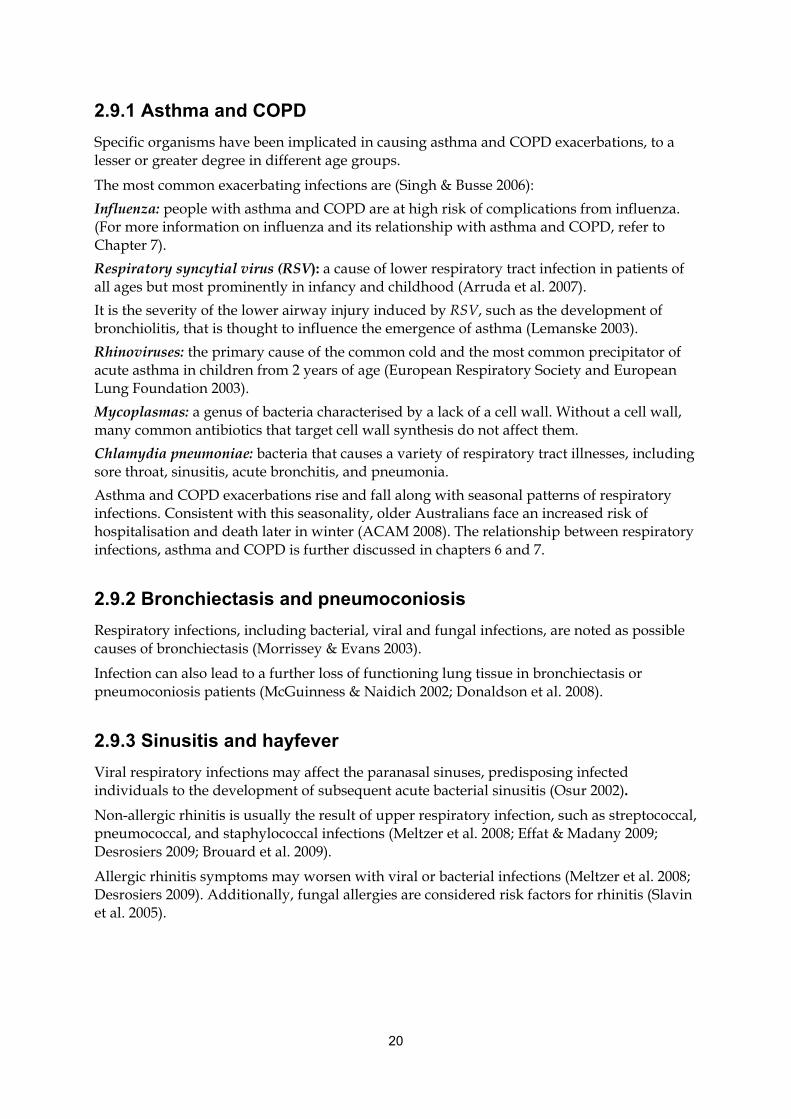
Age-specific prevalence rates for asthma in 2004–05 were highest in those aged less than 25 years (Figure 3.1). This included 12% of children aged less than 15 years.
Over all ages, asthma was slightly more prevalent in females (11.5%, 95% confidence interval (CI): 10.8–12.2) than in males (9%, 95% CI: 8.3–9.5). However, among those aged under 15 years, the prevalence was higher among boys than girls. This was most marked in the 10–14 years age group.
Indigenous Australians and other specific population groups
The National Aboriginal and Torres Strait Islander Health Survey indicated that 16.5%(95% CI: 14.9–18.1) of Indigenous Australians had asthma in 2004–05 (ABS 2006b). This was substantially higher than the prevalence for non-Indigenous Australians (10.2%, 95% CI: 9.7–10.7).
In particular, the prevalence was higher among Aboriginal and Torres Strait Islander females (19.9%, 95% CI: 17.8–22.0) than among non-Indigenous females (11.4%, 95% CI: 10.7–12.1) (ACAM 2008). For females aged 35 years or over, the difference in prevalence was even greater (22% versus 11%).
People from non-English-speaking backgrounds had a lower prevalence of asthma than those from English-speaking backgrounds. Asthma was considerably less prevalent among people who spoke a language other than English at home (4.3%) than among people who spoke English at home (10.4%)(ACAM 2008).
Some researchers (for example, Aligne et al. 2000) suggest that these differences in prevalence do not necessarily point to asthma being an ethnically linked genetic disease. Rather, the differences may be associated with socioeconomic factors and varying exposure to environmental factors, such as dust, tobacco smoke and diet.
50
70
90
110
130
150
170
0–4 5–9 10–14 15–19 20–24 25–29 30–34 35–39 40–44 45–49 50–54 55–59 60–64 65–69 70–74 75–79 80–84 85+
Age group (years)
Males
Persons
Females
Number per 1,000 population
Note: See Appendix A, Table A3.1 for source data.
Source: AIHW analysis of ABS 2004–05 National Health Survey CURF.
Figure 3.1. Prevalence of asthma by age and sex, 2004–05
24
3.1.2 Mortality
Asthma is not a common cause of death in Australia. In 2006, asthma was identified as the underlying cause of 402 deaths (139 males and 263 females). Preliminary data identifies a lower number; 371 deaths (126 males and 245 females) during 2007, but this may change when final data become available.
Box 3.1: Types of causes of death
An underlying cause of death is the condition that is believed to have initiated the train of events leading to death.
Associated cause(s) of death are all the other causes of death listed on the death certificate. These include the last stated cause before death, causes leading up to this final cause and any other causes considered contributory to the death.
Despite high prevalence and hospital use in the younger age groups, deaths attributed to asthma increase with age, with very few deaths in childhood. The death rate among children aged 0–14 years was less than 1.0 death per 100,000 population in 2006. The rate remained low for those in early and middle adult life but was markedly higher in those over 79 years, peaking at 44 deaths per 100,000 persons in the 85 years and over age group.
The presence of comorbidities, such as COPD, often complicates deaths from asthma among older people. The similarity in symptoms can make attributing the actual cause of death problematic. For this reason, Fact sheet 2 in Appendix C includes the proportion of deaths among those aged 5–34 years, in whom the attribution of death to asthma is more certain (ACAM 2008). Nevertheless, in 2006, those whose underlying cause of death was attributed to asthma died, on average, about 5 years younger than those whose underlying cause of death was COPD.
In addition to the 402 deaths in 2006 where asthma was registered as the underlying cause, asthma was registered 853 times as an associated cause.
In terms of trends, between 1979 and 2006 the asthma death rate peaked at just over 5 deaths per 100,000 persons in 1985 (Figure 3.2). Since 1989, the death rate has decreased to fewer than 2 deaths per 100,000 persons.
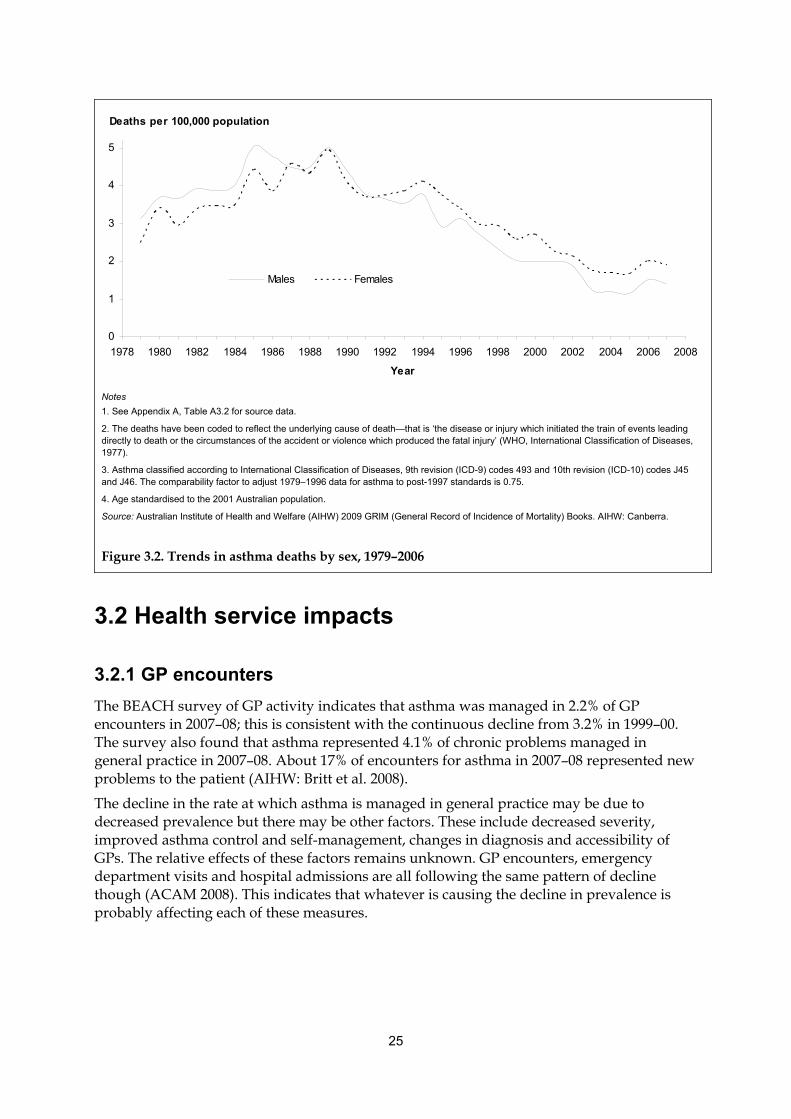
25
0
1
2
3
4
5
1978 1980 1982 1984 1986 1988 1990 1992 1994 1996 1998 2000 2002 2004 2006 2008
Year
Males Females
Deaths per 100,000 population
Notes
1. See Appendix A, Table A3.2 for source data.
2. The deaths have been coded to reflect the underlying cause of death—that is ‘the disease or injury which initiated the train of events leading directly to death or the circumstances of the accident or violence which produced the fatal injury’ (WHO, International Classification of Diseases, 1977).
3. Asthma classified according to International Classification of Diseases, 9th revision (ICD-9) codes 493 and 10th revision (ICD-10) codes J45 and J46. The comparability factor to adjust 1979–1996 data for asthma to post-1997 standards is 0.75.
4. Age standardised to the 2001 Australian population.
Source: Australian Institute of Health and Welfare (AIHW) 2009 GRIM (General Record of Incidence of Mortality) Books. AIHW: Canberra.
Figure 3.2. Trends in asthma deaths by sex, 1979–2006
3.2 Health service impacts
3.2.1 GP encounters
The BEACH survey of GP activity indicates that asthma was managed in 2.2% of GP encounters in 2007–08; this is consistent with the continuous decline from 3.2% in 1999–00. The survey also found that asthma represented 4.1% of chronic problems managed in general practice in 2007–08. About 17% of encounters for asthma in 2007–08 represented new problems to the patient (AIHW: Britt et al. 2008).
The decline in the rate at which asthma is managed in general practice may be due to decreased prevalence but there may be other factors. These include decreased severity, improved asthma control and self-management, changes in diagnosis and accessibility of GPs. The relative effects of these factors remains unknown. GP encounters, emergency department visits and hospital admissions are all following the same pattern of decline though (ACAM 2008). This indicates that whatever is causing the decline in prevalence is probably affecting each of these measures.
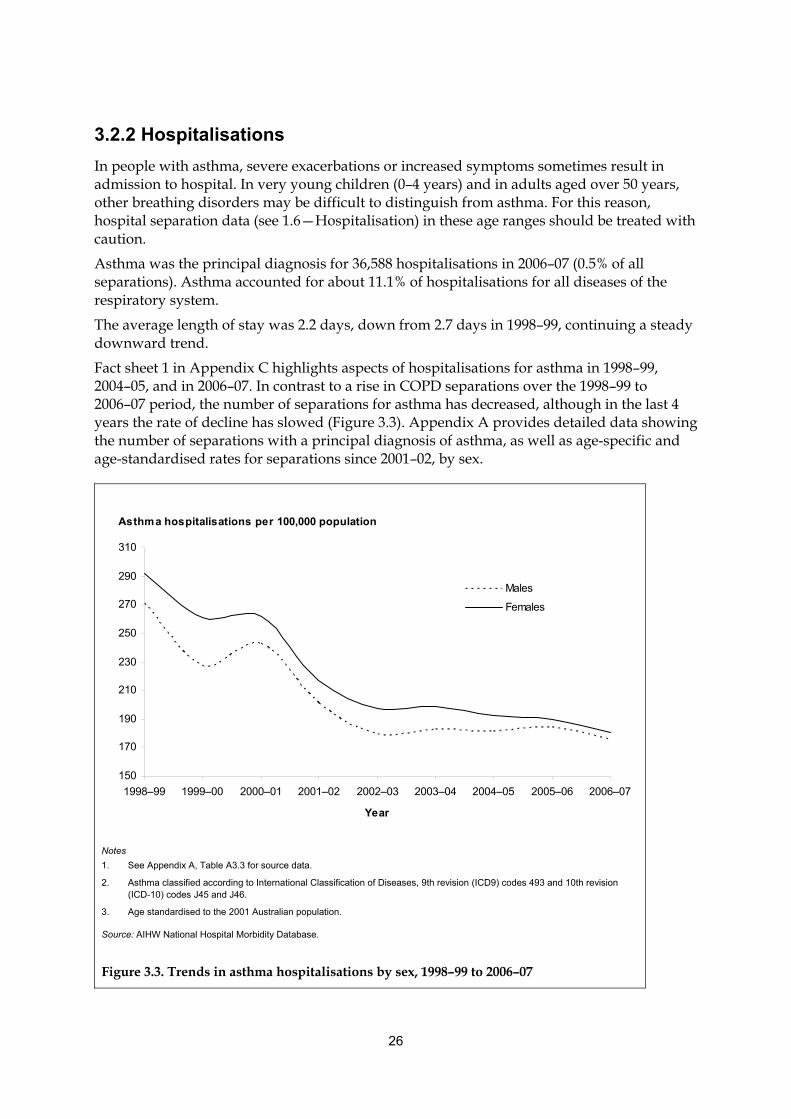
26
3.2.2 Hospitalisations
In people with asthma, severe exacerbations or increased symptoms sometimes result in admission to hospital. In very young children (0–4 years) and in adults aged over 50 years, other breathing disorders may be difficult to distinguish from asthma. For this reason, hospital separation data (see 1.6—Hospitalisation) in these age ranges should be treated with caution.
Asthma was the principal diagnosis for 36,588 hospitalisations in 2006–07 (0.5% of all separations). Asthma accounted for about 11.1% of hospitalisations for all diseases of the respiratory system.
The average length of stay was 2.2 days, down from 2.7 days in 1998–99, continuing a steady downward trend.
Fact sheet 1 in Appendix C highlights aspects of hospitalisations for asthma in 1998–99, 2004–05, and in 2006–07. In contrast to a rise in COPD separations over the 1998–99 to 2006–07 period, the number of separations for asthma has decreased, although in the last 4 years the rate of decline has slowed (Figure 3.3). Appendix A provides detailed data showing the number of separations with a principal diagnosis of asthma, as well as age-specific and age-standardised rates for separations since 2001–02, by sex.
Asthma hospitalisations per 100,000 population
150
170
190
210
230
250
270
290
310
1998–99 1999–00 2000–01 2001–02 2002–03 2003–04 2004–05 2005–06 2006–07
Year
Males
Females
Notes
1. See Appendix A, Table A3.3 for source data.
2. Asthma classified according to International Classification of Diseases, 9th revision (ICD9) codes 493 and 10th revision (ICD-10) codes J45 and J46.
3. Age standardised to the 2001 Australian population.
Source: AIHW National Hospital Morbidity Database.
Figure 3.3. Trends in asthma hospitalisations by sex, 1998–99 to 2006–07
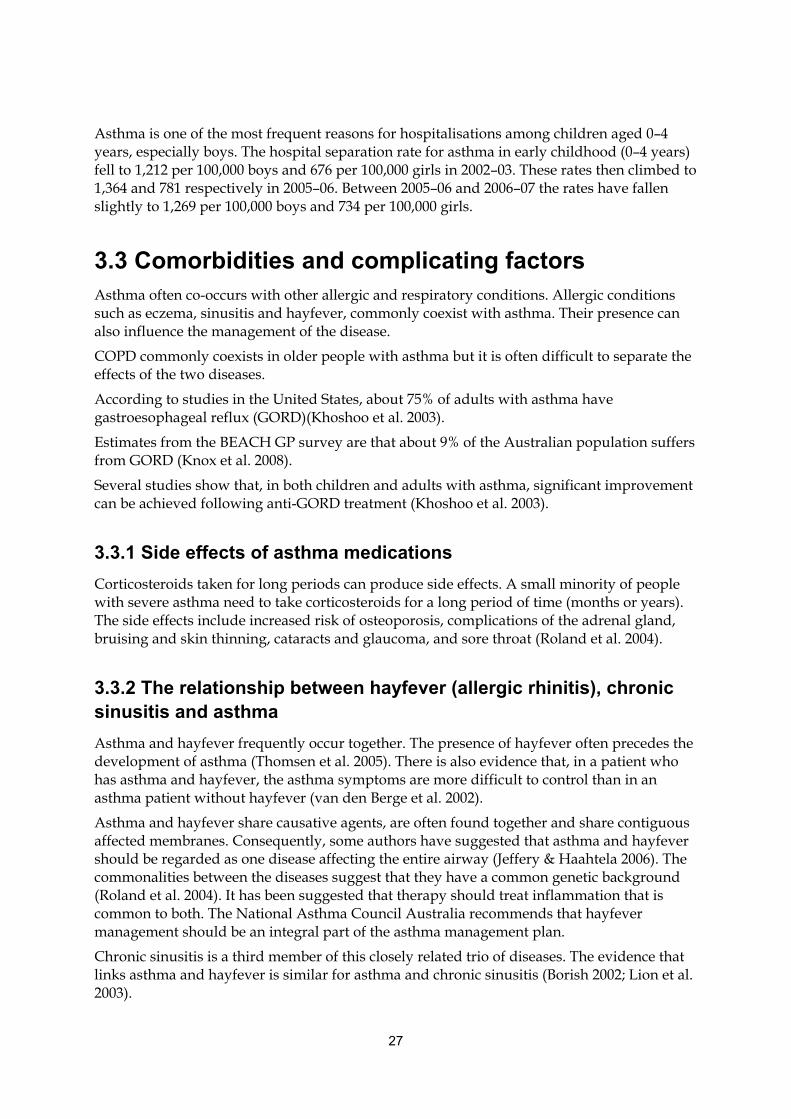
27
Asthma is one of the most frequent reasons for hospitalisations among children aged 0–4 years, especially boys. The hospital separation rate for asthma in early childhood (0–4 years) fell to 1,212 per 100,000 boys and 676 per 100,000 girls in 2002–03. These rates then climbed to 1,364 and 781 respectively in 2005–06. Between 2005–06 and 2006–07 the rates have fallen slightly to 1,269 per 100,000 boys and 734 per 100,000 girls.
3.3 Comorbidities and complicating factors Asthma often co-occurs with other allergic and respiratory conditions. Allergic conditions such as eczema, sinusitis and hayfever, commonly coexist with asthma. Their presence can also influence the management of the disease.
COPD commonly coexists in older people with asthma but it is often difficult to separate the effects of the two diseases.
According to studies in the United States, about 75% of adults with asthma have gastroesophageal reflux (GORD)(Khoshoo et al. 2003).
Estimates from the BEACH GP survey are that about 9% of the Australian population suffers from GORD (Knox et al. 2008).
Several studies show that, in both children and adults with asthma, significant improvement can be achieved following anti-GORD treatment (Khoshoo et al. 2003).
3.3.1 Side effects of asthma medications
Corticosteroids taken for long periods can produce side effects. A small minority of people with severe asthma need to take corticosteroids for a long period of time (months or years). The side effects include increased risk of osteoporosis, complications of the adrenal gland, bruising and skin thinning, cataracts and glaucoma, and sore throat (Roland et al. 2004).
3.3.2 The relationship between hayfever (allergic rhinitis), chronic sinusitis and asthma
Asthma and hayfever frequently occur together. The presence of hayfever often precedes the development of asthma (Thomsen et al. 2005). There is also evidence that, in a patient who has asthma and hayfever, the asthma symptoms are more difficult to control than in an asthma patient without hayfever (van den Berge et al. 2002).
Asthma and hayfever share causative agents, are often found together and share contiguous affected membranes. Consequently, some authors have suggested that asthma and hayfever should be regarded as one disease affecting the entire airway (Jeffery & Haahtela 2006). The commonalities between the diseases suggest that they have a common genetic background (Roland et al. 2004). It has been suggested that therapy should treat inflammation that is common to both. The National Asthma Council Australia recommends that hayfever management should be an integral part of the asthma management plan.
Chronic sinusitis is a third member of this closely related trio of diseases. The evidence that links asthma and hayfever is similar for asthma and chronic sinusitis (Borish 2002; Lion et al. 2003).
28
Figure 3.4 illustrates the integral relationship between asthma, hayfever and chronic sinusitis, using estimates from the Australian National Health Survey. In 2004–05 there were about 2 million Australians with asthma, 3.2 million with hayfever and 1.8 million with chronic sinusitis. However, about 700,000 persons had both asthma and hayfever; 400,000 had both asthma and chronic sinusitis; 800,000 had both hayfever and chronic sinusitis; while about 300,000 had the three conditions.
Note: The areas of the components are not to scale.
Source: AIHW analysis of ABS 2004–05 National Health Survey CURF.
Figure 3.4: Australian population with asthma, hayfever and chronic sinusitis (millions (m))
Asthma, hayfever and sinusitis are linked to the structure in the respiratory system where the inflammation occurs. In the bronchioles and trachea, it is the reaction of smooth muscle and the resulting thickening of the wall that characterises the hypersensitivity of asthma. In the nose, it is the prolific blood supply and resulting sensitivity that leads to the symptoms of hayfever. The inflammation of sinusitis manifests itself as a blocking of normal drainage from the fixed, bony, sinus spaces (Box 5.1).
Asthma,
2.0m (10.2%)
Chronic Sinusitis,
1.8m (9.2%) Hayfever,
3.2m (16.1%)
1.2m
(6.2%)
1.9m
(9.9%)
0.9m
(4.5%)
0.1m
(0.6%)
0.4m
(2.1%)
0.5m
(2.8%)
0.3m
(1.3%)

29
4. Hayfever (allergic rhinitis)
Hayfever, clinically referred to as allergic rhinitis, is an allergic inflammation of the membranes lining the upper airways (particularly the nose), resulting from contact with allergens. Common allergens include airborne particles of dust, pet dander and pollens. The symptoms include runny nose, nasal obstruction, nasal itching and sneezing. The eyes are also commonly involved in the symptoms. The throat can be affected either directly by an allergic response or by irritation by drainage from the nasal passages.
Hayfever is a global health problem and extremely common. Australia has a particularly high prevalence, as do New Zealand and the United Kingdom (Bousquet et al. 2001).
Although hayfever is not usually a severe disease, it can significantly affect the life of patients, including performance at school and work.
4.1 General epidemiology
4.1.1 Prevalence
Based on self-reports in the National Health Survey (NHS), about 3.2 million people (16.1% of the population) had hayfever as a long-term condition in 2004–05. Hayfever was slightly more common among females (17.2%) than males (15.0%). In males it was most common among those aged 35–39 years, whereas in females it was most common in those aged 20–24 years (Figure 4.1).
0
50
100
150
200
250
0–4 5–9 10–14 15–19 20–24 25–29 30–34 35–39 40–44 45–49 50–54 55–59 60–64 65–69 70–74 75–79 80–84 85+
Age group
Females
Persons
Males
Estimate of persons with hayfever per 1,000 population
Note: See Appendix A, Table A4.1 for source data.
Source: AIHW analysis of ABS 2004–05 National Health Survey CURF.
Figure 4.1: Prevalence of hayfever, by age and sex, 2004–05
30
4.1.2 Mortality
Less than 10 deaths are attributed to hayfever in Australia each year.
4.2 Health service impacts In contrast to its high prevalence, hayfever is not a common problem encountered in general practice—it was managed in less than 1% of GP encounters in 2007–08 (AIHW: Britt et al. 2008). In the 1999–2000 survey of general practice, about one-third of people with hayfever were using medication for their condition and about half of those using medication were using intranasal corticosteroid (AIHW: Britt et al. 2007b). As there is significant overlap between hayfever and sinusitis in terms of how they are managed in hospital, the hospital impacts for hayfever are described in Chapter 5 jointly with chronic sinusitis. The comorbidities of hayfever are described in section 3.3.2.

31
5. Chronic sinusitis
Chronic sinusitis is the inflammation of the lining of one or more of the sinuses (Box 5.1). It occurs when the normal draining of the sinuses is obstructed by swelling of the nasal mucus membrane, excessive mucus production or an anatomical abnormality (Durand et al. 1998). The obstruction can lead to bacterial infection and further inflammation of the mucus membranes within the sinuses.
Box 5.1: The sinuses
The sinuses are air-filled spaces within the bones around the nose. They produce mucus that picks up dust particles, bacteria and other air pollutants as it flows through the spaces and into the nasal cavity. The flow continues to the throat, aided by the action of cilia, where it is swallowed. Ultimately stomach acids destroy the trapped pollutants.
Typical symptoms of chronic sinusitis include pressure-like pain on the forehead, temples, cheeks, nose or around the eyes; difficulty breathing through the nose; abnormal nasal drainage (thick yellow or yellow-green); and reduced sense of smell or taste. Having too much or too little air in the sinuses or the swelling of the mucus membranes themselves causes the pain associated with this disorder. People with chronic sinusitis often have stable, minor symptoms interspersed with episodes of acute sinusitis (Durand et al. 1998).
Sinusitis can be classified according to the duration or frequency of the signs and symptoms. For example, acute sinusitis lasts for less than 4 weeks; subacute sinusitis lasts for 4 to 8 weeks; chronic sinusitis lasts for more than 8 weeks; and recurrent sinusitis involves 3 or more episodes within a year (Slavin et al. 2005). Many simply define chronic sinusitis as sinusitis that recurs frequently or lasts for a prolonged period of time (such as 3 months or more).
5.1 General epidemiology
5.1.1 Prevalence
Based on self-reports in the National Health Survey, 9.2% of the population (about 1.8 million people) had chronic sinusitis in 2004–05 (down from 10.5% in 2001). This makes chronic sinusitis one of the most frequently reported health conditions in Australia, comparable to asthma. The prevalence was higher among females (10.9%) than males (7.5%). In males, it was most common in those aged 55–59 and almost as common in those aged 75–79. In females, it was most common in those aged 70–74 (Figure 5.1).
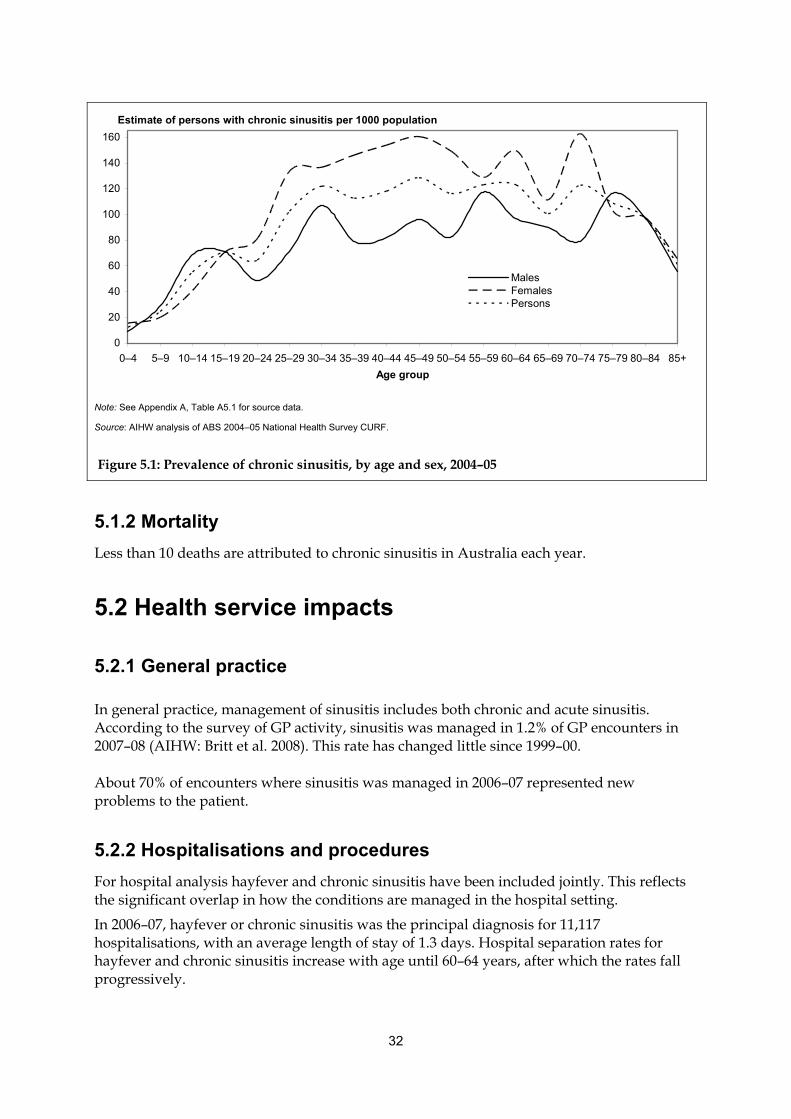
32
5.1.2 Mortality
Less than 10 deaths are attributed to chronic sinusitis in Australia each year.
5.2 Health service impacts
5.2.1 General practice
In general practice, management of sinusitis includes both chronic and acute sinusitis. According to the survey of GP activity, sinusitis was managed in 1.2% of GP encounters in 2007–08 (AIHW: Britt et al. 2008). This rate has changed little since 1999–00.
About 70% of encounters where sinusitis was managed in 2006–07 represented new problems to the patient.
5.2.2 Hospitalisations and procedures
For hospital analysis hayfever and chronic sinusitis have been included jointly. This reflects the significant overlap in how the conditions are managed in the hospital setting.
In 2006–07, hayfever or chronic sinusitis was the principal diagnosis for 11,117 hospitalisations, with an average length of stay of 1.3 days. Hospital separation rates for hayfever and chronic sinusitis increase with age until 60–64 years, after which the rates fall progressively.
0
20
40
60
80
100
120
140
160
0–4 5–9 10–14 15–19 20–24 25–29 30–34 35–39 40–44 45–49 50–54 55–59 60–64 65–69 70–74 75–79 80–84 85+
Age group
MalesFemalesPersons
Estimate of persons with chronic sinusitis per 1000 population
Note: See Appendix A, Table A5.1 for source data.
Source: AIHW analysis of ABS 2004–05 National Health Survey CURF.
Figure 5.1: Prevalence of chronic sinusitis, by age and sex, 2004–05
33
Intranasal maxillary antrostomy, performed 7,535 times in 2006–07, was the most common procedure performed on those with a principal diagnosis of hayfever or chronic sinusitis. It is the surgical creation of a hole in the wall between the nasal passages and the sinus cavity in one or both of the cheeks (maxillary sinuses), for the purposes of draining mucus more freely. The hole created is in addition to the natural drainage passage which is most likely blocked or not operating efficiently, in the patient requiring this procedure.
Sinoscopy or the examination of the sinuses through magnifying lenses was performed on 6,003 occasions, making it the second most common procedure.
Ethmoidectomy was the third most common procedure. It was performed 5,558 times. The ethmoidal sinuses are left and right honeycomb-like structures, located between the eyes. There can be from 5 to 15 cavities in each structure. Ethmoidectomy is the improvement of drainage by the surgical enlargement of holes between the cavities and removing any polyps and uncleared mucus.
When the septum deviates from the center of the nose it narrows one of the nasal cavities, impeding nasal and sinus clearance. Septoplasty is the surgical procedure that straightens the partition between the two nasal cavities (the septum). There were 3,308 septoplasties performed which, disregarding anesthesia, made it the fourth most common procedure.
5.3 Comorbidities and complicating factors Viral infections of the upper respiratory tract are the most common cause of acute sinusitis (Slavin et al. 2005; Durand et al. 1998). Whether or not chronic sinusitis represents cases of untreated or unresolved acute sinusitis is not known with certainty. The exact causes of chronic sinusitis remain unknown and the role of viral infections in chronic sinusitis is uncertain (Slavin et al. 2005).
Inflammation of the middle ear (otitis media) frequently coexists with chronic sinusitis.
Several other comorbidities for chronic sinusitis have been identified and include:
• bacterial infection
• nasal polyps
• enlarged nose bone
• deviated septum
• abscess in the upper jaw
• mucus abnormalities (such as cystic fibrosis)
• nasal tumours and
• psychological stress.
34
6. Chronic obstructive pulmonary disease
Chronic obstructive pulmonary disease (COPD) is a serious, progressive and disabling disease. The sufferer is prone to severe episodes of shortness of breath, with fits of coughing. These conditions are not fully reversible, in contrast to asthma where medication can reverse symptoms or they can reverse naturally.
A variety of respiratory processes may lead to the development of COPD. The most important of these is the destruction of air sacs, attributable to the excessive action of tissue-destructive enzymes. This pathological change is known as emphysema and smoking is its main cause. Occupational exposure to dust and fumes may also play a role.
Scarring, narrowing and disappearance of airways also lead to COPD. This often accompanies emphysema. Many patients with COPD have excessive mucus secretion, leading to chronic cough and sputum (known as chronic bronchitis). This is also attributable to the action of cigarette smoke on the mucus-secreting glands of the airways.
6.1 General epidemiology
6.1.1 Prevalence
The prevalence of COPD is difficult to determine. A precise diagnosis of COPD can only be made by measuring the clinical parameters of the functioning lung (known as spirometry). However, spirometry is usually only undertaken, in the case of COPD, when the disease is substantially progressed and the patient has a restricted lifestyle. Under these circumstances COPD may have been present for decades. Gross underestimates would be obtained if prevalence was based on clinical diagnosis alone.
The largest source, in terms of sample size, of prevalence data for COPD in Australia is the 2004–05 National Health Survey. Respondents were shown prompt cards, listing a number of selected conditions, and asked whether they had any of the listed conditions and whether the conditions had lasted or were expected to last 6 months or more. The conditions used to estimate COPD prevalence included emphysema and bronchitis (not differentiated as acute or chronic). It is assumed that where respondents indicated they had these conditions, their response was based on a medical diagnosis (ABS 2006a).
Using this method of estimation, there were approximately 591,000 persons or 2.9% of the population with COPD in Australia in 2004–05.
COPD is a disease of older age groups. Age-specific rates from the 2004–05 NHS show that before the age of 20, reports of emphysema and bronchitis were between 10 and 20 per 1,000 population. This prevalence in the younger age groups is likely due to respondents reporting acute bronchitis, rather than chronic, as the NHS does not distinguish between the two (Mannino et al. 2001).
The prevalence of COPD based on these NHS estimates was higher among females than males. The 2.9% of the population with COPD was made up of 1.6% females and 1.3% males. Prevalence was 31 per 1,000 females and 27 per 1,000 males.
The prevalence of COPD increased most prominently and consistently for both males and

35
females between the 50–54 (32 per 1,000 persons) and 75–79 (78 per 1,000 persons) age groups.
The 2004–05 NHS also showed that COPD was particularly prevalent in men 75 and over compared to women of the same age. Between the ages of 70–74 and 80–84 the male prevalence rate climbed dramatically. The female rate increased to a much lesser degree over these age groups and dropped dramatically after the age of 84. These two effects resulted in a male rate (119 per 1,000 persons) that was five times the female rate (25 per 1,000 persons) in the 85 and over age group (Figure 6.1).
COPD prevalence in older age groups could in fact be higher than estimates from the NHS because symptoms of COPD overlap with symptoms of other respiratory conditions, such as asthma. A diagnosis of another respiratory condition may mask COPD. Also, as previously discussed, COPD is not diagnosed until it is substantially progressed and restricts a person’s daily activities.
Results from the 2004–05 National Aboriginal and Torres Straight Islander Health Survey (NATSIHS) show that COPD was more prevalent in Indigenous Australians than in non-Indigenous Australians. Approximately 3.8% of the Indigenous population reported having current COPD, compared with 3.0% in the non-Indigenous population. The prevalence of COPD in Indigenous females was significantly higher than in Indigenous males (Table 6.1).
According to age-standardised rates, Indigenous people were 1.7 times as likely to report having COPD compared to non-Indigenous Australians (Table 6.2).
0
20
40
60
80
100
120
0–4 10–14 20–24 30–34 40–44 50–54 60–64 70–74 80–84
Age group (years)
Males
Females
Number w ith emphysema/bronchitis per 1,000 population
85+
Note: See Appendix A, Table A6.1 for source data.
Source: AIHW analysis of ABS 2004–05 National Health Survey CURF.
Figure 6.1: Age-specific prevalence of emphysema and/or bronchitis, 2004–05
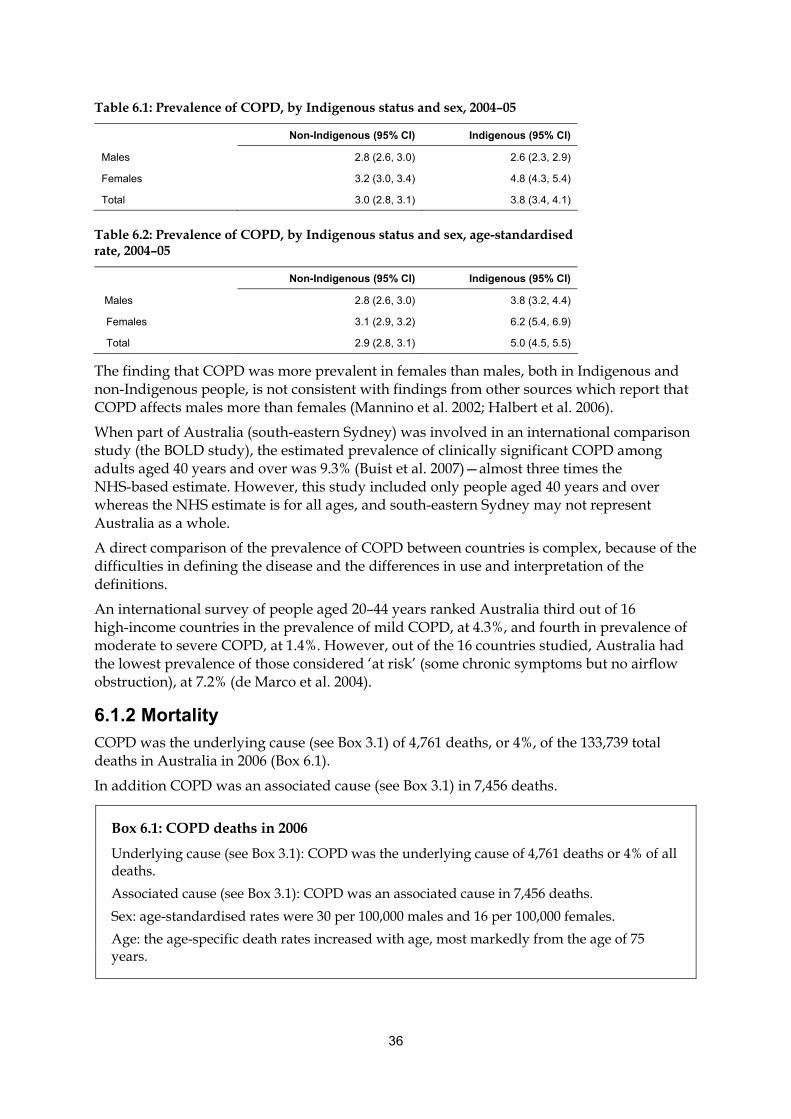
36
Table 6.1: Prevalence of COPD, by Indigenous status and sex, 2004–05
Non-Indigenous (95% CI) Indigenous (95% CI)
Males 2.8 (2.6, 3.0) 2.6 (2.3, 2.9)
Females 3.2 (3.0, 3.4) 4.8 (4.3, 5.4)
Total 3.0 (2.8, 3.1) 3.8 (3.4, 4.1)
Table 6.2: Prevalence of COPD, by Indigenous status and sex, age-standardised rate, 2004–05
Non-Indigenous (95% CI) Indigenous (95% CI)
Males 2.8 (2.6, 3.0) 3.8 (3.2, 4.4)
Females 3.1 (2.9, 3.2) 6.2 (5.4, 6.9)
Total 2.9 (2.8, 3.1) 5.0 (4.5, 5.5)
The finding that COPD was more prevalent in females than males, both in Indigenous and non-Indigenous people, is not consistent with findings from other sources which report that COPD affects males more than females (Mannino et al. 2002; Halbert et al. 2006).
When part of Australia (south-eastern Sydney) was involved in an international comparison study (the BOLD study), the estimated prevalence of clinically significant COPD among adults aged 40 years and over was 9.3% (Buist et al. 2007)—almost three times the NHS-based estimate. However, this study included only people aged 40 years and over whereas the NHS estimate is for all ages, and south-eastern Sydney may not represent Australia as a whole.
A direct comparison of the prevalence of COPD between countries is complex, because of the difficulties in defining the disease and the differences in use and interpretation of the definitions.
An international survey of people aged 20–44 years ranked Australia third out of 16 high-income countries in the prevalence of mild COPD, at 4.3%, and fourth in prevalence of moderate to severe COPD, at 1.4%. However, out of the 16 countries studied, Australia had the lowest prevalence of those considered ‘at risk’ (some chronic symptoms but no airflow obstruction), at 7.2% (de Marco et al. 2004).
6.1.2 Mortality
COPD was the underlying cause (see Box 3.1) of 4,761 deaths, or 4%, of the 133,739 total deaths in Australia in 2006 (Box 6.1).
In addition COPD was an associated cause (see Box 3.1) in 7,456 deaths.
Box 6.1: COPD deaths in 2006
Underlying cause (see Box 3.1): COPD was the underlying cause of 4,761 deaths or 4% of all deaths.
Associated cause (see Box 3.1): COPD was an associated cause in 7,456 deaths.
Sex: age-standardised rates were 30 per 100,000 males and 16 per 100,000 females.
Age: the age-specific death rates increased with age, most markedly from the age of 75 years.
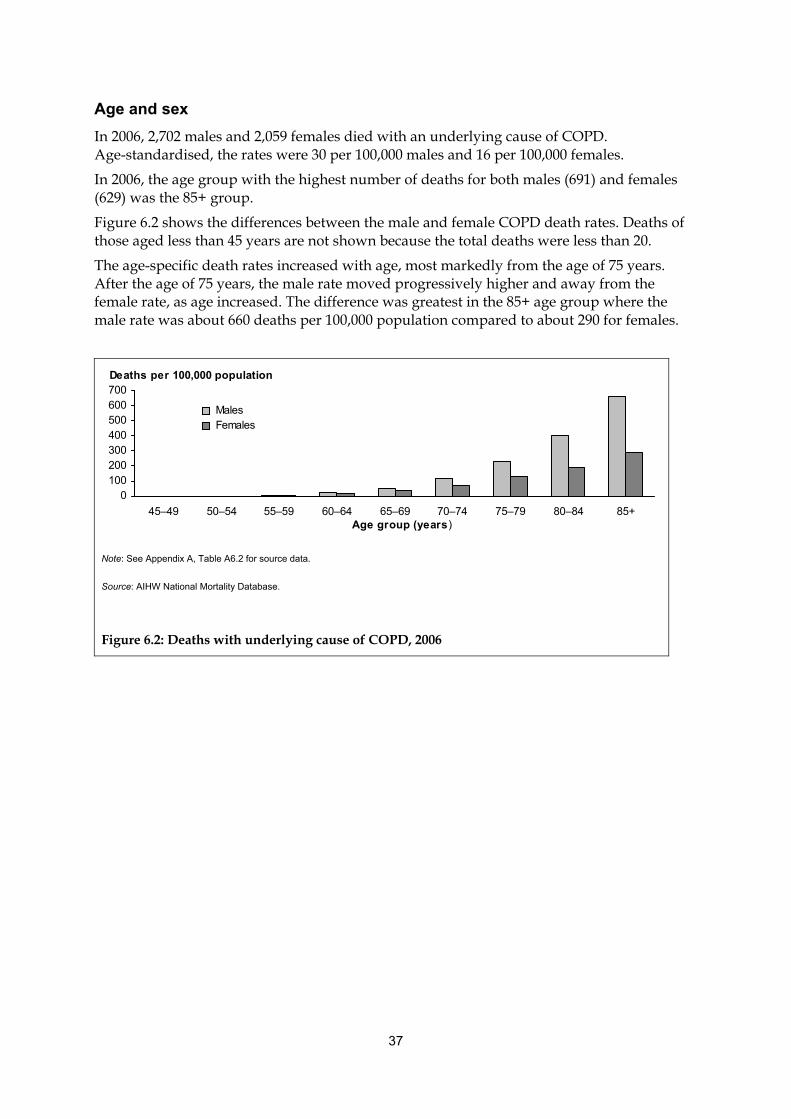
37
Age and sex
In 2006, 2,702 males and 2,059 females died with an underlying cause of COPD. Age-standardised, the rates were 30 per 100,000 males and 16 per 100,000 females.
In 2006, the age group with the highest number of deaths for both males (691) and females (629) was the 85+ group.
Figure 6.2 shows the differences between the male and female COPD death rates. Deaths of those aged less than 45 years are not shown because the total deaths were less than 20.
The age-specific death rates increased with age, most markedly from the age of 75 years. After the age of 75 years, the male rate moved progressively higher and away from the female rate, as age increased. The difference was greatest in the 85+ age group where the male rate was about 660 deaths per 100,000 population compared to about 290 for females.
0100200300400500600700
45–49 50–54 55–59 60–64 65–69 70–74 75–79 80–84 85+Age group (years)
Males Females
Deaths per 100,000 population
Note: See Appendix A, Table A6.2 for source data.
Source: AIHW National Mortality Database.
Figure 6.2: Deaths with underlying cause of COPD, 2006
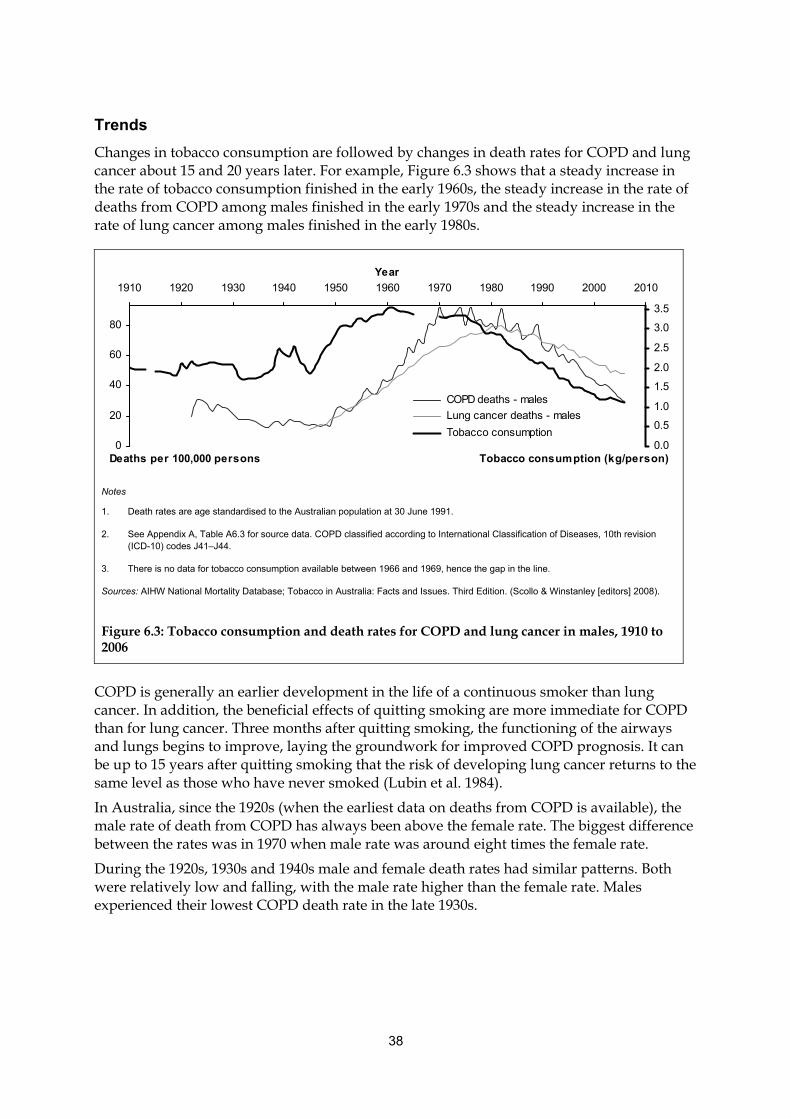
38
Trends
Changes in tobacco consumption are followed by changes in death rates for COPD and lung cancer about 15 and 20 years later. For example, Figure 6.3 shows that a steady increase in the rate of tobacco consumption finished in the early 1960s, the steady increase in the rate of deaths from COPD among males finished in the early 1970s and the steady increase in the rate of lung cancer among males finished in the early 1980s.
COPD is generally an earlier development in the life of a continuous smoker than lung cancer. In addition, the beneficial effects of quitting smoking are more immediate for COPD than for lung cancer. Three months after quitting smoking, the functioning of the airways and lungs begins to improve, laying the groundwork for improved COPD prognosis. It can be up to 15 years after quitting smoking that the risk of developing lung cancer returns to the same level as those who have never smoked (Lubin et al. 1984).
In Australia, since the 1920s (when the earliest data on deaths from COPD is available), the male rate of death from COPD has always been above the female rate. The biggest difference between the rates was in 1970 when male rate was around eight times the female rate.
During the 1920s, 1930s and 1940s male and female death rates had similar patterns. Both were relatively low and falling, with the male rate higher than the female rate. Males experienced their lowest COPD death rate in the late 1930s.
0
20
40
60
80
1910 1920 1930 1940 1950 1960 1970 1980 1990 2000 2010
Year
0.0
0.5
1.0
1.5
2.0
2.5
3.0
3.5
COPD deaths - males
Lung cancer deaths - males
Tobacco consumption
Deaths per 100,000 persons Tobacco consumption (kg/person)
Notes
1. Death rates are age standardised to the Australian population at 30 June 1991.
2. See Appendix A, Table A6.3 for source data. COPD classified according to International Classification of Diseases, 10th revision (ICD-10) codes J41–J44.
3. There is no data for tobacco consumption available between 1966 and 1969, hence the gap in the line.
Sources: AIHW National Mortality Database; Tobacco in Australia: Facts and Issues. Third Edition. (Scollo & Winstanley [editors] 2008).
Figure 6.3: Tobacco consumption and death rates for COPD and lung cancer in males, 1910 to 2006
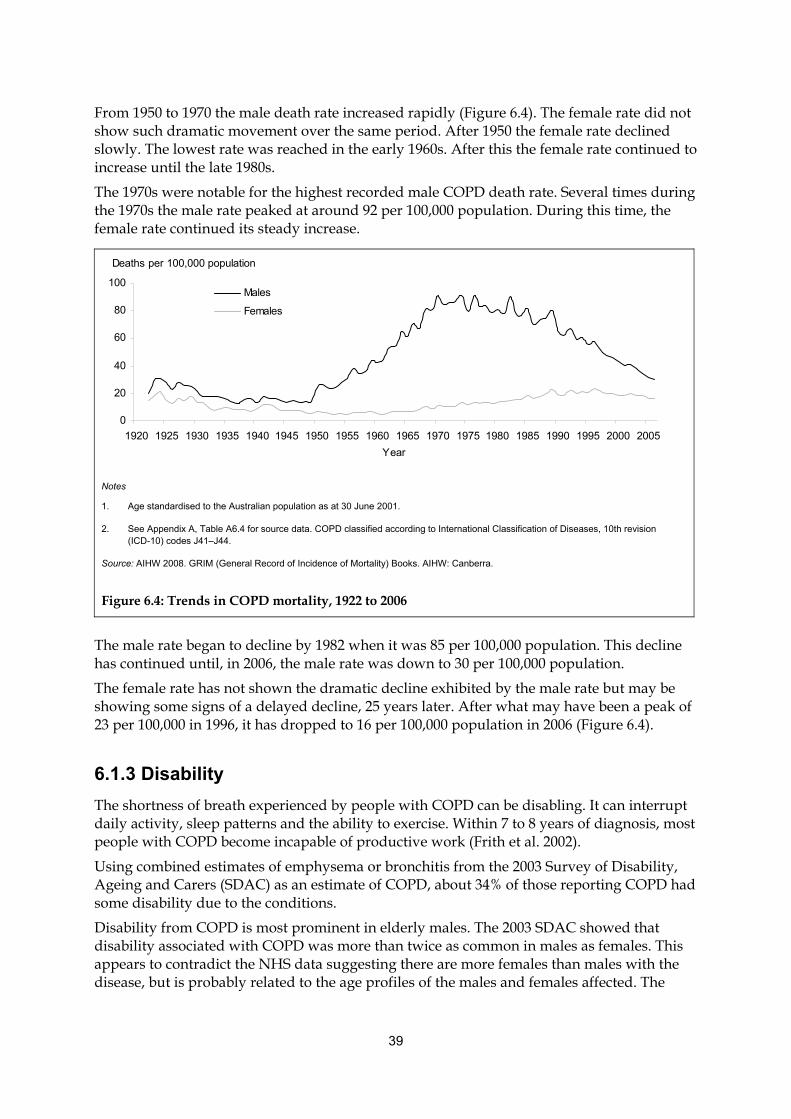
39
From 1950 to 1970 the male death rate increased rapidly (Figure 6.4). The female rate did not show such dramatic movement over the same period. After 1950 the female rate declined slowly. The lowest rate was reached in the early 1960s. After this the female rate continued to increase until the late 1980s.
The 1970s were notable for the highest recorded male COPD death rate. Several times during the 1970s the male rate peaked at around 92 per 100,000 population. During this time, the female rate continued its steady increase.
The male rate began to decline by 1982 when it was 85 per 100,000 population. This decline has continued until, in 2006, the male rate was down to 30 per 100,000 population.
The female rate has not shown the dramatic decline exhibited by the male rate but may be showing some signs of a delayed decline, 25 years later. After what may have been a peak of 23 per 100,000 in 1996, it has dropped to 16 per 100,000 population in 2006 (Figure 6.4).
6.1.3 Disability
The shortness of breath experienced by people with COPD can be disabling. It can interrupt daily activity, sleep patterns and the ability to exercise. Within 7 to 8 years of diagnosis, most people with COPD become incapable of productive work (Frith et al. 2002).
Using combined estimates of emphysema or bronchitis from the 2003 Survey of Disability, Ageing and Carers (SDAC) as an estimate of COPD, about 34% of those reporting COPD had some disability due to the conditions.
Disability from COPD is most prominent in elderly males. The 2003 SDAC showed that disability associated with COPD was more than twice as common in males as females. This appears to contradict the NHS data suggesting there are more females than males with the disease, but is probably related to the age profiles of the males and females affected. The
Deaths per 100,000 population
0
20
40
60
80
100
1920 1925 1930 1935 1940 1945 1950 1955 1960 1965 1970 1975 1980 1985 1990 1995 2000 2005
Year
Males
Females
Notes
1. Age standardised to the Australian population as at 30 June 2001.
2. See Appendix A, Table A6.4 for source data. COPD classified according to International Classification of Diseases, 10th revision (ICD-10) codes J41–J44.
Source: AIHW 2008. GRIM (General Record of Incidence of Mortality) Books. AIHW: Canberra.
Figure 6.4: Trends in COPD mortality, 1922 to 2006
40
2003 SDAC also found disability from COPD to be most prominent in the older age groups, about 68% being 65 years of age and over. This is consistent with COPD prevalence being highest in older age groups.
About 12.1% of people who indicated they had COPD had a severe or profound disability. The severity of disability is defined according to restriction of core activities. Core activities are those associated with:
• communication—understanding or being understood
• mobility—for example, getting into or out of bed or a chair and using transport, and
• self-care—for example, bathing, dressing, eating and toileting.
A person with severe disability sometimes needs help with a core activity or communicates more easily using non-spoken forms of communication. A person with profound disability is unable to do, or always needs help with, a core activity.
According to the study The burden of disease and injury in Australia 2003 (AIHW: Begg et al. 2007), COPD accounts for 3.3% (3.6% among males and 3.0% among females) of the total burden of disease and injury. This burden increases continuously with age among males but peaks at 65–74 years among females, following a similar pattern to the prevalence shown in Figure 6.1.
6.2 Health service impacts
6.2.1 General practice encounters
In 2007–08, the Bettering the Evaluation and Care of Health (BEACH) survey found that COPD was managed in less than 1% of encounters (AIHW: Britt et al. 2008).
6.2.2 Hospitalisations
In 2006–07, there were 52,560 hospitalisations with COPD as the principal diagnosis; 0.7% of 7.6 million total separations recorded in the year.
The average length of hospitalisations where COPD was the principal diagnosis was 7.0 days. This is greater than the average length of 3.3 days for all hospitalisations in the year.
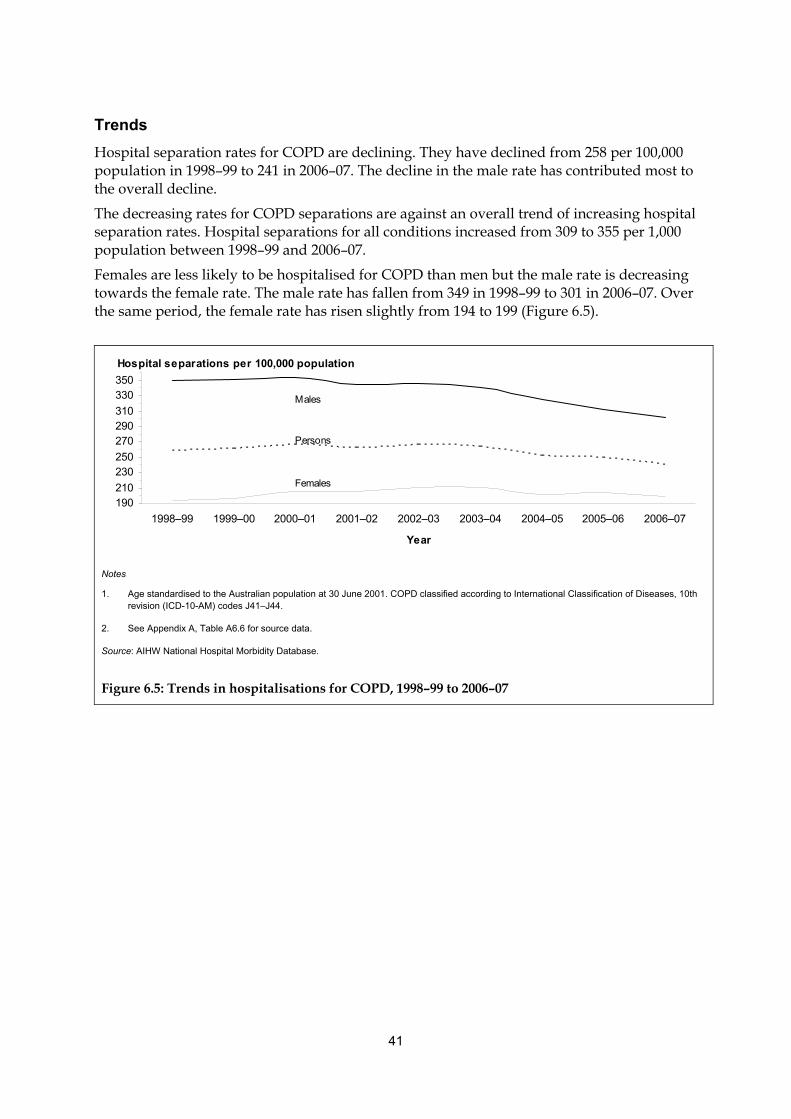
41
Trends
Hospital separation rates for COPD are declining. They have declined from 258 per 100,000 population in 1998–99 to 241 in 2006–07. The decline in the male rate has contributed most to the overall decline.
The decreasing rates for COPD separations are against an overall trend of increasing hospital separation rates. Hospital separations for all conditions increased from 309 to 355 per 1,000 population between 1998–99 and 2006–07.
Females are less likely to be hospitalised for COPD than men but the male rate is decreasing towards the female rate. The male rate has fallen from 349 in 1998–99 to 301 in 2006–07. Over the same period, the female rate has risen slightly from 194 to 199 (Figure 6.5).
190210
230250
270290310
330350
1998–99 1999–00 2000–01 2001–02 2002–03 2003–04 2004–05 2005–06 2006–07
Year
Males
Females
Persons
Hospital separations per 100,000 population
Notes
1. Age standardised to the Australian population at 30 June 2001. COPD classified according to International Classification of Diseases, 10th revision (ICD-10-AM) codes J41–J44.
2. See Appendix A, Table A6.6 for source data.
Source: AIHW National Hospital Morbidity Database.
Figure 6.5: Trends in hospitalisations for COPD, 1998–99 to 2006–07
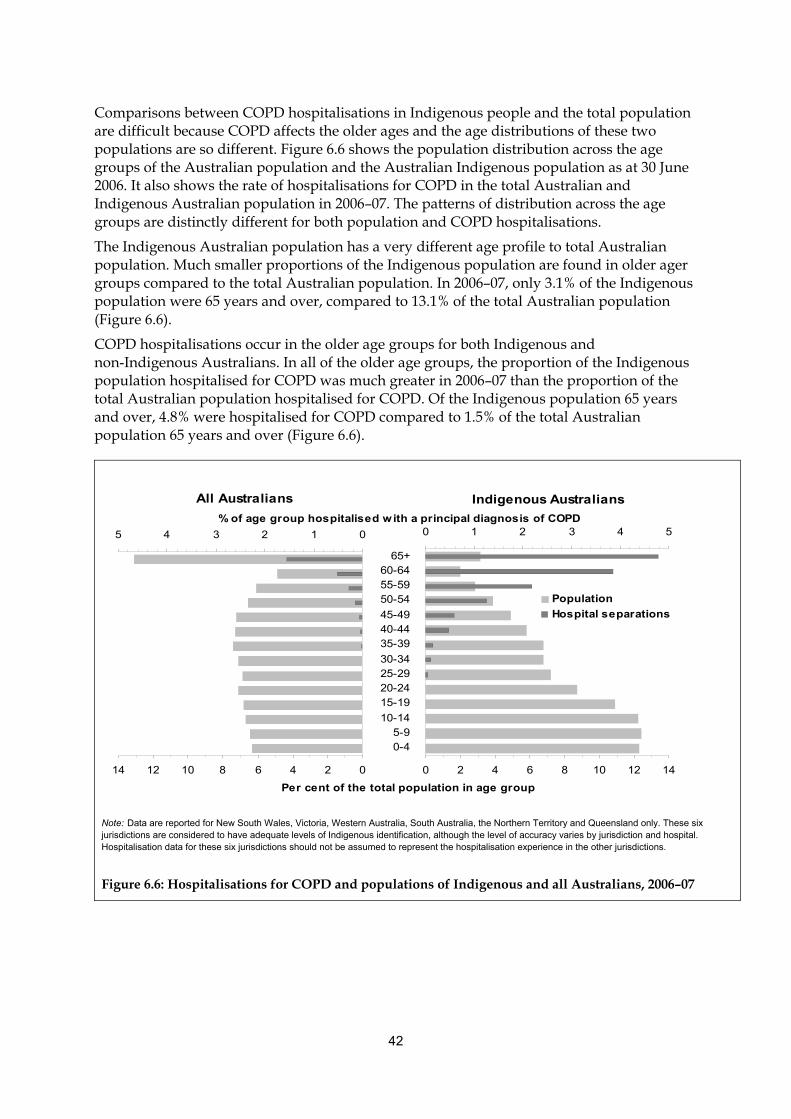
42
Comparisons between COPD hospitalisations in Indigenous people and the total population are difficult because COPD affects the older ages and the age distributions of these two populations are so different. Figure 6.6 shows the population distribution across the age groups of the Australian population and the Australian Indigenous population as at 30 June 2006. It also shows the rate of hospitalisations for COPD in the total Australian and Indigenous Australian population in 2006–07. The patterns of distribution across the age groups are distinctly different for both population and COPD hospitalisations.
The Indigenous Australian population has a very different age profile to total Australian population. Much smaller proportions of the Indigenous population are found in older ager groups compared to the total Australian population. In 2006–07, only 3.1% of the Indigenous population were 65 years and over, compared to 13.1% of the total Australian population (Figure 6.6).
COPD hospitalisations occur in the older age groups for both Indigenous and non-Indigenous Australians. In all of the older age groups, the proportion of the Indigenous population hospitalised for COPD was much greater in 2006–07 than the proportion of the total Australian population hospitalised for COPD. Of the Indigenous population 65 years and over, 4.8% were hospitalised for COPD compared to 1.5% of the total Australian population 65 years and over (Figure 6.6).
02468101214
012345
0 2 4 6 8 10 12 14
0-45-9
10-14
15-1920-2425-2930-34
35-3940-4445-49
50-5455-5960-64
65+
0 1 2 3 4 5
Population
Hospital separations
% of age group hospitalised w ith a principal diagnosis of COPD
All Australians Indigenous Australians
Per cent of the total population in age group
Note: Data are reported for New South Wales, Victoria, Western Australia, South Australia, the Northern Territory and Queensland only. These six jurisdictions are considered to have adequate levels of Indigenous identification, although the level of accuracy varies by jurisdiction and hospital. Hospitalisation data for these six jurisdictions should not be assumed to represent the hospitalisation experience in the other jurisdictions.
Figure 6.6: Hospitalisations for COPD and populations of Indigenous and all Australians, 2006–07
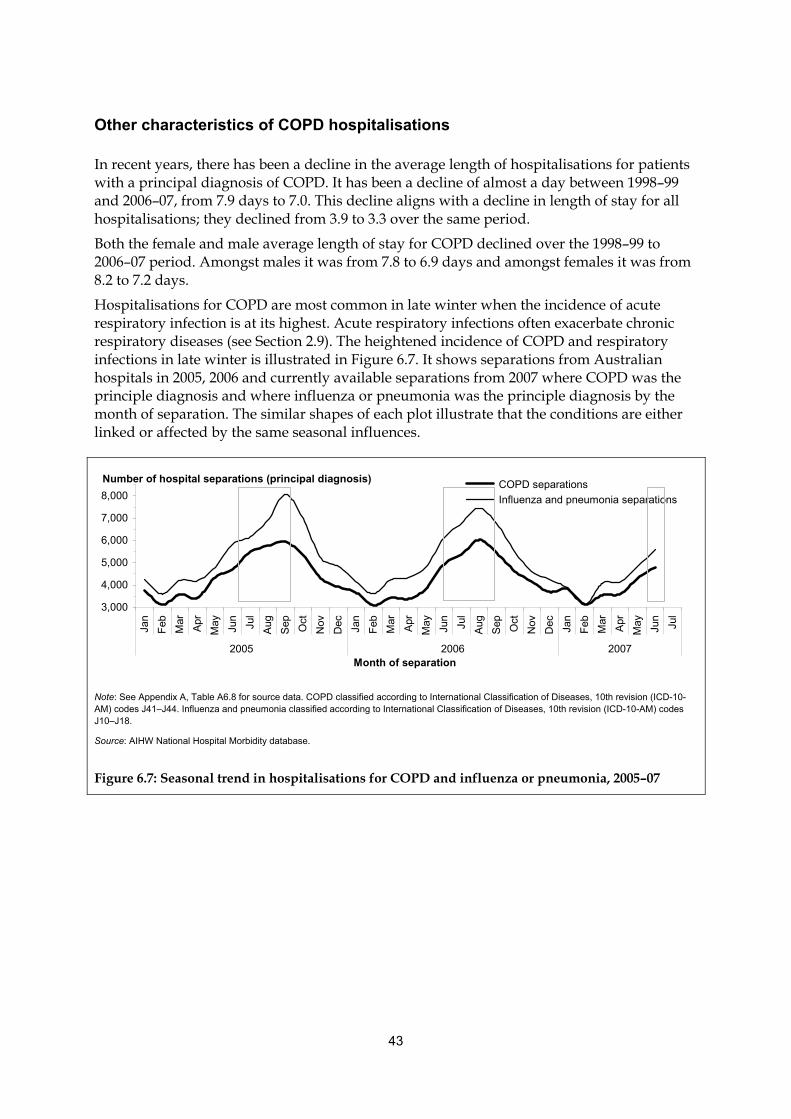
43
Other characteristics of COPD hospitalisations
In recent years, there has been a decline in the average length of hospitalisations for patients with a principal diagnosis of COPD. It has been a decline of almost a day between 1998–99 and 2006–07, from 7.9 days to 7.0. This decline aligns with a decline in length of stay for all hospitalisations; they declined from 3.9 to 3.3 over the same period.
Both the female and male average length of stay for COPD declined over the 1998–99 to 2006–07 period. Amongst males it was from 7.8 to 6.9 days and amongst females it was from 8.2 to 7.2 days.
Hospitalisations for COPD are most common in late winter when the incidence of acute respiratory infection is at its highest. Acute respiratory infections often exacerbate chronic respiratory diseases (see Section 2.9). The heightened incidence of COPD and respiratory infections in late winter is illustrated in Figure 6.7. It shows separations from Australian hospitals in 2005, 2006 and currently available separations from 2007 where COPD was the principle diagnosis and where influenza or pneumonia was the principle diagnosis by the month of separation. The similar shapes of each plot illustrate that the conditions are either linked or affected by the same seasonal influences.
3,000
4,000
5,000
6,000
7,000
8,000
Jan
Feb
Mar
Apr
May
Jun
Jul
Aug
Sep Oct
Nov
Dec Jan
Feb
Mar
Apr
May
Jun
Jul
Aug
Sep Oct
Nov
Dec Jan
Feb
Mar
Apr
May
Jun
Jul
2005 2006 2007Month of separation
COPD separations
Influenza and pneumonia separations
Number of hospital separations (principal diagnosis)
Note: See Appendix A, Table A6.8 for source data. COPD classified according to International Classification of Diseases, 10th revision (ICD-10-AM) codes J41–J44. Influenza and pneumonia classified according to International Classification of Diseases, 10th revision (ICD-10-AM) codes J10–J18.
Source: AIHW National Hospital Morbidity database.
Figure 6.7: Seasonal trend in hospitalisations for COPD and influenza or pneumonia, 2005–07

44
6.3 Comorbidities and complicating factors An exacerbation of COPD is an event characterised by an acute change in the patient’s usual level of shortness of breath, cough and/or sputum. It will often require a change in treatment to respond to the exacerbation (Rabe et al. 2007).
Most often the cause of a severe COPD exacerbation is a viral or bacterial infection of the airways. Exacerbations can also be caused by pollutants, allergic reactions, gastrointestinal reflux and heart failure.
6.3.1 COPD deaths and respiratory cancers
Respiratory cancer and COPD are related diseases. They are both diseases of the lung and they share common causal agents.
The link between reduced lung function and respiratory cancer is not entirely due to them having risk factors in common. Reduced lung function increases the risk of lung cancer, independent of smoking. The risk of developing cancer with reduced respiratory volume is greater in women than men (Wasswa-Kintu et al. 2005).
Cause of death analysis provides evidence of a relationship between COPD and respiratory cancer. In 2006, where COPD was mentioned as an associated cause of death, the underlying cause of death was respiratory cancer 14% of the time. In contrast, for all other associated causes, the underlying cause of death was respiratory cancer only 4% of the time.
In deaths where COPD was the underlying cause, less than 1% of the associated causes mentioned were respiratory cancer. This may indicate that when COPD and respiratory cancer coexist as causes of death, respiratory cancer will be chosen as the underlying cause. This is despite the fact that smokers who have COPD appear to be at increased risk of developing lung cancer (Brody & Spira 2006).
6.3.2 COPD deaths and the circulatory system
Researchers are investigating the relationships between COPD and circulatory diseases. For example, one large population study found that COPD increases the risk of death from cardiovascular disease by two or three times (Sin & Man 2003, 2005; Waters et al. 1999). Another study found strong evidence to indicate that reduced lung function is associated with cardiovascular mortality even without a history of smoking (Sin & Man 2005).
While there is some limited evidence for a relationship between COPD and circulatory disease through cause of death analysis, the results are not definitive. For example, the evidence is not as strong as the evidence for a relationship between COPD and respiratory cancer.
The mechanisms for the association between COPD and diseases of the circulatory system are the subject of ongoing debate and the factors responsible for these associations remain largely unknown. Some of the suggested factors include:
• linkage through the inflammatory pathway
• the stresses that each system can place on the other because of their close relationship
• the role of smoking as a risk factor for both respiratory and circulatory diseases.
45
7. Influenza and pneumonia
Conditions such as common colds, influenza and pneumonia can worsen symptoms and lead to serious consequences for people with chronic respiratory diseases.
It is estimated that viruses play a role in 30% to 80% of asthma exacerbations (Bueving & Wouden 2007). Asthma patients particularly prone to post-viral complications include infants and preschool children, and older people (65 years and above) (Hak et al. 2002).
It has been estimated that at least 30% of serious COPD exacerbations are due to viral and/or bacterial infections (Beckham et al. 2005; McManus et al. 2008).
Respiratory viruses have also been implicated in contributing to pulmonary exacerbations in cystic fibrosis (CF) patients (Wat et al. 2008). Influenza viruses, in particular, have been shown to cause disease progression in CF patients (Conway et al. 1992; Garcia et al. 2007; Pribble et al. 1990), increasing hospitalisation rates (Pribble et al. 1990) and predisposing them to bacterial infections (Conway et al. 1992).
7.1 Influenza Influenza is an acute contagious viral respiratory infection marked by fevers, muscle aches, headache, cough and sore throat.
The incubation period of influenza is about 1 to 3 days and the acute course of illness typically lasts less than a week. Influenza infection is most common during colder months.
Influenza viruses undergo frequent changes. Changes can occur spontaneously as a result of the interaction between bird, human and other mammal strains. The spontaneous changes that can occur require annual reviews of immunisation strategies.
In patients with serious pre-existing illness, such as COPD or asthma, and people over 65, influenza can be a contributing factor leading to death.

46
Box 7.1: Types of influenza
There are three types of influenza viruses, characterised by their core proteins and the response to them by antibodies, but also often described by the host organisms and the mechanisms of transmission:
Type A—The major reservoir is in birds, where this family of viruses evolved (DoHA 2007), but it can exist in several animal populations. Sometimes, infection is passed from birds, pigs and even seals to humans through close contact with infected animals or animal products (Stephenson & Zambon 2002). The infections that result can be severe or fatal and can occur in pandemics or major annual outbreaks. Consequently, it is the most serious type of influenza in humans (Zambon 1999). Equine influenza is a Type A virus that only infects horses. Type A virus that exists in the avian reservoir is commonly referred to as ‘bird flu’ and the Type A virus that usually resides in the pig population is commonly referred to as ‘swine flu’.
Type B—Humans are the only host. Type B is less prone to change, and less serious than Type A, causing outbreaks every 2 to 4 years (Stephenson & Zambon 2002).
Type C—Humans are the natural host but it may also infect pigs. It causes a less severe illness than A or B, resembling the common cold (Zambon 1999). It is not clinically important in human disease (Webster 2001; Wright 2006) but is not as well understood as Type A or B.
7.2 Pneumonia Pneumonia commonly occurs in people with pre-existing illnesses that predispose them to inhale infected material or to fail to clear it when they do inhale it. Vaccination against the influenza virus, and against Streptococcus pneumoniae (often shortened to pneumococcal), may play a role in the prevention of pneumonia.
Immunisation is directed at those most at risk of initially contracting or developing serious complications from infection. In the case of Streptococcus pneumoniae the most serious complications are pneumonia and meningitis. The immunisation strategies for Streptococcus pneumoniae are complex and directed at populations on the basis of age (less than 6 years and 65 years and over), Indigenous status, the presence of chronic disease, immunocompromised status (for example, COPD, HIV infection, alcoholism, diabetes) and a smoking habit.
7.3 General epidemiology
7.3.1 Incidence
No comprehensive data is currently available on the incidence of pneumonia in Australia. There is also no entirely reliable account of the number of influenza cases each year. This is due, in part, because acute respiratory infections are usually short-lived and require minimal health care intervention. However, influenza is encountered often in general practice. Because of its potential for severe complications among vulnerable groups, when confirmed by laboratory tests, medical practitioners are legally required to notify the relevant agency.
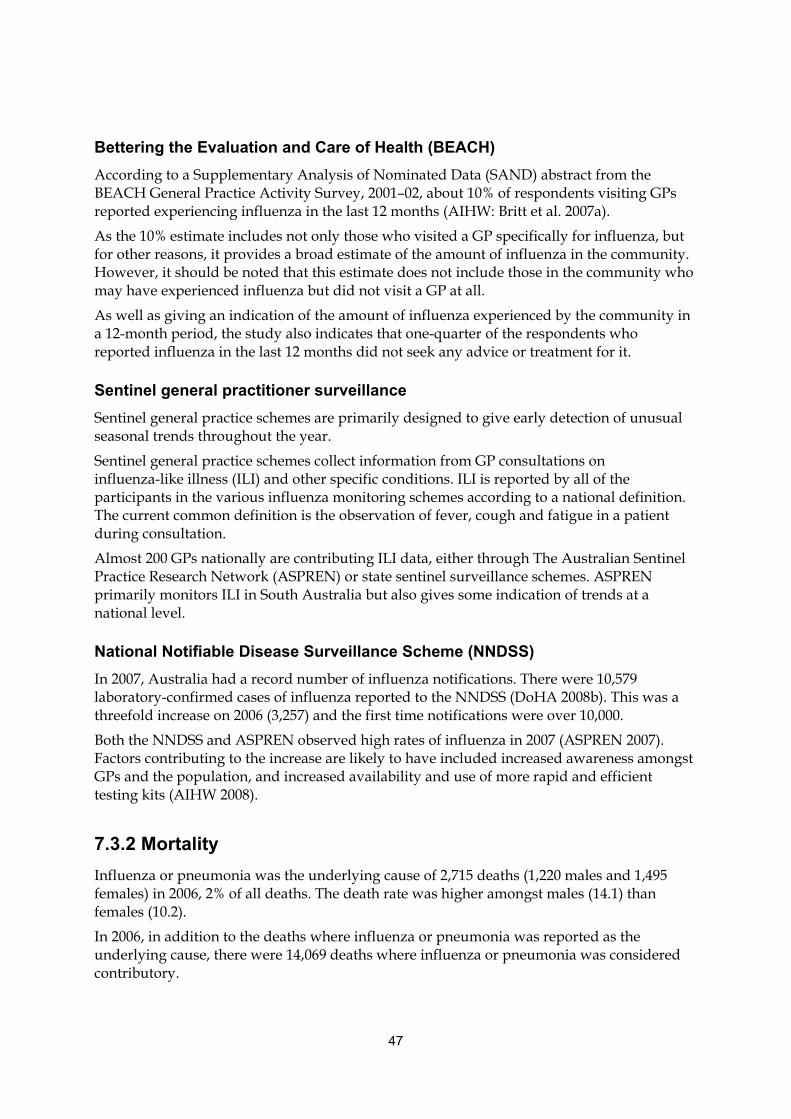
47
Bettering the Evaluation and Care of Health (BEACH)
According to a Supplementary Analysis of Nominated Data (SAND) abstract from the BEACH General Practice Activity Survey, 2001–02, about 10% of respondents visiting GPs reported experiencing influenza in the last 12 months (AIHW: Britt et al. 2007a).
As the 10% estimate includes not only those who visited a GP specifically for influenza, but for other reasons, it provides a broad estimate of the amount of influenza in the community. However, it should be noted that this estimate does not include those in the community who may have experienced influenza but did not visit a GP at all.
As well as giving an indication of the amount of influenza experienced by the community in a 12-month period, the study also indicates that one-quarter of the respondents who reported influenza in the last 12 months did not seek any advice or treatment for it.
Sentinel general practitioner surveillance
Sentinel general practice schemes are primarily designed to give early detection of unusual seasonal trends throughout the year.
Sentinel general practice schemes collect information from GP consultations on influenza-like illness (ILI) and other specific conditions. ILI is reported by all of the participants in the various influenza monitoring schemes according to a national definition. The current common definition is the observation of fever, cough and fatigue in a patient during consultation.
Almost 200 GPs nationally are contributing ILI data, either through The Australian Sentinel Practice Research Network (ASPREN) or state sentinel surveillance schemes. ASPREN primarily monitors ILI in South Australia but also gives some indication of trends at a national level.
National Notifiable Disease Surveillance Scheme (NNDSS)
In 2007, Australia had a record number of influenza notifications. There were 10,579 laboratory-confirmed cases of influenza reported to the NNDSS (DoHA 2008b). This was a threefold increase on 2006 (3,257) and the first time notifications were over 10,000.
Both the NNDSS and ASPREN observed high rates of influenza in 2007 (ASPREN 2007). Factors contributing to the increase are likely to have included increased awareness amongst GPs and the population, and increased availability and use of more rapid and efficient testing kits (AIHW 2008).
7.3.2 Mortality
Influenza or pneumonia was the underlying cause of 2,715 deaths (1,220 males and 1,495 females) in 2006, 2% of all deaths. The death rate was higher amongst males (14.1) than females (10.2).
In 2006, in addition to the deaths where influenza or pneumonia was reported as the underlying cause, there were 14,069 deaths where influenza or pneumonia was considered contributory.
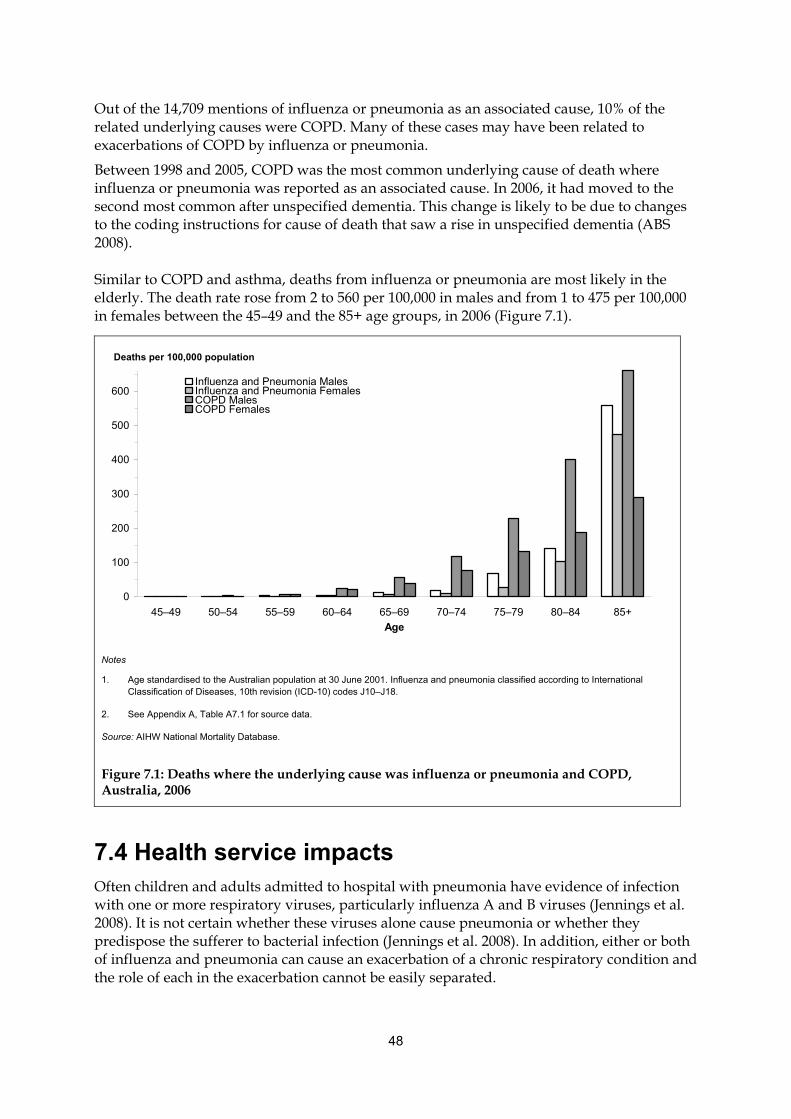
48
Out of the 14,709 mentions of influenza or pneumonia as an associated cause, 10% of the related underlying causes were COPD. Many of these cases may have been related to exacerbations of COPD by influenza or pneumonia.
Between 1998 and 2005, COPD was the most common underlying cause of death where influenza or pneumonia was reported as an associated cause. In 2006, it had moved to the second most common after unspecified dementia. This change is likely to be due to changes to the coding instructions for cause of death that saw a rise in unspecified dementia (ABS 2008).
Similar to COPD and asthma, deaths from influenza or pneumonia are most likely in the elderly. The death rate rose from 2 to 560 per 100,000 in males and from 1 to 475 per 100,000 in females between the 45–49 and the 85+ age groups, in 2006 (Figure 7.1).
7.4 Health service impacts Often children and adults admitted to hospital with pneumonia have evidence of infection with one or more respiratory viruses, particularly influenza A and B viruses (Jennings et al. 2008). It is not certain whether these viruses alone cause pneumonia or whether they predispose the sufferer to bacterial infection (Jennings et al. 2008). In addition, either or both of influenza and pneumonia can cause an exacerbation of a chronic respiratory condition and the role of each in the exacerbation cannot be easily separated.
0
100
200
300
400
500
600
45–49 50–54 55–59 60–64 65–69 70–74 75–79 80–84 85+
Age
Influenza and Pneumonia MalesInfluenza and Pneumonia FemalesCOPD Males COPD Females
Deaths per 100,000 population
Notes
1. Age standardised to the Australian population at 30 June 2001. Influenza and pneumonia classified according to International Classification of Diseases, 10th revision (ICD-10) codes J10–J18.
2. See Appendix A, Table A7.1 for source data.
Source: AIHW National Mortality Database.
Figure 7.1: Deaths where the underlying cause was influenza or pneumonia and COPD, Australia, 2006
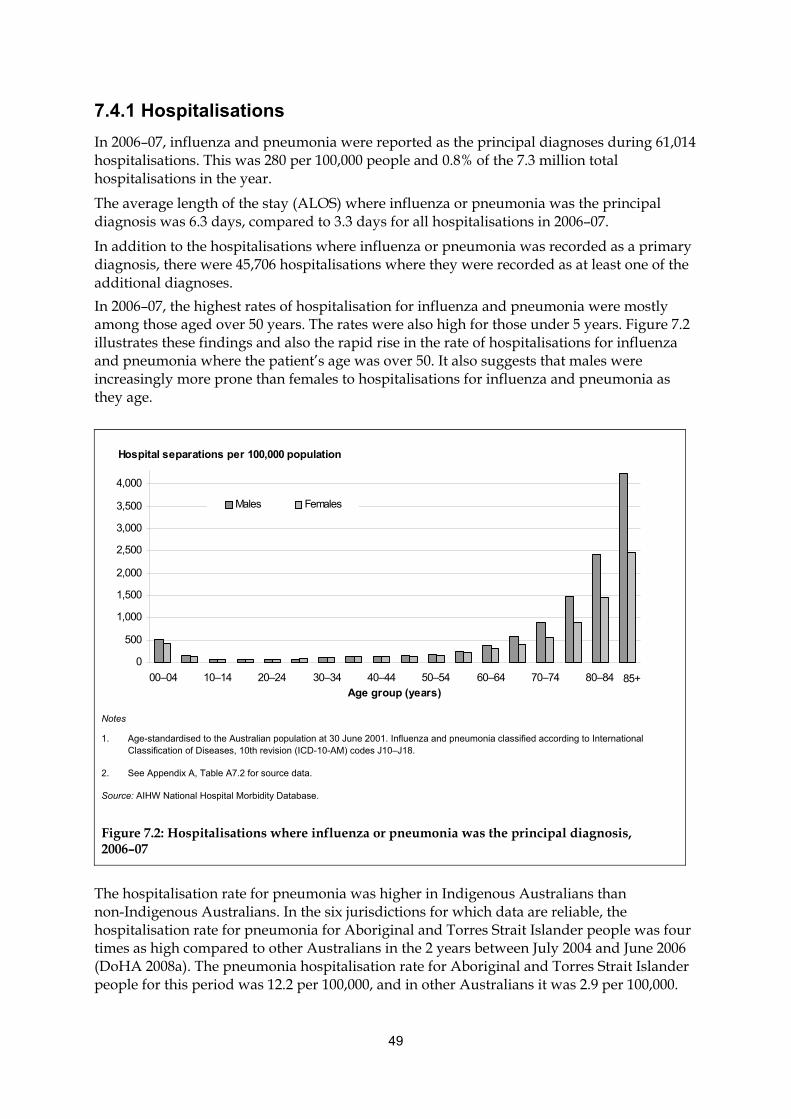
49
7.4.1 Hospitalisations
In 2006–07, influenza and pneumonia were reported as the principal diagnoses during 61,014 hospitalisations. This was 280 per 100,000 people and 0.8% of the 7.3 million total hospitalisations in the year.
The average length of the stay (ALOS) where influenza or pneumonia was the principal diagnosis was 6.3 days, compared to 3.3 days for all hospitalisations in 2006–07.
In addition to the hospitalisations where influenza or pneumonia was recorded as a primary diagnosis, there were 45,706 hospitalisations where they were recorded as at least one of the additional diagnoses.
In 2006–07, the highest rates of hospitalisation for influenza and pneumonia were mostly among those aged over 50 years. The rates were also high for those under 5 years. Figure 7.2 illustrates these findings and also the rapid rise in the rate of hospitalisations for influenza and pneumonia where the patient’s age was over 50. It also suggests that males were increasingly more prone than females to hospitalisations for influenza and pneumonia as they age.
The hospitalisation rate for pneumonia was higher in Indigenous Australians than non-Indigenous Australians. In the six jurisdictions for which data are reliable, the hospitalisation rate for pneumonia for Aboriginal and Torres Strait Islander people was four times as high compared to other Australians in the 2 years between July 2004 and June 2006 (DoHA 2008a). The pneumonia hospitalisation rate for Aboriginal and Torres Strait Islander people for this period was 12.2 per 100,000, and in other Australians it was 2.9 per 100,000.
0
500
1,000
1,500
2,000
2,500
3,000
3,500
4,000
00–04 10–14 20–24 30–34 40–44 50–54 60–64 70–74 80–84
Age group (years)
Males Females
Hospital separations per 100,000 population
85+
Notes
1. Age-standardised to the Australian population at 30 June 2001. Influenza and pneumonia classified according to International Classification of Diseases, 10th revision (ICD-10-AM) codes J10–J18.
2. See Appendix A, Table A7.2 for source data.
Source: AIHW National Hospital Morbidity Database.
Figure 7.2: Hospitalisations where influenza or pneumonia was the principal diagnosis, 2006–07
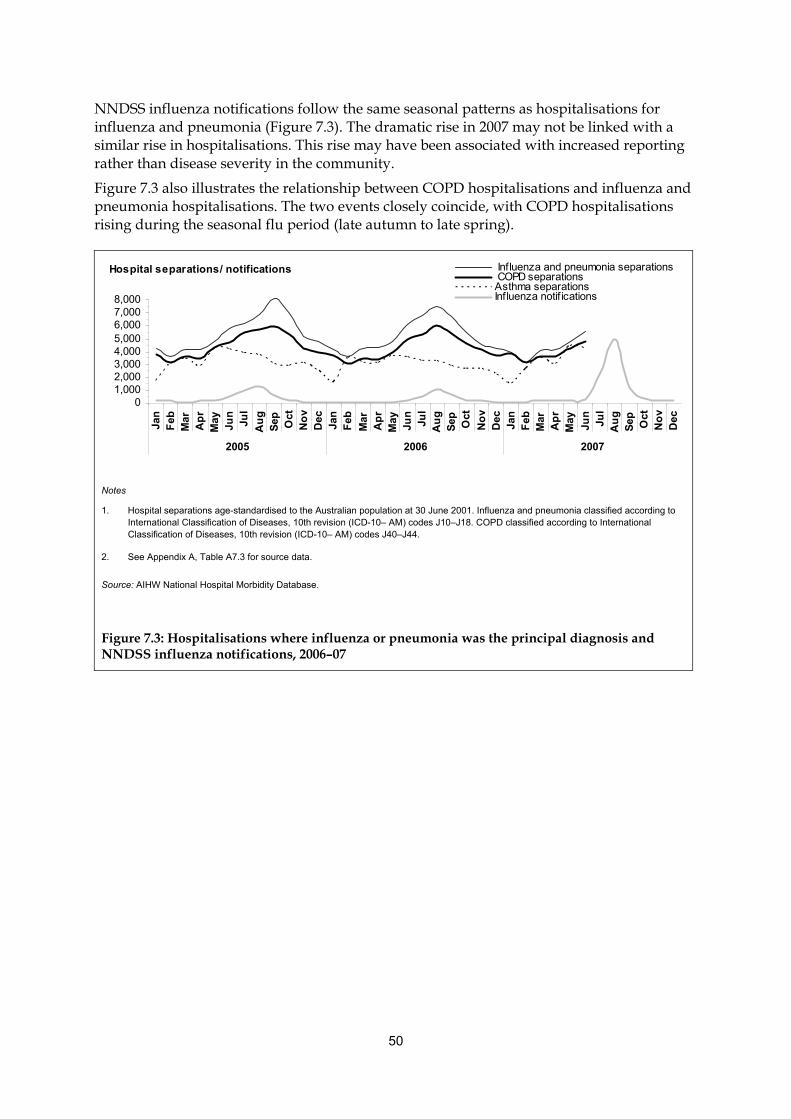
50
NNDSS influenza notifications follow the same seasonal patterns as hospitalisations for influenza and pneumonia (Figure 7.3). The dramatic rise in 2007 may not be linked with a similar rise in hospitalisations. This rise may have been associated with increased reporting rather than disease severity in the community.
Figure 7.3 also illustrates the relationship between COPD hospitalisations and influenza and pneumonia hospitalisations. The two events closely coincide, with COPD hospitalisations rising during the seasonal flu period (late autumn to late spring).
01,0002,0003,0004,0005,0006,0007,0008,000
Jan
Feb
Mar
Ap
rM
ayJu
nJu
l
Au
gS
ep Oct
No
vD
ecJa
nF
eb
Mar
Ap
rM
ayJu
nJu
lA
ug
Sep Oct
No
vD
ecJa
nF
ebM
arA
pr
May
Jun
Jul
Au
gS
ep Oct
No
vD
ec
2005 2006 2007
Influenza and pneumonia separations COPD separationsAsthma separationsInfluenza notif ications
Hospital separations/ notifications
Notes
1. Hospital separations age-standardised to the Australian population at 30 June 2001. Influenza and pneumonia classified according to International Classification of Diseases, 10th revision (ICD-10– AM) codes J10–J18. COPD classified according to International Classification of Diseases, 10th revision (ICD-10– AM) codes J40–J44.
2. See Appendix A, Table A7.3 for source data.
Source: AIHW National Hospital Morbidity Database.
Figure 7.3: Hospitalisations where influenza or pneumonia was the principal diagnosis and NNDSS influenza notifications, 2006–07
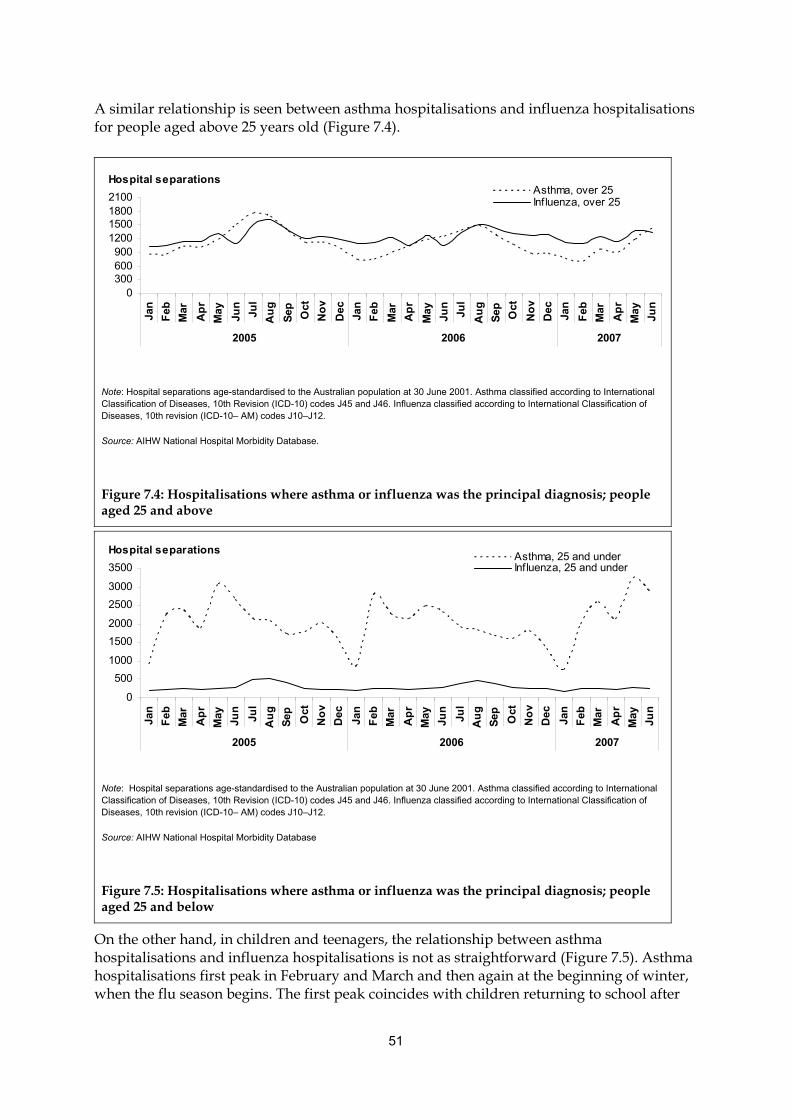
51
A similar relationship is seen between asthma hospitalisations and influenza hospitalisations for people aged above 25 years old (Figure 7.4).
On the other hand, in children and teenagers, the relationship between asthma hospitalisations and influenza hospitalisations is not as straightforward (Figure 7.5). Asthma hospitalisations first peak in February and March and then again at the beginning of winter, when the flu season begins. The first peak coincides with children returning to school after
Hospital separations
0300600900
1200150018002100
Jan
Feb
Mar
Ap
r
May
Jun
Jul
Au
g
Sep Oct
No
v
Dec
Jan
Feb
Mar
Ap
r
May
Jun
Jul
Au
g
Sep Oct
No
v
Dec
Jan
Feb
Mar
Ap
r
May
Jun
2005 2006 2007
Asthma, over 25Influenza, over 25
Note: Hospital separations age-standardised to the Australian population at 30 June 2001. Asthma classified according to International Classification of Diseases, 10th Revision (ICD-10) codes J45 and J46. Influenza classified according to International Classification of Diseases, 10th revision (ICD-10– AM) codes J10–J12.
Source: AIHW National Hospital Morbidity Database.
Figure 7.4: Hospitalisations where asthma or influenza was the principal diagnosis; people aged 25 and above
Hospital separations
0
500
1000
1500
2000
2500
3000
3500
Jan
Feb
Mar
Ap
r
May
Jun
Jul
Au
g
Sep Oct
No
v
Dec
Jan
Feb
Mar
Ap
r
May
Jun
Jul
Au
g
Sep Oct
No
v
Dec
Jan
Feb
Mar
Ap
r
May
Jun
2005 2006 2007
Asthma, 25 and underInfluenza, 25 and under
Note: Hospital separations age-standardised to the Australian population at 30 June 2001. Asthma classified according to International Classification of Diseases, 10th Revision (ICD-10) codes J45 and J46. Influenza classified according to International Classification of Diseases, 10th revision (ICD-10– AM) codes J10–J12.
Source: AIHW National Hospital Morbidity Database
Figure 7.5: Hospitalisations where asthma or influenza was the principal diagnosis; people aged 25 and below
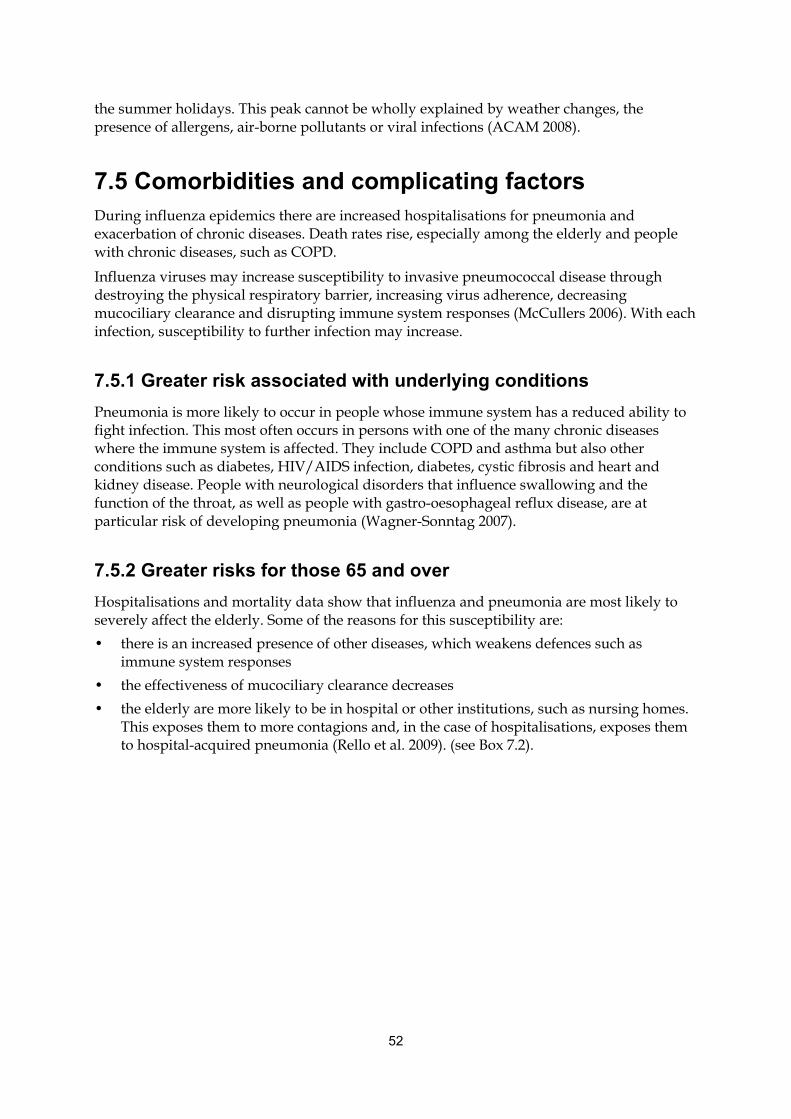
52
the summer holidays. This peak cannot be wholly explained by weather changes, the presence of allergens, air-borne pollutants or viral infections (ACAM 2008).
7.5 Comorbidities and complicating factors During influenza epidemics there are increased hospitalisations for pneumonia and exacerbation of chronic diseases. Death rates rise, especially among the elderly and people with chronic diseases, such as COPD.
Influenza viruses may increase susceptibility to invasive pneumococcal disease through destroying the physical respiratory barrier, increasing virus adherence, decreasing mucociliary clearance and disrupting immune system responses (McCullers 2006). With each infection, susceptibility to further infection may increase.
7.5.1 Greater risk associated with underlying conditions
Pneumonia is more likely to occur in people whose immune system has a reduced ability to fight infection. This most often occurs in persons with one of the many chronic diseases where the immune system is affected. They include COPD and asthma but also other conditions such as diabetes, HIV/AIDS infection, diabetes, cystic fibrosis and heart and kidney disease. People with neurological disorders that influence swallowing and the function of the throat, as well as people with gastro-oesophageal reflux disease, are at particular risk of developing pneumonia (Wagner-Sonntag 2007).
7.5.2 Greater risks for those 65 and over
Hospitalisations and mortality data show that influenza and pneumonia are most likely to severely affect the elderly. Some of the reasons for this susceptibility are:
• there is an increased presence of other diseases, which weakens defences such as immune system responses
• the effectiveness of mucociliary clearance decreases
• the elderly are more likely to be in hospital or other institutions, such as nursing homes. This exposes them to more contagions and, in the case of hospitalisations, exposes them to hospital-acquired pneumonia (Rello et al. 2009). (see Box 7.2).
53
Box 7.2: Types of pneumonia
Pneumonia can be divided into two main types according to whether the pneumonia was acquired outside or inside a hospital:
• Community-acquired
• Hospital-acquired: This type is most commonly acquired during surgery, particularly with endotracheal intubation. It can be more serious than community-acquired because individuals in hospital already have other illnesses, which weakens their defences to invasive micro-organisms. In addition, the micro-organisms they are exposed to in hospital are different to those they have been exposed to out of hospital.
7.5.3 Prevention of exacerbations
Prevention of infection is highly desirable in minimising the number and severity of acute respiratory exacerbations.
It has been demonstrated that the use of the influenza vaccine has a clinically important protective effect on influenza-related exacerbations and probably reduces the number and severity of exacerbations in COPD patients (DoHA 2007).
In patients with severe asthma, defined as requiring frequent hospital visits, annual influenza vaccine is an important part of routine care. The ninth edition of the Australian Immunisation Handbook states ‘there are insufficient data from randomised controlled trials of influenza vaccine to define efficacy across the whole spectrum of asthma, but influenza can cause severe exacerbations of wheezing, and about 10% of episodes of virus-induced wheezing are attributable to influenza’ (DoHA 2007).
The risk of Invasive Pneumococcal Disease (IPD) is highest in patients who cannot mount an adequate immune response to Streptococcus pneumoniae. These include people who smoke, and those with chronic pulmonary disease (for example, COPD) (DoHA 2007).
Prevention strategies for asthma and COPD are included in current management guidelines in Australia, New Zealand and USA (McKenzie et al. 2007, National Asthma Council Australia 2006). These guidelines raise awareness of the consequences and the process of exacerbations. They also help patients and carers to monitor and manage conditions that may exacerbate COPD or asthma.
54
8. Bronchiectasis
Bronchiectasis refers to an abnormal and irreversible dilation of the airways. A cough with large amounts of sputum and, often, airflow obstruction characterise bronchiectasis. People with bronchiectasis are prone to recurrent respiratory tract infections as mucus accumulates in the dilated airway and becomes stagnant.
Bronchiectasis is a disease involving a vicious cycle of infection (Cole 1986). Acute infection elicits a host immune response causing airway inflammation, necessary to clear the infection. When the response is not sufficient, the infection and consequent inflammation can persist. This causes damage to the airway, resulting in weakness and dilation. The ability to clear mucus from the small and medium airways is affected and increases the risk of further infections and structural airway damage.
Bronchiectasis increases the severity of other respiratory diseases. In many cases, the cause of bronchiectasis is unknown. The most common identifiable causes for which specific therapy exists are cystic fibrosis, deficiency of certain immunoglobulins, gastro-oesophageal reflux disease (GORD), infection with certain non-tuberculous mycobacteria and an allergic reaction to aspergillus (a mould), that sometimes occurs in people with asthma. Other causes, for which no specific therapy exists, include an abnormality of the structure and function of the cilia and previous serious infections affecting the lungs, such as pertussis (whooping cough), measles, other viral infections and tuberculosis (Pasteur et al. 2000).
8.1 General epidemiology There is little information available on the overall Australian prevalence or incidence of bronchiectasis as it is usually not a primary condition but more often a consequence of other diseases. Because diagnosis requires special investigations, it is commonly not made unless the patient is referred to a respiratory specialist. While there are no overall prevalence estimates, some information on the extent of the condition can be gained from the use of health services, deaths, surveys of remote Indigenous communities where bronchiectasis is a significant problem, and prevalence estimates in other countries.
8.1.1 Prevalence in Indigenous communities
In Indigenous communities in Australia bronchiectasis is a significant problem. The prevalence of childhood bronchiectasis in the central-Australian Indigenous population was estimated to be about 14 per 1,000 Indigenous children (Chang et al. 2002). In the same study, no cases of bronchiectasis amongst non-Indigenous children were found, even though two-thirds of the study population were non-Indigenous.
The incidence of bronchiectasis in several Indigenous populations internationally is much higher than the corresponding overall population. For example, similar to Australian Aboriginal children, New Zealand children of Pacific and Maori origin have a higher incidence of bronchiectasis than New Zealand children of European ancestry (Twiss et al. 2005).

55
The higher incidence observed in these populations is likely due to higher exposure to smoke from heating and cooking, socioeconomic factors, limited access to health services, non-adherence to medications and inadequate medical follow-up (Chang et al. 2002).
8.1.2 Prevalence in other countries
Several studies provide information about bronchiectasis in other western industrialised countries.
In the United States, the prevalence ranges from 4.2 per 100,000 persons aged 18–34 years to 271.8 per 100,000 among those aged 75 years and over (Weycker et al. 2005).
In Finland, the incidence of bronchiectasis in children under 15 years has been estimated at 0.5 per 100,000 population per year and 3.9 per 100,000 population overall (Saynajakangas et al. 1998).
Higher incidence rates have been reported in children of Northern England (17.2 per 100,000 population per year) and New Zealand (3.7 per 100,000 population per year) (Twiss et al. 2005).
8.1.3 Mortality
There are not a large number of deaths directly attributed to bronchiectasis. In Australia in 2006, it was the underlying cause of death of 80 males and 152 females. In addition to the deaths where bronchiectasis was an underlying cause, there were 120 deaths of males and 188 of females where bronchiectasis was an associated cause. More than 80% of those who died with bronchiectasis as an underlying cause were 70 years or over. The average age of death was 77 years (AIHW 2009).

56
8.1.4 Trends
In Australia over recent years, bronchiectasis has increased as a cause of death, particularly as an associated cause. Over the last 9 years, the age-standardised rate of deaths where bronchiectasis was an associated cause rose from 1.1 to 1.4 per 100,000 people between 1998 and 2006. Over the same period there has been a slight increase in the rate of deaths where bronchiectasis was an underlying cause (Figure 8.1). These increases may come from increased incidence of the disease but may also come from better recognition of the condition and better diagnostic imaging, such as high-resolution computed tomography (HRCT).
0.00.20.40.60.81.01.21.4
1998 1999 2000 2001 2002 2003 2004 2005 2006
Year
AssociatedUnderlying
Deaths per 100,000 population
Notes
1. Age-standardised to the Australian population at 30 June 2001.
2. Bronchiectasis classified according to International Classification of Diseases, 10th Revision (ICD-10) code J47.
Source: AIHW National Mortality Database.
Figure 8.1. Deaths where bronchiectasis was an underlying or associated cause, 1998 to 2006
8.2 Health service impacts
8.2.1 General practice
Bronchiectasis does not frequently appear in GP data. Data from the survey of GP activity in Australia shows that, in 2006–07, bronchiectasis accounted for an estimated 0.05% of encounters and 0.04% of all problems managed (unpublished AIHW analysis of BEACH data).
8.2.2 Hospitalisations
People with bronchiectasis may require hospitalisations to treat their symptoms and have diagnostic procedures. In 2006–07, bronchiectasis was the principal diagnosis for 4,019 hospitalisations. In addition to these, there were 8,489 hospitalisations where bronchiectasis was an additional diagnosis.
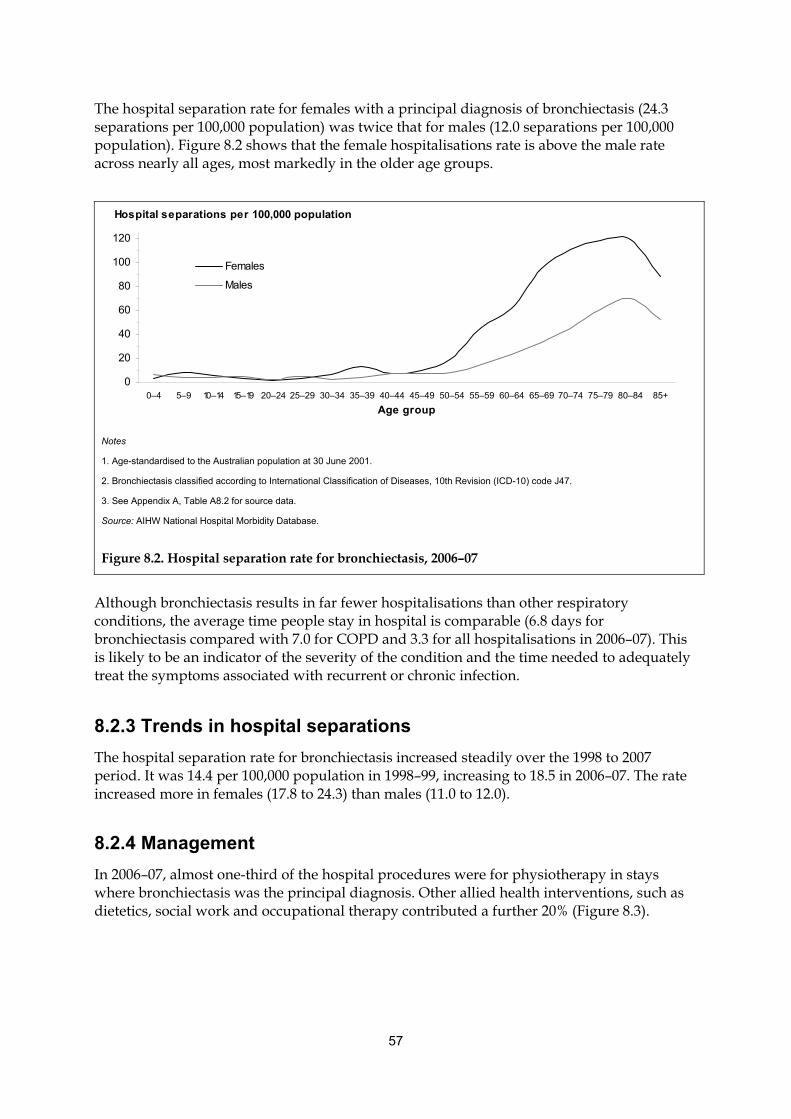
57
The hospital separation rate for females with a principal diagnosis of bronchiectasis (24.3 separations per 100,000 population) was twice that for males (12.0 separations per 100,000 population). Figure 8.2 shows that the female hospitalisations rate is above the male rate across nearly all ages, most markedly in the older age groups.
Although bronchiectasis results in far fewer hospitalisations than other respiratory conditions, the average time people stay in hospital is comparable (6.8 days for bronchiectasis compared with 7.0 for COPD and 3.3 for all hospitalisations in 2006–07). This is likely to be an indicator of the severity of the condition and the time needed to adequately treat the symptoms associated with recurrent or chronic infection.
8.2.3 Trends in hospital separations
The hospital separation rate for bronchiectasis increased steadily over the 1998 to 2007 period. It was 14.4 per 100,000 population in 1998–99, increasing to 18.5 in 2006–07. The rate increased more in females (17.8 to 24.3) than males (11.0 to 12.0).
8.2.4 Management
In 2006–07, almost one-third of the hospital procedures were for physiotherapy in stays where bronchiectasis was the principal diagnosis. Other allied health interventions, such as dietetics, social work and occupational therapy contributed a further 20% (Figure 8.3).
0
20
40
60
80
100
120
0–4 5–9 10–14 15–19 20–24 25–29 30–34 35–39 40–44 45–49 50–54 55–59 60–64 65–69 70–74 75–79 80–84 85+
Age group
Females
Males
Hospital separations per 100,000 population
Notes
1. Age-standardised to the Australian population at 30 June 2001.
2. Bronchiectasis classified according to International Classification of Diseases, 10th Revision (ICD-10) code J47.
3. See Appendix A, Table A8.2 for source data.
Source: AIHW National Hospital Morbidity Database.
Figure 8.2. Hospital separation rate for bronchiectasis, 2006–07
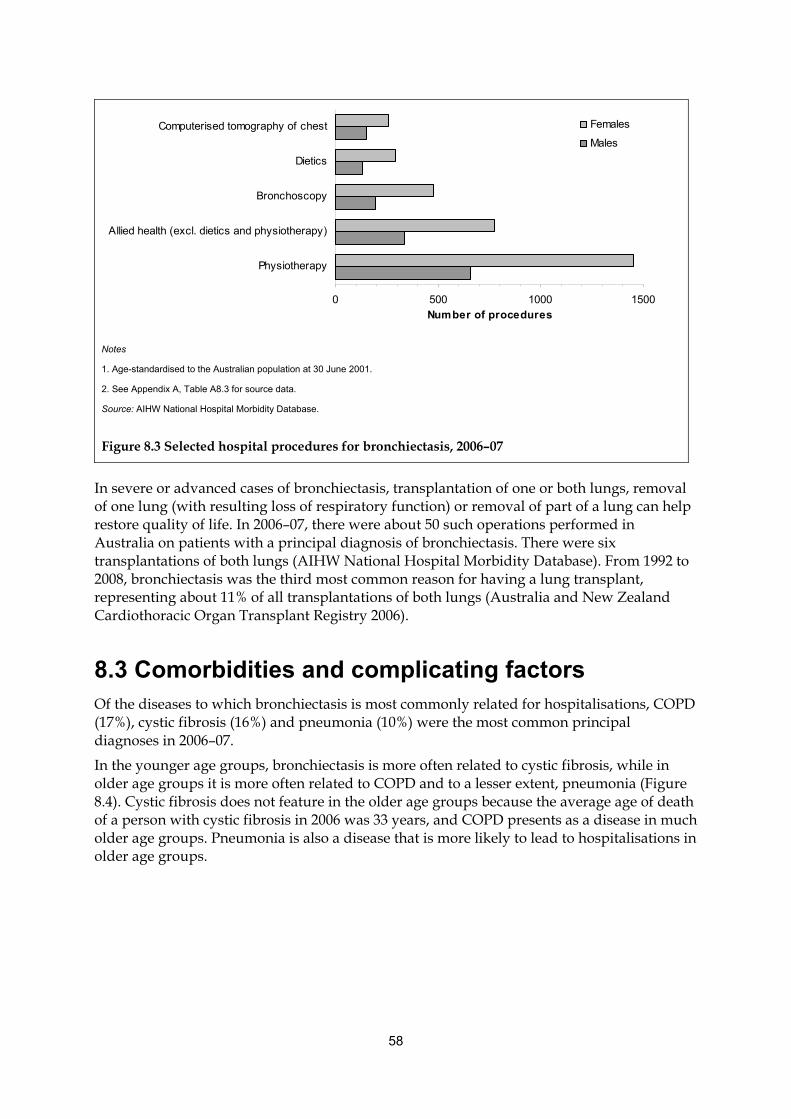
58
0 500 1000 1500
Physiotherapy
Allied health (excl. dietics and physiotherapy)
Bronchoscopy
Dietics
Computerised tomography of chest
Number of procedures
Females
Males
Notes
1. Age-standardised to the Australian population at 30 June 2001.
2. See Appendix A, Table A8.3 for source data.
Source: AIHW National Hospital Morbidity Database.
Figure 8.3 Selected hospital procedures for bronchiectasis, 2006–07
In severe or advanced cases of bronchiectasis, transplantation of one or both lungs, removal of one lung (with resulting loss of respiratory function) or removal of part of a lung can help restore quality of life. In 2006–07, there were about 50 such operations performed in Australia on patients with a principal diagnosis of bronchiectasis. There were six transplantations of both lungs (AIHW National Hospital Morbidity Database). From 1992 to 2008, bronchiectasis was the third most common reason for having a lung transplant, representing about 11% of all transplantations of both lungs (Australia and New Zealand Cardiothoracic Organ Transplant Registry 2006).
8.3 Comorbidities and complicating factors Of the diseases to which bronchiectasis is most commonly related for hospitalisations, COPD (17%), cystic fibrosis (16%) and pneumonia (10%) were the most common principal diagnoses in 2006–07.
In the younger age groups, bronchiectasis is more often related to cystic fibrosis, while in older age groups it is more often related to COPD and to a lesser extent, pneumonia (Figure 8.4). Cystic fibrosis does not feature in the older age groups because the average age of death of a person with cystic fibrosis in 2006 was 33 years, and COPD presents as a disease in much older age groups. Pneumonia is also a disease that is more likely to lead to hospitalisations in older age groups.
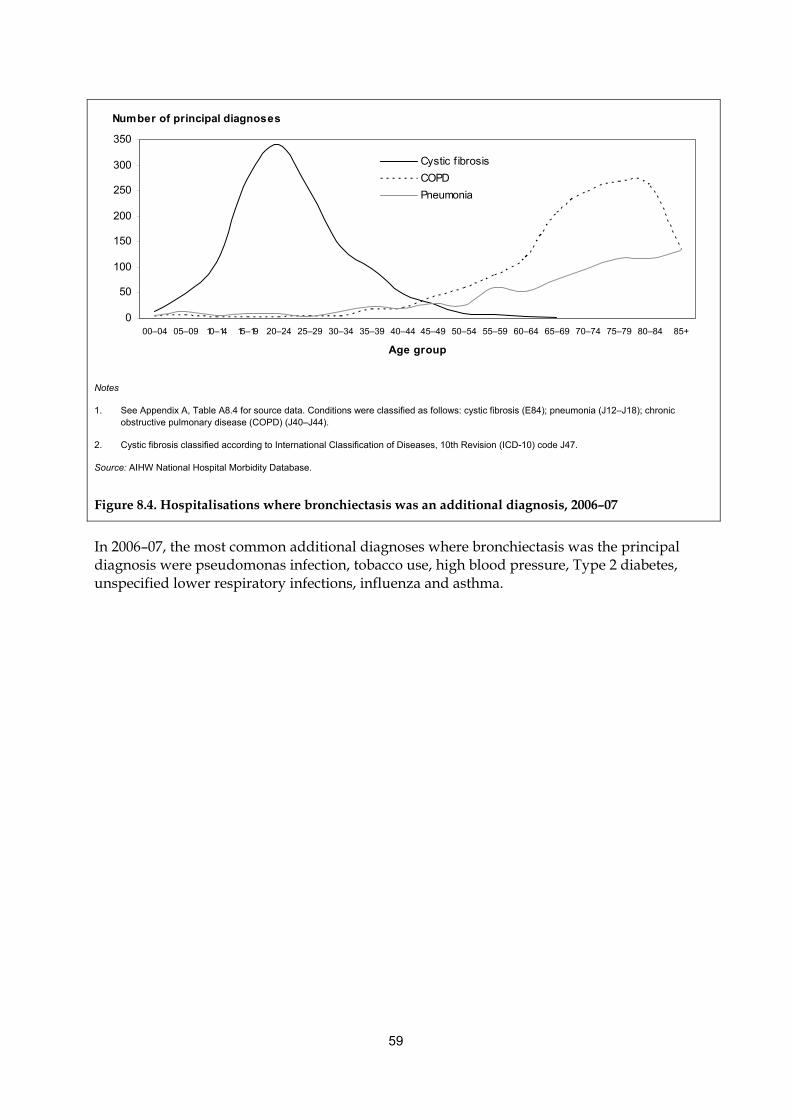
59
0
50
100
150
200
250
300
350
00–04 05–09 10–14 15–19 20–24 25–29 30–34 35–39 40–44 45–49 50–54 55–59 60–64 65–69 70–74 75–79 80–84 85+
Age group
Cystic f ibrosis
COPD
Pneumonia
Number of principal diagnoses
Notes
1. See Appendix A, Table A8.4 for source data. Conditions were classified as follows: cystic fibrosis (E84); pneumonia (J12–J18); chronic obstructive pulmonary disease (COPD) (J40–J44).
2. Cystic fibrosis classified according to International Classification of Diseases, 10th Revision (ICD-10) code J47.
Source: AIHW National Hospital Morbidity Database.
Figure 8.4. Hospitalisations where bronchiectasis was an additional diagnosis, 2006–07
In 2006–07, the most common additional diagnoses where bronchiectasis was the principal diagnosis were pseudomonas infection, tobacco use, high blood pressure, Type 2 diabetes, unspecified lower respiratory infections, influenza and asthma.
60
9. Cystic fibrosis
Cystic fibrosis (CF) is an inherited, progressive multi-system disease that begins in early childhood. It predominantly affects the lungs and digestive tract. Difficulty in clearing secretions from the airways results in frequent serious respiratory infections and progressive airflow obstruction. It is most common in people of European Caucasian ancestry.
Most of the disabilities, illness and deaths from cystic fibrosis are from the effects on the lungs (see Box 9.1).
Box 9.1 : Effects of cystic fibrosis (CF) on the respiratory clearance mechanism
People with CF have abnormal functioning of a cell protein called the Cystic Fibrosis Transmembrane Regulator (CFTR). CFTR controls the flow of water and certain salts in and out of the body’s cells. The lining of the lungs are composed of cells known as epithelia. CF affects these epithelial cells. The mucus that they produce is dehydrated, thicker than normal and sticky. This mucus is harder to clear from the lungs and does not efficiently perform its function in the respiratory clearance mechanism.
Respiratory symptoms are the most common early symptoms of CF. The lungs are essentially normal and sterile at birth but soon become affected. Effects usually show within the first year of life, however, a minority may not show symptoms until later, sometimes even in adulthood.
Most commonly, children with CF have a persistent cough, unsuccessfully attempting to clear mucus. The presence of uncleared mucus may result in a wheeze.
Lung infections are very common in children with CF because the bacteria that are normally cleared remain in the thick tenacious mucus. Many of the infections are chronic and can result in pneumonia. These repeated infections can lead to irreversible scarring of lung tissue.
Children with CF also have involvement of the upper respiratory tract. For example, they have a high rate of sinus infections. Some individuals develop small protrusions of tissue from the lining of the nose (polyps).
CF is a disease characterised by both long-term and short-term fluctuations in lung function, chronic bacterial infection and other exacerbations.
While a decline in lung function is typical of almost all patients with CF, the rate of decline is highly variable. The most common patterns are: an early linear decline; no change for some time then a linear decline; or no distinguishable pattern. The factors contributing to the decline in lung function are: obstruction of the small airways, obstruction of the larger airways; and changes in the volume of air contained and expelled from the lungs.
These conditions continue throughout life but with aggressive management the progression of damage can be slowed. Early detection is aimed at providing high quality of life for as long as possible. This is achieved by slowing the deterioration of lung function that will occur if the disease is not managed well. The rate of decline in lung function is routinely evaluated in patients with CF.
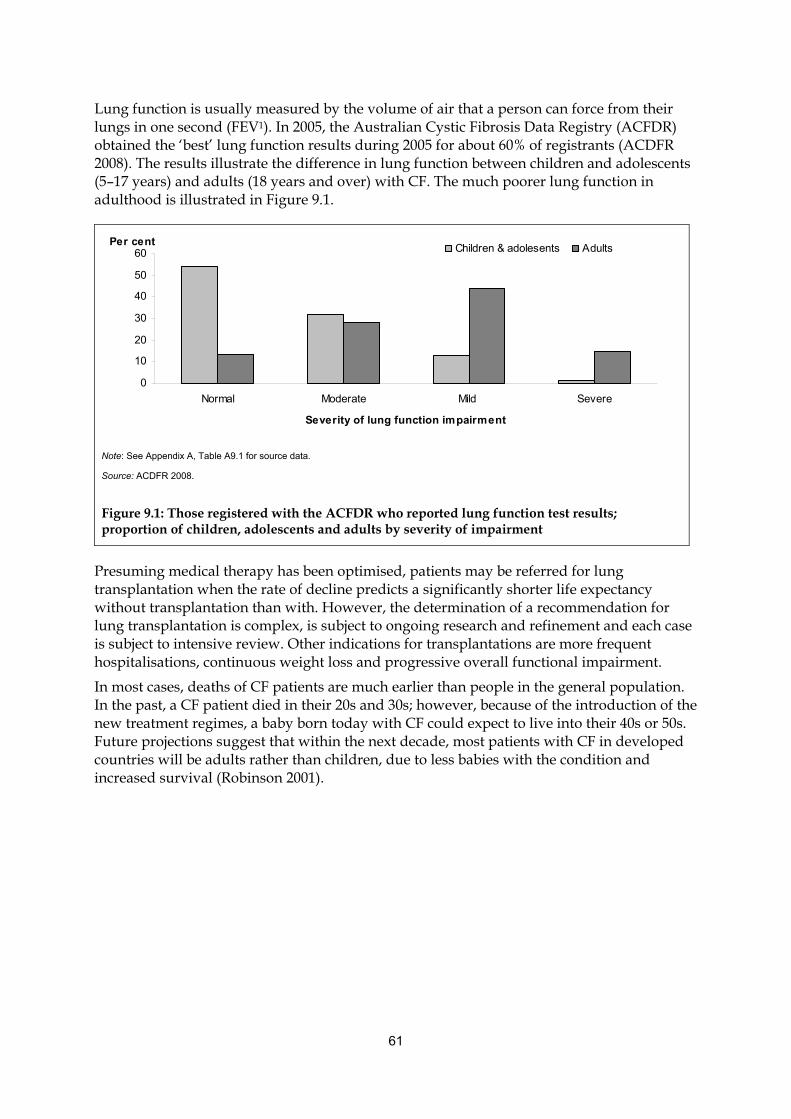
61
Lung function is usually measured by the volume of air that a person can force from their lungs in one second (FEV1). In 2005, the Australian Cystic Fibrosis Data Registry (ACFDR) obtained the ‘best’ lung function results during 2005 for about 60% of registrants (ACDFR 2008). The results illustrate the difference in lung function between children and adolescents (5–17 years) and adults (18 years and over) with CF. The much poorer lung function in adulthood is illustrated in Figure 9.1.
0
10
20
30
40
50
60
Normal Moderate Mild Severe
Severity of lung function impairment
Children & adolesents AdultsPer cent
Note: See Appendix A, Table A9.1 for source data.
Source: ACDFR 2008.
Figure 9.1: Those registered with the ACFDR who reported lung function test results; proportion of children, adolescents and adults by severity of impairment
Presuming medical therapy has been optimised, patients may be referred for lung transplantation when the rate of decline predicts a significantly shorter life expectancy without transplantation than with. However, the determination of a recommendation for lung transplantation is complex, is subject to ongoing research and refinement and each case is subject to intensive review. Other indications for transplantations are more frequent hospitalisations, continuous weight loss and progressive overall functional impairment.
In most cases, deaths of CF patients are much earlier than people in the general population. In the past, a CF patient died in their 20s and 30s; however, because of the introduction of the new treatment regimes, a baby born today with CF could expect to live into their 40s or 50s. Future projections suggest that within the next decade, most patients with CF in developed countries will be adults rather than children, due to less babies with the condition and increased survival (Robinson 2001).
62
9.1 General epidemiology
9.1.1 Incidence
Cystic fibrosis is Australia’s most common inherited recessive genetic condition but the incidence is declining.
The Australian Cystic Fibrosis Data Registry (ACFDR) aims to register all Australians with cystic fibrosis (ACDFR 2008). The registry reported 55 new diagnoses of CF made before the age of 1 year during 2005 (see Box 9.2). There were a further 105 people registered in the year but these cannot be included as new incidences as the diagnosis was made before 2005.
Box 9.2: Diagnosis of CF Currently, in Australia, about 85% of cystic fibrosis diagnoses are made within the first two months of birth. Neonatal screening programs test a blood sample drawn from the heel of all newborn babies at around three days. Where the concentration of immuno-reactive trypsin (IRT), a product of the pancreas and a key indicator for CF, is found to be in the highest 1% of all samples, testing is carried out to look for genetic mutations associated with cystic fibrosis.
Where two copies of a CF gene mutation are found, the infant has CF. Where one copy is found, the presence or absence of CF is determined by a sweat test for elevated electrolyte levels. If no copies are found, it is unlikely but not impossible that the child has CF. Only the most common CF gene mutations are looked for.
Some other early signs may aid diagnosis. The most common of these is meconium ileus, or failure to pass meconium (the earliest faecal matter) from the intestines within 48 hours of birth.
If a child with CF is not diagnosed through genetic testing early in life, they will present with symptoms later. These could be respiratory distress, pancreatic insufficiency, rectal prolapse or failure to thrive. Infertility when older can be the first recognised symptom.
Where there is already a CF sibling, diagnosis may be established by antenatal testing of fetal DNA obtained by amniocentesis.
Source: ACDFR 2008.
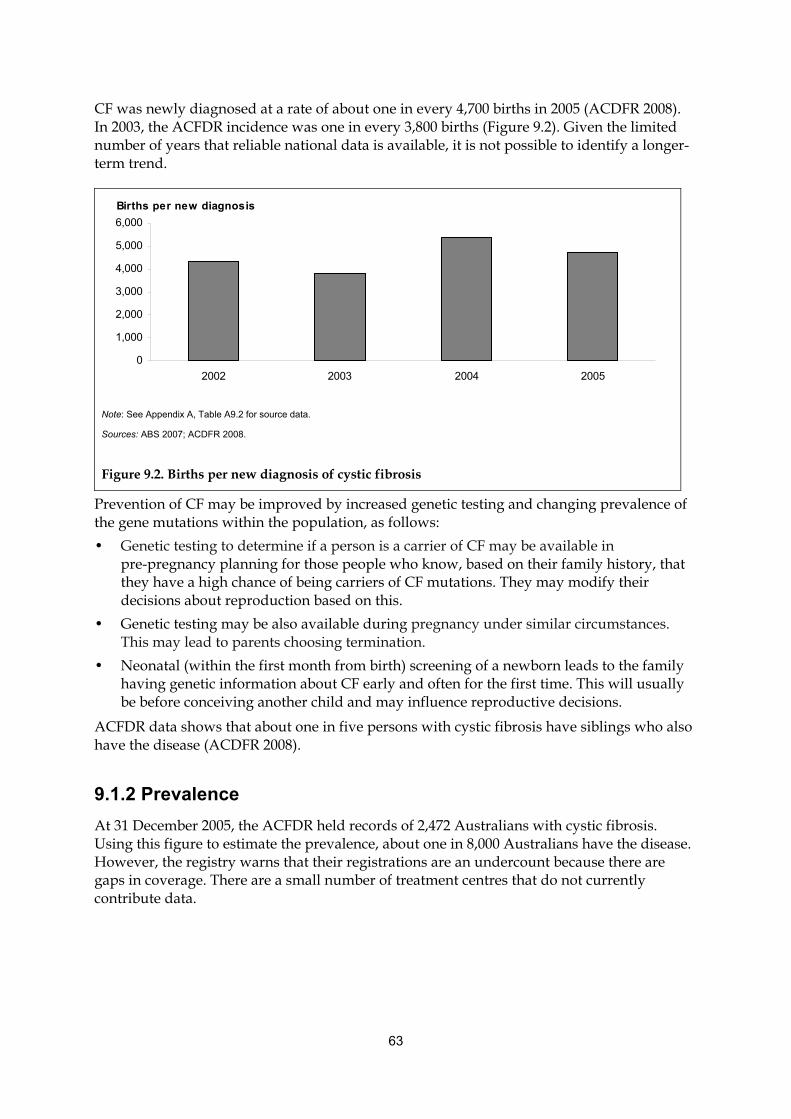
63
CF was newly diagnosed at a rate of about one in every 4,700 births in 2005 (ACDFR 2008). In 2003, the ACFDR incidence was one in every 3,800 births (Figure 9.2). Given the limited number of years that reliable national data is available, it is not possible to identify a longer-term trend.
0
1,000
2,000
3,000
4,000
5,000
6,000
2002 2003 2004 2005
Births per new diagnosis
Note: See Appendix A, Table A9.2 for source data.
Sources: ABS 2007; ACDFR 2008.
Figure 9.2. Births per new diagnosis of cystic fibrosis
Prevention of CF may be improved by increased genetic testing and changing prevalence of the gene mutations within the population, as follows:
• Genetic testing to determine if a person is a carrier of CF may be available in pre-pregnancy planning for those people who know, based on their family history, that they have a high chance of being carriers of CF mutations. They may modify their decisions about reproduction based on this.
• Genetic testing may be also available during pregnancy under similar circumstances. This may lead to parents choosing termination.
• Neonatal (within the first month from birth) screening of a newborn leads to the family having genetic information about CF early and often for the first time. This will usually be before conceiving another child and may influence reproductive decisions.
ACFDR data shows that about one in five persons with cystic fibrosis have siblings who also have the disease (ACDFR 2008).
9.1.2 Prevalence
At 31 December 2005, the ACFDR held records of 2,472 Australians with cystic fibrosis. Using this figure to estimate the prevalence, about one in 8,000 Australians have the disease. However, the registry warns that their registrations are an undercount because there are gaps in coverage. There are a small number of treatment centres that do not currently contribute data.
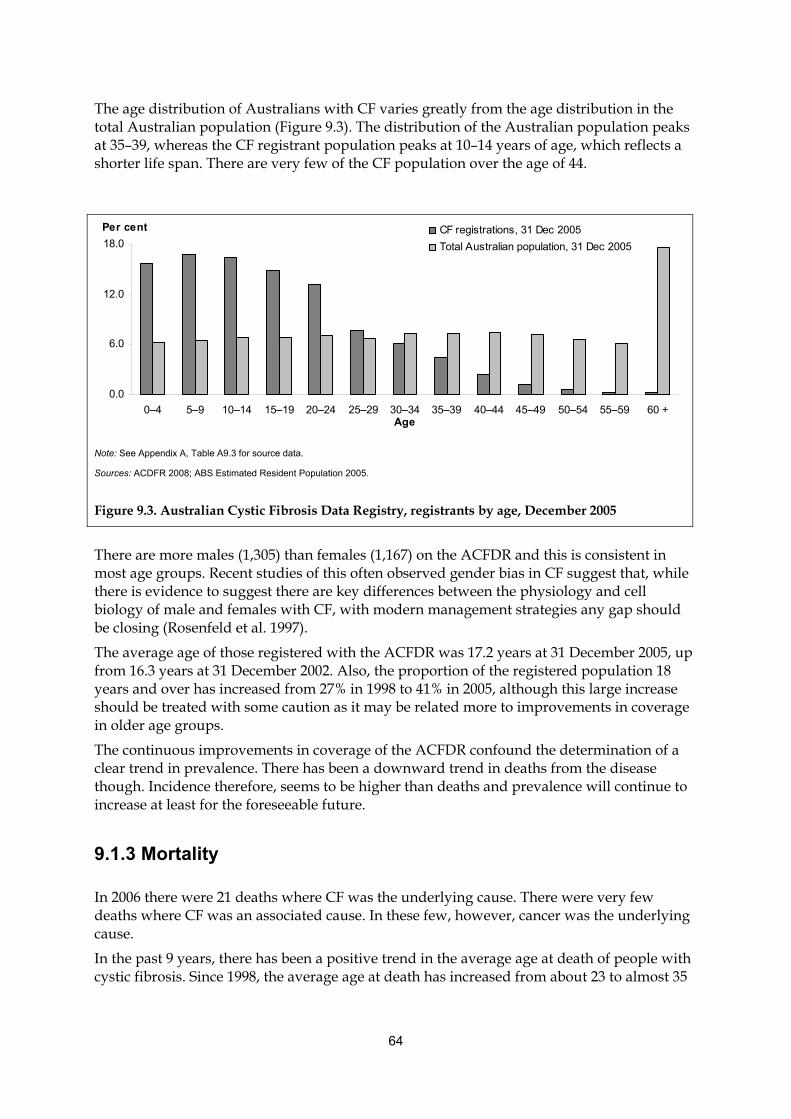
64
The age distribution of Australians with CF varies greatly from the age distribution in the total Australian population (Figure 9.3). The distribution of the Australian population peaks at 35–39, whereas the CF registrant population peaks at 10–14 years of age, which reflects a shorter life span. There are very few of the CF population over the age of 44.
There are more males (1,305) than females (1,167) on the ACFDR and this is consistent in most age groups. Recent studies of this often observed gender bias in CF suggest that, while there is evidence to suggest there are key differences between the physiology and cell biology of male and females with CF, with modern management strategies any gap should be closing (Rosenfeld et al. 1997).
The average age of those registered with the ACFDR was 17.2 years at 31 December 2005, up from 16.3 years at 31 December 2002. Also, the proportion of the registered population 18 years and over has increased from 27% in 1998 to 41% in 2005, although this large increase should be treated with some caution as it may be related more to improvements in coverage in older age groups.
The continuous improvements in coverage of the ACFDR confound the determination of a clear trend in prevalence. There has been a downward trend in deaths from the disease though. Incidence therefore, seems to be higher than deaths and prevalence will continue to increase at least for the foreseeable future.
9.1.3 Mortality
In 2006 there were 21 deaths where CF was the underlying cause. There were very few deaths where CF was an associated cause. In these few, however, cancer was the underlying cause.
In the past 9 years, there has been a positive trend in the average age at death of people with cystic fibrosis. Since 1998, the average age at death has increased from about 23 to almost 35
0.0
6.0
12.0
18.0
0–4 5–9 10–14 15–19 20–24 25–29 30–34 35–39 40–44 45–49 50–54 55–59 60 +Age
CF registrations, 31 Dec 2005
Total Australian population, 31 Dec 2005
Per cent
Note: See Appendix A, Table A9.3 for source data.
Sources: ACDFR 2008; ABS Estimated Resident Population 2005.
Figure 9.3. Australian Cystic Fibrosis Data Registry, registrants by age, December 2005
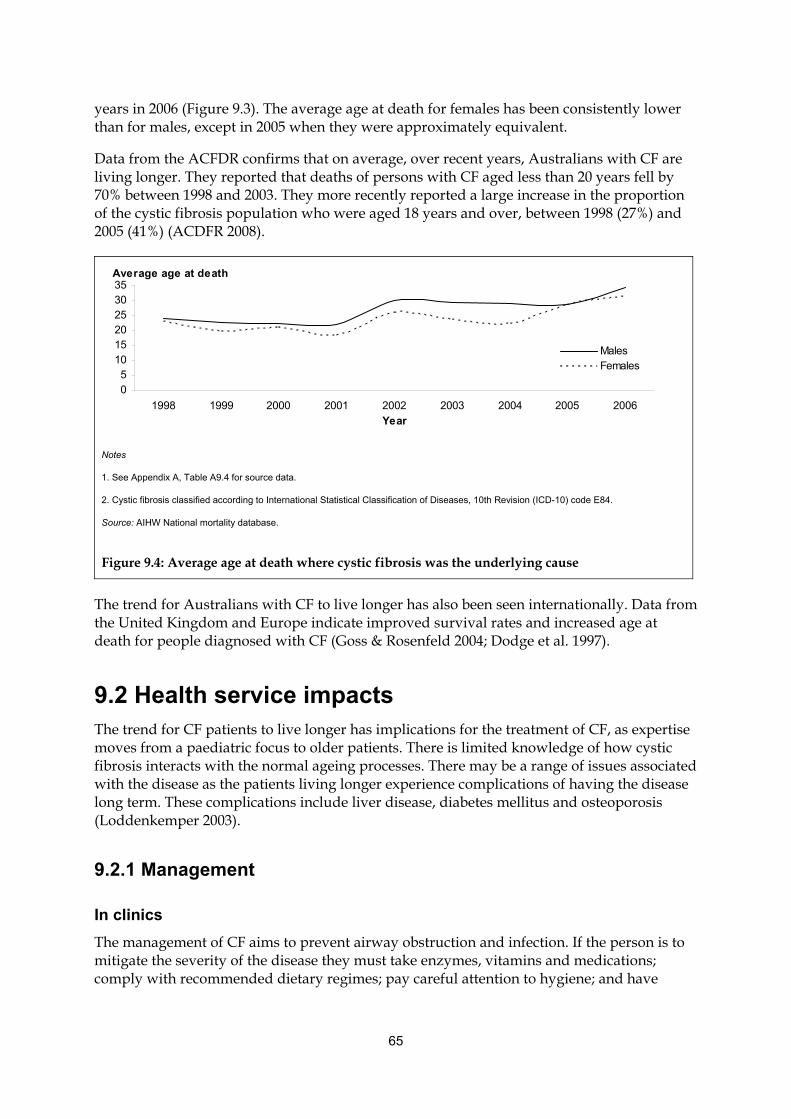
65
years in 2006 (Figure 9.3). The average age at death for females has been consistently lower than for males, except in 2005 when they were approximately equivalent.
Data from the ACFDR confirms that on average, over recent years, Australians with CF are living longer. They reported that deaths of persons with CF aged less than 20 years fell by 70% between 1998 and 2003. They more recently reported a large increase in the proportion of the cystic fibrosis population who were aged 18 years and over, between 1998 (27%) and 2005 (41%) (ACDFR 2008).
05
101520253035
1998 1999 2000 2001 2002 2003 2004 2005 2006
Year
MalesFemales
Average age at death
Notes
1. See Appendix A, Table A9.4 for source data.
2. Cystic fibrosis classified according to International Statistical Classification of Diseases, 10th Revision (ICD-10) code E84.
Source: AIHW National mortality database.
Figure 9.4: Average age at death where cystic fibrosis was the underlying cause
The trend for Australians with CF to live longer has also been seen internationally. Data from the United Kingdom and Europe indicate improved survival rates and increased age at death for people diagnosed with CF (Goss & Rosenfeld 2004; Dodge et al. 1997).
9.2 Health service impacts The trend for CF patients to live longer has implications for the treatment of CF, as expertise moves from a paediatric focus to older patients. There is limited knowledge of how cystic fibrosis interacts with the normal ageing processes. There may be a range of issues associated with the disease as the patients living longer experience complications of having the disease long term. These complications include liver disease, diabetes mellitus and osteoporosis (Loddenkemper 2003).
9.2.1 Management
In clinics
The management of CF aims to prevent airway obstruction and infection. If the person is to mitigate the severity of the disease they must take enzymes, vitamins and medications; comply with recommended dietary regimes; pay careful attention to hygiene; and have
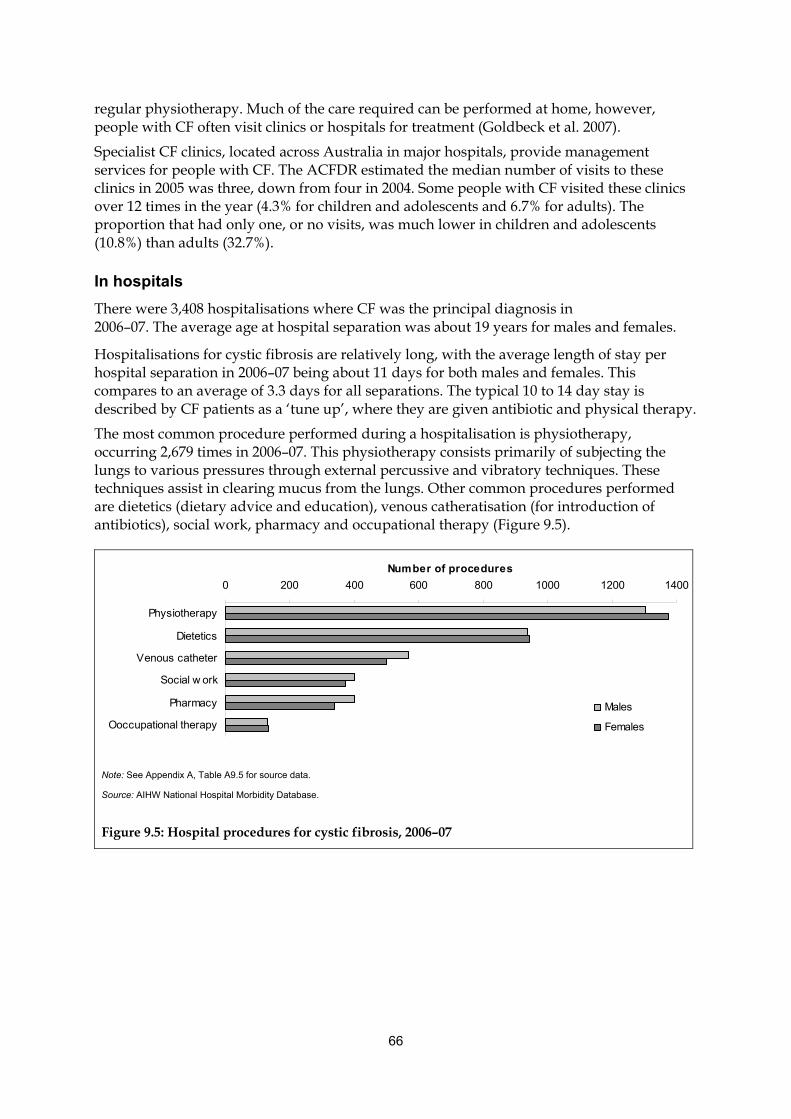
66
regular physiotherapy. Much of the care required can be performed at home, however, people with CF often visit clinics or hospitals for treatment (Goldbeck et al. 2007).
Specialist CF clinics, located across Australia in major hospitals, provide management services for people with CF. The ACFDR estimated the median number of visits to these clinics in 2005 was three, down from four in 2004. Some people with CF visited these clinics over 12 times in the year (4.3% for children and adolescents and 6.7% for adults). The proportion that had only one, or no visits, was much lower in children and adolescents (10.8%) than adults (32.7%).
In hospitals
There were 3,408 hospitalisations where CF was the principal diagnosis in 2006–07. The average age at hospital separation was about 19 years for males and females.
Hospitalisations for cystic fibrosis are relatively long, with the average length of stay per hospital separation in 2006–07 being about 11 days for both males and females. This compares to an average of 3.3 days for all separations. The typical 10 to 14 day stay is described by CF patients as a ‘tune up’, where they are given antibiotic and physical therapy.
The most common procedure performed during a hospitalisation is physiotherapy, occurring 2,679 times in 2006–07. This physiotherapy consists primarily of subjecting the lungs to various pressures through external percussive and vibratory techniques. These techniques assist in clearing mucus from the lungs. Other common procedures performed are dietetics (dietary advice and education), venous catheratisation (for introduction of antibiotics), social work, pharmacy and occupational therapy (Figure 9.5).
0 200 400 600 800 1000 1200 1400
Physiotherapy
Dietetics
Venous catheter
Social w ork
Pharmacy
Ooccupational therapy
Number of procedures
Males
Females
Note: See Appendix A, Table A9.5 for source data.
Source: AIHW National Hospital Morbidity Database.
Figure 9.5: Hospital procedures for cystic fibrosis, 2006–07
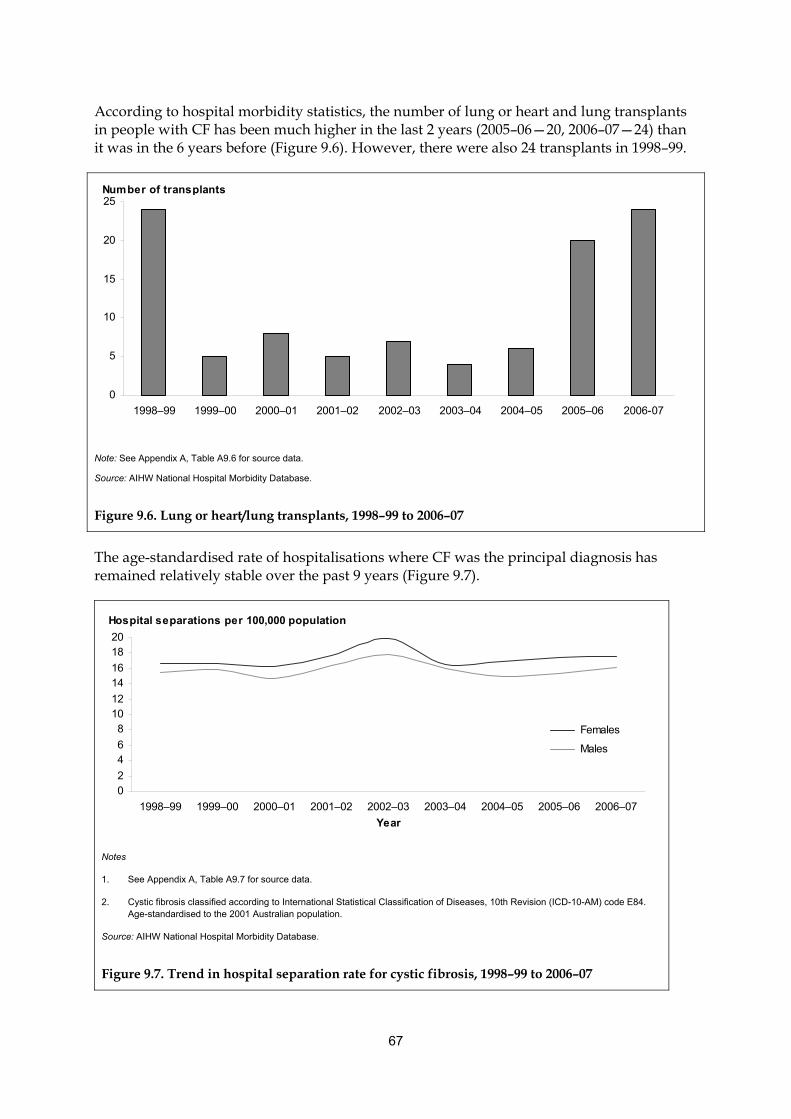
67
According to hospital morbidity statistics, the number of lung or heart and lung transplants in people with CF has been much higher in the last 2 years (2005–06—20, 2006–07—24) than it was in the 6 years before (Figure 9.6). However, there were also 24 transplants in 1998–99.
0
5
10
15
20
25
1998–99 1999–00 2000–01 2001–02 2002–03 2003–04 2004–05 2005–06 2006-07
Number of transplants
Note: See Appendix A, Table A9.6 for source data.
Source: AIHW National Hospital Morbidity Database.
Figure 9.6. Lung or heart/lung transplants, 1998–99 to 2006–07
The age-standardised rate of hospitalisations where CF was the principal diagnosis has remained relatively stable over the past 9 years (Figure 9.7).
Hospital separations per 100,000 population
02
46
81012
1416
1820
1998–99 1999–00 2000–01 2001–02 2002–03 2003–04 2004–05 2005–06 2006–07
Year
Females
Males
Notes
1. See Appendix A, Table A9.7 for source data.
2. Cystic fibrosis classified according to International Statistical Classification of Diseases, 10th Revision (ICD-10-AM) code E84. Age-standardised to the 2001 Australian population.
Source: AIHW National Hospital Morbidity Database.
Figure 9.7. Trend in hospital separation rate for cystic fibrosis, 1998–99 to 2006–07
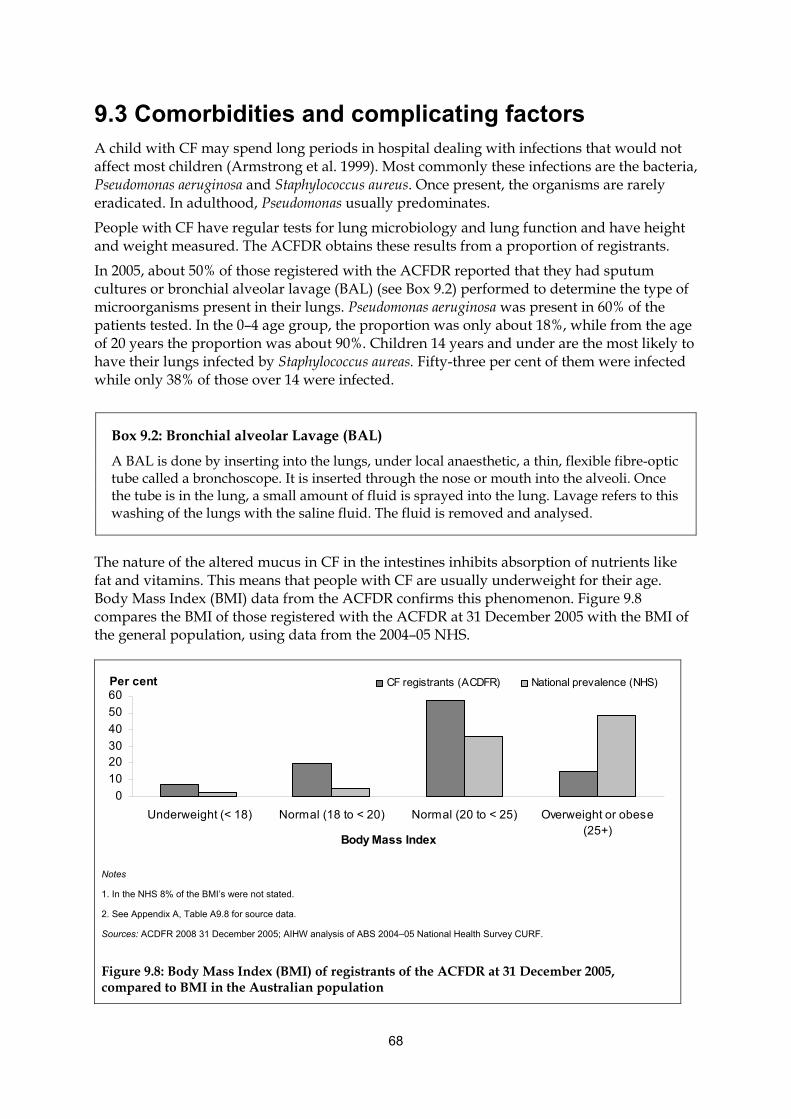
68
9.3 Comorbidities and complicating factors A child with CF may spend long periods in hospital dealing with infections that would not affect most children (Armstrong et al. 1999). Most commonly these infections are the bacteria, Pseudomonas aeruginosa and Staphylococcus aureus. Once present, the organisms are rarely eradicated. In adulthood, Pseudomonas usually predominates.
People with CF have regular tests for lung microbiology and lung function and have height and weight measured. The ACFDR obtains these results from a proportion of registrants.
In 2005, about 50% of those registered with the ACFDR reported that they had sputum cultures or bronchial alveolar lavage (BAL) (see Box 9.2) performed to determine the type of microorganisms present in their lungs. Pseudomonas aeruginosa was present in 60% of the patients tested. In the 0–4 age group, the proportion was only about 18%, while from the age of 20 years the proportion was about 90%. Children 14 years and under are the most likely to have their lungs infected by Staphylococcus aureas. Fifty-three per cent of them were infected while only 38% of those over 14 were infected.
Box 9.2: Bronchial alveolar Lavage (BAL)
A BAL is done by inserting into the lungs, under local anaesthetic, a thin, flexible fibre-optic tube called a bronchoscope. It is inserted through the nose or mouth into the alveoli. Once the tube is in the lung, a small amount of fluid is sprayed into the lung. Lavage refers to this washing of the lungs with the saline fluid. The fluid is removed and analysed.
The nature of the altered mucus in CF in the intestines inhibits absorption of nutrients like fat and vitamins. This means that people with CF are usually underweight for their age. Body Mass Index (BMI) data from the ACFDR confirms this phenomenon. Figure 9.8 compares the BMI of those registered with the ACFDR at 31 December 2005 with the BMI of the general population, using data from the 2004–05 NHS.
0
10
2030
40
50
60
Underweight (< 18) Normal (18 to < 20) Normal (20 to < 25) Overweight or obese(25+)
Body Mass Index
CF registrants (ACDFR) National prevalence (NHS)Per cent
Notes
1. In the NHS 8% of the BMI’s were not stated.
2. See Appendix A, Table A9.8 for source data.
Sources: ACDFR 2008 31 December 2005; AIHW analysis of ABS 2004–05 National Health Survey CURF.
Figure 9.8: Body Mass Index (BMI) of registrants of the ACFDR at 31 December 2005, compared to BMI in the Australian population
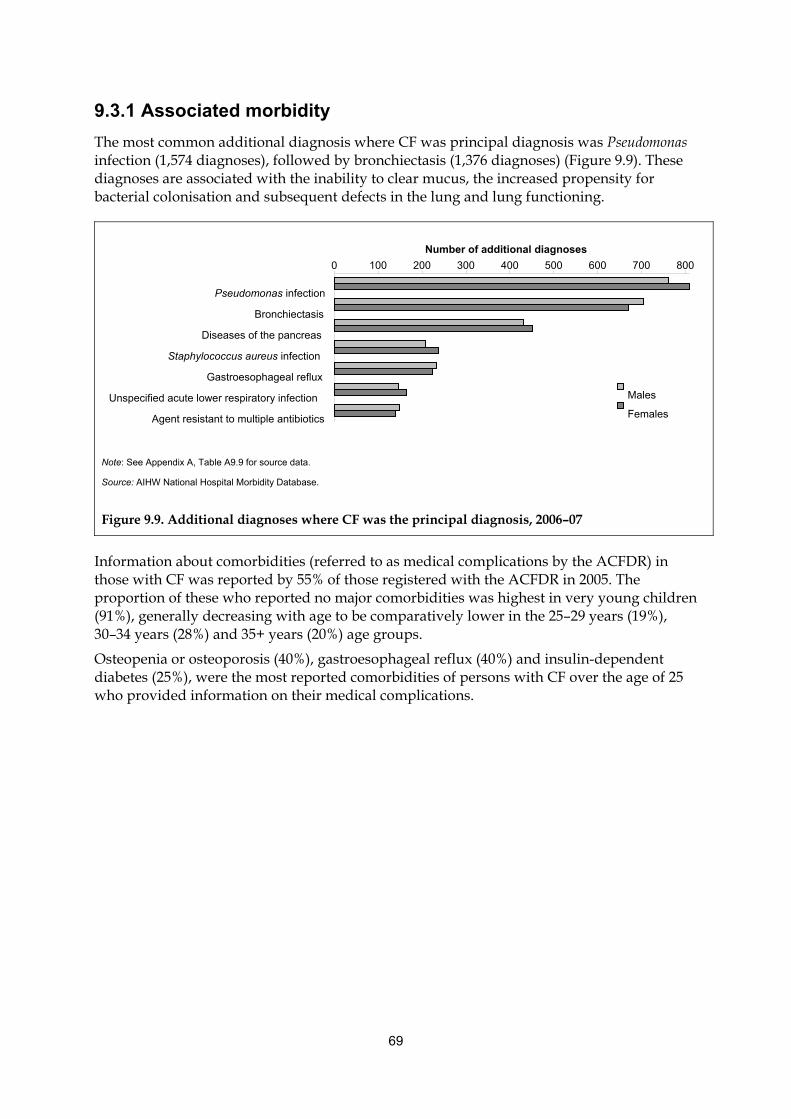
69
9.3.1 Associated morbidity
The most common additional diagnosis where CF was principal diagnosis was Pseudomonas infection (1,574 diagnoses), followed by bronchiectasis (1,376 diagnoses) (Figure 9.9). These diagnoses are associated with the inability to clear mucus, the increased propensity for bacterial colonisation and subsequent defects in the lung and lung functioning.
Note: See Appendix A, Table A9.9 for source data.
Source: AIHW National Hospital Morbidity Database.
Figure 9.9. Additional diagnoses where CF was the principal diagnosis, 2006–07
Information about comorbidities (referred to as medical complications by the ACFDR) in those with CF was reported by 55% of those registered with the ACFDR in 2005. The proportion of these who reported no major comorbidities was highest in very young children (91%), generally decreasing with age to be comparatively lower in the 25–29 years (19%), 30–34 years (28%) and 35+ years (20%) age groups.
Osteopenia or osteoporosis (40%), gastroesophageal reflux (40%) and insulin-dependent diabetes (25%), were the most reported comorbidities of persons with CF over the age of 25 who provided information on their medical complications.
0 100 200 300 400 500 600 700 800
Pseudomonas infection Bronchiectasis
Diseases of the pancreas Staphylococcus aureus infection
Gastroesophageal reflux Unspecified acute lower respiratory infection
Agent resistant to multiple antibiotics
Number of additional diagnoses
Males
Females
70
10. Pneumoconiosis
High levels of mineral or organic dusts and fibres cause the respiratory condition pneumoconiosis. It occurs most commonly from exposures in the workplace (see Box 10.1).
Box 10.1: Physical changes in pneumoconiosis
Prolonged exposure to dust and fibres can trigger an inflammatory response in lung tissues. For most types of pneumoconiosis this leads to diffuse scarring of the lung, also called pulmonary fibrosis (Chong et al. 2006). The scarring and inflammation of the lung progressively worsens in time. It causes the lungs to lose their elasticity and to decrease the surface area used to exchange gases, such as oxygen. Lung function ultimately declines.
In the advanced stages the main symptom of pneumoconiosis is breathlessness. In the early stages there are often no symptoms.
10.1 Causes of pneumoconiosis The three most common causes of pneumoconiosis in Australia are asbestos, silica and coal.
10.1.1 Asbestos
Asbestos is a general term used to describe several fibrous minerals including chrysotile, crocidolite and amosite. While it is best known as a cause of mesothelioma (a type of cancer), asbestos causes other respiratory conditions, such as bronchogenic carcinoma, benign pleural conditions and pneumoconiosis.
Asbestosis, a type of pneumoconiosis, is mostly caused by workplace exposure to asbestos. Occupations at greatest risk of asbestos exposure include asbestos mine workers, power station workers and railway labourers (Smith & Leggat 2006). Non-occupational exposure can occur through living near asbestos mines and domestic use of asbestos building products and piping. There is a risk of exposure during renovation and demolition of old buildings that still contain the fibres.
The degree of cumulative asbestos exposure at work affects the time before onset of symptoms and the rate of progression. Changes in industrial hygiene and other asbestos-related work practices resulted in declines in death rates from the 1950s to 1990s and a longer lag time following exposure to the onset of symptoms (ASCC 2006).
10.1.2 Silica
Silica or silicon dioxide commonly comes in the form of quartz and sand. Other forms of silica are tridymite and cristbalite. It is used to manufacture glass, ceramics and as an abrasive agent.
The inhalation of large amounts of fine particles of crystalline silica causes silicosis. Silica, in the forms of tridymite and cristbalite, are more likely to cause fibrotic changes in the lungs.
71
Occupations such as mining, and other quarrying and tunnelling operations, are associated with silicosis (Smith & Leggat 2006).
Exposure to sudden large amounts of free silica, usually in the form of quartz, can cause a severe acute form of silicosis (SABRE 2008). Death may occur within a couple of years of initial exposure. Due to strict regulations, silica exposure is now extremely rare. The most common form of silicosis is chronic silicosis where the time from exposure to the onset of symptoms is years to decades.
10.1.3 Coal
Coal worker pneumoconiosis is caused by exposure and inhalation of large amounts of washed coal (Smith & Leggat 2006). People are at a greater risk of this condition if they are exposed to coal dust over a long period of time. Symptoms are not often seen until 10 to 20 years following exposure. Chronic exposure to coal dust can also lead to COPD.
10.2 General epidemiology
10.2.1 Incidence
Two surveillance systems in Australia generate data on the incidence of occupational respiratory diseases. One is based on notifications by respiratory physicians of diagnosed cases and the other on successful workers compensation claims.
Data sources
The Surveillance and Australian Workplace Based Respiratory Events (SABRE) is an occupational respiratory disease surveillance notification system. SABRE has operated in Victoria and Tasmania since 1997 and in New South Wales since 2001. The system involves voluntary and anonymous reporting by respiratory and occupational physicians of respiratory events encountered in their practices. The coverage is incomplete as not all physicians who see cases of workplace-based respiratory diseases notify.
The lack of coverage across states means that SABRE data cannot be considered representative of Australia as a whole.
The National Occupational Health and Safety Commission (NOHSC) maintains the National Data Set for Compensation-based Statistics (NDSCS), another source of information on pneumoconiosis incidence. This database contains information on new cases of compensable work-related injury and disease, thereby providing some estimation of the incidence of such diseases.
Surveillance of Australian Workplace Based Respiratory Events
In NSW, there were 366 notified cases of asbestosis and 87 notified cases of silicosis from 2001 to July 2008 (SABRE 2008). In Victoria and Tasmania, around 90 cases of pneumoconiosis were notified to the SABRE system from 1999 to 2005 (Sim et al. 2005). The variation between states may be due to the different industries operating in each state and different reporting rates by physicians in each of the states.
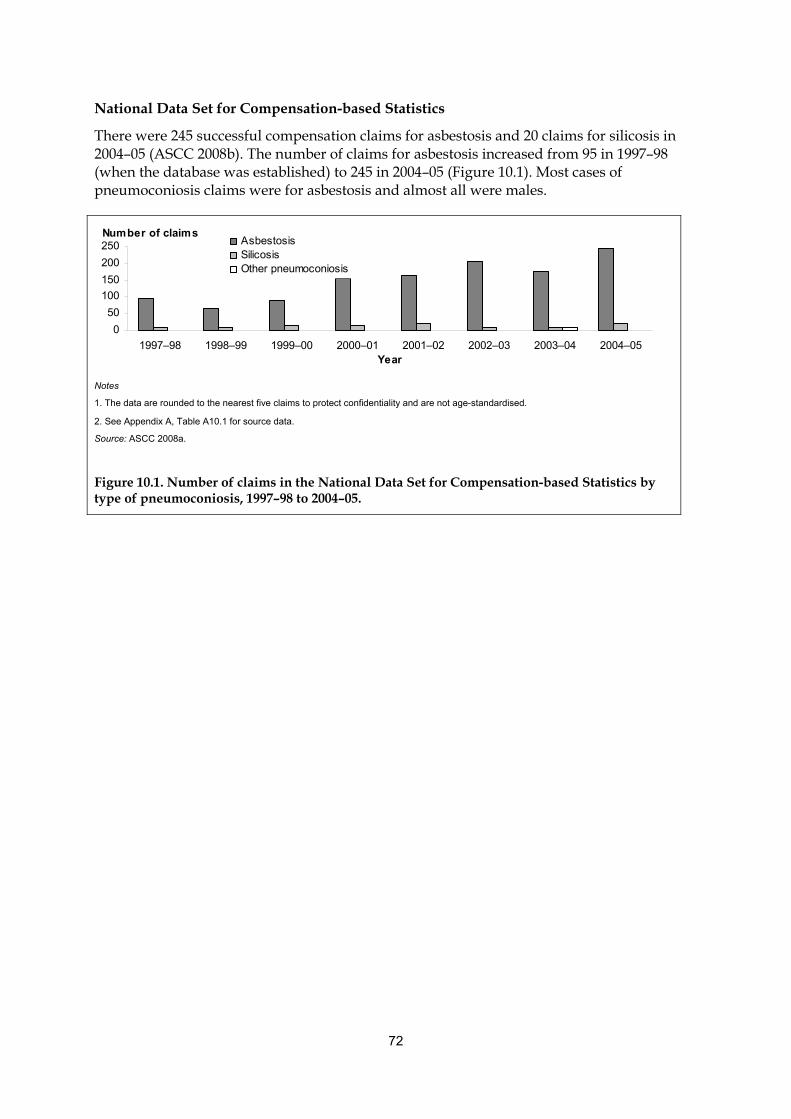
72
National Data Set for Compensation-based Statistics
There were 245 successful compensation claims for asbestosis and 20 claims for silicosis in 2004–05 (ASCC 2008b). The number of claims for asbestosis increased from 95 in 1997–98 (when the database was established) to 245 in 2004–05 (Figure 10.1). Most cases of pneumoconiosis claims were for asbestosis and almost all were males.
0
50
100
150
200
250
1997–98 1998–99 1999–00 2000–01 2001–02 2002–03 2003–04 2004–05Year
AsbestosisSilicosisOther pneumoconiosis
Number of claims
Notes
1. The data are rounded to the nearest five claims to protect confidentiality and are not age-standardised.
2. See Appendix A, Table A10.1 for source data.
Source: ASCC 2008a.
Figure 10.1. Number of claims in the National Data Set for Compensation-based Statistics by type of pneumoconiosis, 1997–98 to 2004–05.
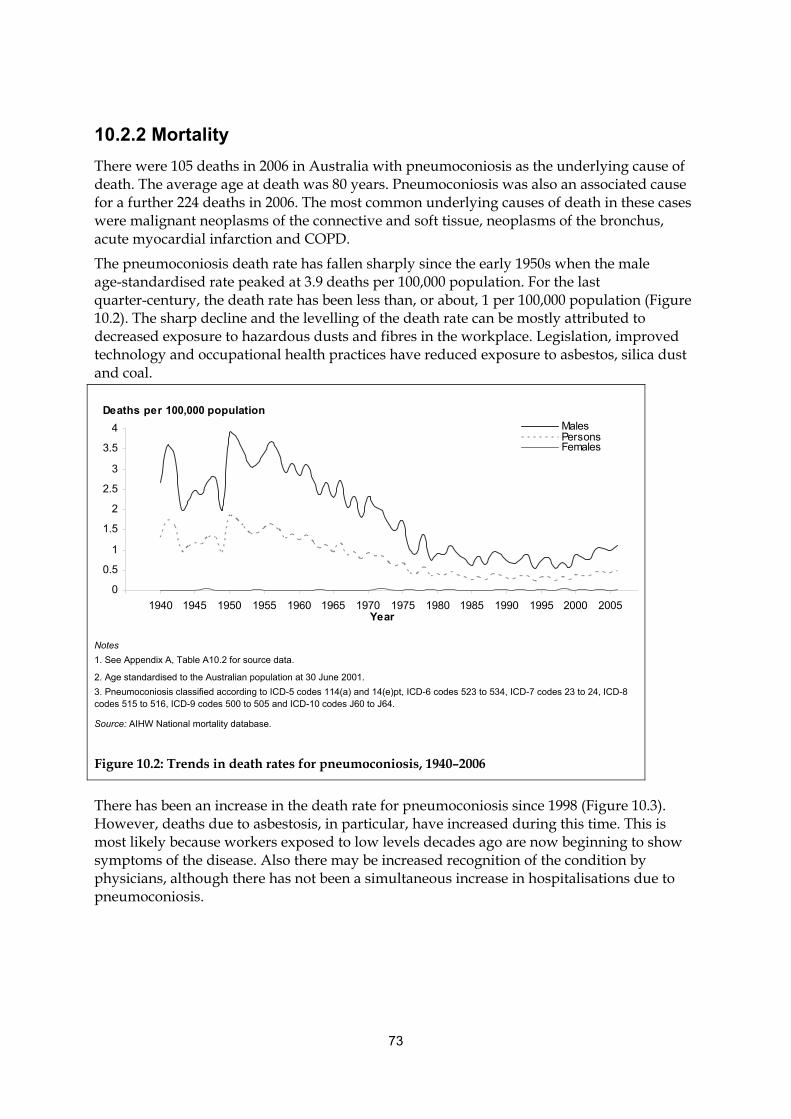
73
10.2.2 Mortality
There were 105 deaths in 2006 in Australia with pneumoconiosis as the underlying cause of death. The average age at death was 80 years. Pneumoconiosis was also an associated cause for a further 224 deaths in 2006. The most common underlying causes of death in these cases were malignant neoplasms of the connective and soft tissue, neoplasms of the bronchus, acute myocardial infarction and COPD.
The pneumoconiosis death rate has fallen sharply since the early 1950s when the male age-standardised rate peaked at 3.9 deaths per 100,000 population. For the last quarter-century, the death rate has been less than, or about, 1 per 100,000 population (Figure 10.2). The sharp decline and the levelling of the death rate can be mostly attributed to decreased exposure to hazardous dusts and fibres in the workplace. Legislation, improved technology and occupational health practices have reduced exposure to asbestos, silica dust and coal.
0
0.5
1
1.5
2
2.5
3
3.5
4
1940 1945 1950 1955 1960 1965 1970 1975 1980 1985 1990 1995 2000 2005Year
MalesPersonsFemales
Deaths per 100,000 population
Notes
1. See Appendix A, Table A10.2 for source data.
2. Age standardised to the Australian population at 30 June 2001.
3. Pneumoconiosis classified according to ICD-5 codes 114(a) and 14(e)pt, ICD-6 codes 523 to 534, ICD-7 codes 23 to 24, ICD-8 codes 515 to 516, ICD-9 codes 500 to 505 and ICD-10 codes J60 to J64.
Source: AIHW National mortality database.
Figure 10.2: Trends in death rates for pneumoconiosis, 1940–2006
There has been an increase in the death rate for pneumoconiosis since 1998 (Figure 10.3). However, deaths due to asbestosis, in particular, have increased during this time. This is most likely because workers exposed to low levels decades ago are now beginning to show symptoms of the disease. Also there may be increased recognition of the condition by physicians, although there has not been a simultaneous increase in hospitalisations due to pneumoconiosis.
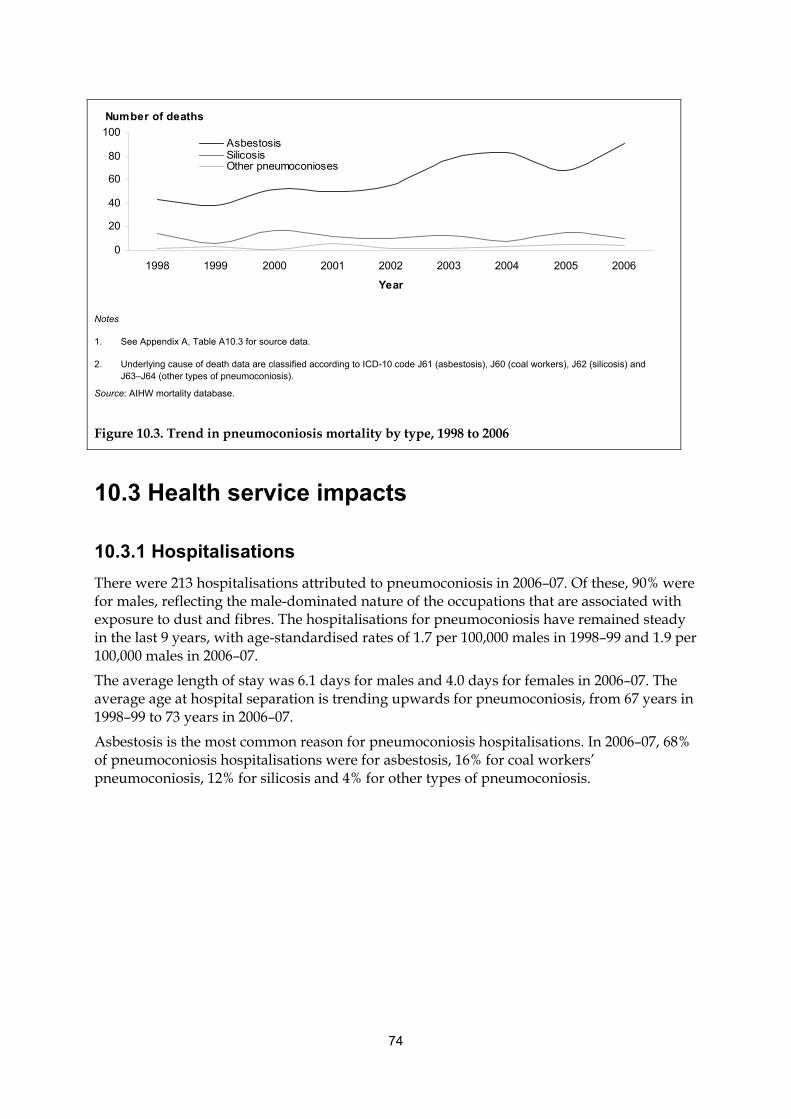
74
0
20
40
60
80
100
1998 1999 2000 2001 2002 2003 2004 2005 2006
Year
AsbestosisSilicosisOther pneumoconioses
Number of deaths
Notes
1. See Appendix A, Table A10.3 for source data.
2. Underlying cause of death data are classified according to ICD-10 code J61 (asbestosis), J60 (coal workers), J62 (silicosis) and J63–J64 (other types of pneumoconiosis).
Source: AIHW mortality database.
Figure 10.3. Trend in pneumoconiosis mortality by type, 1998 to 2006
10.3 Health service impacts
10.3.1 Hospitalisations
There were 213 hospitalisations attributed to pneumoconiosis in 2006–07. Of these, 90% were for males, reflecting the male-dominated nature of the occupations that are associated with exposure to dust and fibres. The hospitalisations for pneumoconiosis have remained steady in the last 9 years, with age-standardised rates of 1.7 per 100,000 males in 1998–99 and 1.9 per 100,000 males in 2006–07.
The average length of stay was 6.1 days for males and 4.0 days for females in 2006–07. The average age at hospital separation is trending upwards for pneumoconiosis, from 67 years in 1998–99 to 73 years in 2006–07.
Asbestosis is the most common reason for pneumoconiosis hospitalisations. In 2006–07, 68% of pneumoconiosis hospitalisations were for asbestosis, 16% for coal workers’ pneumoconiosis, 12% for silicosis and 4% for other types of pneumoconiosis.
75
11. Sleep apnoea
Sleep apnoea (SA) is a disorder characterised by repeated breathing disturbances during sleep. People with sleep apnoea experience repeated periods of breathing cessation (apnoea) or reduced airflow (hypopnoea) that cause intermittent dips in blood oxygen saturation and also fragment sleep.
The severity varies widely. Monitoring the number and types of sleep disturbances can measure the severity of this disorder. A clinical diagnosis of SA generally requires the observation of at least five of these respiratory disturbance events per hour during sleep.
Box 11.1 Diagnosis of sleep apnoea by polysomnography
The gold standard for diagnosing SA is to use polysomnography (PSG). PSG is a comprehensive sleep monitoring test that can monitor breathing function and respiratory effort during sleep, as well as brain activity, eye movements, heart rhythm and muscle activity. The apnoea-hypopnoea index (AHI) is determined by calculating the average number of apnoea and hypopnoea events per hour of sleep.
Guidelines for the severity of SA were established by the American Academy of Sleep Medicine Task Force (American Academy of Sleep Medicine Task Force 1999) and adopted as guidelines by the Australasian Sleep Association and the Thoracic Society of Australia and New Zealand in October 2005 as follows:
Normal — AHI less than 5 events per hour of sleep.
Mild — AHI 5 to 15 events per hour of sleep.
Moderate — AHI 15 to 30 events per hour of sleep.
Severe — AHI greater than 30 events per hour of sleep.
The Australasian Sleep Association and the Thoracic Society of Australia and New Zealand recommend that these guidelines be used with caution in describing severity because the technique used to underpin the guidelines has now been superseded by a more sensitive measure of airflow in most clinical laboratories.
Common symptoms of SA include persistent loud snoring, witnessed apnoea, excessive day time sleepiness, lack of energy, reduced concentration, memory impairment, morning headache, dry or sore throat on waking up, unrefreshed sleep or depression (Lam et al. 2007). The individual with SA is often unaware of any breathing difficulties.
SA can be categorised into two main syndromes, based on the underlying cause of the sleep disturbance:
• Obstructive sleep apnoea/hypopnoea syndrome (OSAHS or simply OSA) is caused by intermittent collapse of the upper airway, blocking and obstructing airflow. The smaller the upper airway space when awake, the more likely the airway collapse. Obesity and fat deposits in the airway are important contributing factors to the development of OSA. A distinguishing feature of OSA is a persistent effort to breathe against the obstructed upper airway.
• Central SA syndrome (CSAS) is much less common and occurs when the brain fails to send messages to the body to breathe.
These two syndromes can occur separately or concurrently in the same patient.
76
In addition to the definition of SA defined by polysomnography results and by the underlying cause, SA is also commonly defined as being symptomatic (present and demonstrating daytime symptoms) or asymptomatic (present but without daytime symptoms).
11.1 General epidemiology
11.1.1 Prevalence
Prevalence estimates of SA are affected by the variability of available diagnostic approaches and population characteristics. In particular, the parameters of the sleep disturbances measured vary considerably. The length of the sleep disturbances, degrees of oxygen desaturation and the apparatuses used to detect the events, contribute to differences in estimates.
Several epidemiological studies in largely Caucasian populations have shown that SA is common in middle-aged adults. A population study of 294 Australian men aged 40 to 65 years found that 26% had SA (AHI 5). Only 3% had daytime sleepiness associated with their SA (Bearpark et al. 1995).
Studies in other western populations have found similar prevalence rates. The Wisconsin Sleep Cohort Study in the United States reported that the estimated prevalence of asymptomatic OSA was 9% for women and 24% for men aged 30–60 years (Young et al. 1993). In the same study, symptomatic OSA (based on daytime sleepiness) prevalence rates were 2% for women and 4% for men.
A study of the US state of Pennsylvania found that symptomatic OSA prevalence was 1.2% for women and 3.9% for men (Bixler et al. 2001).
The reason for the lower prevalence of SA in women compared to men is not yet known. Some of the factors which may explain the differences include differences in obesity and the distribution of adipose tissue, upper-airway anatomy, upper-airway muscle function, control of ventilation, the effect of sex hormones and leptin (Kapsimalis & Kryger 2002).
Large-scale prevalence studies in Asia (Hong Kong, India and Korea) have shown prevalence rates comparable to that in Caucasian populations (Ip et al. 2001; Ip et al. 2004; Udwadia et al. 2004; Kim et al. 2004).
Similarly, the prevalence of OSA in middle-aged African–Americans is comparable to their Caucasian counterparts (Young et al. 2002b; Redline et al. 1997), however, younger African–Americans under 25 years have a higher prevalence than Caucasian–Americans of the same age (Redline et al. 1997).
Several estimates put the prevalence of OSA in children at between 1 and 2% (Brunetti et al. 2001). There is increasing recognition that OSA may have significant consequences for children, even in milder cases.
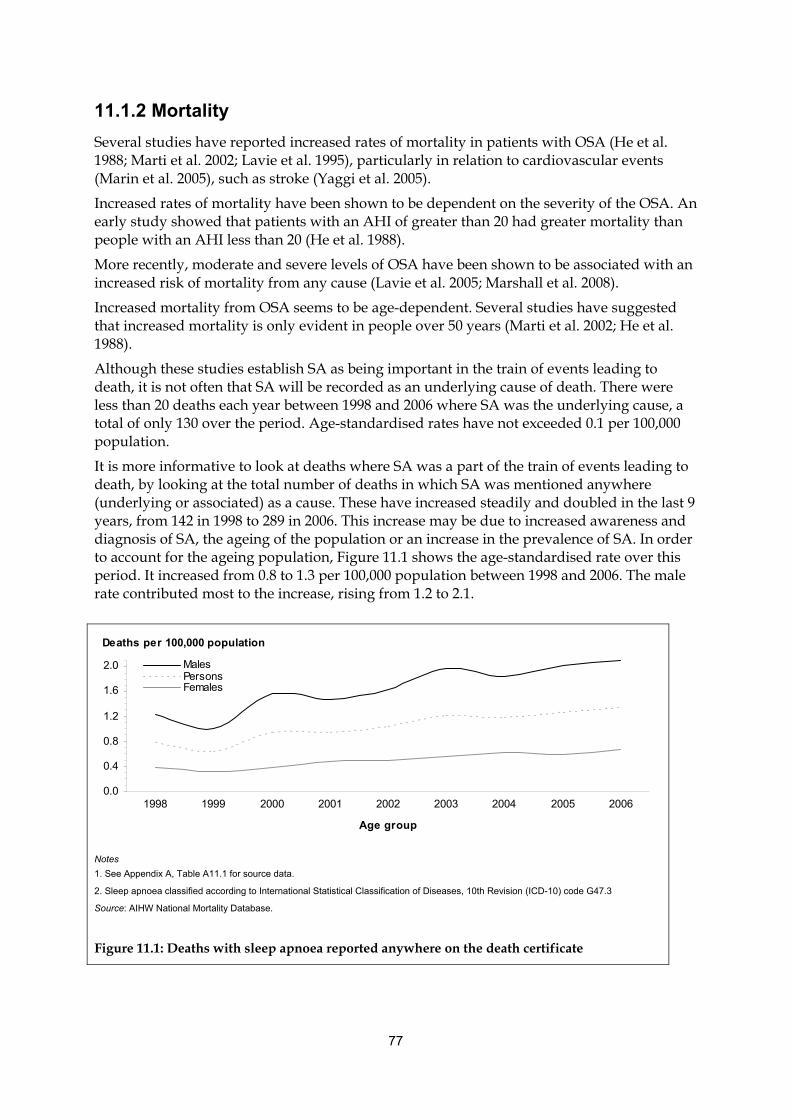
77
11.1.2 Mortality
Several studies have reported increased rates of mortality in patients with OSA (He et al. 1988; Marti et al. 2002; Lavie et al. 1995), particularly in relation to cardiovascular events (Marin et al. 2005), such as stroke (Yaggi et al. 2005).
Increased rates of mortality have been shown to be dependent on the severity of the OSA. An early study showed that patients with an AHI of greater than 20 had greater mortality than people with an AHI less than 20 (He et al. 1988).
More recently, moderate and severe levels of OSA have been shown to be associated with an increased risk of mortality from any cause (Lavie et al. 2005; Marshall et al. 2008).
Increased mortality from OSA seems to be age-dependent. Several studies have suggested that increased mortality is only evident in people over 50 years (Marti et al. 2002; He et al. 1988).
Although these studies establish SA as being important in the train of events leading to death, it is not often that SA will be recorded as an underlying cause of death. There were less than 20 deaths each year between 1998 and 2006 where SA was the underlying cause, a total of only 130 over the period. Age-standardised rates have not exceeded 0.1 per 100,000 population.
It is more informative to look at deaths where SA was a part of the train of events leading to death, by looking at the total number of deaths in which SA was mentioned anywhere (underlying or associated) as a cause. These have increased steadily and doubled in the last 9 years, from 142 in 1998 to 289 in 2006. This increase may be due to increased awareness and diagnosis of SA, the ageing of the population or an increase in the prevalence of SA. In order to account for the ageing population, Figure 11.1 shows the age-standardised rate over this period. It increased from 0.8 to 1.3 per 100,000 population between 1998 and 2006. The male rate contributed most to the increase, rising from 1.2 to 2.1.
0.0
0.4
0.8
1.2
1.6
2.0
1998 1999 2000 2001 2002 2003 2004 2005 2006
Age group
MalesPersonsFemales
Deaths per 100,000 population
Notes
1. See Appendix A, Table A11.1 for source data.
2. Sleep apnoea classified according to International Statistical Classification of Diseases, 10th Revision (ICD-10) code G47.3
Source: AIHW National Mortality Database.
Figure 11.1: Deaths with sleep apnoea reported anywhere on the death certificate
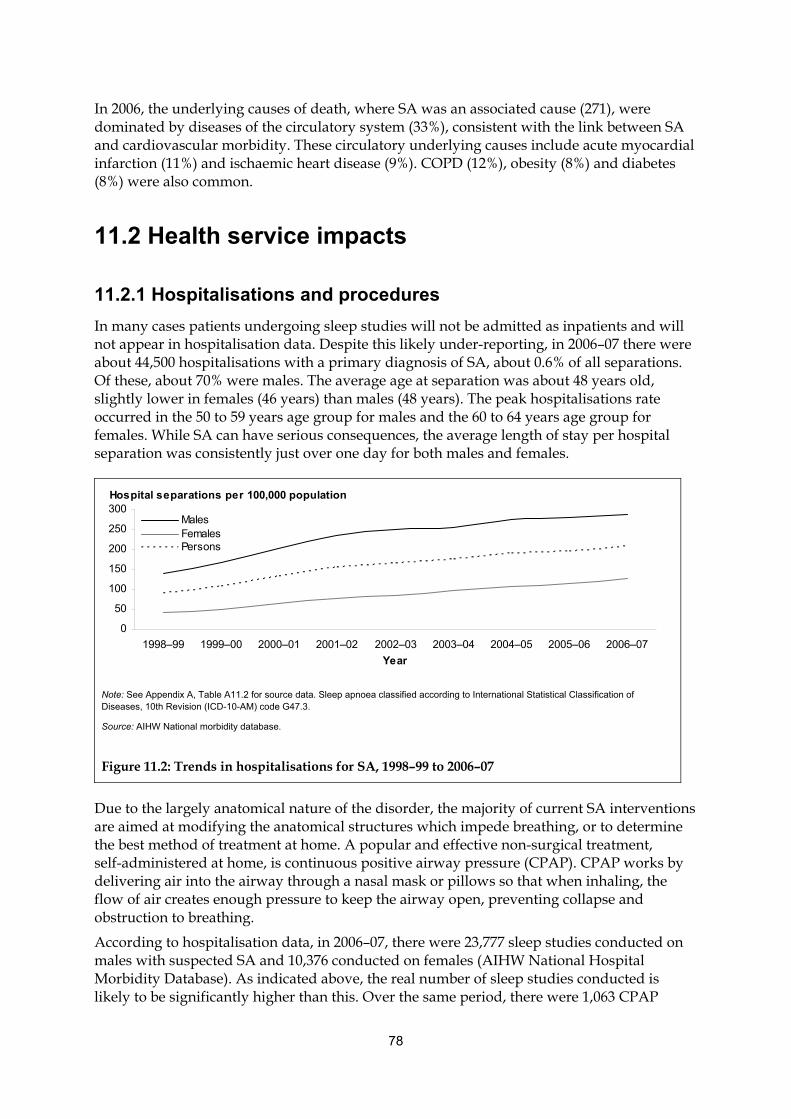
78
In 2006, the underlying causes of death, where SA was an associated cause (271), were dominated by diseases of the circulatory system (33%), consistent with the link between SA and cardiovascular morbidity. These circulatory underlying causes include acute myocardial infarction (11%) and ischaemic heart disease (9%). COPD (12%), obesity (8%) and diabetes (8%) were also common.
11.2 Health service impacts
11.2.1 Hospitalisations and procedures
In many cases patients undergoing sleep studies will not be admitted as inpatients and will not appear in hospitalisation data. Despite this likely under-reporting, in 2006–07 there were about 44,500 hospitalisations with a primary diagnosis of SA, about 0.6% of all separations. Of these, about 70% were males. The average age at separation was about 48 years old, slightly lower in females (46 years) than males (48 years). The peak hospitalisations rate occurred in the 50 to 59 years age group for males and the 60 to 64 years age group for females. While SA can have serious consequences, the average length of stay per hospital separation was consistently just over one day for both males and females.
0
50
100
150
200
250
300
1998–99 1999–00 2000–01 2001–02 2002–03 2003–04 2004–05 2005–06 2006–07
Year
MalesFemalesPersons
Hospital separations per 100,000 population
Note: See Appendix A, Table A11.2 for source data. Sleep apnoea classified according to International Statistical Classification of Diseases, 10th Revision (ICD-10-AM) code G47.3.
Source: AIHW National morbidity database.
Figure 11.2: Trends in hospitalisations for SA, 1998–99 to 2006–07
Due to the largely anatomical nature of the disorder, the majority of current SA interventions are aimed at modifying the anatomical structures which impede breathing, or to determine the best method of treatment at home. A popular and effective non-surgical treatment, self-administered at home, is continuous positive airway pressure (CPAP). CPAP works by delivering air into the airway through a nasal mask or pillows so that when inhaling, the flow of air creates enough pressure to keep the airway open, preventing collapse and obstruction to breathing.
According to hospitalisation data, in 2006–07, there were 23,777 sleep studies conducted on males with suspected SA and 10,376 conducted on females (AIHW National Hospital Morbidity Database). As indicated above, the real number of sleep studies conducted is likely to be significantly higher than this. Over the same period, there were 1,063 CPAP
79
procedures performed with females in hospital and 2,841 with males, where they had a primary diagnosis of SA. As most CPAP is undertaken nightly at home, most of the cases of using CPAP in hospital would be to determine the parameters of use for CPAP at home. In many cases the determination of the settings for a CPAP device are done at the same time as an overnight sleep study.
Another common procedure in patients with SA is the removal of the tonsils and adenoids located on either side of the throat at the back of the mouth cavity. They are lymphatic tissues, located in this area to fight infection. In 2006–07, there were 4,150 operations of this type performed in Australia on patients with a principal diagnosis of SA. Most of these operations are performed on children and teenagers under 15 years, where it is the most effective in the treatment of SA.
11.3 Comorbidities and complicating factors Repeated night-time breathing difficulties reduce the amount of oxygen in the blood (hypoxemia) and cause a person to wake briefly during sleep (arousal). This in turn interrupts the normal pattern of sleep, leading to detrimental health and psychosocial consequences. Among the most serious is the relationship between SA and stroke, heart disease, peripheral vascular disease and endothelial dysfunction.
While people with SA may be unaware of their extensive night-time disturbances and the impact on their physical health, they are often acutely aware of the daytime psychosocial consequences. Excessive daytime sleepiness and impaired cognitive function are daytime consequences of SA. They can contribute to impaired work performance, irritability, relationship disharmony and a reduced level of satisfaction in everyday activities.
Primary intervention initiatives aim to reduce risk by focusing on factors that can be modified. The most common associated diagnoses at hospital separation in 2004–05 included current and past use of tobacco, mouth breathing, high blood pressure, restless leg syndrome (a common recognised comorbidity of SA), disorders of the nose and nasal sinuses, obesity and swollen tonsils and adenoids.
11.3.1 Daytime sleepiness
Daytime sleepiness can be defined as mild, moderate or severe, based on the level of unwanted sleepiness or involuntary sleep episodes that occur during different activities (American Academy of Sleep Medicine Task Force 1999). In the mild form, sleepiness can occur during activities that require little attention, such as when watching television or reading; however, in severe cases, sleepiness can occur during conversation, walking or driving.
11.3.2 Cognitive function
SA is associated with impaired mental processes (cognitive function), including executive functions, working memory, alertness, attention, long-term episodic memory and impaired procedural memory (Mathieu et al. 2008). These functions can affect everyday life, especially when they occur during occupation-related activities.
80
Much of the data supporting an association between SA and impaired cognitive function comes from clinic-based studies. These studies have provided strong evidence for this link but may suffer from bias due to selective referral of people with more severe OSA (Young et al. 2002a).
Data from population-based studies is limited; however, the Wisconsin Sleep Cohort Study found that OSA severity is related to diminished psychomotor efficiency (fine motor skills with sustained attention and concentration) (Kim et al. 1997). A common biological mechanism proposed to explain the observed cognitive dysfunction associated with OSA relates to the impact of chronic night-time hypoxemia on brain function.
Box 11.2: What is cognitive function?
Cognitive function is the mental faculty of processing information, and relates to having awareness, perception, reasoning, and judgment. Cognitive processes allow us to think, solve problems, make decisions, concentrate, learn, remember, and recognise. A number of standardised psychological tests can be used to determine if night-time apnoea and hypopnoea episodes cause cognitive deficits.
11.3.3 Motor vehicle accidents
Some studies indicate that people with severe SA are about two to three times more likely to be involved in an accident than people with mild disease (Ellen et al. 2006). This is mainly because night-time arousals and hypoxemia cause increased sleepiness and fatigue and impaired cognitive function. These symptoms often lead to inattention and perceptual errors, known contributors to motor vehicle accidents (George 2004; George 2007).
However, a systematic review of SA and motor vehicle accidents studies shows that positive correlations are not always consistently observed (Ellen et al. 2006). A report from the United States estimates that about 800,000 SA-related motor vehicle collisions occurred in 2000, costing $15.9 billion and resulting in 1,400 deaths (Sassani et al. 2004).
The effects of daytime sleepiness resulting from SA are of particular relevance to commercial motor vehicle operators, with some reports indicating that the prevalence of SA is higher in commercial vehicle drivers (Howard et al. 2004; Moreno et al. 2004).
11.3.4 Cardiovascular morbidity
People with SA have increased cardiovascular morbidity. The exact mechanism underlying this association remains to be identified.
The most compelling evidence for a causal role of SA in increasing the prevalence of high blood pressure came from the Wisconsin Sleep Cohort Study. The study concluded that breathing disorders during sleep are likely to be risk factors for high blood pressure and consequent cardiovascular morbidity (Peppard et al. 2000b). This study accounted for confounding factors, such as BMI, neck and waist circumference, smoking status and alcohol use.
In addition to general high blood pressure, SA has been strongly linked with stroke as well as cardiovascular diseases, such as pulmonary hypertension (high blood pressure in the
81
vessels carrying blood to and from the lungs), coronary artery disease, congestive heart failure, cardiac arrhythmias and atherosclerosis (Jain 2007; Parati et al. 2007).
11.3.5 Quality of life
Quality of life questionnaires are often used to determine the impact of OSA. They assess an individual’s perception of their quality of life. Nonspecific and disease-specific questionnaires have been used to assess quality of life in people with OSA.
The most commonly used general questionnaire is the medical outcomes study short form-36 questionnaire (SF-36). Using this questionnaire, both the Wisconsin Sleep Cohort Study (Finn et al. 1998) and the Sleep Heart Health Study (Baldwin et al. 2001) found an association between OSA severity and reduced quality of life. These studies also found that, although increased severity is associated with reduced quality of life, even people with mild disease (AHI=5) may also have reduced quality of life.
A recent study has found that those aged 65 years and over with OSA and excessive daytime sleepiness only have a slightly reduced quality of life compared to those younger than 65 years (Martinez-Garcia et al. 2008).

82
Appendix A: Source tables
The source tables are not included in the printed publication but are available on the internet at <http://www.aihw.gov.au/publications/index.cfm/title/10518>.
Note that each table number corresponds to the figure number for which they are the source. Table numbers can be determined from the table of figures provided later in this publication.
83
Appendix B: Health care expenditure
In 2004–05, the direct health expenditure allocated to respiratory diseases was $3.3 billion. This was 6.3% of the $52.7 billion allocated to diseases (see Box B.1). This put respiratory disease in 6th place in terms of expenditure on a single disease group. Cardiovascular disease ($5.9 billion/11.2%), oral health ($5.3 billion/10.1%), mental disorders ($4.1 billion/7.8%), musculoskeletal disease ($4.0 billion/7.5%) and neoplasms (including cancers) ($3.8 billion/7.2%) were greater. Genitourinary disease ($2.3 billion/4.5%) was the next highest group after respiratory disease (AIHW 2007).
Box B.1: Allocation of total direct health expenditure to diseases in 2004–05
The total direct health expenditure is the money spent by governments, private health insurers, companies and individuals to prevent, diagnose and treat health problems. It does not include indirect costs, such as the cost of aids, modifications, child care, lost wages or quality of life.
The allocation of direct health expenditure to diseases undertaken by the AIHW is a satellite national account. Satellite national accounts enable the linkage of non-monetary data sources to the national accounts.
$52.7 billion of the $81.1 billion total direct health expenditure was allocated to specific diseases. Expenditure categories included hospital services for admitted patients, out-of-hospital medical services, prescription pharmaceuticals and research. The amount that could not be allocated included services such as non-admitted patient services, community health, administration and non-prescription medications.
Disease allocations were further allocated to age groups and sexes within disease groups (AIHW 2007).
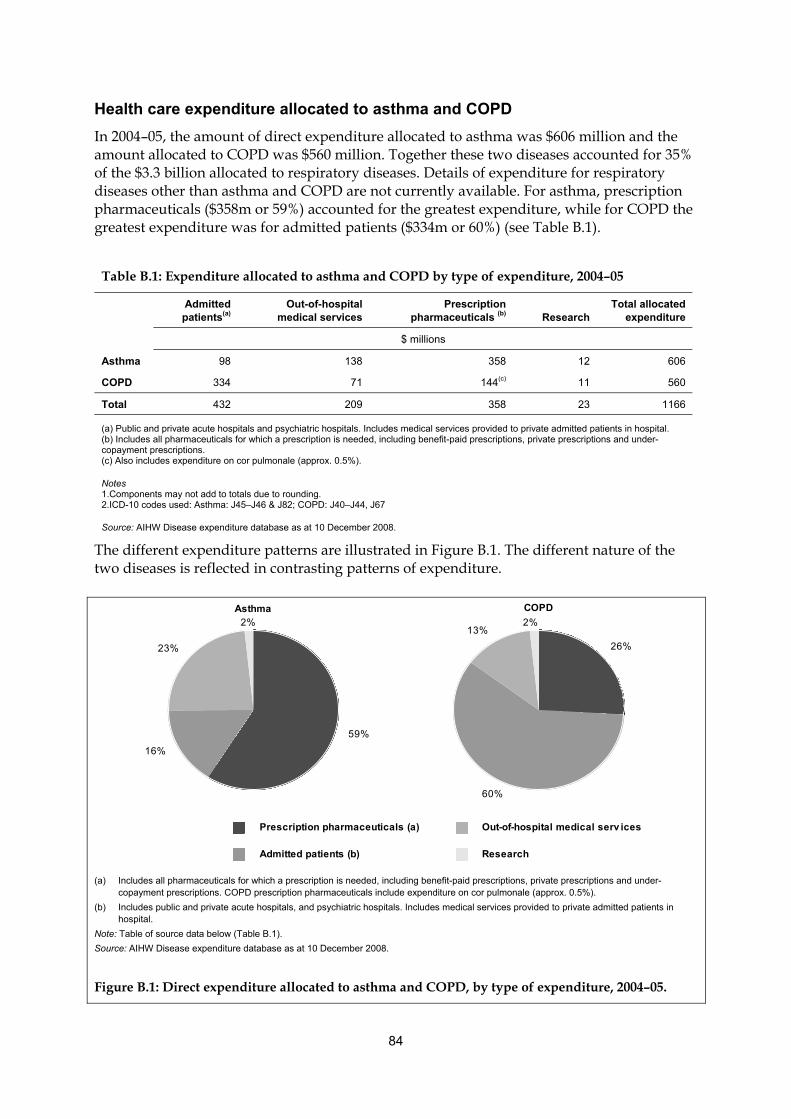
84
Health care expenditure allocated to asthma and COPD
In 2004–05, the amount of direct expenditure allocated to asthma was $606 million and the amount allocated to COPD was $560 million. Together these two diseases accounted for 35% of the $3.3 billion allocated to respiratory diseases. Details of expenditure for respiratory diseases other than asthma and COPD are not currently available. For asthma, prescription pharmaceuticals ($358m or 59%) accounted for the greatest expenditure, while for COPD the greatest expenditure was for admitted patients ($334m or 60%) (see Table B.1).
Table B.1: Expenditure allocated to asthma and COPD by type of expenditure, 2004–05
Admitted patients(a)
Out-of-hospital medical services
Prescription pharmaceuticals (b) Research
Total allocated expenditure
$ millions
Asthma 98 138 358 12 606
COPD 334 71 144(c) 11 560
Total 432 209 358 23 1166
(a) Public and private acute hospitals and psychiatric hospitals. Includes medical services provided to private admitted patients in hospital. (b) Includes all pharmaceuticals for which a prescription is needed, including benefit-paid prescriptions, private prescriptions and under-copayment prescriptions. (c) Also includes expenditure on cor pulmonale (approx. 0.5%).
Notes 1.Components may not add to totals due to rounding. 2.ICD-10 codes used: Asthma: J45–J46 & J82; COPD: J40–J44, J67
Source: AIHW Disease expenditure database as at 10 December 2008.
The different expenditure patterns are illustrated in Figure B.1. The different nature of the two diseases is reflected in contrasting patterns of expenditure.
59%
16%
23%
2%
26%
60%
13%2%
Asthma COPD
Prescription pharmaceuticals (a)
Admitted patients (b)
Out-of-hospital medical serv ices
Research
(a) Includes all pharmaceuticals for which a prescription is needed, including benefit-paid prescriptions, private prescriptions and under-copayment prescriptions. COPD prescription pharmaceuticals include expenditure on cor pulmonale (approx. 0.5%).
(b) Includes public and private acute hospitals, and psychiatric hospitals. Includes medical services provided to private admitted patients in hospital.
Note: Table of source data below (Table B.1).
Source: AIHW Disease expenditure database as at 10 December 2008.
Figure B.1: Direct expenditure allocated to asthma and COPD, by type of expenditure, 2004–05.
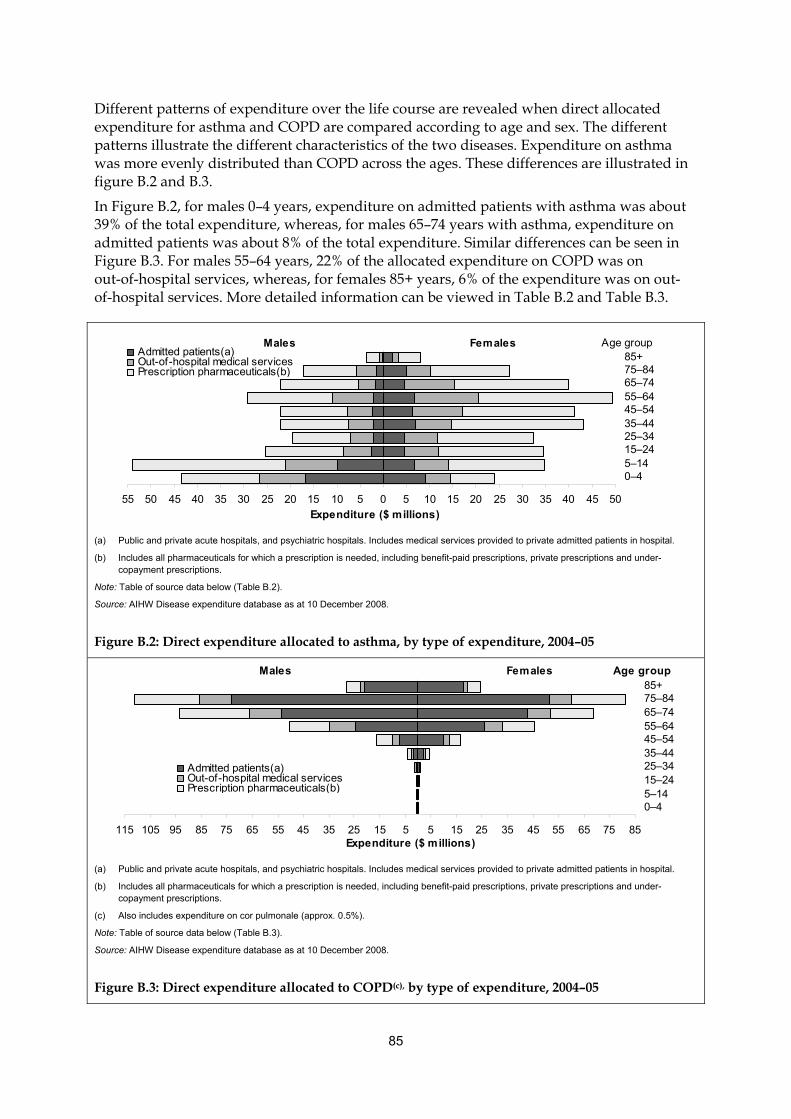
85
Different patterns of expenditure over the life course are revealed when direct allocated expenditure for asthma and COPD are compared according to age and sex. The different patterns illustrate the different characteristics of the two diseases. Expenditure on asthma was more evenly distributed than COPD across the ages. These differences are illustrated in figure B.2 and B.3.
In Figure B.2, for males 0–4 years, expenditure on admitted patients with asthma was about 39% of the total expenditure, whereas, for males 65–74 years with asthma, expenditure on admitted patients was about 8% of the total expenditure. Similar differences can be seen in Figure B.3. For males 55–64 years, 22% of the allocated expenditure on COPD was on out-of-hospital services, whereas, for females 85+ years, 6% of the expenditure was on out-of-hospital services. More detailed information can be viewed in Table B.2 and Table B.3.
55 50 45 40 35 30 25 20 15 10 5 0 5 10 15 20 25 30 35 40 45 50
0–45–1415–2425–3435–4445–5455–6465–7475–8485+
Expenditure ($ millions)
Admitted patients(a)Out-of-hospital medical servicesPrescription pharmaceuticals(b)Ad i d i ( )
Age groupMales Females
(a) Public and private acute hospitals, and psychiatric hospitals. Includes medical services provided to private admitted patients in hospital.
(b) Includes all pharmaceuticals for which a prescription is needed, including benefit-paid prescriptions, private prescriptions and under-copayment prescriptions.
Note: Table of source data below (Table B.2).
Source: AIHW Disease expenditure database as at 10 December 2008.
Figure B.2: Direct expenditure allocated to asthma, by type of expenditure, 2004–05
115 105 95 85 75 65 55 45 35 25 15 5 5 15 25 35 45 55 65 75 85
0–45–1415–2425–3435–4445–5455–6465–7475–8485+
Expenditure ($ millions)
Admitted patients(a)Out-of-hospital medical servicesPrescription pharmaceuticals(b)Ad i d i ( )
Age groupMales Females
(a) Public and private acute hospitals, and psychiatric hospitals. Includes medical services provided to private admitted patients in hospital.
(b) Includes all pharmaceuticals for which a prescription is needed, including benefit-paid prescriptions, private prescriptions and under-copayment prescriptions.
(c) Also includes expenditure on cor pulmonale (approx. 0.5%).
Note: Table of source data below (Table B.3).
Source: AIHW Disease expenditure database as at 10 December 2008.
Figure B.3: Direct expenditure allocated to COPD(c), by type of expenditure, 2004–05
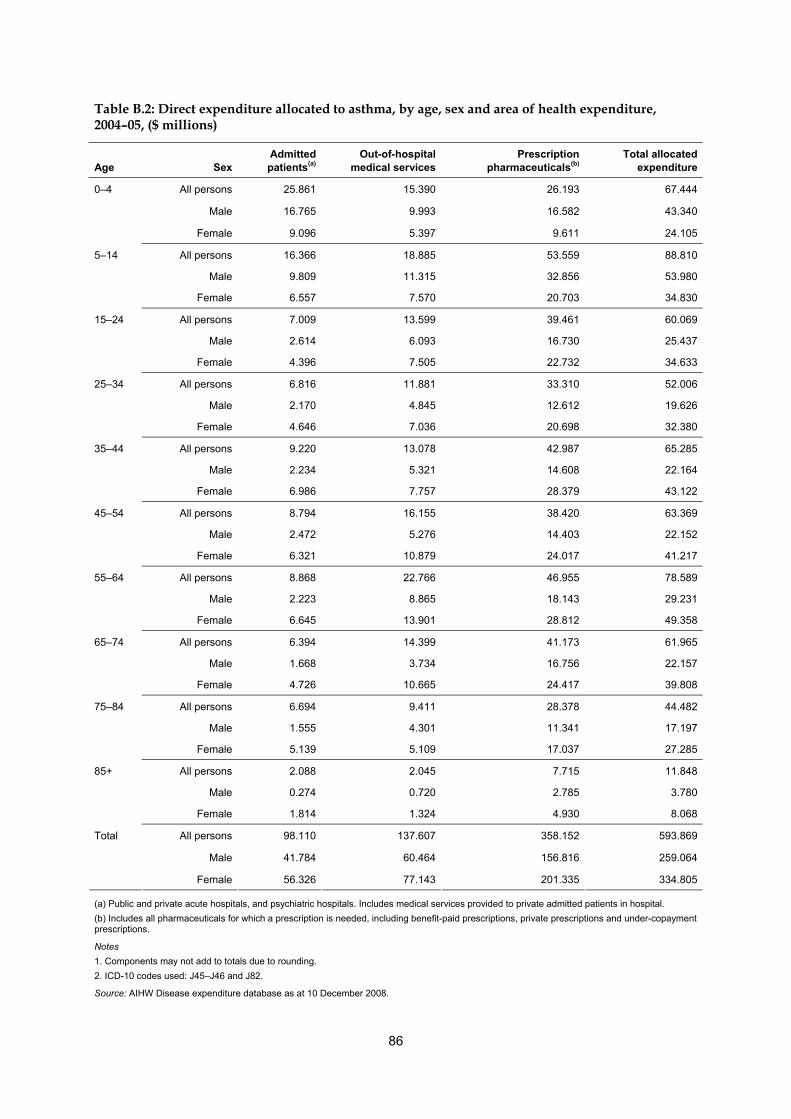
86
Table B.2: Direct expenditure allocated to asthma, by age, sex and area of health expenditure, 2004–05, ($ millions)
Age Sex Admitted patients(a)
Out-of-hospital medical services
Prescription pharmaceuticals(b)
Total allocated expenditure
All persons 25.861 15.390 26.193 67.444
Male 16.765 9.993 16.582 43.340
0–4
Female 9.096 5.397 9.611 24.105
All persons 16.366 18.885 53.559 88.810
Male 9.809 11.315 32.856 53.980
5–14
Female 6.557 7.570 20.703 34.830
All persons 7.009 13.599 39.461 60.069
Male 2.614 6.093 16.730 25.437
15–24
Female 4.396 7.505 22.732 34.633
All persons 6.816 11.881 33.310 52.006
Male 2.170 4.845 12.612 19.626
25–34
Female 4.646 7.036 20.698 32.380
All persons 9.220 13.078 42.987 65.285
Male 2.234 5.321 14.608 22.164
35–44
Female 6.986 7.757 28.379 43.122
All persons 8.794 16.155 38.420 63.369
Male 2.472 5.276 14.403 22.152
45–54
Female 6.321 10.879 24.017 41.217
All persons 8.868 22.766 46.955 78.589
Male 2.223 8.865 18.143 29.231
55–64
Female 6.645 13.901 28.812 49.358
All persons 6.394 14.399 41.173 61.965
Male 1.668 3.734 16.756 22.157
65–74
Female 4.726 10.665 24.417 39.808
All persons 6.694 9.411 28.378 44.482
Male 1.555 4.301 11.341 17.197
75–84
Female 5.139 5.109 17.037 27.285
All persons 2.088 2.045 7.715 11.848
Male 0.274 0.720 2.785 3.780
85+
Female 1.814 1.324 4.930 8.068
All persons 98.110 137.607 358.152 593.869
Male 41.784 60.464 156.816 259.064
Total
Female 56.326 77.143 201.335 334.805
(a) Public and private acute hospitals, and psychiatric hospitals. Includes medical services provided to private admitted patients in hospital.
(b) Includes all pharmaceuticals for which a prescription is needed, including benefit-paid prescriptions, private prescriptions and under-copayment prescriptions.
Notes
1. Components may not add to totals due to rounding.
2. ICD-10 codes used: J45–J46 and J82.
Source: AIHW Disease expenditure database as at 10 December 2008.
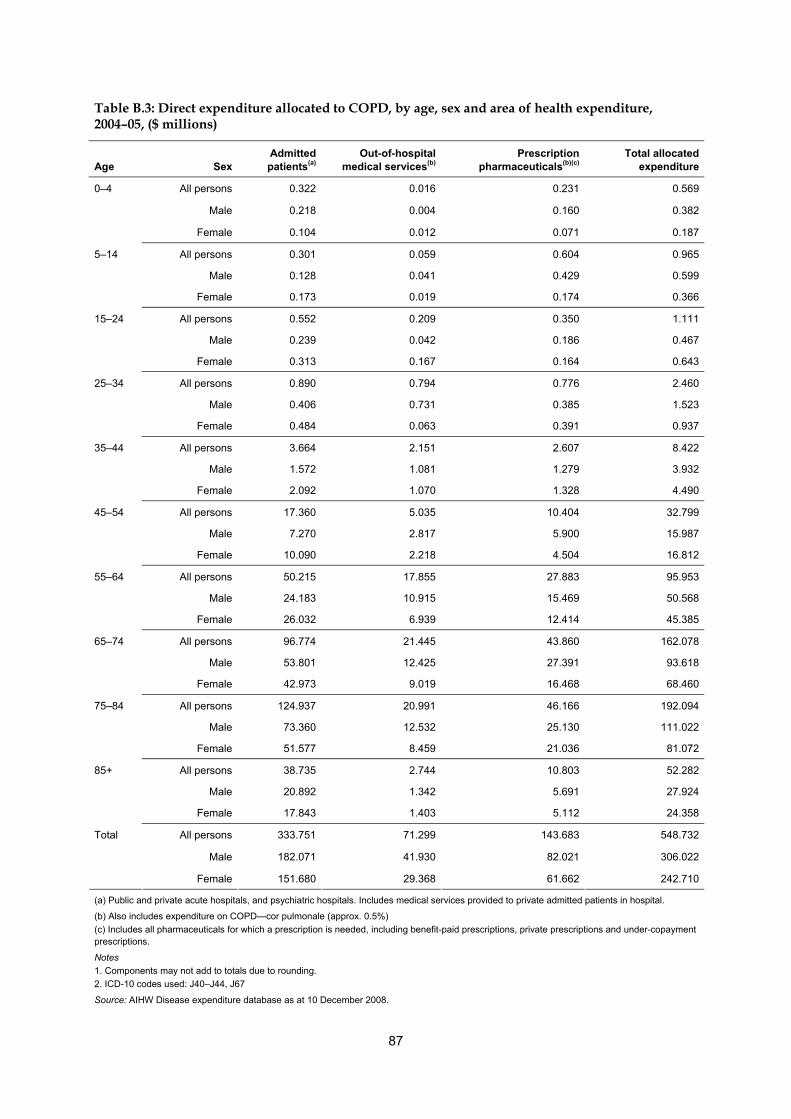
87
Table B.3: Direct expenditure allocated to COPD, by age, sex and area of health expenditure, 2004–05, ($ millions)
Age Sex Admitted patients(a)
Out-of-hospital medical services(b)
Prescription pharmaceuticals(b)(c)
Total allocated expenditure
All persons 0.322 0.016 0.231 0.569
Male 0.218 0.004 0.160 0.382
0–4
Female 0.104 0.012 0.071 0.187
All persons 0.301 0.059 0.604 0.965
Male 0.128 0.041 0.429 0.599
5–14
Female 0.173 0.019 0.174 0.366
All persons 0.552 0.209 0.350 1.111
Male 0.239 0.042 0.186 0.467
15–24
Female 0.313 0.167 0.164 0.643
All persons 0.890 0.794 0.776 2.460
Male 0.406 0.731 0.385 1.523
25–34
Female 0.484 0.063 0.391 0.937
All persons 3.664 2.151 2.607 8.422
Male 1.572 1.081 1.279 3.932
35–44
Female 2.092 1.070 1.328 4.490
All persons 17.360 5.035 10.404 32.799
Male 7.270 2.817 5.900 15.987
45–54
Female 10.090 2.218 4.504 16.812
All persons 50.215 17.855 27.883 95.953
Male 24.183 10.915 15.469 50.568
55–64
Female 26.032 6.939 12.414 45.385
All persons 96.774 21.445 43.860 162.078
Male 53.801 12.425 27.391 93.618
65–74
Female 42.973 9.019 16.468 68.460
All persons 124.937 20.991 46.166 192.094
Male 73.360 12.532 25.130 111.022
75–84
Female 51.577 8.459 21.036 81.072
All persons 38.735 2.744 10.803 52.282
Male 20.892 1.342 5.691 27.924
85+
Female 17.843 1.403 5.112 24.358
All persons 333.751 71.299 143.683 548.732
Male 182.071 41.930 82.021 306.022
Total
Female 151.680 29.368 61.662 242.710
(a) Public and private acute hospitals, and psychiatric hospitals. Includes medical services provided to private admitted patients in hospital.
(b) Also includes expenditure on COPD—cor pulmonale (approx. 0.5%)
(c) Includes all pharmaceuticals for which a prescription is needed, including benefit-paid prescriptions, private prescriptions and under-copayment prescriptions.
Notes
1. Components may not add to totals due to rounding.
2. ICD-10 codes used: J40–J44, J67
Source: AIHW Disease expenditure database as at 10 December 2008.

88
Appendix C: Fact sheets
Fact sheet 1: Asthma hospitalisations
Item Males Females Persons
Number of hospitalisations in 2006–07 17,989 18,599 36,588
… in 2005–06 18,595 19,334 37,929
… in 2004–05 18,102 19,359 37,461
… in 1998–99 26,272 27,635 53,907
Age–standardised hospital separation rate in 2006–07 176 180 179
… in 2005–06 184 190 188
… in 2004–05 183 194 189
… in 1998–99 272 292 283
Average length of stay (in days) in 2006–07 1.8 2.6 2.2
… in 2005–06 1.9 2.7 2.3
… in 2004–05 1.9 2.8 2.4
… in 1998–99 2.2 3.2 2.7
Average age at hospital separation (in years) in 2006–07 14.6 29.6 22.2
… in 2005–06 15.0 30.4 22.8
… in 2004–05 15.3 30.9 23.4
… in 1998–99 15.8 29.4 22.8
Percentage 65 years of age and over in 2006–07 4.9 13.1 9.1
... in 2005–06 4.9 13.5 9.3
... in 2004–05 5.1 13.8 9.6
…in 1998–99 5.5 12.7 9.2
Percentage under 5 years of age in 2006–07 47.8 25.4 36.4
... in 2005–06 48.9 25.5 37.0
... in 2004–05 46.6 23.8 34.8
… in 1998–99 42.8 21.6 31.9
Percentage of all hospitalisations in 2006–07 0.5 0.5 0.5
... in 2005–07 0.5 0.5 0.5
… in 2005–06 0.5 0.5 0.5
… in 1998–99 1.0 0.9 0.9
Percentage Indigenous in 2006–07(a) 6.0 4.6 5.3
… in 2005–06(a) 5.1 6.4 5.7
… in 2004–05(a) 6.2 4.6 5.4
… in 1998–99(b) 7.0 8.5 7.8
Most common procedure in 2006–07 Physio Physio Physio
… in 2005–06 Physio Physio Physio
… in 2004–05 Physio Physio Physio
… in 1998–99 Physio Physio Physio
Note: Rates are per 100,000 and are age standardised to the 2001 Australian population. (a) Analysis includes data for NSW, VIC, Qld, WA, SA and NT (NT public hospitals only) for which the quality of Indigenous identification is considered acceptable for the purpose of analysis.
All conditions in included states, percentage Indigenous in 2006–07 = 3.5%; 2005–06 = 3.5%; 2004–05 = 3.3%.
(b) Includes data from WA, SA , Qld and NT (public hospitals) only.
All conditions in included states, percentage Indigenous in 1998–99 = 7.0%.
Source: AIHW National Hospital Morbidity Database.
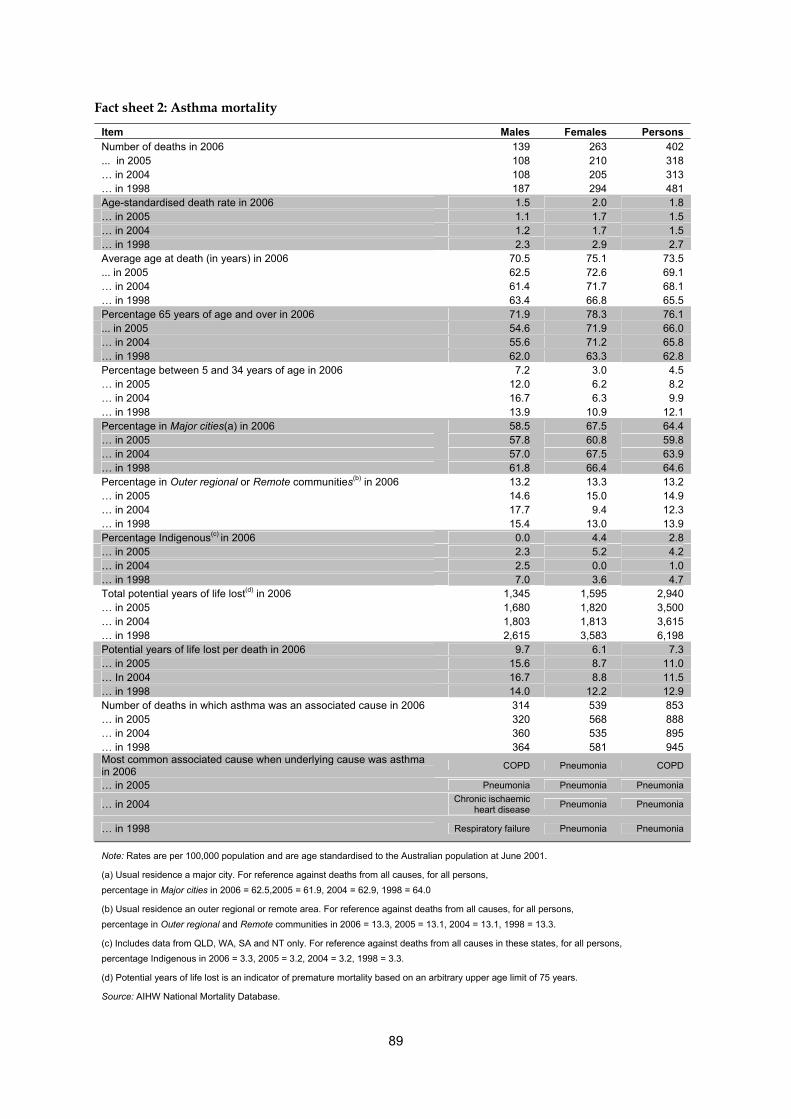
89
Fact sheet 2: Asthma mortality
Item Males Females Persons Number of deaths in 2006 139 263 402 ... in 2005 108 210 318 … in 2004 108 205 313 … in 1998 187 294 481 Age-standardised death rate in 2006 1.5 2.0 1.8 … in 2005 1.1 1.7 1.5 … in 2004 1.2 1.7 1.5 … in 1998 2.3 2.9 2.7 Average age at death (in years) in 2006 70.5 75.1 73.5 ... in 2005 62.5 72.6 69.1 … in 2004 61.4 71.7 68.1 … in 1998 63.4 66.8 65.5 Percentage 65 years of age and over in 2006 71.9 78.3 76.1 ... in 2005 54.6 71.9 66.0 … in 2004 55.6 71.2 65.8 … in 1998 62.0 63.3 62.8 Percentage between 5 and 34 years of age in 2006 7.2 3.0 4.5 … in 2005 12.0 6.2 8.2 … in 2004 16.7 6.3 9.9 … in 1998 13.9 10.9 12.1 Percentage in Major cities(a) in 2006 58.5 67.5 64.4 … in 2005 57.8 60.8 59.8 … in 2004 57.0 67.5 63.9 … in 1998 61.8 66.4 64.6 Percentage in Outer regional or Remote communities(b) in 2006 13.2 13.3 13.2 … in 2005 14.6 15.0 14.9 … in 2004 17.7 9.4 12.3 … in 1998 15.4 13.0 13.9 Percentage Indigenous(c) in 2006 0.0 4.4 2.8 … in 2005 2.3 5.2 4.2 … in 2004 2.5 0.0 1.0 … in 1998 7.0 3.6 4.7 Total potential years of life lost(d) in 2006 1,345 1,595 2,940 … in 2005 1,680 1,820 3,500 … in 2004 1,803 1,813 3,615 … in 1998 2,615 3,583 6,198 Potential years of life lost per death in 2006 9.7 6.1 7.3 … in 2005 15.6 8.7 11.0 … In 2004 16.7 8.8 11.5 … in 1998 14.0 12.2 12.9 Number of deaths in which asthma was an associated cause in 2006 314 539 853 … in 2005 320 568 888 … in 2004 360 535 895 … in 1998 364 581 945 Most common associated cause when underlying cause was asthma in 2006
COPD Pneumonia COPD
… in 2005 Pneumonia Pneumonia Pneumonia
… in 2004 Chronic ischaemic heart disease
Pneumonia Pneumonia
… in 1998 Respiratory failure Pneumonia Pneumonia
Note: Rates are per 100,000 population and are age standardised to the Australian population at June 2001.
(a) Usual residence a major city. For reference against deaths from all causes, for all persons, percentage in Major cities in 2006 = 62.5,2005 = 61.9, 2004 = 62.9, 1998 = 64.0
(b) Usual residence an outer regional or remote area. For reference against deaths from all causes, for all persons, percentage in Outer regional and Remote communities in 2006 = 13.3, 2005 = 13.1, 2004 = 13.1, 1998 = 13.3.
(c) Includes data from QLD, WA, SA and NT only. For reference against deaths from all causes in these states, for all persons,
percentage Indigenous in 2006 = 3.3, 2005 = 3.2, 2004 = 3.2, 1998 = 3.3.
(d) Potential years of life lost is an indicator of premature mortality based on an arbitrary upper age limit of 75 years.
Source: AIHW National Mortality Database.
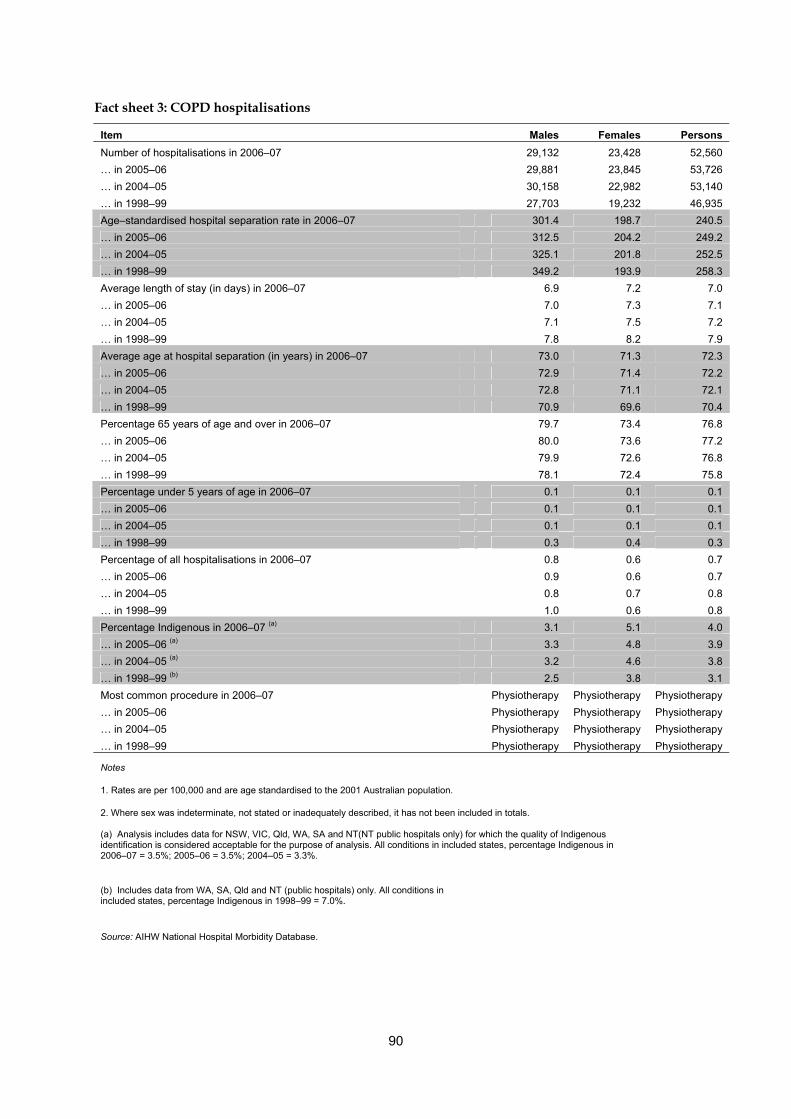
90
Fact sheet 3: COPD hospitalisations
Item Males Females Persons
Number of hospitalisations in 2006–07 29,132 23,428 52,560
… in 2005–06 29,881 23,845 53,726
… in 2004–05 30,158 22,982 53,140
… in 1998–99 27,703 19,232 46,935
Age–standardised hospital separation rate in 2006–07 301.4 198.7 240.5
… in 2005–06 312.5 204.2 249.2
… in 2004–05 325.1 201.8 252.5
… in 1998–99 349.2 193.9 258.3
Average length of stay (in days) in 2006–07 6.9 7.2 7.0
… in 2005–06 7.0 7.3 7.1
… in 2004–05 7.1 7.5 7.2
… in 1998–99 7.8 8.2 7.9
Average age at hospital separation (in years) in 2006–07 73.0 71.3 72.3
… in 2005–06 72.9 71.4 72.2
… in 2004–05 72.8 71.1 72.1
… in 1998–99 70.9 69.6 70.4
Percentage 65 years of age and over in 2006–07 79.7 73.4 76.8
… in 2005–06 80.0 73.6 77.2
… in 2004–05 79.9 72.6 76.8
… in 1998–99 78.1 72.4 75.8
Percentage under 5 years of age in 2006–07 0.1 0.1 0.1
… in 2005–06 0.1 0.1 0.1
… in 2004–05 0.1 0.1 0.1
… in 1998–99 0.3 0.4 0.3
Percentage of all hospitalisations in 2006–07 0.8 0.6 0.7
… in 2005–06 0.9 0.6 0.7
… in 2004–05 0.8 0.7 0.8
… in 1998–99 1.0 0.6 0.8
Percentage Indigenous in 2006–07 (a) 3.1 5.1 4.0
… in 2005–06 (a) 3.3 4.8 3.9
… in 2004–05 (a) 3.2 4.6 3.8
… in 1998–99 (b) 2.5 3.8 3.1
Most common procedure in 2006–07 Physiotherapy Physiotherapy Physiotherapy
… in 2005–06 Physiotherapy Physiotherapy Physiotherapy
… in 2004–05 Physiotherapy Physiotherapy Physiotherapy
… in 1998–99 Physiotherapy Physiotherapy Physiotherapy
Notes
1. Rates are per 100,000 and are age standardised to the 2001 Australian population.
2. Where sex was indeterminate, not stated or inadequately described, it has not been included in totals.
(a) Analysis includes data for NSW, VIC, Qld, WA, SA and NT(NT public hospitals only) for which the quality of Indigenous identification is considered acceptable for the purpose of analysis. All conditions in included states, percentage Indigenous in 2006–07 = 3.5%; 2005–06 = 3.5%; 2004–05 = 3.3%.
(b) Includes data from WA, SA, Qld and NT (public hospitals) only. All conditions in included states, percentage Indigenous in 1998–99 = 7.0%.
Source: AIHW National Hospital Morbidity Database.
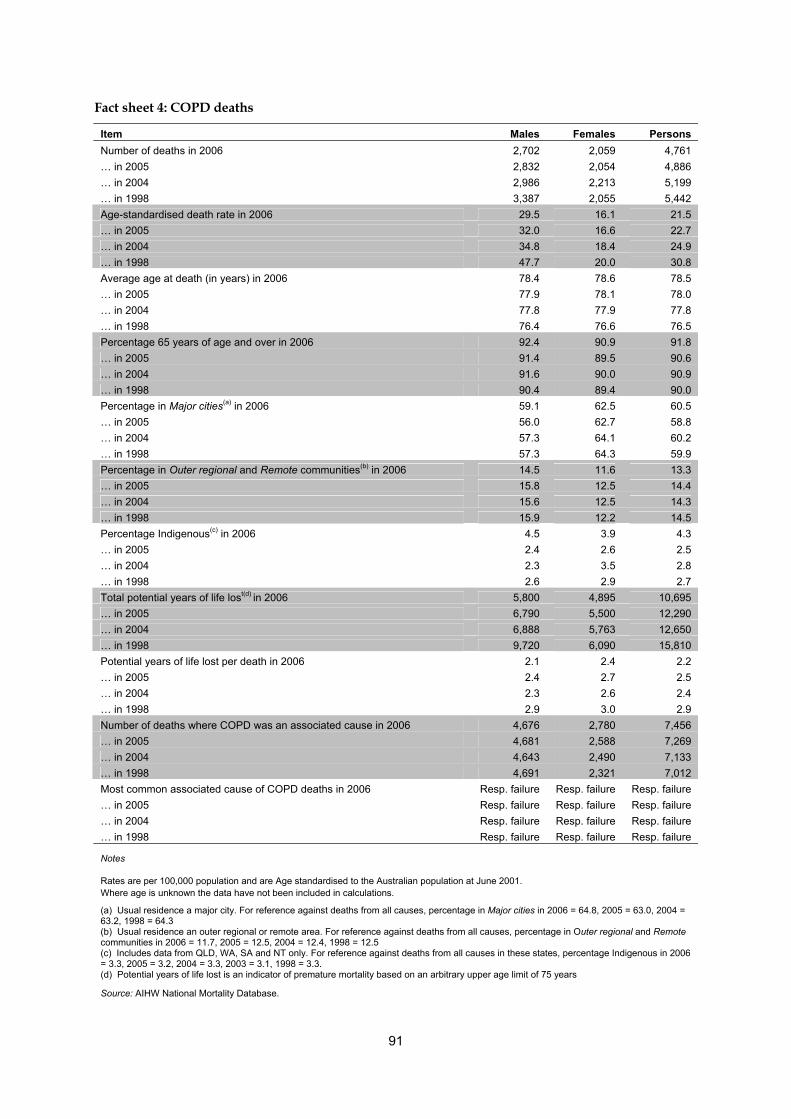
91
Fact sheet 4: COPD deaths
Item Males Females Persons
Number of deaths in 2006 2,702 2,059 4,761
… in 2005 2,832 2,054 4,886
… in 2004 2,986 2,213 5,199
… in 1998 3,387 2,055 5,442
Age-standardised death rate in 2006 29.5 16.1 21.5
… in 2005 32.0 16.6 22.7
… in 2004 34.8 18.4 24.9
… in 1998 47.7 20.0 30.8
Average age at death (in years) in 2006 78.4 78.6 78.5
… in 2005 77.9 78.1 78.0
… in 2004 77.8 77.9 77.8
… in 1998 76.4 76.6 76.5
Percentage 65 years of age and over in 2006 92.4 90.9 91.8
… in 2005 91.4 89.5 90.6
… in 2004 91.6 90.0 90.9
… in 1998 90.4 89.4 90.0
Percentage in Major cities(a) in 2006 59.1 62.5 60.5
… in 2005 56.0 62.7 58.8
… in 2004 57.3 64.1 60.2
… in 1998 57.3 64.3 59.9
Percentage in Outer regional and Remote communities(b) in 2006 14.5 11.6 13.3
… in 2005 15.8 12.5 14.4
… in 2004 15.6 12.5 14.3
… in 1998 15.9 12.2 14.5
Percentage Indigenous(c) in 2006 4.5 3.9 4.3
… in 2005 2.4 2.6 2.5
… in 2004 2.3 3.5 2.8
… in 1998 2.6 2.9 2.7
Total potential years of life lost(d) in 2006 5,800 4,895 10,695
… in 2005 6,790 5,500 12,290
… in 2004 6,888 5,763 12,650
… in 1998 9,720 6,090 15,810
Potential years of life lost per death in 2006 2.1 2.4 2.2
… in 2005 2.4 2.7 2.5
… in 2004 2.3 2.6 2.4
… in 1998 2.9 3.0 2.9
Number of deaths where COPD was an associated cause in 2006 4,676 2,780 7,456
… in 2005 4,681 2,588 7,269
… in 2004 4,643 2,490 7,133
… in 1998 4,691 2,321 7,012
Most common associated cause of COPD deaths in 2006 Resp. failure Resp. failure Resp. failure
… in 2005 Resp. failure Resp. failure Resp. failure
… in 2004 Resp. failure Resp. failure Resp. failure
… in 1998 Resp. failure Resp. failure Resp. failure
Notes
Rates are per 100,000 population and are Age standardised to the Australian population at June 2001. Where age is unknown the data have not been included in calculations.
(a) Usual residence a major city. For reference against deaths from all causes, percentage in Major cities in 2006 = 64.8, 2005 = 63.0, 2004 = 63.2, 1998 = 64.3 (b) Usual residence an outer regional or remote area. For reference against deaths from all causes, percentage in Outer regional and Remote communities in 2006 = 11.7, 2005 = 12.5, 2004 = 12.4, 1998 = 12.5 (c) Includes data from QLD, WA, SA and NT only. For reference against deaths from all causes in these states, percentage Indigenous in 2006 = 3.3, 2005 = 3.2, 2004 = 3.3, 2003 = 3.1, 1998 = 3.3. (d) Potential years of life lost is an indicator of premature mortality based on an arbitrary upper age limit of 75 years
Source: AIHW National Mortality Database.
92
References
ABS 2006a. 2004–05 National Health Survey : Summary of results. ABS Cat. No. 4364.0. Canberra.
ABS 2006b. National Aboriginal and Torres Straight Islander Health Survey 2004–05. ABS Cat. No. 4715.0. Canberra.
ABS 2007. Births, Australia, 2005. ABS Cat. No. 3301.0.
ABS 2008. Causes of Death,2006. ABS Cat. No. 3303.0.
ACAM 2008. Asthma in Australia 2008. Asthma series no. 3. Cat. no. ACM 14. Canberra: AIHW.
ACDFR 2008. Cystic fibrosis in Australia 2005. North Ryde, NSW: Cystic Fibrosis Australia.
AIHW 2005. Chronic respiratory diseases in Australia: Their prevalence, consequences and prevention. Cat. no. PHE 63. Canberra: AIHW.
AIHW 2007. National public health expenditure report 2004–05. Canberra: AIHW.
AIHW 2008. Australia's health 2008. Canberra: AIHW.
AIHW 2009. GRIM (General Record of Incidence of Mortality) Books. AIHW: Canberra.
AIHW: Begg S, Vos T, Barker B, Stevenson C, Stanley L & Lopez A 2007 (in press). The burden of disease and injury in Australia 2003. Cat. no. PHE 82. Canberra: AIHW.
AIHW: Britt H, Miller G, Charles J, Henderson J, Byram C, Harrison C et al. 2008. General practice activity in Australia 2007–08. General practice series no. 22 Cat. no. GEP 19.
AIHW: Britt H, Miller G, Henderson J & Bayram C 2007a. Patient-based substudies from BEACH: abstracts and research tools 1999–2006: Abstract 27. Canberra.
AIHW: Britt H, Miller G, Henderson J & Bayram C 2007b. Patient-based substudies from BEACH: abstracts and research tools 1999–2006; Abstract 1. Canberra.
Aligne CA, Auinger P, Byrd RS & Weitzman M 2000. Risk factors for pediatric asthma. Contributions of poverty, race, and urban residence. American Journal of Respiratory and Critical Care Medicine 162:873–7.
American Academy of Sleep Medicine Task Force 1999. Sleep-related breathing disorders in adults: recommendations for syndrome definition and measurement techniques in clinical research. The Report of an American Academy of Sleep Medicine Task Force. Sleep 22:667–89.
Arif A & Shah S 2007. Association between personal exposure to volatile organic compounds and asthma among US adult population. International Archives of Occupational and Enviromental Health 80:711–9.
Armstrong D, Grimwood K, Carlin J, Carzino R, Hull J, Robertson C et al. 1999. Lower Airway Inflammation in Infants and Young Children with Cystic Fibrosis. American Journal of Respiratory and Critical Care Medicine 156:1197–204.
Arruda K, Ferriani V, Silva J, Arruda E & Camara A 2007. Risk factors for wheezing in children—The role of respiratory viruses. Journal of Allergy and Clinical Immunology International—Journal of The World Allergy Organization 19:185–91.
93
Arruda L, Vailes L, Ferriani V & Santos A 2001. Cockroach allergens and asthma. Journal of Allergy and Clinical Immunology 107:419–28.
ASCC 2006. Occupational respiratory diseases in Australia. Canberra: Australian Safety and Compensation Council.
ASCC 2008a. Australian Safety and Compenstaion Council. Canberra: ASCC. Viewed 16 September 2008, <www.ascc.gov.au>.
ASCC 2008b. Compendium of Workers' Compensation Statistics Australia 2005–06. Canberra: Australian Safety and Compensation Council.
ASPREN 2007. ASPREN Newsletter No. 4—September 2007.1–4.
Australia and New Zealand Cardiothoracic Organ Transplant Registry 2006. Eleventh Annual Report 1984 – 2006. Darlinghurst, NSW: St Vincent's Hospital.
Australian Health Ministers' Advisory Council 2008. Aboriginal and Torres Strait Islander Health Performance Framework Report 2008. Canberra.
Australian State of the Environment Committee 2001. Australia state of the environment 2001: independent report to the Commonwealth Minister for the Environment and Heritage. Canberra: Department of the Environment and Heritage.
Baldwin CM, Griffith KA, Nieto FJ, O'Connor GT, Walsleben JA & Redline S 2001. The association of sleep-disordered breathing and sleep symptoms with quality of life in the Sleep Heart Health Study. Sleep 24:96–105.
Bearpark H, Elliott L, Grunstein R, Cullen S, Schneider H, Althaus W et al. 1995. Snoring and sleep apnea. A population study in Australian men. American Journal of Respiratory Critical Care Med 151:1459–65.
Beckham J, Cadena A, Lin J, Piedra P, Glezen W, Greenberg S et al. 2005. Respiratory viral infections in patients with chronic, obstructive pulmonary disease. Journal of Infection 50:322–30.
Bhattacharyya N 2009. Air Quality Influences the Prevalence of Hay Fever and Sinusitis. The Laryngoscope 119:429–33.
Bixler EO, Vgontzas AN, Lin HM, Ten Have T, Rein J, Vela-Bueno A et al. 2001. Prevalence of sleep-disordered breathing in women: effects of gender. American Journal of Respiratory Critical Care Medicine 163:608–13.
Borish L 2002. The role of leukotrienes in upper and lower airway inflammation and the implications for treatment. Annals of Allergy, Asthma and Immunology 88:16–22.
Borrish L 2002. Sinusitis and asthma: entering the realm of evidence-based medicine. Journal of Allergy and Clinical Immunology 109:606–8.
Bousquet J, Van Cauwenberge P & Khaltaev N 2001. Allergic rhinitis and its impact on asthma. Journal of Allergy and Clinical Immunology 108:S147–334.
Brasch-Andersen C, Haagerup A, Borglum A, Vestbo J & Kruse T 2006. Highly significant linkage to chromosome 3q13.31 for rhinitis and related allergic diseases. Journal of Medical Genetics 43.
Brice P, Jarrett J & Mugford M 2007. Genetic screening for cystic fibrosis: an overview of the science and the economics. Journal of Cystic Fibrosis 6:255–61.
Brody JS & Spira A 2006. State of the art. Chronic obstructive pulmonary disease, inflammation, and lung cancer. Procedures of the American Thoracis Society 3:535–7.
94
Brouard J, Nimal D & Bessiere A 2009. Does allergic rhinitis exist in preschool children? Revue Francaise D Allergoilogie 49:247–9.
Brunetti L, Rana S, Lospalluti ML, Pietrafesa A, Francavilla R, Fanelli M et al. 2001. Prevalence of Obstructive Sleep Apnea Syndrome in a Cohort of 1,207 Children of Southern Italy. Chest 120:1930–5.
Bueving H & Wouden Jvd 2007. What is the role of virus vaccination in patients with asthma? Current Allergy and Asthma Reports 7:72–6.
Buist A, McBurnie M, Vollmer W, Gillespie S, Burney P, Mannino D et al. 2007. International variation in the prevalence of COPD (The BOLD Study): a population-based prevalence study. The Lancet 370:741–50.
California Environmental Protection Agency: Air Resources Board 2005. Proposed Identification of Environmental Tobacco Smoke as a Toxic Air Contaminant. Viewed June 2009, <http://repositories.cdlib.org/tc/surveys/CALEPA2005>.
Castano R & Theriault G 2006. Defining and classifying occupational rhinitis. Journal of Laryngology and Otology 120:812–7.
Celedon J, Lange C, Raby B, Litonjua A, Palmer L, DeMeo D et al. 2004. The transforming growth factor-beta-1 (TGFB1) gene is associated with chronic obstructive pulmonary disease (COPD). Human Molecular Genetics 13:1649–56.
Chang A, Grimwood K, Mulholland E & Torzillo P 2002. Bronchiectasis in indigenous children in remote Australian communities. Medical Journal of Australia 177:200–4.
Chang A, Shannon C, O'Neil M, Tiemann A, Valery P & Craig D 2000. Asthma management in Indigenous children of a remote community using and Indigenous health model. Journal of Paediatrics and Child Health 36:249–51.
Chappell S, Daly L, Morgan K, Baranes TG, Roca J, Rabinovich R et al. 2006. Cryptic haplotypes of SERPINA1 confer susceptibility to chronic obstructive pulmonary disease. Human Mutations 1:103–9.
Chiu H, Cheng M & Yang C 2009. Air Pollution and Hospital Admissions for Pneumonia in a Subtropical City: Taipei, Taiwan. Inhalation Toxicology 21:32–7.
Chong S, Lee KS, Chung MJ, Han J, Kwon OJ & Kim TS 2006. Pneumoconiosis: comparison of imaging and pathologic findings. Radiographics 26:59–77.
Cole PJ 1986. Inflammation: a two-edged sword--the model of bronchiectasis. European Journal of Respiratory Diseasers Supplement 147:6–15.
Conway S, Simmonds E & Littlewood J 1992. Acute severe deterioration in cystic fibrosis associated with influenza A virus infection. Thorax 47:112–4.
Cystic Fibrosis Foundation 2009. Risks of Smoking for People With Cystic Fibrosis.
de Marco R, Accordini S, Cerveri I, Corsico A, Sunyer J, Neukirch F et al. 2004. An international survey of chronic obstructive pulmonary disease in young adults according to GOLD stages. Thorax 59:120–5.
Denison L, Simpson R, Petroeschevsky A, Thalib L & Williams G 2001. Ambient airpollution and daily hospital admissions in Melbourne, 1994–1997. Melbourne: EPA Victoria.
Desrosiers M 2009. Diagnosis and Management of Acute Rhinosinusitis. Postgraduate Medicine 121:83–9.
95
Dharmage S, Bailey M, Raven J, Mitakakis T, Cheng A, Guest D et al. 2001. Current indoor allergen levels of fungi and cats, but not house dust mites, influence allergy and asthma in adults with high dust mite exposure. American Journal of Respiratory and Critical Care Medicine 164:65–71.
Dodge JA, Morison S, Lewis PA, Coles EC, Geddes D, Russell G et al. 1997. Incidence, population, and survival of cystic fibrosis in the UK, 1968–95. UK Cystic Fibrosis Survey Management Committee. Archives of Disease in Childhood 77:493–6.
DoHA 2007. The Australian Immunisation Handbook: 9th edition. In. Canberra, 1–12.
DoHA 2008a. Aboriginal and Torres Strait Islander Health Performance Framework. Canberra: DoHA.
DoHA 2008b. Communicable Disease Australia: National Notifiable Diseases Surveillance System.
Donaldson L, Beasly C & Ridge K 2008. The Influenza Immunisation Programme 2008/09. London: Department of Health.
Drenkard E & Ausubel FM 2002. Pseudomonas biofilm formation and antibiotic resistance are linked to phenotypic variation. Nature 416:740–3.
Durand B, Poje C & Dias M 1998. Sinusitis-associated epidural abscess presenting as posterior scalp abscess--a case report. International Journal of Pediatricic Otorhinolaryngol 43:147–51.
Effat K & Madany N 2009. Microbiological study of role of fungi in primary atrophic rhinitis. Journal of Laryngology and Otology 123:631–4.
Ellen R, Marshall S, Palayew M, Molnar F & Wilson K 2006. Systemic review of motor vehicle crash risk in persons with sleep apnea. Journal of Clinical Sleep Medicine 2:193–200.
European Respiratory Society and European Lung Foundation 2003. European Lung White Book. Sheffield: ERSJ Ltd.
Finn L, Young T, Palta M & Fryback DG 1998. Sleep-disordered breathing and self-reported general health status in the Wisconsin Sleep Cohort Study. Sleep 21:701–6.
Flattery J, Davis L, Rosenman K, Harrison R, Lyon-Callo S & M. F 2006. The proportion of self-reported asthma associated with work in three states: California, Massachusetts, and Michigan. Journal of Asthma 43:213–8.
Frith P, McKenzie D & Pierce R 2002. Management of chronic obstructive pulmonary disease in the twenty-first century. Internal Medicine Journal 31:508–11.
Garcia D, Hiatt P, Jewell A, Schoonover S, Cron S & Riggs M 2007. Human metapneumovirus and respiratory syncytial virus infections in older children with cystic fibrosis. Pediatric pulmonology 42:66–74.
George CF 2004. Sleep. 5: Driving and automobile crashes in patients with obstructive sleep apnoea/hypopnoea syndrome. Thorax 59:804–7.
George CF 2007. Sleep apnea, alertness, and motor vehicle crashes. American Journal of Respiratory and Critical Care Medicine 176:954–6.
Gilmour MI, Jaakkola MS, London SJ, Nel AE & Rogers CA 2006. How Exposure to Environmental Tobacco Smoke, Outdoor Air Pollutants, and Increased Pollen Burdens Influences the Incidence of Asthma. Environmental Health Perspectives 114:627–33.
96
Glasgow NJ, Ponsonby A-L, Yates R & Goodchild EA 2003. Respiratory health in Aboriginal and Torres Strait Islander children in the Australian Capital Territory. Journal of Paediatrics and Child Health 39:534–8.
Goldbeck L, Zerrer S & Schmitz TG 2007. Monitoring quality of life in outpatients with cystic fibrosis: feasibility and longitudinal results. Journal of Cystic Fibrosis 6:171–8.
Golding G & Christensen E 2000. Volatile organic compounds: relevance and measurement in Australia. Canberra: Department of Health and Aged Care, 85–98.
Goss CH, Newsom SA, Schildcrout JS, Sheppard L & Kaufman JD 2004. Effect of Ambient Air Pollution on Pulmonary Exacerbations and Lung Function in Cystic Fibrosis. American Journal of Respiratory and Critical Care Medicine 169:816–21.
Goss CH & Rosenfeld M 2004. Update on cystic fibrosis epidemiology. Current Opinion in Pulmonary Medicine 10:510–4.
Hak E, Hoes A & Verheij T 2002. Influenza Vaccinations: Who Needs Them and When? Drugs 62:2413–20.
Halbert RJ, Natoli JL, Gano A, Badamgarav E, Buist AS & Mannino DM 2006. Global burden of COPD: systematic review and meta-analysis. European Respiratory Journal 28:523–32.
Harding R, Pinkerton KE & Plopper CG 2004. The lung: development, aging and the environment. In. Amsterdam: Academic Press.
He J, Kryger MH, Zorick FJ, Conway W & Roth T 1988. Mortality and apnea index in obstructive sleep apnea. Experience in 385 male patients. Chest 94:9–14.
Holt PG, Macaubas C, Stumbles PA & Sly PD 1999. The role of allergy in the development of asthma. Nature 402:B12–7.
Houser S & Keen K 2009. The Role of Allergy and Smoking in Chronic Rhinosinusitis and Polyposis. Laryngoscope 119:617.
Howard ME, Desai AV, Grunstein RR, Hukins C, Armstrong JG, Joffe D et al. 2004. Sleepiness, sleep-disordered breathing, and accident risk factors in commercial vehicle drivers. American Journal of Respiratory and Critical Care Medicine 170:1014–21.
Ip MS, Lam B, Lauder IJ, Tsang KW, Chung KF, Mok YW et al. 2001. A community study of sleep-disordered breathing in middle-aged Chinese men in Hong Kong. Chest 119:62–9.
Ip MS, Lam B, Tang LC, Lauder IJ, Ip TY & Lam WK 2004. A community study of sleep-disordered breathing in middle-aged Chinese women in Hong Kong: prevalence and gender differences. Chest 125:127–34.
Jain V 2007. Clinical perspective of obstructive sleep apnea-induced cardiovascular complications. Antioxidants and Redox Signaling 9:701–10.
Jedrychowski W & Flak E 1998. Separate and combined effects of the outdoor and indoor air quality on chronicrespiratory symptoms adjusted for allergy among preadolescent children. International Journal of Occupational Medicine and Environmental Health 11:19–35.
Jeffery PK & Haahtela T 2006. Allergic rhinitis and asthma: inflammation in a one-airway condition. BMC Pulmonary Medicine 6 Suppl 1:S5.
Jenkins CR, Thompson PJ, Gibson PG & Wood-Baker R 2005. Distinguishing asthma and chronic obstructive pulmonary disease: why, why not and how? Medical journal of Australia 183:S35–7.
97
Jennings L, Anderson T, Beynon K, Chua A, Laing R, Werno A et al. 2008. Incidence and characteristics of viral community acquired pneumonia in adults. Thorax 63:42–8.
Jiménez-Ruiz CA, Masa F, Miravitlles M, Gabriel R, Viejo JL, Villasante C et al. 2001. Differences in Attitudes and Dependence Between Healthy Smokers and Smokers With COPD. Chest 119:1365–70.
Joos L, He J, Shepherdson M, Connett J, Anthonisen N, Pare P et al. 2002. The role of matrix metalloproteinase polymorphisms in the rate of decline in lung function. Human Molecular Genetics 11:569–76.
Joshi PC & Guidot DM 2007. The alcoholic lung: epidemiology, pathophysiology, and potential therapies. American Journal of Physiology and Lung Cell Molecular Physiology 292:L813–23.
Kapsimalis F & Kryger MH 2002. Gender and obstructive sleep apnea syndrome, part 1: Clinical features. Sleep 25:412–9.
Katsouyanni K 2003. Ambient air pollution and health. British Medical Bulletin 68:143–56.
Khoshoo V, Le T, Haydel RM, Jr., Landry L & Nelson C 2003. Role of gastroesophageal reflux in older children with persistent asthma. Chest 123:1008–13.
Kilburn KH 1984. Particles Causing Lung Disease. Environmental Health Perspectives 55:97–109.
Kim HC, Young T, Matthews CG, Weber SM, Woodward AR & Palta M 1997. Sleep-disordered breathing and neuropsychological deficits. A population-based study. merican Journal of Respiratory and Critical Care Medicin 156:1813–9.
Kim J, In K, You S, Kang K, Shim J, Lee S et al. 2004. Prevalence of sleep-disordered breathing in middle-aged Korean men and women. merican Journal of Respiratory and Critical Care Medicin 170:1108–13.
Knox SA, Harrison CM, Britt HC & Henderson JV 2008. Estimating prevalence of common chronic morbidities in Australia. Medical Journal of Australia 189:66–70.
Koeppen-Schomerus G, Stevenson J & Plomin R 2001. Genes and environment in asthma: a study of 4 year old twins. Archives of Diseases in Childhood 85:398–400.
Kogevinas M, Zock JP, Jarvis D, Kromhout H, Lillienberg L, Plana E et al. 2007. Exposure to substances in the workplace and new-onset asthma: an international prospective population-based study (ECRHS-II). Lancet 370:336–41.
Krämer U, Koch T, Ranft U & Ring J 2000. Traffic-related air pollution is associated with atopy in children living in urban areas. Epidemiology 11:64–70.
Kunzli N, Kaiser R, Medina S, Studnicka M, Chanel O, Filliger P et al. 2000. Public-health impact of outdoor and traffic-related air pollution: a European assessment. Lancet 356:795–801.
Lacroix 1999. Exercise-Induced Asthma. The Physician and Sports medicine 27.
Lam B, Lam DC & Ip MS 2007. Obstructive sleep apnoea in Asia. International Journal of Tuberculosis Lung Disease 11:2–11.
Lavie P, Herer P, Peled R, Berger I, Yoffe N, Zomer J et al. 1995. Mortality in sleep apnea patients: a multivariate analysis of risk factors. Sleep 18:149–57.
Lavie P, Lavie L & Herer P 2005. All-cause mortality in males with sleep apnoea syndrome: declining mortality rates with age. European Respiratory Journal 25:514–20.
98
Lemanske RF, Jr. 2003. Does respiratory syncytial viral-induced bronchiolitis result from helper T cell type 1/type 2 cytokine imbalance? American Journal of Respiratory and Critical Care Medicine 168:625–7.
Leung R, Ho A, Chan J, Choy D & Lai CK 1997. Royal jelly consumption and hypersensitivity in the community. Clinical and Experimental Immunology 27:333–6.
Lion A, Grubb J, Schechtman K & Hamilos D 2003. Causative and contributive factors to asthma severity and patterns of medication use in patients seeking specialized asthma care. Chest 124:1781–8.
Loddenkemper R 2003. European Lung White Book. United Kingdom: European Respiratory Society Journals.
Loeb M, Neupane B, Walter S, Hanning R, Carusone S, Lewis D et al. 2009. Environmental Risk Factors for Community-Acquired Pneumonia Hospitalization in Older Adults. Journal of the American Geriatrics Society 57:1036–40.
Lombardo LJ & Balmes JR 2000. Occupational Asthma: A Review. Environmental Health Perspectives 108.
Lubin JH, Blot WJ, Berrino F, Flamant R, Gillis CR, Kunze M et al. 1984. Modifying risk of developing lung cancer by changing habits of cigarette smoking. British Medical Journal 288:1953–6.
M. van den Berge, Kerstjens H & Postma D 2002. Provocation with adenosine 5'-monophosphate as a marker of inflammation in asthma, allergic rhinitis and chronic obstructive pulmonary disease. Clinical & Experimental Allergy 32:824 – 30.
Mannino DM & Buist S 2007. Global burden of COPD: risk factors, prevalence, and future trends. Lancet 370:765–73.
Mannino DM, Homa DM, Akinbami LJ, Ford ES & Redd SC 2002. Chronic obstructive pulmonary disease surveillance--United States, 1971-2000. Respiratory Care 47:1184–99.
Mannino F, Sposato B, Ricci A, Grasso D, De Clementi F & Mariotta S 2001. Induction and recovery phases of methacholine-induced bronchoconstriction using FEV1 according to the degree of bronchial hyperresponsiveness. Lung 179:137–45.
Marin JM, Carrizo SJ, Vicente E & Agusti AG 2005. Long-term cardiovascular outcomes in men with obstructive sleep apnoea-hypopnoea with or without treatment with continuous positive airway pressure: an observational study. Lancet 365:1046–53.
Marks GB, Colquhoun JR, Girgis ST, Koski MH, Treloar AB, Hansen P et al. 2001. Thunderstorm outflows preceding epidemics of asthma during spring and summer. Thorax 56:468–71.
Marshall NS, Wong KKH, Liu PY, Cullen SRJ, Knuiman MW & Grunstein RR 2008. Sleep Apnea as an Independent Risk Factor for All-Cause Mortality: The Busselton Health Study. Sleep 31:1079–85.
Marti S, Sampol G, Munoz X, Torres F, Roca A, Lloberes P et al. 2002. Mortality in severe sleep apnoea/hypopnoea syndrome patients: impact of treatment. European Respiratory Journal 20:1511–8.
Martinez-Garcia MA, Soler-Cataluna JJ, Roman-Sanchez P, Gonzalez V, Amoros C & Montserrat JM 2008. Obstructive sleep apnea has little impact on quality of life in the elderly. Sleep Medicine
99
Mathieu A, Mazza S, Decary A, Massicotte-Marquez J, Petit D, Gosselin N et al. 2008. Effects of obstructive sleep apnea on cognitive function: A comparison between younger and older OSAS patients. Sleep Medicine 9:112–20.
McCullers JA 2006. Insights into the interaction between influenza virus and pneumococcus. Clin Microbiology Review 19:571–82.
McGuinness G & Naidich D 2002. CT of airways disease and bronchiectasis. Radiologic Clinics of North America 40.
McKenzie, Abramson, Crockett, Glasgow, Jenkins, McDonald et al. 2007. The COPD-X Plan. SYDNEY: Australian Lung Foundation.
McManus T, Marley A, Baxter N, Christie S, O'Neill H, Elborn J et al. 2008. Respiratory viral infection in exacerbations of COPD. Respiratory Medicine 102:1575–80.
Meltzer E, Teper A & Danzig M 2008. Intranasal corticosteroids in the treatment of acute rhinosinusitis. Current Allergy and Asthma Reports 8:133–8.
Molfino NA 2004. Genetics of COPD. Chest 125:1929–40.
Moreno CR, Carvalho FA, Lorenzi C, Matuzaki LS, Prezotti S, Bighetti P et al. 2004. High risk for obstructive sleep apnea in truck drivers estimated by the Berlin questionnaire: prevalence and associated factors. Chronobiology International 21:871–9.
Morgan G, Corbett S & Wlodarczyk J 1998. Air pollution and hospital admissions in Sydney, Australia, 1990 to 1994. American Journal of Public Health 88:1761–6.
Morrissey BM & Evans SJ 2003. Severe bronchiectasis. Clinical Review of Allergy Immunology 25:233–47.
Morwood K, Gillis D, Smith W & Kette F 2005. Aspirin-sensitive asthma. Internal Medicine Journal 35:240–6.
Mullins RJ & Heddle R 2002. Adverse reactions associated with echinacea: the Australian experience. Annals of Allergy, Asthma and Immunology 88:42–51.
National Asthma Council Australia 2006. Asthma Management Handbook 2006. Melbourne.
Newman LS 2008. Air Pollution–Related Illness. Whitehouse Station, N.J.: Merck Research Laboratories.
Ni C, Ye Y, Wang M, Qian H, Song Z, Jia X et al. 2009. A Six-Nucleotide Insertion-Deletion Polymorphism in the CASP8 Promoter is Associated with Risk of Coal Workers' Pneumoconiosis. Journal of Toxicology and Enviromental Health 72: 712–6.
Ostro B, Lipsett M, Mann J, Wiener M & Selner J 1994. Indoor air pollution and asthma. Results from a panel study. American Journal of Respiratory and Critical Care Medicine 149:1400–6.
Osur S 2002. Viral respiratory infections in association with asthma and sinusitis: a review. Annals of Allergy Asthma and Immunology 89:553–60.
Pack AI 2006. Advances in sleep-disordered breathing. American Journal of Respiratory and Critical Care Medicine 173:7–15.
Parati G, Lombardi C & Narkiewicz K 2007. Sleep apnea: epidemiology, pathophysiology, and relation to cardiovascular risk. American Journal of Physiology Regulatory Integrative and Comparative Physiology 293:R1671–83.
100
Pasteur MC, Helliwell SM, Houghton SJ, Webb SC, Foweraker JE, Coulden RA et al. 2000. An investigation into causative factors in patients with bronchiectasis. American Journal of Respiratory and Critical Care Medicine 162:1277–84.
Peppard P, Young T, Palta M, Dempsey J & Skatrud J 2000a. Longitudinal study of moderate weight change and sleep-disordered breathing. ournal of the American Medical Association 284:3015–21.
Peppard PE, Young T, Palta M & Skatrud J 2000b. Prospective study of the association between sleep-disordered breathing and hypertension. New England Journal of Medicine 342:1378–84.
Pinto J, Hayes M, Schneider D, Naclerio R & Ober C 2008. A Genomewide Screen for Chronic Rhinosinusitis Genes Identifies a Locus on Chromosome 7q. Laryngoscope 118:2067–72.
Pribble C, Black P, Bosso J & Turner R 1990. Clinical manifestations of exacerbations of cystic fibrosis associated with nonbacterial infections. Journal of Pediatrics 117:200–4.
Rabe KF, Hurd S, Anzueto A, Barnes PJ, Buist SA, Calverley P et al. 2007. Global strategy for the diagnosis, management, and prevention of chronic obstructive pulmonary disease: GOLD executive summary. American Journal of Respiratory and Critical Care Medicine 176:532–55.
Radon K, Gerhardinger U, Schulze A, Zock J, Norback D, Toren K et al. 2008. Occupation and adult onset of rhinitis in the general population. Occupational and Environmental Medicine 65:38–43.
Redline S & Tishler P 2000. The genetics of sleep apnea. Sleep Medicine Reviews 4:583–602.
Redline S, Tishler PV, Hans MG, Tosteson TD, Strohl KP & Spry K 1997. Racial differences in sleep-disordered breathing in African-Americans and Caucasians. American Journal of Respiratory and Critical Care Medicine 155:186–92.
Rello J, Lujan M, Gallego M, Valles J, Belmonte Y, Fontanals D et al. 2009. Why mortality is increased in Healthcare-associated Pneumonia: lessons from pneumococcal bacteremic pneumonia. Chest. Chest. 2009 Dec 1. [Epub ahead of print]
Robinson P 2001. Cystic fibrosis. Thorax 56:237–41.
Roland NJ, Bhalla RK & Earis J 2004. The local side effects of inhaled corticosteroids: current understanding and review of the literature. Chest 126:213–9.
Romieu I, Sienra-Monge JJ, Ramirez-Aguilar M, Tellez-Rojo MM, Moreno-Macias H, Reyes-Ruiz NI et al. 2002. Antioxidant supplementation and lung functions among children with asthma exposed to high levels of air pollutants. American Journal of Respiratory and Critical Care Medicine 166:703–9.
Rosenfeld M, Davis R, FitzSimmons S, Pepe M & Ramsey B 1997. Gender gap in cystic fibrosis mortality. American Journal of Epidemiology 145:794–803.
Rosenstein BJ 2008. Cystic Fibrosis. Whitehouse Station, N.J.: Merck Research Laboratories.
Rutherford S & Eigeland K 2000. Indoor air quality: a report on health impacts and management options. Canberra: Department of Health and Ageing.
SABRE 2008. Surveillance of Australian Workplace Based Respiratory Events. Viewed 16th September 2008, <www.sabrensw.org>.
Samet J, Marbury M & Spengler J 1989. Health Effects and Sources of Indoor Air Pollution. The American review of respiratory disease 137:221–42.
101
Sandford A, Weir T & Pare P 1996. The genetics of asthma. American Journal of Respiratory and Critical Care Medicine 153:1749–65.
Sassani A, Findley LJ, Kryger M, Goldlust E, George C & Davidson TM 2004. Reducing motor-vehicle collisions, costs, and fatalities by treating obstructive sleep apnea syndrome. Sleep 27:453–8.
Savonius B, Keskinen H, Tuppurainen M & Kanerva L 2006. Occupational respiratory disease caused by acrylates. Clinical & Experimental Allergy 23:416 – 24.
Saynajakangas O, Keistinen T, Tuuponen T & Kivela SL 1998. Evaluation of the incidence and age distribution of bronchiectasis from the Finnish hospital discharge register. Central European Journal of Public Health 6:235–7.
Scollo M & Winstanley [editors] M 2008. Tobacco in Australia: Facts and Issues. Third Edition. Viewed 17/4/10 2010, <http://www.tobaccoinaustralia.org.au/>.
Sim M, Abramson M, LaMontagne T, Aroni R, Elder D & Peeters A 2005. Occupational asthma–detection, surveillance and prevention of the disease burden. Melbourne: Monash University.
Sin D & Sutherland E 2008. Obesity and the lung: 4. Obesity and asthma. Thorax 63:1018–23.
Sin DD & Man SF 2003. Why are patients with chronic obstructive pulmonary disease at increased risk of cardiovascular diseases? The potential role of systemic inflammation in chronic obstructive pulmonary disease. Circulation 107:1514–9.
Sin DD & Man SF 2005. Chronic obstructive pulmonary disease as a risk factor for cardiovascular morbidity and mortality. Procedings of the American Thoracic Societyc 2:8–11.
Singh A & Busse W 2006. Asthma exacerbations · 2: Aetiology. Thorax 61:809–16.
Siroux V, Pin I, Oryszczyn MP, Le Moual N & Kauffmann F 2000. Relationships of active smoking to asthma and asthma severity in the EGEA study. Epidemiological study on the Genetics and Environment of Asthma. European Respiratory Journal 15:470–7.
Sisson J, Wyatt T, Guidot D, Bagby G, Helander A, Tonnesen H et al. 2005. Bench to bedside: Mechanisms and consequences of alcohol-altered host defenses. Alcoholism-Clinical and Experimental Research 29:1090–7.
Slavin RG, Spector SL, Bernstein IL, Kaliner MA, Kennedy DW, Virant FS et al. 2005. The diagnosis and management of sinusitis: a practice parameter update. Journal of Allergy and Clinical Immunology 116:S13–47.
Smith DR & Leggat PA 2006. 24 years of pneumoconiosis mortality surveillance in Australia. J Occupational Health 48:309–13.
Spengler J, Neas L, Dockery D, Speizer F, Ware J & Raizanne M 1994. Respiratory symptoms and housing characteristics. Indoor Air 4:72–82.
Sporik R, Squillace SP, Ingram JM, Rakes G, Honsinger RW & Platts-Mills TA 1999. Mite, cat, and cockroach exposure, allergen sensitisation, and asthma in children: a case-control study of three schools. Thorax 54:675–80.
Stephenson I & Zambon M 2002. The epidemiology of influenza. Occupupational Medicine (London) 52:241–7.
Swierczynska M, Nizankowska-Mogilnicka E, Zarychta J, Gielicz A & Szczeklik A 2003. Nasal versus bronchial and nasal response to oral aspirin challenge: Clinical and biochemical
102
differences between patients with aspirin-induced asthma/rhinitis. Journal of Allergy and Clinical Immunology 112:995–1001.
Thomsen S, Ulrik C, Kyvik K, Larsen K, Skadhauge L, Steffensen I et al. 2005. The incidence of asthma in young adults. Chest 127:1928–34.
Tishler P, Larkin E, Schluchter M & Redline S 2003. Incidence of Sleep-Disordered Breathing in an Urban Adult Population. Journal of the American Medical Association 289 ::2230–7.
Trosini-Desert V, Germaud P & Dautzenberg B 2004. Tobacco smoke and risk of bacterial infection. REVUE DES MALADIES RESPIRATOIRES 21:539–47.
Twiss J, Metcalfe R, Edwards E & Byrnes C 2005. New Zealand national incidence of bronchiectasis "too high" for a developed country. Archives of Disease in Childhood 90:737–40.
Udwadia ZF, Doshi AV, Lonkar SG & Singh CI 2004. Prevalence of sleep-disordered breathing and sleep apnea in middle-aged urban Indian men. American Journal of Respiratory and Critical Care Medicine 169:168–73.
Vally H & Thompson P 2003. Allergic and asthmatic reactions to alcoholic drinks. Addiction Biology 8:3–11.
Wagner-Sonntag E 2007. Swallowing therapy in neurological diseases. NERVENHEILKUNDE 26:1083.
Wang X, Ohtsuka Y, Kimura K, Kaji H, Saito J, Tanino Y et al. 2008. Mannose-binding lectin gene polymorphisms and the development of coal workers' pneumoconiosis in Japan. American Journal of Industrial Medicine 51:548–53.
Warner J 2009. Obesity and allergic disease: closely related epidemics of the 21st century. Pediatric Allergy and Immunology 20:305–6.
Wasswa-Kintu S, Gan WQ, Man SF, Pare PD & Sin DD 2005. Relationship between reduced forced expiratory volume in one second and the risk of lung cancer: a systematic review and meta-analysis. Thorax 60:570–5.
Wat D, Gelder C, Hibbitts S, Bowler I, Pierrepoint M, Evans R et al. 2008. Is there a role for influenza vaccination in cystic fibrosis? Journal of Cystic Fibrosis 7:85–8.
Waters DL, Wilcken B, Irwing L, Van Asperen P, Mellis C, Simpson JM et al. 1999. Clinical outcomes of newborn screening for cystic fibrosis. Archives of Diseases Childhood: Fetal Neonatal Edition 80:F1–7.
Watson L, Vonk J, Löfdahl C, Pride N, Pauwels R, Laitinen L et al. 2006. Predictors of lung function and its decline in mild to moderate COPD in association with gender: Results from the Euroscop study. Respiratory Medicine 100:746–53.
Webster RG 2001. Virology. A molecular whodunit. Science 293:1773–5.
Welch LS & Haile E 2009. Asbestos-Related Disease Among Sheet Metal Workers 1986–2004: Radiographic Changes Over Time. American Journal of Industrial Medicine 52:519–25.
Wetter DW, Young TB, Bidwell TR, Badr MS & Palta M 1994. Smoking as a risk factor for sleep-disordered breathing. Archives of Internal Medicine 154:2219–24.
Weycker D, Edelsberg J, Oster G & Tino G 2005. Prevalence and Economic Burden of Bronchiectasis. Clinical Pulmonary Medicine 12:205–9.
World Health Organization (WHO) 2007. Global surveillance, prevention and control of chronic respiratory diseases : a comprehensive approach. Geneva.
103
Wright PF 2006. The use of inactivated influenza vaccine in children. Seminars in Pediatric Infectious Diseases 17:200–5.
Yaggi HK, Concato J, Kernan WN, Lichtman JH, Brass LM & Mohsenin V 2005. Obstructive sleep apnea as a risk factor for stroke and death. New England Journal of Medicine 353:2034–41.
Yee B, Phillips C, Banerjee D, Caterson I, Hedner J & Grunstein R 2007. The effect of sibutramine-assisted weight loss in men with obstructive sleep apnoea. International Journal of Obesity 31:161–8.
Yin P, Jiang CQ, Cheng KK, Lam TH, Lam KH, Miller MR et al. 2007. Passive smoking exposure and risk of COPD among adults in China: the Guangzhou Biobank Cohort Study. Lancet 370:751–7.
Young T, Palta M, Dempsey J, Skatrud J, Weber S & Badr S 1993. The occurrence of sleep-disordered breathing among middle-aged adults. New England Journal of Medicine 328:1230–5.
Young T, Peppard PE & Gottlieb DJ 2002a. Epidemiology of obstructive sleep apnea: a population health perspective. American Jouirnal of Respiratory and Critical Care Med 165:1217–39.
Young T, Shahar E, Nieto FJ, Redline S, Newman AB, Gottlieb DJ et al. 2002b. Predictors of sleep-disordered breathing in community-dwelling adults: the Sleep Heart Health Study. Archives of Intern al Medicine 162:893–900.
Young T, Skatrud J & Peppard PE 2004. Risk factors for obstructive sleep apnea in adults. Jama 291:2013–6.
Yucesoy B & Luster MI 2007. Genetic susceptibility in pneumoconiosis. Toxicology Letters 168:249–54.
Zambon MC 1999. Epidemiology and pathogenesis of influenza. Journal of Antimicrobial Chemotherapy 44 Supplement B:3–9.
104
List of tables
Table 1.1: Data sources available for monitoring respiratory diseases in Australia.............................8
Table 2.1: Risk factors for selected respiratory conditions.......................................................................9
Table 6.1: Prevalence of COPD, by Indigenous status and sex, 2004–05..............................................36
Table 6.2: Prevalence of COPD, by Indigenous status and sex, age-standardised rate, 2004–05 ........................................................................................................................................36
Table B.1: Expenditure allocated to asthma and COPD by type of expenditure, 2004–05.................84
Table B.2: Direct expenditure allocated to asthma, by age, sex and area of health expenditure, 2004–05, ($ millions) ...........................................................................................86
Table B.3: Direct expenditure allocated to COPD, by age, sex and area of health expenditure, 2004–05, ($ millions) ...........................................................................................87
Fact sheet 1: Asthma hospitalisations............................................................................................................88
Fact sheet 2: Asthma mortality .......................................................................................................................89
Fact sheet 3: COPD hospitalisations ..............................................................................................................90
Fact sheet 4: COPD deaths ..............................................................................................................................91
105
List of figures
Figure 1.1: The respiratory system................................................................................................................ 2
Figure 1.2: Respiratory disease comorbidity................................................................................................ 5
Figure 3.1. Prevalence of asthma by age and sex, 2004–05 ...................................................................... 23
Figure 3.2. Trends in asthma deaths by sex, 1979–2006 ........................................................................... 25
Figure 3.3. Trends in asthma hospitalisations by sex, 1998–99 to 2006–07 ............................................ 26
Figure 3.4: Australian population with asthma, hayfever and chronic sinusitis (millions (m))......... 28
Figure 4.1: Prevalence of hayfever, by age and sex, 2004–05................................................................... 29
Figure 5.1: Prevalence of chronic sinusitis, by age and sex, 2004–05...................................................... 32
Figure 6.1: Age-specific prevalence of emphysema and/or bronchitis, 2004–05 ................................. 35
Figure 6.2: Deaths with underlying cause of COPD, 2006....................................................................... 37
Figure 6.3: Tobacco consumption and death rates for COPD and lung cancer in males, 1910 to 2006 .......................................................................................................................................... 38
Figure 6.4: Trends in COPD mortality, 1922 to 2006................................................................................. 39
Figure 6.5: Trends in hospitalisations for COPD, 1998–99 to 2006–07 ................................................... 41
Figure 6.6: Hospitalisations for COPD and populations of Indigenous and all Australians, 2006–07 ........................................................................................................................................ 42
Figure 6.7: Seasonal trend in hospitalisations for COPD and influenza or pneumonia, 2005–07 ........................................................................................................................................ 43
Figure 7.1: Deaths where the underlying cause was influenza or pneumonia and COPD, Australia, 2006 ............................................................................................................................ 48
Figure 7.2: Hospitalisations where influenza or pneumonia was the principal diagnosis, 2006–07 ........................................................................................................................................ 49
Figure 7.3: Hospitalisations where influenza or pneumonia was the principal diagnosis and NNDSS influenza notifications, 2006–07 ................................................................................ 50
Figure 7.4: Hospitalisations where asthma or influenza was the principal diagnosis; people aged 25 and above...................................................................................................................... 51
Figure 7.5: Hospitalisations where asthma or influenza was the principal diagnosis; people aged 25 and below ..................................................................................................................... 51
Figure 8.1. Deaths where bronchiectasis was an underlying or associated cause, 1998 to 2006......... 56
Figure 8.2. Hospital separation rate for bronchiectasis, 2006–07 ............................................................ 57
Figure 8.3 Selected hospital procedures for bronchiectasis, 2006–07 .................................................... 58
Figure 8.4. Hospitalisations where bronchiectasis was an additional diagnosis, 2006–07 .................. 59
Figure 9.1: Those registered with the ACFDR who reported lung function test results; proportion of children, adolescents and adults by severity of impairment....................... 61
Figure 9.2. Births per new diagnosis of cystic fibrosis.............................................................................. 63
Figure 9.3. Australian Cystic Fibrosis Data Registry, registrants by age and sex, December 2005 .............................................................................................................................................. 64
Figure 9.4: Average age at death where cystic fibrosis was the underlying cause............................... 65
Figure 9.5: Hospital procedures for cystic fibrosis, 2006–07.................................................................... 66
106
Figure 9.6. Lung or heart/lung transplants, 1998–99 to 2006–07............................................................ 67
Figure 9.7. Trend in hospital separation rate for cystic fibrosis, 1998–99 to 2006–07........................... 67
Figure 9.8: Body Mass Index (BMI) of registrants of the ACFDR at 31 December 2005, compared to BMI in the Australian population..................................................................... 68
Figure 9.9. Additional diagnoses where CF was the principal diagnosis, 2006–07.............................. 69
Figure 10.1. Number of claims in the National Data Set for Compensation-based Statistics by type of pneumoconiosis, 1997–98 to 2004–05. ........................................................................ 72
Figure 10.2: Trends in death rates for pneumoconiosis, 1940–2006.......................................................... 73
Figure 10.3. Trend in pneumoconiosis mortality by type, 1998 to 2006................................................... 74
Figure 11.1: Deaths with sleep apnoea reported anywhere on the death certificate.............................. 77
Figure 11.2: Trends in hospitalisations for SA, 1998–99 to 2006–07.......................................................... 78
Figure B.1: Direct expenditure allocated to asthma and COPD, by type of expenditure, 2004–05. ....................................................................................................................................... 84
Figure B.2: Direct expenditure allocated to asthma, by type of expenditure, 2004–05......................... 85
Figure B.3: Direct expenditure allocated to COPD, by type of expenditure, 2004–05 .......................... 85
107
List of boxes
Box 1.1: Definitions of the respiratory diseases covered ........................................................................4
Box 2.1: Mucociliary clearance and alveolar macrophages..................................................................13
Box 2.2: Perennial and seasonal hayfever...............................................................................................16
Box 3.1: Types of causes of death ............................................................................................................24
Box 5.1: The sinuses...................................................................................................................................31
Box 6.1: COPD deaths in 2006 ..................................................................................................................36
Box 7.1: Types of influenza.......................................................................................................................46
Box 7.2: Types of pneumonia ...................................................................................................................53
Box 9.1 : Effects of cystic fibrosis (CF) on the respiratory clearance mechanism...............................60
Box 9.2: Diagnosis of CF ...........................................................................................................................62
Box 9.2: Bronchial alveolar Lavage (BAL) ..............................................................................................68
Box 10.1: Physical changes in pneumoconiosis .......................................................................................70
Box 11.1 Diagnosis of sleep apnoea by polysomnography...................................................................75
Box 11.2: What is cognitive function? .......................................................................................................80
Box B.1: Allocation of total direct health expenditure to diseases in 2004–05 ...................................83