Association Mapping and the Human Genomehein/HumanGenome/cardon.pdfAssociation Mapping and the Human...
66
Association Mapping and the Human Genome Lon Cardon Wellcome Trust Centre for Human Genetics
-
Upload
nguyenhanh -
Category
Documents
-
view
224 -
download
0
Transcript of Association Mapping and the Human Genomehein/HumanGenome/cardon.pdfAssociation Mapping and the Human...

Association Mapping and the Human GenomeLon Cardon
Wellcome Trust Centre for Human Genetics
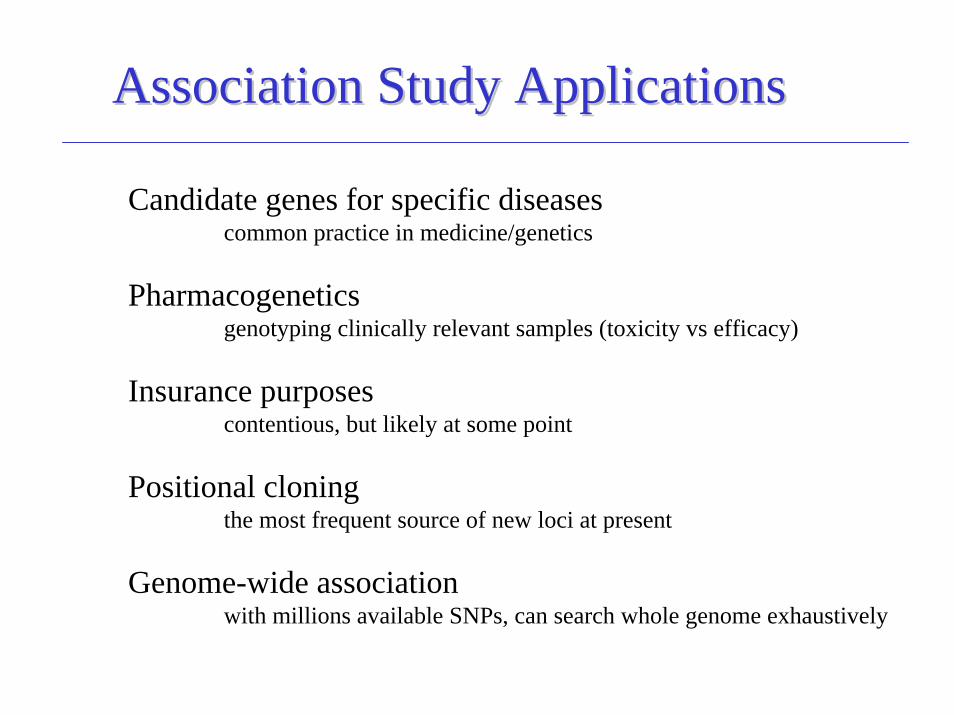
Association Study ApplicationsAssociation Study Applications
Candidate genes for specific diseasescommon practice in medicine/genetics
Pharmacogeneticsgenotyping clinically relevant samples (toxicity vs efficacy)
Insurance purposescontentious, but likely at some point
Positional cloningthe most frequent source of new loci at present
Genome-wide association with millions available SNPs, can search whole genome exhaustively

Association Studies and the Human Genome
1. Mendelian disorders and positional cloning
2. Complex trait association models3. Current status4. Near-term challenges

Mendelian Disorders
• Measured phenotype caused by single gene– May have multiple mutations in gene– May be additional (presumably environmental) causes
• Follow clear segregation patterns in families• Typically rare in population• Examples
– Duchenne Muscular Dystropy– Cystic Fibrosis (1989)– Huntington’s Disease (1993)– ~ 1200 have been mapped

Positional CloningThe identification of a gene based solely on its
position in the genome
• Most widespread strategy in human genetics in past 15 years• Most ongoing association studies initiated on basis of this model• Strengths
– No knowledge of function of gene product required– Very strong track record in single gene disorders
• Weaknesses– Understanding of function not a certain outcome– Poor track record with multifactorial conditions

Positional CloningGenetics
Chromosome Region Association StudyFamilies
LOD
GenomicsMutation Characterization/Functional Annotation
Candidate Gene Selection/Polymorphism Detection
Physical Mapping/Sequencing
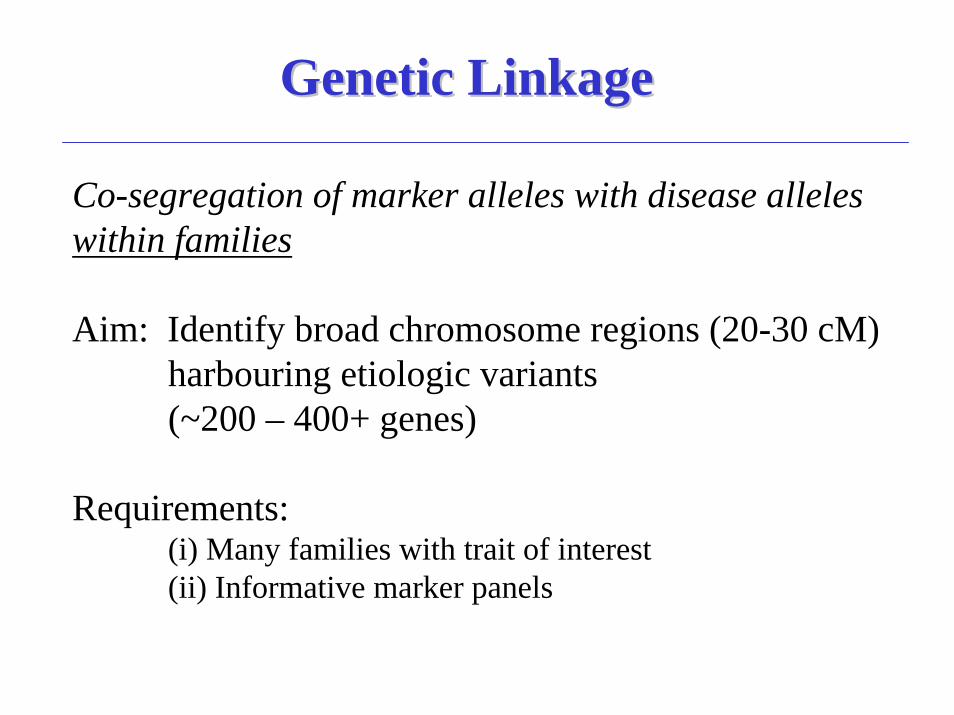
Genetic LinkageGenetic Linkage
Co-segregation of marker alleles with disease alleles within families
Aim: Identify broad chromosome regions (20-30 cM) harbouring etiologic variants(~200 – 400+ genes)
Requirements: (i) Many families with trait of interest(ii) Informative marker panels

Single Gene Linkage AnalysisSingle Gene Linkage Analysis
affected3/5 2/6
3/2 5/2 4/3
3/5 3/2 4/5
unaffected
Disease linked to ‘5’ allele in dominant inheritance pattern
Allele coded by CA copies2 = CACA6 = CACACACACACA

Netherton Syndrome Linkage
Chavanas et al., Am J Hum Genet, 66:914-921, 2000

Netherton Syndrome Haplotypes
Chavanas et al., Am J Hum Genet, 66:914-921, 2000

Chavanas et al. 2000, Nature Genetics

Multifactorial Traits(aka “Complex Disease”)
• Caused by > 1 gene• Possibly triggered by environment• Each gene (env) may have small effect• No clear segregation pattern in families• Epistasis or intra-genic interactions likely• Pleiotropy, environmental influences, G x E
interactions likely• Epigenetic influences possible• Measurement of disease or phenotype not highly
reliable

Assessing genetic contributions to complex traits
• Continuous characters (wt, blood pressure)– Heritability: Proportion of observed variance in phenotype
explained by genetic factors
• Discrete characters (disease)– Relative risk ratio: λ = risk to relative of an affected
individual/risk in general population− λ encompasses all genetic and environmental effects, not just those
due to any single locus

λs examples• Huntington’s Disease >1000• Cystic Fibrosis 400• Autism 75• Inflammatory Bowel Disease 60• Multiple Sclerosis 20• Juvenile Diabetes 15• Schizophrenia 10• Asthma 6• Prostate Cancer 5• Late Onset Diabetes 2-3• Breast Cancer 2
NB: all are crude estimates as different sampling strategies give different values

Cloning Predictions 1995
Collins, F.S. Positional cloning moves from perditional to traditional, Nat Genet, 9:347-350, 1995

Genome Screens in Complex Traits
1997/98 1999- Diabetes (IDDM + NIDDM)- Asthma/atopy- Osteoporosis- Obesity- Multiple Sclerosis- Rheumatoid arthritis- Systemic lupus erythematosus- Ankylosing spondylitis- Epilepsy- Inflammatory Bowel Disease- Celiac Disease- Psychiatric Disorders (incl. Scz, bipolar)- Behavioral traits (incl. Personality, panic)- others missed...
- NIDDM- Asthma/atopy- Psoriasis- Inflammatory Bowel Disease- Osteoporosis/Bone Mineral Density- Obesity- Epilepsy- Thyroid disease- Pre-eclampsia- Blood pressure- Psychiatric disorders (incl. Scz, bipolar)- Behavioral traits (incl. smoking, alcoholism,
autism)- Familial combined hyperlipidemia- Tourette syndrome- Systemic lupus erythematosus- others missed…

Inflammatory Bowel Disease Genome Screen
Hampe et al., Am J Hum Genet, 64:808-816, 1999

Inflammatory Bowel Disease Genome Screen
Hampe et al., Am J Hum Genet, 64:808-816, 1999
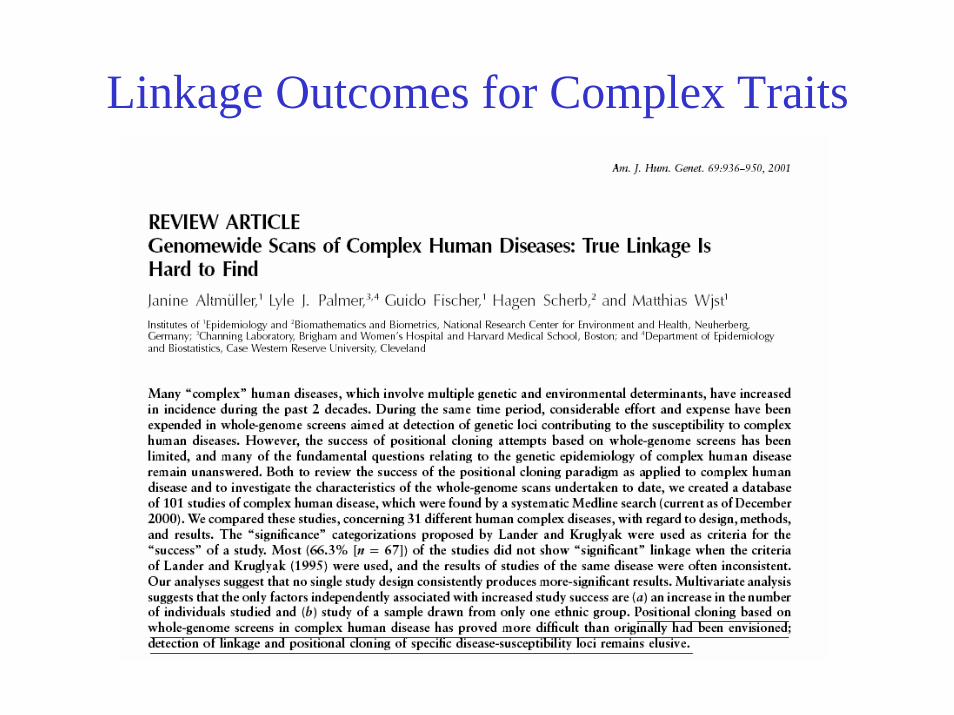
Linkage Outcomes for Complex Traits

Why such limited success with complex trait linkage studies?
• Power– Power calculations have always indicated need for many 100’s,
probably thousands of families to detect genes of even moderate effect
– N ~ 200 for most studies conducted to date• For QTL, this is about enough to detect a locus explaining 25% of the
total variance in the trait
• Hope for ‘low-hanging’ fruit– If there are one or a few monogenic-like loci within oligogenic
spectrum, could lead to pathway information– Not supported by data.
• Practical problems: errors in data

Pedigree Errors
Excerpt from Am J Hum Genet, 2000
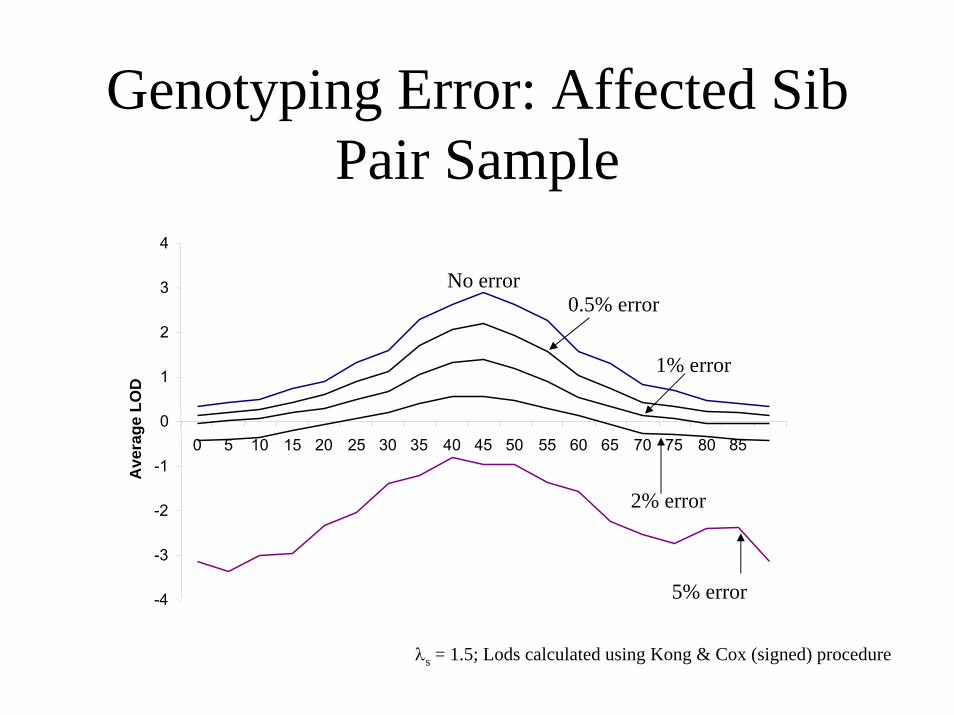
Genotyping Error: Affected Sib Pair Sample
2% error
0.5% error
1% error
No error
5% error-4
-3
-2
-1
0
1
2
3
4
0 5 10 15 20 25 30 35 40 45 50 55 60 65 70 75 80 85
Ave
rage
LO
D
λs = 1.5; Lods calculated using Kong & Cox (signed) procedure
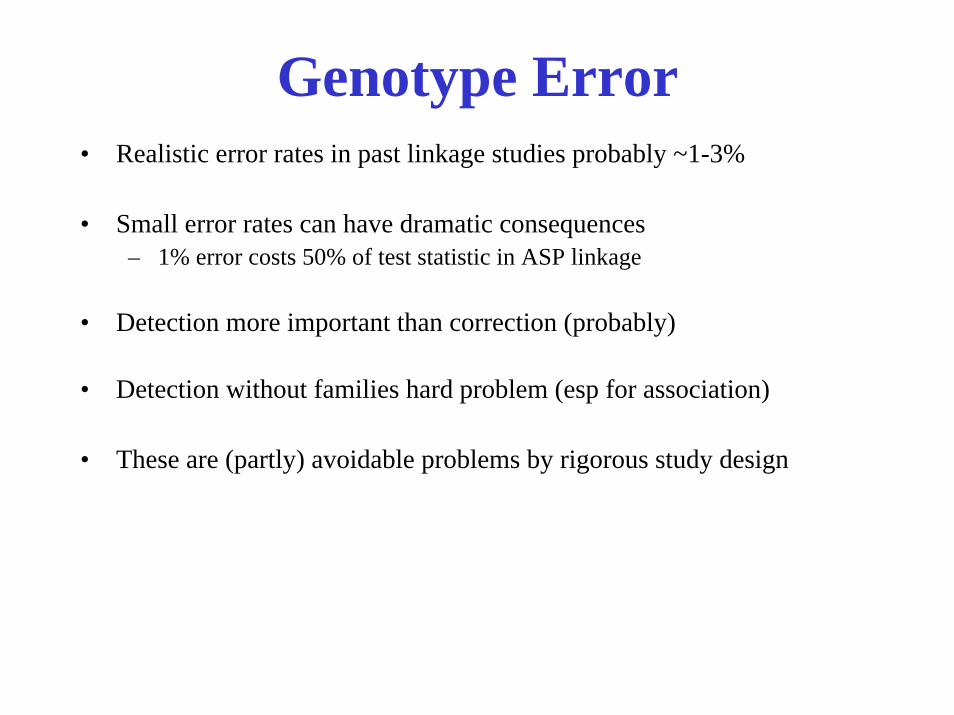
Genotype Error• Realistic error rates in past linkage studies probably ~1-3%
• Small error rates can have dramatic consequences– 1% error costs 50% of test statistic in ASP linkage
• Detection more important than correction (probably)
• Detection without families hard problem (esp for association)
• These are (partly) avoidable problems by rigorous study design

Positional Cloning of Complex Traits: Lack of Success
...Not surprisingly, progress in analyzing complex geneticdisorders has been more modest. What success there has been has basically come from one of two approaches:
(i) Identification of a sub-phenotype in pedigrees... (akin to Mendelian disorder)
(ii) Genetic studies in isolated human populations(reduced genetic variation)
(Collins et al, Science, 278:1580-81, 1997)
This has not improved in past 8 years…Weiss & Terwilliger (2000), Altschuler et al (2000), others

L OD
Sib pairs Chromosome Region Association StudyGenetics
GenomicsCandidate Gene Selection/Polymorphism Detection
Mutation Characterization/Functional Annotation
Physical Mapping/Sequencing
The weakest link?

Association Analysis
• Simple genetic basis
Short unit of resemblancePopulation-specific
• One of easiest genetic study designs
Correlate allele frequencies with traits/diseasesAt core of monogenic & oligo/polygenic trait models
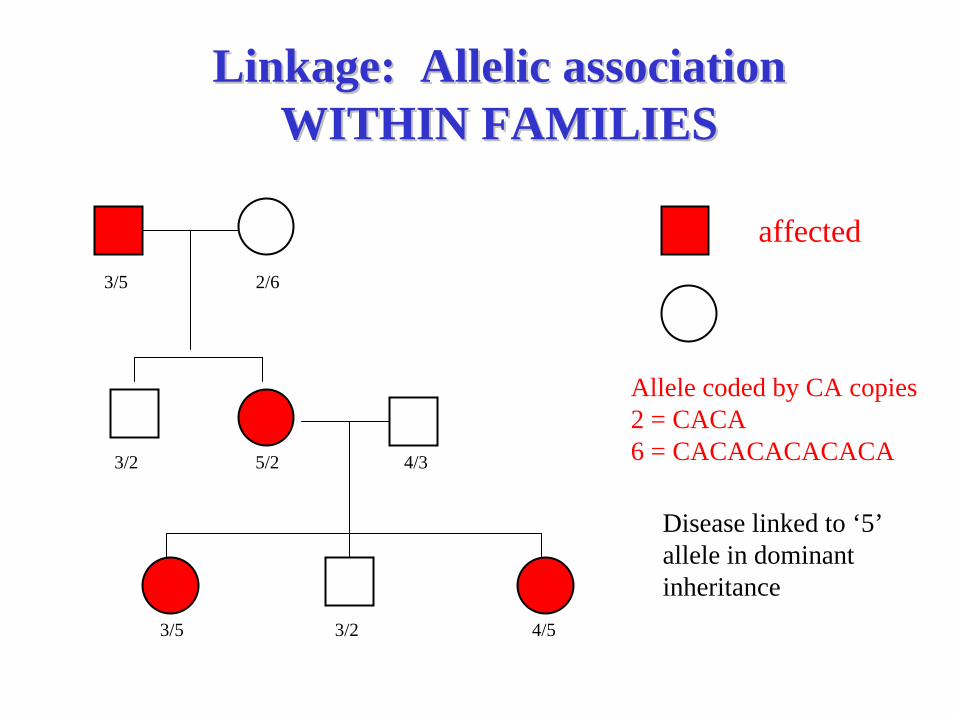
Linkage: Allelic associationLinkage: Allelic associationWITHIN FAMILIESWITHIN FAMILIES
affected3/5 2/6
3/2 5/2 4/3
3/5 3/2 4/5
unaffected
Disease linked to ‘5’ allele in dominant inheritance
Allele coded by CA copies2 = CACA6 = CACACACACACA

Allelic Association:Allelic Association:Extension of linkage to the populationExtension of linkage to the population
3/5 2/6
3/2 5/2
3/5 2/6
3/6 5/6
Both families are ‘linked’ with the marker, but a different allele is involved

Allelic AssociationAllelic AssociationExtension of linkage to the populationExtension of linkage to the population
3/5 2/6
3/6 5/6
3/6 2/4
3/2 6/2
All families are ‘linked’ with the markerAllele 6 is ‘associated’ with disease
4/6 2/6
6/6 6/6

Allelic AssociationAllelic Association
Controls Cases
3/62/4
3/2
6/23/5
2/6
3/6 5/6
Allele 6 is ‘associated’ with disease
4/62/6
6/6
3/4
6/6
5/2


Linkage vs AssociationAssociation
1. Families or unrelateds2. Matching/ethnicity important3. Many markers for genome
coverage (105 – 106 SNPs)4. Powerful design based on
means5. Yields fine-scale location6. Good for fine-mapping, poor
for initial detection7. Powerful for common variants;
rare variants generally impossible
Linkage
1. Requires families2. Matching/ethnicity generally
unimportant3. Few markers for genome
coverage (300-400 STRs)4. Allele-sharing weak design5. Yields coarse location 6. Good for initial detection; poor
for fine-mapping 7. Powerful for rare variants

Allelic AssociationAllelic AssociationThree Common FormsThree Common Forms
• Direct Association• Mutant or ‘susceptible’ polymorphism• Allele of interest is itself involved in phenotype
• Indirect Association• Allele itself is not involved, but a nearby correlated
marker changes phenotype
• Spurious association• Apparent association not related to genetic aetiology

Indirect and Direct Allelic Association
Direct Association
M1 M2 Mn
Assess trait effects on D via correlated markers (Mi) rather than susceptibility/etiologic variants.
D
Indirect Association & LD
D
*
Measure disease relevance (*) directly, ignoring correlated markers nearby
Semantic distinction between Linkage Disequilibrium: correlation between (any) markers in populationAllelic Association: correlation between marker allele and trait

How many association studies have been conducted?
• Pubmed: 1 Mar 2004. “Genetic association” gives 23,467 hits
• > 10% hits in HLA alone
• Probably ~ 20 confirmed associations for complex traits

Association Study OutcomesReported p-values from association
studies in Am J Med Genet or Psychiatric Genet 1997
Terwilliger & Weiss, Curr Opin Biotech, 9:578-594, 1998

Why limited success with association studies?
1. Small sample sizes results overinterpreted
2. Phenotypes are complex. Candidate genes difficult to choose
3. Allelic/genotypic contributions are complex. Even true associations difficult to see.
4. Background patterns of LD are unknown. Difficult to appreciate signal when can’t assess noise.
5. Population stratification has led clouded true/false positives

Influence of sample size on association reportingSample Size MattersPPARγ and NIDDM
ACE and MI
Altshuler et al Nat Genet 2000 Keavney et al Lancet 2000

Phenotypic Complexity
Weiss & Terwilliger, Nat Genet, 2000

Heterogeneity
Terwilliger & Weiss, Curr Opin Biotechnol, 1998

Effects of linkage disequilibrium
Roses, Nature 2000

Main BlameMain Blame
Why do association studies have such a spotted history in human genetics?
Blame: Population stratification
Analysis of mixed samples having different allele frequencies is a primary concern in human genetics, as it leads to false evidence for allelic association.

Population Stratification
• Recent admixture of populations• Requirements:
– Group differences in allele frequency– Group differences in outcome
• Leads to spurious association
• In epidemiology, this is a classic matching problem, with genetics as a confounding variable
Most oft-cited reason for lack of association replication
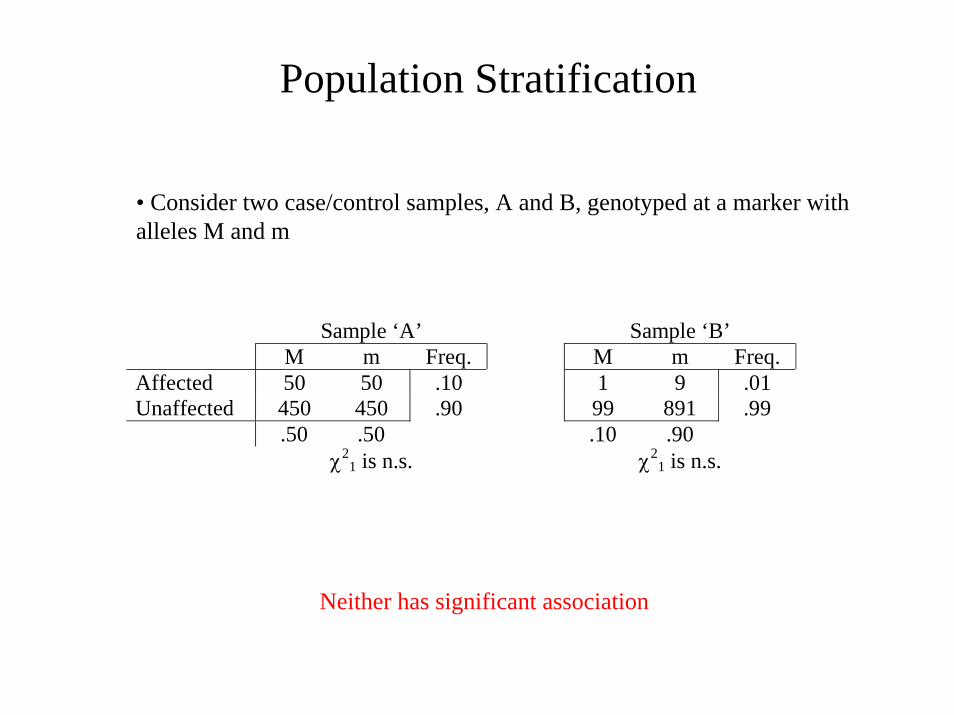
Population Stratification
• Consider two case/control samples, A and B, genotyped at a marker with alleles M and m
Sample ‘A’ Sample ‘B’ M m Freq. M m Freq. Affected 50 50 .10 1 9 .01 Unaffected 450 450 .90 99 891 .99 .50 .50 .10 .90 χ2
1 is n.s. χ21 is n.s.
Neither has significant association

Population Stratification
Sample ‘A’ M m Freq. Affected 50 50 .10 Unaffected 450 450 .90 .50 .50 χ2
1 is n.s.
Sample ‘B’ M m Freq. Affected 1 9 .01 Unaffected 99 891 .99 .10 .90 χ2
1 is n.s.
+
M m Freq. Affected 51 59 .055 Unaffected 549 1341 .945 .30 .70
χ21 = 14.84, p < 0.001
Association induced by sample mixing

Population Stratification: Real Example
39.3%35.9%8
28.8%28.3%4
19.9%17.8%0
-+
Gm3;5,13,14 haplotypeIndex of Indian Heritage
39.3%35.9%8
28.8%28.3%4
19.9%17.8%0
-+
Gm3;5,13,14 haplotypeIndex of Indian Heritage
Proportion with NIDDM by heritage and marker status
Full heritage American Indian Population
+ -Gm3;5,13,14 ~1% ~99%
(NIDDM Prevalence ≈ 40%)
Caucasian Population
+ -Gm3;5,13,14 ~66% ~34%(NIDDM Prevalence ≈ 15%)
Full heritage American Indian Population
+ -Gm3;5,13,14 ~1% ~99%
(NIDDM Prevalence ≈ 40%)
Caucasian Population
+ -Gm3;5,13,14 ~66% ~34%(NIDDM Prevalence ≈ 15%)
Gm3;5,13,14 haplotype
Cases Controls
+ 7.8% 29.0% - 92.2% 71.0%
Study without knowledge of genetic background:
OR=0.2795%CI=0.18 to 0.40
Reviewed in Cardon & Palmer, Lancet 2003
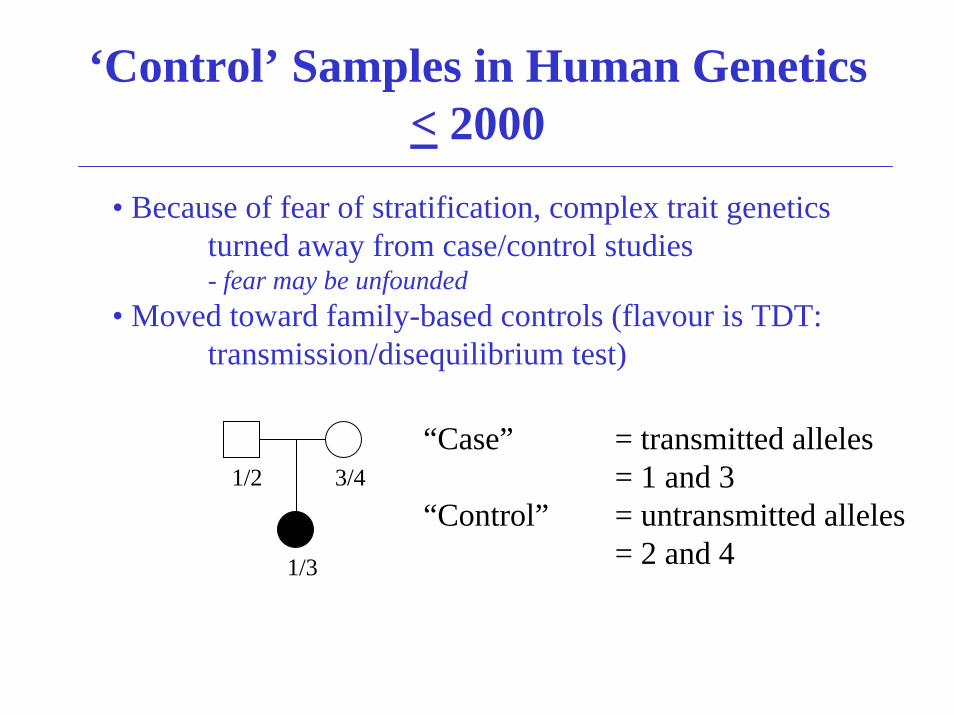
‘Control’ Samples in Human Genetics< 2000
• Because of fear of stratification, complex trait genetics turned away from case/control studies- fear may be unfounded
• Moved toward family-based controls (flavour is TDT: transmission/disequilibrium test)
“Case” = transmitted alleles= 1 and 3
“Control” = untransmitted alleles= 2 and 4
1/2 3/4
1/3
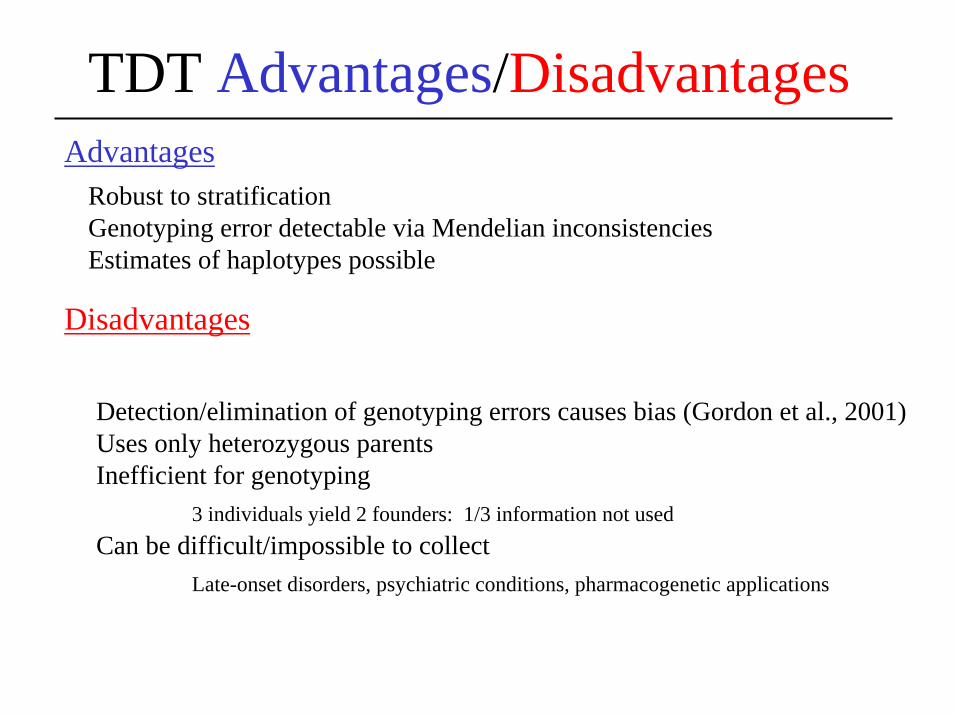
TDT Advantages/DisadvantagesAdvantages
Robust to stratificationGenotyping error detectable via Mendelian inconsistenciesEstimates of haplotypes possible
Disadvantages
Detection/elimination of genotyping errors causes bias (Gordon et al., 2001)Uses only heterozygous parents Inefficient for genotyping
3 individuals yield 2 founders: 1/3 information not usedCan be difficult/impossible to collect
Late-onset disorders, psychiatric conditions, pharmacogenetic applications

Association studies < 2000: TDT
•TDT virtually ubiquitous over past decadeGrant, manuscript referees & editors mandated design
• View of case/control association studies greatly diminished due to perceived role of stratification
Association Studies ~ 2000:Return to population
• Case/controls, using extra genotyping• Traditional trial design, augmented by genotyping

Detecting and Controlling for Detecting and Controlling for Population Stratification with Genetic MarkersPopulation Stratification with Genetic Markers
Idea• Take advantage of availability of large N genetic markers
• Use case/control design
• Genotype genetic markers across genome (Number depends on different factors)
• Look if any evidence for background population substructure exists and account for it
• Different approaches/different assumptions, models• GC (Devlin & Roeder, 1999)• Structured Association (Pritchard, Donnelly and others, 2000+)

Why limited success with association studies?
1. Small sample sizes results overinterpreted
2. Phenotypes are complex. Candidate genes difficult to choose
3. Allelic/genotypic contributions are complex. Even true associations difficult to see.
4. Background patterns of LD are unknown. Difficult to appreciate signal when can’t assess noise.
5. Population stratification has led to many false positives and misses

Upcoming association studies have real promise
• Large, epidemiological-sized samples emerging– ISIS, Biobank UK, Million Women’s Study, …
• Availability of millions of genetic markers– Genotyping costs decreasing rapidly
• Cost per SNP: 2001 ($0.25) 2003 ($0.10) 2004 ($0.05)
• Methods for dealing with population structure advancing
• Background LD patterns being characterized– International HapMap and other projects (see McVean lecture)
Could argue that association studies haven’t failed: they have yet to be conducted properly.
Key elements now in place to do so.

Current Association Study Challenges1) Genome-wide screen or candidate gene
Genome-wide screen• Hypothesis-free• High-cost: large
genotyping requirements• Multiple-testing issues
– Possible many false positives, fewer misses
Candidate gene• Hypothesis-driven• Low-cost: small
genotyping requirements• Multiple-testing less
important– Possible many misses,
fewer false positives

Current Association Study Challenges2) What constitutes a replication?
Replicating association results in different laboratories is often seen as most compelling piece of evidence for ‘true’ finding
But…. in any sample, we measureMultiple traitsMultiple genesMultiple markers in genes
and we analyse all this using multiple statistical tests
Extreme case (recently reported):• “Replication” to correlated phenotype (asthma vs atopy).• Different study design and selection strategies
(“outcomes must attest to the robustness of the findings”)• Same gene region, different markers (“they’re in LD, so must be okay”)• Opposite alleles/haplotype associated (“heterogeneity”)

Current Association Study Challenges3) Do we have the best set of genetic markers
There exist 6 million putative SNPs in the public domain. Are they the right markers?
Allele frequency distribution is biased toward common alleles
0
0.1
0.2
0.3
0.4
0.5
0.6
1-10% 11-20% 21-30% 31-40% 41-50%
Minor allele frequency
Popu
latio
n fre
quen
cy
0
0.1
0.2
0.3
0.4
0.5
0.6
1-10% 11-20% 21-30% 31-40% 41-50%
Minor allele frequency
Popu
latio
n fre
quen
cy
Expected frequency in population
Frequency of public markers

Current Association Study Challenges3) Do we have the best set of genetic markers
Tabor et al, Nat Rev Genet 2003

Current Association Study Challenges4) Common-Disease Common-Variant Hypothesis
Common genes (alleles) contribute to inherited differences in common disease
Given recent human expansion, most variation is due to old mutations that have since become common rather than newer rare mutations.
Highly contentious debate in complex trait field

Common-Disease/Common-VariantFor Against
Wright & Hastie, Genome Biol 2001

Taken from Joel Hirschorn presentation, www.chip.org
If this scenario, association studies will not work
If this scenario, properly designed association studies should work well

Current Association Study Challenges5) Integrating the sampling, LD and epidemiology
principles
Unanswerable questions in indirect association studies:
How much LD is needed to detect complex disease genes?
What effect size is big enough to be detected?
How common (rare) must a disease variant(s) be to be identifiable?
What marker allele frequency threshold should be used to find complex disease genes?

Main Point•In any indirect association study, we measure marker alleles that are correlated with disease variants…
We do not measure the disease variants themselves
•But, for study design and power, we concern ourselves with frequencies and effect sizes at the disease locus….
This can only lead to underpowered studies and inflated expectations
•We should concern ourselves with the apparent effect sizeat the marker, which results from
1) difference in frequency of marker and disease alleles
2) LD between the marker and disease loci3) effect size of disease allele

Single Trait allele (or multiple alleles on same haplotype)
Allelefreq
D D’(marker,T) r2(marker,T) ORM
1.0 2.001.0A = 0.30 0.21A a a a
T t t t 2.00T = 0.30
.18 1.431.0B = 0.70 0.09B B b b
.05 1.331.0C = 0.90 0.03C C C c
Hapfreq .30 .40 .20 .10
Zondervan & Cardon, Nat. Rev. Gen. 2004; 5: 89-100
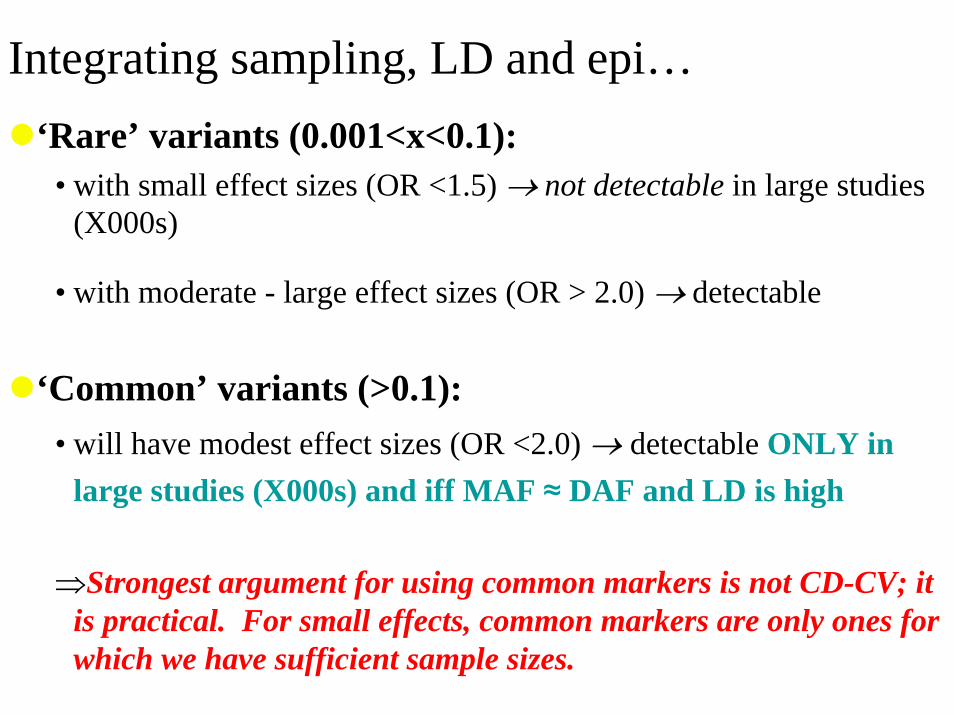
Integrating sampling, LD and epi…‘Rare’ variants (0.001<x<0.1):
• with small effect sizes (OR <1.5) → not detectable in large studies (X000s)
• with moderate - large effect sizes (OR > 2.0) → detectable
‘Common’ variants (>0.1):• will have modest effect sizes (OR <2.0) → detectable ONLY in
large studies (X000s) and iff MAF ≈ DAF and LD is high
⇒Strongest argument for using common markers is not CD-CV; it is practical. For small effects, common markers are only ones for which we have sufficient sample sizes.

Future
Better samples, larger marker sets, improved statistical measures, greater understanding of LD, …hold real promise for association
1) Some important disease genes will emerge2) Not all important disease genes will be identified
The diseases are severe enough to warrant the effort, even if ityields only some of the answers
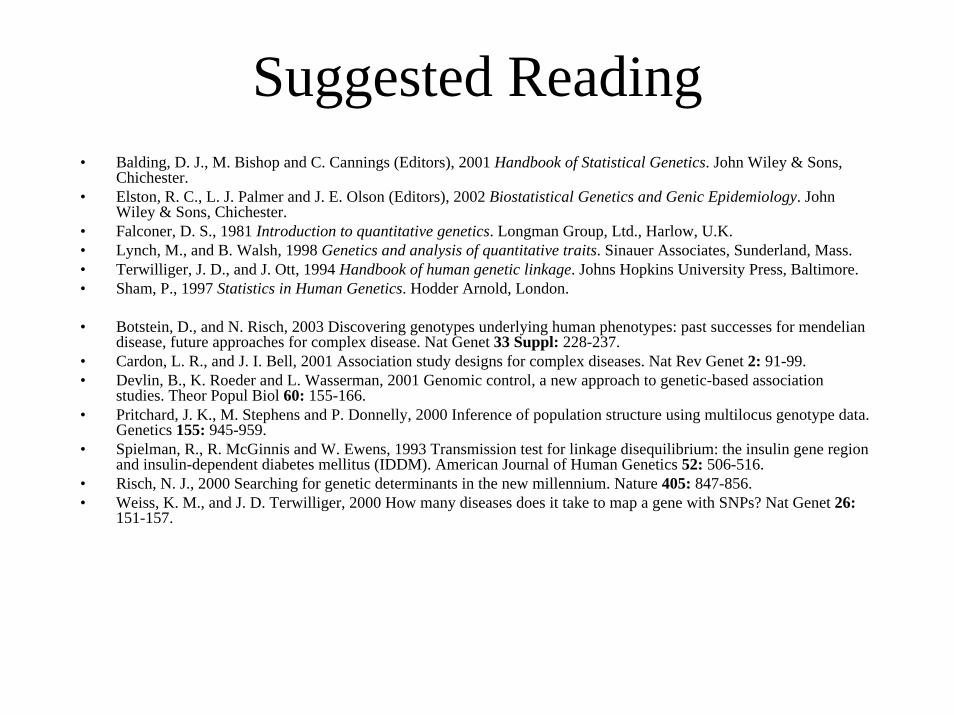
Suggested Reading• Balding, D. J., M. Bishop and C. Cannings (Editors), 2001 Handbook of Statistical Genetics. John Wiley & Sons,
Chichester.• Elston, R. C., L. J. Palmer and J. E. Olson (Editors), 2002 Biostatistical Genetics and Genic Epidemiology. John
Wiley & Sons, Chichester.• Falconer, D. S., 1981 Introduction to quantitative genetics. Longman Group, Ltd., Harlow, U.K.• Lynch, M., and B. Walsh, 1998 Genetics and analysis of quantitative traits. Sinauer Associates, Sunderland, Mass.• Terwilliger, J. D., and J. Ott, 1994 Handbook of human genetic linkage. Johns Hopkins University Press, Baltimore.• Sham, P., 1997 Statistics in Human Genetics. Hodder Arnold, London.
• Botstein, D., and N. Risch, 2003 Discovering genotypes underlying human phenotypes: past successes for mendeliandisease, future approaches for complex disease. Nat Genet 33 Suppl: 228-237.
• Cardon, L. R., and J. I. Bell, 2001 Association study designs for complex diseases. Nat Rev Genet 2: 91-99.• Devlin, B., K. Roeder and L. Wasserman, 2001 Genomic control, a new approach to genetic-based association
studies. Theor Popul Biol 60: 155-166.• Pritchard, J. K., M. Stephens and P. Donnelly, 2000 Inference of population structure using multilocus genotype data.
Genetics 155: 945-959.• Spielman, R., R. McGinnis and W. Ewens, 1993 Transmission test for linkage disequilibrium: the insulin gene region
and insulin-dependent diabetes mellitus (IDDM). American Journal of Human Genetics 52: 506-516.• Risch, N. J., 2000 Searching for genetic determinants in the new millennium. Nature 405: 847-856.• Weiss, K. M., and J. D. Terwilliger, 2000 How many diseases does it take to map a gene with SNPs? Nat Genet 26:
151-157.