Assignment on financial statement ratio analysis
27
Page No- 1 Executive Summary We gladly present you our report titled “Financial Ratio Analysis”. Our report also refers as an analytical report of accounting. We have made the report on the two listed company annual report analysis as you had given us to analyse by help of your suggestions. This report implies the companies’ activity, liquidity, solvency, profitability, valuation financial ratios that helps to get a proper picture of the companies. We have selected the company named- RAK Ceramics BD LTD & Berger Paints Bangladesh Limited. We have discussed all of the ration in the analysis & findings content. We have described the recommendation as much as possible. We believe that the knowledge and experience we gathered during the report will extremely helpful in our future professional and academic life. We will be grateful to you if you accept the assignment.
-
Upload
shourav-mahmud -
Category
Business
-
view
35 -
download
3
Transcript of Assignment on financial statement ratio analysis

Page No- 1
Executive Summary
We gladly present you our report titled “Financial Ratio Analysis”. Our report also
refers as an analytical report of accounting. We have made the report on the two listed
company annual report analysis as you had given us to analyse by help of your
suggestions. This report implies the companies’ activity, liquidity, solvency,
profitability, valuation financial ratios that helps to get a proper picture of the
companies. We have selected the company named- RAK Ceramics BD LTD & Berger
Paints Bangladesh Limited. We have discussed all of the ration in the analysis &
findings content. We have described the recommendation as much as possible.
We believe that the knowledge and experience we gathered during the report will
extremely helpful in our future professional and academic life. We will be grateful to
you if you accept the assignment.
Page No- 2
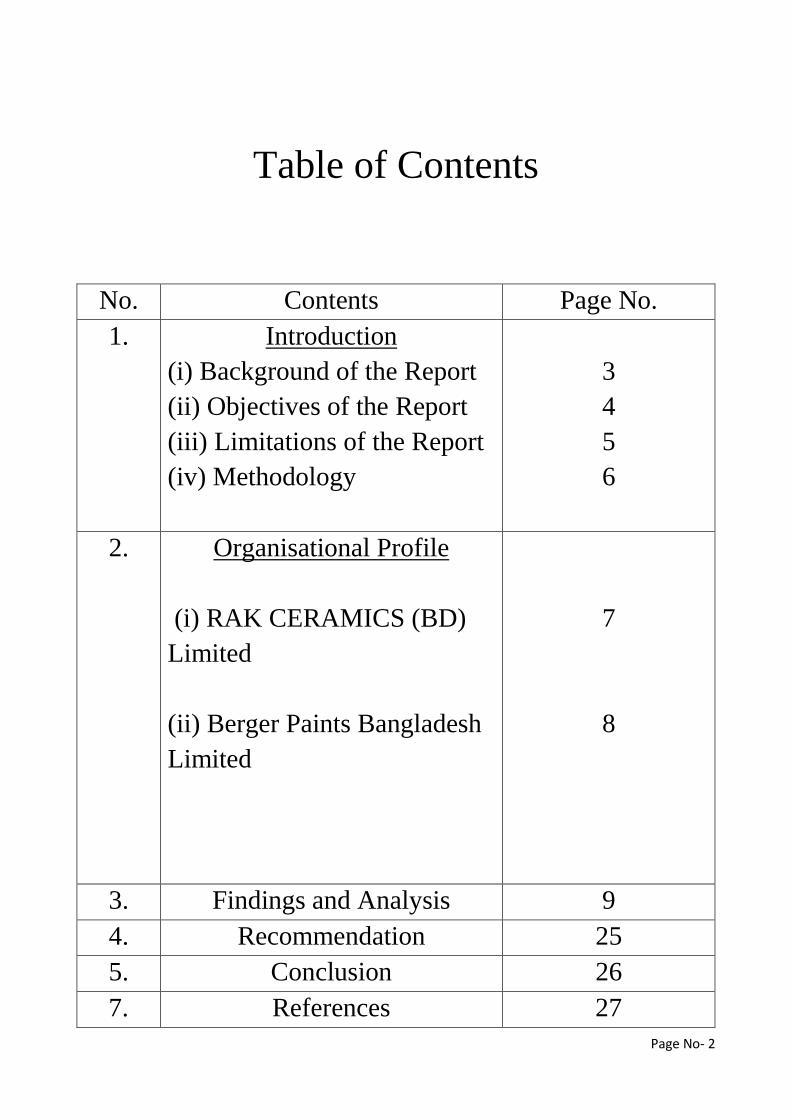
Table of Contents
No. Contents Page No.
1. Introduction
(i) Background of the Report
(ii) Objectives of the Report
(iii) Limitations of the Report
(iv) Methodology
3
4
5
6
2. Organisational Profile
(i) RAK CERAMICS (BD)
Limited
(ii) Berger Paints Bangladesh
Limited
7
8
3. Findings and Analysis 9
4. Recommendation 25
5. Conclusion 26
7. References 27

Page No- 3
Background of the Report
We assign the report to know and analyze the current (2015 & 2015) financial situation
of two companies and discuss how to turn their financial condition into satisfactions.
This report helps us to get new experience for preparing a report. We can get a result
so that we can analyze and solve many problems.
We have used 5 categories financial ratios so that we can easily analyze the whole
financial statement of the previous years annual report of two listed companies. These
categories are-
(1) Activity Ratio- measure how efficiency a company performs day-to-day
tasks
(2) Liquidity Ratio- measure the company’s ability to meet its short term
obligations.
(3) Solvency Ratio- measure a company’s ability to meet long term obligations.
(4) Profitability Ratio- measure the company’s ability to generate profitable
sales from its resources.
(5) Valuation Ratio- measure the quantity of an asset or flow.
We have assigned a recommendation part for this report so that we can discuss
financial positive and negative impact of a company. We also have tried to focus
proper comment/note for each ratio.

Page No- 4
Objectives of the Study
It is very important to set an objective for preparing our report. The main objective of
the report is to analyse the annual reports of two listed company- RAK Ceramics &
Berger Paints BD LTD.
So at first we have to collect the previous annual reports of two companies. We have
tried to solve accurate ratio analyse so that we can achieve our objective. The study
finds out the way haw we can analyze a report and find out the strong & weak sides of
financial situation of a company. So we have analyzed 5 categories ratio analysis
(which includes current ratio, quick ratio, cash ratio, inventory turnover ratio, payable
turnover ratio, fixed asset turnover ratio, debt-to-asset ratio, debt-to-capital ratio P/E,
P/CF etc)
Page No- 5
Limitations of the Study
Time Limitation: Our report submission date was 21 August 2016. We got the
presentation topic two/three weeks back. Unfortunately that was not enough time to
complete this presentation on a high note. If there was more time, we could have done
it much better.
Student Cooperation: Some Students of our class did not cooperate with us at all.
They were afraid that it is very much hard to analyze annual report. So we tried to
solve the ratios without proper helping hand.
Knowledge Gap: We did this kind of report for the very first time and it was obvious
that there will be some knowledge gap.
Absence of Necessary Documents: As it was our first time doing this kind of report
and also we do not know anyone who have done this sort of report before. Therefore
we did not have the proper documents that was needed (except annual report of 2014-
2015).

Page No- 6
Methodology
Sources of Data: We collected data to prepare our repot from 2 types of data:-
(1) Primary Data: Primary data are measurement observed and recorded as part
of an original study. There are two basic methods of obtaining primary data-
Questioning and Observation. We have collected primary data from the
companies (RAK Ceramics BD LTD & Berger Paints Bangladesh Limited)
own websites. The companied have published their 2014 & 2015 annual
repoerts who are thought to have the desired information. So we have get
proper and efficient information from its websites.
(2) Secondary Data: Secondary data is data collected by someone other than
the user. We have collected as a secondary data from lecturer sheet and useful
webinks like Wikipedia, Slideshare (Linkedin) etc.
Page No- 7
Organizational Profile
RAK Ceramics BD LTD
RAK Ceramics (Bangladesh) Limited is the country’s largest and most respected tiles
and sanitary ware brand. The Company was incorporated in Bangladesh on 26
November, 1998 as a private limited company under the Companies Act, 1994 as a
UAE-Bangladesh joint venture project. It has started its commercial production on 12
November 2000. It has converted into public limited company on 10 June 2008 and
listed in the stock exchanges of Bangladesh on 13th June 2010. The Company has
anchored this position on the basis of its market-leading capacities, world-class
manufacturing technologies, high production utilization, optimized cost structures,
vibrant sales and distribution network and robust customer engagement programs.
Page No- 8
Products- Ceramic tiles, sanitary ware, taps and kitchen fittings, tableware, tile
adhesives, interior ancillary products.
Berger Paints Bangladesh LTD
Berger Paints Ltd is the second largest Paint Company in India and a market leader
in Industrial Paint for the past 45 years with a consistent track record of being one of
the fastest growing paint companies, quarter on quarter, for the past few years.
Headquartered at Kolkata it has 10 manufacturing units and over 110 stock points. The
company also has an international presence in 4 countries – Russia, Poland, Nepal and
Bangladesh. With employee strength of over 2,800 and a countrywide distribution
network of 25,000+ dealers, Berger is established in the sector with a varied portfolio
of paints and tailor-made customer services.
Products- Paints, Coatings, Wallpaper, Construction Chemicals and allied products.

Page No- 9
Findings and Analysis
Ratio Analysis- RAK Ceramics
Inventory Turnover Ratio = Cost of Goods Sold
Average Inventory
2015 2014
=2896890000
2239844230 =
3255270000
1835354727
=1.293 =1.773
* The inventory turnover ratio rate of 2014 is greater than 2015.
Receivable Turnover = Revenue
Average Receivables
2015 2014
=5508640000
580719781 =
6329964274
638387373
=9.916 =9.486
* Receivable turnover ratio of two years is almost average and well. The receivable
turnover ratio of 2015 has been improved before the year of 2014.
Page No- 10
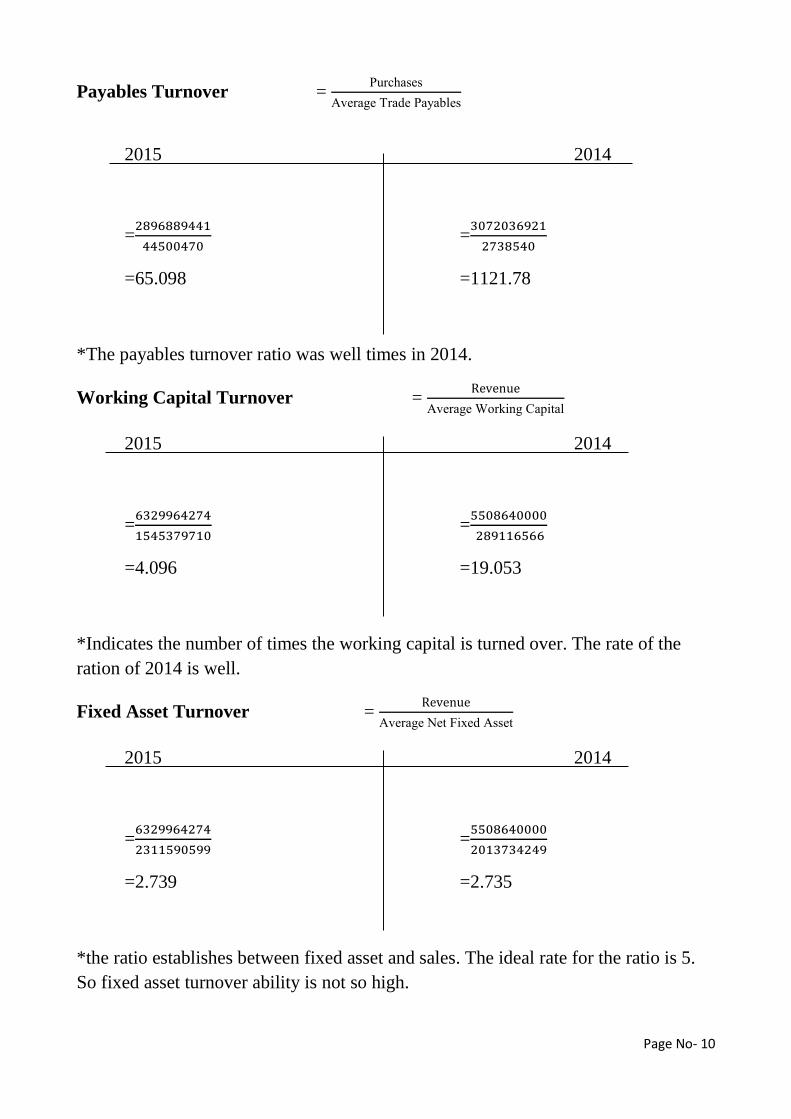
Payables Turnover = Purchases
Average Trade Payables
2015 2014
=2896889441
44500470 =
3072036921
2738540
=65.098 =1121.78
*The payables turnover ratio was well times in 2014.
Working Capital Turnover = Revenue
Average Working Capital
2015 2014
=5508640000
289116566 =
6329964274
1545379710
=4.096 =19.053
*Indicates the number of times the working capital is turned over. The rate of the
ration of 2014 is well.
Fixed Asset Turnover = Revenue
Average Net Fixed Asset
2015 2014
=5508640000
2013734249 =
6329964274
2311590599
=2.739 =2.735
*the ratio establishes between fixed asset and sales. The ideal rate for the ratio is 5.
So fixed asset turnover ability is not so high.

Page No- 11
Total Asset Turnover = Revenue
Average Total Asset
2015 2014
=5508640000
9476977741 =
6329964274
10753365565
=0.59 =0.58
*indicates the ability of a company to use its asset. So the ratio rate of the 2 years is
not so high.
Current Ratio = Current Asset
Current Liabilities
2015 2014
=7123130156
3538079861 =
6741661301
4218330929
=1.599:1 =2.013:1
*Ideal ratio is 2:1. So the current ratio of 2014 is greater than the year of 2015.
Quick Ratio = Cash Short-Term Marketable Investments Receivables
Current Liabilities
2015 2014
=1101566520
4218330929 =
1473926142
3538079861
=0.261 =0.417
*Ideal ratio is 1:1. So the quick ratio rate of two years is not so well.
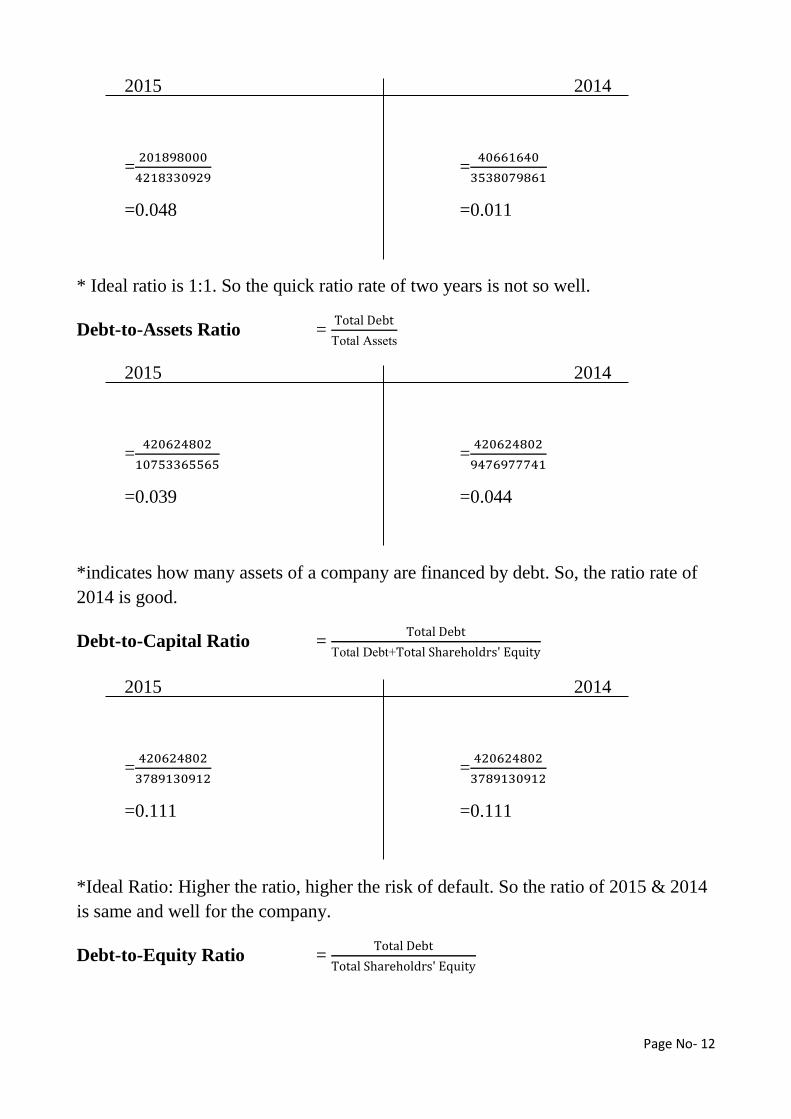
Cash Ratio = Cash Short-Term Marketable Investments
Current Liabilities
Page No- 12
2015 2014
=201898000
4218330929 =
40661640
3538079861
=0.048 =0.011
* Ideal ratio is 1:1. So the quick ratio rate of two years is not so well.
Debt-to-Assets Ratio = Total Debt
Total Assets
2015 2014
=420624802
10753365565 =
420624802
9476977741
=0.039 =0.044
*indicates how many assets of a company are financed by debt. So, the ratio rate of
2014 is good.
Debt-to-Capital Ratio = Total Debt
Total Debt+Total Shareholdrs' Equity
2015 2014
=420624802
3789130912 =
420624802
3789130912
=0.111 =0.111
*Ideal Ratio: Higher the ratio, higher the risk of default. So the ratio of 2015 & 2014
is same and well for the company.
Debt-to-Equity Ratio = Total Debt
Total Shareholdrs' Equity

Page No- 13
2015 2014
=420624802
3368506110 =
420624802
3368506110
=0.124 =0.124
*indicates the extent to which a company relies on external debt. The ratio rate of 2
years is same.
Financial Leverage Ratio = Total Asset
Total Equity
2015 2014
=10753365565
6038597111 =
9476977741
5919429484
=1.780 =1.600
*measure of financial leverage(capital structure) The ratio rate of 2 years is almost
average.
Gross Profit Margin = Gross Profit
Revenue
2015 2014
=1975308452
5508640000 =
2162410962
6329964274
=0.341 =0.358
*A profitability ratio. The ratio rate of 2 years is not so high. So it reflects fewer
efficiency in converting raw materials to income.
Operating Profit Margin = Operating Income
Revenue

Page No- 14
2015 2014
=1070931754
6329964274 =
997857436
5508640000
=0.169 =0.181
*Measures profitability without concern for taxes and interest. The ratio rate of two
years is average.
Net Profit Margin = Net Income
Revenue
2015 2014
=4541554406
6329964274 =
3964568745
5508640000
=0.717 =0.719
* Measures the percentage of each sales. The ratio rate of two years is average.
Operating ROA = Operating Income
Average Total Asset
2015 2014
=1070931754
10753365565 =
997857436
9476977741
=0.084 =0.111
*indicate the levels of operating profits relative to the firm’s total asset. The ration
rate of two years is almost same.
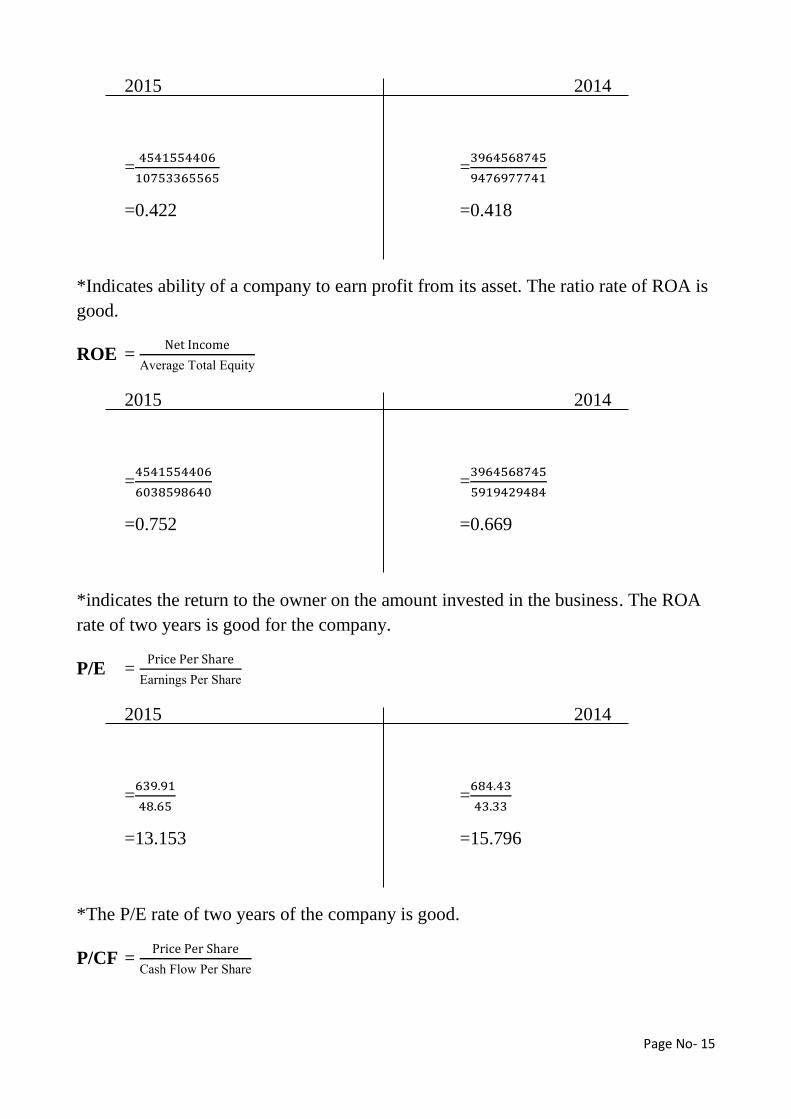
ROA = Net Income
Average Total Asset
Page No- 15
2015 2014
=4541554406
10753365565 =
3964568745
9476977741
=0.422 =0.418
*Indicates ability of a company to earn profit from its asset. The ratio rate of ROA is
good.
ROE = Net Income
Average Total Equity
2015 2014
=4541554406
6038598640 =
3964568745
5919429484
=0.752 =0.669
*indicates the return to the owner on the amount invested in the business. The ROA
rate of two years is good for the company.
P/E = Price Per Share
Earnings Per Share
2015 2014
=639.91
48.65 =
684.43
43.33
=13.153 =15.796
*The P/E rate of two years of the company is good.
P/CF = Price Per Share
Cash Flow Per Share

Page No- 16
2015 2014
=639.91
45.98 =
684.43
39.69
=13.917 =17.244
P/S = Price Per Share
Sales Per Share
2015 2014
=639.91
688.56 =
684.43
727.76
=0.929 =0.940
P/S = Price Per Share
Book Value Per Share
2015 2014
=639.91
124.06 =
694.43
130.66
=5.158 =5.314

Page No- 17
Ratio Analysis- Berger Paints Bangladesh Limited
Inventory Turnover Ratio = Cost of Goods Sold
Average Inventory
2015 2014
=14837714000
1513733000 =
13165473000
1660913000
=9.802 =7.92
* The inventory turnover ratio rate of 2015 is greater than 2014.
Receivable Turnover = Revenue
Average Receivables
2015 2014
=12267996000
939573000 =
10881046000
832711000
=13.056 =7.92
* Receivable turnover ratio of two years is almost average and well. The receivable
turnover ratio of 2015 has been improved before the year of 2014.

Page No- 18
Purchases
Average Trade Payables Payables Turnover =
2015 2014
=5811465000
1779661000 =
5942325000
1461545000
=3.265 =4.065
* The payables turnover ratio was well times in 2014.
Working Capital Turnover = Revenue
Average Working Capital
2015 2014
=12267996000
390590000 =
10881046000
171604000
=31.40 =63.40
* Indicates the number of times the working capital is turned over. The rate of the
ration of 2014 is well.
Fixed Asset Turnover = Revenue
Average Net Fixed Asset
2015 2014
=12267996000
1843340000 =
10881046000
1578664000
=6.655 =6.892
* the ratio establishes between fixed asset and sales. The ideal rate for the ratio is 5.
So fixed asset turnover ratio rate ability is well.
Total Asset Turnover = Revenue
Average Total Asset

Page No- 19
2015 2014
=12267996000
6683525000 =
10881046000
5632593000
=1.83 =1.93
* indicates the ability of a company to use its asset. So the ratio rate of the 2 years is
not so high.
Current Ratio = Current Asset
Current Liabilities
2015 2014
=3951586000
2132948000 =
3541219000
1851418000
=1.852:1 =1.912:1
* Ideal ratio is 2:1. So the current ratio of 2014 is greater than the year of 2015.
Quick Ratio = Cash Short-Term Marketable Investments Receivables
Current Liabilities
2015 2014
=330156000
2132948000 =
293875000
1851418000
=0.155:1 =0.159:1
* Ideal ratio is 1:1. So the quick ratio rate of two years is not so well.
Cash Ratio = Cash Short-Term Marketable Investments
Current Liabilities

Page No- 20
2015 2014
=800000000
2132948000 =
400000000
1851418000
=0.375:1 =0.216:1
* Ideal ratio is 1:1. So the quick ratio rate of two years is not so well.
Debt-to-Assets Ratio = Total Debt
Total Assets
2015 2014
=1426465000
1851418000 =
1747146000
2132948000
=0.819 =0.770
* indicates how many assets of a company are financed by debt. So, the ratio rate of
2015 is good.
Debt-to-Capital Ratio = Total Debt
Total Debt+Total Shareholdrs' Equity
2015 2014
=1426465000
1658354000 =
1747146000
1979035000
=0.882 =0.860
* Ideal Ratio: Higher the ratio, higher the risk of default. So the ratio of 2015 & 2014
is same and well for the company.
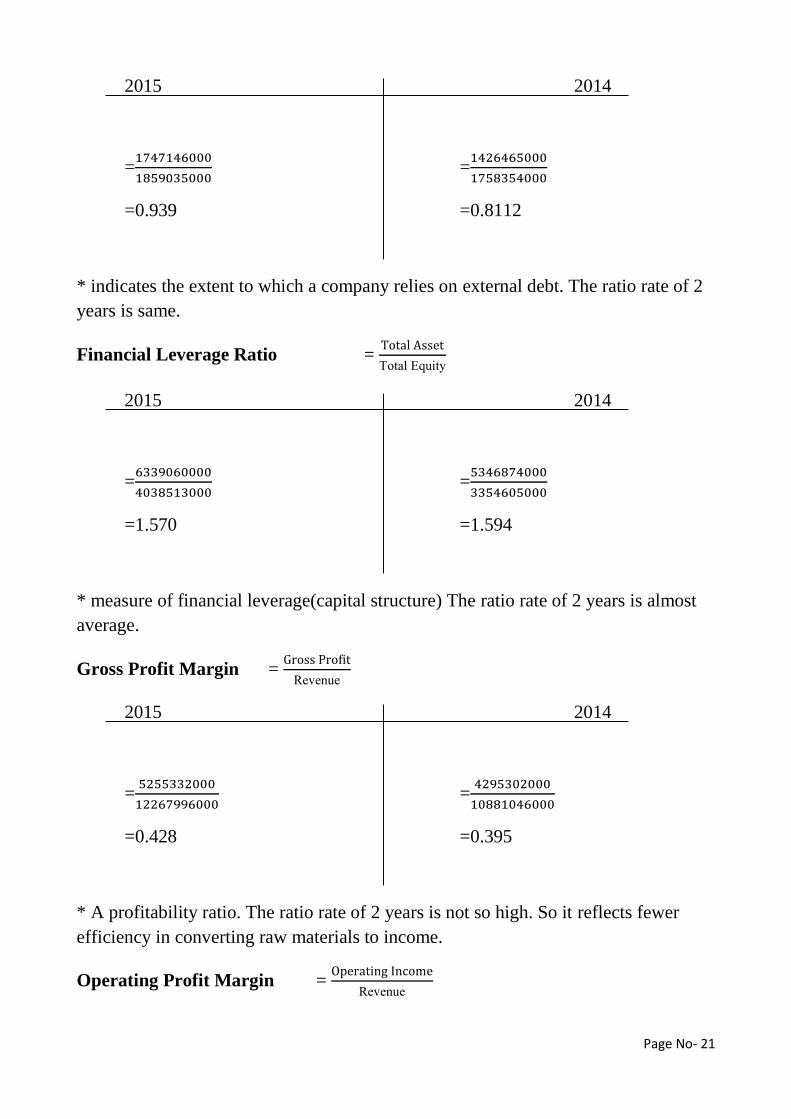
Debt-to-Equity Ratio = Total Debt
Total Shareholdrs' Equity
Page No- 21
2015 2014
=1426465000
1758354000 =
1747146000
1859035000
=0.939 =0.8112
* indicates the extent to which a company relies on external debt. The ratio rate of 2
years is same.
Financial Leverage Ratio = Total Asset
Total Equity
2015 2014
=5346874000
3354605000 =
6339060000
4038513000
=1.570 =1.594
* measure of financial leverage(capital structure) The ratio rate of 2 years is almost
average.
Gross Profit Margin = Gross Profit
Revenue
2015 2014
=5255332000
12267996000 =
4295302000
10881046000
=0.428 =0.395
* A profitability ratio. The ratio rate of 2 years is not so high. So it reflects fewer
efficiency in converting raw materials to income.
Operating Profit Margin = Operating Income
Revenue

Page No- 22
2015 2014
=1520953000
10881046000 =
1996401000
12267996000
=0.162 =0.140
* Measures profitability without concern for taxes and interest. The ratio rate of two
years is average.
Net Profit Margin = Net Income
Revenue
2015 2014
=1425955000
12267996000 =
1097609000
10881046000
=0.116 =0.100
* Measures the percentage of each sales. The ratio rate of two years is average.
Operating ROA = Operating Income
Average Total Asset
2015 2014
=4295302000
5346874000 =
1996401000
6339060000
=0.314 =0.284
* indicate the levels of operating profits relative to the firm’s total asset. The ration
rate of two years is almost same.
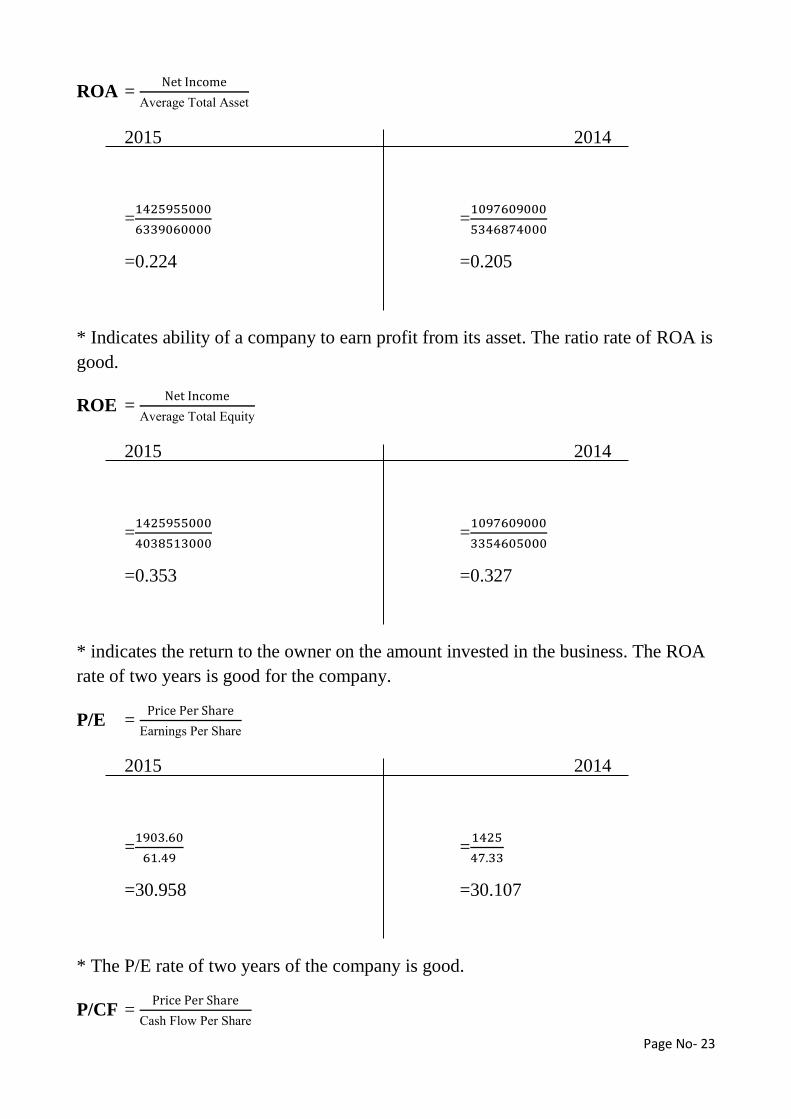
Page No- 23
ROA = Net Income
Average Total Asset
2015 2014
=1425955000
6339060000 =
1097609000
5346874000
=0.224 =0.205
* Indicates ability of a company to earn profit from its asset. The ratio rate of ROA is
good.
ROE = Net Income
Average Total Equity
2015 2014
=1425955000
4038513000 =
1097609000
3354605000
=0.353 =0.327
* indicates the return to the owner on the amount invested in the business. The ROA
rate of two years is good for the company.
P/E = Price Per Share
Earnings Per Share
2015 2014
=1425
47.33 =
1903.60
61.49
=30.958 =30.107
* The P/E rate of two years of the company is good.
P/CF = Price Per Share
Cash Flow Per Share

Page No- 24
2015 2014
=1425
49.69 =
1903.60
91.98
=20.670 =28.678
P/S = Price Per Share
Sales Per Share
2015 2014
=1425
1472.33 =
1903.60
1934.558
=0.983 =0.968
P/S = Price Per Share
Book Value Per Share
2015 2014
=1425
144.66 =
1903.60
174.16
=10.930 =9.850
Page No- 25
Recommendation
The next step is to find out how to turn them into batter Financial Position. In our
opinion we are recommending these:-
RAK Ceramics:
(1) Inventory turnover & receivable turnover ability should be improved further.
(2) Fixed asset turnover should be developed.
(3) Should try to increase current asset & cash.
(4) Should try to increase revenue as much as possible further.
Berger Paints:
(1) Total asset turnover & receivable turnover ability should be improved further.
(2) Fixed asset turnover should be developed.
(3) Should try to increase current asset, cash & cash investments receivables.
(4) Should try to increase revenue & operating income as much as possible further.
Page No- 26
Conclusion We have already solved the report on the financial analysis regarding analysis and total
description in the two company. As we are in ongoing process to be a business graduate
we will have to face some difficulties regarding this report in our professional life. So
we must have to know the knowledge of management in business to regard running a
business and also many aspects of business. This report will help us to meet up the
problems that we may face in future.

Page No- 27
References
(1) http://rakcerambd.com/
(2) http://rakcerambd.com/investor-annual-reports.php
(3) http://www.bergerbd.com/
(4)http://www.bergerbd.com/corporate_info/reports/Annual
_and_Quarterly_Reports
(5) https://www.wikipedia.org/
(6)http://www.investopedia.com/university/peratio/peratio1
.asp