Assets Management and Performance of Selected Quoted Firms ...
12
American International Journal of Business Management (AIJBM) ISSN- 2379-106X, www.aijbm.com Volume 2, Issue 11 (November 2019), PP 65-76 *Corresponding Author: Ayodele, Johnson Eyitope www.aijbm.com 65 | Page Assets Management and Performance of Selected Quoted Firms in Nigeria Olaoye, Clement Olatunji 1 , Ayodele, Johnson Eyitope 2 *Corresponding Author: Ayodele, Johnson Eyitope ABSTRACT:- The study examined asset management and performance of selected quoted firms in Nigeria. Specifically, the study analyzed effect of current asset on the profit after tax, effect of non-current asset on the profit after tax, and effect of debt-equity ratio on the profit after tax of ten (10) quoted firms in Nigeria for ten years spanning from 2007 to 2016. Panel data were collected across the selected quoted firms over the time period covered in the study. Data for the study were sourced from the annual reports of the sampled firms. Data were analyzed using panel techniques of estimation including Pooled OLS, fixed effect and random effect estimation, alongside post estimation test such as restricted F-test, Hausman test, Wald test of heterogeneity, Wooldridge autocorrelation test and Pesaran test of cross-sectional dependence. Results revealed that current assets exert insignificant positive impact on profit after tax to the tune of .0404019 (p=0.250 > 0.05), non- current assets exert significant positive impact on profit after tax, with coefficient estimate of .0685197 (p=0.000 < 0.05), Debt-equity ratio on the other hand exerts insignificant negative impact on profit after tax, with reported coefficient estimate of -719.1976(p=0.307 > 0.05). The study found out that assets management contributed meaningfully towards improved performance of quoted firms in Nigeria, especially when measured in terms of profit after tax, on the other hand, the study established that increase in the leverage ratio of quoted firms in Nigeria has the capacity to affect improved performance especially when measured in terms of profit after taxQuoted firms in Nigeria should ensure to maintain a non-current asset positive that is substantial for sustaining their performance and help to attain market stability that can culminate into higher market share, expansion and growth. firms should look into management of leverage ratio, so as to reduce the likelihood of reduce performance due to rising debt-equity ratio and also designed an internal monitoring system that could help to maintain a balance between current assets and non-current assets in order to guide against loss of operational efficiency that can ensue when the importance of non-current assets were overemphasized at the expense of current assets. Keywords:- Assets Management. Current Assets, Non-current Assets, Leverage Ratio, Performance, Profit After Tax, Quoted Firms I. INTRODUCTION Universally, the ultimate aim of every profit-making organization, irrespective of size, type or nature of business, is profit maximization. Shareholders are always profit-driven hence, the primary objective of every manager is to ensure that resources are judiciously managed with a singular aim of profit maximation. Profitability evaluates the efficiency with which plant, equipment; and current assets are transformed into profit. The composition of a firm’s assets and decisions made concerning them are major determinants of profitability for any business (Egbide, 2009). Basically, profitability of manufacturing firms could be measured using Return on Assets (ROA) which centered on the ability to generate income through the utilization of a firm’s assets, Return on Equity (ROE) that revolves how much profit is earned relatively to shareholders’ equity, Earning per Share (EPS) represents the portion of a company's earnings, net of taxes and preferred stock dividends, that is allocated to each share of common stock, and Profit After Tax (PAT) which means the amount earned by a firm after all taxation related expenses have been deducted (Gul, Faiza & Khalid, 2011; Falope & Ajilore, 2009). In Nigeria, it appeared that the unfriendly operating environment, in which many manufacturing firms have found themselves, is really hindering their profit-making efforts; inclusive is the unprofessional acts of managers to enrich their pockets at the expense of the shareholders wealth. As noted by Ojo (2017), many firms in Nigeria are not performing as expected thus, they subscribe to creative accounting that present figures and all necessary facts in a misleading favourable light. It appeared that all these shortcomings that engulfed firms in the manufacturing sector stem from poor assets management by the management team whose personal aims somewhat override the goal congruence. The importance of assets management in an organization cannot be underplayed. This underpins that management of assets management is central to the survival and growth of any organization. Assets management is as inevitable in business as blood is in human body (Umara, Sabeen & Qaisar, 2009). The need for proper management of a firm’s assets is imperative just as circulation of blood is very necessary in the human body to maintain life, the flow of funds is very necessary to maintain business. If it
Transcript of Assets Management and Performance of Selected Quoted Firms ...

American International Journal of Business Management (AIJBM)
ISSN- 2379-106X, www.aijbm.com Volume 2, Issue 11 (November 2019), PP 65-76
*Corresponding Author: Ayodele, Johnson Eyitope www.aijbm.com 65 | Page
Assets Management and Performance of Selected Quoted
Firms in Nigeria
Olaoye, Clement Olatunji1, Ayodele, Johnson Eyitope
2
*Corresponding Author: Ayodele, Johnson Eyitope
ABSTRACT:- The study examined asset management and performance of selected quoted firms in Nigeria.
Specifically, the study analyzed effect of current asset on the profit after tax, effect of non-current asset on the
profit after tax, and effect of debt-equity ratio on the profit after tax of ten (10) quoted firms in Nigeria for ten
years spanning from 2007 to 2016. Panel data were collected across the selected quoted firms over the time
period covered in the study. Data for the study were sourced from the annual reports of the sampled firms. Data
were analyzed using panel techniques of estimation including Pooled OLS, fixed effect and random effect
estimation, alongside post estimation test such as restricted F-test, Hausman test, Wald test of heterogeneity, Wooldridge autocorrelation test and Pesaran test of cross-sectional dependence. Results revealed that current
assets exert insignificant positive impact on profit after tax to the tune of .0404019 (p=0.250 > 0.05), non-
current assets exert significant positive impact on profit after tax, with coefficient estimate of .0685197
(p=0.000 < 0.05), Debt-equity ratio on the other hand exerts insignificant negative impact on profit after tax,
with reported coefficient estimate of -719.1976(p=0.307 > 0.05). The study found out that assets management
contributed meaningfully towards improved performance of quoted firms in Nigeria, especially when measured
in terms of profit after tax, on the other hand, the study established that increase in the leverage ratio of quoted
firms in Nigeria has the capacity to affect improved performance especially when measured in terms of profit
after taxQuoted firms in Nigeria should ensure to maintain a non-current asset positive that is substantial for
sustaining their performance and help to attain market stability that can culminate into higher market share,
expansion and growth. firms should look into management of leverage ratio, so as to reduce the likelihood of reduce performance due to rising debt-equity ratio and also designed an internal monitoring system that could
help to maintain a balance between current assets and non-current assets in order to guide against loss of
operational efficiency that can ensue when the importance of non-current assets were overemphasized at the
expense of current assets.
Keywords:- Assets Management. Current Assets, Non-current Assets, Leverage Ratio, Performance,
Profit After Tax, Quoted Firms
I. INTRODUCTION Universally, the ultimate aim of every profit-making organization, irrespective of size, type or nature of business, is profit maximization. Shareholders are always profit-driven hence, the primary objective of every
manager is to ensure that resources are judiciously managed with a singular aim of profit maximation.
Profitability evaluates the efficiency with which plant, equipment; and current assets are transformed into profit.
The composition of a firm’s assets and decisions made concerning them are major determinants of profitability
for any business (Egbide, 2009). Basically, profitability of manufacturing firms could be measured using
Return on Assets (ROA) which centered on the ability to generate income through the utilization of a firm’s
assets, Return on Equity (ROE) that revolves how much profit is earned relatively to shareholders’ equity,
Earning per Share (EPS) represents the portion of a company's earnings, net of taxes and preferred stock
dividends, that is allocated to each share of common stock, and Profit After Tax (PAT) which means the amount
earned by a firm after all taxation related expenses have been deducted (Gul, Faiza & Khalid, 2011; Falope &
Ajilore, 2009). In Nigeria, it appeared that the unfriendly operating environment, in which many manufacturing firms
have found themselves, is really hindering their profit-making efforts; inclusive is the unprofessional acts of
managers to enrich their pockets at the expense of the shareholders wealth. As noted by Ojo (2017), many firms
in Nigeria are not performing as expected thus, they subscribe to creative accounting that present figures and all
necessary facts in a misleading favourable light. It appeared that all these shortcomings that engulfed firms in
the manufacturing sector stem from poor assets management by the management team whose personal aims
somewhat override the goal congruence. The importance of assets management in an organization cannot be
underplayed. This underpins that management of assets management is central to the survival and growth of any
organization. Assets management is as inevitable in business as blood is in human body (Umara, Sabeen &
Qaisar, 2009). The need for proper management of a firm’s assets is imperative just as circulation of blood is
very necessary in the human body to maintain life, the flow of funds is very necessary to maintain business. If it

Assets Management and Performance of Selected Quoted Firms in Nigeria
*Corresponding Author: Ayodele, Johnson Eyitope www.aijbm.com 66 | Page
becomes weak, the business can hardly prosper or survive (ALShubiri, 2011). This informed that assets
management is what makes a business to run effectively and efficiently.
Asset management refers to systematic approach to the governance and realization of value from the things that a group or entity is responsible for, over their whole life cycles. It may apply both to non-current
assets and current assets (Vanier, 2001). Put differently, asset management is a systematic process of
developing, operating, maintaining, upgrading, and disposing of assets in the most cost-effective manner
(including all costs, risks and performance attributes (Ani, Okwo &, Ugwunta, 2012). Going by these
descriptions, assets management is indispensable to the growth and profitability of firms, especially those in the
manufacturing sectors. The going concern ability of an organization is greatly anchored on the continued
solvency of that organization (Enyi, 2011); and to be solvent, assets management must be accorded a great
importance at all levels, at all time. Basically, assets are divided into two namely non-current assets and current
assets. By description, non-current assets are tangible assets used by firms to create more wealth and they are
not limited to plant, machineries, land, and motor vehicles. The management of these short terms assets falls in
the area of current asset management (CAM). Current assets could represent a significant component of firm’s total assets. For a number of organizations, current assets management can make or mar the organization’s
financial performance.
The complexity of assets management is to accomplish the dual objectives of profit maximization
which is the primary objective of every shareholders and optimal liquidity necessary for the running of
operational activities. Thus, to resolve such dilemma and ensure profit maximation is attained at not the expense
of optimal liquidity, there should be concession between the two goals of companies. Single goal will never be
achieved at the expense of other as both goals have their individual significance to companies. If companies are
not concerned regarding profitability, they could not last for a longer time. On the other hand, if companies do
not worry about liquidity and spend much on both non-current and current assets, they might face the problem
of bankruptcy or insolvency. Hence, assets management is a key to profit maximization of firms, especially in
the manufacturing firm.
Despite the importance attached to the efficacy of assets management to the performance of organizations, there are only few studies on the effect of assets management on profitability of quoted firms in
Nigeria. Much of the studies have been restricted to working capital management in relation to profitability of
companies. Therefore, did assets management has nothing to do with the profitability of listed firm in Nigeria?
The available studies have reported disaggregated findings resulting to either positive or negative effect on
profitability. Studies like Mutungi (2010), Onodje (2014), Waithaka (2012), Yahaya, Kutigi, Solanke and
Usman (2015) reported a positive relationship between assets management and the profitability of firms while
studies like Samilogu and Demirgunes (2008), Osundina (2014) and Mohammad and Noriza (2010) reported a
negative relationship.
Similarly, existing studies were reduced to the usage of descriptive statistics, linear regression and
correlation to determine the nexus between assets management and firms’ profitability. To close all these gaps
and push forward the frontier of knowledge on how the profitability of firms could be enhanced through assets management, this study was developed to examine asset management and profitability of quoted firms in
Nigeria with a special focus on current assets and non- current assets and financial leverage as the predictor
variables and Profit after Tax (PAT) as the outcome variable.
II. CONCEPTUAL ISSUES 2.1.1 Concepts of Assets
Assets are resources controlled by an entity as a result of past events and from which future economic
benefits or service potential are expected to flow to the entity. Asset also refers to an items or properties owned
by persons or company, which having value and available to meet debts and commitments. Assets are useful or valuable resources owned by a firm, these are normally split into current assets and non-current (Long term)
assets. According Sullivan and Sheffrin (2003), anything tangible or intangible that can be owned or controlled
to produce value and that is held by a company to produce positive economic value is an asset. Simply stated,
assets represent value of ownership that can be converted into cash (although cash itself is also considered an
asset. The balance sheet of a firm records the monetary value of the assets owned by that firm. It covers money
and other valuables belonging to an individual or to a business. Basically, we have two types of assets namely
current assets and non-current assets.
Current asset was described as the life blood of every firm, the primary task of every manager is to
keep current assets flowing and use the cash flows to generate profits (Flanagan, 2005). Current asset
management is the handling of the current assets of a firm. Any asset that a firm has that is the equivalent of
cash or can be liquidated into cash in the period of a year is considered a current asset. Typically, current assets
are the inventory a company has, as well as the accounts receivables and any current investments it has in place.

Assets Management and Performance of Selected Quoted Firms in Nigeria
*Corresponding Author: Ayodele, Johnson Eyitope www.aijbm.com 67 | Page
Non-current assets, also known as tangible assets or property, plant and equipment is a term used in accounting
for assets and property that cannot easily be converted into cash. Similarly, Ojo (2017) define non-current assets
as those assets whose future economic benefit is probable to flow into the entity, whose cost can be measured reliably. Non-current assets are of two types: freehold assets – assets which are purchased with legal right of
ownership and used, and leasehold assets – assets used by owner without legal right for a particular period of
time (Ojo, 2017). Moreover, non-current asset can also be defined as an asset not directly sold to a firm's
consumers/end-users. As an example, its non-current assets would be the oven used to bake bread, motor
vehicles used to transport deliveries, cash registers used to handle cash payments, etc.
2.1.2 Asset Management
Asset management refers to systematic approach to the governance and realization of value from the
things that a group or entity is responsible for, over their whole life cycles. It may apply both to non-current
assets and current assets (Vanier, 2001). Put differently, asset management is a systematic process of
developing, operating, maintaining, upgrading, and disposing of assets in the most cost-effective manner (including all costs, risks and performance attributes (Okwo, Ugwunta & Nwese, 2012). Going by these
descriptions, it therefore enlightens that assets management is indispensable to the growth and profitability of
firms, especially those in the manufacturing sectors. Asset management refers to applying performance
management principles to the management of physical assets in firms and provides a strategic approach for the
preservation, rehabilitation and maintenance of these assets (Mutungi, 2010).
Asset management is one of the most advanced examples of the application of performance
management principles in firms. The analytic tools, data, and experience in applying performance management
principles are more advanced in asset management than in many other aspects of firms. Because most of the
firms’ facilities have long service lives, asset management must have a long-term focus. Many asset
management programs focus primarily on performance measures that reflect the key metrics related to the
physical health of the facilities. However, there are other physical assets that support a range of performance
goals that need to be incorporated into a comprehensive asset management program. These other performance goals include safety, operations as well as other support facilities and equipment. It must be noted that the core
principles of performance management apply to all aspects of firm performance.
2.1.3 Financial Leverage
Financial leverage is a measure of how much firms use equity and debt to finance its assets. A
company can finance its investments by debt and equity. According to Brigham and Houston (2009), financial
leverage is the number of securities that use profits or returns as company's capital structure. Financial leverage
reflects amount of debt used as company's capital structure (Guney, Ozkan & Ozkan, 2007). Relationship
between leverage and cash holding can be positive or negative relationship. If a financial leverage is a cash
substitution that is used to invest then relationship between financial leverage and cash holding is negative.
However, along with large amount of leverage, company will accumulate large sums of cash to reduce risk of financial difficulties and bankruptcy thus relationship between leverage and cash holding can be positive. Based
on the carried out by research of Wenyao (2007), managers who want to improve shareholder's welfare, must
design cash holding of company appropriately. If high financial leverage is considered as a potential bankruptcy
due to high agency problem, impact of financial leverage to cash holding is positive. Debt ratio, equity ratio and
debt to equity ratio are used to measure leverage performance.
2.1.4 Profitability/Performance Firm
Firm profitability is the ability of a firm to generate revenue in excess of cost, in relation to the firm’s
capital base. A sound and profitable sector is better able to withstand negative shocks and contribute to the
stability of the financial system. Ongore and Kusa (2013) defined profitability a relationship between the profits
generated by the enterprise and investments that contributed to the achievement of these profits, and profitability
ratios measure the efficiency with which a company turns business activity into profits. Profit margins assess the ability to turn revenue into profits. Return on assets measures the ability to use assets to produce net income.
Return on equity compares the net income to shareholder equity. This is the most common measure of firm’s
performance. It examines how successful a firm utilizes its operating resources to earn income. It also provides
reasonable clue to the effectiveness of firm’s operation. Profit after Tax (PAT). This is the net profit earned by
the company after deducting all expenses like interest, depreciation and tax. PAT can be fully retained by a
company to be used in the business. Dividends, if declared, are paid to the shareholders from this residue (Gul,
Faiza & Khalid, 2011; Falope & Ajilore, 2009).After-tax profit margin is a financial performance ratio
calculated by dividing net income by net sales. A company's after-tax profit margin is significant because it
shows how well a company controls its costs.

Assets Management and Performance of Selected Quoted Firms in Nigeria
*Corresponding Author: Ayodele, Johnson Eyitope www.aijbm.com 68 | Page
2.2 Theoretical Literature
Agency and pecking order theories were used to explain existing relationships between assets
management and the profitability of firms
2.2.1 Agency Theory
Jensen and Meckling (1976) asserts that a firm can be seen as a nexus of a set of contracting
relationships among individuals by means of which shareholders (principal) delegate every day decisions about
the firm to managers (agent) who should use their specific knowledge and the firm’s resources to maximize
principal agent’s return. However, the interest and decisions of mangers do not always align to the shareholders
interest, resulting in agency costs or problem. Jensen and Meckling (1976) defined agency cost as the sum of the
expenses in monitoring by the principal, the bonding expenditures by the agent and the inevitable residual loss
derived from the separation of ownership and control. The cause of agency problems is the separation of
ownership and control.
This theory is relevant to this study such that assets management are done by the managers saddled with the responsibility of ensuring that shareholders’ fund is judiciously utilized to yield the desired returns.
Shareholders must therefore encourage management to utilize internal funds to their benefit. It was suggested
that when managers have a substantial part of their human capital allocated in company’s share, they tend to
take decisions to enhance the profitability of company’s survival. These decisions can be reflected in a
conservative management of assets, reducing the risk involved in the business operation, such as: to keep high
level of inventories beyond the process cycle needs, to offer credit terms above the product turnover, to accept
low payment terms not aligned to the market practices, and so on. These investment decisions would be
translated in excess of working capital. The theory has been coitized to be one-sided because it only centered
fund could be sourced to ensure proper management of assets and improved the profit level of the company.
2.2.2 The Pecking Order Theory
Developed by Myers and Majluf, (1984) The pecking order theory takes into consideration the information asymmetry which indicates that managers know more about the firm’s value than potential
investors (Myers & Majluf, 1984). It was pointed out that the order is based on the consideration that resources
generated internally do not have transaction costs and the fact that issuing new bonds tend to send positive
information about the company while issues of new stock signal negative information about the issuing
company. This explains why more profitable companies usually prefer to hold less debts and why the less
profitable companies issue bonds to finance investment decisions in fact, the less profitable companies also
prefer issuing debts before the decision to issue new stocks (Myers & Majluf, 1984).
The theory posited that not only managers of less profitable companies but also managers of more profitable
companies would choose a more aggressive working capital policy, pressuring for lower level of current assets
and higher level of financing through suppliers, in order to source internally the needed funds to finance their
companies and to avoid issuing debts and equity.
2.3 Empirical Review Universally, literature is replete of studies devoted to the relationship between assets management and
profitability of firms. In the developed countries, Samiloglu and Demirgunes (2008), Carried out studied on the
impact analysis of current asset management on profitability of firms with reference to Turkey. The quarterly
data was collected for a sample of firms listed at Istanbul Stock Exchange for the period 1998 to 2007.
Correlation and regression analysis were used for the analysis. The results suggested that receivable and
inventory period with liquidity has a negative impact on the profitability of the firm while growth was positively
associated with profitability. However, CCC, size and financial assets did not have significant effect on the
profitability of the firms.
Niresh (2012) investigates the relationship between working capital management and financial
performances of listed firms in Sri Lanka. A sample of 30 firms listed on the Colombo Stock Exchange was used for this study. Data were collected from annual reports of sampled firms for the period of 2008 to 2011.
Performance was measured in terms of return on assets and return on equity while cash conversion cycle,
current assets to total assets and current liabilities to total assets were used as measures of working capital
management. Correlation and regression analysis were used for the analysis. The findings reveal that, there is no
significant relationship between cash conversion cycle and performance measures. The study also concludes that
firms in Sri Lanka follow conservative working capital management policy
Kotšina and Hazak (2012) examines the impact of investment intensity measured by the percentage of
fixed assets to total assets and the return on assets. The sample of the study is 8,074 companies in six European
Union (EU) member states over a nine-year period from 2001 to 2009. The analysis carried via regression
indicates that there is no any strong negative (or positive) impact of companies’ investment intensity on future

Assets Management and Performance of Selected Quoted Firms in Nigeria
*Corresponding Author: Ayodele, Johnson Eyitope www.aijbm.com 69 | Page
rate of return on assets. Similarly, Reyhani (2012) measures the effect of assets structure on the performance of
accepted companies of Tehran Stock Exchange (TSE) through some industries using Panel Data approach. He
defined the assets structure by fixed assets and variable assets as independent variables and EBIT (Earnings before Interest and Taxes) as a dependent variable. The findings of the study revealed that the fixed assets have
a significant positive effect on EBIT. Also, the effect of these variables on EBIT among various industries is not
same.
In the developing countries, Ghosh and Maji (2003) examined current asset management efficiency in
Indian Cement Industry for the period 1992-93 to 2001-2002 for measuring the efficiency of current asset
management, the performance, utilization, and overall efficiency indices were calculated instead of using some
common current asset management ratios. Setting industry norms as target-efficiency levels of the individual
firms, they also tested the speed of achieving that target level of efficiency by an individual firm during the
period of study. Findings of the study indicated that the Indian Cement Industry as a whole did not perform
remarkably well during this period.
Lazaridis and Tryfonidis (2006) investigated the relationship between corporate profitability and current asset management for 131 firms listed in Athens Stock Exchange during period 2001 to 2004.
Correlation analysis was used. They reported that there was statistically significant negative relationship
between profitability measured through gross operating profit and the Cash Conversion Cycle. Furthermore,
managers can create profit by properly handling the individual components of current asset which include
accounts receivable, inventory and accounts payable to an optimal level.
Chowdhary and Amin (2007) investigated the impact of overall current asset policies on the
profitability of Pharmaceutical firms listed at Dhaka Stock Exchange. Primary and secondary data were used for
the period 2000 to 2004 to analyze the current asset management policies. The results indicated that for the
overall performance of the Pharmaceutical industry, current asset management played a vital role and there
existed a positive relationship between current assets management and performance of firms. On the other side,
the questionnaire data used for the study highlighted that firms in this industry have been efficient in managing
their cash, accounts receivables and accounts payable. Furthermore, the industry maintained large volume of inventories but maintaining large inventories did not reflect inefficient management for this industry.
Falope and Ajilore (2009) examines impact of current asset management on firm profitability, used
data for 50 Nigerian non-financial listed firms on Nigerian Stock Exchange during period 1996 to 2005. They
used combined time series and cross-sectional observations in a pooled regression to estimate the relationship
between current asset measures and firm’s profitability. They found significant negative relationship between
profitability and current asset measures such as average collection period, inventory turnover in days, average
payment period and cash conversion cycle. They also compared the impact between large and small firms but
did not find significant variations among these firms.
Waithaka (2012) carried out research on effect of ASSET on performance of agricultural companies
listed in the Nigeria stock of exchange using a correlation analysis she established that there was a positive
relationship between ASSET and profitability of an agricultural firm, however the research was on agricultural firms listed in the NSE.
Ishmael and Kehinde (2013) examine the effects of components of current assets on the profitability in
the Ajaokuta Iron Industry. The study concluded that there are different proportions of current assets in the
industry (for example there are a huge amount of current assets in receivables, cash, and bank). The results
raveled that the profitability analysis of Ajaokuta Iron Industry has shown an upward trend in the period 2001-
2010.
Enekwe, Agu and Eziedo (2014) examined The Effect of Financial Leverage on Financial
Performance: Evidence of Quoted Pharmaceutical Companies in Nigeria. The ex-post facto research design was
used for this study. The secondary data were obtained from the financial statement (Comprehensive income
statement and Statement of financial position) of the selected pharmaceutical companies quoted on the Nigerian
Stock Exchange (NSE). Descriptive statistics, Pearson correlation and regressions were employed and used for
this study. The results of the analysis showed that debt ratio (DR) and debt-equity ratio (DER) have negative relationship with Return on Assets (ROA) while interest coverage ratio (ICR) has a positive relationship with
Return on Assets (ROA) in Nigeria pharmaceutical industry.
2.4 Gap in the Literature While a lot of studies were carried out in other part of the world, only few studies have been carried out
in Nigeria. surprisingly, the few studies carried out in Nigeria were particular only on current assets and
liquidity ratio thereby leaving out fixed asset as if has no effect on the performance of firms. In the same vein,
available studies in Nigeria were limited to 2014 and the findings reported were disaggregated. These gaps in
literature paved way for this present study to push forward the frontier of knowledge on the relationship between
assets management and profitability of firms in Nigeria.

Assets Management and Performance of Selected Quoted Firms in Nigeria
*Corresponding Author: Ayodele, Johnson Eyitope www.aijbm.com 70 | Page
III. METHODOLOGY The study specifically focused on asset management and performance of selected quoted firms in
Nigeria. To this end, the research concentrated on ten (10) selected quoted firms operating within Nigeria, the
firms which are: Nestle Plc, PZ Cusson, Unilever, Nigerian Breweries, 7UP, Vitafoam, Guinness, Flour Mill,
Dangote, and Nascon. It was covered the period of ten (10) years (that is, 2007-2016). The adapted model for
this study was stated according to Onipe and umar (2015) which expressed return on total assets as functions of
the cash and bank balance, Financial Asset held for trading and Derivate asset, Loans and advances to
customers. This was given below:
ROTA = f (CBB, FAHT, DAS, LAC) ..........................................................................(3.1)
ROTAit= 𝑎0 + 𝑏1𝐶𝐵𝐵𝑖𝑡 + 𝑏2𝐹𝐴𝐻𝑇𝑖𝑡 + 𝑏3𝐷𝐴𝑆𝑖𝑡 + 𝑏4𝐿𝐴𝐶𝑖𝑡+𝜇𝑖𝑡……. ….. (3.2)
Symbol Description Variable
β0 Constant -
β1-5 Slope of
independent
variables
-
ε Random error -
ROTA Return on total Continuous
variable
CBB Cash and bank balance Continuous
variable
FAHT Financial Asset held for
trading
Continuous
variable
DAS Derivate asset Continuous
variable
LAC Loans and advances to
customers
Continuous
variable
However, the above model would be modified as stated for this study as follows:
PAT𝑖𝑡 = 𝑓(CAS𝑖𝑡 , NCAS𝑖𝑡 , DER𝑖𝑡)…………………………………...….(3.3)
In an explicit form, this model (3.3) would be written in (3.4) as:
𝑃𝐴𝑇𝑖𝑡 = 𝑎0 + 𝛽1𝐶𝐴𝑆𝑖𝑡 + 𝛽2𝑁𝐶𝐴𝑆𝑖𝑡 + 𝛽3𝐷𝐸𝑅𝑖𝑡 + 𝜇𝑖𝑡…………………….. (3.4)
Where:
PAT = financial performance of the selected firms was measured by profit after tax CAS =Current asset of the selected firms
NCAS = Non-Current asset of the selected firms
DER = Leverage of the selected firms which would be measured by Debt equity ratio
µ = Error Term
The expected effect of each of the explanatory variables presented in mathematical notation below:
dPAT dCA> 0 : connotes that current assets was expected to exert positive effect on profit after tax of quoted firms in
Nigeria
dPAT dNCA> 0 : connotes that non-current assets was expected to exert positive effect on profit after tax of quoted firms
in Nigeria
dPAT dDER< 0 : connotes that leverage ratio was expected to exert negative effect on profit after tax of quoted firms in
Nigeria
The estimation technique adopted in this study includes panel data analysis technique which consists of pooled
effect panel, fixed effect panel and random effect panel. The diagnostic tests that was carried out are: test for
coefficient of determination, T-test, probability value test, F-test.
Pooled Effects Model
The general form of panel data model that permits the intercept and slope coefficients to vary over both
individual and time will be as follow:
Y𝑖𝑡 = 𝐷𝑖𝑡 + X𝑖𝑡′ 𝑏𝑖𝑡 + U𝑖𝑡 i = 1,… . . , M, t = 1,… . , T ………. (3.4)
Where Y𝑖𝑡 is a scalar dependent variable, X𝑖𝑡 is a kx1 vector of independent variable, U𝑖𝑡 is a scalar disturbance
term, I indexes individual is the cross sections and t indexes is time.
Assets Management and Performance of Selected Quoted Firms in Nigeria
*Corresponding Author: Ayodele, Johnson Eyitope www.aijbm.com 71 | Page
Fixed Effects Model The fixed effects model will be specified as:
Y𝑖𝑡= 𝐷𝑖 + 𝑏′X𝑖𝑗𝑘 + U𝑖𝑡 i = 1,… . . , M, j = 1… . , N, t = 1,… . , T….. (3.5)
Where the individual specific effects 𝐷1, 𝐷2…… 𝐷𝑀 measure unobserved heterogeneity that is possibly
correlated with the regressors, X𝑖𝑡 and 𝛼 are k x1 vectors and to start with the errors U𝑖𝑡 are iid (0, σ2)
Random Effects Model
This unlike the fixed effects model, the variation across entities is assumed to be random and uncorrelated
(independence) with the predictor or independent variables included in the model. In the fixed effects model these variables are absorbed by the intercept. The random effects model is given as:
Y𝑖𝑡 = 𝐷 + 𝑏𝑖X𝑖𝑡 + U𝑖𝑡 + V𝑖𝑡 ……………………… (3.6)
Y𝑖𝑡 = the dependent variable which is PAT; X𝑖𝑡 = this represents the explanatory variables which are
CAS, NCAS, DER; 𝑏𝑖 = the coefficient of the explanatory variables, 𝐷 = the unknown intercept for each n specific
entity, U𝑖𝑡 = this represents between-entity error and that V𝑖𝑡 = this represents the within-entity error
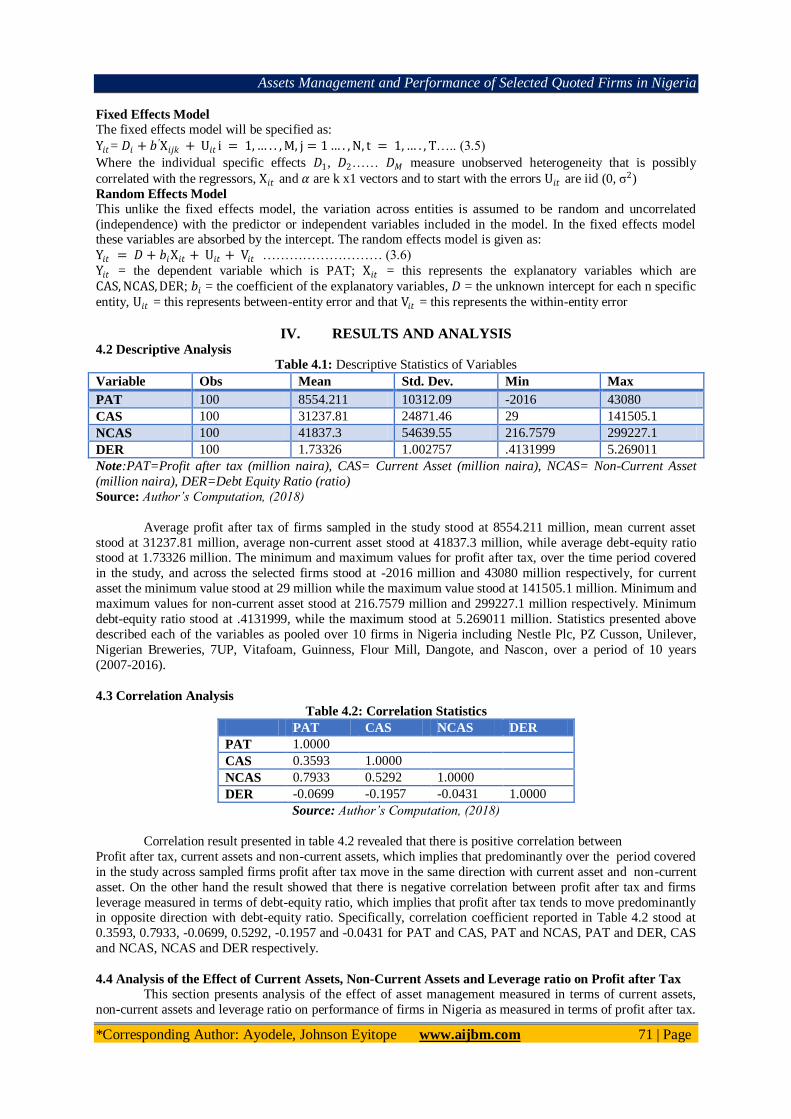
IV. RESULTS AND ANALYSIS 4.2 Descriptive Analysis
Table 4.1: Descriptive Statistics of Variables
Variable Obs Mean Std. Dev. Min Max
PAT 100 8554.211 10312.09 -2016 43080
CAS 100 31237.81 24871.46 29 141505.1
NCAS 100 41837.3 54639.55 216.7579 299227.1
DER 100 1.73326 1.002757 .4131999 5.269011
Note:PAT=Profit after tax (million naira), CAS= Current Asset (million naira), NCAS= Non-Current Asset
(million naira), DER=Debt Equity Ratio (ratio)
Source: Author’s Computation, (2018)
Average profit after tax of firms sampled in the study stood at 8554.211 million, mean current asset
stood at 31237.81 million, average non-current asset stood at 41837.3 million, while average debt-equity ratio stood at 1.73326 million. The minimum and maximum values for profit after tax, over the time period covered
in the study, and across the selected firms stood at -2016 million and 43080 million respectively, for current
asset the minimum value stood at 29 million while the maximum value stood at 141505.1 million. Minimum and
maximum values for non-current asset stood at 216.7579 million and 299227.1 million respectively. Minimum
debt-equity ratio stood at .4131999, while the maximum stood at 5.269011 million. Statistics presented above
described each of the variables as pooled over 10 firms in Nigeria including Nestle Plc, PZ Cusson, Unilever,
Nigerian Breweries, 7UP, Vitafoam, Guinness, Flour Mill, Dangote, and Nascon, over a period of 10 years
(2007-2016).
4.3 Correlation Analysis
Table 4.2: Correlation Statistics
PAT CAS NCAS DER
PAT 1.0000
CAS 0.3593 1.0000
NCAS 0.7933 0.5292 1.0000
DER -0.0699 -0.1957 -0.0431 1.0000
Source: Author’s Computation, (2018)
Correlation result presented in table 4.2 revealed that there is positive correlation between
Profit after tax, current assets and non-current assets, which implies that predominantly over the period covered
in the study across sampled firms profit after tax move in the same direction with current asset and non-current
asset. On the other hand the result showed that there is negative correlation between profit after tax and firms
leverage measured in terms of debt-equity ratio, which implies that profit after tax tends to move predominantly in opposite direction with debt-equity ratio. Specifically, correlation coefficient reported in Table 4.2 stood at
0.3593, 0.7933, -0.0699, 0.5292, -0.1957 and -0.0431 for PAT and CAS, PAT and NCAS, PAT and DER, CAS
and NCAS, NCAS and DER respectively.
4.4 Analysis of the Effect of Current Assets, Non-Current Assets and Leverage ratio on Profit after Tax
This section presents analysis of the effect of asset management measured in terms of current assets,
non-current assets and leverage ratio on performance of firms in Nigeria as measured in terms of profit after tax.

Assets Management and Performance of Selected Quoted Firms in Nigeria
*Corresponding Author: Ayodele, Johnson Eyitope www.aijbm.com 72 | Page
In this section, results of analyses done using Pooled OLS estimator, fixed effect estimator and random effect
estimation were presented after which evaluation for consistency and efficiency was done using post estimation
test including restricted F-test and Hausman test. Emphasis is being place on the most consistent and efficient estimator for discussion and inference.
4.4.1 Pooled OLS Analysis
Table 4.3 Pooled OLS Estimation Result
Series: PAT CAS NCAS DER
Variable Coefficient Std Error T-Test Probability
C 4093.984 1631.566 2.51 0.014
CAS -.0400978 .0306917 -1.31 0.195
NCAS .1589519 .0137131 11.59 0.000
DER -540.7867 646.495 -0.84 0.405
R-square=0.6371, Adjusted R-square=0.6257, F-statistics=56.17, Prob(F-stat)=0.0000
(*) connotes significance at 5% level of significance.
Source: Author’s Computation, (2018)
Pooled estimation result presented in Table 4.3 revealed that when heterogeneity effect across firms
sampled in the study is not given consideration, current assets exert insignificant negative impact on profit after
tax, with coefficient estimate of -.0400978 (p=0.195> 0.05). Non-current assets on the other hand exerts positive
significant impact on profit after tax, with coefficient estimate of 0.1589519 (p=0.000< 0.05). Result revealed also that debt-equity ratio exerts insignificant negative impact of profit after tax to the tune of -
540.7867(p=0.405> 0.05). R-square statistics reported in Table 4.3 showed that about 64% of the systematic
variation in profit after tax could be jointly explained by current assets, non-current assets, and debt-equity
4.4.2. Fixed Effect Estimation
This estimation systematically incorporated the heterogeneity effect across sampled firms into the
model to account for the firm’s uniqueness. This study separately incorporated firm’s heterogeneity effect and
period effect into the model using dummy approach in which each firms and year was assigned an intercept
term. Results of the least square dummy variable fixed effect estimations for (cross sectional and period
specific) are presented in table 4.4
Table 4.4: Fixed Effects Estimates (Cross-sectional and Period specific)
Series: PAT CAS NCAS DER
CROSS-SECTIONAL SPECIFIC EFFECT TIME SPECIFIC EFFECT
Variables Coefficients Prob Variables Coefficients Prob
C 15597.16 0.000 C 3493.41 0.132
CAS .0652248 0.066 CAS -.0296037 0.334
NCAS .0378182 0.007 NCAS .1678964 0.000
DER -1004.77 0.147 DER -433.2971 0.500
Effects Effects
PZ CUSSON -12566.44 0.000 2008 1118.007 0.687
UNILEVER -10785.55 0.000 2009 1291.681 0.643
NIG BREW 10144.62 0.000 2010 771.6699 0.783
7UP -11396.64 0.000 2011 2009.858 0.472
VITAFOAM -13731.32 0.000 2012 1759.755 0.530
GUINNESS -7728.97 0.000 2013 691.0393 0.806
FLOUR MILL -14318.16 0.000 2014 -1290.767 0.649
DANGOTE -15547.52 0.000 2015 -4644.796 0.107
NASCON -13281.15 0.000 2016 -4584.058 0.114
R-square=0.8825
Adjusted R-square=0.8663
F-statistics=54.46
Prob(F-stat)=0.0000
R-square=0.6848
Adjusted R-square= 0.6413
F-statistics=15.75
Prob(F-stat)=0.0000
Sources: Author’s Computation, (2018)

Assets Management and Performance of Selected Quoted Firms in Nigeria
*Corresponding Author: Ayodele, Johnson Eyitope www.aijbm.com 73 | Page
Fixed effect cross-sectional specific estimation result presented in Table 4.4 showed that when
heterogeneity effect across firms sampled in the study is incorporated into the model, both current asset and
non-current asset exert positive impact on profit after tax, though the positive impact of current asset unlike that of non-current asset is not significant. Reported coefficient estimate for current asset and non-current asset stood
at 0.0652248 (p=0.066> 0.05) and .0378182(p=0.007< 0.05) respectively. R-square value reported for cross-
sectional specific estimation presented in table 4.4 stood at 0.8825, which reflect that about 88% of the
systematic variation in profit after tax can be explained jointly by the explanatory variables.
Result of fixed effect period-specific estimation presented in Table 4.4 showed that when heterogeneity
effect over time is incorporated into the model as intercept term, current asset exert negative insignificant impact
on profit after tax, with coefficient estimate of -.0296037(p=0.334> 0.05), while the impact of non-current asset
on profit after tax is positive and significant with reported coefficient estimate of .1678964 (p=0.000< 0.05).
Result also showed that debt-equity ratio exert insignificant negative impact on profit after tax, with reported
coefficient estimate of -433.2971(p=0.500< 0.05). Reported R-square statistics showed that about 68% of the
systematic variation in profit after tax can be explained jointly by current asset, non-current asset and debt-equity ratio.
Deviation from the intercept term (15597.16) corresponding to the reference firms (Nestle Plc) stood
at-12566.44, -10785.55, 10144.62, -11396.64, -13731.32, -7728.97, -14318.16, -15547.52, -13281.15 for PZ
Cusson, Unilever, Nigerian Breweries, 7up, Vitafoam, Guinness, Flour Mills, Dangote Sugar , and Nascon
respectively. Deviation from the intercept term (3493.41) of the reference period (2007) stood at 1118.007 for
2008, 1291.681 for 2009, -771.6699 for 2010, 2009.858 for 2011, 1759.755 for 2012, 691.0393 for 2013, -
1290.767 for 2014, -4644.796 for 2015, and -4584.058 for 2016
4.4.3 Random effect estimation
Table 4.5 Random Effect Estimation
Series: PAT CAS NCAS DER
Variable Coefficient Standard Error Z-Test Values Probability
C 5672.022 2139.918 2.65 0.008
CAS .0404019 .0351488 1.15 0.250
NCAS .0685197 .0142572 4.81 0.000
DER -719.1976 704.1565 -1.02 0.307
R-square=0.5705
Wald chi2(5)=43.17
Prob> chi2 =0.0000
Random effect estimation result presented in Table 4.5 revealed that when heterogeneity effect across
firms and over time is incorporated into the model via the error term, both current asset and non-current asset
exert positive impact on profit after tax, though the impact is only significant for non-current asset,, given the
reported estimates for non-current asset that stood at .0685197(p=0.000< 0.05), as against estimate for current
asset that stood at .0404019 (p=0.250< 0.05). Reported R-square for random effect estimation presented in table
4.5 stood at 0.5705 which implies that about 57% of the systematic variation in profit after tax can be explained
by current assets, non-current assets and debt-equity ratio of the sampled firms.
4.4.4: Post estimation Test
Table 4.6: Restricted F Test of Heterogeneity (Cross-Sectional and Time Specific)
F-statistics Probability
Cross sectional 20.20 0.0000
Time specific 1.46 0.1747
Source: Author’s Computation, (2018)
F-statistics reported in Table 4.6 stood at 20.20 and 1.46 with probability values of 0.0000, and 0.1747 for cross
sectional and period specific effect respectively. Result showed that there is enough evidence to reject the null
hypothesis that all differential intercept corresponding to each cross sectional specific units (firms) are equal to zero, but otherwise for the period specific intercepts. This implies that there is significant cross sectional
heterogeneity effect amidst the sampled manufacturing firms thus invalidating the restriction of pooled OLS
estimation, in favour of cross-sectional fixed effect estimation.
Table 4.7.Hausman Test
Null hypothesis Chi-square stat Probability
Difference in coefficient not systematic 3.41 0.0649
Source: Author’s Computation, (2018)

Assets Management and Performance of Selected Quoted Firms in Nigeria
*Corresponding Author: Ayodele, Johnson Eyitope www.aijbm.com 74 | Page
Table 4.7 reported chi-square statistic of 3.41and probability value of 0.0649. The result revealed that
there is no enough evidence to reject the null hypothesis that differences in coefficients of fixed effect
estimation and random effect estimation is not significant. Therefore the most consistent and efficient estimation is given by the random effect estimation as presented in Table 4.5. It thus became evident that the estimation
that best explained the effect of assets management on performance of firms as measured in terms of profit after
tax is the random effect estimation presented in Table 4.5, which revealed that current assets exert insignificant
positive effect on profit after tax to the tune of .0404019 (p=0.250> 0.05), while the impact of non-current asset
on profit after tax is positive and significant, with coefficient estimate of .0685197(p=0.000< 0.05). Debt-equity
ratio on the other hand exert insignificant negative effect on profit after tax, with reported coefficient estimate of
-719.1976(p=0.307> 0.05)
Table 4.8: Other Post Estimation Test
Wald test
Null hypothesis Statistics Probability
Panel homoscedasticity 2.1717 0.0647
Pesaran test
Null hypothesis Statistics Probability
No cross sectional dependence 1.346 0.5668
Wooldridge test
Null hypothesis Statistics Probability
NoAR(1)panel autocorrelation 0.3369 0.5759
Source: Author’s Computation, (2018)
Result presented in Table 4.8 showed that there was no evidence to reject null hypothesis on panel
homoscedasticity, null hypothesis of no cross-sectional dependence and null hypothesis of no AR (1) panel
autocorrelation, given the reported probability statistics of 0.0647> 0.05 for Wald test, 0.5668> 0.05 for Pesaran
test, and 0.5759> 0.05 for Wooldridge test. Hence it can be established in the study that assumptions of equal
variance of residual terms, cross sectional independence and absence of serial autocorrelation for the estimated
panel-based model is valid.
4.5 Discussion of Findings
This study in an attempt to delineate the connection between asset management and performance of
selected firms conducted panel estimations using both restricted and non-restricted estimator. From the result of evaluation test which compared fixed effect and random effect, it was established that the most consistent and
efficient estimator for the investigation conducted in this study is the random effect estimation presented in
Table 4.5. The estimated result showed that both current assets and non-current assets of firm in Nigeria exert
positive effect on the level of performance as measured in terms of profit after tax. While current assets exert
insignificant positive effect on profit after tax, the effect of non-current assets were significant. In specific terms
the estimated result revealed coefficient estimate of 0.0404019 (p=0.250< 0.05)for current assets and
0.0685197(p=0.000< 0.05) for non-current assets, which reflect that profit after tax of firms in Nigeria on the
average would increase by about 40.4019 million for every one billion increase in the value of current assets,
other things held constant, while for every one billion increase in non-current assets, profit after tax would
increase by 68.5197 million, holding other things constant. The result established that increase in profit after tax
for every one billion increase in non-current assets were statistically significant at 5% level of significance, but
otherwise for the increase in profit after tax, for every one billion increase in current assets, On the other hand result revealed that debt-equity ratio exerts negative insignificant effect on profit after tax of firms in Nigeria,
with reported coefficient estimate of -719.1976(p=0.307> 0.05), which implies that for every unit increase in the
debt-equity ratio, profit after tax would decrease by 719.1 million naira. The result implies that as the leverage
ratio of a firms increase, performance measured in terms of profit after tax tends to fall. Adjusted R-square of
57% gave the predictive capacity of the model and that about 57% of systematic variation in profit after tax of
the sampled firms can be explained by current asset, non-current assets and debt-equity ratio. Hence this study
pin-point the fact that assets management played a substantial role in the discourse of performance of firms in
Nigeria.
Evaluating the result based on the a-priori expectation reflected agreement of the findings made in the
study with expectation of positive effect, meaning that the result of this study align closely with the expectation.
This was so because while both current assets and non-current assets exert positive effect on profit after tax, the effect of debt-equity ratio was negative as expected. Empirical with previous researches established that the
findings made in the study agreed with findings of Onodje (2014),Ishmael and Kehinde (2013), Waithaka
(2012) and Onodje (2014) established debt management and current assets management among other things

Assets Management and Performance of Selected Quoted Firms in Nigeria
*Corresponding Author: Ayodele, Johnson Eyitope www.aijbm.com 75 | Page
were critical for sustaining improved performance of quoted firms. Ishmael and Kehinde (2013) established that
differences in the components of an organization reflected fundamentally in the operational performance
position. Also, findings made by Waithaka (2012) reflected in alignment with the findings of this study that assets regardless of its composition has positive interrelationship with firm’s performance. However there was a
divergence between the findings made in this study and the findings of Falope and Ajilore (2009) in their
investigations of the effect of current assets on firms profitability, where they established that there was negative
relationship between the profitability of firms and their current assets measured in terms of average collection
period, inventory turnover in days, average payment period and cash conversion cycle. Further studies on the
discourse of assets management and performance of quoted firms in Nigeria should extend the scope of research
to cover more quoted firms listed on the Nigerian stock exchange in the bit to increase the generalization
accuracy about how assets management influences the performance of quoted firms in the Nigeria.
V. CONCLUSION AND RECOMMENDATIONS This study established that both current assets and non-current assets influenced performance of firms
in Nigeria positively, and that the positive effects of non-current assets were significant, thus the study reflected
that assets management contributed meaningfully toward improved performance of quoted firms in Nigeria,
especially when measured in terms of profit after tax. On the other hand, the study established that increase in
the leverage ratio of quoted firms in Nigeria has the capacity to impede improved performance especially when
measured in terms of profit after tax. Fundamentally therefore this study submitted that the role of management
of assets among Nigeria quoted firms should not be undermined, if improved performance was desired. It was
recommended that quoted firms in Nigeria should maintain non-current assets that is substantial for sustaining
their performance and help to attain market stability that can culminate into higher market share, expansion and
growth; quoted firms in Nigeria should look into management of leverage ratio, so as to reduce the likelihood of reducing performance due to rising debt-equity ratio and that quoted firms should design an internal monitoring
system that can help to maintain balance between current assets and non-current assets in order to guide against
loss of operational efficiency that can ensue when the importance of non-current assets are overemphasized at
the expense of current assets.
REFERENCE [1]. Ani, W. U., Okwo, I.M. & Ugwunta, D.O. (2012). Effects of working capital management on
profitability: Evidence from the Top five Beer Brewery Firms in the World. Asian Economic and Financial Review, 2(8), 966-982
[2]. Brigham, E. F. & Houston, J.F. (2009). Fundamental of financial management. Orlando: Harcourt
College Publishers
[3]. Chowdhary, A. & Amin, M. M. (2007) Working capital management practices: Pharmaceutical
Companies Listed in Dhaka Stock Exchange. BRAC University Journal, 4(2), 75-86
[4]. Egbide, B. (2009). Working capital management and profitability of listed companies in nigeria.
Nigeria Research of Accountancy, 1(1), 44-57.Journal
[5]. Enekwe, Agu & Ezeido (2014). The effect of financial leverage on financial performance: Evidence of
Quoted Pharmaceutical Companies in Nigeria.Journal of Economics and Finance (IOSR-JEF), 5(3),
17.25
[6]. Enyi, E. P. (2011). Corporate solvency management: How effective are contemporary tools?
International Journal of Research in Commerce, Economics & Management, 1(3), 20 – 25 [7]. Falope, O. L., & Ajilore, O. T. (2009). Working capital management and corporate profitability:
Evidence from Panel Data Analysis of Selected Quoted Companies in Nigeria. Research Journal of
Business Management, 3(4), 73-84.
[8]. Flanagan, B. (2005). Managing working capital. Business Credit, 107(8).
[9]. Ghosh, K. S.,& Maji, S. G. (2003). Working capital management efficiency: A Study on Indian
Cement Industry. Journal of International Finance and Economics, 2(3). 89-95
[10]. Gul, S., Faiza, I.,& Khalid, Z. (2011) Factors affecting bank profitability in pakistan, the Romanian
Economic Journal, 2(3), 6-9.
[11]. Guney, Y., Ozkan. A.,& Ozkan. N., (2007). International evidence on the non-linear impact of leverage
on corporate cash holding. Journal of Multinational Financial Management, 17 (1) 1-23
[12]. Ishmael, O., & Kehinde, J. S. (2013). Profitability analysis trend of components of current assets and their prospects in Ajaokuta iron industry. eCanadian Journal of Accounting and Finance, 1(2), 28
[13]. Jensen, M. C. & Meckling, W. H., (1976) Theory of the firm: Managerial Behavior, Agency Costs and
Ownership Structure
[14]. Kotšina, S., & Hazak, A. (2012). Does investment intensity impact company profitability?

Assets Management and Performance of Selected Quoted Firms in Nigeria
*Corresponding Author: Ayodele, Johnson Eyitope www.aijbm.com 76 | Page
[15]. Across-country empirical study. Proceedings from the 2nd International Conference on Economics,
Trade and Development, IPEDR Vol. 36. IACSIT Press Singapore
[16]. Lazaridis, I., & Tryfonidis, D. (2006). Relationship between working capital management and profitability of listed companies in the athens stock exchange. Journal of Financial Management and
Analysis, 19(6),26-35
[17]. Mohammad A. & Noriza M.S. (2010). “Working capital management: The Effect of Market Valuation
and Profitability in Malaysia”. International Journal of Business and Management, 5, (11)
[18]. Mutungi, M. (2010). The relationship between working capital management and financial performance
of oil marketing firms in kenya. Unpublished MBA project, University of Nairobi.
[19]. Myers & Majluf (1984), Corporate financing and investment decisions When Firms Have Information
That Investors Do Not Have, Journal of Financial Economics 13 (1) 187-221. North-Holland Niresh, J.
A. (2012). Working capital management and financial performance of manufacturing sector in sri
lanka. European Journal of Business Management, 4(15),23-29
[20]. Ojo O. E., (2017) “Practical approach to small business management”: MIDEAL Publications [21]. Okwo, Ugwunta & Nweze (2012), Austin uche investment in fixed assets and firm profitability:
Evidence from the Nigerian Brewery Industry, European Journal of Business and Management. 4 (2)
[22]. Ongore, V. N. & Kusa, G. B. (2013). Determinants of financial performance of commercial banks in
Kenya, International Journal of Economics and Financial Issues, 3 (1), 237-252
[23]. Onodje, M. (2014), Working capital management and performance of selected Nigerian manufacturing
companies, Global Journal of Management and Business Research: Economics and Commerce, 14(3),
13-18
[24]. Osundina J. A., (2014) Working capital management and profitability: Evidence from Quoted Food
and Beverages Manufacturing Firms in Nigeria. Research Journal of Finance and Management. 5(4)
[25]. Reyhani, A. G. (2012). The investigation of effect of assets structure on performance Ofaccepted
companies of Tehran Stock Exchange (TSE). Journal of Basic and AppliedScientific Research, 2(2),
1086-1090 [26]. Samiloglu, F., & Demirgunes, K. (2008). The effects of working capital management on firm
profitability: Evidence from Turkey. The International Journal of Applied Economics and Finance,
2(1), 44-50
[27]. Umara, N., Sabeen, K. K. & Qaisar, A. (2009). International working capital practices in Pakistan.
International Research Journal of Finance and Economics, 32, 160-170
[28]. Vanier, D. (2001) Why industry needs asset management tools. ASCE Journal of Computing in Civil
Engineering, 15(1)
[29]. Waithaka, A. (2012): The relationship between working capital management practices and financial
performance of agricultural companies listed at the nairobi securities exchange. Master’s thesis, The
University of Nairobi 2012. 71
[30]. Wenyao, L. (2007). The determinants of cash holdings: Evidence from Chinese listed companies, from http://www.seiofbluemountain.com .
[31]. Yahaya, O. A., Kutigi, U. M. Solanke, A. A. Onyabe, O. M. & Usman, S. O. (2015). Current assets
management and financial performance: Evidence from Listed Deposit Money Banks in Nigeria,
International Journal of African and Asian Studies, 13, 45-56
*Corresponding Author: Ayodele, Johnson Eyitope