FInance International Journal - Firms Histories and Their Capital Structure

1530 EKWUEME, .C. Mercilina1, AFMJ Volume 3 Issue 05 May 2018
Account and Financial Management Journal e-ISSN: 2456-3374
Volume 3 Issue 05 May- 2018, (Page No.-1530-1542)
DOI:10.31142/afmj/v3i5.01, I.F. - 4.614
© 2018, AFMJ
Capital Structure and Firms Financial Performance in Nigeria Quoted
Insurance Companies
EKWUEME, .C. Mercilina1 (Ph. D), ATU, Oghogho Gina
2
1Lecturer- Department of Accounting, Nnamdi Azikiwe University, Awka, Anambra State.
2Lecturer- Department of Accounting, Igbinedion University, Okada
Corresponding Author: ATU, Oghogho Gina
(B.Sc, NIM, M.Sc, ACA,Ph.D In- view)
Lecturer- Department of Accounting, Igbinedion University, Okada +2348065796019
Abstract: This study examined the capital structure and firms performance in Nigeria Quoted Insurance companies using a
sample of (22) insurance firms Quoted in the insurance sub sector of the financial sector of the economy during (14) years period
(2002-2016) are used as observation in this study. The data was analyzed from the annual report and account from that period.
Correlation analysis was run to determine the relationship between dependent and independent variables. The study utilized E-
view software to generate regression results. From the analysis it was discovered that ;there is a weak relationship between return
on equity and the insurance firms capital structure whether in relation to assets or in relation to equity, also the firm’s capital
structure components are significant in determining variation are significant in the firms variation in the firms return on equity
value. It is recommended that Quoted insurance companies should try to improve their return on equity, because any change in
their gearing ratio may cause change in their return on equity either positively or negatively.
1.0. INTRODUCTION
Capital structure is one of the most important areas in
financial decision. This is because of the relationship it has
with other financial decisions variables. Capital structure is
seen as the overall configuration of long term funds at the
disposal of an enterprise for the pursuit of its objectives.
Weston and Bringham (1981) defined capital structure as the
invariable financing of an enterprise comprising stocks and
common equity. Also Ong & Teh, (2011) viewed Capital
structure as a mixture of a company's debts (long-term and
short-term, common equity and preferred equity. The theory
of corporate Debt capacity & capital structure suggest that
any given combination of Debt instrument in Equity Capital
employed by a business at any given point in time has
significant implications for various managerial actions
especially those concerning future solvency & profitability,
Osazie (1985). The above implies that the realization of a
firm’s objectives in term of maximizing the market value
depends on the financial manager, or the management
ability to make the appropriate financing mix. This view was
also shared by Ong & Teh, (2011) they opined that the
ability an enterprise to carry out their stakeholders’ needs is
related to capital structure.
Myers (1984), mentioned internal fund (retained
earnings) and external fund (debt and equity) as constituent
or elements of capital structure. A capital structure could
either be 100% equity with no debt which will make such a
company an ungeared company, 100% debt with 0 equity
which is not realistic because no investor will invest in a
company that has no equity financing, and or a mix
proportion of equity and debt which will make the company
a geared company ( Dare & Sola, 2010).
The main aim of this research, therefore, is to
examine the impact of capital structure and the financial
performance of Quoted Insurance Companies with a view to
understanding how Capital Structure can be used to improve
Financial Performance of Quoted Insurance Companies.
1.1 Statement of the Research Problem
For the purpose of this study, capital structure can simply be
defined as a firm’s financial framework, which constitute
firm retain earnings, debt financing and equity financing
used in maintaining and financing its assets for the benefits
of its stakeholders. This definition is applied because, the
ability of companies to meet their stakeholders need is
firmly related to capital structure. Hence, making the capital
structure theory highly relevant to the firm’s profitability,
Liquidity, growth and safety. Therefore, How to plan
financing decision using a particular mix or proportion of
funding to maintain an optimal capital structure is an
important issue of concern to the financial manager and the
company if they are ever going to play a leading role in the
industry in fulfilling their primary objectives to their
shareholders and the economy as a whole. It’s on this back
drop that this study is based.
Now while there have be various studies on capital structure
over the world as mentioned in the literature review, like

“Capital Structure and Firms Financial Performance in Nigeria Quoted Insurance Companies”
1531 EKWUEME, .C. Mercilina1, AFMJ Volume 3 Issue 05 May 2018
Boodhoo (2009), Kajola & Onaolapo (2010), Kibrom
(2010), Osuji & Odita (2012), Babalola (2012), Muhammad,
Zaighum, Saeed & Muhammad (2012), Uwuigbe & Uadiale
(2012); Tharmilla & Arulvel (2013); Lucy, Muathe &
George (2014); Mubeen & Kalsoon (2014); Varian,
Rahimie, Zatul & Amer (2015); Ubesie (2016); Niway
(2016); Mathewos (2016) to mention a few
To the best researcher’s knowledge none of the
researchers conduct it specifically on the Quoted insurance
companies, thus resulting in putting an obligation on the
researcher to hence address this issue with a view to closing
the knowledge gap. The main thrust of this research work is
to examine the capital structure of quoted insurance
companies in Nigeria and how this has impacted on their
profitability over the years and make necessary contribution
to this subject of study.
1.2 Objectives of the Study
The main objective of this study is to examine capital
structure and the financial Performance of Quoted Insurance
Companies. While specifically, the study will determine:
1. The relationship between Gearing and Return on
Equity (ROE) of Quoted Insurance Companies.
2. The relationship between Gearing in relation to
assets and Return on Equity (ROE) of the Quoted
Insurance Companies.
1.3. Research Hypotheses
The hypotheses of the study are:
H01: There is no significant relationship between Gearing
and Return on Equity (ROE) in Quoted Insurance
Companies.
H02: There is no significant relationship between Gearing in
relation to assets and Return on Equity (ROE) in Quoted
Insurance Companies.
1.4 Scope of the Study
This study which is on capital structure and financial
performance is limited to insurance Nigeria quoted on the
Nigeria stock exchange (NSE) and covers a period of six
(6) years (2010 to 2016).
2.0. LITERATURE REVIEW
2.1 The Concept of Capital Structure
Capital structure as defined by Damodaran, (2001) and
Dare &Sola (2010) represents the mix of debt and equity
that a company uses to finance its business . Debt could
either be government or corporate bonds or medium and
long term loans from bank or line credits from suppliers.
While equity could either be any of the following: retained
earnings, ordinary shares, preference shares. A close related
definition is that given by Song (2005) they view capital
structure as the mix of the different types of securities
(long term debt, common stock) issued by a company / firms
to finance their asset .
2.2 Capital Structure, financial performance and
Financial Leverage /Gearing
As earlier established, Capital structure plays a major role in
the fulfilment of shareholders’ needs which in turn is
closely linked with the firms’ corporate performance (Tian
& Zeitun, 2007, as cited in Ong & Teh, 2011). There are
various ways in which corporate performance can be
measured. But the most used variable for measurement of
corporate performance are but not limited to:- return on
investment (ROI), residual income (RI), earning per share
(EPS), dividend yield, price earnings ratio, growth in sales,
market capitalization etc. (Barbosa & Louri, 2005). As it
relates to capital structure, these variables are compared to
the gearing or financial leverage of a company to get their
significant relationship or impact to each other. Financial
gearing/ leverage according to Anderson (2000), is the
mixture of long term fund provided internally by
shareholders and long term fund contributed externally by
lenders. A company is said to be unlevered/ ungeared if it
financed solely by equity, that is it has no debt in its capital
structure, while a firm with a mixture debt and equity in its
capital structure is said to be geared or leveraged, Song
(2005).
Olowolaju, (2013) opined that the performance of highly
geared firm is dependent on the appropriate usage of debt
capital, because of the various advantages debt capital has
over equity such as its interest deductibility and its ability
not to dilute control of the shareholders e.t.c Brennan and
Schwartz (1978). However the benefits of debt to equity,
the level of debt in a firms’ capital structure must be
appriopriately determined to reach an optimum level so as
to avoid the situation where debt holders take over the
control of the company and determine how the business can
operate just to suit their own needs, thereby leading
bankruptcy (Brennan & Schwartz, 1978).
There is no universally accepted definition of
leverage or gearing in the academic literatures, the choice of
definition to be used will depend on the objectives of
analysis. Rajan and Zingales (1995) in their research apply
four alternative definitions of leverage of which one will be
adopted in this study. The first definition of leverage
according to them is the ratio of total (non equity) liabilities
to total assets. This can be viewed as proxy of what is left
for shareholders in case of liquidation. There are various
short comings to this definition of which include: the
measure does not provide a clear view of risk of default
should in case the company is not able to meet with its debt
obligations also gearing / leverage is slightly overstated
since items like accounts payable which are used basically
for transaction purposes are included in total liabilities and
so on. The second definition of leverage employed by them
is the ratio of debt (both short term and long term) to total
assets. Again this definition has its short comings such as: it
is a narrower measure of leverage in the sense that it only
covers interest bearing debt and excludes provisions. A
third definition of leverage is the ratio of total debt to net
assets, where net assets are total assets less accounts payable
and other current liabilities. While this measure of leverage

“Capital Structure and Firms Financial Performance in Nigeria Quoted Insurance Companies”
1532 EKWUEME, .C. Mercilina1, AFMJ Volume 3 Issue 05 May 2018
is not affected by non-interest bearing debt and working
capital management, it is influenced by factors that have
nothing to do with financing. For example, assets used as
collateral against pension liabilities may decrease this
measure of leverage. Lastly, the final definition of leverage
is the ratio of total debt to capital, where capital is defined as
total debt plus equity. This measure of leverage looks at the
capital employed as such best represents the effects of past
financing decisions and its most directly related according to
Jensen & Meckling (1976), Myers (1977) to the agency
problems associated with debt.
2.4. Theoretical Framework
The theory to be adopted in this study will be static trade off
theory based on the work of economists Modigliani and
Miller; which is a financial theory that identifies a mix of
debt and equity where the decreasing WAAC offsets the
increasing financial risk to a company. It also shares the
opinion about the existence of optimal capital structure and
it relationship with the value of a firm and this correlates
with the problem of this study.
Static trade-off theory argues that for each
company there is an optimal capital structure, with an
optimal level of gearing. There is a trade-off between the
benefits of taking on more debt and the costs of higher
indebtedness. The benefits of taking on debt (rather than
equity) are mainly in the tax relief that is obtained on debt
interest. Modigliani and Miller have argued that although
the cost of equity rises as gearing increases, the tax relief on
debt means that the company’s weighted average cost of
capital falls as gearing rises. It is therefore beneficial to take
in more debt and increase gearing up to the point where the
marginal costs of extra debt start to exceed the marginal
benefits of extra debt.
The optimal gearing level for a company is reached at a
point where: the marginal benefits of taking on additional
debt capital equals the marginal costs of taking on the extra
debt.
The optimal gearing level varies between companies,
depending on their profitability. A very profitable company
can take on higher gearing because the marginal costs of
financial distress will not become significant until the
gearing level is very high.
2.6 Empirical Review
There have being some studies on capital structure and firm
performance. Just to mention few, among the available
research, that of Harris & Raviv (1991) which is amongst
the earliest studies revealed and argued that capital structure
is significantly related to the trade-off between gain from
liquidation and costs of liquidation to both shareholders
and managers. According to them, because of the benefits of
debt to both shareholder and managers, firms maybe
allowed to have more debt in their capital structure than is
suitable but the firm should put into consideration
bankruptcy costs of liquidation, reorganisation, or the
aligned interest of both managers and shareholders in
estimating the optimum level of debts in the capital
structure. Rajan and Zingales (1995), in their study on the
determinant factors of capital structure on G-7 countries
(United States, Japan, Germany, France, Italy, Britain and
Canada), with a sample size of 4,557 companies for a
period of 1987 to 1991 also revealed capital structure as
determined by profitability was negatively correlated with
financial leverage (i.e. debt level). In another study by
Gleason, Mathur & Mathur, (2000) revealed that firms
capital structure has a negative and significant impact on
firms performance measures return on assets, growth in
sales and pre-tax income. Meaning that, greater proportion
of debt in the capital structure of a firm would decrease the
firm’s financial performance. This findings is closely related
to that of Krishnan & Moyer, (1997), which also revealed a
negative and significant impact of total debt to total equity
(TD/TE) on return on equity (ROE). Onaolapo and Kajola,
(2010) in their study of 30 non-financial firms listed on the
Nigerian Stock Exchange from2001-2007 found a
significant negative impact of Capital structure (debt ratio)
on return on assets (ROA) and return on equity (ROE)
which were the performance measures. Also Uwalomwa &
Uadiale (2012), in their research on the relationship between
Capital Structure and the Financial Performance of Firm’s in
Nigeria, using total sample of 31 listed firms for the period
2005-2009 using the Ordinary Least Square (OLS)
technique of model estimation revealed that employing high
proportion of long-term debt in firm’s Capital Structure will
invariably result in low financial performance of a Firm.
Osuji and Odita (2012) in their study of 30 non-financial
firms listed on Nigerian Stock Exchange from 2004-2010
also revealed a significant but negative impact of capital
structure as represented by debt ratio on firms performance.
In another study by Sheikh & Wang (2013), of 240 non-
financial firms listed on Pakistan stock exchange for a
period of six years (2004-2009), a negative relationship was
also found between capital structure ( as represented total
debt ratio, long and short term debt ratio ) and financial
performance (as represented by ROA). Muhammad,
Zaighum, Saeed & Muhammad (2012) in their research on
impact of capital structure on firms’ financial performance
in Pakistan of top 100 consecutive companies for a period of
four years from 2006 to 2009 showed that all the three
variables of capital structure (Current Liabilities to Total
Asset, Long Term Liabilities to Total Asset, Total Liabilities
to Total Assets) negatively impacts the Earning before
Interest and Taxes, Return on Assets, Earning per Share and
Net Profit Margin while a negative relationship is showed
between Price Earnings ratio and Current Liabilities to
Total Asset and positive relationship with Long Term
Liabilities to Total Asset and an insignificant relationship
with Total Liabilities to Total Assets and positive
relationship exists with Long Term Liabilities to Total
Asset. Therefore its safe based on these results of
Muhammad, Zaighum, Saeed & Muhammad (2012) to
“Capital Structure and Firms Financial Performance in Nigeria Quoted Insurance Companies”
1533 EKWUEME, .C. Mercilina1, AFMJ Volume 3 Issue 05 May 2018
conclude that capital structure choice is an important
determinant of financial performance of firms
Also in Ghana the study done by Dadson & Jamil (2012) on
the relationship between capital structure and performance
of listed banks in Ghana from 2000 to 2010 revealed
although the banks listed on the Ghana Stock Exchange are
highly geared, the level of gearing is negatively related to
the banks’ performance in term of ROE and Tobin’s Q.
Babalola (2014), in his study of 31 manufacturing
firms with audited financial statements from 1999-2012
hitching on static trade-off theory opined that capital
structure is a trade-off between the costs and benefits of
debt, and it has been refuted that large firms are more
inclined to retain higher performance than middle firms
under the same level debt ratio. Lucy, Muathe & George
(2014), in their study on the Relationship between Capital
Structure and Performance of Non-Financial Companies in
Kenya using a sample of 42 non-financial companies for
the period of 2006-2012 using Feasible Generalized Least
Square (FGLS) regression revealed that financial leverage
had a significant negative association with performance as
measured by return on assets (ROA) and return on equity
(ROE). Niway (2016), in their study Investigated the impact
of capital structure choice on Firm’s Financial Performance
in Ethiopia using seven (7) years data from year 2006-20012
for a sample of 15 Manufacturing firms. Panel data has
been selected based on result of model specification tests.
The result revealed a significantly negative relationship
between capital structure ratios (short term debt, long term
debt, and total debt ratios) and financial performance by
(ROA) and (ROE). In the oil and Gas sector, Varien et al
(2015) in their study of the relationship between capital
structure and corporate performance of public listed oil and
gas companies in Malaysia for a period of 2003-2013
revealed that capital structure ( as proxy by short-term to
total debt (STD/TA), long-term to total debt (LTD/TA) and
total debt to total asset (TTD/TA)) is negatively related to
firm’s return on equity, but has no effect on ROA (return
on asset) and GM (Gross profit Margin) . Mathewos (2016)
in its investigation on the impact of capital structure on
financial performance of selected commercial banks in
Ethiopia for a period of five (5) year ranging from 2011 to
2015 indicated that financial performance, which is
measured by both ROA and ROE, is significantly and
negatively associated with capital structure proxies such as
debt to equity ratio (DER), bank’s size (SIZE) and asset
tangibility (TANG) whereas debt ratio (DR) have a positive
and significant relationship on firm performance
While, Mubeen & Kalsoom (2014) in their study
on capital structure on Firm’s Financial Performance and
Shareholders Wealth in Pakistan, using a sample of 155
Textile Firm’s for six (6) years from 2006-2011. The
result shows that there is a significant positive relationship
between Capital Structure & Firm’s financial performance
and Shareholders wealth using ROE, ROA, EPS and stock
price as proxies for financial performance in textile sector in
Pakistan and debt to equity ratio as independent variable.
Ubesie (2016), Investigated the Effect of Capital Structure
on the Financial Performance of Nigerian Conglomerates
Quoted on the floor of the Nigerian Stock Exchange, using
five (5) years data from the year 2011-2015. Descriptive
statistics and the pooled ordinary least square (POLS)
regression analytical method were used for data analysis.
The result of the study is in agreement with most previous
studies on other sectors that discovered mixed result s on the
effect of capital structure on the financial performance. It is
therefore necessary to employ a critical analysis of the
appropriate debt-equity mix suitable for the company.
Further studies also revealed that not only does
firm’s level of leverage or Gearing affects financial
performance of firms but it also affects its debt maturity
structure. This was revealed in a study by Barclay & Smith
(1995), which revealed with evidence that large firms and
firms with low growth rates prefer to issue long term debt
than short term or medium term debt. This was also
supported by Stohs & Mauer (1996), which also evidenced
that larger and less risky firms usually make greater use of
long term debt and that debt maturity is negatively related to
corporate tax, the firm’s risk and earnings. Lastly,
Schiantarelli and Sembenelli (1999), who investigated the
effects of firm’s debt maturity structure on profitability for
Italy and the United Kingdom firms. Their results revealed a
positive relationship between initial debt maturity and
medium term performance
3.0. METHODOLOGY
The design of this study is a correlational and cause – effect
research design intended at examining the relationships
between capital structure variables both in relation to assets
and in relations to equity and the firm financial performance.
The samples are drawn randomly from 22 insurance firms in
the financial sector of the economy. The choice of this
number is to ensure enough representation of the total firm
characteristics for generalization to the sector. The periods
covered for the study depends solely on the availability of
data. But generally a period of 2002 to 2016 is considered in
the study. Though some firms do not have complete data for
that range, they are however utilized to increase
representation for inferences. See appendix for the data and
the name of firms and years used for which there were
availability of data.
The study utilized the annual reports and accounts
for the data in sourcing for the data. The audited reports
were utilized published by the firm as required by the
companies and allied matters act regulating the activities of
companies in Nigeria. The ordinary least square method was
used to examine the statistical significance of the variables,
correlation analysis and descriptive statistics were also
utilized in the study. The correlation analysis gives the
relationships between the variables both in terms of strength
and direction. The study utilized EView software to generate
the regression results.

“Capital Structure and Firms Financial Performance in Nigeria Quoted Insurance Companies”
1534 EKWUEME, .C. Mercilina1, AFMJ Volume 3 Issue 05 May 2018
The model for the study is based on a functional
relationship between return on equity as a measure of
performance and capital structure variables. Return on
equity reveals the earning capacity of the firm in relation to
the shareholders’ wealth. It shows how the activities of the
firm translate into positive net present value for the firm.
Debt, equity, total assets and profit after tax are also
included in the model. The model showing this relationship
is specified below:
ROE = f (DER, DAR, DBT, EQT, PAT, TAS).
Where:
ROE = Return on Equity,
DER = Debt Equity Ratio,
DAR = Debt Assets Ratio,
DBT = Total Liability,
EQT = Total Equity,
PAT = Profit after Tax,
TAS = Total Assets.
The econometric expression of the model is as follows:
ROEt =β0 + β1DERti + β2DARit + β3DBTit + β4EQTit +
β5PATit +Β6TASit +ɛit
The a priori expectations are as follows:
β0 > 0, β1 > 0, β2 < 0, β3 < 0, β4 > 0, β5 > 0, β6 > 0.
4.0. DATA PRESENTATION, ANALYSIS AND
INTERPRETATION
4.1 Presentation and Interpretation of Descriptive
Statistics
The descriptive statistics describes the distribution of the
data. This is to assert if the output from the data should be
relied upon or not. The Jarque-Bera statistic is utilized for
the normality test. While the other descriptive statistics
measures such as mean, standard deviation and skewness
describe the behaviour of the data in relation to magnitude
and direction. The results of the descriptive statistics are
presented as follows:
Table 4.1: Descriptive Statistics on Corporate Governance and firm Performance Data
PAT TAS DBT EQT DAR DER ROE
Mean 2204.883 329032.8 172905.1 196820.2 3.147374 6.278761 0.004029
Median 239.6500 10364.49 3974.430 6207.330 0.420000 0.699800 0.042510
Maximum 485432.0 8273420. 7241484. 4765430. 488.1100 953.5421 1.130543
Minimum -1337180. 6.150000 2.594200 2.766700 0.070000 0.071800 -3.784738
Std. Dev. 116259.2 1472930. 797081.2 885740.9 36.45234 71.20703 0.403188
Skewness -7.819386 4.474319 5.763499 4.484075 13.26573 13.26250 -5.141500
Kurtosis 102.2598 21.23246 41.74082 21.33384 176.9884 176.9313 47.70818
Jarque-Bera 75307.37 3076.569 12184.85 3106.824 231028.4 230877.7 15696.52
Probability 0.000000 0.000000 0.000000 0.000000 0.000000 0.000000 0.000000
Observations 179 179 179 179 179 179 179
Source: EView Output, 2018
The descriptive statistics show a high mean value PAT,
TAS, DBT and EQT. This is because the values for these
variables are measured as absolute values not in relation to
another value. But the ratios such as DAR, DER and ROE
have moderate mean values. The low mean value for DAR,
DER and ROE is accompanied with low standard deviation
values meaning that these variables oscillate around the
mean point. While the variables with high value of standard
deviation shows evidence of outliers (extreme values) on the
data stream for those variables. PAT and ROE are
negatively skewed in the distribution.
For the normality test, the Jarque-Bera statistic
revealed that all the variables passed the normality test both
at 1% and 5% level of statistical significance. With the data
normally distributed, we can rely on the output of the
regression estimate for answering the hypotheses in the
study.
4.2 Presentation and Interpretation of Correlation Results
Table 4.2: Correlation Results of the Relationships between Capital Structure and Firm Performance
Covariance Analysis: Ordinary
Date: 06/04/17 Time: 15:27
Sample: 1 179
Included observations: 179
Correlation
Probability ROE DER DAR DBT EQT PAT TAS
ROE 1.000000
-----
DER 0.000350 1.000000
0.9963 -----

“Capital Structure and Firms Financial Performance in Nigeria Quoted Insurance Companies”
1535 EKWUEME, .C. Mercilina1, AFMJ Volume 3 Issue 05 May 2018
DAR -0.001588 0.999940 1.000000
0.9832 0.0000 -----
DBT -0.001672 0.666030 0.666493 1.000000
0.9823 0.0000 0.0000 -----
EQT 0.004349 -0.016947 -0.016225 0.720198 1.000000
0.9539 0.8219 0.8293 0.0000 -----
PAT 0.086446 -0.001673 -0.001565 0.042684 0.159351 1.000000
0.2499 0.9823 0.9834 0.5705 0.0331 -----
TAS 0.001738 -0.016813 -0.016160 0.729486 0.996862 0.119472 1.000000
0.9816 0.8232 0.8300 0.0000 0.0000 0.1112 -----
Source: EView Output, 2018.
The probability values of the correlation matrix revealed that
none of the independent variables is significantly related to
ROE. Judging from the correlation values, PAT is
positively related to ROA though with a weak relationship,
debt value in relation to assets had negative relationship
with ROE. The amount of leverage of insurance firms is
very weakly related to the firms return on equity. This could
be because of the nature of the business of insurance firms
and the structure of their Statement of Financial Position.
The profitability of the firms is highly dependent on
premium payment and other investment components and not
on the capital structure of the insurance firms. Among the
two variables, leverage in relation to assets revealed more
relationship to return on equity than debt in relation to
equity. This is also because the firm capital structure has
more debt component than equity components. The liability
structure is such that is laden with claim payment which can
occur unprecedented. This has also made regulatory
agencies to specify where insurance firms can place their
investment and in what percentage they will divide them
among varied securities in the financial market. This is to
enable them meet their obligation if the need arise to make
payment in assuaging the occurrence of a particular risk
insured against.
4.3 Presentation and Analysis of the Ordinary Least Square Estimation
Table 4.3: Regression Results of the Relationships between Financial Performance and Insurance Firm’s Capital Structure
Dependent Variable: ROE
Method: Least Squares
Date: 06/04/17 Time: 15:28
Sample: 1 179
Included observations: 179
Variable Coefficient Std. Error t-Statistic Prob.
DER 0.144372 0.039054 3.696710 0.0003
DAR -0.791904 0.163791 -4.834854 0.0000
DBT 3.44E-05 8.25E-06 4.169077 0.0000
EQT 3.42E-05 8.21E-06 4.164599 0.0000
PAT 3.64E-07 2.90E-07 1.254384 0.2114
TAS -3.43E-05 8.22E-06 -4.168055 0.0000
C 0.191767 0.056629 3.386359 0.0009
R-squared 0.127120 Mean dependent var 0.004029
Adjusted R-squared 0.096671 S.D. dependent var 0.403188
S.E. of regression 0.383204 Akaike info criterion 0.957823
Sum squared resid 25.25742 Schwarz criterion 1.082470
Log likelihood -78.72520 Hannan-Quinn criter. 1.008367
F-statistic 4.174824 Durbin-Watson stat 1.606792
Prob(F-statistic) 0.000605
Source: EView Output, 2018.
The ordinary least square estimation results revealed that
debt in relation to equity is statistically significant in
explaining variation in changes in the firms return on equity
at 1% level of statistical significance. Also, debt in relation
to assets is also significant in explaining changes in ROE.
The model specifying this relationship as reflected by the R-
squared accounted for 12.7120% of the systematic variation
in ROE. On the overall statistical significance of the model,

“Capital Structure and Firms Financial Performance in Nigeria Quoted Insurance Companies”
1536 EKWUEME, .C. Mercilina1, AFMJ Volume 3 Issue 05 May 2018
the F – statistic shows that the model is statistically
significant at 5% level of significance. The Durbin Watson
statistic value of 1.606792 shows that there is no serial
correlation in the model hence, we can rely on the
estimation output as it will not generate spurious results.
Debt in relation to assets shows negative relationship to the
firms return on equity.
Below is the mathematical expression of the model
used in the study:
ROE = 0.144372036834*DER - 0.791903822465*DAR +
3.43757812808E-05*DBT + 3.4178547767E-05*EQT +
3.64346214137E-07*PAT - 3.42612929902E-05*TAS +
0.191766643102
4.4 Discussion of Findings
After analysis the results revealed that, There is a very weak
relationship between return on equity and the insurance
Firms capital structure whether in relation to assets or in
relation to equity. Also the Firms capital structure
components are significant in determining variation are
significant in determining variation in the firms variation in
the firms return on equity value. Debt in relation to assets is
more related to the firms return on equity because of assets
utilization. Lastly Debt in relation to equity has a negative
relationship with return on equity of the firm in the
insurance industry f the financial sector.
All these findings are in one way or the other
consistent with, Uwalomwa & Uadiale (2012), which
concludes in their study that employing high proportion of
long –term debt in firms capital structure will invariably
result in low financial performance of a firm. Lucy Muathe
& George (2014) that concluded, managers of listed Non-
Financial Companies should reduce the reliance on long
term debt as a source of finance. Krishnan and Moyer
(1997), the result concludes that there is a negative and
significant impact of total equity (TD/TE) on return on
equity (ROE). Niway (2016), which concludes in their study
that there is a significant negative relationship between
capital structure ratios (short term debt,long term debt, and
total debt ratios) financial performance by (ROA) and
(ROE). Gleason, Mathur & Mathur (2000), concludes in
their study that firms capital structure has a negative and
significant impact on firms performance measures return on
assets (ROA), Growth in sales (Gsales), and pre-tax income
(Ptax), therefore, high levels of debt in the capital structure
would decrease the firms performance. But contrary to the
views of Schiantarelli & Sembenelli (1999), which
concludes in their study that there is a positive relationship
between initial debt maturity and medium term performance.
Mubeen & Kalsoom (2014), which concludes that there is a
significant positive relationship between capital structure
and firms financial performance and shareholders wealth in
textile sector in Pakistan.
5.0. SUMMARY OF FINDINGS, CONCLUSION AND
RECOMMENDATIONS
5.1 Summary of findings
The following are the findings of the study:
1. That there is a very weak relationship between
return on equity and the insurance firms capital
structure whether in relation to assets or in relation
to equity.
2. That on a general note, the firm’s capital structure
components are significant in determining variation
in the firms return on equity value.
3. That debt in relation to assets is more related to the
firms return on equity because of assets utilization
capacity.
4. Debt in relation to equity has a negative
relationship with return on equity of the firm in the
insurance industry of the financial sector.
5.2 Conclusion
Based on the findings above, the following are the
conclusions of the study:
Firstly, both empirical and statistical evidence on
the impact of capital structure on the performance indicator
namely return on assets and in the Nigerian Quoted
insurance companies have significant effect on the quoted
insurance firms’ performance.
Secondly, the study also concludes that Nigerian
Quoted insurance companies have performed remarkably
well within the period of the study 2010-2016. This may be
because of the technological advancements globally.
Finally, the study represents a pioneering attempt in
assessing the impact of capital structure on the performance
of Nigerian Quoted insurance companies looking at
performance from the perspective return on assets.
5.3 Recommendations
Based on the conclusions, the following recommendations
are proffered by the study;
1. The study recommends that Quoted insurance
companies should try to improve their Return on
Equity, because any change in their gearing ratio
may cause change in their Return on Equity, either
positively or negatively due to the insignificant
positive relationship existing between the two
variables.
2. The study also recommends that since positive
relationship exists between Return on Capital
Employed and Long Term Debt to Capitalization,
the management of insurance firms industry
should improve their Return on Capital Employed
through proper and judicious use of the capital
available to them so as to have a general
improvement on their performance.
REFERENCES
1. Akinsulire.O. (2011). Financial Management.
Lagos: Ceemol Nigeria ltd

“Capital Structure and Firms Financial Performance in Nigeria Quoted Insurance Companies”
1537 EKWUEME, .C. Mercilina1, AFMJ Volume 3 Issue 05 May 2018
2. Barclay, M. & C.W. Smith (2005). The Capital
Structure Puzzle: Another look at theevidence.
Journal of Applied Corporate Finance, 12, 8-20.
3. Babalola, Y. A. (2012). The effects of Optimal
Capital Structure on Firms’ Performances in
Nigeria. Journal of Emerging Trends in Economics
and Management Sciences (JETEMS) 3(2), 131-
133
4. Brennan, M. J & Schwartz, E. S (1978). Corporate
Income Taxes, Valuation and the Problem of
Capital Structure. The Journal of Business,
51(1):103-114
5. Boodhoo, R. (2009). Capital structure & ownership
structure: a review of literature. The Journal of
Online Education, January Edition, 1- 8.
6. Dadson, A., & Jamil, B., (2012). Capital Structure
and Performance of Listed Banks in Ghana. Global
Journal of Human Social Science, 12(5):57-62.
7. Damodaran, (2001). Corporate Finance: Theory
and Practice (2nd Ed). New York: Wiley
8. Dare F.O.& Sola.O (2010) Capital structure and
Corporate Performance in Nigeria Petrolum
Industry: Panel Data analysis . Journal of
Mathematics and Statistics 6(2): 168-173
9. Gaud, P., Jani, E., Hoesli, M., & Bender, A. (2005).
The capital structure of Swiss companies: An
empirical analysis using dynamic panel data.
European Financial Management, 11, 51-69.
10. Gleason, K.C. Mathur, L.K. &Mathur, I.
(2000).The interrelationship between culture,
capital structure & performance: evidence from
European retailers. Journal of Business Research,
50, 185- 191.
11. Harris M. &Raviv.A. (1991).The Theory of Capital
Structure. The Journal of Finance, 46, 297-355.
12. Jensen. M. &Meckling (1976). Theory of the Firm:
Managerial Behaviour, Agency Costs &Ownership
Structure, Journal of Financial Economics 3.
13. Krishnan, V.S. & Moyer, R.C (1997).Performance,
capital structure & home country: an analysis of
Asian corporations. Global Finance Journal, 8,
129- 143.
14. Kibrom M. (2010) The determinants of Capital
Structure: Evidence from Commercial banks in
Ethiopia, M.SC thesis, College of Business and
Economics, Mekelle University.
15. Lucy W. M.; Muathe S. M. & George K. (2014)
Relationship between Capital Structure and
Performance of Non-Financial Companies Listed
In the Nairobi Securities Exchange, Kenya Global
Journal of Contemporary Research in Accounting,
Auditing and Business Ethics (GJCRA) An Online
International Research Journal (ISSN: 2311-3162)
1 (2) 72-90
16. Myers, S. C. (1977). Determinants of Corporate
Borrowing. Journal of Financial Economics, 5,
147–175.
17. Muhammad U. Zaighum T. Saeed A. &
Muhammad S. (2012) Impact of Capital Structure
on Firms’ Financial Performance: Evidence from
Pakistan Research Journal of Finance and
Accounting www.iiste.org ISSN 2222-1697 (Paper)
ISSN 2222-2847 (Online) 3 (9), 1-12
18. Mathewos W.B.(2016) The Impact of Capital
Structure on Financial Performance of Commercial
Banks in Ethiopia Global Journal of Management
and Business Research: C Finance 16 (8) 43-52
19. Mubeen M & Kalsoom A (2014) Impact of Capital
Structure on Firms Financial Performance and
Shareholders Wealth: Textile Sector of Pakistan
International Journal of Learning & Development
ISSN 2164-4063 , 4 ( 2) 27-33
20. Niway A. A. (2016) The Impact of Capital
Structure Choice on Firms’ Financial Performance:
Evidence from Manufacturing PLCs in Tigrai
Region, Ethiopia Research Journal of Finance and
Accounting www.iiste.org ISSN 2222-1697 (Paper)
ISSN 2222-2847 (Online)7 (15): 31-38
21. Ong, T. S., & Teh, B. H. (2011). Capital structure
and corporate performance of Malaysian
construction sector. International Journal of
Humanities and Social Science, 1(2), 28-36.
22. Onaolapo, A. A. & Kajola, S. O. (2010). Capital
Structure and Firm Performance: Evidence from
Nigeria. European Journal of Economics, Finance
and Administrative Sciences, Issue 25:70-77.
23. Olowolaju, P. S. (2013). Nigeria Ailing Industries
and the Capital Structure Theory: A Need for
Concern (A Case Study of SMEs in Nigeria Textile
Industry). Journal of Management Policy, 12(69),
140 –153
24. Osuji, C.C., & Odita, A. (2012). impact of capital
structure on the financial performance of Nigerian
firms , Arabian Journal of Business and
Management Review (OMAN Chapter) 1(12) :43-
61.
25. Rajan, R. G., & Zingales, L. (1995). What Do We
Know about Capital Structure ? Some Evidence
from International Data. The Journal of Finance,
50(5), 1421–1460.
26. Schiantarelli, F.,& A. Sembenelli, (1999), The
Maturity Structure of Debt: Determinants and
Effects on Firms’ Performance? Evidence from the
United Kingdom and Italy, Policy Research
Working Paper Series, The World Bank.
27. Stohs, M. H., & Mauer, D. C. (1996), The
Determinants of Corporate Debt Maturity
Structure, Journal of Business 69, 279-312.
28. Song H.S (2005) Capital structure determinants:
An empirical study of Swedish Companies.

“Capital Structure and Firms Financial Performance in Nigeria Quoted Insurance Companies”
1538 EKWUEME, .C. Mercilina1, AFMJ Volume 3 Issue 05 May 2018
International Ph.D Workshop “ Innovation
Entrepreneurship and Growth” Royal Institute of
Technology, Stockholm
29. Sheikh, N.A & Wang, Z. (2013). The Impact of
Capital Structure on Performance: An Empirical
Study of Non-Financial Listed Firms in Pakistan.
International Journal of Commerce and
Management, 23 (4):354-368.
30. Tharmila, K. Arulvel K.K (2013) The impact of
capital structure and financial performance: A
study of the Listed Companies traded in Colombo
Stock Exchange. Journal of Accounting, Auditing,
Economics and Finance, 1(5): 106-117
31. Ubesie M .C (2016) The effect of capital structure
on the financial performance of Nigerian Quoted
Conglomerates. European Journal of Accounting,
Auditing and Finance Research 4(6),61-69
32. Uwalomwa, U., & Uadiale, O.M.(2012). An
Empirical Examination of the Relationship between
Capital Structure and the Financial Performance of
Firms in Nigeria, EuroEconomica, 1(31):57-65.
33. Varian F., Amer A.A Mohd R .A.Zatul K. A.
(2015) Capital Structure and Corporate
Performance: Panel Evidence from Oil and Gas
Companies in Malaysia International Journal of
Business Management and Economic Research
(IJBMER),6(6): 371-379
34. Weston J.F & Brigham .E. (1981) Managerial
Finance ( 7th
Ed) Hinsdale: Holt Rienehart and
Winston
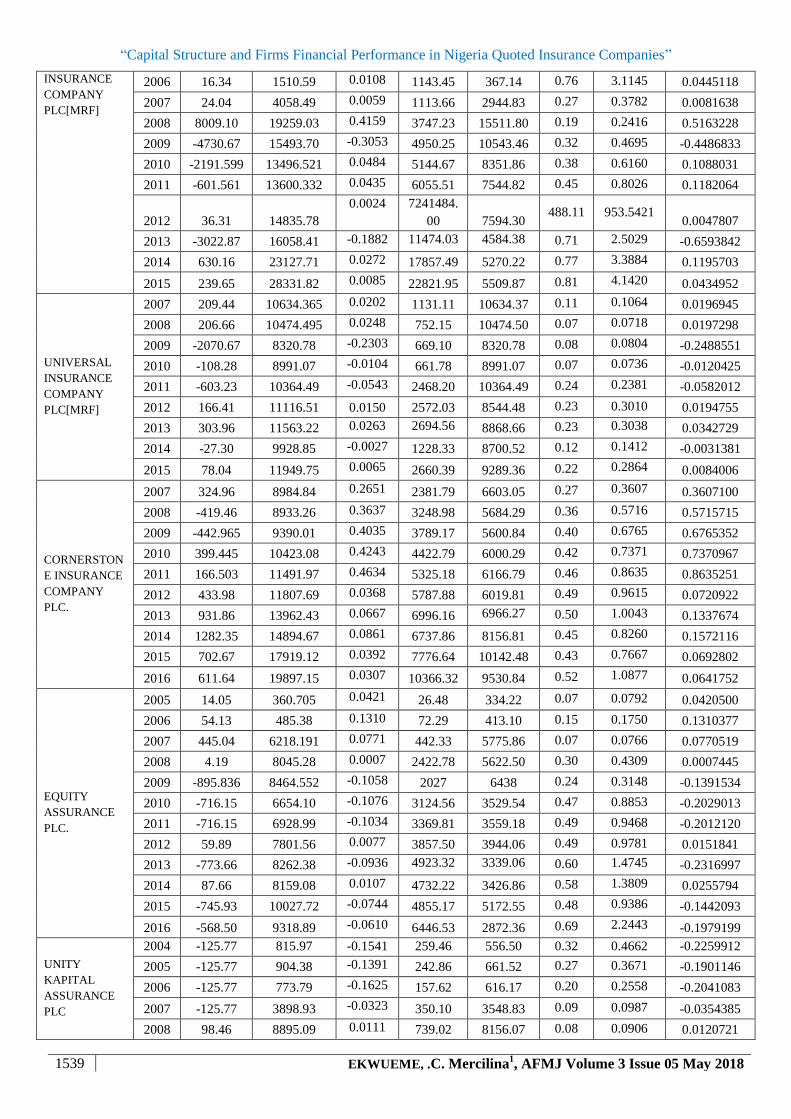
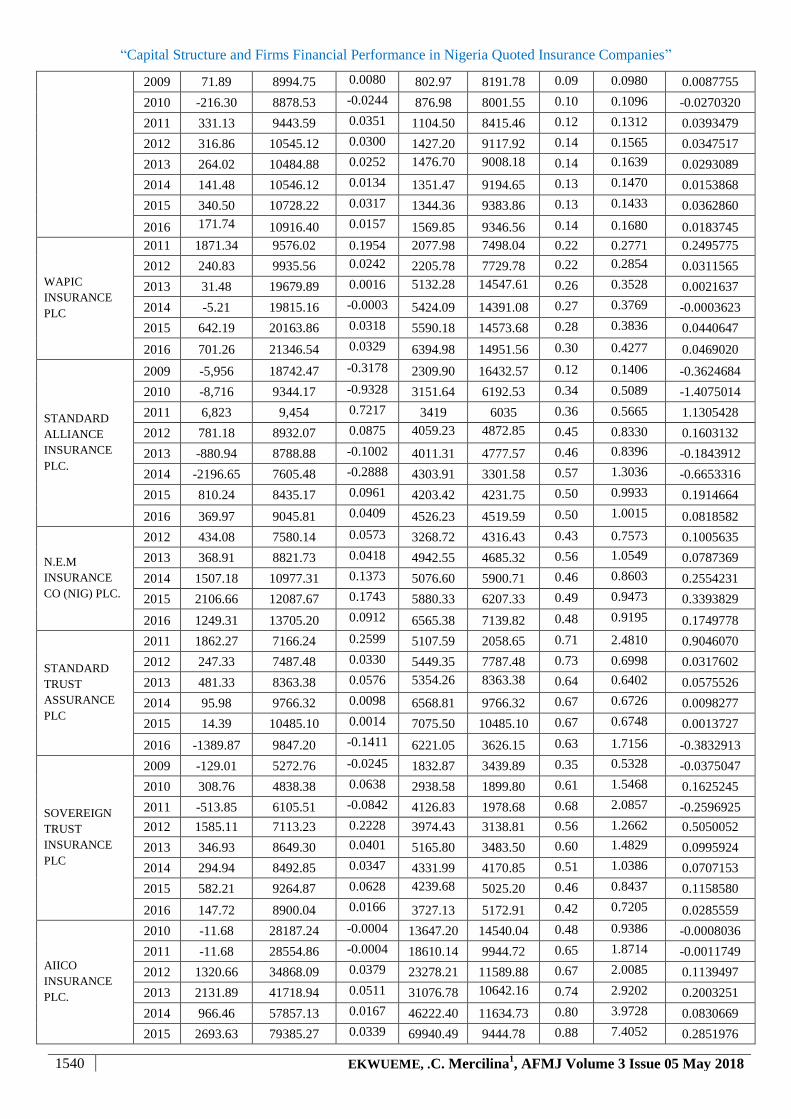
Appendix: Insurance Companies’ Data on Capital Structure and Financial Performance
Firm Name Year
PAT
(N'M)
Total Assets
(N'M) ROA
Total
Liabilitie
s (N'M)
Total
Equity
(Deficit)
(N'M)
Lever
age
(D/A)
Leverage
(D/E) ROE
AXA Mansard
Insurance plc
2002 -14.49 105.20 -0.1377 13.11 92.09 0.12 0.1424 -0.1573386
2003 -37.64 372.51 -0.1011 26.19 346.32 0.07 0.0756 -0.1086936
2004 -39.56 612.22 -0.0646 161.57 450.65 0.26 0.3585 -0.0877734
2005 27.38 3361.27 0.0081 260.02 3101.26 0.08 0.0838 0.0088284
2006 294.43 6181.64 0.0476 845.85 5335.79 0.14 0.1585 0.0551806
2007 821.24 7975.94 0.1030 1677.29 6298.66 0.21 0.2663 0.1303837
2008 1865.22 16474.14 0.1132 3958.78 12515.35 0.24 0.3163 0.1490346
2009 423.83 17012.84 0.0249 4491.08 12521.77 0.26 0.3587 0.0338471
2010 1114.88 20773.13 0.0537 6889.12 13884.01 0.33 0.4962 0.0802994
2011 930.44 24017.12 0.0387 9956.53 14060.59 0.41 0.7081 0.0661733
2012 1380.05 27288.05 0.0506 12870.26 14417.80 0.47 0.8927 0.0957187
2013 959.87 28789.78 0.0333 15265.15 13524.63 0.53 1.1287 0.0709717
2014 1236.80 34263.78 0.0361 20216.18 14047.59 0.59 1.4391 0.0880433
2015 466.10 37920.07 0.0123 22522.91 15397.16 0.59 1.4628 0.0302718
2016 892.22 40304.76 0.0221 25604.07 14700.69 0.64 1.7417 0.0606925
CONTINENTA
L
REINSURANC
E PLC
2004 127.20 4900.90 0.0260 2401.70 1839 0.49 1.3058 0.0408806
2005 155.00 5718.20 0.0271 3111.50 1882.80 0.54 1.6526 0.0823242
2006 293.10 6345.20 0.0462 3503.90 2054.20 0.55 1.7057 0.1426833
2007 676.69 14159.65 0.0478 2344.38 11815.27 0.17 0.1984 0.0572722
2008 473.33 14353.59 0.0330 3219.26 11134.33 0.22 0.2891 0.0425104
2009 905.22 15644.81 0.0579 4475.19 11169.62 0.29 0.4007 0.0810428
2010 908.71 18791.10 0.0484 7171.65 11619.46 0.38 0.6172 0.0782057
2011 891.85 20495.59 0.0435 8540.44 11955.15 0.42 0.7144 0.0745993
2012 1284.78 24049.44 0.0534 10814.07 13235.37 0.45 0.8171 0.0970716
2013 1753.40 26125.41 0.0671 11839.92 14285.49 0.45 0.8288 0.1227399
2014 855.64 28207.64 0.0303 13431.26 14776.38 0.48 0.9090 0.0579062
2015 2142.79 26668.73 0.0803 14131.54 15537.19 0.53 0.9095 0.1379135
AFRICAN
ALLIANCE
2004 -1789.00 1059.74 -1.6881 2669.90 1059.74 2.52 2.5194 -1.6881499
2005 -5542.00 1464.30 -3.7847 1080.82 1464.30 0.74 0.7381 -3.7847384
“Capital Structure and Firms Financial Performance in Nigeria Quoted Insurance Companies”
1539 EKWUEME, .C. Mercilina1, AFMJ Volume 3 Issue 05 May 2018
INSURANCE
COMPANY
PLC[MRF]
2006 16.34 1510.59 0.0108 1143.45 367.14 0.76 3.1145 0.0445118
2007 24.04 4058.49 0.0059 1113.66 2944.83 0.27 0.3782 0.0081638
2008 8009.10 19259.03 0.4159 3747.23 15511.80 0.19 0.2416 0.5163228
2009 -4730.67 15493.70 -0.3053 4950.25 10543.46 0.32 0.4695 -0.4486833
2010 -2191.599 13496.521 0.0484 5144.67 8351.86 0.38 0.6160 0.1088031
2011 -601.561 13600.332 0.0435 6055.51 7544.82 0.45 0.8026 0.1182064
2012 36.31 14835.78
0.0024 7241484.
00 7594.30 488.11 953.5421
0.0047807
2013 -3022.87 16058.41 -0.1882 11474.03 4584.38 0.71 2.5029 -0.6593842
2014 630.16 23127.71 0.0272 17857.49 5270.22 0.77 3.3884 0.1195703
2015 239.65 28331.82 0.0085 22821.95 5509.87 0.81 4.1420 0.0434952
UNIVERSAL
INSURANCE
COMPANY
PLC[MRF]
2007 209.44 10634.365 0.0202 1131.11 10634.37 0.11 0.1064 0.0196945
2008 206.66 10474.495 0.0248 752.15 10474.50 0.07 0.0718 0.0197298
2009 -2070.67 8320.78 -0.2303 669.10 8320.78 0.08 0.0804 -0.2488551
2010 -108.28 8991.07 -0.0104 661.78 8991.07 0.07 0.0736 -0.0120425
2011 -603.23 10364.49 -0.0543 2468.20 10364.49 0.24 0.2381 -0.0582012
2012 166.41 11116.51 0.0150 2572.03 8544.48 0.23 0.3010 0.0194755
2013 303.96 11563.22 0.0263 2694.56 8868.66 0.23 0.3038 0.0342729
2014 -27.30 9928.85 -0.0027 1228.33 8700.52 0.12 0.1412 -0.0031381
2015 78.04 11949.75 0.0065 2660.39 9289.36 0.22 0.2864 0.0084006
CORNERSTON
E INSURANCE
COMPANY
PLC.
2007 324.96 8984.84 0.2651 2381.79 6603.05 0.27 0.3607 0.3607100
2008 -419.46 8933.26 0.3637 3248.98 5684.29 0.36 0.5716 0.5715715
2009 -442.965 9390.01 0.4035 3789.17 5600.84 0.40 0.6765 0.6765352
2010 399.445 10423.08 0.4243 4422.79 6000.29 0.42 0.7371 0.7370967
2011 166.503 11491.97 0.4634 5325.18 6166.79 0.46 0.8635 0.8635251
2012 433.98 11807.69 0.0368 5787.88 6019.81 0.49 0.9615 0.0720922
2013 931.86 13962.43 0.0667 6996.16 6966.27 0.50 1.0043 0.1337674
2014 1282.35 14894.67 0.0861 6737.86 8156.81 0.45 0.8260 0.1572116
2015 702.67 17919.12 0.0392 7776.64 10142.48 0.43 0.7667 0.0692802
2016 611.64 19897.15 0.0307 10366.32 9530.84 0.52 1.0877 0.0641752
EQUITY
ASSURANCE
PLC.
2005 14.05 360.705 0.0421 26.48 334.22 0.07 0.0792 0.0420500
2006 54.13 485.38 0.1310 72.29 413.10 0.15 0.1750 0.1310377
2007 445.04 6218.191 0.0771 442.33 5775.86 0.07 0.0766 0.0770519
2008 4.19 8045.28 0.0007 2422.78 5622.50 0.30 0.4309 0.0007445
2009 -895.836 8464.552 -0.1058 2027 6438 0.24 0.3148 -0.1391534
2010 -716.15 6654.10 -0.1076 3124.56 3529.54 0.47 0.8853 -0.2029013
2011 -716.15 6928.99 -0.1034 3369.81 3559.18 0.49 0.9468 -0.2012120
2012 59.89 7801.56 0.0077 3857.50 3944.06 0.49 0.9781 0.0151841
2013 -773.66 8262.38 -0.0936 4923.32 3339.06 0.60 1.4745 -0.2316997
2014 87.66 8159.08 0.0107 4732.22 3426.86 0.58 1.3809 0.0255794
2015 -745.93 10027.72 -0.0744 4855.17 5172.55 0.48 0.9386 -0.1442093
2016 -568.50 9318.89 -0.0610 6446.53 2872.36 0.69 2.2443 -0.1979199
UNITY
KAPITAL
ASSURANCE
PLC
2004 -125.77 815.97 -0.1541 259.46 556.50 0.32 0.4662 -0.2259912
2005 -125.77 904.38 -0.1391 242.86 661.52 0.27 0.3671 -0.1901146
2006 -125.77 773.79 -0.1625 157.62 616.17 0.20 0.2558 -0.2041083
2007 -125.77 3898.93 -0.0323 350.10 3548.83 0.09 0.0987 -0.0354385
2008 98.46 8895.09 0.0111 739.02 8156.07 0.08 0.0906 0.0120721
“Capital Structure and Firms Financial Performance in Nigeria Quoted Insurance Companies”
1540 EKWUEME, .C. Mercilina1, AFMJ Volume 3 Issue 05 May 2018
2009 71.89 8994.75 0.0080 802.97 8191.78 0.09 0.0980 0.0087755
2010 -216.30 8878.53 -0.0244 876.98 8001.55 0.10 0.1096 -0.0270320
2011 331.13 9443.59 0.0351 1104.50 8415.46 0.12 0.1312 0.0393479
2012 316.86 10545.12 0.0300 1427.20 9117.92 0.14 0.1565 0.0347517
2013 264.02 10484.88 0.0252 1476.70 9008.18 0.14 0.1639 0.0293089
2014 141.48 10546.12 0.0134 1351.47 9194.65 0.13 0.1470 0.0153868
2015 340.50 10728.22 0.0317 1344.36 9383.86 0.13 0.1433 0.0362860
2016 171.74 10916.40 0.0157 1569.85 9346.56 0.14 0.1680 0.0183745
WAPIC
INSURANCE
PLC
2011 1871.34 9576.02 0.1954 2077.98 7498.04 0.22 0.2771 0.2495775
2012 240.83 9935.56 0.0242 2205.78 7729.78 0.22 0.2854 0.0311565
2013 31.48 19679.89 0.0016 5132.28 14547.61 0.26 0.3528 0.0021637
2014 -5.21 19815.16 -0.0003 5424.09 14391.08 0.27 0.3769 -0.0003623
2015 642.19 20163.86 0.0318 5590.18 14573.68 0.28 0.3836 0.0440647
2016 701.26 21346.54 0.0329 6394.98 14951.56 0.30 0.4277 0.0469020
STANDARD
ALLIANCE
INSURANCE
PLC.
2009 -5,956 18742.47 -0.3178 2309.90 16432.57 0.12 0.1406 -0.3624684
2010 -8,716 9344.17 -0.9328 3151.64 6192.53 0.34 0.5089 -1.4075014
2011 6,823 9,454 0.7217 3419 6035 0.36 0.5665 1.1305428
2012 781.18 8932.07 0.0875 4059.23 4872.85 0.45 0.8330 0.1603132
2013 -880.94 8788.88 -0.1002 4011.31 4777.57 0.46 0.8396 -0.1843912
2014 -2196.65 7605.48 -0.2888 4303.91 3301.58 0.57 1.3036 -0.6653316
2015 810.24 8435.17 0.0961 4203.42 4231.75 0.50 0.9933 0.1914664
2016 369.97 9045.81 0.0409 4526.23 4519.59 0.50 1.0015 0.0818582
N.E.M
INSURANCE
CO (NIG) PLC.
2012 434.08 7580.14 0.0573 3268.72 4316.43 0.43 0.7573 0.1005635
2013 368.91 8821.73 0.0418 4942.55 4685.32 0.56 1.0549 0.0787369
2014 1507.18 10977.31 0.1373 5076.60 5900.71 0.46 0.8603 0.2554231
2015 2106.66 12087.67 0.1743 5880.33 6207.33 0.49 0.9473 0.3393829
2016 1249.31 13705.20 0.0912 6565.38 7139.82 0.48 0.9195 0.1749778
STANDARD
TRUST
ASSURANCE
PLC
2011 1862.27 7166.24 0.2599 5107.59 2058.65 0.71 2.4810 0.9046070
2012 247.33 7487.48 0.0330 5449.35 7787.48 0.73 0.6998 0.0317602
2013 481.33 8363.38 0.0576 5354.26 8363.38 0.64 0.6402 0.0575526
2014 95.98 9766.32 0.0098 6568.81 9766.32 0.67 0.6726 0.0098277
2015 14.39 10485.10 0.0014 7075.50 10485.10 0.67 0.6748 0.0013727
2016 -1389.87 9847.20 -0.1411 6221.05 3626.15 0.63 1.7156 -0.3832913
SOVEREIGN
TRUST
INSURANCE
PLC
2009 -129.01 5272.76 -0.0245 1832.87 3439.89 0.35 0.5328 -0.0375047
2010 308.76 4838.38 0.0638 2938.58 1899.80 0.61 1.5468 0.1625245
2011 -513.85 6105.51 -0.0842 4126.83 1978.68 0.68 2.0857 -0.2596925
2012 1585.11 7113.23 0.2228 3974.43 3138.81 0.56 1.2662 0.5050052
2013 346.93 8649.30 0.0401 5165.80 3483.50 0.60 1.4829 0.0995924
2014 294.94 8492.85 0.0347 4331.99 4170.85 0.51 1.0386 0.0707153
2015 582.21 9264.87 0.0628 4239.68 5025.20 0.46 0.8437 0.1158580
2016 147.72 8900.04 0.0166 3727.13 5172.91 0.42 0.7205 0.0285559
AIICO
INSURANCE
PLC.
2010 -11.68 28187.24 -0.0004 13647.20 14540.04 0.48 0.9386 -0.0008036
2011 -11.68 28554.86 -0.0004 18610.14 9944.72 0.65 1.8714 -0.0011749
2012 1320.66 34868.09 0.0379 23278.21 11589.88 0.67 2.0085 0.1139497
2013 2131.89 41718.94 0.0511 31076.78 10642.16 0.74 2.9202 0.2003251
2014 966.46 57857.13 0.0167 46222.40 11634.73 0.80 3.9728 0.0830669
2015 2693.63 79385.27 0.0339 69940.49 9444.78 0.88 7.4052 0.2851976

“Capital Structure and Firms Financial Performance in Nigeria Quoted Insurance Companies”
1541 EKWUEME, .C. Mercilina1, AFMJ Volume 3 Issue 05 May 2018
2016 3043.23 85095.88 0.0358 74881.57 9866.32 0.88 7.5896 0.3084462
MUTUAL
BENEFITS
ASSURANCE
PLC.[AWR]
2010 -2729.37 8751.09
-0.3119 5465.497
0 3285.59 0.62
1.6635
-0.8307086
2011 -2729.37 11470.16
-0.2380 7299.092
0 4171.06 0.64
1.7499
-0.6543577
2012 -2729.37 13893.81 -0.1964 8909.47 4984.34 0.64 1.7875 -0.5475892
2013 574.87 14448.21 0.0398 11143.33 3304.88 0.77 3.3718 0.1739458
2014 2243.77 14488.60 0.1549 8939.95 5548.65 0.62 1.6112 0.4043810
2015 652.61 15798.73 0.0413 9597.47 6201.26 0.61 1.5477 0.1052387
2016 -1203.86 17436.43 -0.0690 12439.03 4997.40 0.71 2.4891 -0.2408967
LINKAGE
ASSURANCE
PLC
2011 220.69 10515.02 0.0210 2280.86 8234.16 0.22 0.2770 0.0268019
2012 47.32 16823.86 0.0028 2100.11 14723.75 0.12 0.1426 0.0032139
2013 414.28 17738.50 0.0234 2370.54 15367.96 0.13 0.1543 0.0269575
2014 325.00 17976.22 0.0181 2388.53 15587.69 0.13 0.1532 0.0208496
2015 512.25 19492.24 0.0263 3182.84 16309.39 0.16 0.1952 0.0314081
2016 616.10 21264.78 0.0290 4339.29 16925.49 0.20 0.2564 0.0364006
NIGER
INSURANCE
CO. PLC.[MRF]
2012 470.17 21732.48 0.0216 14161.66 7086.97 0.65 1.9983 0.0663435
2013 599.47 24181.64 0.0248 15466.96 7881.59 0.64 1.9624 0.0760598
2014 538.78 22214.61 0.0243 15756.69 7945.65 0.71 1.9831 0.0678076
2015 569.19 20386.50 0.0279 16128.59 8225.28 0.79 1.9609 0.0692001
2016 -435.34 20713.83 -0.0210 12925.84 7788.00 0.62 1.6597 -0.0558992
LASACO
ASSURANCE
PLC.
2012 -198.70 11838.26 -0.0168 6240.90 5597.36 0.53 1.1150 -0.0354993
2013 275.34 13412.74 0.0205 7536.82 5875.92 0.56 1.2827 0.0468591
2014 445.75 14240.34 0.0313 7822.25 6418.09 0.55 1.2188 0.0694513
2015 283.32 16133.43 0.0176 9554.65 6578.80 0.59 1.4523 0.0430656
2016 715.39 17455.59 0.0410 10127.69 7327.90 0.58 1.3821 0.0976257
REGENCY
ALLIANCE
INSURANCE
COMPANY
PLC
2011 -21.02 4504.43 -0.0047 870.07 3634.36 0.19 0.2394 -0.0057823
2012 386.79 5162.89 0.0749 1452.40 3710.49 0.28 0.3914 0.1042412
2013 403.60 5976.55 0.0675 1862.45 4114.10 0.31 0.4527 0.0981025
2014 294.91 6319.86 0.0467 1976.21 4343.65 0.31 0.4550 0.0678941
2015 333.33 6726.54 0.0496 2053.02 4673.52 0.31 0.4393 0.0713229
2016 470.33 6798.83 0.0692 1855.04 4943.79 0.27 0.3752 0.0951364
GUINEA
INSURANCE
PLC.
2011 -438.59 3738.69 -0.1173 1246.45 2492.24 0.33 0.5001 -0.1759831
2012 52.76 3958.15 0.0133 1396.14 2562.01 0.35 0.5449 0.0205940
2013 39.84 4213.96 0.0095 1231.01 2982.95 0.29 0.4127 0.0133542
2014 81.90 4564.73 0.0179 1668.30 2896.43 0.37 0.5760 0.0282755
2015 7.23 4116.10 0.0018 1216.15 2899.95 0.30 0.4194 0.0024921
2016 43.45 3969.88 0.0109 1026.47 2943.40 0.26 0.3487 0.0147615
CONSOLIDAT
ED
HALLMARK
INSURANCE
PLC
2012 239.50 6664.33 0.0359 2647.47 4016.86 0.40 0.6591 0.0596231
2013 200.56 6130.36 0.0327 2500.61 3629.75 0.41 0.6889 0.0552532
2014 193.08 6111.85 0.0316 2297.05 3814.80 0.38 0.6021 0.0506126
2015 545.81 6964.21 0.0784 2735.13 4229.08 0.39 0.6467 0.1290615
2016 176.41 7865.79 0.0224 3461.95 4403.84 0.44 0.7861 0.0400572
PRESTIGE
ASSURANCE
CO. PLC.
2009 0.58 6.94 0.0842 2.5942 4.3437 0.37 0.5972 0.1345448
2010 0.48 6.43 0.0746 3.3902 3.0359 0.53 1.1167 0.1579327
2011 -0.03 6.15 -0.0056 3.3868 2.7667 0.55 1.2241 -0.0125381
2012 0.61 9.72 0.0631 5.83 3.89 0.60 1.4996 0.1576413

“Capital Structure and Firms Financial Performance in Nigeria Quoted Insurance Companies”
1542 EKWUEME, .C. Mercilina1, AFMJ Volume 3 Issue 05 May 2018
2013 -0.09 10.13 -0.0090 5.72 4.41 0.56 1.2963 -0.0205821
2014 0.01 11.89 0.0012 7.32 4.58 0.62 1.5991 0.0031002
2015 -0.15 10.37 -0.0140 4.38 5.99 0.42 0.7303 -0.0242489
2016 0.10 9.83 0.0101 3.55 9.83 0.36 0.3613 0.0101366
LAW UNION
AND ROCK
INSURANCE
PLC
2008 -93040.00 5816114.00
-0.0160 2169150.
00
3656964.0
0 0.37
0.5932
-0.0254419
2009 294549.00 6866703.00
0.0429 2328881.
00
4537822.0
0 0.34
0.5132
0.0649098
2010 360922.00 7367038.00
0.0490 2601608.
00
4765430.0
0 0.35
0.5459
0.0757376
2011 249620.00 7555543.00
0.0330 2790225.
00
4765318.0
0 0.37
0.5855
0.0523827
2012
-
1337180.0
0 6617479.00
-0.2021
3094979.
00
3522500.0
0
0.47
0.8786
-0.3796111
2013 485432.00 6908473.00
0.0703
2736273
4172200.0
0 0.40
0.6558
0.1163492
2014 125435.00 7,293,571
0.0172 3111152.
00
4182419.0
0 0.43
0.7439
0.0299910
2015 280919.00 8273420.00
0.0340 3814755.
00
4458665.0
0 0.46
0.8556
0.0630052
SOURCE: ANNUAL REPORTS AND ACCOUNTS OF VARIOUS YEARS FOR VARIOUS