
ASSET MANAGEMENT PLAN - Powerco
248
ASSET MANAGEMENT PLAN ELECTRICITY NETWORKS FY2010 – FY2019 1 INFORMATION DISCLOSURE FOR ELECTRICITY NETWORKS 2010–2019 ASSET MANAGEMENT PLAN
Transcript of ASSET MANAGEMENT PLAN - Powerco

ASSET MANAGEMENT PLAN ELECTRICITY NETWORKS FY2010 – FY2019 1
INFORmATION DISCLOSURE FOR
ELECTRICITY NETWORKS
2010–2019
ASSET MANAGEMENT PLAN

ASSET MANAGEMENT PLAN ELECTRICITY NETWORKS FY2010 – FY2019
Disclaimer: This Asset Management Plan (AMP) is a high-level document providing Powerco Limited’s management and stakeholders with a broad overview of the company’s Asset Management policies, asset details, service levels, capital and maintenance works planning, expenditure forecasts, risk management and performance evaluation. It summarises the content of other plans prepared for specific purposes, and is structured to comply with Section 24 of the Commerce Commission’s Electricity Information Disclosure Requirements 2004 (as amended 31 October 2008). The information in this document has been prepared in good faith and represents Powerco’s intentions and opinions at the date of issue. Powerco does not give any assurance, either express or implied, about the accuracy of the information or whether the company will actually implement the plan or undertake any work mentioned in the documents. None of Powerco Limited, its directors, officers, shareholders or representatives accepts any liability whatsoever by reason of, or in connection with, any information in this document or any actual or purported reliance on it by any person. Powerco may change any information in this document at any time.

ASSET MANAGEMENT PLAN ELECTRICITY NETWORKS FY2010 – FY2019 1
Chief Executive’s Statement
the reliability forecast from the April 2009 AMP (the dark red line) is compared to the updated reliability forecasts based on this years AMP expenditure (the light blue bars). The AMP commits to an additional annual $5.5 million capital expenditure, growing to $6.7 million by 2020.
The increase in expenditure has been made possible by the outcome of the Default Price Path (which regulates Powerco’s revenue) effective from 1 April 2010. For the past six years, Powerco’s prices reduced 2% per annum in real terms. The new Default Price Path allows Powerco to maintain its prices in real terms. We look forward to the conclusion of the current regulatory development process to provide greater certainty for further investment decisions.
The magnitude of the investment needed in the network to renew an increasingly ageing network and increase the security of the core network is significant. Based on our analysis a further $17 million of annual expenditure is necessary to reduce the risk to reliability to an acceptable level.
Ave
rage
Age
Network Average Age and Forecast Capex
Total Capex Average Network Age Year (ending June)
Tota
l Cap
ex ($
m)
31
30
29
28
27
26
25
24$0
$20
$40
$60
$80
$100
$120
$140
2006
2007
2008
2009
2010
2011
2012
2013
2014
2015
2016
2017
2018
2019
2021
2020
Figure 2: Network Age and Forecast Capex
Figure 2 highlights the magnitude of the investment required. Even though capital expenditure has increased significantly, the network will continue to age without a further step-change increase in expenditure.
With that said, we have increased our focus on security, which is building redundancy into the core (or “backbone”) of the network. This will improve resilience (and hence reliability) and the network’s capacity to accommodate future growth.
Welcome to the 2010 Edition of our Asset Management Plan (AMP).
I am pleased to present the 2010 edition of our Asset Management Plan (AMP). The AMP is an important part of Powerco’s planning framework. It describes for our customers, shareholders, staff and partners how we will manage our electricity distribution network to meet the standards of reliability of electricity supply that our customers demand and the commercial performance that our shareholders expect.
Over the past 15 years, we have performed well in efficiently delivering a reliable electricity supply. In the past seven years, we have doubled our expenditure on the network. Significant expenditure has been directed towards renewals and maintenance, reflecting the increasing age of the network and the growing proportion of assets reaching the end of their useful lives. Despite this increased expenditure, reliability has remained static and the risk of breaching our reliability standards has materially increased. This issue is illustrated in Figure 1 where there is a widening gap between target (blue line) and forecast performance (the light blue bars).
Actual and Forecast SAIDI Reliability
SA
IDI (
Cla
ss B
+C
) min
utes
Year (Ending March)
100
150
200
250
300
350
Forecast Reliability (Apr-09 AMP Spend) Actual Reliability (excl. storms)
Forecast Reliability (Apr-10 AMP + 5% more work)Forecast Reliability (Apr-10 AMP Spend)
2019
2018
2017
2016
2015
2014
2013
2012
2011
2010
2009
2008
2007
2006
2005
2004
2003
Deterioriating reliability due to regulation constaining
expenditure (reduced)
Improvement due to increase in spend due to
CPI-0% threshold change
Improvement due to increased work done
for same money
Forecast Reliability (based on IR Spend)Target Reliability (AMP)
Regulatory ThresholdActual Reliability (incl. storms)
Figure 1: Actual and Forecast Reliability Performance
We take the risk to reliability very seriously and in this AMP we have committed to a further step-up in expenditure to minimise the risk to reliability. The resulting improvement (or perhaps better stated as “reducing the risk”) in reliability performance can be seen in Figure 1 where

2 ASSET MANAGEMENT PLAN ELECTRICITY NETWORKS FY2010 – FY2019
We also continue to develop a range of innovative solutions to improve reliability, and are looking to develop the foundations or “smart grid” technology and other solutions to maximise the utilisation of assets and service from those assets.
The most important outcome of our increased investment is that we will be better able to meet the demands of our customers and the requirements of regulators.
An Ageing Network and Increasing Demand for Reliable Electricity Supply
Powerco is New Zealand’s second largest electricity and gas distributor. We own and operate a large network of electricity distribution assets that delivers over 4,400 GWh of electricity through 27,400 km of lines and cables to more than 317,000 consumer connections in Coromandel; Hauraki Plains; Eastern and Southern Waikato; Western Bay of Plenty (including Tauranga); Taranaki; Wanganui; Rangitikei; Tararua; Manawatu and Wairarapa.
The demand for reliable electricity supply in our markets has continued despite the recent recession. We expect this demand to continue to grow, particularly as the intensification and reliance on technology in rural areas increases.
As the recession (and the global financial crisis) had little impact on our growth, the expenditure reductions foreshadowed in the 2009 edition of the AMP will not be occurring. If future growth is significantly higher than expected, particularly in areas where there is already limited redundancy, then this will require increased investment, only a small part of which is contributed to by the new or upgrading customer.
The need for increased expenditure to replace assets was confirmed by independent consultants Farrier Swier Consulting in its report to the Commerce Commission on electricity distribution network asset management. Farrier Swier found that Powerco may need to increase renewal expenditure in the period 2009 to 2014 by 27% (to $30 million in 2012) and, 2014 to 2019 by 71% (to $44 million in 2017).
A Plan for Focused Investment in Security, Capacity and Reliability
As I mentioned at the start, the AMP is an important part of the business planning framework. We are committed to pursuing the following electricity Asset Management-related strategies:
1. Renewal and modernisation;
2. Increasing the redundancy of the core network;
3. Standardisation of systems and processes; and
4. Development of Smart Network.
Renewal and Modernisation
Modernisation of the network involves the replacement and a updating of our aged assets. The increase in renewal expenditure is described in the following graph.
Infla
tion
Ind
ex
Asset Renewal Capital & Operational Expenditure
Asset Replacement and Renewal Refurbishment and Renewal MaintenanceInflation Index
Year (ending June)
Nom
inal
Exp
end
iture
($00
0)
0
2.000
1.750
1.500
1.250
1.000
0.750
0.500
0.250
0
10
20
30
40
50
60
70
80
2006
A
2007
A
2008
A
2009
B
2010
F
2011
F
2012
F
2013
F
2014
F
2015
F
2016
F
2017
F
2018
F
2019
F
2021
F
2020
F
Figure 3: Actual and Forecast Asset Renewal Capital and Maintenance Expenditure
Increasing the Redundancy of the Core Network
Increasing the redundancy of the core network involves increasing zone substation capacity and installing more network automation, such as auto reclosers and earth fault neutralisers. Currently, the level of zone substation utilisation is about 57% and, without investment in zone substation capacity utilisation, will increase to about 64% in 2014. To increase zone substation capacity we have identified the potential for 17 zone substations to be built and 20 additional transformer banks to be installed at existing substations over the next 10 years.
Standardisation
Standardisation of systems and processes is a key strength of Powerco’s employees and it has been a significant focus for management. As a result, we have been able to develop a common maintenance management system and a suite of information system projects directed at improving processes.

ASSET MANAGEMENT PLAN ELECTRICITY NETWORKS FY2010 – FY2019 3
There has also been continuing development of design, construction and maintenance standards, which lead to lower risk profiles in the network and less reliance on the skill levels of field staff. Further investment in the standardisation of systems and processes will allow us to extend asset lives.
We also recognise that although Powerco has demonstrated strong capability in our Asset Management processes compared with our peers in New Zealand, our processes and systems compare less favourably with Australian utilities. We need to invest to bring our performance up to international standard.
Smart Network
Becoming a Smart Network is an addition to the 2010 AMP. The aims of Smart Networks include self-healing networks and networks that can shift load from peak times to reduce peak demand growth. Smart Networks are something that regulators in many countries are now paying greater attention to because they are perceived to offer improvements in performance to customers. Well thought out and implemented Smart Grid technologies offer exciting performance benefits. They also fit well with our business plan objectives of improving reliability through automated solutions and managing increasing investment profiles through non-asset solutions. The 2010 AMP sets out initiatives that are consistent with the ESRI and Energy Networks Australia visions of Smart Networks.
Concluding Comment
Powerco has a responsibility to provide a safe, secure, and reliable supply of electricity to our customers and we have worked hard over the past 15 years to achieve this efficiently. While the reliability of Powerco’s electricity distribution networks is not considered to be out of step with customer expectations, reliability has been largely static and the risk of reliability worsening is increasing. We have committed an additional $6 million of capex per annum to minimise this risk. However, due to ageing of the network and increased demand we have a significant challenge to meet the required investment under the existing regulatory settings.
The Asset Management Plan that follows provides more detail on the issues I have discussed. It also describes in more detail our plan for addressing those issues. We are enthusiastic about Powerco’s future and look forward to discussing our plans with you.
Richard KroghChief Executive

Return to Index4 ASSET MANAGEMENT PLAN ELECTRICITY NETWORKS FY2010 – FY2019
1. EXECUTIVE SUMMARY . . . . . . . . . . . . . . . . . . . . . . . . . . . . . . . . . . . . . . . 8 1.1. Purpose of the Plan . . . . . . . . . . . . . . . . . . . . . . . . . . . . . . . . . . . . . . . . . . . . . . . . . . . . . . . .8 1.2. Period Covered . . . . . . . . . . . . . . . . . . . . . . . . . . . . . . . . . . . . . . . . . . . . . . . . . . . . . . . . . . . . . .8 1.3. Asset Management Stakeholders . . . . . . . . . . . . . . . . . . . . . . . . . . . . . . . . . .9 1.4. Asset Management Drivers . . . . . . . . . . . . . . . . . . . . . . . . . . . . . . . . . . . . . . . . . . . .9 1.5. Balancing Constraints, Asset Management
Drivers and Conflicting Stakeholder Needs . . . . . . . . . . . . . . . . .10 1.6. Asset Management Information Systems . . . . . . . . . . . . . . . . . . . .11 1.7. Service Provision . . . . . . . . . . . . . . . . . . . . . . . . . . . . . . . . . . . . . . . . . . . . . . . . . . . . . . . . . .11 1.8. Assets Covered . . . . . . . . . . . . . . . . . . . . . . . . . . . . . . . . . . . . . . . . . . . . . . . . . . . . . . . . . . . .12 1.9. Performance Level Objectives . . . . . . . . . . . . . . . . . . . . . . . . . . . . . . . . . . . . .13 1.10. Performance Measurement, Evaluation and
Improvement . . . . . . . . . . . . . . . . . . . . . . . . . . . . . . . . . . . . . . . . . . . . . . . . . . . . . . . . . . . . . . . .14 1.11. Ongoing Growth in Electricity Demand
and Throughput . . . . . . . . . . . . . . . . . . . . . . . . . . . . . . . . . . . . . . . . . . . . . . . . . . . . . . . . . . . .15 1.12. Maintenance, Renewal and Development Plans . . . . . . . . . .16 1.13. Smart Networks . . . . . . . . . . . . . . . . . . . . . . . . . . . . . . . . . . . . . . . . . . . . . . . . . . . . . . . . . . .17 1.14. Expenditure Forecasts . . . . . . . . . . . . . . . . . . . . . . . . . . . . . . . . . . . . . . . . . . . . . . . . .17 1.15. Risk Management . . . . . . . . . . . . . . . . . . . . . . . . . . . . . . . . . . . . . . . . . . . . . . . . . . . . . . . .19 1.16. Advanced Asset Management . . . . . . . . . . . . . . . . . . . . . . . . . . . . . . . . . . . . .19
2. BACkgRoUnd And oBjECTIVES . . . . . . . . . . . . . . .20 2.1. About Powerco . . . . . . . . . . . . . . . . . . . . . . . . . . . . . . . . . . . . . . . . . . . . . . . . . . . . . . . . . . . . .20 2.1.1. Overview and Historical Context . . . . . . . . . . . . . . . . . . . . . . . . . . . . . . . . . . . .20 2.1.2. Powerco’s Vision and Mission . . . . . . . . . . . . . . . . . . . . . . . . . . . . . . . . . . . . . . . .20 2.1.3. Powerco’s Values . . . . . . . . . . . . . . . . . . . . . . . . . . . . . . . . . . . . . . . . . . . . . . . . . . . . . . . . . . .20 2.2. Purpose and Objective of the Plan . . . . . . . . . . . . . . . . . . . . . . . . . . . . . . .21 2.2.1. Period Covered by the Plan . . . . . . . . . . . . . . . . . . . . . . . . . . . . . . . . . . . . . . . . . . . .22 2.2.2. Future Review of the Plan . . . . . . . . . . . . . . . . . . . . . . . . . . . . . . . . . . . . . . . . . . . . . . .22 2.2.3. Structure of the Plan . . . . . . . . . . . . . . . . . . . . . . . . . . . . . . . . . . . . . . . . . . . . . . . . . . . . . .22 2.3. Asset Management Drivers . . . . . . . . . . . . . . . . . . . . . . . . . . . . . . . . . . . . . . . . . .23 2.3.1. Stakeholder Drivers of the Asset Management Process . . .23 2.3.2. Other Drivers of the Asset Management Process . . . . . . . . . . . . .27 2.4. Balancing Asset Management Drivers . . . . . . . . . . . . . . . . . . . . . . . .27 2.5. Corporate Interaction with the Asset Management
Process . . . . . . . . . . . . . . . . . . . . . . . . . . . . . . . . . . . . . . . . . . . . . . . . . . . . . . . . . . . . . . . . . . . . . . . .29 2.6. Asset Management Process . . . . . . . . . . . . . . . . . . . . . . . . . . . . . . . . . . . . . . . .30 2.6.1. Process Overview . . . . . . . . . . . . . . . . . . . . . . . . . . . . . . . . . . . . . . . . . . . . . . . . . . . . . . . . . .30 2.6.2. Core Process for Balancing Asset Management Drivers . .32 2.7. Responsibilities for Asset Management . . . . . . . . . . . . . . . . . . . . . .33 2.7.1. Powerco’s Network Ownership and Management
Business Model . . . . . . . . . . . . . . . . . . . . . . . . . . . . . . . . . . . . . . . . . . . . . . . . . . . . . . . . . . . . .33 2.7.2. Governance Level Responsibilities . . . . . . . . . . . . . . . . . . . . . . . . . . . . . . . . . .35 2.7.3. Executive and Senior Management Level
Responsibilities . . . . . . . . . . . . . . . . . . . . . . . . . . . . . . . . . . . . . . . . . . . . . . . . . . . . . . . . . . . . . .35 2.7.4. Field Operations Responsibilities . . . . . . . . . . . . . . . . . . . . . . . . . . . . . . . . . . . .36 2.7.5. Asset Management Reporting . . . . . . . . . . . . . . . . . . . . . . . . . . . . . . . . . . . . . . . .36
2.8. Asset Management Information Systems . . . . . . . . . . . . . . . . . . . .36 2.8.1. Geographical Information System (GIS) . . . . . . . . . . . . . . . . . . . . . . . . . . .36 2.8.2. Maintenance, Works Management and Financial System 37 2.8.3. ENS/Gentrack . . . . . . . . . . . . . . . . . . . . . . . . . . . . . . . . . . . . . . . . . . . . . . . . . . . . . . . . . . . . . . . .37 2.8.4. SCADA Data and PI System . . . . . . . . . . . . . . . . . . . . . . . . . . . . . . . . . . . . . . . . . . .37 2.8.5. TVD . . . . . . . . . . . . . . . . . . . . . . . . . . . . . . . . . . . . . . . . . . . . . . . . . . . . . . . . . . . . . . . . . . . . . . . . . . . . . . .37 2.8.6. OutDef . . . . . . . . . . . . . . . . . . . . . . . . . . . . . . . . . . . . . . . . . . . . . . . . . . . . . . . . . . . . . . . . . . . . . . . . . . .38 2.8.7. CIW Electricity . . . . . . . . . . . . . . . . . . . . . . . . . . . . . . . . . . . . . . . . . . . . . . . . . . . . . . . . . . . . . . .38 2.8.8. Improvement Register and Optimisation Tool . . . . . . . . . . . . . . . . . .38 2.8.9. Drawing Management System . . . . . . . . . . . . . . . . . . . . . . . . . . . . . . . . . . . . . . . .38 2.8.10. Ancillary Databases . . . . . . . . . . . . . . . . . . . . . . . . . . . . . . . . . . . . . . . . . . . . . . . . . . . . . . . .38 2.8.11. Other Record Systems . . . . . . . . . . . . . . . . . . . . . . . . . . . . . . . . . . . . . . . . . . . . . . . . . . .38 2.8.12. Information Integrity and Improvement Actions . . . . . . . . . . . . . . .38 2.9. Network Service Provision Arrangements . . . . . . . . . . . . . . . . . .39 2.9.1. Introduction . . . . . . . . . . . . . . . . . . . . . . . . . . . . . . . . . . . . . . . . . . . . . . . . . . . . . . . . . . . . . . . . . . .39 2.9.2. Powerco Outsourcing Policy Overview . . . . . . . . . . . . . . . . . . . . . . . . . . . .39 2.9.3. Pure Alliance-Style Agreement and Contracts . . . . . . . . . . . . . . . . .40 2.9.4. Other Alliance-Style Agreements . . . . . . . . . . . . . . . . . . . . . . . . . . . . . . . . . . .40 2.9.5. Vegetation Management . . . . . . . . . . . . . . . . . . . . . . . . . . . . . . . . . . . . . . . . . . . . . . . .40 2.9.6. Customer Initiated Work . . . . . . . . . . . . . . . . . . . . . . . . . . . . . . . . . . . . . . . . . . . . . . . . .40 2.10. Transmission Relationship Management . . . . . . . . . . . . . . . . . . . . .41
3. ASSETS CoVEREd . . . . . . . . . . . . . . . . . . . . . . . . . . . . . . . . . . . . . . . . . . . . . .41 3.1. Electricity Network Assets . . . . . . . . . . . . . . . . . . . . . . . . . . . . . . . . . . . . . . . . . . .41 3.2. The Network Assets by Type and Function . . . . . . . . . . . . . . . . . .42 3.2.1. Justification for the Network Assets . . . . . . . . . . . . . . . . . . . . . . . . . . . . . . .44 3.2.2. Transmission Points of Supply . . . . . . . . . . . . . . . . . . . . . . . . . . . . . . . . . . . . . . . .44 3.2.3. Justification for the Points of Supply . . . . . . . . . . . . . . . . . . . . . . . . . . . . . . .44 3.2.4. Subtransmission Networks . . . . . . . . . . . . . . . . . . . . . . . . . . . . . . . . . . . . . . . . . . . .44 3.2.4.1 Justification for Subtransmission Assets . . . . . . . . . . . . . . . . . . . . . . . . . . . . . . 45 3.2.5. Embedded Generation . . . . . . . . . . . . . . . . . . . . . . . . . . . . . . . . . . . . . . . . . . . . . . . . . . .45 3.2.6. Zone Substations . . . . . . . . . . . . . . . . . . . . . . . . . . . . . . . . . . . . . . . . . . . . . . . . . . . . . . . . . .45 3.2.6.1 Justification for Zone Substation Assets . . . . . . . . . . . . . . . . . . . . . . . . . . . . . . 46 3.2.7. Distribution Network . . . . . . . . . . . . . . . . . . . . . . . . . . . . . . . . . . . . . . . . . . . . . . . . . . . . . .46 3.2.8. Distribution Switchgear . . . . . . . . . . . . . . . . . . . . . . . . . . . . . . . . . . . . . . . . . . . . . . . . .47 3.2.8.1 Justification for Distribution Assets . . . . . . . . . . . . . . . . . . . . . . . . . . . . . . . . . . . . . . 48 3.2.9. Distribution Substations . . . . . . . . . . . . . . . . . . . . . . . . . . . . . . . . . . . . . . . . . . . . . . . .48 3.2.9.1 Justification for Distribution Substation Assets . . . . . . . . . . . . . . . . . . . . . 50 3.2.10. Low-voltage Assets . . . . . . . . . . . . . . . . . . . . . . . . . . . . . . . . . . . . . . . . . . . . . . . . . . . . . . . .50 3.2.10.1 Justification for Low-voltage Reticulation Assets . . . . . . . . . . . . . . . . . . 51 3.2.11. Protection and Control Assets . . . . . . . . . . . . . . . . . . . . . . . . . . . . . . . . . . . . . . . .51 3.2.11.1 Protection and Control Configuration . . . . . . . . . . . . . . . . . . . . . . . . . . . . . . . . . . 51 3.2.11.2 Protection Assets . . . . . . . . . . . . . . . . . . . . . . . . . . . . . . . . . . . . . . . . . . . . . . . . . . . . . . . . . . . . . . 51 3.2.11.3 SCADA and Communication Systems . . . . . . . . . . . . . . . . . . . . . . . . . . . . . . . . 51 3.2.11.4 Load-control Systems . . . . . . . . . . . . . . . . . . . . . . . . . . . . . . . . . . . . . . . . . . . . . . . . . . . . . . . 52 3.2.11.5 Energy Measurement Systems . . . . . . . . . . . . . . . . . . . . . . . . . . . . . . . . . . . . . . . . . . 52 3.2.11.6 GXP Meters . . . . . . . . . . . . . . . . . . . . . . . . . . . . . . . . . . . . . . . . . . . . . . . . . . . . . . . . . . . . . . . . . . . . . 52 3.2.11.7 Justification for Protection and Control Assets . . . . . . . . . . . . . . . . . . . . . 52 3.2.12. Emergency and Critical Spares . . . . . . . . . . . . . . . . . . . . . . . . . . . . . . . . . . . . . . .53
3.2.12.1 Justification for Emergency and Critical Spares . . . . . . . . . . . . . . . . . . . 53 3.2.13. Back-up Generation Equipment . . . . . . . . . . . . . . . . . . . . . . . . . . . . . . . . . . . . . .53 3.3. Area Network Descriptions . . . . . . . . . . . . . . . . . . . . . . . . . . . . . . . . . . . . . . . . .53 3.3.1. Manawatu Network . . . . . . . . . . . . . . . . . . . . . . . . . . . . . . . . . . . . . . . . . . . . . . . . . . . . . . .53 3.3.2. Taranaki Network . . . . . . . . . . . . . . . . . . . . . . . . . . . . . . . . . . . . . . . . . . . . . . . . . . . . . . . . . . .54 3.3.3. Tauranga Network . . . . . . . . . . . . . . . . . . . . . . . . . . . . . . . . . . . . . . . . . . . . . . . . . . . . . . . . . .54 3.3.4. Valley Network . . . . . . . . . . . . . . . . . . . . . . . . . . . . . . . . . . . . . . . . . . . . . . . . . . . . . . . . . . . . . . .54 3.3.5. Wairarapa Network . . . . . . . . . . . . . . . . . . . . . . . . . . . . . . . . . . . . . . . . . . . . . . . . . . . . . . . .54 3.3.6. Wanganui Network . . . . . . . . . . . . . . . . . . . . . . . . . . . . . . . . . . . . . . . . . . . . . . . . . . . . . . . .55 3.4. Network Assets by Prevailing Customer Type . . . . . . . . . . . .55 3.4.1. Industrial and Commercial (F1) . . . . . . . . . . . . . . . . . . . . . . . . . . . . . . . . . . . . . . .55 3.4.2. Kinleith Mill Site . . . . . . . . . . . . . . . . . . . . . . . . . . . . . . . . . . . . . . . . . . . . . . . . . . . . . . . . . . . . .55 3.4.3. Te Rerehau Windfarm Site . . . . . . . . . . . . . . . . . . . . . . . . . . . . . . . . . . . . . . . . . . . . . .55 3.4.4. Large Customers . . . . . . . . . . . . . . . . . . . . . . . . . . . . . . . . . . . . . . . . . . . . . . . . . . . . . . . . . . .55 3.4.5. Dairy Sector . . . . . . . . . . . . . . . . . . . . . . . . . . . . . . . . . . . . . . . . . . . . . . . . . . . . . . . . . . . . . . . . . . .56 3.4.6. Timber Processing Sector . . . . . . . . . . . . . . . . . . . . . . . . . . . . . . . . . . . . . . . . . . . . . .56 3.4.7. Food Processing Sector . . . . . . . . . . . . . . . . . . . . . . . . . . . . . . . . . . . . . . . . . . . . . . . . .57 3.4.8. Transportation Sector . . . . . . . . . . . . . . . . . . . . . . . . . . . . . . . . . . . . . . . . . . . . . . . . . . . . .57 3.4.9. Manufacturing Sector . . . . . . . . . . . . . . . . . . . . . . . . . . . . . . . . . . . . . . . . . . . . . . . . . . . . .57 3.4.10. Chemicals Sector . . . . . . . . . . . . . . . . . . . . . . . . . . . . . . . . . . . . . . . . . . . . . . . . . . . . . . . . . . .57 3.4.11. Government Sector & Research Facilities . . . . . . . . . . . . . . . . . . . . . . . .58 3.4.12. Central Business District Networks . . . . . . . . . . . . . . . . . . . . . . . . . . . . . . . .58 3.4.13. Residential Networks . . . . . . . . . . . . . . . . . . . . . . . . . . . . . . . . . . . . . . . . . . . . . . . . . . . .58 3.4.14. Rural Networks (F4) . . . . . . . . . . . . . . . . . . . . . . . . . . . . . . . . . . . . . . . . . . . . . . . . . . . . . . . .58 3.4.15. Remote Rural Networks (F5) . . . . . . . . . . . . . . . . . . . . . . . . . . . . . . . . . . . . . . . . . . .58 3.5. Network Asset Age and Condition . . . . . . . . . . . . . . . . . . . . . . . . . . . . . . .59 3.5.1. The Assets by Age . . . . . . . . . . . . . . . . . . . . . . . . . . . . . . . . . . . . . . . . . . . . . . . . . . . . . . . . .59 3.6. Overhead Lines . . . . . . . . . . . . . . . . . . . . . . . . . . . . . . . . . . . . . . . . . . . . . . . . . . . . . . . . . . . .60 3.6.1. Overhead Lines Age Profile . . . . . . . . . . . . . . . . . . . . . . . . . . . . . . . . . . . . . . . . . . . .60 3.6.2. Overhead Line Condition . . . . . . . . . . . . . . . . . . . . . . . . . . . . . . . . . . . . . . . . . . . . . . . .60 3.7. Underground Cables . . . . . . . . . . . . . . . . . . . . . . . . . . . . . . . . . . . . . . . . . . . . . . . . . . . .61 3.7.1. Underground Cable Age . . . . . . . . . . . . . . . . . . . . . . . . . . . . . . . . . . . . . . . . . . . . . . . . .61 3.7.2. Subtransmission Cable Condition . . . . . . . . . . . . . . . . . . . . . . . . . . . . . . . . . . .61 3.7.3. Distribution Cable Condition . . . . . . . . . . . . . . . . . . . . . . . . . . . . . . . . . . . . . . . . . . .61 3.7.4. LV Cable Condition . . . . . . . . . . . . . . . . . . . . . . . . . . . . . . . . . . . . . . . . . . . . . . . . . . . . . . . .62 3.8. Distribution Transformer . . . . . . . . . . . . . . . . . . . . . . . . . . . . . . . . . . . . . . . . . . . . .62 3.8.1. Distribution Transformer Age . . . . . . . . . . . . . . . . . . . . . . . . . . . . . . . . . . . . . . . . . .62 3.8.2. Distribution Transformer Condition . . . . . . . . . . . . . . . . . . . . . . . . . . . . . . . . . .62 3.9. Distribution Switchgear . . . . . . . . . . . . . . . . . . . . . . . . . . . . . . . . . . . . . . . . . . . . . . .62 3.9.1. Distribution Switchgear Age . . . . . . . . . . . . . . . . . . . . . . . . . . . . . . . . . . . . . . . . . . .62 3.9.2. Distribution Switchgear Condition . . . . . . . . . . . . . . . . . . . . . . . . . . . . . . . . . . .63 3.10. Zone Substations . . . . . . . . . . . . . . . . . . . . . . . . . . . . . . . . . . . . . . . . . . . . . . . . . . . . . . . . .63 3.10.1. Zone Substation Age . . . . . . . . . . . . . . . . . . . . . . . . . . . . . . . . . . . . . . . . . . . . . . . . . . . . . .63 3.10.2. Zone Substation Condition . . . . . . . . . . . . . . . . . . . . . . . . . . . . . . . . . . . . . . . . . . . . .63
Contents

Return to Index 5ASSET MANAGEMENT PLAN ELECTRICITY NETWORKS FY2010 – FY2019
4. PERfoRMAnCE TARgETS And MonIToRIng . . . . . . . . . . . . . . . . . . . . . . . . . . . . . . . . . . . . . . . . . . . . . . . . . . . . . . .64
4.1. Introduction . . . . . . . . . . . . . . . . . . . . . . . . . . . . . . . . . . . . . . . . . . . . . . . . . . . . . . . . . . . . . . . . . .64 4.1.1. Performance Target Philosophy . . . . . . . . . . . . . . . . . . . . . . . . . . . . . . . . . . . . . .64 4.2. Levels of Consumer Service (Quality) Performance . . . .64 4.2.1. Overview . . . . . . . . . . . . . . . . . . . . . . . . . . . . . . . . . . . . . . . . . . . . . . . . . . . . . . . . . . . . . . . . . . . . . . .64 4.2.2. Consumer Consultation – Price Quality Trade-off . . . . . . . . . . . . .64 4.2.2.1 Complaints Process . . . . . . . . . . . . . . . . . . . . . . . . . . . . . . . . . . . . . . . . . . . . . . . . . . . . . . . . . . 64 4.2.2.2 Results of Consultation to Date . . . . . . . . . . . . . . . . . . . . . . . . . . . . . . . . . . . . . . . . . . 65 4.2.2.3 Effect of Consultation on Targets . . . . . . . . . . . . . . . . . . . . . . . . . . . . . . . . . . . . . . . . 65 4.2.2.4 Definition of Consumer Service and Service Performance . . . . 65 4.2.3. Supply Quality . . . . . . . . . . . . . . . . . . . . . . . . . . . . . . . . . . . . . . . . . . . . . . . . . . . . . . . . . . . . . . .65 4.2.3.1 Justification for the Quality Targets . . . . . . . . . . . . . . . . . . . . . . . . . . . . . . . . . . . . . . 66 4.2.4. Reliability Targets . . . . . . . . . . . . . . . . . . . . . . . . . . . . . . . . . . . . . . . . . . . . . . . . . . . . . . . . . . .67 4.2.4.1 Justification for the Reliability Targets . . . . . . . . . . . . . . . . . . . . . . . . . . . . . . . . . . 68 4.2.5. Capacity Targets . . . . . . . . . . . . . . . . . . . . . . . . . . . . . . . . . . . . . . . . . . . . . . . . . . . . . . . . . . . .69 4.2.6. Street Lighting Service Target Levels . . . . . . . . . . . . . . . . . . . . . . . . . . . . . .69 4.2.7. Targeted Number of Faults per km of Line . . . . . . . . . . . . . . . . . . . . . . .69 4.2.7.1 Justification for the Target Numbers of Faults . . . . . . . . . . . . . . . . . . . . . . 70 4.2.8. Targeted Number of Interruptions . . . . . . . . . . . . . . . . . . . . . . . . . . . . . . . . . . .70 4.2.8.1 Justification for the Target Numbers of Interruptions . . . . . . . . . . . . . 70 4.2.9. Targeted Numbers of Customers per Feeder . . . . . . . . . . . . . . . . . . .70 4.3. Target Performance for Economic Efficiency . . . . . . . . . . . . . .70 4.3.1. Integration of Economic Efficiency Drivers into
Asset Management . . . . . . . . . . . . . . . . . . . . . . . . . . . . . . . . . . . . . . . . . . . . . . . . . . . . . . . .70 4.3.1.1 Asset Replacement Economic Assessment . . . . . . . . . . . . . . . . . . . . . . . . 70 4.3.1.2 Planning Criteria Economic Assessment . . . . . . . . . . . . . . . . . . . . . . . . . . . . . 71 4.3.1.3 Maintenance Techniques Economic Assessment . . . . . . . . . . . . . . . . . 71 4.3.1.4 Consumer Initiated Developments Economic Assessment . . . 71 4.3.2. Asset Efficiency Performance Targets . . . . . . . . . . . . . . . . . . . . . . . . . . . . .71 4.3.2.1 Justification for the Asset Efficiency Targets . . . . . . . . . . . . . . . . . . . . . . . . . 71 4.3.3. Asset Utilisation Performance Targets . . . . . . . . . . . . . . . . . . . . . . . . . . . . .71 4.3.3.1 Justification for the Asset Utilisation Targets . . . . . . . . . . . . . . . . . . . . . . . . 72 4.3.3.2 Expenditure Performance Targets . . . . . . . . . . . . . . . . . . . . . . . . . . . . . . . . . . . . . . . 72 4.3.3.3 Justification for the Expenditure Performance Targets . . . . . . . . . . 72 4.3.4. Network Loss Performance Targets . . . . . . . . . . . . . . . . . . . . . . . . . . . . . . . .72 4.3.5. Non-Network and Non-Asset Solutions . . . . . . . . . . . . . . . . . . . . . . . . . .73 4.3.6. Adoption of New Technology . . . . . . . . . . . . . . . . . . . . . . . . . . . . . . . . . . . . . . . . . .73 4.4. Performance of Contractors . . . . . . . . . . . . . . . . . . . . . . . . . . . . . . . . . . . . . . .73 4.4.1. Prequalification of Contractors . . . . . . . . . . . . . . . . . . . . . . . . . . . . . . . . . . . . . . .73 4.4.2. Maintenance Scheduling . . . . . . . . . . . . . . . . . . . . . . . . . . . . . . . . . . . . . . . . . . . . . . . .73 4.4.3. Monitoring Quality of Workmanship . . . . . . . . . . . . . . . . . . . . . . . . . . . . . . . .74 4.5. Target Performance for Safety . . . . . . . . . . . . . . . . . . . . . . . . . . . . . . . . . . . . .74 4.6. Target Performance for Environmental Responsibility 75 4.7. Statutory Compliance . . . . . . . . . . . . . . . . . . . . . . . . . . . . . . . . . . . . . . . . . . . . . . . . . .75 4.8. Risk Management . . . . . . . . . . . . . . . . . . . . . . . . . . . . . . . . . . . . . . . . . . . . . . . . . . . . . . . .75
5. EVALUATIon of PERfoRMAnCE . . . . . . . . . . . . . . . . .76 5.1. Introduction . . . . . . . . . . . . . . . . . . . . . . . . . . . . . . . . . . . . . . . . . . . . . . . . . . . . . . . . . . . . . . . . . .76 5.1.1. General Review Comments . . . . . . . . . . . . . . . . . . . . . . . . . . . . . . . . . . . . . . . . . . . .76 5.1.2. Review of Work in Progress . . . . . . . . . . . . . . . . . . . . . . . . . . . . . . . . . . . . . . . . . . . .76 5.2. Review of Consumer Service Performance
against Targets . . . . . . . . . . . . . . . . . . . . . . . . . . . . . . . . . . . . . . . . . . . . . . . . . . . . . . . . . . . . .76 5.2.1. Results of Consumer Consultation Process . . . . . . . . . . . . . . . . . . . . .76 5.2.2. Results of Complaints Monitoring Process . . . . . . . . . . . . . . . . . . . . . .76 5.2.3. Network Supply Quality Performance . . . . . . . . . . . . . . . . . . . . . . . . . . . . .77 5.2.4. Reliability Overview . . . . . . . . . . . . . . . . . . . . . . . . . . . . . . . . . . . . . . . . . . . . . . . . . . . . . . . .78 5.2.5. Reliability History . . . . . . . . . . . . . . . . . . . . . . . . . . . . . . . . . . . . . . . . . . . . . . . . . . . . . . . . . . .81 5.2.6. Underlying Reliability Performance Trends . . . . . . . . . . . . . . . . . . . . . .82 5.2.7. Distribution Feeder Class Reliability Performance . . . . . . . . . . .83 5.2.8. Network Capacity Performance . . . . . . . . . . . . . . . . . . . . . . . . . . . . . . . . . . . . . .84 5.3. Review of Economic Efficiency Performance
against Targets . . . . . . . . . . . . . . . . . . . . . . . . . . . . . . . . . . . . . . . . . . . . . . . . . . . . . . . . . . . . .84 5.3.1. Asset Efficiency Performance . . . . . . . . . . . . . . . . . . . . . . . . . . . . . . . . . . . . . . . . .84 5.3.2. Asset Utilisation Performance . . . . . . . . . . . . . . . . . . . . . . . . . . . . . . . . . . . . . . . . .85 5.3.3. Cost Performance . . . . . . . . . . . . . . . . . . . . . . . . . . . . . . . . . . . . . . . . . . . . . . . . . . . . . . . . . .85 5.4. Review of Safety Performance . . . . . . . . . . . . . . . . . . . . . . . . . . . . . . . . . . . . .86 5.5. Review of Environmental Performance . . . . . . . . . . . . . . . . . . . . . . .86 5.6. Review of Physical Performance against Plan . . . . . . . . . . . . .86 5.6.1. Subtransmission Network Project Performance . . . . . . . . . . . . . . .86 5.6.2. Distribution Network Project Performance . . . . . . . . . . . . . . . . . . . . . . .88 5.6.3. Protection and Control Development Performance . . . . . . . . . .88 5.7. Review of Financial Progress against Plan . . . . . . . . . . . . . . . . . .90 5.7.1. Capital Expenditure . . . . . . . . . . . . . . . . . . . . . . . . . . . . . . . . . . . . . . . . . . . . . . . . . . . . . . . .90 5.7.2. Maintenance Expenditure . . . . . . . . . . . . . . . . . . . . . . . . . . . . . . . . . . . . . . . . . . . . . . .90
6. ASSET LIfE CYCLE MAnAgEMEnT PLAn . . . . . . . . . . . . . . . . . . . . . . . . . . . . . . . . . . . . . . . . . . . . . . . . . . . . . . . . . . . . . . . . . . . . . . . . .91
6.1. Introduction . . . . . . . . . . . . . . . . . . . . . . . . . . . . . . . . . . . . . . . . . . . . . . . . . . . . . . . . . . . . . . . . . .91 6.1.1. Life Cycle Asset Management Concepts . . . . . . . . . . . . . . . . . . . . . . . .91 6.1.2. Network Standards Philosophy . . . . . . . . . . . . . . . . . . . . . . . . . . . . . . . . . . . . . . .92 6.1.3. Network Standards Status . . . . . . . . . . . . . . . . . . . . . . . . . . . . . . . . . . . . . . . . . . . . . .92 6.2. Asset Conception, Design and Specification . . . . . . . . . . . . . . .92 6.2.1. Class A – Item-Focused Equipment . . . . . . . . . . . . . . . . . . . . . . . . . . . . . . . .93 6.2.2. Class B – Standards-Focused Equipment . . . . . . . . . . . . . . . . . . . . . . .93 6.2.3. Class C – Functionality-Focused Equipment . . . . . . . . . . . . . . . . . . .93 6.2.4. Class Exceptions . . . . . . . . . . . . . . . . . . . . . . . . . . . . . . . . . . . . . . . . . . . . . . . . . . . . . . . . . . .93 6.3. Maintenance Strategy . . . . . . . . . . . . . . . . . . . . . . . . . . . . . . . . . . . . . . . . . . . . . . . . .93 6.3.1. Determining Maintenance Strategy . . . . . . . . . . . . . . . . . . . . . . . . . . . . . . . . .93 6.3.2. Maintenance Work Types . . . . . . . . . . . . . . . . . . . . . . . . . . . . . . . . . . . . . . . . . . . . . . . .94 6.3.3. Inspection and Condition Assessments . . . . . . . . . . . . . . . . . . . . . . . . . .94 6.3.4. Routine Servicing . . . . . . . . . . . . . . . . . . . . . . . . . . . . . . . . . . . . . . . . . . . . . . . . . . . . . . . . . . .95 6.3.5. Evaluation of Condition Monitoring Results . . . . . . . . . . . . . . . . . . . . .95 6.3.6. Evaluation of Faults and Monitoring Reliability
(Reliability Driven Renewal) . . . . . . . . . . . . . . . . . . . . . . . . . . . . . . . . . . . . . . . . . . . . .95
6.3.7. Fault First Response and Call Outs . . . . . . . . . . . . . . . . . . . . . . . . . . . . . . . . .95 6.3.8. Corrective Maintenance . . . . . . . . . . . . . . . . . . . . . . . . . . . . . . . . . . . . . . . . . . . . . . . . .95 6.3.9. Individual Asset Life Cycle Plans . . . . . . . . . . . . . . . . . . . . . . . . . . . . . . . . . . . . .95 6.3.10. Maintenance Management System . . . . . . . . . . . . . . . . . . . . . . . . . . . . . . . . .95 6.4. Asset Renewal Strategy . . . . . . . . . . . . . . . . . . . . . . . . . . . . . . . . . . . . . . . . . . . . . . .95 6.4.1. Asset Renewal Strategic Themes . . . . . . . . . . . . . . . . . . . . . . . . . . . . . . . . . . . .95 6.4.2. Asset Renewal Timing – Renewal versus Maintenance . . . .96 6.4.3. Asset Renewal Forecasting Process . . . . . . . . . . . . . . . . . . . . . . . . . . . . . . .97 6.4.4. Age Profile-Based Renewal Forecasts . . . . . . . . . . . . . . . . . . . . . . . . . . .97 6.4.5. Implications of the “Wall of Wire” . . . . . . . . . . . . . . . . . . . . . . . . . . . . . . . . . . .99 6.4.6. Renewal Investment Risks . . . . . . . . . . . . . . . . . . . . . . . . . . . . . . . . . . . . . . . . . . .100 6.4.7. Historical Rates of Asset Replacement . . . . . . . . . . . . . . . . . . . . . . . . .100 6.4.8. Life Extension Practices . . . . . . . . . . . . . . . . . . . . . . . . . . . . . . . . . . . . . . . . . . . . . . .100 6.5. Redeployment, Upgrade and Disposal of
Existing Assets . . . . . . . . . . . . . . . . . . . . . . . . . . . . . . . . . . . . . . . . . . . . . . . . . . . . . . . . . . .101 6.6. Overhead Lines . . . . . . . . . . . . . . . . . . . . . . . . . . . . . . . . . . . . . . . . . . . . . . . . . . . . . . . . . .101 6.6.1. Individual Asset Life Cycle Plans . . . . . . . . . . . . . . . . . . . . . . . . . . . . . . . . . . .101 6.6.2. Frequencies of Overhead Line Inspections . . . . . . . . . . . . . . . . . . .101 6.6.3. Overhead Line Condition Monitoring and Maintenance
Summary . . . . . . . . . . . . . . . . . . . . . . . . . . . . . . . . . . . . . . . . . . . . . . . . . . . . . . . . . . . . . . . . . . . . .101 6.6.4. Overhead Line Replacement Profile . . . . . . . . . . . . . . . . . . . . . . . . . . . . .101 6.6.5. Reliability Driven Renewal Philosophy . . . . . . . . . . . . . . . . . . . . . . . . . . .102 6.6.6. Subtransmission Line . . . . . . . . . . . . . . . . . . . . . . . . . . . . . . . . . . . . . . . . . . . . . . . . . . .103 6.6.7. Distribution Line . . . . . . . . . . . . . . . . . . . . . . . . . . . . . . . . . . . . . . . . . . . . . . . . . . . . . . . . . . .103 6.6.8. Low-Voltage Line . . . . . . . . . . . . . . . . . . . . . . . . . . . . . . . . . . . . . . . . . . . . . . . . . . . . . . . . .104 6.7. Underground Cables . . . . . . . . . . . . . . . . . . . . . . . . . . . . . . . . . . . . . . . . . . . . . . . . . .104 6.7.1. Individual Asset Life Cycle Plans . . . . . . . . . . . . . . . . . . . . . . . . . . . . . . . . . . .104 6.7.2. Frequencies of Underground Circuit Inspections . . . . . . . . . .104 6.7.3. Underground Cable Network Condition Monitoring and
Maintenance Summary . . . . . . . . . . . . . . . . . . . . . . . . . . . . . . . . . . . . . . . . . . . . . . . . .104 6.7.4. Underground Cable Replacement Profile . . . . . . . . . . . . . . . . . . . . . .104 6.7.5. Subtransmission Cables . . . . . . . . . . . . . . . . . . . . . . . . . . . . . . . . . . . . . . . . . . . . . . .105 6.7.6. Distribution Cables . . . . . . . . . . . . . . . . . . . . . . . . . . . . . . . . . . . . . . . . . . . . . . . . . . . . . . .105 6.7.7. Low-Voltage Cables . . . . . . . . . . . . . . . . . . . . . . . . . . . . . . . . . . . . . . . . . . . . . . . . . . . . .105 6.8. Distribution Transformers . . . . . . . . . . . . . . . . . . . . . . . . . . . . . . . . . . . . . . . . . .105 6.8.1. Individual Asset Life Cycle Plans . . . . . . . . . . . . . . . . . . . . . . . . . . . . . . . . . . .105 6.8.2. Frequencies of Inspections and Maintenance Activities .105 6.8.3. Distribution Transformer Condition Monitoring
and Maintenance Summary . . . . . . . . . . . . . . . . . . . . . . . . . . . . . . . . . . . . . . . . . .106 6.8.4. Distribution Transformer Replacement Profile . . . . . . . . . . . . . . . .106 6.8.5. Condition Overview . . . . . . . . . . . . . . . . . . . . . . . . . . . . . . . . . . . . . . . . . . . . . . . . . . . . . .106 6.9. Distribution Switchgear . . . . . . . . . . . . . . . . . . . . . . . . . . . . . . . . . . . . . . . . . . . . .107 6.9.1. Individual Asset Life Cycle Plans . . . . . . . . . . . . . . . . . . . . . . . . . . . . . . . . . . .107 6.9.2. Frequencies of Inspections and Maintenance Activities .107 6.9.3. Distribution Switchgear Condition Monitoring
and Maintenance Summary . . . . . . . . . . . . . . . . . . . . . . . . . . . . . . . . . . . . . . . . . .107 6.9.4. Switchgear Replacement Profile . . . . . . . . . . . . . . . . . . . . . . . . . . . . . . . . . . .107 6.10. Zone Substation Equipment . . . . . . . . . . . . . . . . . . . . . . . . . . . . . . . . . . . . . . .108 6.10.1. Individual Asset Life Cycle Plans . . . . . . . . . . . . . . . . . . . . . . . . . . . . . . . . . . .108
Return to Index6 ASSET MANAGEMENT PLAN ELECTRICITY NETWORKS FY2010 – FY2019
6.10.2. Frequencies of Inspections and Maintenance Activities .108 6.10.3. Zone Substation Condition Monitoring
and Maintenance Summary . . . . . . . . . . . . . . . . . . . . . . . . . . . . . . . . . . . . . . . . . .109 6.10.4. Zone Substation Replacement Profile . . . . . . . . . . . . . . . . . . . . . . . . . . .109 6.10.5. Zone Substation Switchgear . . . . . . . . . . . . . . . . . . . . . . . . . . . . . . . . . . . . . . . .110 6.10.6. Zone Transformers . . . . . . . . . . . . . . . . . . . . . . . . . . . . . . . . . . . . . . . . . . . . . . . . . . . . . . .111 6.10.7. Zone Substation DC Supplies . . . . . . . . . . . . . . . . . . . . . . . . . . . . . . . . . . . . . . .111 6.10.8. Substation Buildings . . . . . . . . . . . . . . . . . . . . . . . . . . . . . . . . . . . . . . . . . . . . . . . . . . . .112 6.11. Protection and Control Equipment . . . . . . . . . . . . . . . . . . . . . . . . . . . .112 6.11.1. Individual Asset Life Cycle Plans . . . . . . . . . . . . . . . . . . . . . . . . . . . . . . . . . . .112 6.11.2. Frequencies of Inspections and Maintenance Activities .112 6.11.3. Protection and Control Condition Monitoring
and Maintenance Summary . . . . . . . . . . . . . . . . . . . . . . . . . . . . . . . . . . . . . . . . . .112 6.11.4. Protection Relays . . . . . . . . . . . . . . . . . . . . . . . . . . . . . . . . . . . . . . . . . . . . . . . . . . . . . . . . .112 6.11.5. SCADA and Communications . . . . . . . . . . . . . . . . . . . . . . . . . . . . . . . . . . . . . . .113 6.11.6. Load Control Plants . . . . . . . . . . . . . . . . . . . . . . . . . . . . . . . . . . . . . . . . . . . . . . . . . . . . .114 6.11.7. Metering System Instrument Transformers . . . . . . . . . . . . . . . . . . . .114 6.11.8. GXP Metering Systems . . . . . . . . . . . . . . . . . . . . . . . . . . . . . . . . . . . . . . . . . . . . . . .114 6.11.9. Street Lighting Control Assets . . . . . . . . . . . . . . . . . . . . . . . . . . . . . . . . . . . . . .115 6.12. Critical and Emergency Spares . . . . . . . . . . . . . . . . . . . . . . . . . . . . . . . . . .115 6.13. Network Renewal Project Summary . . . . . . . . . . . . . . . . . . . . . . . . . .115
7. nETwoRk dEVELoPMEnT PLAn – SYSTEM gRowTh . . . . . . . . . . . . . . . . . . . . . . . . . . . . . . . . . . . . . . . . . . . . 118
7.1. Introduction . . . . . . . . . . . . . . . . . . . . . . . . . . . . . . . . . . . . . . . . . . . . . . . . . . . . . . . . . . . . . . . .118 7.2. Security of Supply Criteria . . . . . . . . . . . . . . . . . . . . . . . . . . . . . . . . . . . . . . . . .118 7.3. Network Capacity Criteria . . . . . . . . . . . . . . . . . . . . . . . . . . . . . . . . . . . . . . . . . .119 7.3.1. Design Operational Temperatures . . . . . . . . . . . . . . . . . . . . . . . . . . . . . . . . .119 7.3.2. Capacities for Planning Purposes . . . . . . . . . . . . . . . . . . . . . . . . . . . . . . . . .120 7.3.3. Planning Design Concepts . . . . . . . . . . . . . . . . . . . . . . . . . . . . . . . . . . . . . . . . . . .120 7.3.4. General Principles Related to Feeders . . . . . . . . . . . . . . . . . . . . . . . . . .120 7.3.5. Underground versus Overhead Construction . . . . . . . . . . . . . . . . .121 7.3.6. Voltage Fluctuation Criteria . . . . . . . . . . . . . . . . . . . . . . . . . . . . . . . . . . . . . . . . . . .121 7.3.7. Voltage Selection . . . . . . . . . . . . . . . . . . . . . . . . . . . . . . . . . . . . . . . . . . . . . . . . . . . . . . . . .121 7.3.8. Transformer Ratings . . . . . . . . . . . . . . . . . . . . . . . . . . . . . . . . . . . . . . . . . . . . . . . . . . . . .121 7.4. Planning Considerations . . . . . . . . . . . . . . . . . . . . . . . . . . . . . . . . . . . . . . . . . . . .121 7.4.1. Long-Term Planning (Subtransmission) . . . . . . . . . . . . . . . . . . . . . . . . .121 7.4.2. Medium-Term Planning (Distribution) . . . . . . . . . . . . . . . . . . . . . . . . . . . .121 7.4.3. Kinleith Paper Mill . . . . . . . . . . . . . . . . . . . . . . . . . . . . . . . . . . . . . . . . . . . . . . . . . . . . . . . .122 7.4.4. Planning Criteria – Low-Voltage Reticulation Planning . . .122 7.5. Load Forecasting . . . . . . . . . . . . . . . . . . . . . . . . . . . . . . . . . . . . . . . . . . . . . . . . . . . . . . .122 7.5.1. Introduction . . . . . . . . . . . . . . . . . . . . . . . . . . . . . . . . . . . . . . . . . . . . . . . . . . . . . . . . . . . . . . . . .122 7.5.2. Regional Influences . . . . . . . . . . . . . . . . . . . . . . . . . . . . . . . . . . . . . . . . . . . . . . . . . . . . . .123 7.5.3. Changing Consumer Technologies and Demand . . . . . . . . . . .123 7.5.4. Impact of Demand Side Management Initiatives . . . . . . . . . . . .123 7.5.5. Volume Load Forecasting Process . . . . . . . . . . . . . . . . . . . . . . . . . . . . . . . .124 7.5.6. Volume Elasticity with GDP and Population . . . . . . . . . . . . . . . . . . .124
7.5.7. Electricity Volume Forecast . . . . . . . . . . . . . . . . . . . . . . . . . . . . . . . . . . . . . . . . . . .126 7.5.8. Zone Substation Load Forecasting Process . . . . . . . . . . . . . . . . . .127 7.5.9. Forecast Demand at Zone Substations . . . . . . . . . . . . . . . . . . . . . . . . .128 7.5.10. Impact of Uncertainties in the Forecasts . . . . . . . . . . . . . . . . . . . . . . .128 7.5.11. The Forecast . . . . . . . . . . . . . . . . . . . . . . . . . . . . . . . . . . . . . . . . . . . . . . . . . . . . . . . . . . . . . . . .128 7.6. Impacts of Distributed Generation and
Non Network Options . . . . . . . . . . . . . . . . . . . . . . . . . . . . . . . . . . . . . . . . . . . . . . . . .137 7.6.1. Distributed Generation Policy . . . . . . . . . . . . . . . . . . . . . . . . . . . . . . . . . . . . . . .137 7.6.2. Distributed Generation Impacts . . . . . . . . . . . . . . . . . . . . . . . . . . . . . . . . . . . .137 7.6.3. Non Network Options . . . . . . . . . . . . . . . . . . . . . . . . . . . . . . . . . . . . . . . . . . . . . . . . . . .137 7.7. Acquisition of New Assets . . . . . . . . . . . . . . . . . . . . . . . . . . . . . . . . . . . . . . . . .137 7.8. Subtransmission Development Plan . . . . . . . . . . . . . . . . . . . . . . . . . .137 7.8.1. LTDP Preparation Process – Zone Substations . . . . . . . . . . . . . .137 7.8.2. Grid Exit Points . . . . . . . . . . . . . . . . . . . . . . . . . . . . . . . . . . . . . . . . . . . . . . . . . . . . . . . . . . . .138 7.8.3. Zone Substation Transformer Utilisation . . . . . . . . . . . . . . . . . . . . . . . .141 7.8.4. Transformer Utilisation and Age . . . . . . . . . . . . . . . . . . . . . . . . . . . . . . . . . . . .147 7.8.5. Zone Substation Capacity and Security Levels . . . . . . . . . . . . . .147 7.8.6. Manawatu Network Descriptions . . . . . . . . . . . . . . . . . . . . . . . . . . . . . . . . .154 7.8.7. Taranaki Network Description . . . . . . . . . . . . . . . . . . . . . . . . . . . . . . . . . . . . . . .155 7.8.8. Tauranga Network Description . . . . . . . . . . . . . . . . . . . . . . . . . . . . . . . . . . . . . .157 7.8.9. Valley Network Description . . . . . . . . . . . . . . . . . . . . . . . . . . . . . . . . . . . . . . . . . . .158 7.8.10. Wairarapa Network Description . . . . . . . . . . . . . . . . . . . . . . . . . . . . . . . . . . . .160 7.8.11. Wanganui Network Description . . . . . . . . . . . . . . . . . . . . . . . . . . . . . . . . . . . . .160 7.8.12. Fault Levels and Equipment Ratings . . . . . . . . . . . . . . . . . . . . . . . . . . . . .161 7.8.13. Summary of Subtransmission Network Development . . . .161 7.9. Medium-Term Development Plan (Distribution) . . . . . . . . .162 7.9.1. Introduction . . . . . . . . . . . . . . . . . . . . . . . . . . . . . . . . . . . . . . . . . . . . . . . . . . . . . . . . . . . . . . . . .162 7.9.2. Medium-Term Development Planning Process . . . . . . . . . . . . . .162 7.9.3. Distribution Network Upgrade Projects . . . . . . . . . . . . . . . . . . . . . . . . .162 7.10. Reticulation Planning . . . . . . . . . . . . . . . . . . . . . . . . . . . . . . . . . . . . . . . . . . . . . . . . .162 7.11. Implementing Development Projects . . . . . . . . . . . . . . . . . . . . . . . . .162 7.11.1. Resource Consent Requirements . . . . . . . . . . . . . . . . . . . . . . . . . . . . . . . . . .162 7.11.2. Easement Issues . . . . . . . . . . . . . . . . . . . . . . . . . . . . . . . . . . . . . . . . . . . . . . . . . . . . . . . . . .162 7.12. Major Project Descriptions . . . . . . . . . . . . . . . . . . . . . . . . . . . . . . . . . . . . . . . .163 7.12.1. New Bethlehem Zone Substation . . . . . . . . . . . . . . . . . . . . . . . . . . . . . . . . .163 7.12.2. Hatricks and Taupo Quay Zone Substation Upgrade . . . . .163 7.12.3. New Pyes Pa Zone Substation . . . . . . . . . . . . . . . . . . . . . . . . . . . . . . . . . . . . .164 7.12.4. New Omanu Zone Substation . . . . . . . . . . . . . . . . . . . . . . . . . . . . . . . . . . . . . . .164 7.12.5. Browne St and Tower Rd Zone Substation Upgrades . . . .165 7.12.6. New Sulphur Point Zone Substation . . . . . . . . . . . . . . . . . . . . . . . . . . . . .165 7.12.7. Tauranga CBD Reinforcement . . . . . . . . . . . . . . . . . . . . . . . . . . . . . . . . . . . . . . .166 7.12.8. Te Puke Subtransmission Upgrade . . . . . . . . . . . . . . . . . . . . . . . . . . . . . . .167 7.12.9. New Katere Zone Substation . . . . . . . . . . . . . . . . . . . . . . . . . . . . . . . . . . . . . . . .167 7.12.10. New Paengaroa Zone Substation . . . . . . . . . . . . . . . . . . . . . . . . . . . . . . . . . .168 7.12.11. New Te Maunga Zone Substation . . . . . . . . . . . . . . . . . . . . . . . . . . . . . . . . .168 7.12.12. Peat St Zone Substation Upgrade . . . . . . . . . . . . . . . . . . . . . . . . . . . . . . . .168 7.13. Network Development Project Summary . . . . . . . . . . . . . . . . . . .168
8. nETwoRk dEVELoPMEnT PLAn – PERfoRMAnCE EnhAnCEMEnT . . . . . . . . . . . . . . 172
8.1. Introduction . . . . . . . . . . . . . . . . . . . . . . . . . . . . . . . . . . . . . . . . . . . . . . . . . . . . . . . . . . . . . . . .172 8.2. Reliability Planning Considerations . . . . . . . . . . . . . . . . . . . . . . . . . . .172 8.2.1. Business Planning Drivers . . . . . . . . . . . . . . . . . . . . . . . . . . . . . . . . . . . . . . . . . . . .172 8.2.2. Reliability Performance Comparisons . . . . . . . . . . . . . . . . . . . . . . . . . . . .173 8.2.3. Reliability Road Map . . . . . . . . . . . . . . . . . . . . . . . . . . . . . . . . . . . . . . . . . . . . . . . . . . . .173 8.2.4. Reliability Performance – Lagging Measures . . . . . . . . . . . . . . . . .176 8.2.5. Reliability Performance – Leading Measures . . . . . . . . . . . . . . . . .176 8.2.6. Global Network Reliability vs Localised Reliability . . . . . . . . .176 8.3. Automation - Reliability Improvement . . . . . . . . . . . . . . . . . . . . . . . .176 8.3.1. Automation Philosophy . . . . . . . . . . . . . . . . . . . . . . . . . . . . . . . . . . . . . . . . . . . . . . . .176 8.3.2. Automation to be Applied at Zone Substations . . . . . . . . . . . . . .176 8.3.3. Automation to be Applied on Subtransmission
Networks . . . . . . . . . . . . . . . . . . . . . . . . . . . . . . . . . . . . . . . . . . . . . . . . . . . . . . . . . . . . . . . . . . . . .177 8.3.4. Automation on Distribution Networks . . . . . . . . . . . . . . . . . . . . . . . . . . . .177 8.4. Regional Reliability Performance Review . . . . . . . . . . . . . . . . . .177 8.4.1. Reliability Tactical Overview . . . . . . . . . . . . . . . . . . . . . . . . . . . . . . . . . . . . . . . . . .181 8.5. Worst Performing Feeder Analysis . . . . . . . . . . . . . . . . . . . . . . . . . . . . .181 8.5.1. Feeder Class F1 FIDI . . . . . . . . . . . . . . . . . . . . . . . . . . . . . . . . . . . . . . . . . . . . . . . . . . . .181 8.5.2. Feeder Class F2 FIDI . . . . . . . . . . . . . . . . . . . . . . . . . . . . . . . . . . . . . . . . . . . . . . . . . . . .182 8.5.3. Feeder Class F3 FIDI . . . . . . . . . . . . . . . . . . . . . . . . . . . . . . . . . . . . . . . . . . . . . . . . . . . .184 8.5.4. Feeder Class F4 FIDI . . . . . . . . . . . . . . . . . . . . . . . . . . . . . . . . . . . . . . . . . . . . . . . . . . . .186 8.5.5. Feeder Class F5 FIDI . . . . . . . . . . . . . . . . . . . . . . . . . . . . . . . . . . . . . . . . . . . . . . . . . . . .187 8.5.6. Numbers of Customers per Feeder . . . . . . . . . . . . . . . . . . . . . . . . . . . . . . .188 8.5.7. Reliability Actions Summary . . . . . . . . . . . . . . . . . . . . . . . . . . . . . . . . . . . . . . . . .188 8.6. Protection and Control System Development Plan . . . .188 8.6.1. Protection Systems . . . . . . . . . . . . . . . . . . . . . . . . . . . . . . . . . . . . . . . . . . . . . . . . . . . . . .188 8.6.2. SCADA Systems . . . . . . . . . . . . . . . . . . . . . . . . . . . . . . . . . . . . . . . . . . . . . . . . . . . . . . . . . .190 8.6.3. SCADA Master Stations . . . . . . . . . . . . . . . . . . . . . . . . . . . . . . . . . . . . . . . . . . . . . . .191 8.6.4. Load-control Systems . . . . . . . . . . . . . . . . . . . . . . . . . . . . . . . . . . . . . . . . . . . . . . . . . .192 8.6.5. Metering System Instrument Transformers . . . . . . . . . . . . . . . . . . . .192 8.6.6. GXP Metering Systems . . . . . . . . . . . . . . . . . . . . . . . . . . . . . . . . . . . . . . . . . . . . . . . .192 8.7. Streetlight Supply and Control Enhancement . . . . . . . . . . . .192 8.8. Environmental Enhancements . . . . . . . . . . . . . . . . . . . . . . . . . . . . . . . . . . .192 8.8.1. Strategic Perspective . . . . . . . . . . . . . . . . . . . . . . . . . . . . . . . . . . . . . . . . . . . . . . . . . . .192 8.8.2. Environmental Site Reviews . . . . . . . . . . . . . . . . . . . . . . . . . . . . . . . . . . . . . . . . . .192 8.8.3. Sensitive Sites . . . . . . . . . . . . . . . . . . . . . . . . . . . . . . . . . . . . . . . . . . . . . . . . . . . . . . . . . . . . .193 8.8.4. Environmental Action List . . . . . . . . . . . . . . . . . . . . . . . . . . . . . . . . . . . . . . . . . . . . .193 8.9. Safety Enhancements . . . . . . . . . . . . . . . . . . . . . . . . . . . . . . . . . . . . . . . . . . . . . . . .194 8.9.1. Health & Safety Plan . . . . . . . . . . . . . . . . . . . . . . . . . . . . . . . . . . . . . . . . . . . . . . . . . . . .194 8.9.2. Network Incident Register . . . . . . . . . . . . . . . . . . . . . . . . . . . . . . . . . . . . . . . . . . . .194 8.9.3. Red Pin Defect process . . . . . . . . . . . . . . . . . . . . . . . . . . . . . . . . . . . . . . . . . . . . . . .195 8.9.4. Zone Sub Integrity Assessment . . . . . . . . . . . . . . . . . . . . . . . . . . . . . . . . . . .195 8.9.5. Switchgear replacements . . . . . . . . . . . . . . . . . . . . . . . . . . . . . . . . . . . . . . . . . . . .195 8.9.6. LV Switchgear and Pillar replacements . . . . . . . . . . . . . . . . . . . . . . . . .195 8.9.7. New Equipment Trials . . . . . . . . . . . . . . . . . . . . . . . . . . . . . . . . . . . . . . . . . . . . . . . . . . .195

Return to Index 7ASSET MANAGEMENT PLAN ELECTRICITY NETWORKS FY2010 – FY2019
8.10. Smart Network Implementation . . . . . . . . . . . . . . . . . . . . . . . . . . . . . . . .195 8.10.1. “Smart Grid” Definition . . . . . . . . . . . . . . . . . . . . . . . . . . . . . . . . . . . . . . . . . . . . . . . . .195 8.10.2. Technology . . . . . . . . . . . . . . . . . . . . . . . . . . . . . . . . . . . . . . . . . . . . . . . . . . . . . . . . . . . . . . . . . .196 8.10.3. Standards . . . . . . . . . . . . . . . . . . . . . . . . . . . . . . . . . . . . . . . . . . . . . . . . . . . . . . . . . . . . . . . . . . . .197 8.10.4. Consumer Information Pricing . . . . . . . . . . . . . . . . . . . . . . . . . . . . . . . . . . . . . .197 8.10.5. Drivers for Implementation . . . . . . . . . . . . . . . . . . . . . . . . . . . . . . . . . . . . . . . . . . .197 8.10.6. A Smart Grid Roadmap for Powerco . . . . . . . . . . . . . . . . . . . . . . . . . . . . .197 8.10.7. Summary . . . . . . . . . . . . . . . . . . . . . . . . . . . . . . . . . . . . . . . . . . . . . . . . . . . . . . . . . . . . . . . . . . . . .198 8.11. Network Enhancement Project Summary . . . . . . . . . . . . . . . . . .199 8.12. Descriptions of Key Projects . . . . . . . . . . . . . . . . . . . . . . . . . . . . . . . . . . . . .199 8.12.1. Thames Coast to Manaia Link . . . . . . . . . . . . . . . . . . . . . . . . . . . . . . . . . . . . . .199 8.12.2. Putaruru Second Circuit . . . . . . . . . . . . . . . . . . . . . . . . . . . . . . . . . . . . . . . . . . . . . .199 8.12.3. Coroglen Kaimarama 110kV Line . . . . . . . . . . . . . . . . . . . . . . . . . . . . . . . . .199 8.12.4. Miscellaneous Cable Installations and Links . . . . . . . . . . . . . . . . . .200 8.12.5. Miscellaneous Series 1 Switch Replacements . . . . . . . . . . . . . .200 8.12.6. Coromandel Second Transformer Bank . . . . . . . . . . . . . . . . . . . . . . . . .200 8.12.7. Miscellaneous Noja installations and Recloser
Upgrades . . . . . . . . . . . . . . . . . . . . . . . . . . . . . . . . . . . . . . . . . . . . . . . . . . . . . . . . . . . . . . . . . . . .200 8.12.8. Miscellaneous Protection Upgrades . . . . . . . . . . . . . . . . . . . . . . . . . . . . . .200 8.12.9. Thames Second Subtransmission Circuit . . . . . . . . . . . . . . . . . . . . . .200 8.12.10. Whangamata Second Subtransmission Circuit . . . . . . . . . . . . . .200
9. fInAnCIAL . . . . . . . . . . . . . . . . . . . . . . . . . . . . . . . . . . . . . . . . . . . . . . . . . . . . . . . . . . . 204 9.1. Introduction . . . . . . . . . . . . . . . . . . . . . . . . . . . . . . . . . . . . . . . . . . . . . . . . . . . . . . . . . . . . . . .204 9.2. Assumptions and Strategic Influences Underlying
the Expenditure Forecasts . . . . . . . . . . . . . . . . . . . . . . . . . . . . . . . . . . . . . . . .204 9.2.1. Background and Significant Assumptions . . . . . . . . . . . . . . . . . . . .204 9.2.2. Strategic Influences . . . . . . . . . . . . . . . . . . . . . . . . . . . . . . . . . . . . . . . . . . . . . . . . . . . . .205 9.2.3. Multiple Stakeholder Influences . . . . . . . . . . . . . . . . . . . . . . . . . . . . . . . . . . . .205 9.2.4. Forecast Accuracy . . . . . . . . . . . . . . . . . . . . . . . . . . . . . . . . . . . . . . . . . . . . . . . . . . . . . . .205 9.3. Capital and Maintenance Expenditure Overview . . . . . . .205 9.3.1. Expenditure Categories . . . . . . . . . . . . . . . . . . . . . . . . . . . . . . . . . . . . . . . . . . . . . . . .205 9.3.2. Key Asset Management Programme . . . . . . . . . . . . . . . . . . . . . . . . . . . . .206 9.3.3. Relationship with Disclosed Expenditures . . . . . . . . . . . . . . . . . . . . .207 9.4. Capital Expenditure . . . . . . . . . . . . . . . . . . . . . . . . . . . . . . . . . . . . . . . . . . . . . . . . . . . .207 9.4.1. Treatment of Uncertainty in the Capital Expenditure
Forecasts . . . . . . . . . . . . . . . . . . . . . . . . . . . . . . . . . . . . . . . . . . . . . . . . . . . . . . . . . . . . . . . . . . . .207 9.4.2. Impact of Expenditure Forecast on Network
Average Age . . . . . . . . . . . . . . . . . . . . . . . . . . . . . . . . . . . . . . . . . . . . . . . . . . . . . . . . . . . . . . . .208 9.4.3. Customer Connection Capex . . . . . . . . . . . . . . . . . . . . . . . . . . . . . . . . . . . . . . .208 9.4.3.1 Assumptions behind the Customer Connection
Capex Forecast . . . . . . . . . . . . . . . . . . . . . . . . . . . . . . . . . . . . . . . . . . . . . . . . . . . . . . . . . . . . . . .208 9.4.4. System Growth Capex . . . . . . . . . . . . . . . . . . . . . . . . . . . . . . . . . . . . . . . . . . . . . . . .208 9.4.4.1 Assumptions behind the System Growth Capex Forecast . . .209 9.4.5. Reliability, Safety and Environment Capex . . . . . . . . . . . . . . . . . . . .209 9.4.5.1 Assumptions behind the Reliability, Safety and
Environment Capex Forecast . . . . . . . . . . . . . . . . . . . . . . . . . . . . . . . . . . . . . . . . . . .209 9.4.6. Asset Replacement and Renewal Capex . . . . . . . . . . . . . . . . . . . . . . .210
9.4.6.1 Assumptions behind the Asset Renewal Capex Forecast . . . .210 9.4.7. Asset Relocation Capex . . . . . . . . . . . . . . . . . . . . . . . . . . . . . . . . . . . . . . . . . . . . . . .210 9.4.7.1 Assumptions behind the Asset Relocation Capex Forecast .210 9.4.8. Forecast Capital Expenditures against Improvement
Register Content . . . . . . . . . . . . . . . . . . . . . . . . . . . . . . . . . . . . . . . . . . . . . . . . . . . . . . . . .211 9.4.9. Status of Capital Programme Initiatives . . . . . . . . . . . . . . . . . . . . . . . . .212 9.5. Operational Expenditures . . . . . . . . . . . . . . . . . . . . . . . . . . . . . . . . . . . . . . . . . .212 9.5.1. Treatment of Uncertainty in the Operational Expenditure
Forecasts . . . . . . . . . . . . . . . . . . . . . . . . . . . . . . . . . . . . . . . . . . . . . . . . . . . . . . . . . . . . . . . . . . . .213 9.5.2. Routine and Preventive Maintenance Opex . . . . . . . . . . . . . . . . . .213 9.5.2.1 Assumptions behind the Routine and Preventive
Maintenance Forecasts . . . . . . . . . . . . . . . . . . . . . . . . . . . . . . . . . . . . . . . . . . . . . . . . . . . . .213 9.5.3. Refurbishment and Renewal Maintenance . . . . . . . . . . . . . . . . . . .214 9.5.3.1 Assumptions behind the Refurbishment and Renewal
Maintenance Forecasts . . . . . . . . . . . . . . . . . . . . . . . . . . . . . . . . . . . . . . . . . . . . . . . . . . . . .214 9.5.4. Fault and Emergency Maintenance . . . . . . . . . . . . . . . . . . . . . . . . . . . . . . .215 9.5.4.1 Assumptions behind Fault and Emergency Maintenance
Forecast . . . . . . . . . . . . . . . . . . . . . . . . . . . . . . . . . . . . . . . . . . . . . . . . . . . . . . . . . . . . . . . . . . . . . . . . . .215 9.5.5. System Management and Operations Expenditures . . . . . .215 9.5.5.1 Assumptions behind System Management and
Operations Forecast . . . . . . . . . . . . . . . . . . . . . . . . . . . . . . . . . . . . . . . . . . . . . . . . . . . . . . . . .216 9.5.6. Status of Maintenance Initiatives . . . . . . . . . . . . . . . . . . . . . . . . . . . . . . . . . .216 9.6. Expenditure Forecast Summary . . . . . . . . . . . . . . . . . . . . . . . . . . . . . . . . .216 9.6.1. Summary of Changes from Previous Forecasts . . . . . . . . . . . . .217
10. RISk MAnAgEMEnT . . . . . . . . . . . . . . . . . . . . . . . . . . . . . . . . . . . . . . . 218 10.1. Introduction . . . . . . . . . . . . . . . . . . . . . . . . . . . . . . . . . . . . . . . . . . . . . . . . . . . . . . . . . . . . . . . .218 10.2. Corporate Risk Management and Governance . . . . . . . . . .218 10.2.1. Audit and Risk Committee . . . . . . . . . . . . . . . . . . . . . . . . . . . . . . . . . . . . . . . . . . . .218 10.2.2. Risk Management Charter . . . . . . . . . . . . . . . . . . . . . . . . . . . . . . . . . . . . . . . . . . . .218 10.2.3. Risk Assessment Matrix . . . . . . . . . . . . . . . . . . . . . . . . . . . . . . . . . . . . . . . . . . . . . . .218 10.3. Risk Management Process . . . . . . . . . . . . . . . . . . . . . . . . . . . . . . . . . . . . . . . .218 10.3.1. Risk Identification . . . . . . . . . . . . . . . . . . . . . . . . . . . . . . . . . . . . . . . . . . . . . . . . . . . . . . . . .218 10.3.2. Risk Analysis . . . . . . . . . . . . . . . . . . . . . . . . . . . . . . . . . . . . . . . . . . . . . . . . . . . . . . . . . . . . . . .219 10.3.3. Risk Evaluation . . . . . . . . . . . . . . . . . . . . . . . . . . . . . . . . . . . . . . . . . . . . . . . . . . . . . . . . . . . .219 10.3.4. Risk Treatment . . . . . . . . . . . . . . . . . . . . . . . . . . . . . . . . . . . . . . . . . . . . . . . . . . . . . . . . . . . . .219 10.3.5. Monitoring and Reporting . . . . . . . . . . . . . . . . . . . . . . . . . . . . . . . . . . . . . . . . . . . . .219 10.4. Key Risk Areas . . . . . . . . . . . . . . . . . . . . . . . . . . . . . . . . . . . . . . . . . . . . . . . . . . . . . . . . . . .219 10.4.1. Operational Continuity and Customer Relations . . . . . . . . . . . .219 10.4.2. Environmental Management . . . . . . . . . . . . . . . . . . . . . . . . . . . . . . . . . . . . . . . . .220 10.4.3. Regulatory and Legal Compliance . . . . . . . . . . . . . . . . . . . . . . . . . . . . . . . .220 10.4.4. Finance . . . . . . . . . . . . . . . . . . . . . . . . . . . . . . . . . . . . . . . . . . . . . . . . . . . . . . . . . . . . . . . . . . . . . . .220 10.4.5. Health and Safety . . . . . . . . . . . . . . . . . . . . . . . . . . . . . . . . . . . . . . . . . . . . . . . . . . . . . . . .220 10.5. Contingency Plans . . . . . . . . . . . . . . . . . . . . . . . . . . . . . . . . . . . . . . . . . . . . . . . . . . . . .220 10.5.1. Electricity Supply Continuity Plan . . . . . . . . . . . . . . . . . . . . . . . . . . . . . . . . .220 10.5.2. Major Network Event Procedures . . . . . . . . . . . . . . . . . . . . . . . . . . . . . . . . . .221 10.5.3. Substation Contingency Plans . . . . . . . . . . . . . . . . . . . . . . . . . . . . . . . . . . . . . .222 10.5.4. Business Continuity Plans (Process, Information
Technology and Loss of Precinct) . . . . . . . . . . . . . . . . . . . . . . . . . . . . . . . . .222 10.5.5. Pandemic Contingency Plans . . . . . . . . . . . . . . . . . . . . . . . . . . . . . . . . . . . . . . .222
10.6. Risk Management Application to Asset Management 222 10.6.1. Risk Management Process: Review of
Maintenance Methodology . . . . . . . . . . . . . . . . . . . . . . . . . . . . . . . . . . . . . . . . . . .223 10.6.2. Risk Management Process: Design Overhead Lines . . . . .223 10.6.3. Project Risk Management . . . . . . . . . . . . . . . . . . . . . . . . . . . . . . . . . . . . . . . . . . . . .224 10.7. Conclusions from Asset Management Risk Analysis 224 10.7.1. General Network Risk Issues . . . . . . . . . . . . . . . . . . . . . . . . . . . . . . . . . . . . . . . .224 10.7.2. Eastern Region At-Risk Situations . . . . . . . . . . . . . . . . . . . . . . . . . . . . . . . .225 10.7.3. Western Network At-Risk Situations . . . . . . . . . . . . . . . . . . . . . . . . . . . . .226
11. ASSET MAnAgEMEnT IMPRoVEMEnT . . . 227 11.1. Introduction . . . . . . . . . . . . . . . . . . . . . . . . . . . . . . . . . . . . . . . . . . . . . . . . . . . . . . . . . . . . . . . .227 11.2. Review of AM Maturity . . . . . . . . . . . . . . . . . . . . . . . . . . . . . . . . . . . . . . . . . . . . . .227 11.2.1. Background . . . . . . . . . . . . . . . . . . . . . . . . . . . . . . . . . . . . . . . . . . . . . . . . . . . . . . . . . . . . . . . . .227 11.2.2. Gap Analysis . . . . . . . . . . . . . . . . . . . . . . . . . . . . . . . . . . . . . . . . . . . . . . . . . . . . . . . . . . . . . . . .227 11.2.3. Commentary on the Gap Analysis . . . . . . . . . . . . . . . . . . . . . . . . . . . . . . . . .228 11.2.4. Constraints on Asset Management Process . . . . . . . . . . . . . . . . . .229 11.3. Improvement Initiatives . . . . . . . . . . . . . . . . . . . . . . . . . . . . . . . . . . . . . . . . . . . . .229 11.3.1. Network Performance Process . . . . . . . . . . . . . . . . . . . . . . . . . . . . . . . . . . . . .229 11.3.2. Maintenance Process Improvement Initiatives . . . . . . . . . . . . . .230 11.3.3. Summary of Improvement Initiatives Undertaken
in FY2010 . . . . . . . . . . . . . . . . . . . . . . . . . . . . . . . . . . . . . . . . . . . . . . . . . . . . . . . . . . . . . . . . . . . .230 11.4. Proposed Asset Management Advancement Projects 230 11.4.1. Proposed Future Information System Projects . . . . . . . . . . . . . . .230 11.4.2. Human Resource Projects . . . . . . . . . . . . . . . . . . . . . . . . . . . . . . . . . . . . . . . . . . .231 11.5. Asset Management Plan Improvements . . . . . . . . . . . . . . . . . . . .231 11.5.1. Asset Management Plan Improvements . . . . . . . . . . . . . . . . . . . . . . . .231 11.5.2. Planned Asset Management Plan Improvements . . . . . . . . . . .231 11.1. Framework Questions for Reference . . . . . . . . . . . . . . . . . . . . . . . . .241 11.2. B.3 Background and Objectives . . . . . . . . . . . . . . . . . . . . . . . . . . . . . . . . .241 11.3. B.4 Details of Assets Covered . . . . . . . . . . . . . . . . . . . . . . . . . . . . . . . . . . . .242 11.4. B.5 Service Levels . . . . . . . . . . . . . . . . . . . . . . . . . . . . . . . . . . . . . . . . . . . . . . . . . . . . . .243 11.5. B.6 Capital Works Planning . . . . . . . . . . . . . . . . . . . . . . . . . . . . . . . . . . . . . . . .243 11.6. B.7 Maintenance Planning . . . . . . . . . . . . . . . . . . . . . . . . . . . . . . . . . . . . . . . . .244 11.7. B.8 Risk Management . . . . . . . . . . . . . . . . . . . . . . . . . . . . . . . . . . . . . . . . . . . . . . . .245 11.8. B.9 Performance Evaluation . . . . . . . . . . . . . . . . . . . . . . . . . . . . . . . . . . . . . . .245

Return to Index8 ASSET MANAGEMENT PLAN ELECTRICITY NETWORKS FY2010 – FY2019
EXECUTIVE SUMMARY1.
Purpose of the Plan1.1.
The AMP is an important part of Powerco’s planning framework. It describes for our customers, shareholders, staff and partners how we will manage our electricity distribution network to meet the standards of reliability of electricity supply that our customers demand and the commercial performance that our shareholders expect. Importantly, this AMP sets out our plans for focussed investment in security, capacity and reliability to address an ageing network, increasing demand for reliable electricity supply and expenditure constrained below the level required to maintain reliability.
Efficient and effective management of Powerco’s electricity network assets is critical to the provision of an efficient service to our customers. With Powerco’s electricity network assets ranging in age from new to more than 50 years old and ageing, effective long-term network planning is a fundamental requirement of their management. Powerco continues to experience an Increasing Investment need as assets progressively reach the ends of their useful lives. We also continue to experience growth on our network, which in turn drives a need to invest in reinforcing and strengthening the core elements of the network. Costs can be reduced via the adoption of new technology and by ensuring effective and efficient capital delivery, however the scale of investment remains significant.
Within the context of restricted capital availability, Powerco has focussed its investment programme on a range of strategies that have been confirmed as offering optimal benefit to stakeholders. This plan contains these specific details on our short and long-range planning for network development, renewal and maintenance and, more particularly contains detail on the following electricity Asset Management-related strategies:
Renewal and modernisation (see Section 6);1.
Increasing the redundancy of the core network (see Section 7);2.
Standardisation of systems and processes (see Section 11); and3.
Development of Smart Network (see Section 8).4.
In terms of structure, the AMP is a high-level document providing management and stakeholders with a broad overview of Powerco’s Asset Management policies, asset details, service levels, capital and maintenance works planning, expenditure forecasts, risk management and performance evaluation. This AMP incorporates information from a range of other internal documents. It sets out the performance criteria for the assets and summarises the actions needed to achieve those performance criteria. Its structure is shown in Figure 1.1.
Who wants what from the assets?
What is the state of the assets?
What performance are we targeting from the assets? How are we doing vs. the target? What are the gaps?
How are we managing the network and solving any performance gaps?
What does this mean for the works programmes and required expenditure?
How can we improve?
Section 2Define StakeholdersDefine AM Drivers
Section 3Describe Assets
Section 4Set Performance Targets
Section 5Performance Evaluation
Section 10Analyse Network Risks
Section 6, 7 and 8Develop Work ProgrammesLinked with AM Driver
Section 9Set Expenditure Forecasts
Section 6Set Asset Lifecycle StrategyAnalyse Renewal Needs
Section 8Reliability, Safety, Environment Enhancement NeedsProtection & Control, Smart Network Development
Section 7Security Criteria Prepare Load Forecasts System Growth Needs
Section 11Develop AM Improvement Initiatives
Figure 1.1: AMP Structure
Developing this plan is a key step in ensuring that the needs of all stakeholders are properly considered and incorporated into the long-term management strategies, and that the plans provide, subject to any regulatory constraints, the optimum balance between levels of service and the efficient costs to provide the required service.
Period Covered1.2.
This Asset Management Plan covers a period of 10 years, beginning on 1 July 2010 and continuing to 2021. It replaces the April 2009 Asset Management Plan. The main focus of analysis is the first three to five years, for which plans are generally firm. Beyond five years, general forecasts are made and reviewed annually. Expenditure forecasts cover a 10-year period from FY2011 to FY2021. In some instances, it is necessary to have longer- term (out to 20 years) plans to provide the context needed for the AMP planning periods. The Asset Management Plan was approved by the Powerco Board in March 2010.
Return to Index 9ASSET MANAGEMENT PLAN ELECTRICITY NETWORKS FY2010 – FY2019
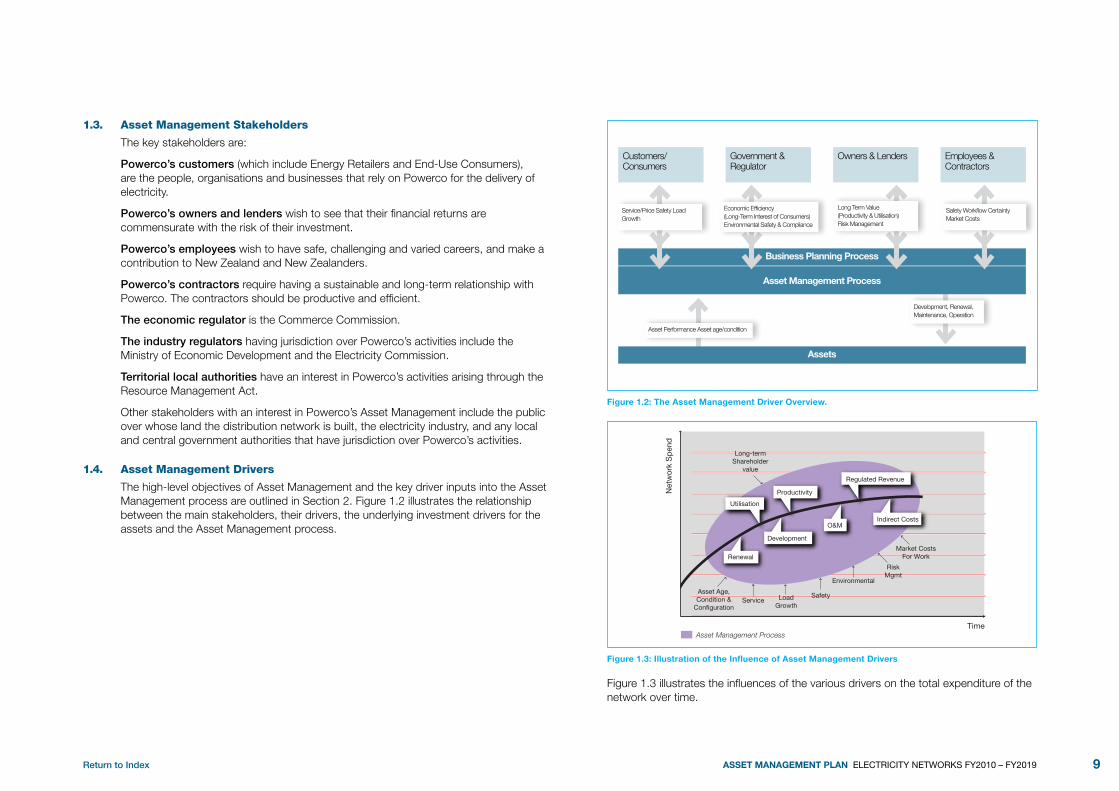
Asset Management Stakeholders1.3.
The key stakeholders are:
Powerco’s customers (which include Energy Retailers and End-Use Consumers), are the people, organisations and businesses that rely on Powerco for the delivery of electricity.
Powerco’s owners and lenders wish to see that their financial returns are commensurate with the risk of their investment.
Powerco’s employees wish to have safe, challenging and varied careers, and make a contribution to New Zealand and New Zealanders.
Powerco’s contractors require having a sustainable and long-term relationship with Powerco. The contractors should be productive and efficient.
The economic regulator is the Commerce Commission.
The industry regulators having jurisdiction over Powerco’s activities include the Ministry of Economic Development and the Electricity Commission.
Territorial local authorities have an interest in Powerco’s activities arising through the Resource Management Act.
Other stakeholders with an interest in Powerco’s Asset Management include the public over whose land the distribution network is built, the electricity industry, and any local and central government authorities that have jurisdiction over Powerco’s activities.
Asset Management drivers1.4.
The high-level objectives of Asset Management and the key driver inputs into the Asset Management process are outlined in Section 2. Figure 1.2 illustrates the relationship between the main stakeholders, their drivers, the underlying investment drivers for the assets and the Asset Management process.
Asset Management Process
Business Planning Process
Customers/Consumers
Assets
Government & Regulator
Owners & Lenders Employees & Contractors
Safety Workflow Certainty Market Costs
Service/Price Safety Load Growth
Asset Performance Asset age/condition
Development, Renewal, Maintenance, Operation
Long Term Value (Productivity & Utilisation) Risk Management
Economic Efficiency (Long-Term Interest of Consumers) Environmental Safety & Compliance
Figure 1.2: The Asset Management Driver Overview.
Net
wor
k S
pen
d
Asset Management ProcessTime
Renewal
Asset Age,Condition &
Configuration
Development
Utilisation
Productivity
Long-termShareholder
value
Regulated Revenue
O&MIndirect Costs
Service LoadGrowth
Safety
Environmental
RiskMgmt
Market CostsFor Work
Figure 1.3: Illustration of the Influence of Asset Management Drivers
Figure 1.3 illustrates the influences of the various drivers on the total expenditure of the network over time.

Return to Index10 ASSET MANAGEMENT PLAN ELECTRICITY NETWORKS FY2010 – FY2019
As alluded to above and in the Chief Executive’s Statement, three drivers are worthy of particular mention: (1) An ageing network (notwithstanding significantly increased investment), (2) deteriorating service (in particular worsening reliability) and (3) load growth, which has eroded redundancy in the core (backbone) network. These drivers are discussed in more detail in the following sections:
Ageing Network: Sections 3.5 – 3.10;1.
Worsening Reliability: Section 4.2;2.
Load Growth: Section 7.5.3.
The need for increased expenditure to replace assets was confirmed by independent consultants Farrier Swier Consulting in its report to the Commerce Commission on electricity distribution network asset management. Farrier Swier found that Powerco may need to increase renewal expenditure in the period 2009 to 2014 by 27% (to $30 million in 2012) and, 2014 to 2019 by 71% (to $44 million in 2017).
Balancing Constraints, Asset Management drivers and Conflicting 1.5. Stakeholder needs
At a strategy level, constraints, Asset Management drivers and the needs and interests of various stakeholders are evaluated and considered as part of the corporate planning process and these are applied during the network planning process. For instance, at a strategy level, the need to increase investment to manage an ageing network, load growth and worsening reliability has to be balanced against the revenue that Powerco is allowed to earn under the current default price path and investors (debt and equity) expectations of earning risk adjusted returns on their investment. Figures 1 and 2 of the Chief Executive’s statement highlight the magnitude of investment needed in the network to renew an increasingly ageing network and increase the security of the core network.
At a tactical and operational level in the network planning process, the investment policy and asset strategy shapes and is shaped by Powerco’s multi-stakeholder assessment process. This process is a key part of the way in which network development and renewal programmes are formed. At its core, the process is one of “optimisation” where the portfolio of projects is evaluated and then optimised to form programmes of work that offer the best benefit to stakeholders within available expenditure allowances.
NPAM Create
Templates automatically
for final works plan
Reporting
Works Plan
Coin Scoring System based on predifined
budget
Initial Priority of high to cut to 120% of budget then use Coin prioritisation to cut to 100% of budget and EXP Draft Plan.
Budget only gets confirmed after Draft Plan was sent out. Should it change the priortisation needs to be run again.
Manual Filing System
Gat
e K
eepe
r (P
lann
ing
Team
)
Asset Condition Analysis
AMPs
Field Input
Budget gets confirmed or
changed
Consultation
Work Plan
Issue
Automated population of Coin
Improvement Register Database
Figure 1.4: Network Works Programme Optimisation Process
Figure 1.4 provides a more detailed outline of the multi-stakeholder analysis used to develop optimised investment programmes. The primary objectives of the optimisation process are:
To provide a consistent approach to the development of capital works programmes •that balances (potentially conflicting) stakeholder requirements.
To eliminate (or mitigate) any high risks to public safety, network performance, •customer outcomes, public relations, or employee engagement.
To maximise the strategic value of the portfolio of projects that make up the capital •works programme.
Potential projects are entered into the Improvement Register, which is essentially a database. The projects come from various sources, such as internal Asset Management plans or project ideas from the field. Projects are scored against 14 different strategic value criteria, each of which comes under four strategic themes, and the projects considered for go/no go under a combination of budget and risk profile constraints. Projects that have a high strategic value pass into the annual works

Return to Index 11ASSET MANAGEMENT PLAN ELECTRICITY NETWORKS FY2010 – FY2019
programme. Those that have a lesser strategic value are deferred to future years. The system has reporting tools for producing Works Plan reports and Project Approval documentation (NPAM).
Asset Management Information Systems1.6.
Given Powerco’s history of growth and acquisition, standardisation of systems and processes are key strengths of Powerco’s employees and this has been a significant focus for management over recent years. A range of Asset Management information systems have been implemented at Powerco to support the Asset Management processes, including the following systems that Powerco considers to be core:
GIS is our key system for storage of spatial network data;•
JDE is our key system for works and financial management; and •
SCADA is our key system for real time operation and control of the network. •
A number of significant data and system standardisation projects are currently being undertaken to enhance this core capability. These projects are summarised below:
The centralisation of asset location and attributed data into the GIS. A key goal •of the systems management is to make the GIS system the master for all spatial data. This involves the synchronisation of information from ENS and other ancillary databases;
Normalisation of naming and coding conventions for asset and network sites in all •core systems to minimise discrepancies;
Updating and redrawing critical zone substation schematics and protection •diagrams;
Integration between network modelling software applications (Synergy and PSS •Sincal) and network data contained in GIS. This will significantly minimise the amount of rework and inaccuracies introduced in maintaining independent datasets;
The completion of the GIS Network connectivity project will improve the consistency •and completeness of critical network hierarchy and topology, especially in the high-voltage network, which will benefit all dependent systems;
Migration of Western SCADA to a common Master Station platform; •
A project has recently been completed to reduce the backlog of as-built drawings •awaiting input in the GIS to an acceptable level; and
The continued refinement of Powerco’s maintenance management system (GEM) •including the progressive rollout of field automation (SPA).
Future network information improvement would result from a rolling audit of network data from the field to gather information, like the size of a conductor and location of street lights.
The Asset Management information systems are described in more detail in Section 2.8.
Service Provision1.7.
Powerco has developed a service provision strategy to set the long-term direction for the management of construction and maintenance activities in line with its business model and corporate objectives. This strategy has been designed to deliver long term productivity gains and maximise design innovation. The strategy was developed in 2004 and has resulted in a move to outsourcing detailed design and (capital and operational) field work via alliance and patch based contracts.
The delivery strategy uses competitive market principles to deliver sustainable improvements in the cost, quality and safety of construction and maintenance services on the electricity and gas networks. These include:
Facilitating Service Provider resources with expertise matched to the work •requirement in the locations required;
Maximising the Service Provider’s control over the inputs to its services to allow it to •meet the service performance level;
Utilising competitive tension to encourage continuous improvement in the cost of the •delivered service;
Minimising the level of management of Service Providers while ensuring appropriate •control is maintained to deliver the desired service outcome;
Maintaining a high level of safety performance by Service Providers; and•
Fairly allocating risk between Powerco and the Service Provider.•
The strategy is underpinned by a series of guiding principles has been developed to provide greater detail on how the service provision strategy can be achieved. The service provision principles cover:
Facilitation of resources to meet Powerco’s needs;•
Delegation of responsibility to Service Providers;•
Utilising competitive tension to improve productivity and innovation;•
Optimising the level of Service Provider management; and•
The allocation, communication and recognition of risk.•
Powerco’s Service Delivery strategy has delivered strong improvements in works completion performance. It is currently being reviewed to ensure that the arrangements are able to demonstrate to all stakeholders that capital and maintenance costs are efficient.
As part of Powerco’s process to validate delivery efficiency, about 5% ($6m) of additional capital work (primarily pole replacement work) is being tendered in FY10. This is being done to provide benchmark data – which is particularly important given the age and renewal profile of Powerco’s overhead lines.
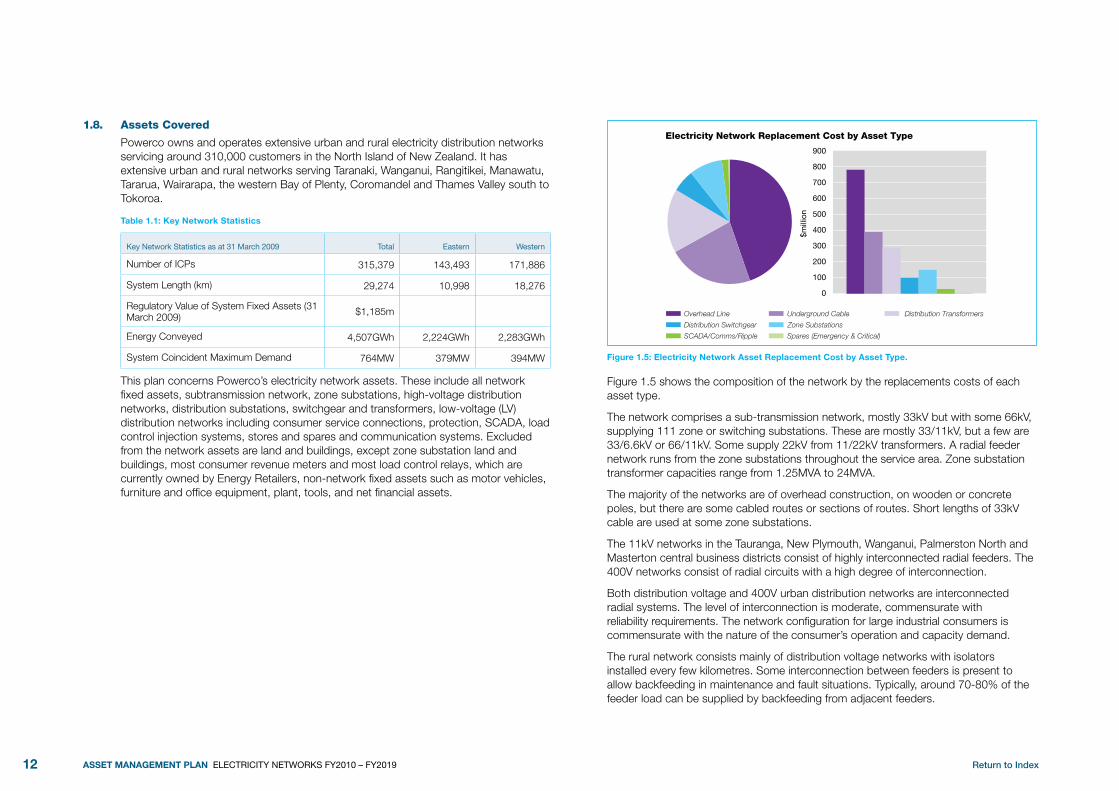
Return to Index12 ASSET MANAGEMENT PLAN ELECTRICITY NETWORKS FY2010 – FY2019
Assets Covered1.8.
Powerco owns and operates extensive urban and rural electricity distribution networks servicing around 310,000 customers in the North Island of New Zealand. It has extensive urban and rural networks serving Taranaki, Wanganui, Rangitikei, Manawatu, Tararua, Wairarapa, the western Bay of Plenty, Coromandel and Thames Valley south to Tokoroa.
Table 1.1: Key Network Statistics
Key Network Statistics as at 31 March 2009 Total Eastern Western
Number of ICPs 315,379 143,493 171,886
System Length (km) 29,274 10,998 18,276
Regulatory Value of System Fixed Assets (31 March 2009) $1,185m
Energy Conveyed 4,507GWh 2,224GWh 2,283GWh
System Coincident Maximum Demand 764MW 379MW 394MW
This plan concerns Powerco’s electricity network assets. These include all network fixed assets, subtransmission network, zone substations, high-voltage distribution networks, distribution substations, switchgear and transformers, low-voltage (LV) distribution networks including consumer service connections, protection, SCADA, load control injection systems, stores and spares and communication systems. Excluded from the network assets are land and buildings, except zone substation land and buildings, most consumer revenue meters and most load control relays, which are currently owned by Energy Retailers, non-network fixed assets such as motor vehicles, furniture and office equipment, plant, tools, and net financial assets.
$mill
ion
0
900
800
700
500
600
300
100
400
200
Electricity Network Replacement Cost by Asset Type
Overhead Line Underground Cable Distribution Transformers
Distribution Switchgear Zone Substations
SCADA/Comms/Ripple Spares (Emergency & Critical)
Figure 1.5: Electricity Network Asset Replacement Cost by Asset Type.
Figure 1.5 shows the composition of the network by the replacements costs of each asset type.
The network comprises a sub-transmission network, mostly 33kV but with some 66kV, supplying 111 zone or switching substations. These are mostly 33/11kV, but a few are 33/6.6kV or 66/11kV. Some supply 22kV from 11/22kV transformers. A radial feeder network runs from the zone substations throughout the service area. Zone substation transformer capacities range from 1.25MVA to 24MVA.
The majority of the networks are of overhead construction, on wooden or concrete poles, but there are some cabled routes or sections of routes. Short lengths of 33kV cable are used at some zone substations.
The 11kV networks in the Tauranga, New Plymouth, Wanganui, Palmerston North and Masterton central business districts consist of highly interconnected radial feeders. The 400V networks consist of radial circuits with a high degree of interconnection.
Both distribution voltage and 400V urban distribution networks are interconnected radial systems. The level of interconnection is moderate, commensurate with reliability requirements. The network configuration for large industrial consumers is commensurate with the nature of the consumer’s operation and capacity demand.
The rural network consists mainly of distribution voltage networks with isolators installed every few kilometres. Some interconnection between feeders is present to allow backfeeding in maintenance and fault situations. Typically, around 70-80% of the feeder load can be supplied by backfeeding from adjacent feeders.

Return to Index 13ASSET MANAGEMENT PLAN ELECTRICITY NETWORKS FY2010 – FY2019
The condition of all infrastructure assets is maintained to a level commensurate with the nature of the asset, the environmental conditions and the consumers’ reliability requirements. Table 1.2 summarises the average standard life and average age for different asset categories. An average standard life is given for each asset category because there are assets with different standard lives included in the general asset categories.
Table 1.2: Average Age of Assets
Asset CategoryAverage Design Life (Weighted by Cost)
Average Age at 30/06/06
(Weighted by Cost) [1]
Overhead Line 57.16 30.32
Underground Cable 49.29 22.07
Distribution Transformer 55.00 24.80
Subtransmission and Distribution Switchgear 37.24 17.92
Zone Substation Assets 45.86 27.45
Total Asset Replacement Cost vs Age
Rep
lace
men
t C
ost
($00
0)
0
30,000
20,000
10,000
40,000
50,000
60,000
70,000
90,000
110,000
80,000
100,000
Transformers Switchgear Transformers Underground Overhead
65605550454035302520151050 ODL
Age (Years)
Figure 1.6: Total Asset Age Profile
The age profile for the entire infrastructure asset base, presented as a nine-year moving average, is given in Figure 1.6 above. Costs represent Powerco’s estimate of actual replacement cost for brownfield construction at scales typical of actual anticipated levels. It is noted that these rates are higher than the ODV replacement costs.
While it is practical that longer-term renewal forecasts of the type above are made on the basis of age profiles, actual commitment to renewal projects (used for near-term forecasting) is based on the condition of the assets rather than their age.
Performance Level objectives1.9.
The AMP recognises that a trade-off exists in the Asset Management process between performance, cost and risk. By minimising the costs of the assets, the asset manager may compromise on asset performance and asset risk; by minimising the asset risk, service performance and cost may be compromised.
The target levels of service chosen in this plan are based on a combination of past practice, consultation with customer and consumer groups, economic factors, recognised international best practice, legal obligations and safety considerations.
Powerco seeks to achieve a balance between legislative, regulatory, owner/financier requirements and consumer expectations in setting these performance criteria. The levels of service adopted by Powerco for its Asset Management Plan are based on the internationally recognised measurements, SAIDI, SAIFI, and CAIDI, and accepted New Zealand lines companies’ best practice.
The customer consultation process has been an important part in the selection of appropriate supply reliability targets. This consultation process is continuing and is confirming that the consumers’ needs will be satisfied if Powerco meets its Service Performance targets. Service Performance is defined as:
“Delivery of electricity line function services to meet consumer load requirements within targeted quality and reliability limits”.
Table 1.3: Reliability Performance Targets
SAIFI (B+C) SAIDI (B+C) CAIDI (B+C)
Target 2.56 170 66
Note: (B + C) refers to total distributor reliability, including planned outages (class B) and unplanned outages (class C).
The balance between service and economic efficiency (asset investment/utilisation and maintenance and operating costs) needs to be considered in Asset Management decision-making. Table 1.4 sets out some of the expenditure-related targets.

Return to Index14 ASSET MANAGEMENT PLAN ELECTRICITY NETWORKS FY2010 – FY2019
Table 1.4: Expenditure Performance Targets
Asset Management Driver: Economic Efficiency, Risk Management & Long-Term Value
KPI Description FY2010 B FY2011 F FY2012 F FY2013 F FY2014 F
Direct Cost per km of line ($/km) 1,197 1,186 1,196 1,209 1,211
Direct Cost per Asset Base (RC) (%) 1.96% 1.97% 2.00% 2.04% 2.07%
Maintenance Expenditure per Asset Base (RC) (%) 1.50% 1.49% 1.52% 1.55% 1.57%
Capital Expenditure per Asset Base (%) 4.31% 4.87% 5.06% 5.26% 5.34%
Renewal Expenditure per Depreciation (%) 59.4% 57.6% 74.1% 81.3% 89.2%
Growth Expenditure per Change in Transformer Capacity ($/kVA) 803 850 872 894 855
Powerco is efficient in terms of its spend when compared to other electricity distributors. For instance, Powerco’s operating expenditure is below average and its average revenue is close to average.
Opex $ % of RAB Opex $ / km Opex $ / ICP
Powerco 2.51 1,988 185
Average 2.81 2,801 211
Medium 3.17 2,579 269
Minimum 1.77 1,233 113
Maximum 4.96 7,583 587
Gross Line Revenue c/kWh
Gross Line Revenue $/ICP
Distribution Revenue c/kWH
Distribution Revenue $/ICP
Powerco 6.3 880 4.8 673
Average 6.1 916 4.5 680
Medium 6.0 927 4.4 690
Minimum 4.2 442 3.3 336
Maximum 10.4 1,612 8.8 1,346
Performance Measurement, Evaluation and Improvement1.10.
Overall network reliability performance, as measured by SAIDI, was above Powerco’s internal target (unfavourable) in 2009. The SAIFI index was slightly above target (unfavourable), as shown in Table 1.5.
Powerco’s reliability performance to 31 March 2009 was adversely affected by storms (July 2008 affecting the Valley and Manawatu networks, and some Grid Exit Point events). Excluding these storms, the performance was only somewhat adverse when compared with the target.
The historical reliability performance pattern indicates a continuing theme of slightly greater than target faults per unit of HV line (which is consistent with an ageing network), leading to slightly greater than target numbers of interruptions and SAIFI. The actual CAIDI is rather higher than target, caused in part by the lack of back-up supply routes and difficulty of access in some parts of the network.
With the oncoming wave of renewal needed, it is expected that reliability performance will worsen unless renewal activity is able to keep up. The overhead line age profile indicates that the average age of overhead line assets is increasing. To a certain extent, it will be possible to mask this impact through implementation of automation, more fuses, reclosers and sectionalisation (although this may see a rise in momentary outages), but in the main it will be necessary to address this through increased levels of renewal activity.
0
10
20
30
40
50
SA
IDI M
ins
Significant Impacts on SAIDI
1/04
/200
8
15/0
4/20
08
29/0
4/20
08
13/0
5/20
08
27/0
5/20
08
10/0
6/20
08
24/0
6/20
08
8/07
/200
8
22/0
7/20
08
5/08
/200
8
19/0
8/20
08
2/09
/200
8
16/0
9/20
08
30/0
9/20
08
14/1
0/20
08
28/1
0/20
08
11/1
1/20
08
25/1
1/20
08
9/12
/200
8
23/1
2/20
08
6/01
/200
9
20/0
1/20
09
3/02
/200
9
17/0
2/20
09
3/03
/200
9
17/0
3/20
09
31/0
3/20
09
Manawatu & Taihape Wind & Rain Storm
Whangamata Outage Bunnythorpe Outage
L2 Storm Event Wairarapa & Taranaki
Valley Region Wind & Rain Storm
Loss Waihi, Waihi Beach & Whangamata Sub
Loss Whangamata Sub
Storm Event Tauranga Region
L2 Storm Event Valley & Tauranga Region
Transpower Loss Tauranga Region
Figure 1.7: SAIDI Performance over Time to March 2009
Powerco’s 2009 reliability performance is summarised in Table 1.5. In overview, the SAIDI performance is adversely affected by the number of faults and the ability to restore supply quickly to most customers following faults. A focus on renewal and greater levels of network automation is being taken as a result.
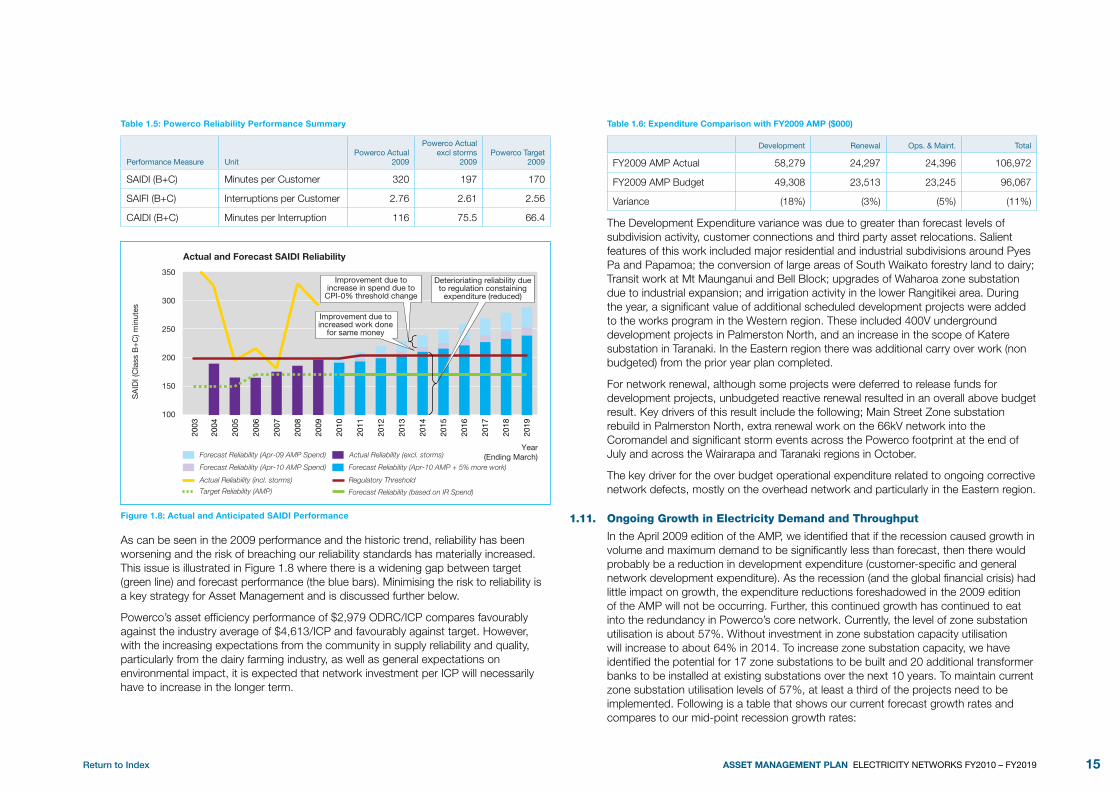
Return to Index 15ASSET MANAGEMENT PLAN ELECTRICITY NETWORKS FY2010 – FY2019
Table 1.5: Powerco Reliability Performance Summary
Performance Measure UnitPowerco Actual
2009
Powerco Actual excl storms
2009Powerco Target
2009
SAIDI (B+C) Minutes per Customer 320 197 170
SAIFI (B+C) Interruptions per Customer 2.76 2.61 2.56
CAIDI (B+C) Minutes per Interruption 116 75.5 66.4
Actual and Forecast SAIDI Reliability
SA
IDI (
Cla
ss B
+C
) min
utes
Year (Ending March)
100
150
200
250
300
350
Forecast Reliability (Apr-09 AMP Spend) Actual Reliability (excl. storms)
Forecast Reliability (Apr-10 AMP + 5% more work)Forecast Reliability (Apr-10 AMP Spend)
2019
2018
2017
2016
2015
2014
2013
2012
2011
2010
2009
2008
2007
2006
2005
2004
2003
Deterioriating reliability due to regulation constaining
expenditure (reduced)
Improvement due to increase in spend due to
CPI-0% threshold change
Improvement due to increased work done
for same money
Forecast Reliability (based on IR Spend)Target Reliability (AMP)
Regulatory ThresholdActual Reliability (incl. storms)
Figure 1.8: Actual and Anticipated SAIDI Performance
As can be seen in the 2009 performance and the historic trend, reliability has been worsening and the risk of breaching our reliability standards has materially increased. This issue is illustrated in Figure 1.8 where there is a widening gap between target (green line) and forecast performance (the blue bars). Minimising the risk to reliability is a key strategy for Asset Management and is discussed further below.
Powerco’s asset efficiency performance of $2,979 ODRC/ICP compares favourably against the industry average of $4,613/ICP and favourably against target. However, with the increasing expectations from the community in supply reliability and quality, particularly from the dairy farming industry, as well as general expectations on environmental impact, it is expected that network investment per ICP will necessarily have to increase in the longer term.
Table 1.6: Expenditure Comparison with FY2009 AMP ($000)
Development Renewal Ops. & Maint. Total
FY2009 AMP Actual 58,279 24,297 24,396 106,972
FY2009 AMP Budget 49,308 23,513 23,245 96,067
Variance (18%) (3%) (5%) (11%)
The Development Expenditure variance was due to greater than forecast levels of subdivision activity, customer connections and third party asset relocations. Salient features of this work included major residential and industrial subdivisions around Pyes Pa and Papamoa; the conversion of large areas of South Waikato forestry land to dairy; Transit work at Mt Maunganui and Bell Block; upgrades of Waharoa zone substation due to industrial expansion; and irrigation activity in the lower Rangitikei area. During the year, a significant value of additional scheduled development projects were added to the works program in the Western region. These included 400V underground development projects in Palmerston North, and an increase in the scope of Katere substation in Taranaki. In the Eastern region there was additional carry over work (non budgeted) from the prior year plan completed.
For network renewal, although some projects were deferred to release funds for development projects, unbudgeted reactive renewal resulted in an overall above budget result. Key drivers of this result include the following; Main Street Zone substation rebuild in Palmerston North, extra renewal work on the 66kV network into the Coromandel and significant storm events across the Powerco footprint at the end of July and across the Wairarapa and Taranaki regions in October.
The key driver for the over budget operational expenditure related to ongoing corrective network defects, mostly on the overhead network and particularly in the Eastern region.
ongoing growth in Electricity demand and Throughput1.11.
In the April 2009 edition of the AMP, we identified that if the recession caused growth in volume and maximum demand to be significantly less than forecast, then there would probably be a reduction in development expenditure (customer-specific and general network development expenditure). As the recession (and the global financial crisis) had little impact on growth, the expenditure reductions foreshadowed in the 2009 edition of the AMP will not be occurring. Further, this continued growth has continued to eat into the redundancy in Powerco’s core network. Currently, the level of zone substation utilisation is about 57%. Without investment in zone substation capacity utilisation will increase to about 64% in 2014. To increase zone substation capacity, we have identified the potential for 17 zone substations to be built and 20 additional transformer banks to be installed at existing substations over the next 10 years. To maintain current zone substation utilisation levels of 57%, at least a third of the projects need to be implemented. Following is a table that shows our current forecast growth rates and compares to our mid-point recession growth rates:

Return to Index16 ASSET MANAGEMENT PLAN ELECTRICITY NETWORKS FY2010 – FY2019
Table 1.7: Electricity Volume Forecast
kWh Growth forecast (Electricity Only)
Assumption 2010 2011 2012 2013 2014 2015
Eastern Region (Model) 1.25 1.75 2.25 2.50 2.50 2.50
Western Region (Model) 1.25 1.25 1.25 1.25 1.25 1.25
Eastern Region (medium recession scenario) 1.5 1.5 2.5 2.5 2.5 2.5
Western Region (medium recession scenario) 0.67 0.67 1.0 1.0 1.0 1.0
Maintenance, Renewal and development Plans1.12.
This AMP describes the life cycle management perspectives for renewal and maintenance strategy management in Section 6, development (system growth) in Section 7 and performance improvement measures in Section 8.
Powerco’s maintenance and renewal policy is based on balancing the cost of repair and replacement against the consequences of failure. The maintenance and renewal planning process determines the most cost-effective method for reducing the risk of the asset not achieving the required performance level. This is a key focus for the business, given the risk to reliability presented above.
Powerco’s maintenance and renewal comprises:
Routine inspections and condition monitoring;•
Routine servicing;•
Evaluation of inspection and condition monitoring results to determine maintenance •and renewal requirements;
Evaluating faults to predict maintenance and renewal requirements; and•
Performing maintenance (repairs, refurbishment or renewal).•
The decision to continue to maintain an asset or to renew it is made considering the ongoing costs of maintaining the existing assets vs. the cost of renewing the asset, including the risks of not meeting performance requirements in each case. Individual asset life cycle plans are presented for each asset type, along with plans for maintenance and renewal of the network assets.
An outcome of this process has illustrated the magnitude of the investment needed in the network to renew an increasingly ageing network and increase the security of the core network is significant. Based on our analysis, a further $17m of annual expenditure is necessary to reduce the risk to reliability to an acceptable level.
Ave
rage
Age
Network Average Age and Forecast Capex
Total Capex Average Network Age Year (ending June)
Tota
l Cap
ex ($
m)
31
30
29
28
27
26
25
24$0
$20
$40
$60
$80
$100
$120
$140
2006
2007
2008
2009
2010
2011
2012
2013
2014
2015
2016
2017
2018
2019
2021
2020
Figure 1.9: Network Age and Forecast Capex
Consistent with this (as evidenced above), the risk to reliability is increasing and, as a result, we are increasing our focus on the replacement and modernisation of the network.
Development of the subtransmission network, distribution network and 400V distribution network over the planning period is determined from the asset management drivers, planning criteria and forecast load growth. Where drivers or planning criteria are not satisfied, development options are evaluated and programmed. Development plans have been prepared for the long- and medium-term planning periods.
The Maintenance, Renewal and Development planning analysis indicates that Powerco could be spending approximately $17m per year - more than it is forecasting on network development and network renewal respectively. That is, if the regulatory environment were more amenable towards investment, Powerco could justifiably be spending this much more.

Return to Index 17ASSET MANAGEMENT PLAN ELECTRICITY NETWORKS FY2010 – FY2019
The process of deriving expenditure forecasts is an iterative one that seeks to optimise the performance and risk levels in the network within these competing constraints (refer Section 4.1). In particular, projected network expenditure needs to be given consideration within the context of the revenue allowed by regulatory regime and Powerco’s mandate of delivering long-term sustainable earnings and interest payments to its capital providers.
The programme of work for a given period is passed through the Multi-Stakeholder Prioritisation process (refer to Section 2.6). With this process, the strategic values and risks associated with each potential project are weighed against their associated dollar spend, and a decision can be made on the best projects to include in a work programme given a certain budget constraint.
The forecast expenditure, including development, renewal and maintenance, over the planning period, is given in Tables 1.10 to 1.12.
Smart networks1.13.
Powerco has for many years been adopting Smart Grid technology (albeit under the name of automation). Becoming a Smart Network is an addition to this AMP. The aims of Smart Networks include self-healing networks and networks that can shift load from peak times to reduce peak demand growth. Smart Networks are something that regulators in many countries are now paying greater attention to because they are perceived to offer improvements in performance to customers. Well thought out and implemented Smart Grid technologies offer exciting performance benefits. Smart Network technologies also fit well with our business plan objectives of improving reliability through automated solutions and managing increasing investment profiles through non-asset solutions. The 2010 AMP sets out initiatives that are consistent with the ESRI and Energy Networks Australia visions of smart networks.
Expenditure forecasts1.14.
The network expenditure forecasts detail the development, renewal and maintenance expenditure to:
Maintain levels of service performance for the assets;•
Develop the assets to meet the new and future load growth; and•
Improve service performance where the service standards are not being met.•
As already mentioned, a key focus of this AMP is on reducing the risk to adverse reliability performance (from the failure of ageing assets or the loss of redundancy in the core network due to load growth). Hence, to further support our key works programmes, overall expenditure has been increased by an average of $17m per annum. The increase in expenditure has been made possible by the increase in allowable revenue under the Default Price Path (that regulates Powerco’s revenue) effective from 1 April 2010.
Powerco’s network expenditure forecasts are developed from the bottom up and the top down. Working from the bottom up, expenditure forecasts are developed in conjunction with our multi-stakeholder portfolio optimisation planning process, taking into consideration the age and condition of existing assets, targeted reliability and security standards, projected growth rates, the current regulatory constraints on expenditure, and the performance expectations of the company’s owners. Working from the top down (which are compared with the bottom-up forecasts), the expenditure forecasts comprise the previous AMP expenditure forecast, adjusted for actual CPI change, with adjustment for specific issues noted and agreed to by key stakeholders during the previous year. Generally, the adjustments to the expenditure forecasts have been upwardly trending. There have been several reviews of the forecasts driven from the asset planning processes.

Return to Index18 ASSET MANAGEMENT PLAN ELECTRICITY NETWORKS FY2010 – FY2019
Table 1.10: Expenditure Summary Forecast
Total Expenditure Forecast ($000) (Nominal $ Values)
Expenditure Category FY 2006 A FY 2007 A FY 2008 A FY 2009 A FY 2010 B FY 2011 F FY 2012 F FY 2013 F FY 2014 F FY 2015 F FY 2016 F FY 2017 F FY 2018 F FY 2019 F FY 2020 F FY 2021 F
Operational Expenditure 28,118 28,580 32,045 30,364 33,826 35,953 37,152 38,460 38,947 39,756 40,580 41,421 42,279 43,153 44,046 45,015
Capital Expenditure 61,851 61,293 72,920 82,797 76,469 83,870 87,080 90,545 91,989 93,708 99,581 106,002 112,601 119,811 127,699 136,335
Total 89,969 89,873 104,964 113,161 110,295 119,823 124,232 129,005 130,936 133,464 140,162 147,423 154,879 162,965 171,744 181,349
Table1.11: Capital Expenditure Summary by Work Category
Capital Expenditure Forecast ($,000) (Nominal $ Values)
Expenditure Category FY 2006 A FY 2007 A FY 2008 A FY 2009 A FY 2010 B FY 2011 F FY 2012 F FY 2013 F FY 2014 F FY 2015 F FY 2016 F FY 2017 F FY 2018 F FY 2019 F FY 2020 F FY 2021 F
Customer Connection 23,714 22,076 29,144 29,023 18,366 19,860 18,919 18,141 17,123 16,262 16,620 16,985 17,359 17,741 18,131 18,530
System Growth 11,563 14,472 15,951 18,853 22,474 23,796 24,411 25,023 23,940 22,787 23,288 23,801 24,324 24,859 25,406 25,965
Reliability, Safety and Environment 7,413 8,128 8,961 10,986 10,845 13,567 14,281 15,042 15,202 15,399 16,309 17,302 18,323 19,436 20,652 21,980
Asset Replacement and Renewal 16,526 14,164 15,626 20,710 21,177 24,441 27,131 30,098 33,390 37,043 41,098 45,597 50,227 55,355 61,037 67,333
Asset Relocations 2,635 2,453 3,238 3,225 1,422 2,207 2,338 2,242 2,335 2,218 2,266 2,316 2,367 2,419 2,472 2,527
Total 61,851 61,293 72,920 82,797 74,285 83,870 87,080 90,545 91,989 93,708 99,581 106,002 112,601 119,811 127,699 136,335
Table 1.12: Operational Expenditure Summary by Work Type
Operational Expenditure Forecast ($000) (Nominal $ Values)
Expenditure Category FY 2006 A FY 2007 A FY 2008 A FY 2009 A FY 2010 B FY 2011 F FY 2012 F FY 2013 F FY 2014 F FY 2015 F FY 2016 F FY 2017 F FY 2018 F FY 2019 F FY 2020 F FY 2021 F
System Management & Operations 6,654 6,750 7,627 5,968 8,026 10,351 11,041 11,760 11,920 12,120 12,336 12,556 12,778 13,004 13,233 13,524
Routine & Preventive Maintenance 9,427 9,901 11,510 10,394 11,800 11,521 11,750 12,015 12,162 12,436 12,710 12,989 13,275 13,567 13,866 14,171
Refurbishment & Renewal Maintenance 7,683 7,615 6,918 8,938 8,921 7,680 7,833 8,010 8,108 8,291 8,473 8,660 8,850 9,045 9,244 9,447
Fault & Emergency Maintenance 4,353 4,314 5,990 5,064 5,079 6,400 6,528 6,675 6,757 6,909 7,061 7,216 7,375 7,537 7,703 7,873
Total 28,118 28,580 32,045 30,364 33,826 35,953 37,152 38,460 38,947 39,756 40,580 41,421 42,279 43,153 44,046 45,015
Note: The year refers to financial year end 30 June. The expenditure has been stated in nominal terms.

Return to Index 19ASSET MANAGEMENT PLAN ELECTRICITY NETWORKS FY2010 – FY2019
The development expenditure forecasts are driven from the need to keep up with the levels of growth in electricity demand across the network. The renewal expenditure forecasts have been dictated by the appropriate recognition of the actual cost of renewing assets.
Summary tables of capital work are provided in Sections 6, 7 and 8 that link the capital work to an Asset Strategy theme, outline project options and reference back to sections of the AMP that justify their need.
The key change to the expenditure forecasts over those presented in the April 2009 AMP is the 10% increase in capital expenditure (other than Customer Connection and Asset Relocation expenditure), which will be focussed on increasing security, capacity and reliability. The increase in expenditure has been made possible by the outcome of the Default Price Path (which regulates Powerco’s revenue) effective from 1 April 2010. For the past six years Powerco’s prices reduced 2% per annum in real terms. The new Default Price Path allows Powerco to maintain its prices in real terms. System Growth, Reliability, Safety and Environment and Asset Renewal and Refurbishment capital expenditures have been increased by 10% on account of the improvement in regulatory revenue threshold from CPI-2% to CPI-0%.
As articulated above, the constraint on further network investment (to minimise reliability risk) is the current uncertainty around the future regulatory regime. We look forward to the conclusion of the current regulatory development process to provide greater certainty to increase our investment further.
Risk Management1.15.
Risk Management analysis and risk tables are presented in Section 10. This presents the risks under headings as follows:
Operational Continuity and Customer Relations;•
Environmental Management;•
Regulatory and Legal Compliance;•
Finance; and•
Health and Safety;•
Powerco’s contingency plans are described and these include:
Electricity Supply Continuity Plan;•
Major Network Event Procedures; •
Substation Contingency Plans; •
Business Continuity Plans (Process, Information Technology and Loss of Precinct); •and
Pandemic Contingency Plans.•
Advanced Asset Management1.16.
Powerco has demonstrated strong capability in our Asset Management processes compared with our peers in NZ. However, when compared against Australian utilities, which have been regulated for significantly longer, our processes and systems compare less favourably. Accordingly, in Section 11 we assess our current capabilities (strengths and weaknesses) and identify the improvements that we are working on.

Return to Index20 ASSET MANAGEMENT PLAN ELECTRICITY NETWORKS FY2010 – FY2019
BACkgRoUnd And oBjECTIVES 2.
About Powerco2.1.
Overview and Historical Context 2.1.1.
Powerco is a utility network ownership and management business and is New Zealand’s largest provincial distributor of electricity and gas, with around 400,000 consumers connected to its networks. Powerco’s electricity networks are in Tauranga, Thames, Coromandel, Eastern and Southern Waikato, Taranaki, Wanganui, Rangitikei, Manawatu and Wairarapa. Its gas pipeline networks are in Hutt Valley, Porirua, Wellington, Horowhenua, Manawatu, Taranaki and Hawke’s Bay.
From the mid-1990s until the early 2000s, Powerco grew significantly through mergers and acquisitions to its current position as New Zealand’s second largest electricity and gas distribution utility. In March 2000, Mergeco (renamed Powerco in September 2000) was incorporated, and in September 2000, acquired the energy distribution undertakings of the former Powerco Limited and CentralPower Limited (and, as such, has never had any obligations under the Energy Companies Act 1992). Powerco acquired the Eastern Region electricity network and Central gas network from UnitedNetworks Limited in November 2002.
1993 1995 1998 1999 2001 2004 2005
POWERCO CORPORATE HISTORY1994 1997 1998 2000 2002
New
Ply
mou
th E
nerg
y
Tara
naki
Ele
ctric
ity
Wai
rara
pa E
lect
ricity
Haw
era
Gas
Com
pany
Cen
tral
Pow
er
Pow
erco
AG
L (H
utt V
alle
y an
d P
oriru
a ne
twor
k)
Egm
ont E
lect
ricity
Uni
ted
Net
wor
ks (E
aste
rn
Ele
ctric
ity a
nd C
entr
al G
as
Net
wor
ks
Sal
e of
reta
il an
d ge
nera
tion
busi
ness
Acq
uisi
tion
of P
ower
co P
rime
Infra
stru
ctur
e
Nat
ural
Gas
Cor
pora
tion
(Tar
anak
i net
wor
ks)
Sal
e of
Pow
erco
Ene
rgy
Ser
vice
s to
Ten
ix A
llianc
e
Figure 2.1: History of Powerco Mergers and Acquisitions.
Funds managed by QIC Limited recently acquired a 58% stake in Powerco, with the remaining 42% holding owned by Prime Infrastructure Limited. QIC Limited is a Queensland Government-owned institutional investment manager. Prime Infrastructure is an Australian infrastructure investment company listed on the ASX.
In November 2005, Powerco sold its New Zealand field service contracting businesses to Tenix Alliance. In New Zealand, Powerco contracts a large portion of its field services from Tenix under an open-book alliance arrangement.
The electricity industry has undergone significant change, including regulatory changes, since 1992 to a point where electricity lines businesses were separated from retail and generation, and electricity line price and quality thresholds were introduced in 2003.
These thresholds were in force until 31 March 2010. On 1 April 2010 Powerco falls under the electricity distribution default price-quality path determination, pursuant to Part 4 of the Commerce Act 1986. Powerco will have the option of applying for a customised price-quality path after the end of 2010 once the rules and methodologies are finalised.
Throughout the large extent of change over the last 15 years, Powerco has continued to maintain strong service performance across its networks to its stakeholders.
Powerco’s Vision and Mission 2.1.2.
At its highest level, Powerco’s direction is described through its Vision and Mission statements, which provide the fundamental basis against which each detailed element of the strategy must align. Powerco’s Vision and Mission, and the interpretations of the Vision and Mission by stakeholders, are shown in Figure 2.2. The different perspectives of the various stakeholders are important in defining the appropriate Asset Management response (expanded upon later in this section).
Powerco’s Values2.1.3.
Powerco’s Values (Figure 2.3) are important in shaping how the organisation acts. They define the types of behaviour and actions that will contribute to the success of the company. Each of these statements defines the basic cultural ingredients that shape the approach towards the management of Powerco’s network assets.
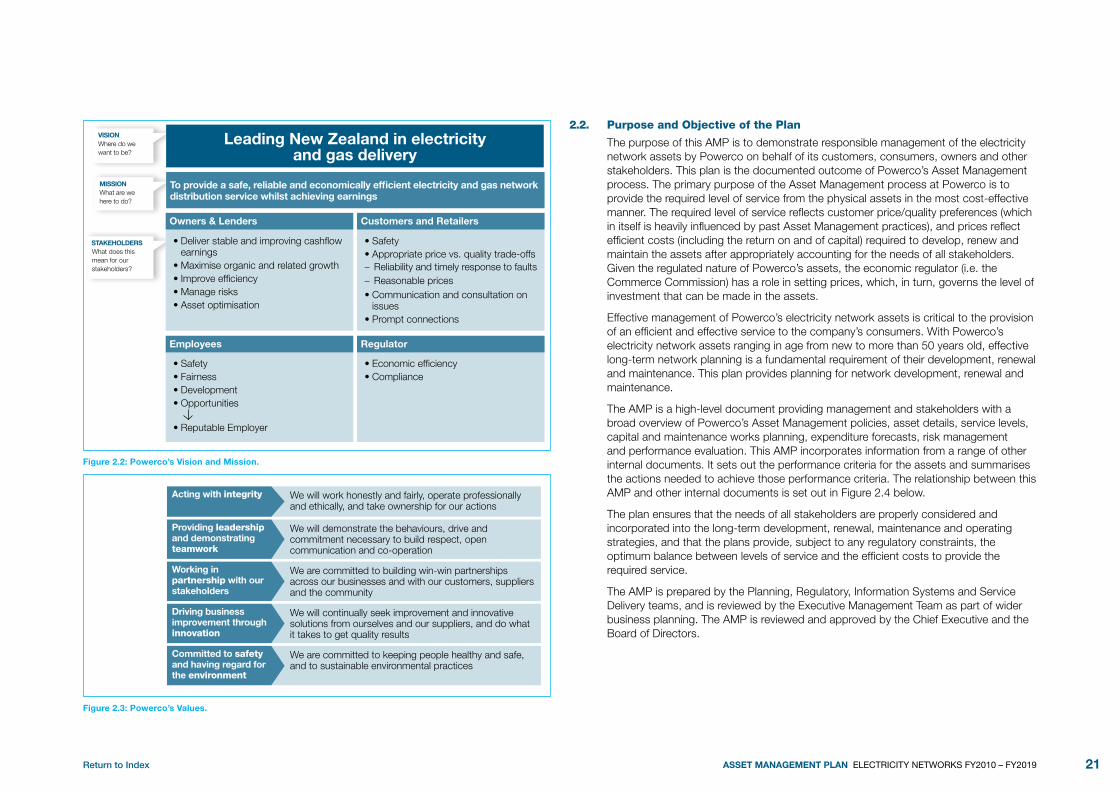
Return to Index 21ASSET MANAGEMENT PLAN ELECTRICITY NETWORKS FY2010 – FY2019
VISION Where do we want to be?
MISSION What are we here to do?
STAKEHOLDERS What does this mean for our stakeholders?
Leading New Zealand in electricity and gas delivery
Deliver stable and improving cashflow •earningsMaximise organic and related growth•Improve efficiency•Manage risks•Asset optimisation•
Safety•Appropriate price vs. quality trade-offs•
– Reliability and timely response to faults– Reasonable prices
Communication and consultation on •issuesPrompt connections•
Safety•Fairness•Development•Opportunities • Reputable Employer•
Economic efficiency•Compliance•
To provide a safe, reliable and economically efficient electricity and gas network distribution service whilst achieving earnings
Owners & Lenders
Employees
Customers and Retailers
Regulator
Figure 2.2: Powerco’s Vision and Mission.
We will work honestly and fairly, operate professionally and ethically, and take ownership for our actions
Acting with integrity
We will demonstrate the behaviours, drive and commitment necessary to build respect, open communication and co-operation
Providing leadership and demonstrating teamwork
We are committed to building win-win partnerships across our businesses and with our customers, suppliers and the community
Working in partnership with our stakeholders
We will continually seek improvement and innovative solutions from ourselves and our suppliers, and do what it takes to get quality results
Driving business improvement through innovation
We are committed to keeping people healthy and safe, and to sustainable environmental practices
Committed to safety and having regard for the environment
Figure 2.3: Powerco’s Values.
Purpose and objective of the Plan2.2.
The purpose of this AMP is to demonstrate responsible management of the electricity network assets by Powerco on behalf of its customers, consumers, owners and other stakeholders. This plan is the documented outcome of Powerco’s Asset Management process. The primary purpose of the Asset Management process at Powerco is to provide the required level of service from the physical assets in the most cost-effective manner. The required level of service reflects customer price/quality preferences (which in itself is heavily influenced by past Asset Management practices), and prices reflect efficient costs (including the return on and of capital) required to develop, renew and maintain the assets after appropriately accounting for the needs of all stakeholders. Given the regulated nature of Powerco’s assets, the economic regulator (i.e. the Commerce Commission) has a role in setting prices, which, in turn, governs the level of investment that can be made in the assets.
Effective management of Powerco’s electricity network assets is critical to the provision of an efficient and effective service to the company’s consumers. With Powerco’s electricity network assets ranging in age from new to more than 50 years old, effective long-term network planning is a fundamental requirement of their development, renewal and maintenance. This plan provides planning for network development, renewal and maintenance.
The AMP is a high-level document providing management and stakeholders with a broad overview of Powerco’s Asset Management policies, asset details, service levels, capital and maintenance works planning, expenditure forecasts, risk management and performance evaluation. This AMP incorporates information from a range of other internal documents. It sets out the performance criteria for the assets and summarises the actions needed to achieve those performance criteria. The relationship between this AMP and other internal documents is set out in Figure 2.4 below.
The plan ensures that the needs of all stakeholders are properly considered and incorporated into the long-term development, renewal, maintenance and operating strategies, and that the plans provide, subject to any regulatory constraints, the optimum balance between levels of service and the efficient costs to provide the required service.
The AMP is prepared by the Planning, Regulatory, Information Systems and Service Delivery teams, and is reviewed by the Executive Management Team as part of wider business planning. The AMP is reviewed and approved by the Chief Executive and the Board of Directors.

Return to Index22 ASSET MANAGEMENT PLAN ELECTRICITY NETWORKS FY2010 – FY2019
Work Plan Overview
Cost Assumptions Programme status Risk escalation
Work Programme Policy Strategy
Performance & Investment Drivers
Network Project Design Scopes – prepared as needed Annual Capital and Maintenance Works Plan – prepared annually
Network Maintenance and Design Standards – reviewed 3 yearly or as needed
Tier 3 – Policy and Works Plans
Asset Lifecycle Plan, Development Plans, Renewal Plans, Special Asset Management Plans, Environmental Plan - prepared annually or biennially
Tier 2
Disclosure Asset Management Plan – prepared annually
Tier 1
Figure 2.4: Asset Management Documentation Hierarchy.
The Plan ensures that the needs of all stakeholders are properly considered and incorporated into the long-term development, renewal, maintenance and operating strategies, and that the plans prepared provide the optimum balance between levels of service and economic efficiency (asset investment/utilisation and maintenance and operating costs).
Period Covered by the Plan2.2.1.
This Asset Management Plan covers a period of 10 years, beginning on 1 July 2010 and continuing to 2020. It replaces the April 2009 Asset Management Plan. The main focus of analysis is the first three to five years, for which plans are generally firm. Beyond five years, general forecasts are made and reviewed annually. Expenditure forecasts cover a 10-year period from FY2011 to FY2021. In some instances, it is necessary to have longer term (out to 20 years) plans to provide the context needed for the AMP planning periods. The Asset Management Plan was approved by the Powerco Board in March 2010.
Future Review of the Plan2.2.2.
This plan is continuously reviewed and updated as fresh data becomes available. Formal reviews are carried out annually, in line with other Powerco business plans. The development strategies are reviewed to ensure that they keep pace with changing load patterns, and the maintenance strategies are reviewed as technology and techniques develop.
Structure of the Plan2.2.3.
Figure 2.5 below illustrates the structure of the Asset Management Plan and what each section is seeking to address.
Who wants what from the assets?
What is the state of the assets?
What performance are we targeting from the assets? How are we doing vs. the target? What are the gaps?
How are we managing the network and solving any performance gaps?
What does this mean for the works programmes and required expenditure?
How can we improve?
Section 2Define StakeholdersDefine AM Drivers
Section 3Describe Assets
Section 4Set Performance Targets
Section 5Performance Evaluation
Section 10Analyse Network Risks
Section 6, 7 and 8Develop Work ProgrammesLinked with AM Driver
Section 9Set Expenditure Forecasts
Section 6Set Asset Lifecycle StrategyAnalyse Renewal Needs
Section 8Reliability, Safety, Environment Enhancement NeedsProtection & Control, Smart Network Development
Section 7Security Criteria Prepare Load Forecasts System Growth Needs
Section 11Develop AM Improvement Initiatives
Figure 2.5: Structure of Asset Management Plan.

Return to Index 23ASSET MANAGEMENT PLAN ELECTRICITY NETWORKS FY2010 – FY2019
Asset Management drivers2.3.
Stakeholder Drivers of the Asset Management Process2.3.1.
Figure 2.6 illustrates the relationship between the main stakeholders and drivers and the Asset Management process. The diagram now includes recognition of the business planning process because the stakeholder drivers are equally (and in some cases more appropriately) applicable to the business planning process.
Asset Management Process
Business Planning Process
Customers/Consumers
Assets
Government & Regulator
Owners & Lenders Employees & Contractors
Safety Workflow Certainty Market Costs
Service/Price Safety Load Growth
Asset Performance Asset age/condition
Development, Renewal, Maintenance, Operation
Long Term Value (Productivity & Utilisation) Risk Management
Economic Efficiency (Long-Term Interest of Consumers) Environmental Safety & Compliance
Figure 2.6: Powerco Stakeholders and Drivers of the Asset Management Process.
The Asset Management process is described in more detail in Section 2.6 below; however its primary objective is to optimise the management (i.e. development, renewal, maintenance and operation) of assets to deliver the required level of service in a manner that effectively controls costs and risks.
The tables below present the key stakeholders and their drivers of the Asset Management process. The input these parties have into the Asset Management Plan is addressed at various stages of the planning process.
Powerco’s customers, retailers and end-use customers
are the people, organisations and businesses that rely on Powerco for the delivery of electricity. They want a safe, reliable, high-quality supply of electricity at the lowest possible price.
Stakeholder
Except for the new connection work and certain large consumers having direct connection contracts with Powerco, the energy retailers manage the interests of the consumers. Service levels, pricing and other consumer issues are addressed in the Use of System agreements existing between retailers and Powerco. Powerco consults with retailers and representatives of end-use consumers over price and service trade-offs. Details of the consultation work are outlined in Section 4.2.2.
For new connection work, the consumer or developer deals with an approved contractor and any planning-related issues are addressed between the contractor, the consumer and Powerco.
Driver
Service performance is the delivery of “electricity line function” service. The key elements of service in this context are:
Adequacy of the network: the capacity, configuration and security inherent in the network to •supply the load required;
Reliability of supply: the frequency and duration of supply interruptions; and•
Quality of supply: voltage level, waveform quality and momentary fluctuations..•
Method identifying Stakeholder Interest
Consumer surveys and meetings with consumer representatives and major consumers.
Feedback from complaints and compliments.
Use of System agreements and meetings with retailers.

Return to Index24 ASSET MANAGEMENT PLAN ELECTRICITY NETWORKS FY2010 – FY2019
The Economic Regulator
(i.e. the Commerce Commission) is the main government regulatory agency that regulates Powerco.
Stakeholder
The Commerce Commission aims to ensure regulated industries, such as electricity lines businesses, are constrained from earning excessive profits, and are given incentives to invest appropriately and share efficiency gains with consumers. The Commerce Commission has both an enforcement and adjudication role under the Electricity Industry Reform Act 1998, and has responsibilities under Part 4 of the Commerce Act 1986, where the Commission:
Sets default or customised price/quality paths that lines businesses must follow;•
Administers the information disclosure regime for lines businesses; and •
Develops input methodologies.•
Driver
Economic efficiency is the delivery of service through the best use of capital and other resources, considering the opportunity cost of doing so.
From an economic regulator’s perspective, this is best described in the Purpose Statement to Part 4 of the Amended Commerce Act, which states that suppliers should:
Have incentives to innovate and invest;•
Have incentives to improve efficiency;•
Share with consumers the benefits of efficiency gains;•
Have limited ability to extract excessive profits;•
The key factors that drive economic efficiency are:
Asset investment: the level of capital investment in the assets to deliver the service. The key •performance driver is the level of utilisation;
Operating costs: the overhead, operating and maintenance costs associated with the network •assets; and
Service: the quality or level of service delivered.•
Part 4 of the Commerce Act requires the Commerce Commission to implement an information disclosure regime for electricity lines services. The regime places a requirement on businesses to provide enough information publicly, such as regulatory accounts and various performance indicators, to ensure that interested parties are able to assess whether the regulatory objectives are being met.
Method identifying Stakeholder Interest
Requirements of the Commerce Act 1986
Consultation papers, decision papers and determinations
Meetings with Commissioners and staff
The Industry Regulators
that have jurisdiction over Powerco’s activities include the Commerce Commission, the Ministry of Economic Development and the Electricity Commission. The key driver from the Government is outlined in the Government Policy Statement on Electricity Governance.
Stakeholder
The Electricity Commission regulates the operation of the electricity industry and markets to ensure that electricity is produced and delivered to all consumers in an efficient, fair, reliable and environmentally sustainable manner. The Commission has jurisdiction over Powerco’s activities as they relate to the electricity industry structure, including terms of access to the grid, Use of System agreements with retailers, as well as metering, load control, electricity losses and distribution pricing methodologies.
The Government’s overall objective (for the Electricity Commission) is to ensure that electricity is delivered in an efficient, fair, reliable and environmentally sustainable manner to all classes of consumer. Industry arrangements should promote the satisfaction of consumers’ electricity requirements in a manner that is of least cost to the economy as a whole and is consistent with sustainable development.
Driver
Providing service in a safe and environmentally sustainable manner and provision of the Asset Management service in a manner that complies with the statutes and regulations and industry standards. In the electricity distribution network context, the most noteworthy legislation to comply with is:
Electricity Act 1991 (and subsequent amendments);•
Electricity Regulations 1997;•
Resource Management Act 1992;•
Health and Safety in Employment Act 1992;•
Electricity Governance Regulations 2003; and the •
Hazardous Substances and New Organisms Act 1996.•
Method identifying Stakeholder Interest
Requirements of various Acts relating to electricity
Government Policy Statement on Electricity
Consultation papers, decision papers and regulations
Meetings with Commissioners and staff

Return to Index 25ASSET MANAGEMENT PLAN ELECTRICITY NETWORKS FY2010 – FY2019
Government and Other Regulatory Bodies
The New Zealand Energy Strategy (NZES), published in October 2007, provides a vision of New Zealand’s energy future and has a core focus of moving towards a sustainable, low-emissions energy system. The strategy sets a clear, long-term strategic direction for the supply and use of energy to 2050 that responds to the challenges of climate change and energy security. In February 2009, the Minister of Energy and Resources announced his intention to update the NZES.
Stakeholder
The Ministry of Economic Development develops and implements policy for the electricity sector, in particular relating to the regulatory framework and governance. The Ministry also monitors market performance, including competition issues and electricity prices. The Ministry maintains responsibility for the promotion of safety in the electricity industry through the Energy Safety office and the registration of ongoing competence of electrical workers.
Driver
The guiding principles are:
Investment should occur in energy efficiency measures where this is cheaper than the long-term costs of building extra generation capacity, including environmental costs; and
For the foreseeable future, it is preferable that all new electricity generation be renewable, except to the extent necessary to maintain security of supply.
Electricity distribution networks have a role to play in achieving this vision and can contribute through a variety of avenues, including:
Integrating renewable generation into distribution networks;
Providing price signals to consumers, possibly through the use of smart meters or other mechanisms of load control to encourage flatter load shapes;
Minimising losses in distribution networks; and
Possible investment by lines companies in renewable generation.
Method identifying Stakeholder Interest
Government Statements,
Consultation documents and policy announcements
Territorial Local Authorities
have an interest in Powerco’s activities through the Resource Management Act.
Stakeholder
Territorial local authorities have an interest in Powerco’s activities through the Resource Management Act. The overriding purpose of the RMA is “to promote the sustainable management of natural and physical resources”. The delivery of reliable and sustainable energy is part of this. The role of the RMA in enabling investment in the energy sector is essential to the achievement of reliable energy supply and the efficient use objectives outlined in the NZES.
Powerco participates in the consultative process at national level on environmental matters with the Ministry for Environment to represent distribution company interests for National Policy Statements (NPS) such as NPS Renewable Generation and NPS Transmission.
The Government has passed the Resource Management (Simplifying and Streamlining) Amendment Act 2009 and introduced the Infrastructure Bill into Parliament. Both these legislative changes aim to facilitate infrastructure development by removing unnecessary barriers.
Driver
Main guiding principles are that we are a long-term and responsible corporate citizen actively involved in District Plan change debates and taking part in hearings and submissions on local issues.
Method identifying Stakeholder Interest
National policy statements
Strategic meetings with TLAs
Hearings and submissions

Return to Index26 ASSET MANAGEMENT PLAN ELECTRICITY NETWORKS FY2010 – FY2019
Powerco’s Owners and Lenders
Stakeholder
Powerco’s owners and lenders wish to see that their financial returns are commensurate with the risk of their investment. This is achieved by ensuring that the development, operation and maintenance of the network is optimised to enable an appropriate level of return, while maintaining an acceptable risk profile for the investment. Note: As the Electricity Distribution sector is highly regulated, regulatory certainty, along with the way in which the regulatory regime recognises the cost of capital projects above the value of the Regulated Asset base, are both key issues that impact on the owner’s investment decisions.
Driver
Productivity and commercial efficiency: delivery of Asset Management in a productive, efficient •and commercially prudent manner.
Optimal utilisation of assets represents the best trade-off between capital expended on the •assets and network risk.
Risk management processes seek to identify, recognise, communicate and accept or control •risks that arise in the Asset Management process (Section 10).
Powerco is subject to a number of Corporate KPIs that measure business performance and •Asset Management performance. These include: cash flow available for distribution; earnings before interest, tax and depreciation; various capital structure and credit metrics; electricity reliability (SAIDI, SAIFI); faults repaired within target times; electricity counterparty credit risk; total electricity costs per km; completion of electricity concept scopes; completion of electricity works plan; close out of internal audit findings; employees with personal plans; training hours completed and lost-time injuries.
Note: this section is seeking to focus on the key owner/lender drivers and avoids duplication of drivers covered elsewhere. Owners (as represented by the Directors) have overall responsibility for Powerco and, as such, are seeking for Powerco to address and optimise a wide range of business drivers.
Method identifying Stakeholder Interest
Powerco’s Board meetings and KPIs
Powerco’s Employees
Stakeholder
Powerco has 220 staff. The staff are predominantly of a technical skill set.
Driver
Powerco’s employees wish to have interesting and varied careers, with the ability for career development. Safety, job satisfaction In terms of working environment, and staff wellbeing are key employee tenets. Powerco’s culture is backed up by its Health and Safety and Human Resource policies. The employees have an interest in managing the network competently and doing what is the “right thing”. Electrical equipment is capable of causing serious harm. Employees need to have a safe environment to work in and need to ensure that the environments are safe for contractors and the public as a result of the work they do (safety through design). This point is reflected in the Design and Construction standards, and description of maintenance, in Section 6.2.
Method identifying Stakeholder Interest
Internal communications
Employee surveys
Powerco’s Contractors
Stakeholder
Powerco’s contractors require a sustainable and long-term relationship with Powerco. The contractors should be profitable but efficient. This means having a foreseeable and constant stream of work to keep their workforces productively employed. Focus areas from an asset owner’s perspective are safety, competency, training of young mechanics and technicians, crew leadership, alignment of business models, and systems to work drivers.
Driver
Workflow certainty allows the contractors to confidently build up the right level of resources to achieve efficient resource utilisations. It also allows contractors to achieve the right scale of benefits for their material purchases, resulting in efficient pricing and a stable industry environment.
Note: Electrical equipment is capable of causing serious harm, and measures should be taken to ensure that contractor employees work in a safe environment. From an asset owner’s perspective, this is accomplished through a competency certification framework, procedures and through audit processes.
Method identifying Stakeholder Interest
Contractor relationship meetings
Contractual agreements
Other Stakeholders
Other stakeholders with an interest in Powerco’s Asset Management process include iwi, the public over whose land the distribution network is built, Transpower, media and groups representing the electricity industry, such as Electricity Networks Association and the Electricity Engineers Association.
Powerco recognises the importance of consulting with iwi on significant new projects, particularly development of new subtransmission line routes to ensure that the iwi views, values, significant sites and special relationship with the land is taken into account early in the project development phase.
Affected landowners wish to be advised when maintenance crews enter their property, and wish to be assured that their property will not be damaged or put at risk.
Transpower supplies bulk electricity from the grid. Operational plans (like outages and contingency planning) and long-term development plans need to be co-ordinated well in advance to ensure seamless supply.
Industry groups, such as the Electricity Engineers Association, provide industry guidelines, training and a point of focus for inter-industry working groups. The Electricity Networks Association represents the interests of the distribution lines companies in New Zealand.
Powerco is involved in a range of community projects and activities.
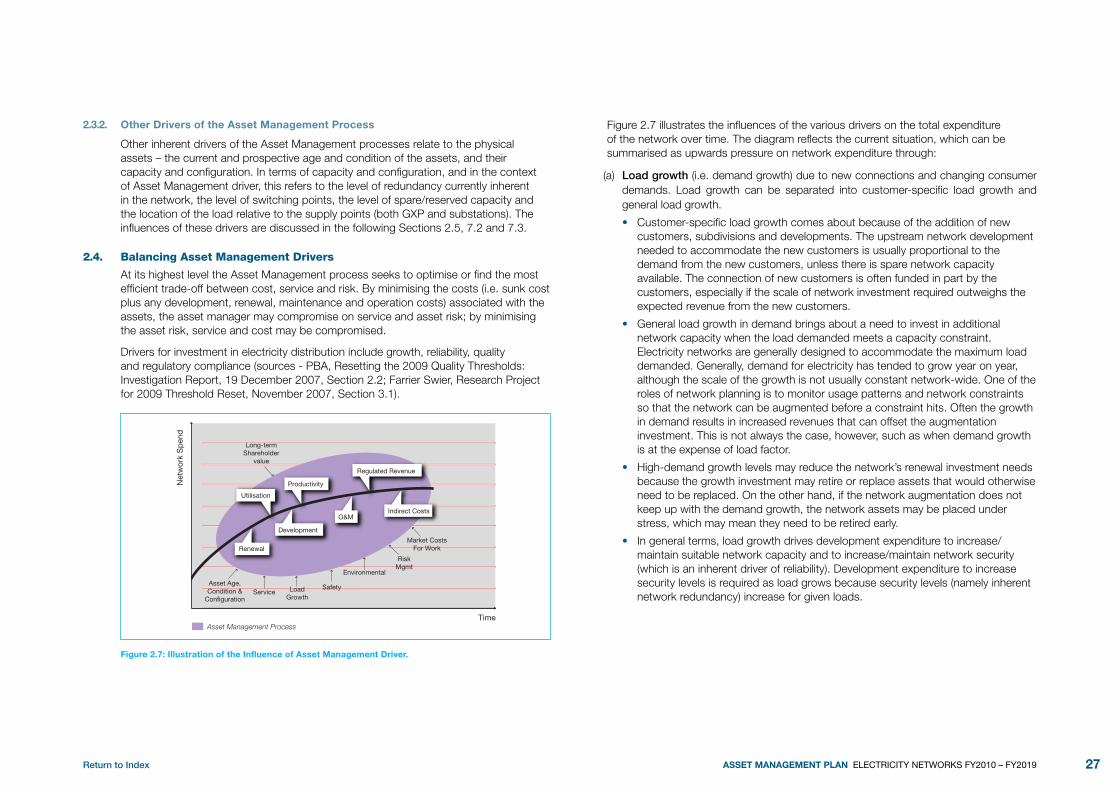
Return to Index 27ASSET MANAGEMENT PLAN ELECTRICITY NETWORKS FY2010 – FY2019
Other Drivers of the Asset Management Process2.3.2.
Other inherent drivers of the Asset Management processes relate to the physical assets – the current and prospective age and condition of the assets, and their capacity and configuration. In terms of capacity and configuration, and in the context of Asset Management driver, this refers to the level of redundancy currently inherent in the network, the level of switching points, the level of spare/reserved capacity and the location of the load relative to the supply points (both GXP and substations). The influences of these drivers are discussed in the following Sections 2.5, 7.2 and 7.3.
Balancing Asset Management drivers 2.4.
At its highest level the Asset Management process seeks to optimise or find the most efficient trade-off between cost, service and risk. By minimising the costs (i.e. sunk cost plus any development, renewal, maintenance and operation costs) associated with the assets, the asset manager may compromise on service and asset risk; by minimising the asset risk, service and cost may be compromised.
Drivers for investment in electricity distribution include growth, reliability, quality and regulatory compliance (sources - PBA, Resetting the 2009 Quality Thresholds: Investigation Report, 19 December 2007, Section 2.2; Farrier Swier, Research Project for 2009 Threshold Reset, November 2007, Section 3.1).
Net
wor
k S
pen
d
Asset Management ProcessTime
Renewal
Asset Age,Condition &
Configuration
Development
Utilisation
Productivity
Long-termShareholder
value
Regulated Revenue
O&MIndirect Costs
Service LoadGrowth
Safety
Environmental
RiskMgmt
Market CostsFor Work
Figure 2.7: Illustration of the Influence of Asset Management Driver.
Figure 2.7 illustrates the influences of the various drivers on the total expenditure of the network over time. The diagram reflects the current situation, which can be summarised as upwards pressure on network expenditure through:
Load growth(a) (i.e. demand growth) due to new connections and changing consumer demands. Load growth can be separated into customer-specific load growth and general load growth.
Customer-specific load growth comes about because of the addition of new •customers, subdivisions and developments. The upstream network development needed to accommodate the new customers is usually proportional to the demand from the new customers, unless there is spare network capacity available. The connection of new customers is often funded in part by the customers, especially if the scale of network investment required outweighs the expected revenue from the new customers.
General load growth in demand brings about a need to invest in additional •network capacity when the load demanded meets a capacity constraint. Electricity networks are generally designed to accommodate the maximum load demanded. Generally, demand for electricity has tended to grow year on year, although the scale of the growth is not usually constant network-wide. One of the roles of network planning is to monitor usage patterns and network constraints so that the network can be augmented before a constraint hits. Often the growth in demand results in increased revenues that can offset the augmentation investment. This is not always the case, however, such as when demand growth is at the expense of load factor.
High-demand growth levels may reduce the network’s renewal investment needs •because the growth investment may retire or replace assets that would otherwise need to be replaced. On the other hand, if the network augmentation does not keep up with the demand growth, the network assets may be placed under stress, which may mean they need to be retired early.
In general terms, load growth drives development expenditure to increase/•maintain suitable network capacity and to increase/maintain network security (which is an inherent driver of reliability). Development expenditure to increase security levels is required as load grows because security levels (namely inherent network redundancy) increase for given loads.

Return to Index28 ASSET MANAGEMENT PLAN ELECTRICITY NETWORKS FY2010 – FY2019
The need to maintain/enhance the required level of service (in a broad sense this (b) includes supply reliability and quality of supply) is the key quality component that customers notice about the electricity they receive. However, the right level of reliability of supply is a difficult thing to define.
There is a correlation between network investment and supply reliability in that it •is possible to have a more reliable network through greater network investment. Economic theory indicates that network customers should be able to identify the level of investment that achieves the level of reliability that best suits them. However, no model has yet been developed that accurately balances the cost benefit for all customers over all points of time.
Electricity distribution network managers recognise the reliability/investment •trade-off implicitly. This can be seen through the architecture of the networks and in their behaviour towards restoring supply. For example, in rural networks the level of investment per customer may be higher than that in urban networks but rural network customers often receive a lower reliability of supply than their urban counterparts.
Changes in reliability expectations can arise where the utilisation of electricity •changes. This can be seen in the dairy sector. Network shutdowns may raise the profile of reliability as an issue in the public’s mind and precipitate increased reliability expectations. Additional investment is usually required to meet the new expectations. Evidence internationally suggests, however, that the largest step increases in reliability investment have usually been driven by legislative or regulatory changes.
The need to maintain/enhance the required level of service to consumers •drives both development and renewal costs. That is, depending on the nature, underlying reason and most cost-effective solution to the gap between actual service and required service, the expenditure may be in either network development or network renewal. Network development solutions may relate to network augmentation to improve security, network automation and the like. Network renewal solutions would typically involve the replacement of assets in poor condition to reduce the risk of failure.
Regulatory obligations are imposed by government agencies. These include health and (c) safety, environmental compliance, taxation, business law and energy sector regulation. The obligations may be able to be grandfathered, but generally they act to increase the levels of investment required.
Asset age, condition and configuration are key drivers of the Asset Management (d) process. These attributes of the network form the baseline upon which solutions need to be implemented. The challenge for the asset managers is to determine the optimal timing for the renewal of assets.
Effective asset renewal is a key component of the Asset Management process. •It is most successfully performed when it is fully integrated with all aspects of the Asset Management strategy and not treated in isolation. Information from other parts of the Asset Management process may influence the timing of asset renewal activities and similarly, information from the renewal process impacts on other processes.
The result of the inter-relatedness of asset renewal with other parts of the Asset •Management process is that, to achieve optimal outcomes overall, actions are often needed that appear suboptimal at an individual process level. As an example, some poles are replaced early to achieve the benefits of scale for an overall pole replacement programme. Another example is that a high-quality, expensive unit is installed to replace an old item, so that it provides a more reliable service throughout its lifetime.
The current configuration of the network is also a key driver. The configuration •includes the inherent redundancy (i.e. security), the use of automation, and the locality of the assets and where the load is. There are many locationally specific factors, such as the need to cater for special snow loadings, high winds, rocky soils, remote terrains and vegetation management. They also include the economies of scale available to a business.
Market costs for work should reflect an efficient work provision regime – sustainable (e) over the long term and without excessive cost.
Competitive tendering for work is one way in which efficient work provision can •be assured, although in a distribution context there can be a large number of jobs to tender, and the cost of tendering and administration is included in the job cost (this is one of the benefits of Alliancing).
Benchmarking studies can be undertaken to compare competitively tendered •work.
Unit cost comparisons can be used to compare costs between contractors, •between teams, inter-temporally or a combination of these. The ability to analyse unit costs depends on the information available in the works management systems
In recent years, the need for extra traffic management, in some cases limited •working hours, additional safety measures and shutdown constraints have led to increasing unit costs. For example, pole replacement, which in the mid-90s averaged around $1200 per pole, is now averaging almost $4000 per pole.
Lastly, risk management is a key driver to maintain long-term sustainable value to (f) shareholders and is inherent in the Asset Management process when dealing with matters of safety, environmental compliance and the delivery of the required level of service.

Return to Index 29ASSET MANAGEMENT PLAN ELECTRICITY NETWORKS FY2010 – FY2019
Referring again to Figure 2.7, the current constraints on network expenditure are generally in the form of:
The outcomes of the economic regulatory environment, which is ultimately the level of (g) regulated revenue. The regulated revenue is in two parts: firstly, the level of allowable revenue; and, secondly, the form of control. The regulated revenue is the outcome of the regulatory process and there are a number of other factors that sit behind this that impose the present constraints on the level of investment:
Regulatory certainty is a cornerstone of investor certainty because investors •must be confident that the returns from their investments will not be eroded by regulatory action over the life of those investments.
Transparency and predictability of the regulator’s decision-making helps ensure •that the regulator is accountable and credible. As an agency establishes a body of reasoning, it will develop a clear reputation so that investors will be able to predict the regulatory regime.
Stability ensures short-term shocks are minimised, and investor confidence is •maintained.
As network assets can last 40+ years, these factors are of particular importance •to owners of, and lenders to, network businesses. In short, investors need to have confidence that they will receive a fair return on and of capital (both sunk and new invested capital).
It is worth noting that dealing with these factors is primarily a corporate business •planning matter, and the direct driver on the Asset Management process is the level of capital and maintenance provided for work on the network, and the level of service accepted for this given level of capital and maintenance expenditure.
A properly incentivised owner will be seeking long-term sustainable earnings from its (h) current and ongoing investment in its business. Notwithstanding the wide role and responsibilities of Directors (as owner representatives), which was briefly discussed in the Stakeholder Tables above, the two key drivers to improve financial performance (other than growth) are utilisation improvements and productivity improvements.
A commercial entity’s drive for utilisation and productivity improvement provides •the appropriate countervailing force on the setting of budgets and investment decision-making for Asset Management work.
Proper incentives come when the business is able to benefit from making •improvements to productivity and utilisation while maintaining an appropriate control of risk to ensure that the required level of service is delivered. That is, the regulatory regime needs to ensure that dynamic efficiency is properly considered in setting the allowable revenue and the form of control over the long term.
There is strong alignment with the commercial utilisation and productivity drivers •with the economic efficiency drivers under a well-constructed regulatory regime.
There will be a natural tension between the overarching corporate objectives •for utilisation and productivity improvements, and the need to manage risks in terms of service to customers. This point is the core interface between business planning and Asset Management planning (and is referred to as the “asset strategy” in the Asset Management process diagram in Figure 2.8).
The mechanisms to make these trade-offs are discussed in the following two sections on the interaction with the corporate business planning and the Asset Management process.
Although not drivers of investment per se, there are other factors that influence the costs of investment. As mentioned earlier, these include location-specific factors such as the need to cater for special snow loadings, high winds, rocky soils, remote terrains and vegetation management. They also include the economies of scale available to a business. Large businesses tend to have specialised techniques that can reduce the costs of investment. Conversely, they can face increased costs associated with the need to adhere to (perhaps inflexible) systems and processes. Finally, business ownership structures impact on the cost of investment through access to and the cost of capital, appetite for risk, customer engagement; and cashflow. There is much debate internationally around the best forms of ownership structures for utility network assets.
The Asset Management process requires that the services provided by the electricity network are delivered at a competitive price. Planning of the network and forecasting the associated expenditures is a strategic level activity. Optimisation of expenditures is a business objective at this level, involving a trade-off between capital and operational expenditure, network performance and levels of network risk. For example, some renewal activities may need to be delayed if the business operates in an environment where revenues are constrained.
Corporate Interaction with the Asset Management Process2.5.
The previous two sections have looked at the stakeholder drivers for Asset Management and the balancing of these varied Asset Management drivers. Before looking at the Asset Management process in more detail it is appropriate to first review the interaction between the corporate business planning and Asset Management planning.
The Asset Management Plan is a key input to the corporate planning process. Conversely, key corporate objectives influence the direction of the Asset Management process. The interfaces between corporate business planning and Asset Management planning occur at the senior management, Executive Management team and Board level.

Return to Index30 ASSET MANAGEMENT PLAN ELECTRICITY NETWORKS FY2010 – FY2019
The corporate business planning process (and the business plan) deals with setting strategies for Powerco. An overview of these strategies and their interaction with the Asset Management process is given in the table below:
Business Plan Component Interaction with the Asset Management Plan
The overarching strategic objectives.
From the FY09 Powerco business plan, the overarching strategic objectives relating to the physical assets and the Asset Management process are:
Workflow and productivity improvements in operating, maintenance and capital work;
Improvements in Asset Management workflow systems and processes;
Increasing customer focus and being more responsive to customer demands; and,
Exploiting non-asset solutions.
The customer value proposition.
The level of service from the asset.
The financial objectives and forecasts.
Investment policy (which underpins the Coin optimiser)
The level of investment and O&M.
The utilisation/productivity improvement strategies.
The business processes and improvement programmes.
The objectives for the Asset Management processes.
The Corporate Risk Assessment Guidelines
The Asset Management process puts the corporate risk management policies into practice.
Powerco people and knowledge strategies.
The mix and depth of skills and systems required to support the Asset Management processes.
To set the abovementioned corporate strategies requires both a consideration of the key stakeholder needs and a consideration of the output from the Asset Management process. As noted in Figure 2.8, the corporate business planning and Asset Management stakeholders and drivers overlap. Recognition of how the stakeholder needs are considered across the corporate and Asset Management planning processes was discussed in the preceding section.
The key interface between business planning and Asset Management planning is referred to as the “asset strategy” in the Asset Management process diagram in Figure 2.8. The asset strategy is the investment policy, capital, maintenance and required service level and would incorporate the strategies for utilisation and productivity improvements. Setting these aspects is an iterative process and occurs largely during the drafting, review and approval of the Asset Management Plan (which is an input into the business planning cycle).
From an Asset Management process perspective, the key linkages between the business plan and the Asset Management processes occur with the setting of the Electricity business tactical action plan. Primarily, the Electricity business tactical action plan deals with the implementation of the various process, system, people and knowledge perspectives of the business plan relating to the electricity business.
Asset Management Process2.6.
Process Overview2.6.1.
The Asset Management process requires that the services delivered by the electricity network be provided at efficient cost. Powerco’s Asset Management process is designed to accommodate the needs of the stakeholders and corporate requirements, as shown diagrammatically in Figure 2.6. The process includes the following subprocesses:
Manage Asset Strategy: This process provides long-term strategic direction for the •management of the assets and the business operations, and is the key interface for customer/consumer consultation and corporate strategy;
Deliver Asset Planning: This process involves planning for the renewal, development, •maintenance and operation of the assets;
Manage Service Provision: This process involves the delivery of construction, •maintenance and operating services on the network assets;
Manage Network Operations: This process involves the management of the real-•time operation of the networks, recording network outages and approving planned shutdowns and the access to the network by service providers; and
Maintain Asset Information: This process involves the maintenance of, and reporting •from, the asset information databases.
Figure 2.8 also shows the interaction with key corporate processes, namely:
Governance and Management: This process provides direction, governance and •management to ensure that the Asset Management Group’s objectives are met and delegated responsibilities are properly executed;
Manage Customer Relationships: This process involves maintaining the relationships •with retailers and major connected customers;
Manage Regulatory Relationships: This process provides legal advice, co-•ordinates regulatory submissions, co-ordinates corporate risk management, and environmental policy and performance monitoring;
Details of Powerco’s Asset Management information systems are given in Section 2.8.

Return to Index 31ASSET MANAGEMENT PLAN ELECTRICITY NETWORKS FY2010 – FY2019
Maintain Asset Information
Update and Maintain Asset
Information
Audit and Verify Asset Information
Financial Systems
Works Management
System
Asset Information Systems
Manage Network Operation
Monitor Network
Performance
Manage Network Access
Manage Network
Availability and Load
Deliver Customer Interface
Dispatch Network
Work
Manage Network Deffects
Manage Employee
Competency
Manage Customer Relationships
Manage Retailer
relationships
Manage Customer
Initiated Works
Develop Pricing
Manage relationships with large customers
Manage Regulatory Relationships
Monitor Legislation Changes
Environmental Management
Prepare Regulatory
submissions
Involvement in Industry Work
Groups
Governance and Management
Business Planning
Risk Management Legal Advice
Management Review
Deliver Asset Planing
Planning Cycle
Monitor Network Against
Performance Criteria
Develop Solutions to meet Performance Requirements and
Growth
Determine Network
Renewal Needs
Compile AMP, Construction Standards &
Operating Policy From Solutions
Forecast Demand Compile Annual
Works Plan and Conceptual Scopes
Asset Strategy
DataICP Information
Data
Asset Management Plan
Requests for Customer Initiated Work
Information on Assets and their History and Performance (to all processes)
Commissioning
Des
ign
App
rova
l,
Pow
erco
Inve
stm
ent A
ppro
val
Wor
ks C
ompl
etio
n N
otic
e
As-
Bui
lt an
d A
sset
Info
rmat
ion
Con
tract
(Ter
ms
& S
tand
ards
) and
Pro
ject
W
ork
pack
s
(Direct to Powerco for Gas and via to Service Providers for Electricity)
Network Switching Instructions PermitsAsset Condition InformationNetwork Status InformationFault Job Information
As-Built and Asset Information
Fault Information
Competitor & Best-Practice Information
Corporate Business Plan Corporate Governance Charter Delegated Authorities
Consumer Supply Issues and Consumer Complaints via retaillers
Annual Works Plan Design, construction & Materials Standards
Network Operation Policy Asset Operating Standards
Tactical Actions Business Improvement Management Policy
Project Financial & Status Info
Group Performance Measures
TO ALL PROCESS
ASSET MANAGEMENT
PROCESSESCORPORATE
PROCESSES
TO/FROM ALL PROCESSDisclosure
Legislation and Regulatory Requirements
Forecast Investment, Cost, Service and Risk + Asset Valuation
Consumer Price/Service Preferences (As Regulated or ‘agreed’)
Market & Industry
Government & Regulators
Owner (Owner, Lenders & Board)
Customers/Consumers
Manage Service Provision
Service Provision Contract 2
Manage Contractor
Relationship
Service Provision Contract 1
Contract Preparation, Tendering and Negotiation
Manage Service Provider Performance
Manage Programmes and Projects
Set Contract Structure
Approve Service
Providers
Billing Process Service Provider Undertakes
Required Work
Manage Asset Strategy
Asset Strategy
Set Asset Strategy
Set Network Performance Criteria
Set Investment Policy
Figure 2.8: Powerco’s Asset Management Process Map.

Return to Index32 ASSET MANAGEMENT PLAN ELECTRICITY NETWORKS FY2010 – FY2019
Core Process for Balancing Asset Management Drivers2.6.2.
At the heart of the Asset Management process is the balancing of the various Asset Management drivers. At a strategic level, the needs and interests of various stakeholders are evaluated and considered as part of the corporate planning process, and these are applied during the network planning process (refer Figure 2.9). At a tactical and operational level in the network planning process, the investment policy and asset strategy shapes, and is shaped by, Powerco’s multi-stakeholder assessment process. This process is a key part of the way in which network development and renewal programmes are formed.
NPAM Create
Templates automatically
for final works plan
Reporting
Works Plan
Coin Scoring System based on predifined
budget
Initial Priority of high to cut to 120% of budget then use Coin prioritisation to cut to 100% of budget and EXP Draft Plan.
Budget only gets confirmed after Draft Plan was sent out. Should it change the priortisation needs to be run again.
Manual Filing System
Gat
e K
eepe
r (P
lann
ing
Team
)
Asset Condition Analysis
AMPs
Field Input
Budget gets confirmed or
changed
Consultation
Work Plan
Issue
Automated population of Coin
Improvement Register Database
Figure 2.9: Network Works Programme Optimisation Process.
The Coin optimiser is a portfolio optimisation system developed specially for Powerco. Potential projects are entered into the Improvement Register, which is essentially a database. The projects come from various sources, such as internal Asset Management plans (tier 2 documents in Figure 2.4) or project ideas from the field. Projects are scored against 14 different strategic value criteria, each of which comes under four strategic themes (Figure 2.10), and the projects considered for go/no go under a combination of budget- and risk-profile constraints. Projects that have a high strategic value pass into the annual works programme. Those with a lesser strategic value are deferred to future years. The system has reporting tools for producing Works Plan reports and Project Approval documentation (NPAM).
Financial Worth •(based on “NPV” measures)Financial Return •(based on “ODV” and “Payback period” measures)
Regulatory Quality•Customer Quality•Relationships•Customer Service Delivery•
Growth and Competitive Positioning•Public/Community Safety•Environment•Network Performance•Process/Information Integrity•
Workforce Safety•Training and Development•Culture and Commitment•
Financial Performance
Customer Value
Business Operations
Employee Safety and Development
Figure 2.10: Portfolio Optimisation Strategic Themes and Criteria.

Return to Index 33ASSET MANAGEMENT PLAN ELECTRICITY NETWORKS FY2010 – FY2019
Each of the strategic criteria is weighted as follows:
Financial Performance – 49%
Culture & CommitmentTraining & DevelopmentWorkforce SafetyProcess/Information Integrity
Network Performance
Environment
Public/Community Safety
Growth & CompetitivePositioning
Customer Service Delivery
RelationshipsCustomer QualityRegulatory Quality
Financial Worth
Financial Return
Employee Safety and Development – 10%
Customer Value – 20% Business Operations – 21%
Figure 2.11: Strategic Theme and Criteria Weightings.
The optimisation process produces an efficient frontier (strategic value versus expenditure) against which a budget can be set. This gives the company a view of marginal value benefit versus additional cost. An example of this is shown below (Figure 2.12) where the purple curve represents growing strategic value for every dollar spent and the blue curve demonstrates risk reduction (representing the additional risk if the project were not done) per dollar spent. The diagram on the right is a risk matrix of the programme, with each dot representing the risk reduction in doing a project.
Projects are also analysed for risk (i.e. the risk to the company if the project is not done) as part of the project approval process.
Planned projects are required to undergo concept design, followed by multi-stakeholder evaluation and economic justification processes. If the projects measure up, they are recommended for approval at the appropriate level of authority.
The primary objectives of the optimisation process are:
To provide a consistent approach to the development of capital works programmes •that balances (potentially conflicting) stakeholder requirements;
To eliminate (or mitigate) any high risks to public safety, network performance, •customer outcomes, public relations, or employee engagement; and
To maximise the strategic value of the portfolio of projects that make up the capital •works programme.
Consequence
Efficient Frontier – Risk & Value Overall Risk of Deferral
4,000 9,0003,000 5,000 6,000 7,000 8,000
$ (000)
0
10
20
30
40
50
70
100
90
80
60
0 1 2 3 4 5
0
1
2
3
4
5
Strategic Value Risk
189
21
12
14
11
48
13
19
1617
310
76
15
5
Pro
bab
ility
Figure 2.12: Examples of Strategic and Risk-Scoring Graph Outcomes.
Responsibilities for Asset Management2.7.
Responsibilities for Asset Management are held from the Board through to contractor field staff. This section presents an overview of Powerco’s business model and organisation structure as context for the discussion on responsibilities for Asset Management across the company.
Powerco’s Network Ownership and Management Business Model2.7.1.
Powerco owns and manages the network, and external alliance partners undertake the field service activities. The business model is shown diagrammatically in Figure 2.13.

Return to Index34 ASSET MANAGEMENT PLAN ELECTRICITY NETWORKS FY2010 – FY2019
Powerco Group
IS Services and network information
Corporate Communication
IS Infrastructure
Legal Services
Programme Office
Business Development
Regulatory Management
RegulatorService ProvidersDesign & Field Services
Service ProvidersDesign & Field Services
Finance
Billing
Treasury
Helpdesk and Control Room1
Helpdesk and Control Room1
Electricity Customer and Commercial
Management
Gas Customer and Commercial
Management
Electricity Planning Gas Planning
Electricity Service Delivery Gas Service Delivery
Powerco NZ Holdings Limited Board
Powerco Limited Board
Funds managed by Queensland investments Corporation (58%)
Energy Retailers
Electricity Network Customers
Connection Contractor
Electricity Prospects
Transpower
Generators
Tx customers
Other SuppliersIT services and •
projectsCommunication •
systemEngineering specialist•Regulatory Specialist•
Legal•Property•
Travel•
Gas Retailers
Gas Network Customers
Gas Prospects
Connection Contractor
Gas Fitters
Vector Transmission
Debt Providers
NZDX
Rating Agencies
Public
Community
Executive Management Team
New Connection Service
Retail Service
Cus
tom
er N
eeds
Cus
tom
er N
eeds
AM
P W
orks
Pla
n
AM
P W
orks
Pla
n
New Connection New Connection
Service Mgmt
Outage mgmtCustomer mgmt
Outage mgmtCustomer Service
Supplier mgmt Communication
Governance Reporting
Business Planning Management Review
Financial Services IS and PO services Asset Information
Legal, regulatory and growth support
Regulatory Management
Contract/ project mgmtSafety mgmt
Maint/defect mgmt
Contract/ project mgmtSafety mgmt
Maint/defect mgmt
Babcock and Brown Infrastructure (42%)
Transmission business PTS/ITS2
DBOO
Figure 2.13: Powerco Business Model.

Return to Index 35ASSET MANAGEMENT PLAN ELECTRICITY NETWORKS FY2010 – FY2019
Powerco has five functional units, as outlined in Figure 2.14, comprising separate functional groups for Electricity and Gas networks and shared Finance, Information Systems and Regulatory and Business functional groups. This structure became current in April 2008, prior to which the company was structured along functional lines.
The Corporate structure (and associated position descriptions) is important in the context of the AMP because it defines how accountabilities for the Asset Management subprocesses are assigned to managers and teams.
GENERaL MaNaGER (ELECTRICITy)
Nigel Barbour
Electricity Customer and Commercial ManagementElectricity PlanningElectricity Service DeliveryTransmission Business ManagementNetwork Operations Management
GENERaL MaNaGER (GaS)
andrew McLeod
Gas Customer and Commercial ManagementGas Network PlanningGas Service Delivery
ChIEF FINaNCIaL OFFICER
Elanga Ekanayake
Corporate Finance Management Accounting Billing and ReconciliationTreasury
INFORMaTION SERVICES MaNaGER
Blane Evans-Parker
IS ServicesIS Infrastructure Programme OfficeNetwork Information
REGuLaTORy aND BuSINESS MaNaGER
Paul Goodeve
Regulatory Management Technical Regulatory Management Business Development Legal ServicesCorporate Communications
ChIEF ExECuTIVE
Richard Krogh
Human Resources
Figure 2.14: Powerco’s Corporate Structure.
Governance Level Responsibilities2.7.2.
In carrying out its governance, a key role of the Board is to drive the performance of the company. It does this through establishing Powerco’s objectives and the major strategies for achieving these objectives, while meeting the owner’s key corporate governance policies within the business of the company.
The Board reviews and approves the Asset Management plan, annual capital and operating expenditure forecasts, sanctions for operational or capital projects involving expenditure greater than $2,000,000 (refer to Figure 2.15), and the divestment of any assets with a value greater than $250,000. One of the main rationales that the Board uses for approving such projects is its alignment with the Asset Management Plan.
The Board receives monthly reports that include performance reports against the Asset Management Plan and escalated top 10 risks. It also receives audit reports against a prescribed audit schedule.
Executive and Senior Management Level Responsibilities2.7.3.
The Electricity Division is the custodian of Powerco’s electricity network assets. This Group is responsible for ensuring that the utility assets are developed, renewed, maintained, operated and used on a long-term, sustainable basis to meet the needs of all stakeholders. Setting and monitoring performance standards, making investment decisions, using network information, establishing standards, operating the network, managing work on the network and risk management are included in this work. The General Manager Electricity is responsible for the Electricity Division.
The Electricity Planning Manager is responsible for the Asset Strategy and Asset Planning processes. These processes culminate in the delivery of Asset Management policies and documentation, network valuation, investment policies and forecasts, maintenance and capital works plans, project concept design scopes and maintenance, and design and construction standards.
The Electricity Service Delivery Manager is responsible for fulfilling the capital and maintenance works plans in a timely manner, managing the defects and vegetation control processes, and maintaining the relationship with service providers. The Electricity Service Delivery team is responsible for implementing Powerco’s Health and Safety policies, and administering the Contract Works Manuals and competency certification of contract staff.
Day-to-day operation and access to the network is managed by the Network Operations Manager and the Network Operations Centre. This process includes controlling network shutdowns and network switching, co-ordinating the response to network outages, managing the load control process, maintaining the SCADA system and ensuring adherence to the contractor competency requirements.
The Customer and Commercial team maintains relationships with the major connected customers and retailers, the Customer Initiated Works process, and relationships with other parties associated with the network, such as distributed generators.
Responsibility for the Asset Management Information Systems is taken by the Information Services Group, which is also responsible for IT infrastructure and data services, quality systems, IT development projects and “as building” (updating to match the physical environment) the Information Systems.

Return to Index36 ASSET MANAGEMENT PLAN ELECTRICITY NETWORKS FY2010 – FY2019
Legal services, Business Development and Regulatory Management are the responsibility of the Regulatory and Business Group. Subprocesses include preparation of regulatory submissions, co-ordination of risk management, environmental planning and management, and the Communications and Customer Consultation processes. The impact of new and existing legislation on Powerco’s network is reviewed regularly.
Approval of projects is done through the network project approval process. This process works within the company’s Delegated Financial Authorities and sets out the levels of justification needed for projects to be considered for approval. In summary, the process involves the levels shown in Figure 2.15. In this diagram, a short NPAM comprises a description of the project scope, required timing, budget and major risks. A long NPAM comprises the content of a short NPAM, along with an economic justification, assessment of options and multi-stakeholder benefits.
Projects > $30 thousand and
< $300 thousand
Approval Level: Manager
Project documentation: Short Network
Project Approval Memo
Number per year: Approx 250
Projects > $300 thousand and
< $2 million
Approval Level: Executive
Project documentation: Long Network
Project Approval Memo
Number per year: Approx 20
Projects > $2 million
Approval Level: Board
Project documentation: Sanction for
Expenditure and NPAM
Number per year: Approx 3 to 10
Projects < $30 thousand
Approval Level: Planner Project
Manager
Project documentation: Email or memo
Number per year: Approx 2000
Figure 2.15: Powerco’s Network Project Approval Levels.
Field Operations Responsibilities2.7.4.
Powerco’s field service operations are fully outsourced (Section 2.9.2 describes the outsourcing arrangements). Field service personnel undertake the network maintenance and capital work, gather asset condition information, and provide timely responses to faults and incidents. The field service contractors are a key sensory organ for the Asset Management process – the ears and eyes for the network.
Crossover inevitably and desirably exists between teams. For example, customer communication on price/quality trade-offs is shared between the Corporate Communications process, the Customer Relations process and the Asset Strategy process. Information systems are used and maintained by a variety of teams.
External consultants are sometimes used by all teams for expert advice, performing detailed studies and peer review, such as on detailed design issues.
Asset Management Reporting2.7.5.
Monthly reports against a balanced scorecard of critical performance measures are given to the Chief Executive Officer and Board of Directors. The scorecard reflects
financial, customer, process and improvement/learning areas of their groups. Monthly KPIs include financial performance against budget, SAIDI; projects scoped and works plan completion. Key project status and performance against budget (including explanations of any variations) are reported monthly. Longer-term performance measures are reported annually in the AMP.
Major issues from an Asset Management perspective can be raised at executive meetings or at bi-monthly or weekly team meetings. Annual reviews of AMP to Works Plan and Works Plan completion, and a quarterly group review of Works Plan project status, are undertaken. Group reviews of network incidents and closure of resulting improvement actions are undertaken regularly.
In accordance with Delegated Financial Authorities (DFA), requests for capital are approved by the Board or the Chief Executive Officer and Chief Financial Officer, to ensure that appropriate economic viability investigation has been undertaken and that the proposed project considers the needs of the stakeholders. On project completion, close-out reports are prepared to give internal stakeholders information on how the projects have been completed.
Asset Management Information Systems2.8.
Asset Management information systems have been implemented at Powerco to support the Asset Management processes. The information systems include:
ESRI Geographical Information System (GIS)•
JD Edwards (JDE) Maintenance, Work Management and Financial System•
Electrical Network System (ENS)•
SCADA data and PI system•
TVD dispatch system and OutDef outage recording system•
CIW Electricity•
Improvement Register database and Coin optimisation tool•
Hard copy records and Drawing Management System (DMS)•
Ancillary databases•
The following section provides a brief description of the systems and their associated processes.
Geographical Information System (GIS)2.8.1.
Powerco uses a GIS to capture, store, manage and visualise its network assets. The GIS is built on top of a set of ESRI and Telvent applications (ArcGIS, ArcFM) that deliver data in Web, desktop and service based solutions.

Return to Index 37ASSET MANAGEMENT PLAN ELECTRICITY NETWORKS FY2010 – FY2019
The systems contain data about the lines, cables, devices, structures and Installations of the electricity distribution network, and about the pipes, structures and installations of the gas distribution network.
GIS is the master system for current assets in the network, but it also distributes and informs other systems about the current assets via a middleware system interface (Biztalk server). The primary consumer of this data is the enterprise system (JD Edwards), which acts as the works management and financial system that operates as a slave system off the GIS data. This integration allows calculating and managing the network optimised depreciated replacement cost (ODRC), the network maintenance plans, and others as described under the next chapter. The asset spatial information is also a key input into maintenance scheduling where geographical and network hierarchy factors are considered in the planning, monitoring and improvement of the asset base.
The GIS system also serves as a data reference master for other systems and processes, like new connection requests, address geocoding, and general network information.
As a matter of process, “as built” documentation is required to be submitted to the Network Information team following any work on the network in order to keep the GIS and other systems current.
Maintenance, Works Management and Financial System2.8.2.
Powerco operates a JDE system, which provides Asset Management and reporting capability, including financial tracking, works management, procurement and maintenance management.
Powerco has centralised asset condition and maintenance programming in JDE. As the master for all maintenance and condition information, JDE drives asset renewal programmes centrally. Within JDE, Powerco has implemented system and process improvements for defect and rotable Asset Management. The system provides improved visibility over Powerco’s rotable asset base.
Powerco has recently deployed a mobile platform that will enable the delivery of applications to Service Provider PCs and mobile devices. This will enable asset condition, defect and maintenance activity records to be captured in the field. Future plans include the recording of scheduled maintenance activity completion, prescribed test result capture and corrective maintenance work instructions.
ENS/Gentrack2.8.3.
The ENS is a subsystem of our Gentrack billing system and is used to maintain the relationship of the Powerco installation points and the parent distribution transformer.
SCADA Data and PI System2.8.4.
The PI system specialises in the collection, processing, storage and display of time series data. Powerco will use PI to store the SCADA tag values from, initially, all the analogue SCADA points (initially 2,343 tags with capacity to increase to 4,000). The current SCADA control systems, Abbey Systems and Foxboro, feed the tag data to PI, which stores and processes it. A strong feature of PI is the way large amounts of data are stored and retrieved with quick response time. The client tools for PI, Data Link and Process Book are available over the Citrix portal. These are for viewing data and graphs in customisable interactive displays.
TVD2.8.5.
The TVD Avalanche and CSC Network application suites are both business-critical applications designed for 24/7 operations within Powerco.
Together they are used as a comprehensive Fault Management System for all low-voltage faults reported by consumers and retailers. TVD manages all aspects of the fault, from initial logging, business-to-business event logging, telephony IVR diversion and work order, and service request handling for fault management.
The consumer’s retailer tends to be the first point of contact for customers in respect of any service request, network query or complaint. This includes requests for temporary safety disconnects as well as notification of faults or loss of supply. There is an 0800 number available for direct contact with Powerco’s 24-Hour Network Operations Centre in emergency situations. Large consumers regularly contact Powerco directly via the Key Account Managers.
The retailers are expected to advise Powerco’s Network Operations Centre (NOC) of any concerns regarding the performance of the network on a real-time basis. Field staff will be dispatched to attend faults while maintaining liaison with the NOC to ensure that any inspection or remedial work is carried out in complete safety and in co-ordination with other activities on the network. The NOC ensures that:
Jobs are prioritised on the basis of safety risk first and then on the basis of social or •economic impact;
Appropriate safety measures are applied as necessary;•
Industry best practice, as well as Powerco’s own processes and procedures, are •adhered to at all times; and
All necessary information regarding incidents and outages (including Powerco’s •response) is recorded accurately for later analysis and public disclosure, as necessary.
Powerco targets an average dispatch time of less than four minutes and 90% of jobs dispatched in less that seven minutes. Additionally, Powerco aims to restore supply within three hours for urban faults and six hours for rural faults.

Return to Index38 ASSET MANAGEMENT PLAN ELECTRICITY NETWORKS FY2010 – FY2019
OutDef2.8.6.
OutDef is an application built and maintained by Powerco that handles high-voltage fault recording, fault diagnosis and the management of outages and defects (electrical networks).
The fault database is used to produce external reports for the Commerce Commission, Ministry of Economic Development, and internal reports for Powerco Management and Performance and Protection Engineers to improve network performance. It is an ongoing record of electrical interruptions in the Powerco network, with data collected by fault staff in the field and control room.
OutDef is populated by the Network Controllers during times of low switching activity from switching record sheets. Daily reports of interruptions are prepared and circulated internally. Key outages and SAIDI and SAIFI numbers are reported on monthly. An annual network reliability report is prepared for information disclosure purposes.
CIW Electricity2.8.7.
This is a stand-alone Workflow Management application with an internet interface for Powerco approved contractors. The primary function is to manage the flow of Customer Initiated Work from conception by third party proponent through to as-building and ICP process completion.
Requests for new or existing customers to carry out work on Powerco’s network are covered by Powerco’s Customer Initiated Works process. This process places importance on providing new and existing consumers with a choice of prequalified contractors that they can engage to carry out work at their connection point(s). The process adopted ensures that the integrity of the overall local network and the quality of supply to adjacent consumers is retained, while making the Customer Initiated Work contestable.
A Customer Works Engineer provides the contact point between the customer, or customer’s representative, and Powerco. An Approved Contractor working in accordance with Powerco’s Contract Works Manual can usually complete routine or simple work. Moderately complex or medium-sized works have their design details assessed before approval by the Customer Works Engineer. Complex or large works are referred to the Asset Management Planning team for scoping and review. Works of this nature may require high levels of planning and design input before work can commence.
Improvement Register and Optimisation Tool2.8.8.
The Improvement Register and Optimisation Tool is described in Section 2.6.
Drawing Management System2.8.9.
The drawing management system is based on IC Meridian, and works in conjunction with AutoCad drawing software. It is a database of all engineering drawings, including substation schematics, structure drawings, wiring diagrams, regulator stations, and metering stations. In addition, there is a separate vault that contains legal documents relating primarily to line routes over private property.
While the drawing management system works well, the accuracy of the drawings against what is out in the field is not confirmed. This means that wherever work is done at a zone substation, checks are carried out and drawings updated to reflect the as-built status of the site.
Ancillary Databases2.8.10.
Powerco operates ancillary electronic databases for control and issuing of installation connection point (ICP) information to retailers, and to control hard copy drawings and documents.
Powerco also maintains a comprehensive protection database to manage settings in numerical and electromechanical protection relays.
Other Record Systems2.8.11.
In addition to the electronic systems, several other recording systems are maintained, including:
Zone substation drawing folders. These contain hard copies of the electronic master •drawings;
Standard construction drawings;•
Equipment operating and service manuals;•
Manual maintenance records;•
Network operating information (system capacity information and operating policy);•
Policy documentation; and•
HV and LV schematic drawings. These are distributed in pdf format whenever the •electronic master copy is updated.
Information Integrity and Improvement Actions2.8.12.
Extensive effort is made to ensure the integrity of the asset information. This includes auditing as-built information against the physical work, checking GIS additions against the as-built information, and formal auditing. A comprehensive network information programme is being developed to ensure the quality, consistency and completeness of the entire network’s asset data.

Return to Index 39ASSET MANAGEMENT PLAN ELECTRICITY NETWORKS FY2010 – FY2019
A number of significant data and system rationalisation projects are being undertaken. These projects are summarised below:
The centralisation of asset location and attributed data into the GIS. A key goal •of the systems management is to make the GIS system the master for all spatial data. This involves the synchronisation of information from ENS and other ancillary databases.
Normalisation of naming and coding conventions for asset and network sites in all •core systems to minimise discrepancies.
Updating and redrawing critical zone substation schematics and protection •diagrams.
Integration between network modelling software applications (Synergee and PSS •Sincal) and network data contained in GIS. This will significantly minimise the amount of rework and inaccuracies introduced in maintaining independent datasets.
The completion of the GIS Network connectivity project will improve the consistency •and completeness of critical network hierarchy and topology, especially in the high-voltage network, which will benefit all dependent systems.
A project has recently been completed to reduce the backlog of as-built drawings •awaiting input in the GIS to an acceptable level.
Powerco has also recently replaced the Eastern Region SCADA Master Station as a first step towards an integrated SCADA Master Station. The new ICT platform on which the SCADA Master Station has been delivered gives corporate users real-time data via a web browser, high availability, redundancy and disaster recovery options. This new system provides future capability with advanced network modelling tools to support Asset Management.
Future network information improvement would result from a rolling audit of network data from the field to gather information, like the size of a conductor and location of street lights.
network Service Provision Arrangements 2.9.
Introduction2.9.1.
Powerco outsources all of its field construction and maintenance activities.
Powerco Outsourcing Policy Overview2.9.2.
Powerco has developed a service provision strategy to set the long-term direction for the management of construction and maintenance activities in line with its business model and corporate objectives.
The service provision strategy was revised during 2004 and the updated strategy is given below. The strategy was reviewed giving consideration to:
Powerco’s corporate business drivers;•
The current capabilities, strengths and weaknesses of the service provision market;•
The needs of the Service Providers; and•
The capabilities of the Asset Management Group in managing the outsourcing of •construction and maintenance activities.
Powerco utilises Service Providers and competitive market principles to deliver sustainable improvements in the cost, quality and safety of construction and maintenance services on the electricity and gas networks. These include:
Facilitating Service Provider resources with expertise matched to the work •requirement in the locations required;
Maximising the Service Provider’s control over the inputs to its services to allow it to •meet the service performance level;
Utilising competitive tension to encourage continuous improvement in the cost of •the delivered service;
Minimising the level of management of Service Providers while ensuring appropriate •control is maintained to deliver the desired service outcome;
Maintaining a high level of safety performance by Service Providers; and•
Fairly allocating risk between Powerco and the Service Provider.•
A series of guiding principles has been developed to provide greater detail on how the service provision strategy can be achieved. The service provision principles cover:
Facilitation of resources to meet Powerco’s needs;•
Delegation of responsibility to Service Providers;•
Utilising competitive tension to improve productivity and innovation;•
Optimising the level of Service Provider management; and•
The allocation, communication and recognition of risk.•
The service provision principles describe the use of long-term pure alliance or alliance-style contracts with Service Providers. It is considered that this style of contract is the most appropriate commercial arrangement for Powerco to adopt with its Service Providers for core construction and maintenance activities, given the need to provide 24/7 cover across Powerco’s large (and sometimes remote) network footprint. Pure alliance and alliance-style contracts are well matched to the level of maturity of the Electricity Service Delivery Group and Service Providers.
Powerco will undertake one of its regular reviews of the service provision strategy during 2010.

Return to Index40 ASSET MANAGEMENT PLAN ELECTRICITY NETWORKS FY2010 – FY2019
Pure Alliance-Style Agreement and Contracts2.9.3.
Alliancing is a collaborative arrangement aimed at overcoming a number of the disadvantages often associated with what is described as the traditional contracting approach. The alliance relationship, evidenced by the title, is based on a framework of co-operation and mutual adhesion to agreed principles and outcomes, particularly in relation to matters such as risk and risk-sharing, quality, timing, cost and profit.
Alliancing can lead to a more accurate assessment and certainty of the cost to Powerco in relation to the delivery of services. Usually that cost is lower than what may have been bid or delivered if a more traditional contracting approach had been used. It should be noted, however, that the accuracy and certainty obtained represents a trade-off of sorts. To secure accuracy and certainty, Powerco collectively assumes responsibility, with its alliance partners, for the risks associated with the delivery of services. In a traditional contract arrangement, various risks will have been solely allocated to the contractor (and the contractor would have priced those risks in) and Powerco would have retained the right to sue the contractor in relation to those risks.
Tenix Alliance has had all of the shares in Powerco’s contracting business since November 2005. Tenix Alliance now undertakes the provision of network construction and maintenance services in the Eastern and Western regions, except for the Southern Waikato area. The scope of this partnership includes the following general work types:
Fault and defect repair;•
Zone substation maintenance;•
Major ground-level distribution substations and HV switchgear maintenance;•
Detailed design for general line construction;•
Construction, maintenance, inspection and condition-monitoring work for the •subtransmission and distribution network;
Zone substation development work;•
Distribution network condition-monitoring and maintenance; and•
Construction work for the subtransmission and distribution network.•
The value of work selected and issued under the alliance agreement is set at a guaranteed minimum expenditure level. This enables the alliance Service Provider partner to support the quantity and location of resources to deliver core fault and defect response services, along with scheduled maintenance and capital works services. Major projects, typically greater than $500,000, specialist technical services and vegetation management are performed by other Service Providers.
Typically, this work is performed under either lump-sum or measure-and-value contracts. In addition, other work types are outsourced for benchmarking purposes.
Other Alliance-Style Agreements 2.9.4.
Powerco also has a Contract for Field Services Agreement (CFSA) with NorthPower to build and maintain services, primarily in the Valley network of the Eastern region.
Generally, the CFSA requires the Service Provider to provide:
Fault and defect repair;•
Major ground-level distribution substations and HV switchgear maintenance;•
Detailed design for general line construction;•
Construction, maintenance, inspection and condition-monitoring work for the •subtransmission and distribution network;
Zone substation development work;•
Distribution network condition-monitoring and maintenance; and•
Construction work for the subtransmission and distribution network.•
Apart from major project work and some non-exclusive services outlined in the contract, such as zone substation maintenance, ground-mounted switchgear maintenance and capital work, the services mentioned above are exclusive to the Service Provider.
Other contract arrangements exist pertaining to the provision of tree management over the network footprint.
Vegetation Management 2.9.5.
There are three contractors employed under Vegetation Management Agreements (VMAs). They are charged with looking after all of Powerco’s tree management activities. They look after not only the physical cutting but also compliance with vegetation management regulations. These contractors are Asplundh, Arborco and J&L Cummings Ltd.
The Vegetation Management Agreements are set up to be theoretically self-managing. Targeted cutting takes place on preselected network areas, chosen by safety to the public, personnel, property and network, system reliability and feeder classification (F1 to F5 as defined in section 4.2.4). Powerco derives a list of critical feeders for cutting, which are prioritised on network reliability implications and criticality (e.g. starting at the beginning of a feeder rather than the end), and these are provided to the contractor to manage.
Customer Initiated Work2.9.6.
Customer initiated work, which is typically the extension of the network to connect new consumers or the reticulation of new subdivisions, is performed by a number of approved Service Providers. There is an active market across Powerco’s regions where the approved Service Providers compete for this work.

Return to Index 41ASSET MANAGEMENT PLAN ELECTRICITY NETWORKS FY2010 – FY2019
Transmission Relationship Management2.10.
Powerco maintains a close relationship with the National Grid owner and System Operator, Transpower NZ Ltd, at the following four levels of contact:
Regular peer contact at senior management levels.•
Powerco has a resource dedicated to managing day-to-day business for the •technical aspects of the Transpower relationship (and with embedded generators). This relationship deals with formal requests for information or services from either Powerco or Transpower. Such requests are formally documented and supported by technical evidence.
Powerco’s Network Operations release planners’ work with Transpower’s field •planners to co-ordinate outages and load management for maintenance or development operations.
Powerco’s Network Operations control room operators are in direct contact with •Transpower regional control centres in Auckland and Wellington for day-to-day operations of network interfaces.
Powerco network demand is monitored closely in real time against grid exit point capacity limits and constraints, as described in Section 7.8.2. The load management system can automatically control thermal storage loads if preset limits are reached. Reactive power consumption is being looked at to meet the proposed Electricity Commission requirements.
ASSETS CoVEREd3.
Powerco is a utility network ownership and management business and is New Zealand’s largest provincial distributor of electricity and gas. This plan covers Powerco’s fixed electricity network assets.
Electricity network Assets3.1.
Powerco owns and operates extensive urban and rural electricity distribution networks, servicing around 310,000 customers in the following parts of the North Island of New Zealand:
Coromandel•
Hauraki Plains•
East and South Waikato•
Western Bay of Plenty/Tauranga•
Taranaki•
Wanganui•
Rangitikei•
Manawatu•
Wairarapa•
Key Network Stats as at 31 March 2009 Total EasternSouthern & Western
Number of ICPs 315,379 143,493 171,886
System Length (km) 29,274 10,998 18,276
System ODV (as at 31 March 2004) $950 million $408 million $535 million
DRC Network Fixed Assets in Use (2006) $1,185 million
Energy Conveyed 4,507GWh 2,224GWh 2,283GWh
System Coincident Maximum Demand 764MW 379MW 394MW
Notes:
1. Eastern Region comprises Coromandel, South and East Waikato and Tauranga.
2. Southern and Western Regions comprise Manawatu, Taranaki, Wairarapa and Wanganui.
3. Total values include common assets (Central SCADA and Spares).
4. Values accommodate corrections to the asset register (e.g. found assets).
In this plan, we describe and characterise the network assets by asset type, network function, geographical region and customer type.

Return to Index42 ASSET MANAGEMENT PLAN ELECTRICITY NETWORKS FY2010 – FY2019
The network Assets by Type and function3.2.
The major type categories of electricity distribution network assets are:
Overhead lines;•
Underground cables;•
Distribution transformers;•
Subtransmission (not zone substation) and distribution switchgear; •
Zone substation and Transmission Point of Supply asset; and •
Emergency and critical spares.•
The major functional categories of the electricity distribution assets are:•
Transmission Points of Supply;•
Subtransmission network;•
Zone substations, including buildings;•
High-voltage distribution networks and distribution switchgear;•
Distribution substations and transformers;•
Low-voltage distribution networks, including consumer service connections;•
Protection, SCADA, load-control injection and communications systems; and•
Emergency and critical spares.•
The electricity distribution assets do not include:
Land and buildings, except for substation land and buildings;•
Consumer revenue meters and load control relays, which are owned by other •parties;
Non-network fixed assets, such as motor vehicles, furniture and office equipment, •plant and tools; and
Net financial assets.•

Return to Index 43ASSET MANAGEMENT PLAN ELECTRICITY NETWORKS FY2010 – FY2019
Thumbnail statistics about the network by asset type and functional category as follows:
$mill
ion
0
1,200
1,000
800
600
400
200
Electricity Network Replacement Cost by Asset Type
Overhead Line Underground Cable Distribution Transformers Distribution Switchgear
Zone Substations SCADA/Comms/Ripple Spares (Emergency & Critical)
Figure 3.1 Electricity Network Asset Replacement Cost by Asset Type (2004 ODV Valuation).
$mill
ion
0
1,200
1,000
800
600
400
200
Electricity Network Replacement Cost by Function
Subtransmission Zone Substation & GXP Protection & Control Distribution
Distribution Substation Low Voltage Spares (Emergency & Critical)
Figure 3.2: Electricity Network Asset Replacement Cost by Functional Category (2004 ODV Valuation).
Total network replacement costs by asset type category and function (ODV valuation as at 31 March 2004) are shown in Figures 3.1 and 3.2 above.
Replacement Cost by Asset Category
Rep
lace
men
t C
ost
($00
0)
0
1,000,000
500,000
1,500,000
2,500,000
2,000,000
Assets Valued at ODV Replacement Cost
Assets Valued at Current Replacement Cost
Overhead Underground Transformers Switchgear Substations
Asset Category
Figure 3.3: Replacement Cost by Asset Category.
Table 3.1: Key Network Statistics
Key Network Stats as at 31 March 2009 Total EasternSouthern &
Western
Length of Overhead Circuit (km) 23,089 8,189 14,900
Length of Underground Circuit (km) 6,185 2,809 3,376
Subtransmission Circuit Length (km) 1,666 598 1,068
Distribution Circuit Length (km) 16,638 5,905 10,733
Low-Voltage Circuit Length (km) 10,970 4,495 6,475
Number of Zone Substations and Switching Stations 108 42 66
Zone Substation Transformer Capacity (MVA) 1,503 749 754
Distribution Transformer Capacity (MVA) 2,870 1,376 1,494

Return to Index44 ASSET MANAGEMENT PLAN ELECTRICITY NETWORKS FY2010 – FY2019
Justification for the Network Assets 3.2.1.
Electricity distribution networks follow the philosophy that, despite the associated complications in community, society is more than the simple sum of its parts. Put another way, we are better off working together than if all people act individually.
One way for consumers to have electricity would be for each one to own their own generator and run it independently. However, through the benefits of scale and diversity of consumption, unless consumers live in very remote rural areas, it is usually more economical for electricity to be generated centrally and for consumers to receive reticulated power.
Network assets are required to deliver electricity from generating sources to many consumers. They range from subtransmission assets down to low-voltage reticulation along residential streets. Powerco uses several voltages for different distribution distances.
Transmission Points of Supply3.2.2.
Powerco’s network connects to Transpower’s grid at 66kV, 33kV and 11kV via 27 Transpower points of supply or grid exit points (GXPs). The grid exit points comprise assets mostly owned by Transpower, although Powerco does own circuit-breakers and protection and control gear at some grid exit points. The grid exit points supplying Powerco’s electricity network are identified in Table 7.14, along with their respective capacities.
Justification for the Points of Supply3.2.3.
The grid exit points are the points of interface between Powerco’s subtransmission and distribution networks and Transpower’s transmission grid. The transmission grid conveys bulk electricity from the generators throughout New Zealand to local communities. The grid exit points are the main supply points from which the local communities are supplied with electricity and where embedded generation is connected to the grid. To provide a reliable supply of electricity to the subtransmission network, redundancy is built into the grid exit points in many locations by means of duplicated incoming lines, transformers and sectioned busbars. A large number of consumers may lose supply if a grid exit point fails or is shut down, so a highly reliable configuration is required. However, the levels of security required by Powerco’s standards are not always achieved (refer to Figure 7.14).
Subtransmission Networks 3.2.4.
Figure 3.4: Linesman at work on a 66kV subtransmission circuit near Thames.
The subtransmission networks carry electricity within regions to suburbs or rural localities. They mostly operate at 33kV, although there are some at 66kV, and they supply in excess of 100 zone substations. The subtransmission voltages in use are mainly a result of history and they correspond with the 36kV and 72.5kV maximum apparatus voltage classes set out by IEC.
Subtransmission network configurations tend to be radial for remote rural areas, loops or rings for intensive rural or suburban areas, or transformer feeders for industrial or urban environments.
The majority of the rural subtransmission networks are of overhead construction, on wood or concrete poles, but there are some cabled routes or sections of routes. Short lengths of 33kV cable are used at some zone substations. The load density in the service areas is relatively low and thus many conductor sizes are light.
Underground cables tend to be more common for subtransmission networks in urban areas. These are typically cross-linked polyethylene-insulated cables, although some pressure oil-filled cables exist in Palmerston North and Hawera.

Return to Index 45ASSET MANAGEMENT PLAN ELECTRICITY NETWORKS FY2010 – FY2019
Table 3.2: Key Subtransmission Statistics
Subtransmission Network Stats as at 31 March 2009
Total Eastern Southern & Western
OH UG Total OH UG Total OH UG Total
Length of 66kV Circuit (km) 152 0 152 152 0 152 0 0 0
Length of 33kV Circuit (km) 1,316 114 1,430 370 55 424 946 59 1,005
Total subtransmission (km)
1,467 114 1,581 521 55 576 946 59 1,005
The subtransmission networks are described in more detail in Section 3.3, and are shown geographically on maps in Appendix 2.
Justification for Subtransmission Assets3.2.4.1
Subtransmission assets carry electricity at 66kV or 33kV from the Transpower or generating company connection points to zone substations, although other voltages could be used in the future. To provide a reliable supply of electricity to the zone substations, redundancy is built into the network in many locations by means of duplicated or interconnected lines. A large number of consumers would lose supply if a zone substation fails, so a highly reliable subtransmission network is required. However, the levels of security required by Powerco’s standards at zone substations are not always achieved.
Embedded Generation3.2.5.
In some locations, Powerco’s subtransmission and distribution networks have generation connected that can impact on the planning and operation of the network. Therefore, while they are not Powerco assets, per se, they still warrant mention in this plan. Generation with capacity greater than 1MW is outlined as follows:
Table 3.3: Key Embedded Generation Statistics
Dedicated Export Generation:
Kaimai Hydro Tauranga 40MW
Tararua Wind Farm North Manawatu 34MW
Tararua Wind Farm South Manawatu 34MW
Patea Hydro Taranaki 30.5MW
Todd Energy Mangahewa Taranaki 9MW
Hau Nui Wind Farm Wairarapa 8.5MW
Mangorei Hydro Taranaki 4.5MW
Motukawa Hydro Taranaki 4.3MW
Industrial Co-generation installations:
Carter Holt Harvey Kinleith 30MW
Ballance-Agri Kapuni 2.5MW
Ballance-Agri Mt Maunganui 2MW
Todd Energy McKee Taranaki 2MW
Origin Pacific Taranaki 1.2MW
Under Construction:
Palmerston North City Council Manawatu 1MW
In addition, there are an increasing number of smaller, embedded generation installations being commissioned, ranging from 1.8kW micro-systems to 600kW landfill methane gas-driven units. Details of all new installations are being captured and documented into Powerco’s network operating systems. All installations are commissioned under Powerco’s embedded generation standards to ensure safety and security.
Zone Substations 3.2.6.
Subtransmission voltage is converted to distribution voltage by means of zone substations. These are mostly 33/11kV, but a few are 33/6.6kV or 66/11kV. Some supply 22kV from 11/22kV transformers. A radial feeder network runs from the zone substations throughout the service area. Zone substation transformer capacities range from 1.25MVA to 24MVA.
Substations supplying urban/industrial loads typically have two transformers, two incoming 33kV feeders and anywhere between four and 15 outgoing distribution voltage feeders, except in the Wanganui and Valley areas where some single transformer substations are typically used.
For rural substations only one transformer is normally provided, and there are typically three to six distribution voltage feeders.

Return to Index46 ASSET MANAGEMENT PLAN ELECTRICITY NETWORKS FY2010 – FY2019
Figure 3.5: Main St Zone Substation, Palmerston North.
There are two vector groups in use: Dy11 in the Valley area and the ex-Taranaki EPB area; and Yy0 in the other regions. The difference in vector groups limits interconnection between regions and restricts the interchanging of transformers.
Table 3.4: Zone Substation Statistics
Zone Substation Stats as at 31 March 2009 Total EasternSouthern &
Western
Number of central city zone substations 8 2 6
Number of suburban or town zone substations 54 23 31
Number of rural and remote rural zone substations 33 11 22
Number of zone substations whose role is predominantly supplying industrial load 14 7 7
Number of switching stations 2 1 1
Total zone substations and switching stations 111 44 67
Details of zone substation capacities and security of supply classes are given in Section 7.
Justification for Zone Substation Assets3.2.6.1
Zone substations convert subtransmission voltage levels of 66kV or 33kV to distribution voltage levels of 22kV, 11kV or 6.6kV. They are required because voltages above 22kV are not an economically viable means of distributing electricity to individual consumers or groups of consumers, except for single customers with a load above about 8MVA.
In many cases, equipment redundancy is provided at zone substations so that supply can be maintained in the event of an equipment failure and maintenance can be performed without a supply interruption.
Distribution Network3.2.7.
Electricity is distributed from the zone substations around suburbs and rural localities to consumers using a network of 22kV, 11kV or 6.6kV distribution lines or cables. Like the subtransmission networks, these voltages are mainly a consequence of history, but they correspond to the 24, 12 and 7.2kV maximum apparatus voltages set by IEC.
The majority of the rural distribution networks are of overhead construction, on concrete or wooden poles. In suburban areas, there is a mix of overhead and underground construction, depending on the age of the original reticulation and the planning rules of the particular local authority at the time. In CBD areas, the distribution network is almost invariably underground.
Overhead distribution circuits usually comprise three conductors arranged in a flat configuration. The distribution circuits may be accompanied by low-voltage circuits under-built on the same line. In some rural areas where customers have a need for single phase supply, circuits may have only two wires. In remote rural areas, Single Wire Earth Return (SWER) systems may used. The majority of poles are reinforced concrete, pre-stressed concrete, hardwood or softwood. Railway iron poles exist in some areas. Overhead conductor types are predominantly aluminium (AAC or ACSR), copper or in some remote areas, galvanised steel. The present norm is to use pre-stressed concrete poles with hardwood cross-arms and AAC conductor.
Underground cables tend to have paper or cross-linked polyethylene (XLPE) insulation and either copper or aluminium conductors. The present norm is to use underground cables with aluminium conductors and XLPE insulation.
Distribution network configurations are typically highly meshed to a degree dependent on the density of load. Distribution networks in CBD areas are heavily meshed and, at the other end of the scale, remote rural feeders may contain little ability to interconnect.

Return to Index 47ASSET MANAGEMENT PLAN ELECTRICITY NETWORKS FY2010 – FY2019
Table 3.5: Distribution Network Statistics
Distribution Network Stats
as at 31 March 2009
Total Eastern Southern & Western
OH UG Total OH UG Total OH UG Total
Length of 22kV Circuit (km) 120 0 121 0 0 0 120 0 121
Length of 11kV Circuit (km) 13,915 1,718 15,633 4,732 1,108 369 9,183 610 9,793
Length of 6.6kV Circuit (km) 419 9 427 0 0 0 419 9 427
Total distribution (km) 14,454 1727 16,180 4,732 1,108 5,840 9,722 619 1,025
Figure 3.6: Rural Distribution Line, Rangitikei area.
Despite their meshed configuration, distribution feeders are always operated in radial fashion, apart from short periods while feeders are paralleled to transfer loads from one feeder to another.
The meshed nature of distribution feeders provides a degree of security for maintaining supply to customers during fault events or maintenance shutdowns.
Distribution network conductor size is selected to provide a mix of adequate capacity to accommodate the forecast load during backfeed situations, adequate voltage performance, adequate fault capacity and optimising the energy-loss profile of the network. Voltage performance can be improved by ensuring that the power factor of the electricity is adequate, or through voltage regulators.
Further descriptions of the distribution networks are given in Section 3.3.
Distribution Switchgear 3.2.8.
Distribution switchgear is specialised equipment used for transferring the load between distribution feeders, moving distribution feeder open points, isolating faulted components from the rest of the network, or for providing points of isolation to enable work to be done safely on the distribution network.
In overhead networks, distribution switchgear includes air-break switches, circuit-breakers, links and fuses, which are used to partition or sectionalise parts of distribution feeders; and reclosers, sectionalisers and fuses, which are used to isolate faulted sections from the main distribution feeders.
Figure 3.7: Air-break Switch (left) and Dropout Fuse.
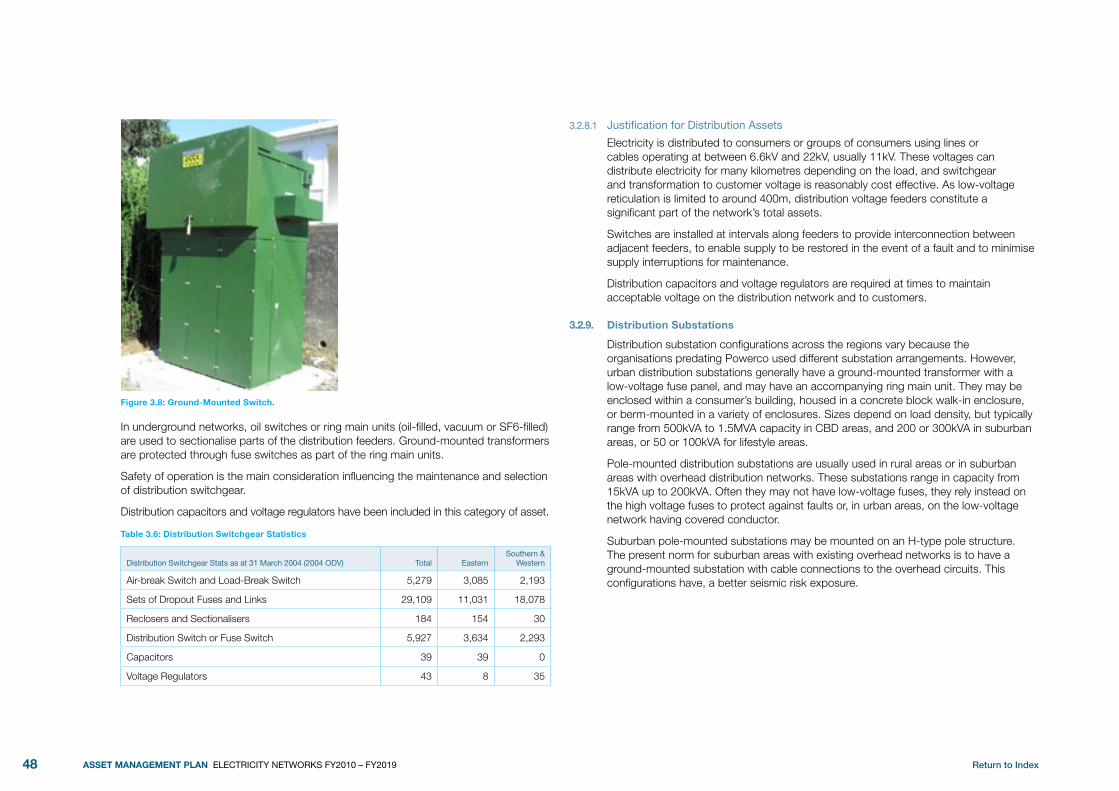
Return to Index48 ASSET MANAGEMENT PLAN ELECTRICITY NETWORKS FY2010 – FY2019
Figure 3.8: Ground-Mounted Switch.
In underground networks, oil switches or ring main units (oil-filled, vacuum or SF6-filled) are used to sectionalise parts of the distribution feeders. Ground-mounted transformers are protected through fuse switches as part of the ring main units.
Safety of operation is the main consideration influencing the maintenance and selection of distribution switchgear.
Distribution capacitors and voltage regulators have been included in this category of asset.
Table 3.6: Distribution Switchgear Statistics
Distribution Switchgear Stats as at 31 March 2004 (2004 ODV) Total EasternSouthern &
Western
Air-break Switch and Load-Break Switch 5,279 3,085 2,193
Sets of Dropout Fuses and Links 29,109 11,031 18,078
Reclosers and Sectionalisers 184 154 30
Distribution Switch or Fuse Switch 5,927 3,634 2,293
Capacitors 39 39 0
Voltage Regulators 43 8 35
Justification for Distribution Assets3.2.8.1
Electricity is distributed to consumers or groups of consumers using lines or cables operating at between 6.6kV and 22kV, usually 11kV. These voltages can distribute electricity for many kilometres depending on the load, and switchgear and transformation to customer voltage is reasonably cost effective. As low-voltage reticulation is limited to around 400m, distribution voltage feeders constitute a significant part of the network’s total assets.
Switches are installed at intervals along feeders to provide interconnection between adjacent feeders, to enable supply to be restored in the event of a fault and to minimise supply interruptions for maintenance.
Distribution capacitors and voltage regulators are required at times to maintain acceptable voltage on the distribution network and to customers.
Distribution Substations 3.2.9.
Distribution substation configurations across the regions vary because the organisations predating Powerco used different substation arrangements. However, urban distribution substations generally have a ground-mounted transformer with a low-voltage fuse panel, and may have an accompanying ring main unit. They may be enclosed within a consumer’s building, housed in a concrete block walk-in enclosure, or berm-mounted in a variety of enclosures. Sizes depend on load density, but typically range from 500kVA to 1.5MVA capacity in CBD areas, and 200 or 300kVA in suburban areas, or 50 or 100kVA for lifestyle areas.
Pole-mounted distribution substations are usually used in rural areas or in suburban areas with overhead distribution networks. These substations range in capacity from 15kVA up to 200kVA. Often they may not have low-voltage fuses, they rely instead on the high voltage fuses to protect against faults or, in urban areas, on the low-voltage network having covered conductor.
Suburban pole-mounted substations may be mounted on an H-type pole structure. The present norm for suburban areas with existing overhead networks is to have a ground-mounted substation with cable connections to the overhead circuits. This configurations have, a better seismic risk exposure.

Return to Index 49ASSET MANAGEMENT PLAN ELECTRICITY NETWORKS FY2010 – FY2019
Figure 3.9: Pole-Mounted Substation and Ground-Mounted Substation.
Rural distribution substations generally comprise a transformer on a pole, pictured above, left, with associated high-voltage fuse gear, and often low-voltage fuses. Sizes range from 15kVA to 100kVA depending on load density, with 15kVA generally used for remote rural areas (60A peak with ADMD at zone substation level of 2kVA, or 13% utilisation) and between 30 and 100kVA often used for dairy farm or orchard areas.
Some of the smaller pole-mounted transformers are single phase units being fed from two or three-wire distribution lines; others are three-phase units depending on the nature of load supplied and on the available distribution network phasing.
Table 3.7: Typical Distribution Substation Application by Transformer Size
Transformer Capacity (kVA) Typical Application
15kVA Single Remote Rural Customer
30kVA Between 1 and 4 Rural Customers with small LV network connecting the customers
50kVA Between 5 and 9 Rural or Lifestyle customers, or single large agricultural load.
100kVA Up to 22 Suburban or Semi-rural customers, or large agricultural load
200kVA Up to 47 Suburban domestic customers, or industrial load
300kVA Up to 72 Suburban domestic customers, or industrial load
500kVA High density suburban domestic customers, industrial or commercial load
750kVA Industrial or commercial load
1000kVA, 1500kVA Commercial load in CBD or large shopping centre, industrial process
Above 1500kVA Special industrial process
All distribution substations have a neutral connection to earth as part of the Multiple Earthed Neutral (MEN) system. The earth connection may be made through driven earth stakes or through buried conductor. For safety reasons, it is important that the earth connection is integral and earth testing is performed at regular intervals.
The distribution substation often contains a maximum demand indicator that allows monitoring of the historical loading at the transformer. The substation also often contains a streetlight control relay.
Table 3.8: Distribution Transformer Statistics
Distribution Transformer Stats as at 31 March 2004
(2004 ODV)
Total Eastern Southern & Western
Pole Mount
Ground Mount Total
Pole Mount
Ground mount Total
Pole Mount
Ground Mount Total
Above 1500kVA capacity (industrial)
0 82 82 0 82 82 0 0 0
1000kVA, 1250kVA & 1500kVA (large commercial, industrial)
0 157 157 0 92 92 0 65 65
500kVA, 750kVA (commercial, industrial)
19 735 754 7 385 392 12 360 372
200kVA, 300kVA (residential) 762 2,716 3,478 64 1,548 1,612 698 1,168 1,866
100kVA (residential, agricultural)
724 2,542 3,266 250 1,776 2,026 474 766 1,240
50kVA, 75kVA (large rural, semi rural)
2,774 0 2,774 1,252 0 1,252 1,522 0 1,522
30kVA (rural) 14,921 0 14,921 4,645 0 4,645 10,276 0 10,276
15kVA (rural, remote rural) 4,611 0 4,611 1,769 0 1,769 2,842 0 2,842
33kV (zone substation, ripple injection)
9 9 18 0 2 2 9 7 16
Total 23,820 6,251 30,068 7,987 3,885 11,869 15,833 2,366 18,199

Return to Index50 ASSET MANAGEMENT PLAN ELECTRICITY NETWORKS FY2010 – FY2019
Justification for Distribution Substation Assets3.2.9.1
Distribution substations convert distribution voltages to 230/400V for consumers to use. They are located close to groups of consumers because these voltages cannot be distributed more than about 400m without excessive voltage drop.
Low-voltage Assets3.2.10.
Figure 3.10: Low-voltage Line.
Low-voltage (LV) assets consist of 400V lines, cables, link boxes and pillar-boxes. By design, the LV neutral is intended to be maintained at earth potential (as part of the Multiple Earthed Neutral (MEN) system) and special earth banks may be in place ensure this.
Overhead low-voltage circuits may be mounted on their own poles or they may be under-built below a distribution network circuit. Low-voltage circuits may have as many as six conductors, comprising three phases, one neutral, one dedicated streetlight wire and one hot water pilot conductor. Conversely, low-voltage circuits may have only two conductors – one phase and one neutral for supplying one single-phase customer or a row of street lights.
Underground low-voltage circuits may comprise a single four- or five-core cable, or a neutral screened three- or four-core cable. The final core may be used for supplying street lights. A variety of cable types may be in use, ranging from PVC-covered single-core conductors, such as “Beetle”, to stranded aluminium XLPE/PVC insulation. A variety of historical standards of workmanship are evident, with some examples of corroding conductor or improper use of bimetallic lugs.
Low-voltage network design is dictated by the voltage fluctuation at each consumer’s premises. The number of consumers on a particular low-voltage network depends on the load density, but the distance from the distribution transformer to the furthest consumer is usually limited to around 400 metres.
In urban situations, 400V link boxes are in place to allow the adjacent 400V circuits to provide back-up supply in the event of failure of a distribution substation.
Figure 3.11: Street-mounted LV Pillar Boxes.
Consumers connect to Powerco’s LV network either by a cable from a service pillar, usually located on the boundary of the property, or by an overhead service line from a pole-mounted fuse. Ownership of service lines varies depending on the policy in place at the time of installation, but they are generally owned by the consumer from the point of connection to the consumer’s main switchboard. Ownership of the service line from the point of supply back to the isolation fuse is usually by the distribution lines company.
Powerco supplies street lights although it does not own street lighting columns, lamps, reflectors or lamp holders: these are generally owned by the Local Authority. A controlled street-lighting wire is often provided whichh may be mounted on the Low-voltage poles or on their own standards. The supply to each streetlight has its own means of isolation.
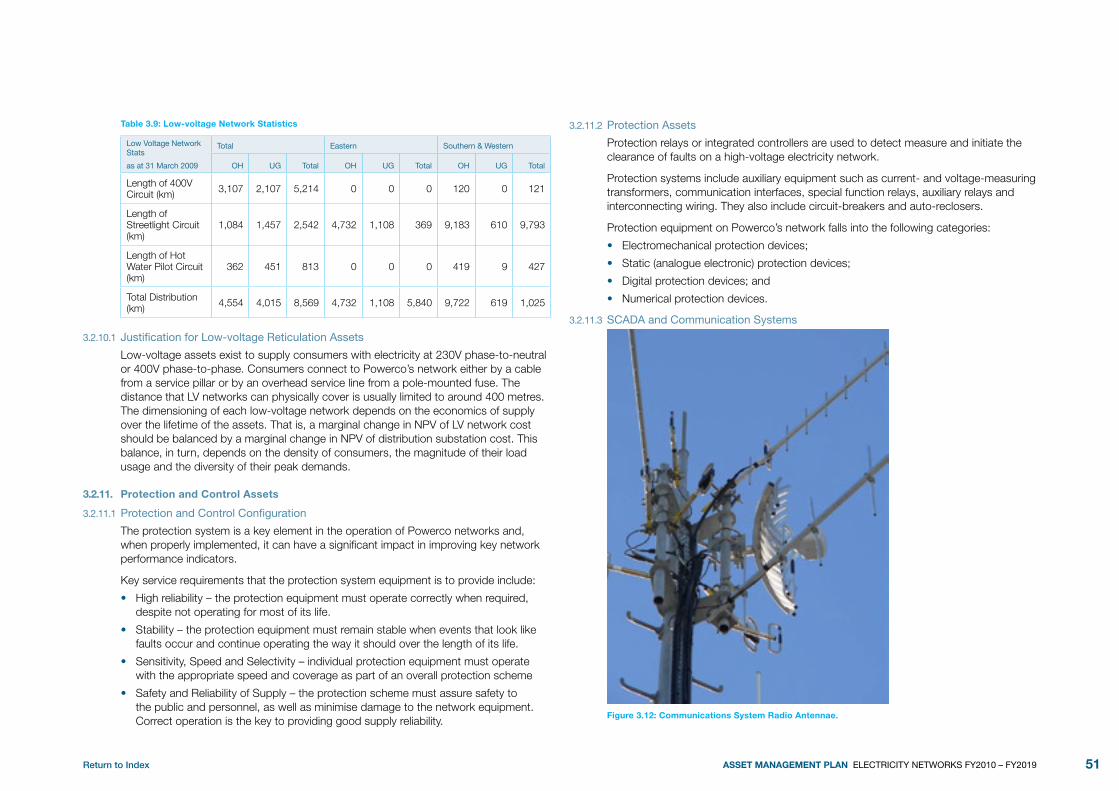
Return to Index 51ASSET MANAGEMENT PLAN ELECTRICITY NETWORKS FY2010 – FY2019
Table 3.9: Low-voltage Network Statistics
Low Voltage Network Stats
as at 31 March 2009
Total Eastern Southern & Western
OH UG Total OH UG Total OH UG Total
Length of 400V Circuit (km) 3,107 2,107 5,214 0 0 0 120 0 121
Length of Streetlight Circuit (km)
1,084 1,457 2,542 4,732 1,108 369 9,183 610 9,793
Length of Hot Water Pilot Circuit (km)
362 451 813 0 0 0 419 9 427
Total Distribution (km) 4,554 4,015 8,569 4,732 1,108 5,840 9,722 619 1,025
Justification for Low-voltage Reticulation Assets3.2.10.1
Low-voltage assets exist to supply consumers with electricity at 230V phase-to-neutral or 400V phase-to-phase. Consumers connect to Powerco’s network either by a cable from a service pillar or by an overhead service line from a pole-mounted fuse. The distance that LV networks can physically cover is usually limited to around 400 metres. The dimensioning of each low-voltage network depends on the economics of supply over the lifetime of the assets. That is, a marginal change in NPV of LV network cost should be balanced by a marginal change in NPV of distribution substation cost. This balance, in turn, depends on the density of consumers, the magnitude of their load usage and the diversity of their peak demands.
Protection and Control Assets3.2.11.
Protection and Control Configuration3.2.11.1
The protection system is a key element in the operation of Powerco networks and, when properly implemented, it can have a significant impact in improving key network performance indicators.
Key service requirements that the protection system equipment is to provide include:
High reliability – the protection equipment must operate correctly when required, •despite not operating for most of its life.
Stability – the protection equipment must remain stable when events that look like •faults occur and continue operating the way it should over the length of its life.
Sensitivity, Speed and Selectivity – individual protection equipment must operate •with the appropriate speed and coverage as part of an overall protection scheme
Safety and Reliability of Supply – the protection scheme must assure safety to •the public and personnel, as well as minimise damage to the network equipment. Correct operation is the key to providing good supply reliability.
Protection Assets3.2.11.2
Protection relays or integrated controllers are used to detect measure and initiate the clearance of faults on a high-voltage electricity network.
Protection systems include auxiliary equipment such as current- and voltage-measuring transformers, communication interfaces, special function relays, auxiliary relays and interconnecting wiring. They also include circuit-breakers and auto-reclosers.
Protection equipment on Powerco’s network falls into the following categories:
Electromechanical protection devices;•
Static (analogue electronic) protection devices;•
Digital protection devices; and•
Numerical protection devices.•
SCADA and Communication Systems3.2.11.3
Figure 3.12: Communications System Radio Antennae.

Return to Index52 ASSET MANAGEMENT PLAN ELECTRICITY NETWORKS FY2010 – FY2019
The system control and data acquisition (SCADA) equipment is used to control and monitor the networks remotely from the Network Operations Centre in New Plymouth. Powerco operates two SCADA systems, one supplied by Abbey Systems in the Western region and one supplied by Foxboro in the Eastern region. They comprise:
SCADA master stations located at the Network Operations Centre;•
Remote terminal units (RTUs) located at zone substations;•
RTUs located on the distribution network. This includes pole-mounted and ground-•mounted units, radio repeaters and load control plant.
Communication systems consisting of:
VHF, UHF or Microwave radio circuits, •
Optical fibre•
TelstraClear/Telecom leased circuits,•
CDMA and GPRS private IP networks•
Powerco-owned copper cable communication circuits•
Communication hubs for the Abbey Systems SCADA at Hawera, Wanganui, Palmerston North and Masterton are connected through a wide area network (WAN) to the master station located at the Network Operations Centre. Communication hubs for the Foxboro SCADA system at Te Aroha and Tauranga are linked via a WAN to an operator station in the Network Operations Centre.
A SCADA replacement project is under way, which will replace the Eastern SCADA Master Station and Load Control systems with OSI Monarch to provide a common interface across Powerco. It is intended that this new SCADA platform will be subsequently rolled out into the Western Region.
Powerco is also re-establishing and enhancing its own VHF Voice Radio network to remove reliance on the current Fleetlink trunked radio system, thereby increasing radio coverage while reducing operational costs.
Load-control Systems3.2.11.4
Load-control systems allow electricity distribution companies to control the profile of the load demanded by consumers where they have load suitable for control. Audio frequency signals are sent through electricity distribution networks from ripple-injection plants. Ripple-receive relays, located at consumer main distribution boards, turn-on or off certain consumer loads, such as hot water or space heating. Configured well, load-control systems are highly effective at reducing demands at peak times by deferring non-time-critical power usage. The benefits of load-control systems include more predictable peak demand magnitudes, fewer peaking generation plants and deferred transmission and distribution capacity augmentations. The benefits accrue across the entire electricity sector.
The load-control system comprises two main parts – the injection plant and the receivers. Powerco’s injection plants vary in type, technology and age, but generally they are operated under the control of the SCADA system and inject signals across the electrical network to control the receivers in the field. Injection plants are installed at some GXPs and some zone substations. The receivers are located at the point where the controllable load is connected and are generally owned by a third party, not Powerco.
The load-control system is used to control water heating and other controllable loads, to manage system peak demand, to provide load smoothing, to operate public lighting and to meet other customer requirements.
Where load control system is used to control street lights, Powerco provides a control signal to switch the lights on and off in accordance with the requirements of the lighting owner. Ownership of the street lighting relay receivers varies depending on area. In some cases Powerco owns and maintains the relay receivers or local control system, in others they are 3rd party owned.
Energy Measurement Systems 3.2.11.5
Powerco’s network includes metering voltage and current transformers at 63 installations. The voltage and current transformers’ outputs are used to power measurement devices and, in some cases, to operate other substation protection and control devices. The metering units are calibrated and maintained to meet the requirements of the electricity Governance Rules and Regulations. The metering units are embedded in the distribution network and comprise:
Outdoor metering units, pole-mounted or ground-mounted, which are part of the •network switching equipment; and
Components of zone substations, including current transformers mounted on high-•voltage busbars, and voltage transformers forming part of the substation’s auxiliary voltage supply.
GXP Meters 3.2.11.6
High-accuracy meters exist at grid exit points for checking the Transpower energy reconciliation meters to determine demand for load control purposes, SCADA indication purposes and recording power factor. Most of these meters are now around 20 years old or older.
Justification for Protection and Control Assets3.2.11.7
The protection, SCADA, radio, microwave and cable communication systems are used to protect, monitor and control the status of the network and to enable some assets to be operated remotely. The overall replacement cost of these assets may be lower than other categories but the amount of strategic direction and careful design is significant.
Load control equipment benefits the entire electricity industry by improving the load factor of electricity demand. An improved load factor means less need for expensive

Return to Index 53ASSET MANAGEMENT PLAN ELECTRICITY NETWORKS FY2010 – FY2019
peaking generation and lower installed capacity of transmission equipment and some distribution network equipment. With Demand Side Management (DSM) taking on increasing importance, the need for effective and reliable load control systems is becoming more important.
Emergency and Critical Spares3.2.12.
Emergency spares are held to provide a level of immunity in the network operation against the (catastrophic) failure of assets. This may be for prescribed events, although one has to be careful to know where to stop. Emergency spares include things like transformers of assorted sizes, poles of different types, fuses and fuse elements, cross-arms, insulators, bolts, pillar boxes, switch units, joint kits, compression joints and heat-shrink.
Critical spares are specialised parts that are kept to keep an existing asset going. They may be consumables as part of a maintenance regime, or special parts that need to otherwise be specially manufactured due to obsolescence or have a long lead time. These may include tap changer parts, pressure oil cable joint kits, transformer bushings or switchgear parts.
Justification for Emergency and Critical Spares 3.2.12.1
Emergency spares are held to provide a level of security in the network against an unexpected failure of network assets that could be difficult to obtain (or in the quantities needed) at short notice. Without these holdings, consumers could be exposed to long periods without power supply. Emergency spares may be held for a prescribed type of event.
Critical spares are held to provide a level of security against the unexpected failure of a unique or specialised piece of equipment whose parts may be difficult to source at short notice. Critical spares may also be specialised consumables that a certain asset needs as part of its ongoing regular maintenance regime. Without critical spares, a network asset (and therefore the network) is exposed to excessive risk of failure.
Back-up Generation Equipment3.2.13.
Back-up diesel generation is available for supporting the Network Operations Centre in New Plymouth and the operational hub at Palmerston North.
Powerco owns around 20 small (5kVA) portable generators to provide customers with special power supplies in extreme circumstances where supply may not otherwise be able to be provided for long periods, such as in severe storms.
Mobile and temporary generators are hired when needed for minimising the customer impacts from planned shutdowns or when needed for emergencies.
Area network descriptions 3.3.
Powerco has two contiguous networks, but within these there used to be several previously separate distribution network entities. By virtue of their history, each of these network parts has its own unique characteristics that need to be taken into account in the planning and network management process. The subtransmission networks of each network are shown in Appendix 2.
Manawatu Network 3.3.1.
The Manawatu region has three areas, based on the areas of the electricity supply authorities that used to operate them. These are Manawatu, Palmerston North and Tararua.
The Manawatu rural subtransmission network (ex-Manawatu Oroua EPB) consists of an open 33kV ring feeding four substations around the periphery of Palmerston North and 33kV radial feeders to Sanson and Kimbolton via Feilding. The Feilding substation supplies all Feilding’s load. The 33kV circuits are predominantly overhead construction on concrete poles.
Outlying suburbs and rural areas close to Palmerston North are supplied from the Kelvin Grove, Milson, Kairanga and Turitea substations. These substations are located on the periphery of Palmerston North. All of these substations are supplied by two 33kV circuits from either Linton GXP or Bunnythorpe GXP. Turitea Substation has neutral earthing resistors to limit fault levels.
The Palmerston North urban (ex-Palmerston North MED) subtransmission network comprises three 33/11kV zone substations. Keith Street substation, at the north-eastern periphery of the urban area of Palmerston North, is supplied by two 33kV circuits from Bunnythorpe and an interconnection to Kelvin Grove substation. Pascal Street substation, at the western end of the City, takes supply via 33kV circuits from Bunnythorpe and Linton. Two circuits from Keith Street and a single circuit from Pascal Street supply Main Street substation. All 33kV subtransmission circuits are underground in the city area. 33kV circuits outside this area are of overhead construction on concrete poles.
The Tararua network, formerly operated by the Tararua Electric Power Board, consists of four zone substations supplied from Mangamaire GXP. It has two 33kV circuits feeding Mangamutu substation, and a 33kV ring feeding zone substations at Pongaroa, Alfredtown and Eketahuna. Auto transformers exist at these zone substations, which will be converted to standard Yy0 when the opportunity arises.

Return to Index54 ASSET MANAGEMENT PLAN ELECTRICITY NETWORKS FY2010 – FY2019
Taranaki Network3.3.2.
The Taranaki area comprises three areas, based on the areas of the electricity supply authorities that used to operate them. These are New Plymouth, Taranaki and Egmont.
The New Plymouth subtransmission network consists of two 33kV cables supplying City Substation from Carrington GXP, two 33kV lines from Carrington GXP and one 33kV line from Huirangi GXP supplying Bell Block Substation, two 33kV cables owned by Powerco linking New Plymouth Power Station (NPPS) and Moturoa GXP, and two 33kV lines from Huirangi GXP to Mamaku Rd Substation.
The Taranaki subtransmission network is an interconnected network supplying 12 zone substations from Huirangi GXP and Stratford GXP. The distribution network around Inglewood operates at 6.6kV – conversion may take place to 11kV or to 22kV.
The Egmont subtransmission network supplies the south Taranaki area and consists of Cambria Substation supplied via two oil-filled 33kV cables, and four zone substations supplied via two 33kV line closed rings from Hawera GXP. It also supplies three zone substations from Opunake GXP via an interconnected 33kV line network. One of these feeds the Oaonui Shore Station.
Tauranga Network3.3.3.
The Tauranga region covers the western Bay of Plenty area from near Athenree, north of Katikati to Otamarakau, east of Te Puke. Tauranga has significant industrial load and a major port. The Bay of Plenty area has predominantly dairy and orchard load, particularly kiwifruit and avocados.
Tauranga has two areas based on the electricity supply authorities that used to operate them. These are the ex-Tauranga Electricity Limited network supplying Tauranga CBD and the surrounding area, and the former Tauranga EPB network, which supplies the remainder. These areas used to be separately operated due to being supplied by transformers with different vector groups, but the Dy11 transformers have now been replaced with Yy0 units, and integration of the networks is proceeding.
The subtransmission network in the Tauranga region is connected to the grid via Transpower GXPs at Kaitimako, Mt Maunganui and Tauranga, where supply is taken at 33kV and 11kV and Te Matai, at 33kV. It also connects to generation from the Kaimai hydro scheme and generation at a fertiliser manufacturer.
Mt Maunganui GXP supplies Matapihi, Papamoa and Triton substations at 33kV by double circuit lines and cables. A harbour bridge cable links Triton with Tauranga City substation at 33kV. Another zone substation is under construction at Omanu.
Tauranga GXP supplies the substations at Waihi Rd, City, Otumoetai and Matua, Omokoroa, Aongatete, Katikati and Kauri Point by a network of lines and cables at 33kV. Trustpower’s Kaimai generation feeds into the 33kV network at Greerton
switching station. At 11kV, the GXP supplies a large suburban and surrounding rural area including Greerton, Pyes Pa and Bethlehem out to the Kaimai Range.
Kaitimako GXP supplies the substation at Welcome Bay at 33kV. It is capable of supplying Atuaroa substation and interconnecting with Tauranga GXP.
Te Matai GXP supplies Te Puke, Atuaroa and Pongakawa substations. A 33kV line interconnects Welcome Bay and Te Puke substations.
Valley Network3.3.4.
The Valley region covers the eastern area of the Waikato as far south as Kinleith, plus Waihi and the Coromandel Peninsula. Several small towns have some industrial load, but the rural area is predominantly dairy farming load.
The region has five grid exit points supplying Powerco’s network at 66, 33 and 11kV.
Kopu GXP supplies six substations on the Coromandel Peninsula and the Hauraki Plains at 66kV with a mixture of ring and radial feeds.
From Waikino GXP, 33kV lines run to Waihi, Whangamata, Waihi Beach and Paeroa also in a mixture of ring and radial feeds.
Waihou GXP supplies the Piako area. A 33kV meshed network supplies Morrinsville, Waitoa, Farmer Rd, Piako and Walton Substations, although Walton and Morrinsville are operated in radial configuration. Tahuna is a supplied via a radial spur from Waihou GXP. Mikkelsen Rd, adjacent to Waihou GXP, is supplied by twin 33kV connections.
Hinuera GXP supplies the area around Matamata, Tirau and Putaruru. The network consists of single radial feeds to Tower Rd, Browne St and Waharoa, and Putaruru via Tirau. This network can be partially backed up via a 33kV line between Walton and Browne St.
Kinleith GXP supplies at 33kV and 11kV. The 33kV network supplies two substations at Tokoroa, Maraetai Rd and Baird Rd, and the two substations associated with the water pumping stations for the Kinleith mill at Midway and Lakeside.
Supply at 11kV is taken from Kinleith GXP for the Kinleith mill site. A co-generation plant is connected to the Kinleith GXP.
Wairarapa Network3.3.5.
The Wairarapa region covers the Wairarapa area from south of Eketahuna to Cape Palliser. Masterton has significant industrial load. The Wairarapa area has predominantly dairy farming load, although there are also many orchards and vineyards.
The network is supplied from Masterton GXP and Greytown GXP.

Return to Index 55ASSET MANAGEMENT PLAN ELECTRICITY NETWORKS FY2010 – FY2019
Masterton GXP supplies Akura and Te Ore Ore Substations in a ring. A single line eastwards from Te Ore Ore supplies Awatoitoi and Tinui Substations. It supplies Norfolk and Chapel Substations on a ring, which is part line and part cable. It also supplies Clareville Substation via two lines and Gladstone Substation via a single line.
Greytown GXP supplies an interconnected line network which supplies Featherston and Martinborough Substations by two lines each, and Kempton, Hau Nui and Tuhitarata Substations by one line each.
Wanganui Network 3.3.6.
The Wanganui region covers the area from Waiouru in the north to Bulls in the south, and includes the Rangitikei and Wanganui areas. The Wanganui network consists of four areas, Wanganui, Marton, Taihape and Raetihi. Wanganui and Marton have significant industrial load. The rural area has a predominantly mixed farming load.
The Wanganui area is supplied from two Transpower GXPs at opposite sides of the city, Wanganui GXP and Brunswick GXP. A 33kV line runs between these, passing through substations at Peat St, Castlecliff, Beach Rd and Taupo Quay on the way. Hatricks Wharf Substation is connected by 33kV line to Wanganui GXP and by 33kV cable and line to Peat St. A radial line connects Peat St to Kai Iwi Substation, and another connects Brunswick GXP to Roberts Ave Substation. A radial line connects Wanganui GXP to Wanganui East Substation, and two short radial lines connect Wanganui GXP to the adjacent Blink Bonnie Substation.
The Marton area is supplied from Marton GXP. One line connects Marton GXP to Bulls Substation. Another line connects Marton GXP to Arahina and Rata Substations, and a short cable connects Marton GXP to the adjacent Pukepapa Substation.
The Taihape area is supplied from Mataroa GXP. It is connected to Taihape Substation by three lines, two of which are in parallel, to form two circuits, and it is connected to Waiouru Substation by a single line.
The Raetihi area is supplied from Ohakune GXP. There is a small, embedded hydro generator near Ohakune.
network Assets by Prevailing Customer Type 3.4.
Industrial and Commercial (F1)3.4.1.
The network configuration for large industrial customers (F1 in Tables 4.2 and 7.3) is commensurate with the nature and capacity of the customer’s load. Typically, for customers with a demand above 3MVA, dual 11kV feeders are available, providing a no-break supply for maintenance, or backup in the event of a single fault. Automated or remote control of 11kV switching is provided for some major customers. The cable and conductor sizes reflect the load size. In general, newer areas have underground reticulation, while older areas are overhead.
Due to the higher load currents, there tends to be limited load transfer capacity through the 400V networks. Typically radial 400V feeders from the transformer to the consumer are provided. In some industrial subdivisions 400V interconnection between feeders is provided using either 240mm2 or 185mm2 aluminium cable, but load transfer is limited.
Kinleith Mill Site3.4.2.
There is a significant network owned and operated by Powerco supplying 33kV subtransmission and 11kV distribution assets located at the Carter Holt Harvey Pulp Paper Mill at Kinleith, near Tokoroa. The network is highly interconnected, beginning at the cable terminations of the Transpower switchgear at the Kinleith GXP, and ending at the low-voltage terminals of the supply transformers. The system is mainly underground, comprising 29 11kV feeders, and including one 33kV circuit that supplies Midway and Lakeside substations.
There are 230 indoor 11kV switches and circuit-breakers grouped into 32 switchboards that range in size from four to 24 panels, 64km of cable circuits comprising of 33/11kV, 24.6km of overhead line that comprising of 33/11kV, and 136 transformers that provide a total of 195 MVA of distribution capacity converting 11kV to 3.3kV, 575V, 415V, or 440V.
Te Rerehau Windfarm Site3.4.3.
An underground cable reticulation system links wind turbines in the Manawatu area and connects them to the Tararua 3 transmission GIP. This comprises 28km of 33kV underground cable, presently 65 33kV/400V distribution transformers, an optical fibre network and a 33kV switching station.
Large Customers3.4.4.
Customers with an installed capacity of greater than 1.5MVA (owned by Powerco and excluding Kinleith) are characterised as follows:
Region Number of Large Customers Total Powerco owned installed capacity
Eastern Region 41 customers Over 128 MVA
Western Region 51 customers Over 187 MVA
The large customers and their impacts on network operations are characterised by industry sector below. Generally, the type of asset maintenance applied does not depend on whether the assets are dedicated to the customer or not, and the maintenance regimes applicable are described in the Asset Life cycle section. However, the available windows for maintenance are dictated by the special needs of each customer.

Return to Index56 ASSET MANAGEMENT PLAN ELECTRICITY NETWORKS FY2010 – FY2019
Industrial Customer Installed Capacity by SectorIn
stal
led
Cap
acity
(MV
A)
0
30
20
10
40
50
60
70
80
100
90
Dairy TimberProcessing
FoodProcessing
Ports Manufacturing Chemicals Government
Western Eastern
Figure 3.13: Installed Transformer Capacity by Large Customer Sector.
Notes:
1. Timber processing sector includes sawmills and wood processing plants. It excludes the Kinleith Pulp and Paper Mill site.
2. The Food Processing sector includes meat and chicken industries, flour industries, major cool stores, major bakeries and breweries.
3. The Manufacturing sector includes vehicle assembly, plastic pipeline, carpets and electrical cable industries.
4. The Chemical sector includes oil and gas process industries.
5. The Government sector includes the NZ Defence Force Bases, University Campus and Research facilities.
6. Some customers own their own transformer capacity.
The size of these customers puts them on feeders with a Powerco security class of F1 or F2, which requires a security of supply of at least AA (restoration time of 45 minutes).
Dairy Sector3.4.5.
The dairy industry electricity peak demands occur in spring. The industry is reliant on a reliable electricity supply, so shutdowns for maintenance or network upgrade activities have to be planned for the dairy dry season, especially in South Waikato and South Taranaki.
At an individual farm level, operations are intensifying and amalgamating. There is greater use of irrigation and new technologies. The overall impact is that the load is increasing and the operations require higher reliability of supply and better quality of supply than was previously the case. This is consuming existing spare capacity, creating a greater onus on effective network planning and operations.
Eastern customers > 1.5MVA installed capacity Western customers > 1.5MVA installed capacity
Fonterra – Morrinsville Fonterra – Mainland Products
Fonterra – Tirau Fonterra - Pahiatua
Fonterra – Waitoa Fonterra - Longburn
Open Country Cheese Silver Fern Farms
Tatua Dairy
Timber Processing Sector3.4.6.
Timber processing facilities may be located in remote areas where there is low network security. This means that outage planning may involve extensive customer consultation and that voltage fluctuations may occur.
Eastern customers > 1.5MVA installed capacity Western customers > 1.5MVA installed capacity
CHH - Kopu Kiwi Lumber - Sawmill
Kiwi Lumber Juken Nissho
Pacific Pine
Pukepine Sawmills
Thames Timber
Fletcher Challenge Forests
Claymark Katikati

Return to Index 57ASSET MANAGEMENT PLAN ELECTRICITY NETWORKS FY2010 – FY2019
Food Processing Sector3.4.7.
Outage requirements for customers in this sector can usually be co-ordinated if sufficient notice is given. Unplanned outages can lead to spoiled products, causing expensive wastage and staff disruption. Coolstores are significant growth packages and can have heavy, peaky loads. Careful planning is needed to ensure adequate backfeed capability is allowed for these loads. Backup capacities to the full site capacities are becoming more difficult to provide due to the size of the loads.
Eastern customers > 1.5MVA installed capacity Western customers > 1.5MVA installed capacity
Apata Coolstores Ernest Adams
Affco Rangiuru Canterbury Meat Packers
Baypac Riverlands Manawatu
Champion Flour Foodstuffs
Eastpac Coolstores Foodstuffs Coolstores
Greenlea Meats DB Breweries
Huka Pak Totara Tegal Foods
Inghams Enterprises Mt Maunganui Goodman Fielder Meats
Inghams Enterprises Waitoa International Malting Company
Cold Storage Tauranga Yarrows Bakery
Silverfern Farms Affco NZ Feilding
Sanford Affco NZ Wanganui
Trevalyan Coolstore Riverlands Eltham
Wallace Corporation Aotearoa Coolstores
Seeka ANZCO Foods
Cold Storage International
Transportation Sector3.4.8.
Port operations are based around shipping movements and the quick turnaround of ships is important. When ships are in port, the facilities make heavy demands on the electricity distribution network and at these times a highly reliable supply is needed to ensure a fast turnaround. A secure supply (N-1) is therefore needed by ports. Continued drive for efficiency and increasing demands in this sector has been squeezing the windows available for maintenance. Both of the main ports supplied by Powerco are on growth paths. The port in Tauranga is highly competitive with a large expansion planned. Improvements in the capacity of the rail link between New Plymouth and Marton have occurred but the closure of the rail link from Stratford to Taumarunui could constrain Westgate’s future growth path.
Eastern customers > 1.5MVA installed capacity Western customers > 1.5MVA installed capacity
Port of Tauranga Westgate Transport
Manufacturing Sector3.4.9.
The manufacturing sector is dependent on the prevailing general economic conditions and the economic conditions within the industry’s particular niche. The requirements on the electricity distribution network can therefore vary accordingly.
Eastern customers > 1.5MVA installed capacity Western customers > 1.5MVA installed capacity
A & G Price MCK Metals Pacific
Fulton Hogan Ballance Agri-Nutrients
Thames Toyota Olex Cables NZ
Katikati Quarries 2001 Iplex Pipelines NZ
Waihi Gold Taranaki By Products
Waters & Farr
Cavalier Spinners
Van Globe
Chemicals Sector3.4.10.
The chemical sector is heavily reliant on a reliable supply of electricity with few voltage disturbances. Some of the machines in this industry can create large voltage dips on the network when they start. This needs ongoing co-ordination with the customers.
Eastern customers > 1.5MVA installed capacity Western customers > 1.5MVA installed capacity
Ballance (Mt Maunganui) Shell Exploration NZ - Pohokura
Evonik Methanex NZ – Waitara Valley
Ballance (Morrinsville) Shell Todd Oil Services - Oaonui
Methanex NZ – Waitara Pumps
Origin Energy – Waihapa TAG

Return to Index58 ASSET MANAGEMENT PLAN ELECTRICITY NETWORKS FY2010 – FY2019
Government Sector & Research Facilities3.4.11.
Some of the Government sector organisations have on-site generation and this needs to be co-ordinated with Powerco’s network operations.
Eastern customers > 1.5MVA installed capacity Western customers > 1.5MVA installed capacity
Chapel St Sewage Plant AgResearch
Tauranga Hospital Dow AgroSciences NZ
Bay of Plenty Polytech Taranaki Healthcare
Wanganui DC - Waste Water Treatment
NZDF – Army Training Waiouru
TEI Works
Fonterra Research Centre
NZDF – Linton Military Camp
MidCentral Health
NZDF – RNZAF Base Ohakea
Massey University – Turitea Campus
Central Business District Networks 3.4.12.
The networks in the Tauranga, Palmerston North, New Plymouth, Wanganui, Tokoroa and Masterton central business districts (CBDs) consist of highly interconnectable 11kV radial feeders. Switching points are provided at most 11kV/400V transformer locations. There is a high level of interconnection between adjacent 11kV feeders (F2 in Tables 4.2 and 7.3). The reticulation in the CBDs is 100% underground, with cable sizes ranging from 70mm2 to 300mm2, aluminium or copper. In some areas there are express feeder inter-ties of up to 630mm2. In key locations 11kV switch automation is being progressively introduced, and provision for future automation is being provided at less critical locations. This configuration allows quick restoration of supply in fault situations.
The 400V network consists of radial circuits with a high degree of interconnection. The interconnection between distribution substations is made at junction boxes located along the 400V circuits. The cable sizes are typically large (up to 0.5 sq inch copper). The 400V network is 100% underground in the CBDs. Load can be transferred across the 400V network in some locations.
The main streets of most towns and suburban centres in Powerco’s network have a typical urban network configuration. In these centres the business district is largely or completely underground.
Large retail business customers include 88 The Square in Palmerston North, Bayfair in Mt Maunganui and Centre City Shopping Centre in New Plymouth.
Residential Networks 3.4.13.
Both 11kV and 400V residential distribution networks (F3 in Tables 4.1 and 7.3) are interconnectable radial networks. The level of interconnectability is moderate, commensurate with the reliability requirements. In general, newer areas have underground reticulation while older areas are overhead. In some urban areas, the distance and/or load between switching points is such that Powerco’s planning criteria are not fully met.
Low-voltage networks in residential areas tend to be extensive, with transformer capacities of around 200kVA typically supplying 50 or more ICPs. Load can be transferred across the 400V network in some locations either through link boxes or through temporary jumpers.
Rural Networks (F4)3.4.14.
The rural network consists of 11kV lines with isolators installed every 1-2km in some regions (F4 in Tables 4.1 and 7.3). This enables flexibility of switching, but presents a maintenance and reliability liability. Generally, 11kV spur lines may be fused with dropout fuses. There is some interconnection between feeders to allow backfeeding in maintenance and fault situations. Feeders are overhead lines on wooden or concrete poles.
Line reclosers and sectionalisers are used in rural areas. Typically reclosers are placed at the transition between urban and rural loads and between rural and remote rural loads. Sectionalisers are used on some spur lines. Many reclosers are SCADA-controlled.
Low-voltage networks may be short supplying up to around five ICPs and transformer capacities of up to around 100kVA are common.
Remote Rural Networks (F5)3.4.15.
Remote rural feeders are generally radial (F5 in Tables 4.2 and 7.3), with limited or no interconnection between adjacent feeders. In some areas, 11kV isolators and 11kV dropout fuses are used to provide discrimination and sectionalising under fault conditions. Some remote areas are supplied by two-phase lines, and a small number are supplied by single-wire earth return (SWER).
Due to the scattered nature of the population there are no significant rural 400V networks. Typically, the 400V network extends 100-200m under the main distribution voltage lines from the distribution transformer to supply nearby loads. Distribution transformers would typically have a capacity of 15 or 30kVA.
Many of the remote rural coastal communities have been undergoing subdivision, leading to stress on the electricity networks that supply them, particularly during holiday periods. Furthermore, there is a tendency that the consumers moving to these communities are used to urban supply reliability and have consequent high expectations.
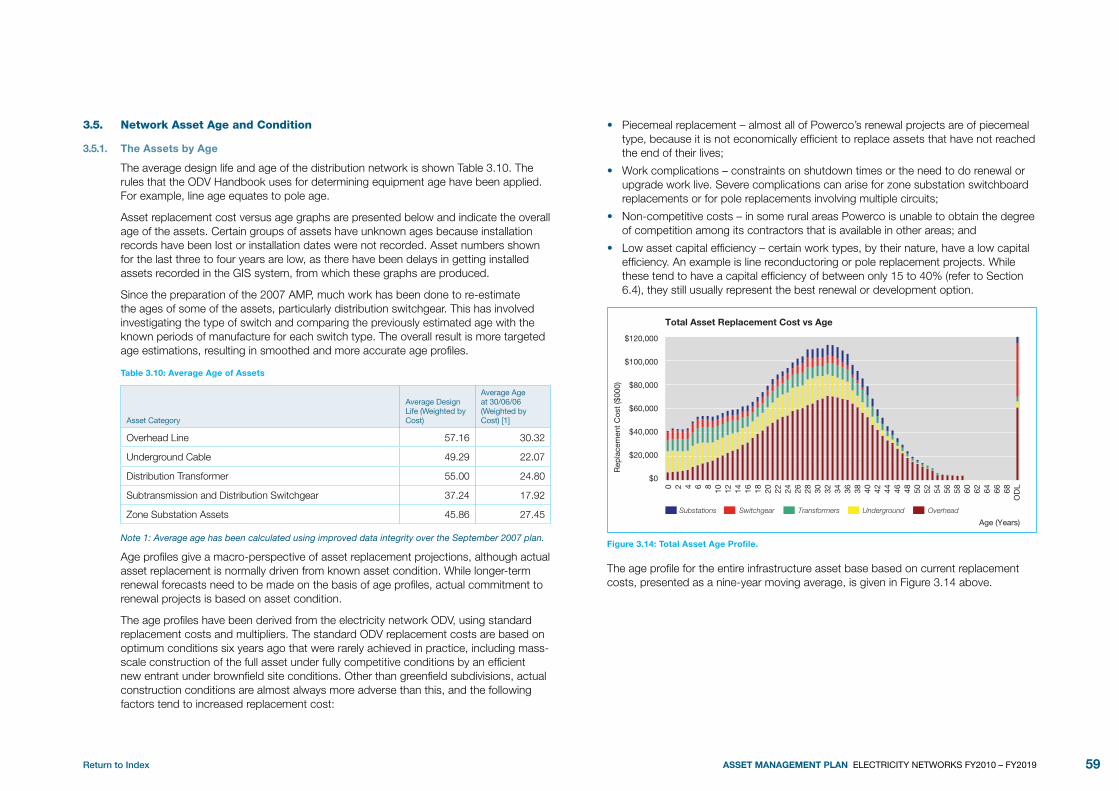
Return to Index 59ASSET MANAGEMENT PLAN ELECTRICITY NETWORKS FY2010 – FY2019
network Asset Age and Condition3.5.
The Assets by Age3.5.1.
The average design life and age of the distribution network is shown Table 3.10. The rules that the ODV Handbook uses for determining equipment age have been applied. For example, line age equates to pole age.
Asset replacement cost versus age graphs are presented below and indicate the overall age of the assets. Certain groups of assets have unknown ages because installation records have been lost or installation dates were not recorded. Asset numbers shown for the last three to four years are low, as there have been delays in getting installed assets recorded in the GIS system, from which these graphs are produced.
Since the preparation of the 2007 AMP, much work has been done to re-estimate the ages of some of the assets, particularly distribution switchgear. This has involved investigating the type of switch and comparing the previously estimated age with the known periods of manufacture for each switch type. The overall result is more targeted age estimations, resulting in smoothed and more accurate age profiles.
Table 3.10: Average Age of Assets
Asset Category
Average Design Life (Weighted by Cost)
Average Age at 30/06/06 (Weighted by Cost) [1]
Overhead Line 57.16 30.32
Underground Cable 49.29 22.07
Distribution Transformer 55.00 24.80
Subtransmission and Distribution Switchgear 37.24 17.92
Zone Substation Assets 45.86 27.45
Note 1: Average age has been calculated using improved data integrity over the September 2007 plan.
Age profiles give a macro-perspective of asset replacement projections, although actual asset replacement is normally driven from known asset condition. While longer-term renewal forecasts need to be made on the basis of age profiles, actual commitment to renewal projects is based on asset condition.
The age profiles have been derived from the electricity network ODV, using standard replacement costs and multipliers. The standard ODV replacement costs are based on optimum conditions six years ago that were rarely achieved in practice, including mass-scale construction of the full asset under fully competitive conditions by an efficient new entrant under brownfield site conditions. Other than greenfield subdivisions, actual construction conditions are almost always more adverse than this, and the following factors tend to increased replacement cost:
Piecemeal replacement – almost all of Powerco’s renewal projects are of piecemeal •type, because it is not economically efficient to replace assets that have not reached the end of their lives;
Work complications – constraints on shutdown times or the need to do renewal or •upgrade work live. Severe complications can arise for zone substation switchboard replacements or for pole replacements involving multiple circuits;
Non-competitive costs – in some rural areas Powerco is unable to obtain the degree •of competition among its contractors that is available in other areas; and
Low asset capital efficiency – certain work types, by their nature, have a low capital •efficiency. An example is line reconductoring or pole replacement projects. While these tend to have a capital efficiency of between only 15 to 40% (refer to Section 6.4), they still usually represent the best renewal or development option.
Total Asset Replacement Cost vs Age
Rep
lace
men
t C
ost
($00
0)
Age (Years)
$0
$40,000
$20,000
$60,000
$80,000
$100,000
$120,000
0 2 4 6 8 10
12
14
16
18
20
22
24
26
28
30
32
34
36
38
40
42
44
46
48
50
52
54
56
58
60
62
64
66
68
OD
L
Switchgear Transformers Underground Overhead Substations
Figure 3.14: Total Asset Age Profile.
The age profile for the entire infrastructure asset base based on current replacement costs, presented as a nine-year moving average, is given in Figure 3.14 above.

Return to Index60 ASSET MANAGEMENT PLAN ELECTRICITY NETWORKS FY2010 – FY2019
Current experience has shown that actual replacement costs are significantly higher than the ODV replacement costs. Actual current replacement costs assumed are as follows, but even these do not represent the present true costs of replacement:
Overhead lines: 2.9 times ODV unit rate
Underground cables: 1.9 times ODV unit rate
Distribution transformers: 1.6 times ODV unit rate
Distribution switchgear: 1.6 times ODV unit rate
Zone substation equipment: 1.7 times ODV unit rate
The bars on the graph in Figure 3.14 and the following graphs show the current replacement cost calculated on these figures.
overhead Lines3.6.
Overhead Lines Age Profile3.6.1.
In Figures 3.15 to 3.19, the bar graphs show the unsmoothed asset age profiles and the green line is a nine-year moving average. How the unknown age assets have been assigned can be clearly seen. A single bar at the right-hand end of the graphs represents assets over their standard design life. It should be noted that equipment with different design lives are included in these graphs. Graphs showing replacement cost against year of replacement are included in Sections 6.6 to 6.11.
Overhead Line Replacement Cost vs Age
Rep
lace
men
t C
ost
($00
0)
RC - Valued at Current Cost of Renewal
9 Year Average RC - Valued at Current Cost of Renewal Age (Years)
0 2 4 6 8 10 12 14 16 18 20 22 24 26 28 30 32 34 36 38 40 42 44 46 48 50 52 54 56 58
OD
L
$0
$15,000
$30,000
$45,000
$60,000
$75,000
$90,000
Figure 3.15: Overhead Line Age Profile.
Figure 3.15 shows the age profile of overhead line assets based on the current replacement cost. It includes overhead lines and their replacement cost multipliers, overhead service connections and associated traffic management. There is a large hump of replacement value among line assets with an age of between 15 and 35 years. Lines have a standard useful life of between 45 and 60 years and the graph indicates that a wave of line renewal activity is coming over the next 20 years. This is in common with many other line companies in New Zealand, Australia and the UK.
Overhead Line Condition3.6.2.
Condition monitoring, shows that most lines are in the condition expected for their age, although some in harsh coastal areas have deteriorated more quickly than expected. Steel core corrosion in ACSR conductors is a problem in coastal areas, and some older copper conductors have become work-hardened by wind movement and load cycling.
In Tauranga, there are some instances of concrete poles with top load strengths not clearly established. These poles are allowed to remain in service unless additional load is required on the pole head due to heavier conductors. In the Hawera area, some concrete poles were manufactured with salt contaminated sea sand. Many of these have spalling exposing the reinforcing steel. These are monitored to ensure they have sufficient strength for the loads they are carrying.
In some places, cross-arms are too short for the spans of conductors they support resulting in conductor clashing. These are rectified when they are identified as problems.
Some 33kV insulators (batches from the 80s and 90s) appear to have a specific failure mode where the neck breaks off the top shed. Multiple-piece 33kV pin insulators mounted on steel cross-arms with heavy conductors appear to fail by splitting or breaking the cement between the shells. These insulators are replaced when this failure mode arises.
A tendency to fail has been noted on kidney strain insulators, although wholesale replacement is not considered justified. These insulators tend to be located on older wooden poles and programmed pole replacement will eventually phase them out. Polymer strain insulators are used on some replacement structures.
Cross-arm and insulator replacement is being undertaken to maintain the condition at the overall line asset.

Return to Index 61ASSET MANAGEMENT PLAN ELECTRICITY NETWORKS FY2010 – FY2019
Underground Cables3.7.
Underground Cable Age3.7.1.
Underground Cable Replacement Cost vs Age
Rep
lace
men
t C
ost
($00
0)
RC - Valued at Current Cost of Renewal
9 Year Average RC - Valued at Current Cost of Renewal Age (Years)
$0
$5,000
$10,000
$15,000
$20,000
$25,000
$30,000
$35,0001 5 10 15 20 25 30 35 40 45 50 55 60 65
OD
L
Figure 3.16: Underground Cable Age Profile.
Figure 3.16 shows the age profile for underground cable assets based on current replacement cost. It includes underground cables, underground service connections and associated traffic management. Prior to 35 years ago, little cable had been installed. The age profiles show that little cable replacement will be required as cables have a standard life of 40 to 70 years. However, an increasing number of early XLPE insulated cables are being found to need replacement before their standard lives because of water treeing in the insulation, screen corrosion, poorly adhering semicon layers or other manufacturing defects.
Subtransmission Cable Condition3.7.2.
Subtransmission cables and distribution cables are generally in good condition, commensurate with their age. The majority of failures are caused by third-party damage – by contractors excavating in road reserves. Some failures have been attributed to joint failure, poor manufacture of early XLPE cables and poor installation.
The 33kV oil-filled cables in Palmerston North are around 40 years old. Design shortcomings in joints of the type used on these cables have been identified elsewhere, and an investigation is ongoing to determine whether the cables need derating to protect the joints. They may need to be replaced prematurely if the cost of fault repairs becomes uneconomic or if the derating required is too severe.
Sections of 33kV cables supplying the Tauranga CBD have been identified as having screens that could have overheated at some stage during their lives. Sections of this cable have been replaced, but with the increasing load a project is being scoped to move Waihi Rd on to its own 33kV feeder transformers.
For other 33kV cables, no replacement due to age or condition is expected during the period covered by this plan.
Distribution Cable Condition3.7.3.
Distribution cables are generally in good condition, commensurate with their age. Underground construction commenced in the 1950s. The early cables were paper-insulated, lead-covered (PILC) type, which have a life expectancy of 70 years provided they are not moved. Some early 11kV PILC cables in the New Plymouth area have brittle lead sheaths, prone to cracking. These cannot be moved, and where cables are grouped in a common trench, jointing is difficult.
Other cables that may require early replacement are aluminium XLPE cables installed in the late 1960s and 1970s. These were first-generation XLPE cables, manufactured using tape semi-conducting layers and water-curing. This, coupled with a lack of knowledge and subsequent poor handling of cables during installation, has resulted in some cable failures.
Early 11kV XLPE cables, installed prior to 1975 in the Tauranga area, especially smaller 25mm cables, have a tendency to fail. A replacement programme is proceeding for circuit segments where the reliability impact of a failure is expected to be significant. The problem appears to be poor installation methods and exposure to fault levels above their rating, as well as poor cable manufacturing.
In the CBDs of main centres such as Tauranga and Palmerston North, the sustained levels of load growth have meant that the distribution cables do not now have adequate capacity to provide a full N-1 security level. While feeder inte-tie projects have been completed in response, the situation continues to be monitored. The Tauranga CBD distribution network is being upgraded with a 300mm Al cable ring around the CBD.
In some cases, non-compressed sleeves have been used for jointing compressed 11kV conductors, leading to the possibility of joints not being correctly or adequately compressed. In other cases, joints using early heat shrink methods (“tin can” joints) are starting to fail. Instances of this issue will be rectified when they fail.
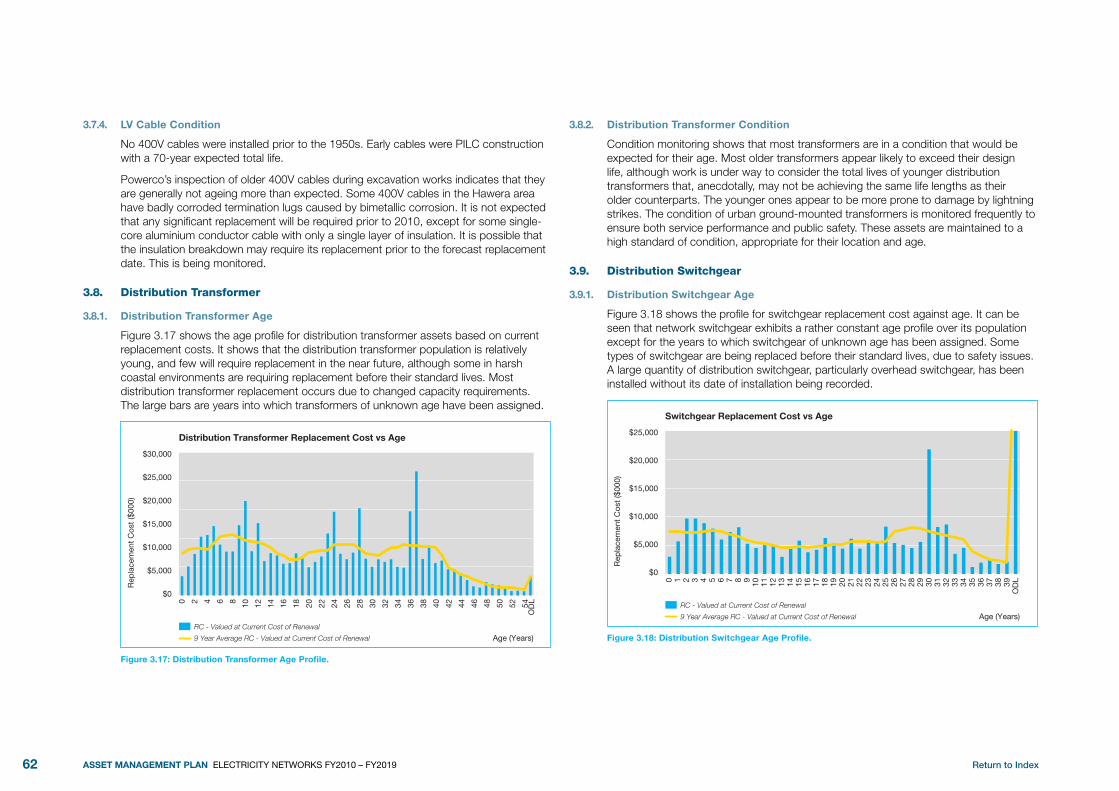
Return to Index62 ASSET MANAGEMENT PLAN ELECTRICITY NETWORKS FY2010 – FY2019
LV Cable Condition3.7.4.
No 400V cables were installed prior to the 1950s. Early cables were PILC construction with a 70-year expected total life.
Powerco’s inspection of older 400V cables during excavation works indicates that they are generally not ageing more than expected. Some 400V cables in the Hawera area have badly corroded termination lugs caused by bimetallic corrosion. It is not expected that any significant replacement will be required prior to 2010, except for some single-core aluminium conductor cable with only a single layer of insulation. It is possible that the insulation breakdown may require its replacement prior to the forecast replacement date. This is being monitored.
distribution Transformer 3.8.
Distribution Transformer Age3.8.1.
Figure 3.17 shows the age profile for distribution transformer assets based on current replacement costs. It shows that the distribution transformer population is relatively young, and few will require replacement in the near future, although some in harsh coastal environments are requiring replacement before their standard lives. Most distribution transformer replacement occurs due to changed capacity requirements. The large bars are years into which transformers of unknown age have been assigned.
Distribution Transformer Replacement Cost vs Age
Rep
lace
men
t C
ost
($00
0)
RC - Valued at Current Cost of Renewal
9 Year Average RC - Valued at Current Cost of Renewal Age (Years)
$0
$5,000
$10,000
$15,000
$20,000
$25,000
$30,000
0 2 4 6 8 10 12 14 16 18 20 22 24 26 28 30 32 34 36 38 40 42 44 46 48 50 52 54O
DL
Figure 3.17: Distribution Transformer Age Profile.
Distribution Transformer Condition3.8.2.
Condition monitoring shows that most transformers are in a condition that would be expected for their age. Most older transformers appear likely to exceed their design life, although work is under way to consider the total lives of younger distribution transformers that, anecdotally, may not be achieving the same life lengths as their older counterparts. The younger ones appear to be more prone to damage by lightning strikes. The condition of urban ground-mounted transformers is monitored frequently to ensure both service performance and public safety. These assets are maintained to a high standard of condition, appropriate for their location and age.
distribution Switchgear3.9.
Distribution Switchgear Age3.9.1.
Figure 3.18 shows the profile for switchgear replacement cost against age. It can be seen that network switchgear exhibits a rather constant age profile over its population except for the years to which switchgear of unknown age has been assigned. Some types of switchgear are being replaced before their standard lives, due to safety issues. A large quantity of distribution switchgear, particularly overhead switchgear, has been installed without its date of installation being recorded.
Switchgear Replacement Cost vs Age
Rep
lace
men
t C
ost
($00
0)
RC - Valued at Current Cost of Renewal
9 Year Average RC - Valued at Current Cost of Renewal Age (Years)
$0
$5,000
$10,000
$15,000
$20,000
$25,000
0 1 2 3 4 5 6 7 8 9 10 11 12 13 14 15 16 17 18 19 20 21 22 23 24 25 26 27 28 29 30 31 32 33 34 35 36 37 38 39O
DL
Figure 3.18: Distribution Switchgear Age Profile.

Return to Index 63ASSET MANAGEMENT PLAN ELECTRICITY NETWORKS FY2010 – FY2019
Distribution Switchgear Condition3.9.2.
Overhead 33kV and 11kV switchgear is inspected in conjunction with line or transformer inspections. These assets are in the condition to be expected for their age and location. Greater maintenance or earlier replacement is undertaken in coastal areas when necessary.
The condition of urban ground-mounted switchgear is monitored frequently to ensure serviceability and public safety. Other than the exceptions noted below, these assets are in good condition, as appropriate for their location and age.
Several failures of one type of oil-filled ring main unit have occurred as a result of apparent poor design, poor assembly or water ingress. Some remedial work has been carried out in accordance with the manufacturer’s instructions. Operating restrictions are in place for this switchgear and a renewal programme has been established in advance of its design life.
Oil-filled plain break-type switches are understood to have been fully replaced for safety reasons. Any remaining such switches that are found will be replaced.
A significant amount of Magnefix resin-insulated switchgear is in service, but the majority is in good condition and is housed in dry, clean environments. Replacement is planned only where the Magnefix current rating is causing operating restrictions or where the units are open points between feeders.
Zone Substations3.10.
Zone Substation Age3.10.1.
Figure 3.19 shows the age profile of zone substation equipment based on current replacement cost. It includes all zone substation equipment and buildings, but excludes land. Note that due to their 45-year life, a large number of 11kV switchboards installed in the 1960s and 1970s will require replacement on an ongoing basis from now on. The large amount of equipment beyond its design life is largely load control and other electronic equipment with a short standard life.
Overhead Line Replacement Cost vs Age
Rep
lace
men
t C
ost
($00
0)
RC - Valued at Current Cost of Renewal
9 Year Average RC - Valued at Current Cost of Renewal Age (Years)
0 2 4 6 8 10 12 14 16 18 20 22 24 26 28 30 32 34 36 38 40 42 44 46 48 50 52 54 56 58
OD
L
$0
$5,000
$10,000
$15,000
$20,000
$25,000
Figure 3.19: Zone Substation Equipment Age Profile.
Zone Substation Condition3.10.2.
Significant condition monitoring is undertaken on zone substation assets and most are in good condition. Older switchboards or individual circuit-breakers have been identified as requiring replacement due to condition, lack of earthing equipment or lack of replacement spare parts. A large number of 11kV switchboards installed in the 1960s and 1970s will be reaching the nominal end of their design life. Progressive replacement, starting with the oldest units or those in worst condition, will be necessary to prevent excessive numbers needing replacement at once.
The English Electric OKW3 33kV minimum oil breakers have a tendency to absorb moisture, resulting in the deterioration of insulation resistance. The GEC JB424 type of 33kV breaker is becoming old. The “dog box” type of circuit-breaker, while fairly new, is prone to let water into its cubicle, resulting in heightened risk of failure.
The original design of the protection equipment in the Wairarapa area means that the protection can become unstable under some fault conditions.
Load control injection plants are becoming aged and, while still serviceable, should be replaced.
New building code requirements mean zone substation buildings have to be built more robustly than they have in the past. The new Building Act requires that Lifelines Utilities construct their buildings with a 2500-year earthquake return period.

Return to Index64 ASSET MANAGEMENT PLAN ELECTRICITY NETWORKS FY2010 – FY2019
PERfoRMAnCE TARgETS And MonIToRIng 4.
Introduction4.1.
This section of the plan outlines the performance levels required from the network assets. It first looks at the consumer-related service requirements, and the confirmation of these requirements through the consumer consultation process. It then looks at the ways in which economic efficiency is assured in the Asset Management process, contractor performance, safety performance, environmental matters and statutory compliance. The targets also take into account the type of assets used across our network (as described in Section 3) and a balance of comparisons with other New Zealand lines companies with the same customer density, ratio of overhead to underground construction, past planning practice, economic factors, recognised international best practice and safety considerations.
This section looks at the processes used to monitor the performance levels, how the monitoring processes help set performance levels, as well as the performance targets themselves.
Key performance drivers were described briefly in Section 2 from a stakeholder introduction perspective. Each aspect of performance is described in detail in this section.
Where targets do not have a date specified, they are intended to apply for the whole period of the AMP. This does not, however, preclude the setting of revised targets in future AMPs.
Performance Target Philosophy4.1.1.
A trade-off exists in the Asset Management process between performance, cost and risk, as shown in Figure 4.1. By minimising the costs of the assets, the asset manager may compromise on asset performance and asset risk; by minimising the asset risk, service performance and cost may be compromised. This section of the Asset Management Plan looks to set Network Performance targets by seeking the best trade-off between levels of Network Risk (Section 10) and cost of providing the service (Section 9).
Performance LevelsLevel of Risk
Cost
Network assets
Figure 4.1: Cost, Performance and Risk Balance.
Levels of Consumer Service (Quality) Performance4.2.
Overview4.2.1.
The target levels of service chosen in this plan are based on a combination of past practice, consultation with customer and consumer groups, economic factors, recognised international best practice, legal obligations and safety considerations.
Powerco achieves a balance between legislative, regulatory, owner requirements and consumer expectations in setting these performance criteria. The levels of service adopted by Powerco for its Asset Management plan are based on the internationally recognised measurements, SAIDI, SAIFI, and CAIDI, and accepted New Zealand lines companies’ best practice.
Consumer Consultation – Price Quality Trade-off4.2.2.
Powerco conducts a Customer Communications Programme as part of its compliance with requirements of the Commerce Act (Electricity Distribution Thresholds Notice 2004). The primary intention of this requirement is to ensure distribution businesses effectively consult with, and take into account, the views of their customers and stakeholders.
Complaints Process4.2.2.1
Through its call centre Powerco keeps a database of all complaints and suggestions registered by its customers. Powerco has commenced mapping these complaints by type and feeding these into the Asset Management process (refer Section 5.2.2).

Return to Index 65ASSET MANAGEMENT PLAN ELECTRICITY NETWORKS FY2010 – FY2019
Results of Consultation to Date4.2.2.2
Generally, meetings held with local authorities and urban business people indicate satisfaction with reliability of supply for urban consumers. In areas experiencing fast growth, recent prolonged outages or in communities that are relatively isolated, significant discussions and exchanges of information tend to take place.
Discussion with manufacturers, dairy farmers or the horticulture industry often draw attention to the significance of the Cost of Non-Supply (CNS) and deliberation on the localities/social services/industries for priority restoration in the event of an outage that might result from a large storm or similarly significant event.
Focus group discussions often provide Powerco’s planning engineers with information useful for the scheduling of projects and initiatives that could improve the performance of particular feeders (possible initiatives are described in Section 8.5).
Aside from the capital development/infrastructure expansion perspective referred to above, a number of shorter-term issues often come up during discussions. These include topics such as voltage instability and outages such as those resulting from trees or animals interfering with overhead lines. Such situations often involve a degree of shared responsibility. In the case of voltage instability, this would be between the owner(s) of heavy plant/equipment and the lines company. In the case of tree interference, it can concern the land/tree-owner and the lines company. Again, the focus group discussions provide a helpful forum for advancing mutual understanding on such topics, as well as information that could be used in the scheduling of maintenance projects.
Overall, the consumer consultation programme can be seen to have resulted in:
A significant widening in understanding by some members of the public of the •structure of the electricity industry following reforms and their implications;
Information on consumer preferences that can be of assistance in scheduling the •programmes for both capital and maintenance works;
Information of assistance in deciding on the detail of individual projects; •
Understanding that, on the whole, communities do not mind having pre-planned •outages if they know the outage is for maintenance or improvement to the network.
Effect of Consultation on Targets4.2.2.3
Powerco reviews the reliability performance targets annually, set out in Tables 4.1 and 4.2 below, taking account feedback from consumers during the consultation process. To date, the only specific issues raised at these consultation meetings have been in relation to certain feeders where performance targets have not been met. Some consumers in dairy farming and horticultural areas have commented on the difficulties that power outages cause if they happen at certain times, but a concrete conclusion has not been reached as to whether the F4 target warrants changing.
Generally, feedback from consumers has been that if the targets were met they would be satisfied. For this reason, Powerco’s focus remains on the worst-performing feeders.
Definition of Consumer Service and Service Performance4.2.2.4
Consumer consultation is a useful method of gauging the mood of the community for acceptable supply reliability, but it needs to be borne in mind that, by itself, consumer consultation does have its drawbacks for objectively monitoring reliability. The mood of the community is a coarse measure of the economic wellbeing that a secure electricity supply provides because, until the power goes off, consumers can forget how much they rely on a secure supply. The mood can be swung by one-off events. Also, the views of some sections of the community often contradict other sections of the community, leading to an unsure direction.
For reasons of objectivity and for the purposes of this plan, we must assume that the consumers’ needs will be satisfied if Powerco meets its Service Performance targets.
Service Performance is defined as:
“Delivery of electricity line function services to meet consumer load requirements within targeted quality limits and within targeted levels of reliability”.
The three key elements of the service performance definition are quality, reliability (which is a subset of quality) and capacity. These are described below.
Supply Quality4.2.3.
There are two types of supply quality issues - continuous and discrete. Continuous supply quality elements include flicker, harmonics and phase balance. Discrete issues include outages, voltage sags and swells, brown-outs and frequency excursions. Powerco’s power quality performance criteria are shown in the Power Quality Characterisation Plan shown below.
Powerco’s voltage regulation targets are in line with statutory requirements, which are that the voltage shall be maintained within ±6% at the consumer’s point of connection. Performance outside the target is usually indicated by low-voltage complaints from consumers. Corrective action is taken as soon as possible after the performance gap is identified.
Presently, there are no statutory requirements in respect of transient fluctuations from the statutory voltage limits.
Increasing use of electronic devices is resulting in a progressive deterioration of waveform quality and it is likely that further measures will need to be introduced and enforced to monitor and control harmonics over the next decade. Harmonics also affect neutral and transformer ratings.

Return to Index66 ASSET MANAGEMENT PLAN ELECTRICITY NETWORKS FY2010 – FY2019
Table 4.1: Reliability performance targets
Continuous Power Quality issues
Issue Characterisation Impact to Customer Target Performance How monitored
Flicker Frequency of less than 35Hz
Visual flicker with lighting
No complaints Customer complaint
Harmonics & Interharmonics
3rd, 5th and 7th harmonics most common on distribution level
Radio Interference, Transformer overheating, motors overheating, induction motors contacts tripping
Total Harmonic Voltage < 5% at Point of Common Coupling
PQ Meters at the Substation 11kV, site monitoring using portable PQ-Box 100
Phase Voltages Unbalance
One or two phases with voltage <95%,
Damages rotating machines, a fuse on one phase continually blows
No complaints Customer complaint
Longer Term Brown Outs
Voltage drop to below 0.9pu > 1min
Burns out motors Voltage within 6% of nominal
Customer Complaint
Longer Term Overvoltages
Greater than 1.1pu > 1min
Light bulbs blowing, 3 phase motor heating
Voltage within 6% of nominal
Customer Complaint
Discrete Power Quality Issues
Issue Characterisation Impact to Customer Target Perfromance How monitored
Outages (> 1min)
Power goes off No power 170 SAIDI
2.56 SAIFI
Customer notification, SCADA alert, logged in Outdef system
Auto Recloses (< 1min, > 2 sec)
Power goes off then comes back on
Reset electronic equipment, clocks,
No complaints Reclose Counters, SCADA notification, PQ Meters at Substations
Short Term Fluctuations, Dips & Sags, Flicker
Lights flicker Visual flicker, clocks running faster
No complaints PQ Meters at Substations, tap change counter
Voltage Spikes Short term <1min voltage
Damages equipment
No damage to equipment
Customer Complaint
Frequency Excursions Short Term < 1 sec
Deviation from 50Hz. May cause protection system maloperation
Frequency Excursions Long Term > 1 sec
Deviation from 50Hz
Clocks Running Faster/Slower
AUFLS operation, System Operator advice
Justification for the Quality Targets4.2.3.1
Some power quality requirements, such as voltage quality and harmonic voltage, are set out in statute. Other requirements stem from the need to maintain adequate customer satisfaction with the delivered electricity. Practical difficulties of monitoring the supply quality imply a reactive response to customer notifications of supply quality issues is needed. The target is no complaints or as few as possible. Changes in the types of appliances in the last 20 years are having an impact on customers’ tolerance to power quality issues (such as auto-recloses) and on the production of harmonic pollution. Smart metering projects may offer the potential to be more proactive towards power quality issues and Powerco is closely monitoring their adoption.

Return to Index 67ASSET MANAGEMENT PLAN ELECTRICITY NETWORKS FY2010 – FY2019
Reliability Targets4.2.4.
The reliability service component is a function of six phases:
The failure of network assets or planned shutdowns that render the assets 1. unavailable for normal service. This is dependent on asset design and type and the condition of the asset, where this affects the likelihood of failure;
The susceptibility of the network to loss of asset service. That is, does a faulted 2. asset cause an interruption to the supply to customers? This is dependent on network architecture, one of the most important mechanisms being built-in equipment redundancy, referred to as the security level, which is, a measure of the resilience of the network to operational changes. Powerco has developed security criteria for the subtransmission and distribution network (which continue to be consulted on with consumers) and these are key inputs into the planning process. Network security results from a combination of adequacy of capacity and configuration. A network with good security has a diversity of supply options that allow supply to be maintained or restored quickly following a fault.
The security criteria are discussed in Section 7 of this plan;3.
The widespreadness of an interruption of supply. That is, if a fault does cause an 4. interruption of supply to customers, is its impact widespread or localised in terms of numbers of customers? This is influenced by numbers of customers by feeder or the presence of reclosers;
Identification of the cause and location of the fault. Often this is done at the same 5. time as restoring customers, and can be helped by line fault indicators or through SCADA;
Restoration of supply to as many customers as possible in timely fashion. 6. Sectionalisability helps this restoration phase. Network security also affects restorability. There is a kind of inverse relationship between the levels of security inherent in a network and CAIDI; and
Finally, the faulted equipment is repaired in a quality and timely fashion.7.
Each of these phases requires a different focus from different parts of a lines business, but some elements of the network management process, such as the defect management process, impact on reliability from every angle. The capital works and maintenance strategy processes require attention from all of the focus areas. Powerco uses all endeavours, as a reasonable and prudent network operator, to provide continuous service within the limitations of the network design.
Powerco’s reliability targets vary according to the feedback of needs and preferences from the different types of consumers and what is practical to achieve within the constraints of economic and technical feasibility. The reliability targets are quantified by indices of interruption duration (SAIDI) and frequency of interruption (SAIFI). Fault response and repair times affect the duration of interruptions. The reliability targets assume normal weather conditions.
Powerco sets reliability targets at a network and feeder level based on five different types of consumer. Of these, four types concern small to medium-sized consumers:
Commercial/CBD;•
Urban residential;•
Rural; and•
Remote rural.•
The fifth category embraces large industrial users of electricity. For these consumers, special needs, such as reliability and voltage stability, can be accommodated by negotiation.
Each distribution feeder is assigned a feeder class that best encompasses the types of consumers connected to the feeder. In some instances the feeder class changes from a higher to lower class. Where this occurs, a distribution recloser or other protection element is often used. Feeder level reliability targets are an approximation of individual consumer reliability needs.
Acceptable reliability performance for unplanned outages is performance equal to or better than the performance indices stated in Table 4.2 below. This table indicates the targets for major (storm-excluded) feeder class reliability performance.

Return to Index68 ASSET MANAGEMENT PLAN ELECTRICITY NETWORKS FY2010 – FY2019
Table 4.2: Unplanned Reliability Performance Targets by Feeder (Consumer) Type
Asset Management Driver: Service
Typical Consumer Type
Large Industrial Commercial Urban Rural
Remote Rural Unit
Powerco Feeder Class
F1 F2 F3 F4 F5
Average number of consumers on feeder class
5 100 800 500 250
SAIFI (average for class)
0.33 0.33 0.5 2 3 Interruptions per year
CAIDI (average for class)
45 45 45 90 150 Minutes per interruption
SAIDI (average for class)
15 15 23 180 450 Minutes per consumer per year
Maximum no. of auto-recloses
- - - 16 24 Reclose shots per year
Maximum no. of Interruptions
0.5 1.0 1.5 4 6 Interruptions per year
Maximum average outage duration
60 60 120 150 180 Minutes per interruption
Feeder interruption duration index (FIDI)
30 60 180 600 1080 Minutes per feeder per year
Note: The reliability performance stated in the table above excludes the performance of the network upstream of the feeder. Refer to Section 3.4 for descriptions of the feeder types.
The network reliability targets have been further disaggregated by outage class for the next four years and this is shown in Table 4.3 below. Class B outages relate to planned outages on the Powerco network and class C outages relate to unplanned outages (faults) on the Powerco network. The specific target levels of service chosen are based on a balance of consumer feedback, comparisons with other New Zealand lines companies with the same customer density, past practice, economic factors, recognised international best practice and safety considerations. The targets were increased last year to provide a greater planned SAIDI allowance. This will improve project cost efficiency and improve reliability performance in the future, which in previous years’ results were worse than target. Tight control of planned SAIDI has an adverse impact on network project cost efficiencies.
Strategic investment in planned SAIDI has the benefit of actually increasing the reliability of the network in the medium and long term, which is particularly important given the ageing profile of network assets. By increasing the allowable planned SAIDI, we can set about maintaining the unplanned SAIDI for the same network budget cost.
Table 4.3: Network Reliability Performance by Class and Year
Asset Management Driver: Service
MeasureOutage Class
Year
Unit2010 2011 2012 2013
SAIDI B 40 40 40 40 Minutes per consumer per year
C 130 130 130 130
SAIFI B 0.20 0.20 0.20 0.20 Interruptions per year
C 2.36 2.36 2.36 2.36
CAIDI B 202 20 202 202 Minutes per interruption
C 55 55 55 55
SAIFI B+C 2.56 2.56 2.56 2.56 Interruptions per year
SAIDI B+C 170 170 170 170 Minutes per consumer per year
CAIDI B+C 66 66 66 66 Minutes per interruption
Justification for the Reliability Targets4.2.4.1
The reliability targets have been determined by weighing a combination of several factors:
Benchmarking with other lines companies: comparisons of the reliability performance of other lines companies with similar mixes of provincial urban, rural and remote rural customers results in a SAIDI performance average of around 220 and SAIFI average of 2.5.
Comparisons with historical reliability performance: the graphs of historical SAIDI indicate that reliability is heavily influenced by weather. Removing storms, the reliability performance has been consistently between 165 and 190 SAIDI from 2004 to 2008. Therefore 170 SAIDI is a stretching target achievable when weather is benign.
Consideration of public preferences: customer consultation to date has indicated that apart from some localised reliability concerns, on the whole our customers perceive the supply reliability performance to be adequate.
The targets by feeder type take into account the consequences of supply loss by customer type. For example, loss of supply to commercial customers in a CBD and industrial customers will cause a large economic loss during business hours and so

Return to Index 69ASSET MANAGEMENT PLAN ELECTRICITY NETWORKS FY2010 – FY2019
very high reliability expectations exist in these areas. Conversely, in rural areas, the scale of economic loss caused by loss of supply may be significant but the reduced customer density in rural areas usually means longer lines, more faults and longer restoration times, and a reduced reliability of supply is inevitable.
The SAIDI, SAIFI and CAIDI targets remain static as a reflection of the need for increased network renewal due to the increasing average age of the network. Reliability performance of worst-performing feeders is monitored every month on a 12-month rolling basis as part of the performance engineering process. Actions to improve network performance are incorporated into the works plan each year or during the year when required. Note that Section 6.6 outlines that the reliability performance targets may have to increase if there is insufficient incentive for lines companies to invest in asset renewal.
Capacity Targets4.2.5.
The capacity service component needs to be considered in two parts.
Firstly, for medium-term network planning, consumer load requirements are taken as the present load on the network plus provision for load growth over five years. The load is taken at the network distribution feeder level. Five years is chosen because this is the lead time in which most network additions can be planned, designed and implemented. The network must be capable of meeting the demand until any necessary reinforcements, or additions can be brought into service. The capacity targets are discussed as a planning criterion for network development planning in Section 7 of this plan.
Secondly, for an individual consumer connection the “consumers load requirement” is the present consumers’ load, typically measured at the point of common coupling on the 400V network. Powerco aims to meet this requirement. In most parts of the network there is spare capacity available in the 400V network to accommodate limited individual consumer load growth. However, changes to an individual consumers load (or the addition of new consumers) is subject to Powerco’s investment policy.
Capacity management at distribution level is an integral part of the planning process. Closely associated with the concepts of asset utilisation (Section 4.3.3), load versus capacity targets are key planning criteria that drive the need to spend development capex.
Further descriptions of the capacity criteria and targets are given in Section 7.3.
Street Lighting Service Target Levels 4.2.6.
Street and road lighting is subject to a requirement for a high level of service. It is relied upon for safety, security, economic and aesthetic reasons. Adequate lighting of public and commercial areas serves as a crime deterrent. The asset owners of street lighting equipment are subject to negative publicity, and media, public and regulatory scrutiny
in the case of non-performance. These service level expectations are recognised and documented in Powerco’s low voltage fault procedures with regard to reported instances of street lighting failure. Where single light failures are reported, the fault is referred to the appropriate asset owner, usually a local authority. Where multiple circuits or full town outages are reported, Powerco initiates fault response procedures on the supply and control assets involved. These responses are subject to the same Powerco KPIs as all other LV faults, namely to achieve 95 per cent of LV faults to be dispatched within seven minutes.
Key stakeholders in the street lighting service are:
Territorial Local Authorities are required to provide public lighting in accordance with •AS/NZ 1158. They rely on public lighting for safety, security, economic and aesthetic reasons.
Transit New Zealand owns and operates road lighting at various state highway •intersections and pedestrian crossings, again in accordance with AS/NZ1158.
New Zealand Police rely on adequate lighting of public and commercial areas as a •crime deterrent.
Targeted Number of Faults per km of Line4.2.7.
This measure, considered with demographic factors, helps to identify reliability maintenance or improvement options (Section 6.6) that are worth pursuing, such as line segmentation, upgrades and additional feeders. The measure excludes preplanned shutdowns of a preplanned nature. Regionally, comparing results identifies where improvements can be made through researching the cause of poor fault/km performance.
Table 4.4: Targeted Future Average Number of Faults per 100 km per year
Asset Management Driver: Asset Age, Condition, Configuration & Service
Voltage
Target No of Faults per 100km per year
Forecast
2010 2011 2012 2013 2014
6.6, 11 & 22kV overhead 14 14 14 14 14
6.6, 11 & 22kV underground 4 4 4 4 4
33kV & 66kV overhead 6 6 6 6 6
33kV underground 4 4 4 4 4
Average 12.3 12.3 12.3 12.3 12.3
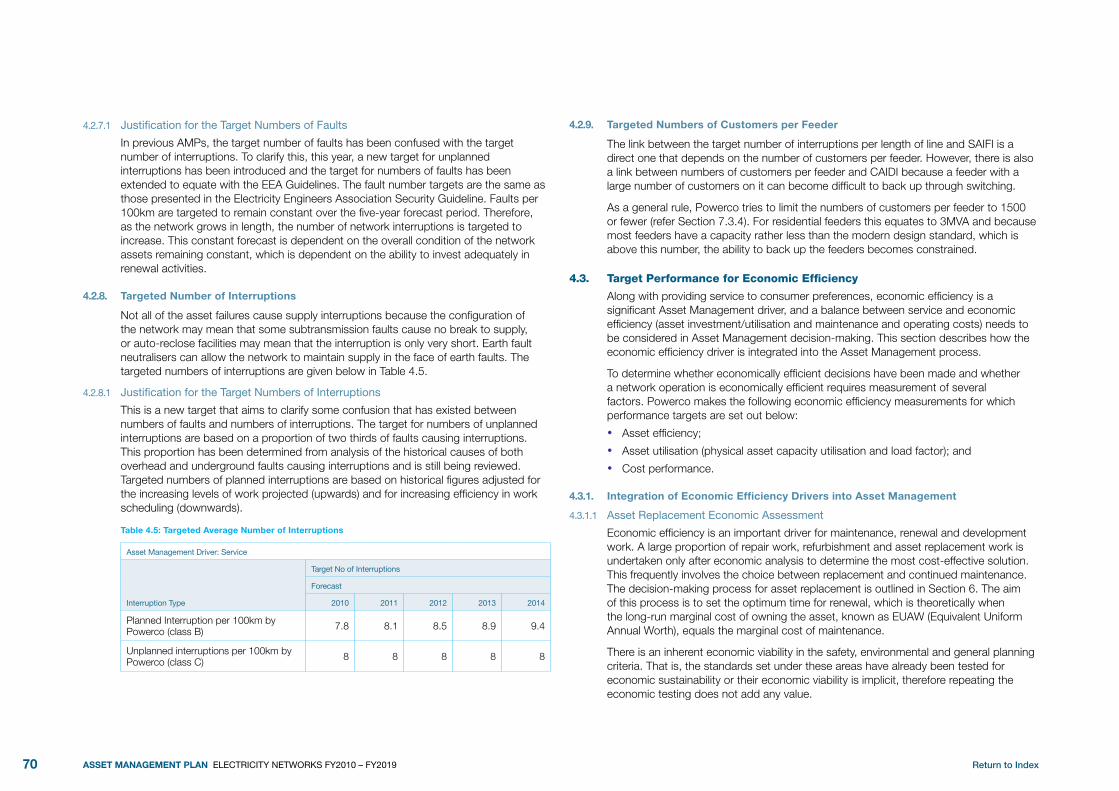
Return to Index70 ASSET MANAGEMENT PLAN ELECTRICITY NETWORKS FY2010 – FY2019
Justification for the Target Numbers of Faults4.2.7.1
In previous AMPs, the target number of faults has been confused with the target number of interruptions. To clarify this, this year, a new target for unplanned interruptions has been introduced and the target for numbers of faults has been extended to equate with the EEA Guidelines. The fault number targets are the same as those presented in the Electricity Engineers Association Security Guideline. Faults per 100km are targeted to remain constant over the five-year forecast period. Therefore, as the network grows in length, the number of network interruptions is targeted to increase. This constant forecast is dependent on the overall condition of the network assets remaining constant, which is dependent on the ability to invest adequately in renewal activities.
Targeted Number of Interruptions4.2.8.
Not all of the asset failures cause supply interruptions because the configuration of the network may mean that some subtransmission faults cause no break to supply, or auto-reclose facilities may mean that the interruption is only very short. Earth fault neutralisers can allow the network to maintain supply in the face of earth faults. The targeted numbers of interruptions are given below in Table 4.5.
Justification for the Target Numbers of Interruptions4.2.8.1
This is a new target that aims to clarify some confusion that has existed between numbers of faults and numbers of interruptions. The target for numbers of unplanned interruptions are based on a proportion of two thirds of faults causing interruptions. This proportion has been determined from analysis of the historical causes of both overhead and underground faults causing interruptions and is still being reviewed. Targeted numbers of planned interruptions are based on historical figures adjusted for the increasing levels of work projected (upwards) and for increasing efficiency in work scheduling (downwards).
Table 4.5: Targeted Average Number of Interruptions
Asset Management Driver: Service
Interruption Type
Target No of Interruptions
Forecast
2010 2011 2012 2013 2014
Planned Interruption per 100km by Powerco (class B) 7.8 8.1 8.5 8.9 9.4
Unplanned interruptions per 100km by Powerco (class C) 8 8 8 8 8
Targeted Numbers of Customers per Feeder4.2.9.
The link between the target number of interruptions per length of line and SAIFI is a direct one that depends on the number of customers per feeder. However, there is also a link between numbers of customers per feeder and CAIDI because a feeder with a large number of customers on it can become difficult to back up through switching.
As a general rule, Powerco tries to limit the numbers of customers per feeder to 1500 or fewer (refer Section 7.3.4). For residential feeders this equates to 3MVA and because most feeders have a capacity rather less than the modern design standard, which is above this number, the ability to back up the feeders becomes constrained.
Target Performance for Economic Efficiency4.3.
Along with providing service to consumer preferences, economic efficiency is a significant Asset Management driver, and a balance between service and economic efficiency (asset investment/utilisation and maintenance and operating costs) needs to be considered in Asset Management decision-making. This section describes how the economic efficiency driver is integrated into the Asset Management process.
To determine whether economically efficient decisions have been made and whether a network operation is economically efficient requires measurement of several factors. Powerco makes the following economic efficiency measurements for which performance targets are set out below:
Asset efficiency;•
Asset utilisation (physical asset capacity utilisation and load factor); and•
Cost performance.•
Integration of Economic Efficiency Drivers into Asset Management4.3.1.
Asset Replacement Economic Assessment4.3.1.1
Economic efficiency is an important driver for maintenance, renewal and development work. A large proportion of repair work, refurbishment and asset replacement work is undertaken only after economic analysis to determine the most cost-effective solution. This frequently involves the choice between replacement and continued maintenance. The decision-making process for asset replacement is outlined in Section 6. The aim of this process is to set the optimum time for renewal, which is theoretically when the long-run marginal cost of owning the asset, known as EUAW (Equivalent Uniform Annual Worth), equals the marginal cost of maintenance.
There is an inherent economic viability in the safety, environmental and general planning criteria. That is, the standards set under these areas have already been tested for economic sustainability or their economic viability is implicit, therefore repeating the economic testing does not add any value.

Return to Index 71ASSET MANAGEMENT PLAN ELECTRICITY NETWORKS FY2010 – FY2019
Planning Criteria Economic Assessment4.3.1.2
Economic viability testing is performed as part of the project approval process when projects are proposed that address non-compliance with planning criteria. The life-cycle cost of ownership of a notional network or portion of a network constructed using the planning criteria is determined. This cost of ownership is tested against other network scenarios to ensure the most economically viable criteria are selected.
In setting the planning criteria, the balance between service, economic efficiency and reliability needs to be considered. There are significant trade-offs to be made with the level of assets employed to provide security and the resulting reliability performance.
That is, in general, an increased quantity of assets provide greater redundancy and security, or provide increased service performance, but increase the price of the service due to the asset investment return requirements and costs, and reduces utilisation.
Maintenance Techniques Economic Assessment4.3.1.3
When maintenance techniques are reviewed or changed, the effect on long-term asset ownership cost and risk is considered, rather than the short-term effects on maintenance expenditure. The economic analysis consists of a comparison of the marginal annualised cost of the maintenance, risk costs and disposal over the remaining life of the asset.
Consumer Initiated Developments Economic Assessment4.3.1.4
When determining investment into consumer initiated network developments, such as subdivisions and network extensions for new consumers, the expected financial return is weighed against the life cycle cost of ownership of the new assets. Powerco’s investment into new consumer initiated works is set at the level that will provide the required commercial return, given the projected revenue and costs. The payback period considered in the NPV analysis may be adjusted to account for risk of connected business(es).
Asset Efficiency Performance Targets4.3.2.
Asset efficiency is a measure of the value of assets employed to provide the service. To allow benchmarking against other electricity lines companies, the common measure of Replacement Cost per Consumer (RC/ICP) has been used. Because ODRC is more publicly available than RC, the measure of ODRC/ICP has also been used even though there can be some distortion when comparing networks with different average ages. Similar measures are developed per MWh delivered.
Powerco’s asset efficiency targets are presented in Table 4.6 below:
Table 4.6: Asset Efficiency Performance Targets
Asset Management Driver: Economic Efficiency
KPI Description Unit 2010 2011
Asset Efficiency (ODRC/ICP) $/ICP <3000 <3000
Asset Efficiency (RC/ICP) $/ICP <6000 <6000
Asset Efficiency (ODRC/MWh) $/MWh <225 <225
Asset Efficiency (RC/MWh) $/MWh <450 <450
Capital Efficiency % 60 60
Notes:
1. Asset efficiency (ODRC/MWh) is the ratio of network optimised depreciated replacement cost over input network MWh.
2. Asset Efficiency (RC/MWh) is the ratio of network replacement cost over input network MWh.
3. Capital Efficiency is the annual network Capital Expenditure over the change in ODRC as a percentage. It excludes the reduction due to depreciation and any gain due to asset revaluation during the period considered. Different project types have different asset efficiency levels. For example, pole replacements or reconductoring projects can have a capital efficiency of around 40%. The Capital Efficiency factors presented in Section 6.4 are the inverse of the Capital Efficiency ratios presented here.
Justification for the Asset Efficiency Targets4.3.2.1
The asset efficiency targets have been determined by dividing the actual 2004 ODV by the numbers of customers. Actually, the numbers of customers and their upstream portion of supply network value follow a form of Poisson distribution. The target’s aim is to minimise the assets needed to supply customers.
The capital efficiency of a project depends on its nature. A typical figure is around 60%. However, a reconductoring project may have a capital efficiency of 20% or lower. A new zone substation may have a capital efficiency of 80% to 100%.
Asset Utilisation Performance Targets4.3.3.
Asset utilisation is the measurement of the physical utilisation of the assets employed. The utilisation measurements used focus on the utilisation of capacity of the assets. The following utilisation targets, based on international data, are used:

Return to Index72 ASSET MANAGEMENT PLAN ELECTRICITY NETWORKS FY2010 – FY2019
Table 4.7: Asset Utilisation Performance Targets
Asset Management Driver: Economic Efficiency & Long-Term Value
KPI Description Target
Zone Substation Transformer in F3, F4 or F5 area at planning horizon 50 - 60%
Zone Substation Transformer in F1 of F2 area at planning horizon [2] 40 - 50%
Distribution Transformer by supply MD (urban area) 35%
Distribution Transformer by supply MD (rural area) 23%
Distribution Transformer by disaggregated feeder MD 38%
Distribution Feeder 50 - 65%
Load Factor 65%
Notes:
1. Zone Substation Transformer utilisation is the substation maximum demand over total substation ONAN rating.
2. Industrial and commercial load curves tend to be flatter than their residential or rural equivalents.
3. Distribution transformer utilisation is calculated for both aggregated and disaggregated demand.
4. Aggregated: Network kW MD over distribution transformer capacity.
5. Disaggregated: Sum of disaggregated feeder MDs over distribution transformer capacity.
6. Distribution Feeder utilisation is the disaggregated feeder maximum demand over the winter 6pm capacity of the smallest section of distribution feeder.
Justification for the Asset Utilisation Targets4.3.3.1
The utilisation targets have been developed from a combination of international practice comparisons and design fundamentals, such as supply diversity.
Expenditure Performance Targets4.3.3.2
For the efficient operation of an electricity network company the direct costs need to be monitored and carefully controlled. The Asset Management Plan considers network expenditures. Total organisation cost has not been considered because corporate costs are not under the control of the Asset Management process. Direct network expenditures include:
Asset Management;•
Network operating and maintenance; and •
Network control function (Powerco’s Network Operations Centre).•
The targeted performance for direct cost per km of line is given in Table 4.8 below:
Table 4.8: Expenditure Performance Targets
Asset Management Driver: Economic Efficiency, Risk Management & Long Term-Value
KPI Description FY2010 B FY2011 F FY2012 F FY2013 F FY2014 F
Direct Cost per km of line ($/km) 1,197 1,259 1,288 1,321 1,324
Direct Cost per Asset Base (RC) (%) 1.96% 2.09% 2.16% 2.23% 2.26%
Maintenance expenditure per Asset Base (RC) (%) 1.50% 1.49% 1.52% 1.55% 1.57%
Capital Expenditure per Asset Base (%) 4.44% 4.87% 5.06% 5.26% 5.34%
Renewal Expenditure per Depreciation (%) 63.5% 67.7% 74.1% 81.3% 89.2%
Growth Expenditure per Change in Transformer Capacity ($/kVA) 803 850 872 894 855
Notes:
1. The Direct Cost targets include network maintenance costs, network operating and network management costs. They exclude utility rates.
2. Direct costs expressed in nominal $ values. Refer to Section 9.
3. Depreciation determined from ODV.
Justification for the Expenditure Performance Targets4.3.3.3
The expenditure performance targets stem directly from the budgeted and forecast expenditures outlined in Section 9.
Network Loss Performance Targets4.3.4.
Technical network losses occur due to resistance as electricity passes through lines and other network elements. Technical losses can be minimised through good engineering but never eliminated entirely, and it is not usually economic to minimise them. Although not directly charged to lines companies, losses are an operating cost to be controlled and balanced against other costs. The economic lifetime costs to pass electricity through lines vary according to the amount of current a line carries, with the cost of losses increasing in proportion to the square of the current carried.
Non-technical losses also arise due to metering error, variations in the timing of meter readings, or due to theft.
Network losses can be determined by calculating the difference between energy flowing into the network and energy flowing out. This relies on information provided from retailers. The targeted level of network losses is 6%. This target is related to the Economic Efficiency and Environmental Asset Management Drivers.

Return to Index 73ASSET MANAGEMENT PLAN ELECTRICITY NETWORKS FY2010 – FY2019
Non-Network and Non-Asset Solutions 4.3.5.
Powerco has an active policy of investigating and, where appropriate, recommending or adopting non-network and non-asset solutions. Presently, the following solutions have been implemented:
Demand-side management is encouraged through demand-based network charges •in some cases;
Load control is used to reduce demand peaks. This has been proposed for •controlling irrigation pumps in areas where voltage complaints have arisen;
Power factor correction is best applied at the customers’ installations and this is set •out in Powerco’s connection standard. In some cases it is applied in the distribution network, particularly in the Valley area, with shunt capacitors (generally 750kVA banks) applied at key locations on distribution feeders;
In some areas, particularly in the Valley area, customers are supplied via long single-•circuit subtransmission feeders and Powerco’s security criteria cannot be met at an economic cost. In these areas additional maintenance is carried out to minimise the probability of outages;
Load transfer through the distribution network is considered prior to any substation •capacity upgrade (conversely, new substations should also be considered as an alternative to upgrades of existing substations);
Solar-powered installations have been supplied in place of network extensions for •some remote small loads, such as electric fence units; and
Micro-grids and remote-area power systems are being implemented in some remote •rural areas.
All opportunities will continue to be monitored and the current policy of encouraging non-network and non-asset-based solutions will continue. Non-asset solution possibilities are pointed out to consumers when they approach Powerco with a request for information or for a connection. Non-network options are also pointed out to key customers by Powerco’s Key Account Managers.
Adoption of New Technology4.3.6.
Powerco has an active programme in keeping up with the latest technical innovations and, where appropriate introducing these on to its network. Recent new technology adopted by Powerco includes the use of the following:
Transformer monitoring and control units;•
Infra-red, ultrasonic and partial discharge condition monitoring techniques;•
The use of profile loggers for circuit-breaker condition monitoring;•
Helicopter-mounted Wescam camera and corona-detecting camera for special line •inspections;
Remotely operated distribution switchgear;•
Digital microwave radio;•
Numerical protection relays;•
Ethernet-based high-speed radio;•
Expansion of CDMA secure data communications;•
Computerised fault management and dispatch;•
Installation of a new integrated SCADA system;•
Spread-spectrum radio, microwave and optical fibre communication for SCADA;•
Handheld electronic data capture devices for inspection and maintenance work; and•
Creation of an online application that allows Powerco’s approved contractors •to access the Contract Works Manual and the Network Operations Manual documentation.
Performance of Contractors 4.4.
Prequalification of Contractors4.4.1.
Potential contractors for work on the network are given the opportunity to prequalify as competent to perform work on Powerco’s network. This is one way Powerco ensures that work performed has adequate quality, and that contractors have the capabilities to attend faults in a timely manner and make repairs efficiently and effectively, in a way that meets Powerco’s own compliance standards and legislated requirements.
Maintenance Scheduling4.4.2.
When maintenance is required on the network, contractors have to schedule a shutdown with the Network Operations Centre in advance. The contractors prepare their own switching plan that is considered and approved by the Network Operations Centre. In determining the suitability of a scheduled shutdown (depending on the length of the shutdown, and the types and numbers of consumers affected) the Network Operations Centre considers the following:
Feedback from retailers with affected consumers;•
The effect on special connections (for instance, Powerco has a list of connections •that rely on electricity for providing dialysis treatment or other medical needs);
The impact on large or electricity-dependent consumers. For instance, shutdowns in •dairying areas are scheduled not to coincide with milking times;
The period available to inform consumers of the shutdowns; and•
Alternative arrangements that may be available for consumers, including the •availability of generators.

Return to Index74 ASSET MANAGEMENT PLAN ELECTRICITY NETWORKS FY2010 – FY2019
Monitoring Quality of Workmanship4.4.3.
Powerco has a well-developed contracts work audit process to ensure that the work carried out on the network meets Powerco’s standards in terms of workmanship and safe working practices. Although engaged by Powerco’s Asset Management Group, the auditors are charged with carrying out their duties on a completely independent basis.
The audit process involves:
Regular inspection of the work during construction for workmanship and safe •working practices. The auditors prepare independent reports and the findings are passed on to the Asset Management Group;
Copies of the audit reports are forwarded to the contractors on the understanding •that any necessary remedial work will be completed within a fixed time. In respect of safe working practices, any required change should normally be implemented immediately; and
A final inspection of the completed work is undertaken, if required to receive a •satisfactory audit report before close-off.
Examples of serious breaches of workmanship quality include (by way of example):
Insufficient depth for laying underground conductors or insufficient aerial clearance •for overhead conductors;
Poor security of electrical installations, i.e. transformer doors left unlocked, and poor •service pillar security where unauthorised access can be gained;
Live terminals or bushings not electrically protected within pillar or transformer •installations; and
Loose neutral connections. •
Target Performance for Safety4.5.
Safety is one of the most important drivers on the Asset Management process. Electrical plant and equipment are capable of causing serious harm. Measures must be taken to ensure, as far as practicable, the safety of employees and the public.
For the safety of staff and the public, the network must be maintained in a way that meets statutory requirements, follows good engineering practice, and is considered safe in accordance with recognised industry standards.
Safety is determined by a combination of:
Asset design;•
Maintaining the assets in a safe condition; and •
Safe operating and work practices.•
The statutory safety drivers are:•
The Electricity Regulations, Electrical Codes of Practice and the Australian/•
New Zealand Standard Wiring Rules. These contain the general framework for Powerco’s safety-related Asset Management. They require existing assets to be maintained in good order and repair to protect from danger;
The Safety Manual – Electricity Industry (SM-EI). SM-EI contains the framework for •Powerco’s safety-related network operation. Powerco has now implemented its network operating procedures to comply with the requirements of SM-EI;
Safe Practices for Low-voltage Electrical Work. This is a safe working code for work •on low-voltage equipment;
The Building Act. This puts in place a building maintenance regime that is aimed at •ensuring the existence of essential safeguards for the users of buildings;
The Health and Safety in Employment Act. This is a key item of safety legislation. •While not overriding safety requirements found in other electrical Acts and Regulations, this Act requires all significant hazards associated with assets to be identified, assessed, and controlled. This is achieved by duties set on all parties associated with design, construction, maintenance and operation of assets; and
The Hazardous Substances and New Organisms Act 1996: This is relevant as it •sets out requirements for handling certain chemicals that are used from time to time during equipment maintenance and construction.
There are also industry drivers set out in the Electricity Engineers Association guides. Powerco has adopted the practice of working as a reasonable and prudent operator as a guide to safe Asset Management practices. Its health and safety policy and procedures are set out in documents in the Powerco Business Management System (BMS). Contractors can receive instructions via the online Contracts Works Manual and the Network Operations Manual. Both of these are new initiatives that operate with online search applications.
Powerco carries out a policy of auditing its contractors for health and safety compliance, along with quality of workmanship. Health and safety audit breaches are divided into major and minor. Powerco has a focus on continual improvement on health and safety and has a target number of zero major breaches. Examples of major breaches include:
Not testing that conductors are de-energised prior to applying temporary earths;•
Not completing a Hazard Identification Register prior to commencing work duties;•
Not wearing appropriate PPE while carrying out duties – e.g. insulated gloves, fall-•arrest devices, overalls and hard hats when working in proximity to live conductors;
Not following correct switching procedures, i.e. not applying temporary earthing as •set out in NOC switching sheets;
Insufficient traffic management; and•
Employees carrying out tasks for which they are not suitably qualified, unsupervised.•

Return to Index 75ASSET MANAGEMENT PLAN ELECTRICITY NETWORKS FY2010 – FY2019
Powerco’s targeted health and safety performance is zero injuries or near misses to Asset Management personnel, contractors or the public.
Target Performance for Environmental Responsibility4.6.
Powerco is committed to achieving our goals, as stated in our mission statement, in a manner that prevents or minimises pollution and other adverse impacts on the surrounding environment and has regard for the interests of the communities in which it operates.
Powerco supports the New Zealand Energy Strategy and the New Zealand Energy Efficiency and Conservation Strategy and is committed to developing more sustainable energy outcomes.
Powerco is also committed to pursuing continual improvement and recognises that sound environmental management is consistent with and complementary to the company’s overall vision to lead New Zealand in electricity and gas distribution.
To fulfil these commitments, Powerco will:
As a minimum, comply with all statutory environmental requirements and other •relevant Standards and Codes, and provide adequate resources to meet those requirements;
Implement an Environmental Management System that provides a framework for •setting and reviewing environmental objectives and targets;
Continually seek improvement and innovative solutions from ourselves and our •suppliers, and do what it takes to get quality results;
Recognise that effective environmental management has implications across the •business and seek to deliver improved environmental and economic performance.
Statutory Compliance4.7.
Powerco is targeting many areas for compliance and has appointed a new Risk and Legal Compliance Analyst who will be reviewing Powerco’s statutory compliance regime. Particular focus over the next 12 months will be on:
review of compliance with key applicable legislation;•
vegetation management through the Electricity (Hazards from Trees) Regulations •2003;
draft Electricity (Safety) Regulations; •
preparation of an environmental management plan and environmental risk audit; and•
Requiring Authority Notices of Requirement for the designation of Electricity and •Gas sites.
Whilst Powerco is targeting many areas for compliance, particular focus is on :
Rolling reviews of seismic stability at zone substations;•
Preparation of an environmental management plan and environmental risk audit; •
Vegetation Management through the Electricity (Hazards from Trees) Regulations •2003.
Review of compliance with Electricity Governance (Connection of Distributed •Generation) Regulations 2007;
Recording of new 230/400V cable locations between service pillars and customers’ •boundaries (focusing on Tauranga);
Knowledge of service providers of the requirements of the Hazardous Substances •and New Organisms Act 1996;
Requiring Authority applications for Electricity and Gas; and,•
Gaining all necessary radio licences needed to operate the radio network.•
Risk Management4.8.
Powerco’s risk management strategy and techniques are explained in Section 10 of this plan. In summary, risk management is implemented to reduce the likelihood of the targeted performance not being achieved and to reduce the consequences to the company and its stakeholders if this happens.
Measurement of risk management is achieved through monitoring of key performance indicators and verification that risks are being considered in the decision-making processes.

Return to Index76 ASSET MANAGEMENT PLAN ELECTRICITY NETWORKS FY2010 – FY2019
EVALUATIon of PERfoRMAnCE5.
Introduction5.1.
This section presents a review of Powerco’s performance against target for the previous year, discusses the factors that influenced the performance, and compares these against industry performance where a reasonable comparison can be made. Detailed discussion of the performance measures and targets is included in Section 4 of this plan. Actions resulting from the evaluation of performance are presented and these are reflected in Sections 6, 7, 8 and 11.
General Review Comments5.1.1.
This plan is the result of the review against Powerco’s April 2009 Asset Management Plan. Preparation of the plan is an ongoing process throughout the year, but work intensifies when final results become available. Powerco has established a comprehensive set of performance targets for FY2010 (Section 4) and will monitor performance against them over the next year.
Review of Work in Progress5.1.2.
Powerco has prepared a series of internal Asset Management Plans that culminate in a five-year work programme suitable for entry into its Improvement Register (refer to Section 2.6). These plans include the long-term development plan, covering subtransmission development for a 15-year period to FY2025; the medium-term development plan covering distribution network development for a five-year period to FY2015; as well as a range of other special Asset Management plans.
Review of Consumer Service Performance against Targets5.2.
Results of Consumer Consultation Process5.2.1.
Powerco continued with its programme of face-to-face focus group discussions with agencies representing the great majority of consumers as defined by:
Local economic development agencies/Chambers of Commerce as representative •of Industrial (F1) and Commercial (F2) consumers;
Territorial authorities and the electricity retailers as representative of Urban •Residential (F3) consumers;
Federated Farmers and independent farmer groups as representatives of Rural (F4) •and Remote Rural (F5) consumers; and
Community boards as representatives of Urban Residential (F3) consumers, Rural •(F4), and Remote Rural (F5) consumers.
In addition to the focus group discussions there was ongoing:
One-to-one liaison between a number of very large industrial consumers and •Powerco’s Key Account Managers;
Pricing and Asset Management Plan consultation with electricity retailers;•
Consumer surveys;•
Consumer education, in particular around safety issues; and•
Reactive consultation in response to outages caused by extreme weather events or •general consumer dissatisfaction;
Interface with utilities managers from territorial authorities as representative of the •“lifelines” networks identified in terms of the Civil Defence Emergency Management structure.
These interfaces with consumers are recorded and discussed with Powerco’s planning engineers. Customer-specific requirements from these meetings are handled through the Customer Initiated Works process and higher-level concerns are considered as part of the planning process, be they immediate requirements or input to longer-term projects.
Discussion usually takes place at the Powerco subregion level to take account of investment drivers such as reliability of individual feeders and the vagaries of the environment in different areas. (Section 8.5 discusses feeder level performance in more detail.)
In addition to the general ongoing consultation activities described above, an opportunity was identified to carry out a specific exercise relating to a true price/quality trade-off for a distinct group of consumers in Taihape and Waiouru. The extensive exercise was conducted over four months and included media advertising, direct consumer contact and correspondence and public meetings - and culminated In the community voting on the proposed improvement. The purpose of the exercise was to determine the community’s willingness to pay more for an improvement in security of supply. While the proposed improvement was emphatically rejected, the exercise provided valuable insight into consumer expectations and future consultation methods.
Results of Complaints Monitoring Process5.2.2.
Complaints from the public are recorded in a database. The database is used to follow up the complaints, but it can be used to analyse the types of complaints and put actions around them. This process is currently being integrated as a business system (refer to Section 11.4). The map in Figure 5.1 is one way that the complaints data is analysed.

Return to Index 77ASSET MANAGEMENT PLAN ELECTRICITY NETWORKS FY2010 – FY2019
Figure 5.1: Mapped Customer Complaints Example.
Network Supply Quality Performance5.2.3.
Powerco’s Supply Quality performance for the 12 months to the end of December 2009 is outlined in Table 5.1.
Table 5.1: Review of past year Quality Performance and Complaints
Continuous Power Quality issues
Issue Characterisation Impact to CustomerTarget Performance How monitored Number
Flicker Frequency of less than 35Hz
Visual flicker with lighting
No complaints Customer complaint
7
Harmonics & Interharmonics
3rd, 5th and 7th harmonics most common on distribution level
Little noticeable difference, Radio Interference, Transformer overheating, motors overheating, induction motors contacts tripping
Total Harmonic Voltage < 5% at Point of Common Coupling
PQ Meters at the Substation 11kV, site monitoring using portable PQ-Box 100
0
Phase Voltages Unbalance
One or two phases with voltage <95%, >80%
Damages rotating machines, a fuse on one phase continually blows
No complaints Customer complaint
19
One or two phases with low voltage <80%
No complaints Customer complaint
15
Longer Term Brown Outs
Voltage drop to between 0.1 to 0.9pu
Burns out motors Voltage within 6% of nominal
Customer Complaint
5
Longer Term Overvoltages
Greater than 1.1pu > 1min
Light bulbs blowing, 3 phase motor heating
Voltage within 6% of nominal
Customer Complaint
5

Return to Index78 ASSET MANAGEMENT PLAN ELECTRICITY NETWORKS FY2010 – FY2019
Discrete Power Quality Issues
Issue Characterisation Impact to CustomerTarget Perfromance How monitored Number
Outages (> 1min)
Power goes off
No power 170 SAIDI
2.56 SAIFI
Customer notification, SCADA alert, logged in Outdef system
62
Auto Recloses (< 1min, > 2 sec)
Power goes off then comes back on
Reset electronic equipment, clocks,
No complaints Reclose Counters, SCADA notification, PQ Meters at Substations
15
Short Term Fluctuations, Dips & Sags, Flicker
Lights flicker Visual flicker, clocks running faster
No complaints PQ Meters at Substations, tap change counter
7
Voltage Spikes Short term <1min voltage
Damages equipment
No damage to equipment
Customer Complaint
21
Frequency Excursions Short Term < 1 sec
Deviation from 50Hz
Frequency Excursions Long Term > 1 sec
Deviation from 50Hz
Clocks Running Faster/Slower
AUFLS operation, System Operator advice
Most complaints on power quality were reliability complaints involving autoreclosers. Reliability is covered later in this section. Comprehensively monitoring the actual auto-recloser (or MAIFI) performance presents a problem due to the limitations of the field equipment and the numbers of reclosers not able to be readily counted.
The network generally performed to the required level in terms of voltage and quality. Some voltage imbalance and low-voltage complaints were received, but these were predominantly caused by the consumer or adjacent consumers increasing their load. Some of these issues were dealt with in accordance with Powerco’s policy covering conductor and transformer upgrades and reconfigurations. In some areas, general load growth has been accommodated by installing 11kV voltage regulation equipment.
Some of the consumer property damage complaints were received as a result of voltage fluctuations. Powerco undertook investigations in all instances and the fluctuations were outside the reasonable control of a prudent network operator.
Harmonic levels on the network are not known although few, if any, complaints are received. Power Quality Monitoring equipment is being installed at certain sites to collect harmonics data.
Reliability Overview5.2.4.
Powerco’s SAIDI and SAIFI performance measures for the year ending March 2009 were higher than the targets set and agreed by customers in Section 4.2.4. This data is presented in Table 5.2. Powerco is also measured against a threshold set by the Commerce Commission, which we were under for this period. The April to March period for reporting reliability performance in this plan ensures that the AMP aligns with the disclosed figures.
Powerco calculates the network performance measures through the OutDef application, as described in Section 2.8. This application records the start and end times of faults (and times in between for staged restorations) and then automatically calculates SAIDI and SAIFI figures using an interface with Gentrack (see Section 2.8), which contains the numbers of customers connected to the network, and is then used to determine the number of customers affected by each outage.
For the threshold calculations of SAIDI and SAIFI, the Supplementary Guidelines for Investigating Breaches of the Reliability Criterion of the Quality Threshold have been used (which is based on IEEE Standard 1366TM-2003) to remove extreme weather events.
Powerco’s 2009 reliability performance (planned and unplanned to 31 March 2009) is summarised in Table 5.2 below.

Return to Index 79ASSET MANAGEMENT PLAN ELECTRICITY NETWORKS FY2010 – FY2019
Table 5.2: Powerco Reliability Performance Summary
Performance Measure Unit
Powerco
Actual 2009
Powerco Excl
Major Event Days 2009
Eastern Excl
Major Event Days 2009
Western Excl
Major Event Days 2009
Powerco Target 2009
Industry Average
2009
Industry Median
2009
SAIDI (B+C) Minutes per Customer 290.69 196.7 244.8 156.5 170 223.4 200.9
SAIFI (B+C) Interruptions per Customer 2.76 2.61 3.35 2.00 2.56 2.5 2.1
CAIDI (B+C) Minutes per Interruption 105.3 75.4 73.1 78.3 66.4 88 78
Reliability performance statistics, including major events (e.g. storms), disaggregated to the level of Powerco’s sub-regions, are given in Table 5.3 below. The Valley (Val) sub-region had the most adverse performance figures, comprising around 70% of Powerco’s SAIDI. This result was largely due to the storms that occurred in July 2008 (highlighted in Figure 5.3 below). Separate figures, in terms of faults per 100km, are provided for overhead lines and underground cable.
The storms somewhat mask the underlying performance but it can be concluded that numbers of faults are either at or above the target. Unplanned interruptions are above target. SAIFI is generally at about target, although the numbers of customers affected per interruption in Tauranga and Coromandel is high, indicating a high number of customers per feeder. CAIDI performance is higher than target, although this is likely to be because of storms. Underlying CAIDI indicates that adoption of automation would enable restoration times for most customers to reduce following a fault.

Return to Index80 ASSET MANAGEMENT PLAN ELECTRICITY NETWORKS FY2010 – FY2019
Table 5.3: Regional Reliability Performance
Performance
Measure Unit
Powerco Actual FYE 2009
Target 2009Man Tar Tau Val Wai Wan Total
SAIDI (Class A) Minutes per Customer 0.00 0.01 0.00 0.03 0.00 2.59 2.64
SAIDI (Class B) Minutes per Customer 3.2 5.5 11.1 19.71 5.09 2.21 46.87 40
SAIDI (Class C) Minutes per Customer 37.6 25.9 43.8 112.58 14.43 9.46 243.82 130
SAIDI (Class D) Minutes per Customer 0.0 1.7 17.31 0.94 0.00 0.51 20.49
SAIDI (B+C) Minutes per Customer 40.84 31.49 54.89 132.29 19.52 11.67 290.69 170
SAIDI (All Classes) Minutes per Customer 41.14 34.77 72.73 135.99 20.31 15.15 320.09
SAIFI (Class A) Interruptions per Customer 0.000 0.000 0.000 0.000 0.000 0.000 0.000
SAIFI (Class B) Interruptions per Customer 0.020 0.024 0.063 0.069 0.021 0.010 0.207 0.2
SAIFI (Class C) Interruptions per Customer 0.489 0.382 0.604 0.790 0.141 0.140 2.545 2.36
SAIFI (Class D) Interruptions per Customer 0.000 0.000 0.000 0.000 0.000 0.000 0.000
SAIFI (B+C) Interruptions per Customer 0.509 0.406 0.667 0.859 0.162 0.150 2.753 2.56
SAIFI (All Classes) Interruptions per Customer 0.509 0.406 0.667 0.859 0.162 0.150 2.753
CAIDI (Class A) Minutes per Interruption
CAIDI (Class B) Minutes per Interruption 160.24 236.38 174.97 283.69 237.83 228.59 225.95
CAIDI (Class C) Minutes per Interruption 77.03 67.74 72.58 142.53 102.64 67.32 95.78
CAIDI (Class D) Minutes per Interruption
CAIDI (B+C) Minutes per Interruption 80.31 77.57 82.29 153.95 120.48 77.70 105.59 66
CAIDI (All Classes) Minutes per Interruption
Faults O/H and U/G Number per 100km 11.24 12.02 12.13 12.06 15.41 11.60 12.16 12.3
Faults O/H Number per 100km 15.61 13.85 20.22 14.49 17.36 12.25 15.07 13.2
Faults U/G Number per 100km 2.20 2.26 2.18 2.72 0.32 2.56 2.24 4
Notes:
A) The data returned from the Business Objects report doesn’t provide SAIFI for Transpower, so Classes A & D are missing (also affecting all classes). This also affects CAIDI.
B) The denominator for regional SAIDI figures is the customer numbers for the full Powerco footprint.
C) The different classes are defined as follows:
1. Class A – planned interruption by Transpower
2. Class B – planned interruption by Powerco
3. Class C – unplanned interruption on the Powerco network
4. Class D – unplanned interruption on the Transpower network
D) Faults O/H and U/G excludes faults on zone substations and distribution equipment. Interruptions, however, does include these faults.
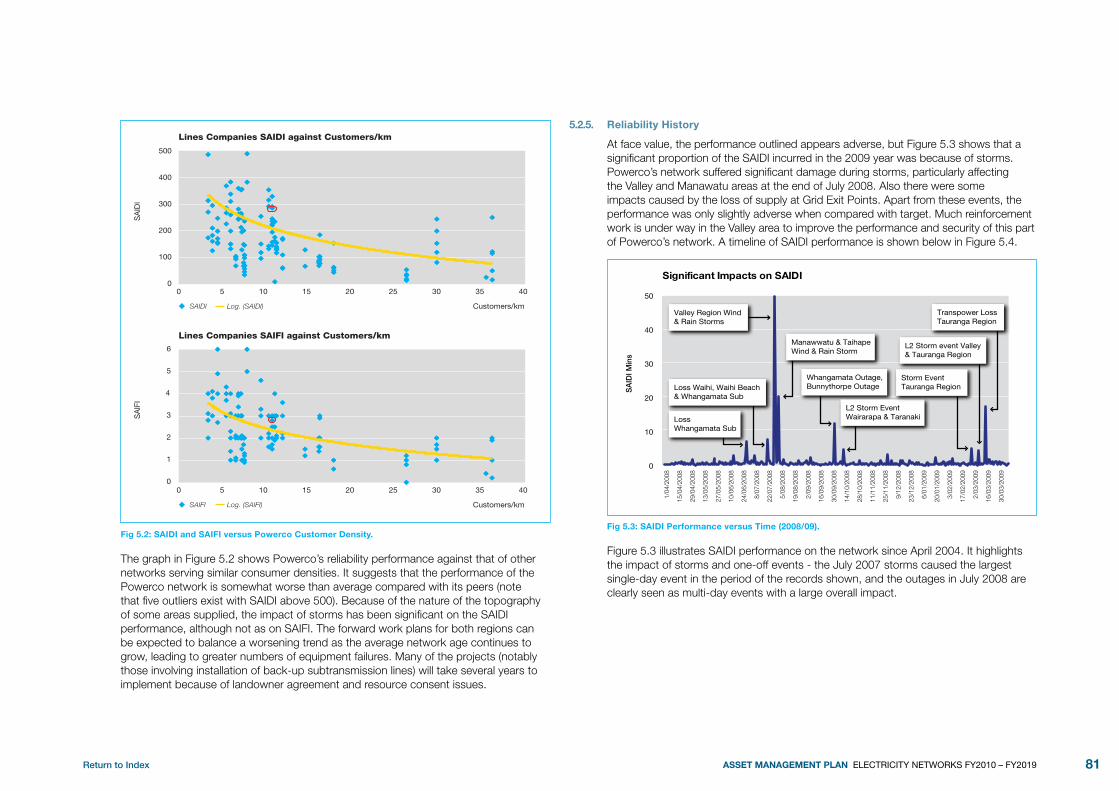
Return to Index 81ASSET MANAGEMENT PLAN ELECTRICITY NETWORKS FY2010 – FY2019
SAIDI Log. (SAIDI)
0 5 10 15 20 25 30 35 40
SA
IDI
Customers/km
Lines Companies SAIDI against Customers/km
0
100
200
300
400
500
SAIFI Log. (SAIFI)
0
1
2
3
4
5
6
0 5 10 15 20 25 30 35 40
SA
IFI
Customers/km
Lines Companies SAIFI against Customers/km
Fig 5.2: SAIDI and SAIFI versus Powerco Customer Density.
The graph in Figure 5.2 shows Powerco’s reliability performance against that of other networks serving similar consumer densities. It suggests that the performance of the Powerco network is somewhat worse than average compared with its peers (note that five outliers exist with SAIDI above 500). Because of the nature of the topography of some areas supplied, the impact of storms has been significant on the SAIDI performance, although not as on SAIFI. The forward work plans for both regions can be expected to balance a worsening trend as the average network age continues to grow, leading to greater numbers of equipment failures. Many of the projects (notably those involving installation of back-up subtransmission lines) will take several years to implement because of landowner agreement and resource consent issues.
Reliability History5.2.5.
At face value, the performance outlined appears adverse, but Figure 5.3 shows that a significant proportion of the SAIDI incurred in the 2009 year was because of storms. Powerco’s network suffered significant damage during storms, particularly affecting the Valley and Manawatu areas at the end of July 2008. Also there were some impacts caused by the loss of supply at Grid Exit Points. Apart from these events, the performance was only slightly adverse when compared with target. Much reinforcement work is under way in the Valley area to improve the performance and security of this part of Powerco’s network. A timeline of SAIDI performance is shown below in Figure 5.4.
0
10
20
30
40
50
SA
IDI M
ins
Significant Impacts on SAIDI
1/04
/200
8
15/0
4/20
08
29/0
4/20
08
13/0
5/20
08
27/0
5/20
08
10/0
6/20
08
24/0
6/20
08
8/07
/200
8
22/0
7/20
08
5/08
/200
8
19/0
8/20
08
2/09
/200
8
16/0
9/20
08
30/0
9/20
08
14/1
0/20
08
28/1
0/20
08
11/1
1/20
08
25/1
1/20
08
9/12
/200
8
23/1
2/20
08
6/01
/200
9
20/0
1/20
09
3/02
/200
9
17/0
2/20
09
2/03
/200
9
16/0
3/20
09
30/0
3/20
09
Loss Whangamata Sub
Valley Region Wind & Rain Storms
Manawwatu & Taihape Wind & Rain Storm
Whangamata Outage, Bunnythorpe Outage
L2 Storm Event Wairarapa & Taranaki
Storm Event Tauranga Region
Transpower Loss Tauranga Region
L2 Storm event Valley & Tauranga Region
Loss Waihi, Waihi Beach & Whangamata Sub
Fig 5.3: SAIDI Performance versus Time (2008/09).
Figure 5.3 illustrates SAIDI performance on the network since April 2004. It highlights the impact of storms and one-off events - the July 2007 storms caused the largest single-day event in the period of the records shown, and the outages in July 2008 are clearly seen as multi-day events with a large overall impact.

Return to Index82 ASSET MANAGEMENT PLAN ELECTRICITY NETWORKS FY2010 – FY2019
SA
IDI M
ins
Significant Impacts on SAIDI
Apr
200
4
Mar
200
9
Oct
200
8
Apr
200
8
Nov
200
7
May
200
7
Dec
200
6
Jul
200
6
Jan
2006
Aug
200
5
Feb
2005
Sep
t 200
4
Severe storm in Coromandel
Eastern Region severe strorm
Jul 05 extreme weather event
Aug 04 Taihape Snowstorm
Jul 07 extreme weather event
Loss Waihi, Waihi Beach & Whangamata Sub
Transpower Loss Tauranga Region
0
20
40
60
80
100
120
140
Fig 5.4: SAIDI Performance versus Time (2004 to 2009).
Underlying Reliability Performance Trends5.2.6.
The graphs below deconstruct Powerco’s underlying reliability (excluding major events) performance in 2009 using the philosophies outlined in Section 8 (reliability rainbow).
SA
IDI
2006 2007 2008 20090
50
100
150
200
250
SAIDI (excl. storms)
Year ending 31 Mar
SA
IDI
2006 2007 2008 20090
100
200
300
400
500
600
Customers/ Interruption (excl. storms)
Year ending 31 Mar
SA
IDI
2006 2007 2008 2009
Interruptions per 100 km HV cct (excl. storms)
0
5
10
15
20
Year ending 31 Mar
SA
IDI
2006 2007 2008 20090
5
10
15
20
25
30
Year ending 31 Mar
Faults & Shutdowns per 100 km HV cct (excl. storms)
2006 2007 2008 2009
Year ending 31 Mar
0
0.5
1
1.5
2
2.5
3
SAIFI (excl. storms)
SA
IDI
2006 2007 2008 20090
50
100
150
200
CAIDI (excl. storms)
Year ending 31 Mar
Planned Unplanned FaultsTarget
Planned Unplanned Unplanned Interuptions Target
Planned Unplanned Interuptions Target
Planned Unplanned Target
Planned Unplanned SAIDI Target
Planned Unplanned
SA
IDI
2006 2007 2008 20090
50
100
150
200
250
SAIDI (excl. storms)
Year ending 31 Mar
SA
IDI
2006 2007 2008 20090
100
200
300
400
500
600
Customers/ Interruption (excl. storms)
Year ending 31 Mar
SA
IDI
2006 2007 2008 2009
Interruptions per 100 km HV cct (excl. storms)
0
5
10
15
20
Year ending 31 Mar
SA
IDI
2006 2007 2008 20090
5
10
15
20
25
30
Year ending 31 Mar
Faults & Shutdowns per 100 km HV cct (excl. storms)
2006 2007 2008 2009
Year ending 31 Mar
0
0.5
1
1.5
2
2.5
3
SAIFI (excl. storms)
SA
IDI
2006 2007 2008 20090
50
100
150
200
CAIDI (excl. storms)
Year ending 31 Mar
Planned Unplanned FaultsTarget
Planned Unplanned Unplanned Interuptions Target
Planned Unplanned Interuptions Target
Planned Unplanned Target
Planned Unplanned SAIDI Target
Planned Unplanned

Return to Index 83ASSET MANAGEMENT PLAN ELECTRICITY NETWORKS FY2010 – FY2019
SA
IDI
2006 2007 2008 20090
50
100
150
200
250
SAIDI (excl. storms)
Year ending 31 Mar
SA
IDI
2006 2007 2008 20090
100
200
300
400
500
600
Customers/ Interruption (excl. storms)
Year ending 31 Mar
SA
IDI
2006 2007 2008 2009
Interruptions per 100 km HV cct (excl. storms)
0
5
10
15
20
Year ending 31 Mar
SA
IDI
2006 2007 2008 20090
5
10
15
20
25
30
Year ending 31 Mar
Faults & Shutdowns per 100 km HV cct (excl. storms)
2006 2007 2008 2009
Year ending 31 Mar
0
0.5
1
1.5
2
2.5
3
SAIFI (excl. storms)
SA
IDI
2006 2007 2008 20090
50
100
150
200
CAIDI (excl. storms)
Year ending 31 Mar
Planned Unplanned FaultsTarget
Planned Unplanned Unplanned Interuptions Target
Planned Unplanned Interuptions Target
Planned Unplanned Target
Planned Unplanned SAIDI Target
Planned Unplanned
SA
IDI
2006 2007 2008 20090
50
100
150
200
250
SAIDI (excl. storms)
Year ending 31 Mar
SA
IDI
2006 2007 2008 20090
100
200
300
400
500
600
Customers/ Interruption (excl. storms)
Year ending 31 Mar
SA
IDI
2006 2007 2008 2009
Interruptions per 100 km HV cct (excl. storms)
0
5
10
15
20
Year ending 31 Mar
SA
IDI
2006 2007 2008 20090
5
10
15
20
25
30
Year ending 31 Mar
Faults & Shutdowns per 100 km HV cct (excl. storms)
2006 2007 2008 2009
Year ending 31 Mar
0
0.5
1
1.5
2
2.5
3
SAIFI (excl. storms)
SA
IDI
2006 2007 2008 20090
50
100
150
200
CAIDI (excl. storms)
Year ending 31 Mar
Planned Unplanned FaultsTarget
Planned Unplanned Unplanned Interuptions Target
Planned Unplanned Interuptions Target
Planned Unplanned Target
Planned Unplanned SAIDI Target
Planned Unplanned
Figure 5.5: Underlying Reliability Performance Trends
As explained above, storms and one off incidents played a big part in the overall reliability indices. Extracting the extreme events provides a better view of the underlying issues that cause outages to customers.
The number of faults, apart from during 2008, have been above target. This implies a continued focus is needed on maintaining the network in good condition (renewal and maintenance) and managing tree contacts. Likewise, the numbers of interruptions are above target, although the ratios are about the same as for the number of faults. Customers per interruption high because of the high number customers affected by interruptions in Tauranga and Coromandel. These areas require a focus on reducing the number of customers per feeder, and on subtransmission reinforcement. The CAIDI is about on target, although work can be done to improve the restoration times for most customers through implementing automation schemes and implementing SCADA. In 2008, planned CAIDI was affected by a six-hour shut down of supply to Coromandel to rebuild sections of 66kV line. These sorts of initiatives are described further in Section 8.
Overall, Powerco’s underlying network performance measured in SAIDI has been substantially consistent over time. In the bottom right graph in Figure 5.5, the underlying SAIDI excluding extreme events has been rather static at between 160 and 200 SAIDI although in recent years there appears to be a rising trend. The trough in numbers of faults and SAIDI in 2007 and 2008 is most likely due to the calm La Niña weather patterns.
Distribution Feeder Class Reliability Performance 5.2.7.
Powerco has established a set of Feeder Interruption Duration Index (FIDI)1 targets for each of the five different classes of feeder (as defined in Section 4.2.4). This individual feeder performance index provides a disaggregated measure of service levels that is more closely aligned to those that individuals experience. Monitoring FIDI performance provides key information for the focus group consultation process referred to in Section 4.2.2.
Supply reliability performance against target is the main area in which targets are not being met. Much of this is weather-dependent, with storms adversely affecting the reliability results (all storm-related outages have been included the FIDI results), and major-event days in the reporting year have increased the KPIs listed against feeders in the following networks:
July 2008 - Valley network; •
July – August 2008 - Manawatu network; and•
September 2008 - Valley and Manawatu networks.•
There are several areas in which performance improvements are being made on an ongoing basis. While these are taking several years to complete, significant progress has and is being made on them. They include:
Continued monitoring and management of the worst-performing distribution feeders (Pareto diminishing returns):
Distribution system reconfiguration, automation and sectionalisation to improve •performance; loop automation schemes are being implemented to re-supply healthy sections on faulted feeders in less than one minute;
Zone substation earth fault neutralisers will be commissioned to limit the impact of •earth-type faults on the distribution networks;
The fitting of SCADA control to normally open, and mid-points on distribution •feeders to allow quicker restoration times;
The fitting of line fault indicators (some 66kV circuits having SCADA indication); •
Implementing SCADA at zone substations that do not have this facility; and•
Addressing subtransmission network reliability performance, particularly in the •Eastern region. Significant planning work in this area is reflected in the Eastern Region long-term development plan (refer to Section 7.13).
1 FIDI is defined in the Key Definitions given in the glossary. As a mathematical formula, it is the number of ‘customer minutes’ of interruption experienced by consumers on a feeder divided by the number of ICPs.
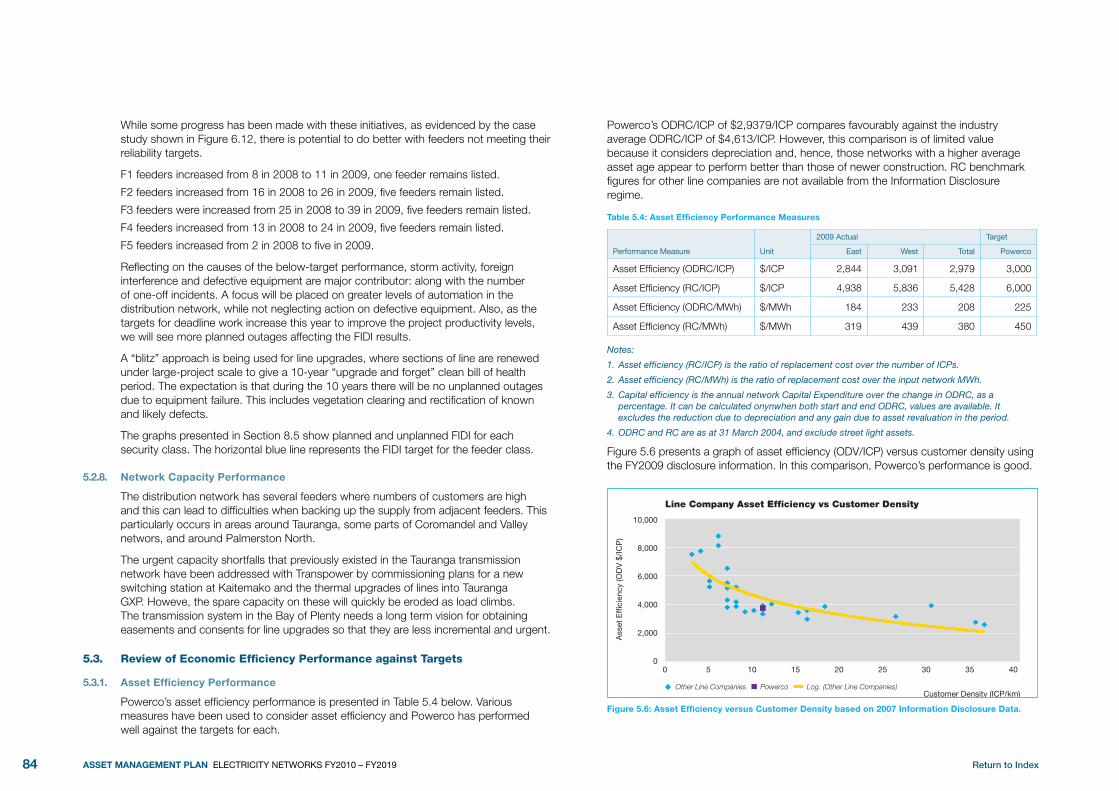
Return to Index84 ASSET MANAGEMENT PLAN ELECTRICITY NETWORKS FY2010 – FY2019
While some progress has been made with these initiatives, as evidenced by the case study shown in Figure 6.12, there is potential to do better with feeders not meeting their reliability targets.
F1 feeders increased from 8 in 2008 to 11 in 2009, one feeder remains listed.
F2 feeders increased from 16 in 2008 to 26 in 2009, five feeders remain listed.
F3 feeders were increased from 25 in 2008 to 39 in 2009, five feeders remain listed.
F4 feeders increased from 13 in 2008 to 24 in 2009, five feeders remain listed.
F5 feeders increased from 2 in 2008 to five in 2009.
Reflecting on the causes of the below-target performance, storm activity, foreign interference and defective equipment are major contributor: along with the number of one-off incidents. A focus will be placed on greater levels of automation in the distribution network, while not neglecting action on defective equipment. Also, as the targets for deadline work increase this year to improve the project productivity levels, we will see more planned outages affecting the FIDI results.
A “blitz” approach is being used for line upgrades, where sections of line are renewed under large-project scale to give a 10-year “upgrade and forget” clean bill of health period. The expectation is that during the 10 years there will be no unplanned outages due to equipment failure. This includes vegetation clearing and rectification of known and likely defects.
The graphs presented in Section 8.5 show planned and unplanned FIDI for each security class. The horizontal blue line represents the FIDI target for the feeder class.
Network Capacity Performance5.2.8.
The distribution network has several feeders where numbers of customers are high and this can lead to difficulties when backing up the supply from adjacent feeders. This particularly occurs in areas around Tauranga, some parts of Coromandel and Valley networs, and around Palmerston North.
The urgent capacity shortfalls that previously existed in the Tauranga transmission network have been addressed with Transpower by commissioning plans for a new switching station at Kaitemako and the thermal upgrades of lines into Tauranga GXP. Howeve, the spare capacity on these will quickly be eroded as load climbs. The transmission system in the Bay of Plenty needs a long term vision for obtaining easements and consents for line upgrades so that they are less incremental and urgent.
Review of Economic Efficiency Performance against Targets5.3.
Asset Efficiency Performance5.3.1.
Powerco’s asset efficiency performance is presented in Table 5.4 below. Various measures have been used to consider asset efficiency and Powerco has performed well against the targets for each.
Powerco’s ODRC/ICP of $2,9379/ICP compares favourably against the industry average ODRC/ICP of $4,613/ICP. However, this comparison is of limited value because it considers depreciation and, hence, those networks with a higher average asset age appear to perform better than those of newer construction. RC benchmark figures for other line companies are not available from the Information Disclosure regime.
Table 5.4: Asset Efficiency Performance Measures
Performance Measure Unit
2009 Actual Target
East West Total Powerco
Asset Efficiency (ODRC/ICP) $/ICP 2,844 3,091 2,979 3,000
Asset Efficiency (RC/ICP) $/ICP 4,938 5,836 5,428 6,000
Asset Efficiency (ODRC/MWh) $/MWh 184 233 208 225
Asset Efficiency (RC/MWh) $/MWh 319 439 380 450
Notes:
1. Asset efficiency (RC/ICP) is the ratio of replacement cost over the number of ICPs.
2. Asset efficiency (RC/MWh) is the ratio of replacement cost over the input network MWh.
3. Capital efficiency is the annual network Capital Expenditure over the change in ODRC, as a percentage. It can be calculated onynwhen both start and end ODRC, values are available. It excludes the reduction due to depreciation and any gain due to asset revaluation in the period.
4. ODRC and RC are as at 31 March 2004, and exclude street light assets.
Figure 5.6 presents a graph of asset efficiency (ODV/ICP) versus customer density using the FY2009 disclosure information. In this comparison, Powerco’s performance is good.
Other Line Companies Powerco Log. (Other Line Companies)
0
2,000
4,000
6,000
8,000
10,000
0 5 10 15 20 25 30 35 40
Ass
et E
ffic
ienc
y (O
DV
$/I
CP
)
Customer Density (ICP/km)
Line Company Asset Efficiency vs Customer Density
Figure 5.6: Asset Efficiency versus Customer Density based on 2007 Information Disclosure Data.

Return to Index 85ASSET MANAGEMENT PLAN ELECTRICITY NETWORKS FY2010 – FY2019
Powerco performs well on asset efficiency in comparison to many other distributors because of the rural nature of Powerco’s network. However, with the increasing expectations from the community in supply reliability and quality, particularly from the dairy farming industry, as well as general expectations on the environmental impact, it is expected that network investment per ICP will necessarily have to increase in the longer term.
Asset Utilisation Performance5.3.2.
Asset utilisation is a key driver of long-term asset efficiency. Generally, Powerco performance was good when compared to with the targets set. The load factor and substation transformer utilisation were in the good performing range when compared with national and international benchmarks.
Table 5.5: Asset Utilisation Performance Measures
Performance Measure
Powerco Actual FYE 2009
TargetMan Tar Tau Val Wai Wan Total
Substation Transformer Utilisation. Note 1 55% 53% 74% 81% 51% 59% 61% 40%
Distribution Transformer Utilisation by Supply MD. Note 2 31% 34% 31% 28% 24% 34% 29% 30%
Distribution Transformer Utilisation by Disaggregated Feeder MD. Notes 3, 4, 6 and 8
37% 38% 39% 35% 36% 39% 37% 38%
Load Factor. Note 5 60% 67% 58% 70% 69% 62% 67% 65%
Line Losses. Note 7 n/a n/a n/a n/a n/a n/a n/a -
Notes:
1. Zone substation transformer utilisation is the substation maximum demand over the total substation ONAN rating, expressed as a percentage.
2. Distribution transformer utilisation is calculated for both aggregated and disaggregated demand.
3. Aggregated: Network kW MD over distribution transformer capacity.
4. Disaggregated: Sum of disaggregated feeder MDs over distribution transformer capacity. Note that the aggregated factor is lower due to power factor.
5. Load factor is the ratio of Network kWh/Network MD kW x 365 x24.
6. Feeder capacity utilisation is the disaggregated feeder MD over the total distribution feeder winter 6pm capacity.
7. Line losses calculation is not reported because up-to-date information is not available from all retailers.
8. While disaggregated distribution transformer utilisation has been calculated, the results should be treated with some caution. Feeder MD results were not available for some feeders and some feeders supply loads directly (not via distribution transformers). These feeders have been removed from the average. Tauranga’s result is strongly affected by these limitations
The zone substation transformer utilisation resides at the high end of the target band, which indicates, on average, a good utilisation level. Valley’s and Tauranga’s utilisation levels are high, indicating that shutdowns have to be carefully pre-planned for times of low demand. This, coupled with the historically high growth levels in these areas, means that further zone substations should be constructed (refer Section 7).
The distribution transformer utilisation was slightly below target and under the national average of 32.1% (Information Disclosure Compendium). It is typical for less dense networks to have a lower distribution transformer utilisation due to the low diversity of rural distribution substations. Lower utilisation factors are also observed in widespread networks where weather and demographic trends lead to non-coincidence of local versus regional consumption patterns.
Load factor was slightly above the 65% target. The efficacy of the load control systems is important in achieving this target. Discussions are under way with the receiver owners about maintaining this system.
Losses were not able to be reported on due to the fragmented nature of the energy reconciliation records.
Cost Performance5.3.3.
Powerco’s direct cost performance is presented in Table 5.6 below. The actual performance for FY2008 was slightly above target (unfavourable by 4%), which, considering the storm activity that occurred, demonstrated tight control of the maintenance budget.
Table 5.6: Powerco’s Direct Cost Performance
KPI Description FY2008 FY2009
Direct Cost per km of line ($/km) 1,176 1,090
Direct Cost per Asset Base (RC) (%) 1.86% 1.76%
Maintenance expenditure per Asset Base (RC) (%) 1.42% 1.42%
Capital Expenditure per Asset base (%) 4.24% 4.79%
Renewal Expenditure per Depreciation (%) 45.3% 58.6%
Growth Expenditure per Change in Transformer Capacity ($/kVA) 551 672
Notes:
1. Actual direct costs are denominated in the value of the dollar for the year they are reported.
2. The actual direct costs include the System Management and Operations expenditures along with the network maintenance costs.

Return to Index86 ASSET MANAGEMENT PLAN ELECTRICITY NETWORKS FY2010 – FY2019
Figure 5.7 presents a graph of operational costs versus customer density, using the FY2009 information disclosure information. It presents a view of the key cost and service component. Powerco experienced lower operational costs than the industry average of $2910/km.
Other Line Companies Powerco Log. (Other Line Companies)
0
2,000
4,000
6,000
8,000
10,000
0 5 10 15 20 25 30 35 40
Ass
et E
ffic
ienc
y (O
DV
$/I
CP
)
Customer Density (ICP/km)
Line Company Asset Efficiency vs Customer Density
Figure 5.7: Operational Costs versus Customer Density, based on Information Disclosure Data.
Review of Safety Performance5.4.
There were four lost-time injury Incidents reported in the 12 months ending June 2009. The most serious was during a storm when a linesman fell from a pole.
Tenix Alliance and other contracted service providers perform all construction and maintenance work on Powerco’s network. The health and safety programmes of all service providers are audited and field safety audits are conducted to confirm compliance. In the FY2009 year, 11,291 field audits were conducted. In the year ended June 2009, there were 184 near-miss incidents reported by contract service providers, and four lost-time injuries.
Contractors: Four lost-time injuries were reported from Powerco’s major contractors in the year ended 30 June 2009.
A total of 184 near-misses were reported by Powerco’s major contractors in the 12 months ended 30 June 2009.
Employees: Over the year ending 30 June 2009, there were three near-miss events reported, and one lost-time injury.
Review of Environmental Performance 5.5.
No environmental incidents occurred during the previous year on Powerco’s network.
During 2009 an audit of the Zone Substation Oil Containment in the Western Region was carried out and outcomes are described in Section 8.8.
Review of Physical Performance against Plan5.6.
The physical progress of major development, renewal and maintenance activities for FY2009 and FY2010, as at February 2010, is summarised in Tables 5.7 to 5.11, which provide a brief description of the project, its status and a summary of the project difficulties encountered.
The FY09 scheduled capital works programme (development and renewal activities) was 97% complete by year-end. Certain work had to be deferred due to resource constraints (the result of a tight labour market), delays for gaining resource or landowner consents, and the delivery of some materials. The uncompleted works have been rescheduled for completion in 2010.
The FY09 maintenance work programme was largely completed, with 97% of scheduled activities achieved by year-end. The outstanding maintenance has been incorporated into the FY2010 maintenance plan.
Subtransmission Network Project Performance5.6.1.
Major subtransmission and zone substation development and equipment replacement project progress is summarised in Table 5.7 below.
Table 5.7: Subtransmission Projects Status
Location Project DescriptionStatus at February 2010
Description of Project Difficulties
Tauranga Bethlehem Substation Land
Obtain and designate land
In progress Consent process to obtain designation is not clear and is liable to take several years.
Tauranga Pyes Pa Substation Land
Purchase land, assist with designation
In progress Consent process to obtain designation is liable to take several years.
Valley Whitianga 66kV line extension
Negotiate line route, easement compensation, resource consent preparation
In progress Obtaining landowner consent has taken several years, and on-going.

Return to Index 87ASSET MANAGEMENT PLAN ELECTRICITY NETWORKS FY2010 – FY2019
Location Project DescriptionStatus at February 2010
Description of Project Difficulties
Valley Coroglen to Kaimarama Landowner compensation
Complete resource consent process, landowner negotiations, payment of easement compensation, legal fees, sign-on fees
In progress Obtaining landowner consent has taken several years, and on-going.
Valley Whangamata second circuit easement compensation
Line route negotiation, easement compensation, resource consent costs
In progress Obtaining landowner consent has already taken several years and may require compulsory acquisition.
Valley Kopu - Kauaeranga 110kV line construction
Landowner negotiation, easement compensation, signing fees, consent preparation
In progress Landowner negotiation will take several years
Tauranga Tauranga CBD Reinforcement - Waihi Rd - Tauranga 33kV circuits
Identify circuit routes, undertake concept design, obtain consents
Wetlands area under tender, cable route in progress for Tauranga to Greerton
The available cable routes are quite congested. Easements could take extended time to obtain.
Tauranga Omanu Substation Environment Court hearing costs, easement compensation, design, subtransmission cabling
Consents obtained, design complete, major equipment ordered, cabling under way
Consent process to obtain designation has been taken an extended period and the process has not been straight forward.
Tauranga Te Maunga Substation
Identify, purchase site, obtain consents, concept design
In progress Consent process to obtain designation is liable to take several years.
Tauranga Te Matai - Te Puke subtransmission circuit upgrade
Upgrade the 33kV circuit B from Te Matai to Atuaroa take off
Construction under way
Landowner consent has taken extra time.
Valley Second Browne St transformer
Install second transformer at Browne St, Matamata
Main build contract let, major equipment on order
Valley Kopu - Coroglen line reconductoring
Stage 4 of the reconductoring project
Construction under way
Shutting down the line for an extended period needs careful security risk planning.
Location Project DescriptionStatus at February 2010
Description of Project Difficulties
Tauranga Paengaroa substation
Construct new zone substation, obtain land, obtain consent
In progress
Valley Second Thames 66kV circuit
Construct new 66kV circuit to Thames
Design under way
Tauranga Omokoroa second bank
Install second transformer, new 33kV CB and protection at Omokoroa. Replace 11kV switchboard
Commissioned, as building underway
Valley Mikkelsen transformer upgrade
Purchase and install two new transformers at Mikkelsen Rd
Complete
Tauranga New Kaitimako GXP Connect new GXP into the existing subtransmission circuits
As-building
Tauranga Otumoetai new switchboard
Replace 11kV switchboard, protection relays and SCADA
Complete
Wanganui Hatricks Substation transformer
Install new 16/24MVA transformer and extend substation area. Obtain consent and lease.
In progress The time taken to obtain a lease for the site extension could delay the project.
Taranaki New Katere Substation
Establish new zone substation.
Under construction
Cables in the road have taken extended time to negotiate with Council.
Wanganui Beach Rd switchgear upgrade
Change switchgear to indoor, extend building
Equipment on order
Taranaki Tasman substation rebuild
Extend building, replace switchgear with indoor
Equipment on order
Wanganui Peat Street switchgear
Replacing 33kV switchgear at Peat St with indoor equipment
Equipment on order, design under way
Manawatu Main St 33kV switchboard
Replacing 33kV switchgear at Main St
Construction under way
Some equipment quality issues
Taranaki Livingston 11kV switchboard replacement
Temporary protection grading issues occurred.
Taranaki Brooklands substation
New zone substation Complete DRMCC transformer management relays have had teething problems.

Return to Index88 ASSET MANAGEMENT PLAN ELECTRICITY NETWORKS FY2010 – FY2019
Distribution Network Project Performance5.6.2.
The status of major distribution network projects in FY2009 and FY2010 is outlined in the table below.
Table 5.8: FY2009 Distribution Network Project Status
Location Project DescriptionStatus at February 2010
Description of Project Difficulties
Tauranga 11kV and 33kV Overhead reconstruction
Overhead hardware renewal of Pongakawa 33, Kauri Pt 33, Committee Ccts, Welcome Bay, Mt Maunganui, Bethlehem, Green Park, Mural Town, Paengaroa, Rotoehu, Black Stump
Build tenders awarded
Valley 400V, 11kV and 33kV Overhead reconstruction
Waikino 33, Tairua 66, Kaihere, Kuaotunu, Cook Dr, Victoria St, Waihi Nth, Bennett St, Ngatea, Kopu, Thames Urban, Waihi Urban
Build tenders awarded
Tauranga & Valley
11kV Distribution reconstruction
Distribution transformer, ABS, Distribution Switchgear replacement
Site work in progress
Tauranga Distribution development project
Maunganui Rd, Otamarakau, Waikite, Welcome Bay capacity upgrades and new feeders
Outage planning under way, soil resistivity tests underway
Obtaining landowner consent has taken several years and ongoing.
Valley Scheduled development project
Mangatarata, Purangi, Whitianga, Pauanui, Manaia line reconstruction
Design in progress
Potential for resource consent to rebuild line will cause project delay in TCDC area.
Western 11kV and 33kV Overhead Line reconstruction
Pole and cross-arm replacement in general Western area.
Build tenders awarded
Tauranga Tauranga CBD Reinforcement - Waihi Rd - Tauranga 33kV circuits
Identify circuit routes, undertake concept design, obtain consents
In progress The available cable routes are quite congested. Easements could take extended time to obtain.
Wanganui Raetihi Overhead reconstruction
Reconstruction of a length of aged line
Installation work planning in progress
Protection and Control Development Performance5.6.3.
The following tables indicate the status of protection, communications and SCADA projects in the FY2009 and FY2010 plans:
Table 5.9: FY2009 Protection Project Status
Region Protection ProjectStatus at February 2010
Description of Project Difficulties
Manawatu Linton-Kairanga-Pascal 33kV protection and communications system
Protection installed, communications link not yet operational
Communications link is temperamental.
Manawatu Kelvin Grove-Keith Street and Bunnythorpe Line differential protection and communications system
In progress
Manawatu Linton-Turitea protection upgrade Protection installed, communications link not yet operational
Communications link is temperamental.
Manawatu Kimbolton Protection Upgrade To be deferred until switchgear is replaced
Protection upgrades are incumbent on class of switchgear.
Wairarapa Norfolk - Chapel directional protection Completed
Wairarapa Tuhitarata protection upgrade Complete This was a pole-mounted circuit-breaker replacement.
Tauranga Triton 33kV protection upgrade Completed
Tauranga Te Puke A&B circuits protection replacement
Deferred to FY11
Wairarapa Akura transformer protection upgrade Completed
Taranaki Comms and Protection upgrade – Waitara East
Completed

Return to Index 89ASSET MANAGEMENT PLAN ELECTRICITY NETWORKS FY2010 – FY2019
Table 5.10: FY2009 Communications Project Status
Region Development ProjectStatus at February 2010
Description of Project Difficulties
All Provision of 4 x VOIP units to bring VHF voice traffic back to NOC from Wanganui and Palmerston regions
Completed
All Implementation of remote Dial-Out facility on Powerco WAN for data access
Completed
Manawatu Radio communications between NOC and Powerco’s contractors
Develop VHF voice radio network and interface to VOIP circuit back to NOC
Completed
Manawatu Migration of the Pahiatua Track communications facility to Te Rere Hau Substation site
Completed
Wairarapa Create new Radio Repeater site at Rewa to replace current poor Fleetlink communications to Awatoitoi and Tinui Substations
Completed
Taranaki Digital radio upgrade Junction Street
Provide protected mode communications circuit from Junction St to Egmont.
Completed
Taranaki New radio link Waitara West to East Egmont, (replacing Waitara East to East Egmont).
In progress
Taranaki Replacement of the overloaded and rusting radio structure at the CA hut.
Completed
Taranaki Install new digital radio link between CA hut and Hawera and Brunswick
Feasibility study done, project not proceeding
Wanganui Replace/repair Bastia Hill Radio Mast Completed
Eastern Region
Trial of Powerco-owned VHF Voice Radio Network to replace current Fleetlink trunked radio system
Being commissioned
Eastern Region
Continuation of the Eastern Region Powerco-owned Microwave Communications Backbone
One link still to be completed
Manawatu Kairanga-Pascal St Protection Comms Completed
Various Review/upgrade communications to facilitate interrogation of modern relays.
Completed
Various Install time-synchronisation facilities to substations with modern protection relay equipment
In progress
Region Development ProjectStatus at February 2010
Description of Project Difficulties
Various Migrate Point-to-multipoint radio licensing system to land mobile
Completed
Various Review/upgrade data communication systems to allow interrogation of field devices and sharing of data on Corporate network
Completed
Taranaki Rationalise Waitara East and West Comms Under way as part of Dataterm replacement
Tauranga, Valley
Change older crystal controlled radio equipment to allow DNP3 Comms
Not started Dependent upon the migration to DNP3 proof of concept.
Manawatu Palmerston radio equipment replacements In progress
Valley Migrate voice comms to VHF In progress
All Implement SEL calling for VHF and UHF voice In progress
Table 5.11: FY2009/10 SCADA Project Status
Substation Development ProjectStatus at February 2010
Description of Project Difficulties
Various Line fault locators and RTUs / Communications
In progress
Various Line circuit breaker control upgrades In progress
Various Review/upgrade load control facilities In progress
Central Upgrade SCADA Master Station to open architecture and associated technology enhancements
Eastern done, Western conversion undergoing proof of concept
Migration is dependant on proof of concept
Wairarapa Upgrade Norfolk, Gladstone SCADA RTUs
Wanganui Fit new Taihape RTU Completed
Taranaki Migrate Cambria, Eltham, Inglewood and Transpower Stratford RTUs to DNP3
In progress
Wanganui Provide SCADA visibility of Transpower’s breakers at Brunswick and Wanganui GXPs
Cancelled because of the MS to MS interface project
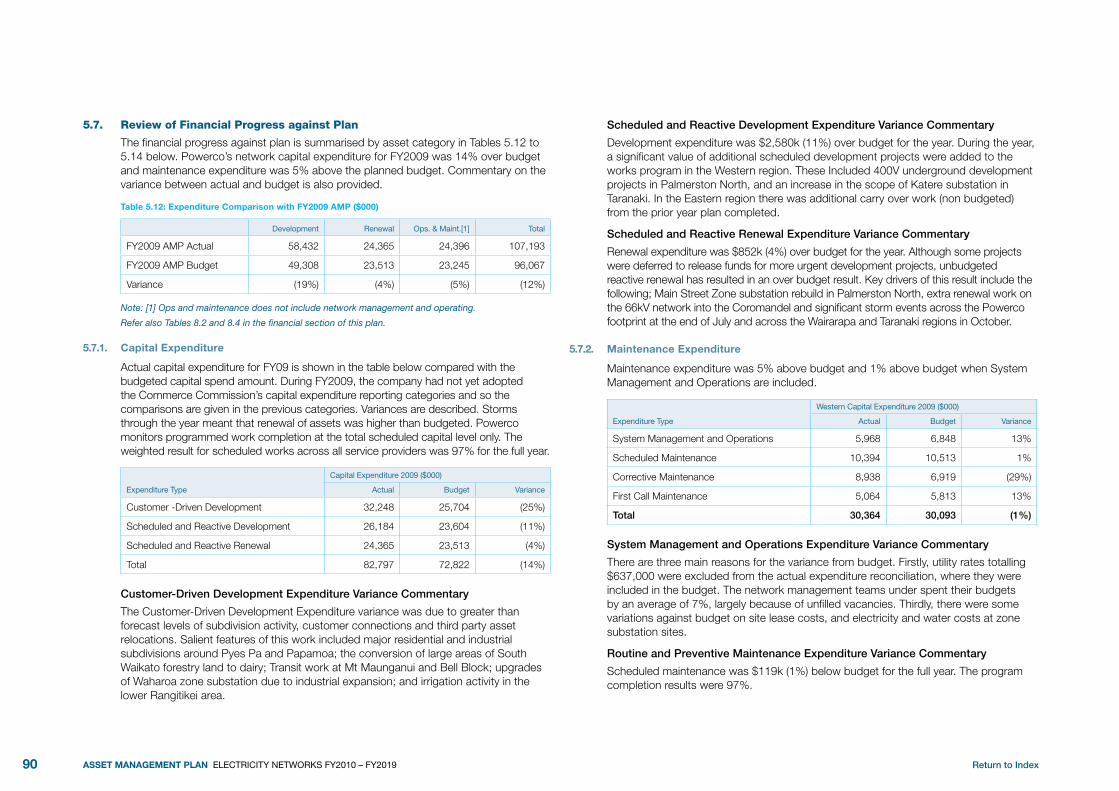
Return to Index90 ASSET MANAGEMENT PLAN ELECTRICITY NETWORKS FY2010 – FY2019
Review of financial Progress against Plan5.7.
The financial progress against plan is summarised by asset category in Tables 5.12 to 5.14 below. Powerco’s network capital expenditure for FY2009 was 14% over budget and maintenance expenditure was 5% above the planned budget. Commentary on the variance between actual and budget is also provided.
Table 5.12: Expenditure Comparison with FY2009 AMP ($000)
Development Renewal Ops. & Maint.[1] Total
FY2009 AMP Actual 58,432 24,365 24,396 107,193
FY2009 AMP Budget 49,308 23,513 23,245 96,067
Variance (19%) (4%) (5%) (12%)
Note: [1] Ops and maintenance does not include network management and operating.
Refer also Tables 8.2 and 8.4 in the financial section of this plan.
Capital Expenditure5.7.1.
Actual capital expenditure for FY09 is shown in the table below compared with the budgeted capital spend amount. During FY2009, the company had not yet adopted the Commerce Commission’s capital expenditure reporting categories and so the comparisons are given in the previous categories. Variances are described. Storms through the year meant that renewal of assets was higher than budgeted. Powerco monitors programmed work completion at the total scheduled capital level only. The weighted result for scheduled works across all service providers was 97% for the full year.
Expenditure Type
Capital Expenditure 2009 ($000)
Actual Budget Variance
Customer -Driven Development 32,248 25,704 (25%)
Scheduled and Reactive Development 26,184 23,604 (11%)
Scheduled and Reactive Renewal 24,365 23,513 (4%)
Total 82,797 72,822 (14%)
Customer-Driven Development Expenditure Variance Commentary
The Customer-Driven Development Expenditure variance was due to greater than forecast levels of subdivision activity, customer connections and third party asset relocations. Salient features of this work included major residential and industrial subdivisions around Pyes Pa and Papamoa; the conversion of large areas of South Waikato forestry land to dairy; Transit work at Mt Maunganui and Bell Block; upgrades of Waharoa zone substation due to industrial expansion; and irrigation activity in the lower Rangitikei area.
Scheduled and Reactive Development Expenditure Variance Commentary
Development expenditure was $2,580k (11%) over budget for the year. During the year, a significant value of additional scheduled development projects were added to the works program in the Western region. These Included 400V underground development projects in Palmerston North, and an increase in the scope of Katere substation in Taranaki. In the Eastern region there was additional carry over work (non budgeted) from the prior year plan completed.
Scheduled and Reactive Renewal Expenditure Variance Commentary
Renewal expenditure was $852k (4%) over budget for the year. Although some projects were deferred to release funds for more urgent development projects, unbudgeted reactive renewal has resulted in an over budget result. Key drivers of this result include the following; Main Street Zone substation rebuild in Palmerston North, extra renewal work on the 66kV network into the Coromandel and significant storm events across the Powerco footprint at the end of July and across the Wairarapa and Taranaki regions in October.
Maintenance Expenditure5.7.2.
Maintenance expenditure was 5% above budget and 1% above budget when System Management and Operations are included.
Expenditure Type
Western Capital Expenditure 2009 ($000)
Actual Budget Variance
System Management and Operations 5,968 6,848 13%
Scheduled Maintenance 10,394 10,513 1%
Corrective Maintenance 8,938 6,919 (29%)
First Call Maintenance 5,064 5,813 13%
Total 30,364 30,093 (1%)
System Management and Operations Expenditure Variance Commentary
There are three main reasons for the variance from budget. Firstly, utility rates totalling $637,000 were excluded from the actual expenditure reconciliation, where they were included in the budget. The network management teams under spent their budgets by an average of 7%, largely because of unfilled vacancies. Thirdly, there were some variations against budget on site lease costs, and electricity and water costs at zone substation sites.
Routine and Preventive Maintenance Expenditure Variance Commentary
Scheduled maintenance was $119k (1%) below budget for the full year. The program completion results were 97%.
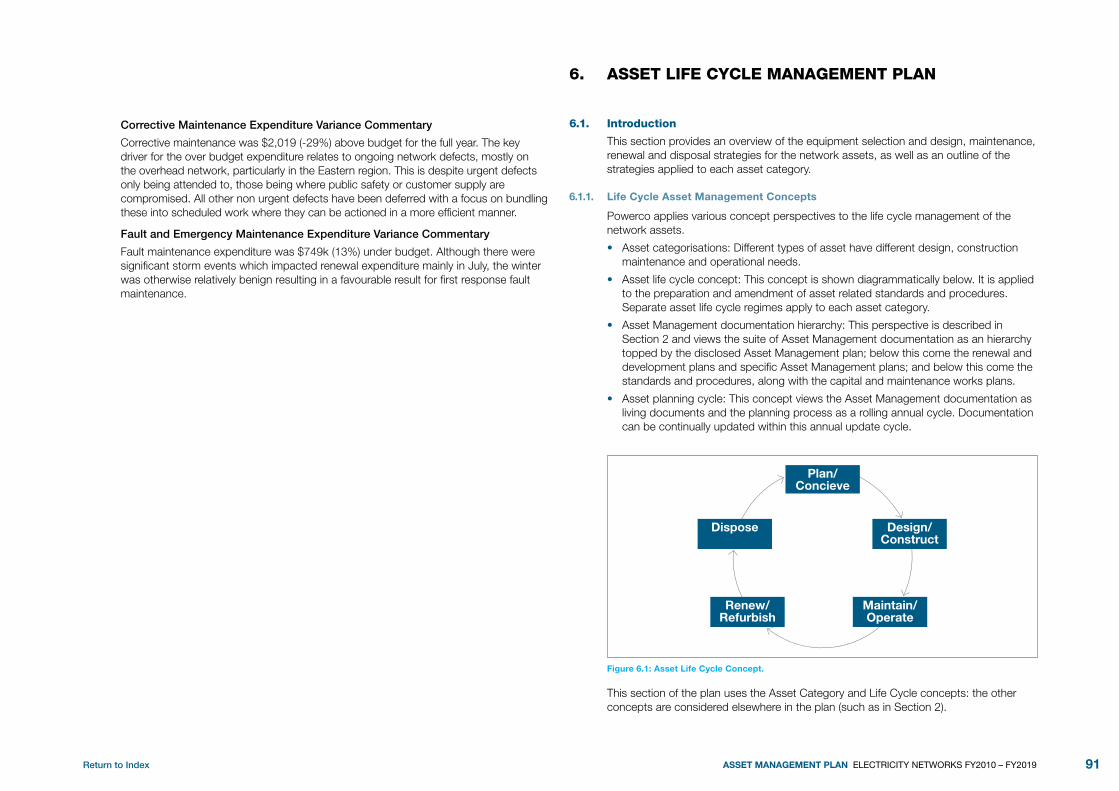
Return to Index 91ASSET MANAGEMENT PLAN ELECTRICITY NETWORKS FY2010 – FY2019
Corrective Maintenance Expenditure Variance Commentary
Corrective maintenance was $2,019 (-29%) above budget for the full year. The key driver for the over budget expenditure relates to ongoing network defects, mostly on the overhead network, particularly in the Eastern region. This is despite urgent defects only being attended to, those being where public safety or customer supply are compromised. All other non urgent defects have been deferred with a focus on bundling these into scheduled work where they can be actioned in a more efficient manner.
Fault and Emergency Maintenance Expenditure Variance Commentary
Fault maintenance expenditure was $749k (13%) under budget. Although there were significant storm events which impacted renewal expenditure mainly in July, the winter was otherwise relatively benign resulting in a favourable result for first response fault maintenance.
ASSET LIfE CYCLE MAnAgEMEnT PLAn6.
Introduction6.1.
This section provides an overview of the equipment selection and design, maintenance, renewal and disposal strategies for the network assets, as well as an outline of the strategies applied to each asset category.
Life Cycle Asset Management Concepts 6.1.1.
Powerco applies various concept perspectives to the life cycle management of the network assets.
Asset categorisations: Different types of asset have different design, construction •maintenance and operational needs.
Asset life cycle concept: This concept is shown diagrammatically below. It is applied •to the preparation and amendment of asset related standards and procedures. Separate asset life cycle regimes apply to each asset category.
Asset Management documentation hierarchy: This perspective is described in •Section 2 and views the suite of Asset Management documentation as an hierarchy topped by the disclosed Asset Management plan; below this come the renewal and development plans and specific Asset Management plans; and below this come the standards and procedures, along with the capital and maintenance works plans.
Asset planning cycle: This concept views the Asset Management documentation as •living documents and the planning process as a rolling annual cycle. Documentation can be continually updated within this annual update cycle.
Plan/Concieve
Design/Construct
Maintain/Operate
Renew/Refurbish
Dispose
Figure 6.1: Asset Life Cycle Concept.
This section of the plan uses the Asset Category and Life Cycle concepts: the other concepts are considered elsewhere in the plan (such as in Section 2).

Return to Index92 ASSET MANAGEMENT PLAN ELECTRICITY NETWORKS FY2010 – FY2019
Network Standards Philosophy6.1.2.
Powerco’s Network Standards set the requirements for the design and construction of equipment, particularly those that we use a lot of, like poles, cable, pipe and transformers. Our standards also set out our requirements for maintenance inspections and servicing, and guidelines for the overhaul of equipment. They also set out our specification requirements when purchases are being made by contract field staff on Powerco’s behalf.
The standards reflect the range of different contractor drivers in place across Powerco’s network. Most field work is done through alliance contract arrangements and the purpose of the standards is partly to assist and train field staff. Some work is fully contestable (such as Customer Initiated Work) and standards reflect a need to prevent corner-cutting while not disallowing new ways of doing things.
The standards are reviewed nominally on three-year cycles, although more regularly when needed. Standards become applicable, only once they are issued into Powerco’s Business Management System (a controlled documentation filing system). Once issued into the BMS, the documents may also be confirmed for entry to the on-line Contract Works Manual (CWM). The CWM is a password protected application that contains all of the documents necessary for work on the networks. Changes to standards are highlighted at annual roadshows and workshops held across the network area. These events are generally attended by senior representatives of contract field staff.
The structure of the standards is based on an asset life cycle concept with each asset type being considered from an asset life cycle perspective. Asset specifications are prepared with working committees involving field and engineering staff. It is assumed that those using the standard have experience in doing the work that the standard is about.
Functional Standards Prescriptive Standards
Functional Prescriptive Continuum
Presently our contractors desire more prescription
Earlier position – more functional than presciptive
Our desired Position
Figure 6.2: Functional Prescriptive Standards Continuum.
An area of consistent debate is around striking the best balance between functionality and prescription in the standards. Standards road shows indicate that contractors now have a preference for prescriptive standards. From the 1990s and into the earlier part of the 2000s, functional standards had been preferred because these could give contract field staff greater autonomy for innovative solutions. However, we are finding that contract staff now need more guidance to do the work right. Therefore we are trying to increase the level of prescription in our standards without hamstringing our contractors.
Network Standards Status6.1.3.
The standards and policies follow a continuous improvement process whereby the standards are challenged as they are used. Input to the standards preparation and update process can arise during the semi-regular standards road shows, through the field work audit process or if anyone has a new idea that should be tried out.
Figure 6.3 shows a status summary of the standards by asset category and by asset life cycle stage. The blue areas represent standards that are well developed and where the work of field staff is well aligned with the standard. The green areas represent standards that are still becoming well developed, while the yellow-coloured areas represent areas where policy development work is under way.
Plan ConceiveDesign
Construct Maintain Operate Dispose
Electricity
Overhead Lines
Underground Cables
Distribution Txfrs
Distribution Sgear
Zone Substations
Development under way Well developed Standard not yet developed
Figure 6.3: Standards Development Status Summary.
Asset Conception, design and Specification6.2.
The conception part of the asset life cycle concerns the process of planning for a new asset. From a renewal perspective, this is covered under Section 6.4.
Most design work is performed by Powerco’s contractors in line with Powerco’s Contract Works Manual. This is a suite of design, construction and maintenance policy documents available on line to approved contractors and consultants. These are continually reviewed and updated, and the nominal three-year rolling review is most often preceded.

Return to Index 93ASSET MANAGEMENT PLAN ELECTRICITY NETWORKS FY2010 – FY2019
Safety Through Design is a key philosophy applied throughout the standards updating process. Every technical standard is progressively being updated to include recognition of Health and Safety, Environmental, Risk Identification and Risk Management requirements.
Powerco is revising its equipment selection policy. In short, this requires all materials and equipment used on Powerco’s electricity network to comply with:
Applicable legislation – Regulations and Codes of Practice; •
Safety Manual – Electricity Industry (latest versions of SM-EI, Parts 1, 2 and 3) and •Safe Practices for Low-voltage Electrical Work;
Powerco Asset Management Plans;•
Powerco’s Contracts Works manual; and•
In the absence of a technical standard, then equipment and materials compliant with •NZS and AS, NZ Codes of Practice, IEC or IEEE may be used (generally external standards are only valid when they are referenced directly within a Powerco standard).
A key area that Powerco is working on is the alignment of activity to the standards across the organisation.
Powerco has split its approach to asset specification into three classes as set out below. Powerco’s Service Providers have full discretion to select Class B and Class C items as long as they comply with the equipment specifications.
Class A – Item-Focused Equipment6.2.1.
Class A is an Item-Focused group of materials and equipment. Items within this class are regarded as being critical to supporting the reliability and performance of their respective networks. Examples of Class A equipment are as follows:
33kV and 11kV switchgear
Power transformers
Distribution ground-mounted switchgear (RMUs)
Protection relays
Class A equipment must be chosen from specific type lists within standards published in Powerco’s on-line Contracts Works Manual. Specialist Network Advisory Teams (NATs) help management decide on the composition of those lists. No Powerco Service Provider discretion is allowed when choosing these items.
Class B – Standards-Focused Equipment6.2.2.
Class B is a Standards-Focused group of materials and equipment. These items of equipment can be chosen in compliance with standards published within Powerco’s online Contract Works Manual. Examples of Class B equipment include overhead conductors, underground cable, poles, cross-arms, distribution transformers and surge arresters.
Class C – Functionality-Focused Equipment6.2.3.
This is a Functionality-Focused group of materials and equipment. Class C items can be selected in compliance with functional requirements published within Powerco’s online Contract Works Manual. Examples of Class C equipment types include bolts, cross-arm braces, LV fuses and disconnector units and LV fuse pillars/cubicles.
Class Exceptions6.2.4.
From time to time, some items arise that can be categorised into one or more classes. These exceptions are clearly noted within the relevant Powerco standards.
Class AItem Focused
Items approved for use by NAT Focus Group. Service Providers choose items from list
Published in Powerco’s Material standards. No Service provider Discretion
Class BStandards Focused
Service Providers choose items
in compliance with Technical
Requirements detailed in Material
standards (e.g. 393S013)
Class CFunctionality Focused
Service Providers choose items in compliance with Functional Requirements
detailed in Material standards (e.g.
393S013)
Acts & Regulations
Powerco driven Policies, AMP’s
Standards & Specifcations
Figure 6.4: Equipment Specification Classes.
Maintenance Strategy 6.3.
Determining Maintenance Strategy6.3.1.
Maintenance strategy is recorded in the Electricity Network Asset Life Cycle Plan. The objective of the maintenance planning process is to determine the most cost-effective method for managing the levels of network risk and allowing the network assets to achieve their expected level of service potential.

Return to Index94 ASSET MANAGEMENT PLAN ELECTRICITY NETWORKS FY2010 – FY2019
A risk analysis has been conducted for each asset category and from this an inspection regime has been developed. A summary of the types of maintenance performed for each general type of asset has been included.
Risk management analysis is used to determine the type and effects of maintenance through:
Identifying all hazards that present a risk to the asset performing its intended •function;
Conducting a Failure Mode and Effects Analysis (FMEA). In performing the FMEA, •the maintenance that can be performed to reduce or eliminate the consequences of the failure is reviewed and the type of maintenance is selected; and
Determining the cost of the maintenance or renewal, cost of failure and selecting a •maintenance or renewal type that provides a positive EUAW return.
Powerco’s maintenance and renewal policy is based on balancing the cost of inspections, servicing and renewal, against the consequences of failure. Premature or too-frequent servicing and refurbishment unnecessarily increase maintenance costs, while servicing delayed too long can increase the risk of failure and generally increase the servicing costs overall. Age-based maintenance and renewal provide a conservative approach and may result in the potential for high asset investment costs due to premature replacements.
Practical factors affect the maintenance management balance: for example, a condition or reliability-based maintenance approach puts heavy onus on the effectiveness of the maintenance management systems. In the distribution industry, with hundreds of thousands of assets, a time-based maintenance approach reduces system complexity to work satisfactorily. Similarly, a time-based approach may better foster maintenance task scale benefits.
Maintenance Work Types6.3.2.
Powerco’s maintenance work comprises the following elements:
Maintenance management and maintenance planning;•
Routine inspections and condition assessments;•
Routine servicing;•
Non-routine servicing (overhauls); •
Fault first response, callouts;•
Asset relocations (where an asset is simply moved and not replaced);•
Evaluation of inspection and condition monitoring results to determine any •maintenance or renewal requirements (this may be performed in the field at the time of inspection/condition monitoring or later by engineering staff);
Evaluating faults to predict maintenance or renewal requirements; •
Performing corrective maintenance or renewal as a result of the above; and•
Service disconnections.•
Inspection and Condition Assessments6.3.3.
Powerco has developed specific routine inspection requirements for each asset type. These requirements are based on a combination of manufacturer’s recommendations, industry practice and Powerco’s own experience. Powerco’s experience is based on asset type, duty, incidence of faults and the operating environment.
The frequency of the inspection and condition monitoring is based on the expected “lead time to failure” (LTF). The LTF is the time between the asset deterioration detection and the point of failure. Routine inspection work is scheduled from the date of the last inspection to fall within the LTF.
Greater emphasis is being placed on non-invasive diagnostic testing wherever practical. This work involves the adoption of new technology through the chemical analysis of transformer and switch oils, the use of infrared cameras, ultra-sound discharge detection, partial discharge and other techniques. In particular, all Kinleith mill transformers above 500kVA and smaller units of particular importance have oil samples taken at least every year for dissolved gas analysis. If previous tests indicate that a unit is deteriorating the sampling period is shortened. Any units that show a deteriorating trend are either scheduled for a planned outage or have a full transformer condition assessment carried out.
Powerco’s contractors have a responsibility to report defects observed while in the field. This defect information may be used to initiate inspections or maintenance.
A maintenance plan is prepared annually that outlines the scheduled maintenance tasks, the number of assets that each task applies to, the frequency and the allowed budget. Corrective Maintenance and Fault Response tasks are included as line items in the plan to which budget buckets are assigned.
Asset condition information is being logged in the maintenance management system and this information will be useful for scheduling future renewal and corrective maintenance activities. The scheduling and execution of distribution network condition monitoring and maintenance is co-ordinated across the asset base to minimise cost and avoid duplication of travelling. The detailed maintenance schedules are not included in this plan.
Powerco is presently developing a format of recording asset maintenance and condition assessment parameters in a mobility regime. Maintenance and condition parameters will be logged in hand-held loggers for downloading to a computer maintenance management system.

Return to Index 95ASSET MANAGEMENT PLAN ELECTRICITY NETWORKS FY2010 – FY2019
Routine Servicing6.3.4.
Routine servicing is prescribed where condition-based monitoring is not practical or possible. The application of these techniques is based on a combination of manufacturer’s recommendations, industry practice and Powerco’s own experience. Routine servicing work is generally scheduled from the date of the last service.
Evaluation of Condition Monitoring Results6.3.5.
The results of inspection and condition monitoring are analysed by specialist service providers or by Powerco engineers. The type and extent of maintenance prescribed, or total asset replacement, will depend on results.
Evaluation of Faults and Monitoring Reliability (Reliability Driven Renewal)6.3.6.
In addition to routine servicing, Powerco undertakes Reliability Driven Renewal and this is achieved using the following techniques:
Evaluation of the type of faults occurring in a particular area of the network or on a •particular type of equipment can provide information on how to prevent the faults from recurring. Appropriate maintenance can then be applied to prevent or eliminate further faults. The type of maintenance or renewal prescribed will depend on the type of failure mode. The review of the types of faults typically occurs six-monthly over a two- to three-year window to determine asset service levels and trends
Evaluation of individual feeder performance indices is carried out over a rolling •12-month window. Condition monitoring work will be initiated on feeders with poor reliability. The type of condition monitoring and the resulting maintenance or renewal would be dependent on the nature of the unreliability.
Fault First Response and Call Outs6.3.7.
Fault callouts arise where a third party advises that the level of service is not normal, resulting in a need to investigate and attempt to repair if possible. If repair is not simple, the problem becomes one of corrective maintenance or renewal.
Corrective Maintenance6.3.8.
As a result of fault callout, condition monitoring or fault analysis, corrective maintenance may be required. The type of maintenance carried out will depend on the results of the investigation and evaluation. Where the relationship between the condition monitoring and type of maintenance required is known this is described in the maintenance plans that follow.
Where the condition monitoring indicates that an asset needs replacement or refurbishment, this is typically scheduled to co-ordinate with other planned work in the area. In the case of large customers, particularly Kinleith, work is programmed to coincide with plant maintenance shutdowns. General criteria for asset replacement have been defined in Section 6.4.
Individual Asset Life Cycle Plans6.3.9.
Individual asset life cycle plans have been prepared for each asset type. These identify the inspection regimes and their frequencies, along with their associated corrective and renewal programmes. They are described in overview in Sections 6.6 to 6.10 and in more detail in Powerco’s Asset Life Cycle Plan and Powerco’s Maintenance Standards for each main asset type.
Maintenance Management System6.3.10.
A significant Information Systems project (Project GEM) has been under way to convert Powerco’s many maintenance management systems into one JD Edwards system. This project aims to streamline the existing maintenance management process and bring about greater effectiveness in maintenance information reporting. The introduction of mobility solutions to network inspections was at the time of writing about to begin.
Asset Renewal Strategy6.4.
Asset Renewal Strategic Themes6.4.1.
Powerco’s scheduled asset renewal strategy encompasses three main themes, each of which is appropriate for the different asset types.
A run to failure strategy is applied to assets where the consequences of failure are not major and where the costs of ongoing condition monitoring may outweigh the costs of failure. This strategy is applied to equipment such as small pole-mounted distribution transformers, underground distribution feeder cable spurs, LV cables, expulsive fuses and surge arresters.
A risk and condition based replacement strategy is applied where there is a significant implication due to failure, such as major health and safety risk, significant reliability of supply consequence or a major expense in repair. This strategy is applied where ongoing condition inspections are needed to comply with regulations or where the costs of condition monitoring are small compared with the costs associated with failure. It is applied to equipment such as poles, cross-arms, important distribution feeder cables and zone substation transformers.
An age and obsolescence based replacement strategy is applied to assets with a high level of technical complexity or a high level of interconnectedness with other network assets (that is, the operation of a system as a whole is dependent on the integrity of several assets. It includes the need to replace equipment because of availability of spares, or for standardisation or changes in technology. This strategy is applied to equipment such as zone substation switchgear, SCADA equipment and protection relays.
Reactive renewal strategies are based around the need to renew assets that have failed and need to be replaced in a short time or to renew assets with a high imminent risk of failure.

Return to Index96 ASSET MANAGEMENT PLAN ELECTRICITY NETWORKS FY2010 – FY2019
Asset Type Sub
tran
smis
sion
Cab
leS
ub tr
ansm
issi
on L
ine
Sub
tran
smis
sion
Isol
ator
sZ
one
Sub
Tra
nsfo
rmer
sZ
one
Sub
Sw
itchg
ear
- m
in o
ilZ
one
Sub
Sw
itchg
ear
- O
ther
Zon
e S
ub S
witc
hgea
r -
11kV
Out
doo
r B
usb
ars
& S
truc
ture
sD
istr
ibut
ion
Feed
er c
able
sLV
Cab
les
Dis
trib
utio
n Li
nes
Dis
trib
utio
n C
ircui
t Bre
aker
sG
roun
d M
ount
ed S
witc
hgea
rO
verh
ead
Dis
trib
utio
n S
witc
hgea
rD
istr
ibut
ion
AB
SO
verh
ead
Exp
ulsi
on F
uses
Gro
und
Mou
nted
Tra
nsfo
rmer
Pol
e M
ount
ed T
rans
form
erD
istr
ibut
ion
Box
es a
nd P
illar
sS
urge
Arr
este
rsS
CA
DA
RTU
Out
stat
ion
SC
AD
A D
C S
yste
ms
Zon
e S
ubst
atio
n D
C S
yste
ms
SC
AD
A M
SP
rote
ctio
n R
elay
sIn
stru
men
t Tra
nsfo
rmer
sE
arth
ing
Sys
tem
sR
ipp
le In
ject
ion
Pla
nts
Pol
e M
ount
ed C
apac
itor
Zon
e S
ubst
atio
n B
uild
ings
& F
ence
s11
kV G
roun
d M
ount
ed J
Bs
Bac
k up
Die
sel G
ener
ator
sD
istr
ibut
ion
Volta
ge R
egul
ator
s
Run to Failure
Risk & Condition
Not
e A
Age & Obsolescence
Notes A - Distribution cables replaced on Risk & Condition where known.B - Any asset can be replaced reactively if it fails in service.
Figure 6.5: Renewal Strategy by Asset Type
Asset Renewal Timing – Renewal versus Maintenance6.4.2.
The question of when to maintain an old asset and when to replace it with new frequently arises when maintenance and renewal strategy is set. CIGRE Technical Brochure 353 (WG B2.13) offers some guidance by outlining the theoretical optimum time to renew assets. While the context of the brochure is electricity transmission, the theory applies equally well in the distribution context.
An asset’s economic end of life is relevant in the context of network assets. Usually technical end of life occurs when an item of equipment fails to perform within the normal operating requirements and is no longer fit for its original purpose. However, it may be economic to replace an asset before its technical end of life, or to repair an asset that has reached its technical end of life.
In an asset renewal decision, there are typically two options: one to replace the asset (blue curve in Figure 6.6) and the other to continue maintaining the asset (red curve). In the case of replacing the asset, there is a step change in expenditure due to the replacement followed by a continued maintenance cost. In the case of continuing to maintain an existing asset, there is a continued but rising maintenance cost due to the early stages of asset deterioration and increased maintenance activities, followed by an accelerated and increasing recurrent maintenance cost.
Renew existing asset Continue maintaining
LRMC existing asset renewal LRMC delayed renewal
Best Timing for Asset Renewal
NP
V o
f ass
et c
ost
Time from present (yr)
Optimum time to replace asset
Present
0 4
Figure 6.6: Theoretical Optimum Timing for Asset Renewal.
The optimum time for asset renewal (economic end of life) is when the long-run marginal costs of continued ownership are minimum, that is, where the slope of the green line (between point {0,0} and tangent to the renew asset cost curve) is minimum (the slope of this line represents the EUAW). In most cases, utilities do not have historical financial asset data and a mid-life cost analysis has to be done. The optimum time for undertaking the renewal project is where the marginal costs of the continued maintenance option equal the long run marginal costs of the renewal project. Therefore, in Figure 6.6, the optimum timing for the renewal project is where the red curve is tangential with the mauve LRMC line, which, in this example is in about six years’ time. In practice, this occurs when extraordinary maintenance starts to be needed to keep the asset functioning normally.
Powerco has built this theory into a process that resides in the Network Project Approval Memorandum template. To calculate the marginal cost of continued ownership and the life cycle cost of ownership of the new asset the following items are considered:
Risk of failure (annualised risk cost, including incidence of outages and customer •complaints);
Asset maintenance and operating costs;•
Health and safety risks;•
Asset disposal cost; and•
Asset market value (or asset purchase cost in the case of a new asset).•

Return to Index 97ASSET MANAGEMENT PLAN ELECTRICITY NETWORKS FY2010 – FY2019
Keep Asset Replace Asset
Yes
Yes
Note: The Asset may be redeployed Note: The original Asset is disposed
Yes
No
No
No
Marginal Cost of Ownership of Existing Asset < Marginal Cost of Ownership of New Asset?
Is refurbishment and/or redeployment economically feasible?
Significant Risk? (Reliability, Capacity, Safety ...)
Start
Figure 6.7: Asset Replacement Decision Process.
If there are significant over-riding risks, such as reliability (i.e. imminent failure), safety, environmental impact or capacity, a project economic analysis may not be necessary.
Asset Renewal Forecasting Process6.4.3.
The most accurate means of forecasting renewal needs for the network is through knowledge of the condition of the assets. A condition-based renewal programme is the most accurate for a period of around one to five years’ hence. Beyond this, renewal forecasts are best made using age profiles.
Renewal forecasting involves determining the quantity of assets needing renewal (renewal tasks) and the unit costs per renewal task. The forecast renewal expenditure equals the product of these two factors. The asset condition information is presently being compiled in the Maintenance Management system, and so the full extent of condition-based renewal needs is still in progress.
Estimates of condition-based renewal forecasts, calculated on the information available, have been entered into Powerco’s Improvement Register and an extract of the renewal expenditure needs from this is given in Section 9.
Age Profile-Based Renewal Forecasts 6.4.4.
Powerco uses age profile-based techniques for estimating the long-term trends in renewal needs for the network. Figure 6.8 shows the asset replacement profiles of different asset categories in ODV valuation replacement cost terms with a nine-year moving average. Further age profiles by asset category are shown in Sections 6.6 to 6.10.
Budgeted asset renewal expenditures can be somewhat different from expenditures estimated from age profiles alone. Actual asset renewals are generally driven by their condition rather than their age. Other criteria for replacing equipment include availability of spares, particularly in the case of switchgear and load control injection equipment, standardisation and changes in technology (which can arise in protection and SCADA equipment), latent defects and the present value costs of ongoing maintenance. In addition, some assets may not be able to reach their standard maximum lives due to third-party damage, road realignments, overhead line to underground conversions, higher asset degradation rates than expected or historically deferred maintenance.
The unit costs for the asset renewal tasks do not equate with the ODV unit costs, with the actual replacement costs significantly higher. This is partly because actual projects usually have a smaller scale than those assumed by the ODV replacement costs, partly because of the extra difficulties due to the need to maintain supply to existing customers, and partly because of the need to work around other services (such as hand-digging to co-ordinate with Telecom cables).
Additionally, raw material costs, including fabrication steel, electrical steel, aluminium, copper and oil, have fluctuated dramatically in recent years. This coupled with the recent falling exchange rate, means that the ODV replacement costs in the 2004 Valuation Handbook have risen on average by around 35 or 40%.
Thirdly, ODV replacement costs understate actual renewal expenditure needs because ODV valuations do not fully recognise the values of some asset categories (such as street lighting, service pillars and service connections).
As outlined in Section 4, the concept of capital efficiency links the expenditure on a project with its associated valuation uplift. When network assets are replaced, the associated expenditure is a multiple of the ODV. Approximate multiples by asset group are shown in Table 6.1.

Return to Index98 ASSET MANAGEMENT PLAN ELECTRICITY NETWORKS FY2010 – FY2019
Table 6.1: Asset Renewal Cost Multiples of ODV Unit Rates by Asset Categories
Asset Category
Capital Efficiency Factor
(multiple of ODV unit rate in 2004 valuation Handbook)
Overhead lines 2.9 (Actual range 2 to 6)
Underground cables 1.9
Distribution transformers 1.6
Distribution switchgear 1.6
Zone substation equipment 1.7
Notes:
Capital Efficiency Factor is the inverse of the Capital Efficiency ratio as outlined in Section 4.
Average simple pole replacement cost is $3500 but equivalent ODV uplift is $1350.
The source of the age profile information is Powerco’s GIS, Billing and ENS systems. These information systems have been queried as at June 2007 to form an access database from which the age profiles have been derived. The age profiles have used the same (or similar) queries as those that were used for the regulatory asset valuation in 2004.
Substations Switchgear Transformers
Underground Overhead
Total Asset Replacement Cost vs Age
Rep
lace
men
t C
ost
($00
0)
$0
$100,000
$80,000
$60,000
$40,000
$20,000
$120,000
Age (Years)
0 2 4 6 8 10
12
14
16
18
20
22
24
26
28
30
32
34
36
38
40
42
44
46
48
50
52
54
56
58
60
62
64
66
68
OD
L
Figure 6.8: Total Network Asset Age Profile.
Some delays may exist in the information flow from practical completion of an asset replacement task in the field through the information systems to the age profiles. For example, when a pole is replaced, there can be work-in-progress delays between the actual pole being replaced and the overall pole replacement project being completed.
In some instances, the date that an asset was installed was never recorded. This means that the ages of some assets have had to be estimated. Techniques for age estimation vary, but most rely on association with known ages of related assets. For example, if the age of a main feeder is not known, then associated customer service connections or switches can be used to estimate the age where they are known. In some isolated cases, estimates have had to be made from known dates of subdivisions.
The average total life of the network is in the order of 53 years (based on 2007 FRS3 valuation) and this indicates that, on average, the requirement for network renewal will be rising over the coming years. It is not likely, however, that the rate of renewal will increase as quickly as the age profile that drops away between 35 to 50 years of age because the asset lives comprise a spread about a mean, as indicated in Section 6.6, rather than a sharply defined life. Also assets like cross-arms need renewal at a line’s mid life. Instead the expectation is that the rate of increased renewal requirement will increase by the rate indicated by the gold line in Figure 6.9.
All Assets - Replacement Profile
Rep
lace
men
t C
ost
($00
0)
0
$40,000
$20,000
$60,000
$80,000
$100,000
$120,000
Year of Replacement (FY)
$140,000
2009
2010
2011
2012
2013
2014
2015
2016
2017
2018
2019
2020
2021
2022
2023
ODV Replacement Cost (June 2007 quantities in $2004 terms)
Current Replacement Cost (including $2004 to $2007 inflationfactor and capital efficiency factor)
9 year rolling average, Current Replacement Cost (including$2004 to $2007 inflation factor and capital efficiency factor)
50 Year Average (Current Replacement Cost) ($2007)
Renewal Budget (Real 2008$)
Figure 6.9: Total Network Asset Replacement Profile.
The asset age profiles are presented in real 2004 dollars (as per the Valuation Handbook). The current asset replacement profiles and expenditure forecast are in real December 2009 dollars ($ value at the time of writing).

Return to Index 99ASSET MANAGEMENT PLAN ELECTRICITY NETWORKS FY2010 – FY2019
Based on the gold “9 year rolling average, Current Replacement Cost” line, Figure 6.9 shows that the average renewal expenditure required over the next five years is between $50 and $70 million and that renewal expenditures will need to increase beyond this over coming years. The renewal budget on the graph (the green line) is in agreement with the total forecast renewal expenditure costs listed in Section 9. The large bars in 2009 represent equipment past its design life. The forecast renewal expenditure has been derived by trending up from the present level and increasing annually at a fixed percentage. The rate of increase chosen was 8.6%, reflecting the capability of service providers to increase capacity. This forecast expenditure ramps the funding up towards the “9 year rolling average, Current Replacement Cost” (the gold line). The gold line is above the present renewal expenditure (green line), indicating a present shortfall. This implies that a degree of deferral is happening, based on asset condition, that will eventually have to be caught up. At present, this shortfall is accommodated by the assets that are over design life but are still in serviceable condition, and to some extent by development work that includes renewal (or making up for renewal).
Although the revised renewal forecast is greater than that proposed in the FY2006 plan, and is moving towards the gold “9 year Average, Replacement Cost” line, it is plain that in the medium term, there is still a shortfall. Furthermore, the replacement profile graphs are based on a fixed asset life but, in reality the assets have a life that varies according to a probability function. Powerco has been doing work to define this probability function for different asset types using Weibull analysis. This is still work in progress, but the analysis shows that renewal activity should actually be higher than what the gold line represents. This is because the probability function flattens out the required renewal curve.
The level of expenditure proposed above, and later, attendance to the shortfall, will require agreement by two main stakeholders, namely, Powerco’s owner and the Regulator. The actual level of renewal work (i.e. expenditure) will be dependent on the individual project and annual budget justification, and in particular the treatment of the higher renewal costs (when compared with the ODV replacement costs) under the regulatory regime will be a critical factor in the justification. That is to say, should the regulatory regime not properly recognise the cost of renewal projects above ODV (and hence not properly allow for sustainable returns from capital expenditure on these projects), it would be difficult to justify undertaking this type of work. It is envisaged that the rules governing Powerco’s investment strategy and allowed financial return, must be addressed to reflect this forthcoming reality.
A consequence of not adequately investing in scheduled renewal is that asset renewal then has to be managed reactively. Powerco is constantly striving to ensure an appropriate balance between scheduled and reactive work. Reactive work tends to be associated with long supply outages to customers, increased health and safety risks, hasty network designs that can lead to short-term patches and future liabilities. These all lead to increased asset life cycle costs. Failure to proceed with adequate
network renewal approximately in line with the age profiles will significantly increase the likelihood that reliability of supply and safety levels will deteriorate.
Implications of the “Wall of Wire” 6.4.5.
Powerco is well aware of the “wall of wire” and has mentioned this in earlier plans. As the assets constructed during the post-war development period begin to reach the end of their life, the scale of renewal activity is expected to have to ramp up. This ramp-up of renewal activity is known by some as the “wall of wire”. It is a very significant challenge with:
Input (steel, copper, aluminium, oil and labour) costs fluctuating;•
The quantity of asset needing replacement increasing;•
The external pressure (regulated CPI-X and otherwise) to reduce price;•
The pressure to deliver better supply quality and maintain reliability;•
Contractor relationships and their ability to deliver the required service; and•
Increasing land access costs and environmental compliance.•
Having the need to invest in ageing electricity infrastructure properly recognised and catered for in the regulatory regime will be highly important for the future New Zealand economy. There are several actions that Powerco has under way in response to the wall of wire issue, described below.
Blitz approach to improve productivity – while the number of assets needing renewal is expected to increase (when assets are at their technical end of life, there isn’t a “do nothing” option), Powerco can control the costs of replacement by exploiting the benefits of large scale that are talked about in ODV replacement cost circles. By increasing the benefits of scale and bringing much replacement work together into one project, setting up and travel costs can be minimised. In this regard, there is a significant amount of work that can be bundled together by optimising the project size, including analysis of shut-down requests and project management activity. Powerco’s blitz approach aims to renew a section of line (between two switches) so that the line is given a clean bill of health for a 10-year period. In addition to the normal replacement, work done includes general maintenance on the line and a clean up of vegetation.
Optimising the renewal work done – when several lines need attention through their overall condition (that is nearing the end of life but not at end of life), the renewal work is then prioritised by mapping the recent fault history, along with the presence of equipment defects found during routine asset inspections. Lines with the highest concentration of faults and defects are given a higher priority in the works programmes.
Staff training perspective – While numbers of trainees have ramped up significantly in the past few years, no significant numbers of trainees entered either the electricity distribution industry for around 15 years. As the baby-boom generation of technical

Return to Index100 ASSET MANAGEMENT PLAN ELECTRICITY NETWORKS FY2010 – FY2019
staff will look to retire, or work shorter or more flexible hours, more onus will go on to the small number of young engineers and technical staff to keep the wheels of the energy distribution industry turning. The skills of technical and engineering staff take many years to build up and we need to be thinking now about future gaps in our technical staff resources at least 10 years forth so that we don’t end up with a gap in the skill set continuum.
At the same time, the quantity and complexity of electricity network work is expected to increase as the network continues ageing, as community expectations for greater supply reliability continue to increase, and as resource consent, regulatory and environmental requirements continue to get stricter. This means more work and continually greater demand for skilled staff.
To maintain status quo on numbers and skills for Powerco as an asset owner, a large number of trainees, comprising a mix of NDE-qualified and graduate trainees, need to enter the industry. Powerco is responding to this by taking on students and NDE cadets, building associations with universities and retaining good staff – efforts that are reflected in Powerco’s business plan as key requirements.
Supply continuity to marginally economic areas – A large part of Powerco’s network is remote rural. This brings challenges of its own, with lower customer density and increased costs required to continue supplying these areas.
Some of the remote rural network areas were constructed through subsidies to assist marginal rural areas to develop. Faced with the oncoming renewal of these lines, Powerco has been undertaking a fully consultative Remote Area Power Supply (RAPS) trial to investigate alternative power supply possibilities. The three main options for supply are: continued maintenance and renewal of the present line; a reduced capacity line such as SWER; or standalone systems including combinations of micro-hydro, solar panels and batteries, bottled LPG and diesel generation.
The study commenced mid-2006, when a sample site was selected and landowner agreement gained for the project. Generally speaking, the study is to investigate known supply options for the selected site, including technical, social and economic feasibility for each option. Various stakeholders are included as we work through the project and, to date, the work has included Powerco commercial and Asset Management staff, the landowner or customer, Federated Farmers, a remote area power supply specialist and Ministry of Economic Development staff.
In this instance, the stand-alone system was found to be economic and satisfied the requirements of the stakeholders. We envisage there will need to be a review conducted for each uneconomic line to determine the best method of supply when renewal is required. This type of work is expected to increase in the coming years as the renewal needs increase, with the certainty given through the amendment of the Electricity Act.
Renewal Investment Risks 6.4.6.
The potential reducing costs of technologies such as Photovoltaic Cells and batteries create risks to the investment in overhead line renewal, particularly those in remote rural areas. Customers in moderately sparsely populated areas may be more economically supplied by Remote Area Power Supplies leading to the risk of investments in conventional line technology being written down in value.
Historical Rates of Asset Replacement6.4.7.
Historical asset renewal rates provide a useful benchmark against present and forecast rates. Renewal expenditures back to FY2006 are outlined in Section 9. However, determining the historical rates of asset replacement to any degree of accuracy for the previous 10 years is not a particularly fruitful task. Extracts from GIS can provide the numbers of assets installed during the period, but do not identify the rates of replacement. Queries of historical work management systems are problematic because it is difficult to identify the underlying driver for each of the jobs.
Life Extension Practices6.4.8.
Various life extension techniques have been tried by Powerco, but apart from transformer refurbishment, these really apply to only specialised assets, and many of the techniques have had only limited degrees of success. These include:
Retrofitting of vacuum circuit-breakers to existing indoor switchgear at some sites. This effectively extends the life of a switchboard if the busbar, associated panelwork and cable terminations are in good condition. However, retrofitting tends to be expensive and often development-type drivers lead to the need to replace the switchboard with new.
Techniques for enhancing the useful life of underground cables have been trialled but not really pursued. These have involved injecting compounds into the cable to prevent the ingress of moisture. Powerco considers that specifying underground cables with water-blocking tapes and HD or MDPE outer sheath is a better all-round solution. This specification results in a slightly higher cost cable initially, but international studies show that cable life can be extended by 20 years.
Powerco has historically done some work to bandage poles where strength loss occurs just below the ground surface. Bandaging is usually good for an immediate deferment strategy but complete replacement is the ideal option. Some line companies have pinned their poles to achieve an extended life. Pinning involves inserting a steel plate into the ground next to the pole and bolting the above ground part of the pole to the plate. Generally, this technique has been used if a risk survey has been completed and the lines company has decided that quick action is needed. Pinning can buy time for pole replacement to happen. In our view, pinning is not an ideal practice and it is usually more cost effective to replace the entire poles.

Return to Index 101ASSET MANAGEMENT PLAN ELECTRICITY NETWORKS FY2010 – FY2019
Refurbishing distribution transformers is a way of achieving an extension of life. Refurbishment tends to be done on the larger indoor-mounted transformers, but for small pole-mounted transformers, refurbishment is usually not economic.
Redeployment, Upgrade and disposal of Existing Assets6.5.
Powerco is presently developing its policy on reusing second-hand materials, such as poles and conductors, and rotables, such as transformers.
Powerco is also updating its disposal policies in line with its Environmental strategy. It is not envisaged that any major network assets will need disposal that would have environmental consequences during the period covered by the plan.
Powerco does not anticipate disposing of any major network assets for the duration of the plan other than obsolete, superseded equipment, or equipment at the end of its economic life. Equipment that is redundant at a particular location will be maintained or refurbished and returned to service in an alternative location more appropriate to its capabilities, provided that it has sufficient life remaining for refurbishment to be economic. Any serviceable equipment that does not have a potential use within a reasonable period is disposed of.
overhead Lines6.6.
Individual Asset Life Cycle Plans6.6.1.
Individual asset life cycle plans have been prepared for the following overhead line asset types:
66 kV and 33kV subtransmission lines•
High-voltage distribution voltage and 400V distribution lines•
Frequencies of Overhead Line Inspections 6.6.2.
Circuit Inspection frequencies vary depending upon the criticality of the circuit. Subtransmission circuits are inspected annually, while distribution circuits are inspected at five-yearly intervals. Spur lines may be inspected at 10-yearly intervals.
Overhead Line Condition Monitoring and Maintenance Summary6.6.3.
The types of condition monitoring and maintenance carried out on overhead lines include:
Visual inspection of pole, conductor, cross-arm, insulators and ancillary equipment •at regular intervals;
Infrared scans, and detailed inspections of fittings on strategic feeders from bucket •truck;
RF inspection of insulators on strategic feeders;•
Scheduled replacement of cross-arms;•
Scheduled replacement of distribution surge arrestors;•
Vegetation management;•
Earth testing;•
Specific maintenance is carried out as a result of condition monitoring or reliability •assessment; and
Verification of conductor phase-to-earth clearances.•
Overhead Line Replacement Profile 6.6.4.
Overhead Line Replacement Profile
Rep
lace
men
t C
ost
($00
0)
$0 $10,000 $20,000
$30,000
$40,000
$50,000
$60,000
$70,000
$80,000
Year of Replacement (FY)ODV Replacement Cost (March 2009 quantities in $2004 terms) (includes midlife crossarms)
Current Replacement Cost (including 2.9 capital efficiency factor)
9 year rolling average, Current Replacement Cost (including 2.9 capital efficiency factor)
50 Year Average (Current Replacement Cost) ($2008)
Renewal Budget (Real 2009$)
2010
2011
2012
2013
2014
2015
2016
2017
2018
2019
2020
2021
2022
2023
2024
Figure 6.10: Overhead Line Replacement Profile.
Figure 6.10 shows a steadily increasing pole asset replacement cost each year. As mentioned in the commentary after Figure 6.8, Powerco has been doing work to better define the end-of-life probability functions for different asset types using Weibull analysis. This is still work in progress, but because the probability function flattens out the required renewal curve, renewal activity should actually be higher than what the gold line represents. The analysis can also point to design and construction technique improvements that we can focus on. Figure 6.11 shows typical probability distribution functions for different assets, as well as survivor curves for different types of poles. Of interest, prestressed poles (which could fail due to sudden shock or due to rough handling during installation) exhibit a fairly constant failure rate, whereas hardwood poles exhibit a more sharply defined end of life (due to deterioration of strength). These are points for consideration in our design policies.

Return to Index102 ASSET MANAGEMENT PLAN ELECTRICITY NETWORKS FY2010 – FY2019
0.07 1.0
0.8
0.6
0.4
0.2
000 10025 50 75 0 10025 50 75
0.02
0.01
0.03
0.04
0.05
0.06
Pro
bab
ility
Den
sity
for
End
of L
ife
Frac
tion
of P
oles
Sur
vivi
ng
Prestressed Reinforced
Softwood HardwoodAge (yr)Age (yr)
Figure 6.11: Sample Survivor and Probability Density Curves for Assets at End of Life.
There are several areas where poles may need replacement before the standard life due to unsatisfactory materials or manufacture. These include part of the Tauranga network, which was constructed using poles with top-load strength not clearly established, and some older concrete poles in the south Taranaki area, where some concrete poles were manufactured using sand anecdotally contaminated with sea salt. Softwood poles of certain species installed at various locations throughout Powerco’s network have been found to decay rapidly and are requiring early renewal. Conversely, some of the timbers used for cross-arms 50 years ago are still in good condition and in some cases are reported to still be of better quality than new cross-arms.
Normally, cross-arm replacement has to occur when the pole reaches its mid-life. In theory, this is recognised in lives and replacement costs assigned to network valuations, but in the case of the ODV (from which the age profiles have been derived) remaining life assessment is based on the age of the poles. This means that an extra mid-life allowance needs to be made for cross-arm replacement. This has been factored into the gold lines in the graphs in Figure 6.8 and 6.9.
Condition monitoring shows that most lines are in the condition expected for their age, although some in harsh coastal areas they have deteriorated more quickly than expected. Snow storms in recent years in the Taihape and Northern Manawatu region, and severe weather in Coromandel, have severely stressed some ageing assets. The renewal programme has been, and still is focussed in these regions. In the Eastern regions, many cross-arms require replacement. ACSR conductor corrosion is also influenced by the presence or lack of grease (some suppliers of this conductor have not offered grease in their conductors). The coastal environment causes corrosion to copper conductors. This reduces useful cross-sectional area affecting both conductivity
and strength, and is most noticed with smaller conductors. Some copper conductors have become work-hardened due to load cycling, wind movement, vibration and age.
Reliability Driven Renewal Philosophy6.6.5.
Network reliability is an important measure of the condition of overhead line equipment. The Network Performance process applies a control feedback loop to condition-driven network reliability issues. Reliability performance of feeders is monitored monthly and actions are tailored when reliability (in particular, faults due to defective equipment) is showing a worsening trend or is worse than what we would like it to be.
This is a reliability-driven renewal strategy and is proving to be very successful in terms of work efficiency, safety and reliability enhancement. It is recognised that renewal has the possibility of improving SAIDI, SAIFI and MAIFI and, as a minimum, does not deteriorate network reliability. Renewal is targeted to where reliability has the most potential for improvement and aims to prevent slippage or deterioration of SAIDI and SAIFI performance. Renewing the network from switch point to switch point, which includes the removal of known defects, ensures that unplanned outages due to defective equipment are minimised for a 10-year period.
Vegetation and other reliability impacts aside, as a line ages, its components begin to fail and this manifests as a worsening reliability (SAIDI and SAIFI) impact. The network performance process in action can be seen in Section 8. Reliability performance of feeders is monitored and reported on, with recommendations for corrective actions when reliability performance worsens. Worsening reliability performance can occur fairly rapidly. Over the space of two years a feeder can move from being a good performer to being a poor performer (Figure 6.12).
Theoretical Feeder Age Reliability Performance
Typical Feeder Age Reliability Performance
Feeder 1
1.2 2.5
2.0
1.5
1.0
0.5
0
0
0 4010 20 30 0 4010 20 30
0.2
0.4
0.6
0.8
1.0
SA
IDI
SA
IDI
Age (yr)Age (yr)
Crossarm replacement
Renewal work - eg Crossarm replacement
Reliability improvement - eg New Recloser
Feeder 2
Figure 6.12: Typical Reliability Performance as Feeders Age.

Return to Index 103ASSET MANAGEMENT PLAN ELECTRICITY NETWORKS FY2010 – FY2019
The reliability-based renewal programme is about maintaining the existing feeder supply reliability and, in essence, renewal work is done to restore the underlying reliability. Reliability improvement, on the other hand, is about improving the underlying feeder reliability. Improvements can be made through automation or by reducing the number of customers per feeder.
Figure 6.13 shows a case study highlighting the relationship between reliability and renewal work. Significant work was done in the Taihape area in 2004 and 2005 that saw reliability performance markedly improve. The graphs highlight that work will be needed in the near future to renew lines in the Motunui (Waitara) area and Pongaroa and Tinui areas (Wairarapa).
Zone Sub Station Unplanned outage SAIDI
SA
IDI M
inut
es
0
1.00
0.50
1.50
2.00
2.50
3.00
Year
3.50
2003 2004 2005 2006 2007 2008
Pongaroa Taihape Tinui Waitara East
Figure 6.13: Reliability Performance over Time by Zone.
With the oncoming wave of renewal needed, it is expected that reliability performance will worsen unless renewal activity is able to keep up. The overhead line age profile indicates that the average age of overhead line assets is increasing. To a certain extent it will be possible to mask this impact through implementation of automation, more fuses, reclosers and sectionalisation (although this may see a rise in momentary outages).
Powerco incl. storms Powerco excl. storms Powerco Target
Present Renewal Scenario Powerco Trendline (inclstorms) Powerco Trendline (exclstorms)
Forecast Powerco SAIDI Performance
SA
IDI (
Cla
ss B
+C
) min
utes
0
100
50
150
200
250
300
Year ending 31 March
350
2004 2005 2006 2007 2009 2010 20142013201220112008
Figure 6.14: Anticipated Increased SAIDI Performance Target.
If line companies are not given adequate encouragement to invest in overhead line renewal, the outcome will be that reliability will worsen and this will have to be reflected through increased reliability performance targets. This is shown in Figure 6.14 where the SAIDI target (violet line) will have to increase (brown line).
Subtransmission Line6.6.6.
Due to their importance in terms of reliability and security, these lines are maintained to a higher level than distribution lines. In general, the lines are in good condition for their age. The Coromandel 66kV subtransmission, network has reached the end of its useful life, with significant work completed to thermally upgrade the conductor, upgrade the conductor, and overhead reconstruction for poles and cross-arms. The problems encountered with renewing these lines are the difficult terrain and maintaining supply to end-use customers while the renewal work happens. Some samples of the ACSR conductors from the 33kV lines from Hawera to Patea, and Whareroa to Patea show internal corrosion, probably due to a lack of grease during manufacture.
Distribution Line6.6.7.
Condition monitoring shows that most lines are in the condition expected for their age, although some in harsh coastal areas have deteriorated more quickly than expected, and, due to economic and customer benefit, remote rural areas have received less attention. Steel core corrosion in ACSR conductors is a problem in coastal areas. Some all-aluminium conductors (AAC) have suffered severe corrosion and some older copper conductors have become work-hardened by wind movement and load cycling.

Return to Index104 ASSET MANAGEMENT PLAN ELECTRICITY NETWORKS FY2010 – FY2019
A tendency to fail has been noted on kidney strain insulators, although wholesale replacement is not considered justified. These insulators tend to be located on older wooden poles and programmed pole replacement will eventually phase them out.
Cross-arm and insulator replacement is being undertaken to maintain the condition of the overall line asset.
Low-Voltage Line6.6.8.
Similar condition comments apply as for Distribution (above). However, given the lesser security and reliability impacts of LV network compared to the above, Powerco’s response in this category tends to be more reactive, driven mainly by safety or customer initiated growth.
Underground Cables6.7.
Individual Asset Life Cycle Plans6.7.1.
Individual asset life cycle plans have been prepared for the following asset types:
Subtransmission cables•
Distribution and low-voltage cables•
Frequencies of Underground Circuit Inspections 6.7.2.
Circuit inspection frequencies vary depending upon the criticality of the circuit. Subtransmission circuits are inspected annually while distribution circuits are inspected at five-yearly intervals.
Underground Cable Network Condition Monitoring and Maintenance Summary6.7.3.
The types of condition monitoring and maintenance carried out on underground cables include:
Review of operating ratings to ensure that ratings are correct for various conditions. •This can be achieved by distributed temperature-sensing devices on some recently installed subtransmission cables;
Visual survey of subtransmission cable routes for possible damage points;•
Partial discharge tests on XLPE subtransmission cables;•
Continuous oil pressure monitoring;•
Routine sheath-to-earth resistance tests on subtransmission cables;•
Visual, infrared and RF inspection of terminations;•
Visual inspection of link and pillar boxes;•
On-line partial discharge testing of subtransmission cables; and•
Specific maintenance is carried out as a result of condition-monitoring or reliability •assessment.
Underground Cable Replacement Profile6.7.4.
Underground Cable Replacement Profile
Rep
lace
men
t C
ost
($00
0)
$0
$2,000
$4,000
$6,000
$8,000
$18,000
$16,000
$14,000
$12,000
$10,000
$20,000
Year of Replacement (FY)ODV Replacement Cost (March 2009 quantities in $2004 terms)
Current Replacement Cost (including 1.9 capital efficiency factor)
9 year rolling average, Current Replacement Cost (including 1.9 capital efficiency factor)
50 Year Average (Current Replacement Cost) ($2008)
2009 AMP Renewal Budget (Real 2009$)
2010
2011
2012
2013
2014
2015
2016
2017
2018
2019
2020
2021
2022
2023
2024
Figure 6.15: Underground Cable Replacement Profile.
Subtransmission and distribution cables are generally in good condition, commensurate with their age.
While the amount of underground cable requiring replacement due to age is •expected to increase steadily, there are several instances where cables need to be replaced before the end of their standard economic life. These include:
In Tauranga, where large-scale development has taken place, existing 25 sq mm •and 35 sq mm cables need to be replaced by 185 sq mm or 300 sq mm cables for capacity reasons. This is effectively small cable retired early;
Some early (early to mid 70s) XLPE-type distribution cables, particularly in •the Tauranga and Palmerston North areas, suffer from water-treeing and poor manufacturing, and are prone to failure. This type of cable was the standard at the time, however its selection for use varied from place to place and records are incomplete. The extent of the problem is difficult to quantify;
Unplanned defect replacement as a result of third-party excavations;•
Unplanned defect replacement as a result of poor quality jointing techniques, e.g. tin •can joints in Palmerston North area;

Return to Index 105ASSET MANAGEMENT PLAN ELECTRICITY NETWORKS FY2010 – FY2019
Route realignment for Transit and others;•
Consumer requirements;•
Link box and underground tee replacement (safety and reliability);•
Replacement due to repositioning of other assets (e.g. distribution substations); and•
Land subsidence, requiring the moving of cables to a secure area.•
While the standard total life applied to XLPE cables of 40 years may be reasonable for modern XLPE cable, it does appear that there is a statistical spread with some failing early and some not failing (yet), and that modern XLPE cable is much more robust than earlier types if specified and laid properly.
Subtransmission Cables6.7.5.
A section of 33kV cable in Tauranga was replaced because it had a failed screen. A project to install extra subtransmission cable capacity into the CBD is under way to cater for load growth and to relieve loading on the existing circuits.
The 33kV oil-filled cables in Palmerston North are around 40 years old. Design shortcomings in joints of the type used on these cables have been identified elsewhere and as a result of an investigation the cables have been derated to protect the joints. The cable circuits may need to be replaced prematurely if the cost of fault repairs becomes uneconomic.
Distribution Cables6.7.6.
Underground construction commenced in the 1950s. The early cables were paper-insulated lead-covered (PILC) type, which have a life expectancy of 70 years, provided they are not moved. Some early 11kV PILC cables in the New Plymouth area have brittle lead sheaths, prone to cracking. These cannot be moved, and where cables are grouped in a common trench, jointing is difficult.
Other cables that may require early replacement are aluminium XLPE cables installed in the late 1960s and 1970s. These were first-generation XLPE cables, manufactured using tape semi-conducting layers and water-curing. This, coupled with a lack of knowledge and subsequent poor handling of cables during installation, has resulted in some cable failures.
Early 11kV XLPE cables, installed prior to 1975 in the Tauranga area, especially smaller 25mm cables, have a tendency to fail, particularly in sympathy with a downstream fault. A replacement programme is proceeding for circuit segments where the reliability impact of a failure is expected to be significant. The problem appears to be due to poor installation methods, exposure to fault levels above their rating, and poor cable manufacturing.
In the CBDs of main centres such as Tauranga and Palmerston North, the sustained levels of load growth mean that many of the distribution cables have not had adequate capacity to provide a full N-1 security level. Whilst all supply was able to be restored in Palmerston North after the Main St substation fire in February 2006, the situation was aided by the benign weather conditions at the time, and feeder inter-tie projects have since been completed in response. Both CBD distribution networks are gradually and progressively being upgraded with new 300mm Al cable feeders.
Low-Voltage Cables6.7.7.
No significant amounts of 400V cable were installed prior to the 1950s. Early cables were PILC construction with a 70-year expected total life.
Powerco’s inspection of older 400V cables during excavation works indicates that they are not ageing more than expected. It is not expected that any significant replacement will be required this year except for some single-core aluminium conductor cable with only a single layer of insulation. It has been observed that insulation damage or breakdown allows ingress of water, which severely corrodes the aluminium conductor. Replacement is required well before the forecast replacement date. The incidence of cable faults is being monitored, and is the initiating indicator that replacement might be required.
distribution Transformers6.8.
Individual Asset Life Cycle Plans6.8.1.
Individual asset life cycle plans have been prepared for the following distribution transformer asset types:
Distribution voltage regulators•
Distribution transformers•
Earthing systems•
Frequencies of Inspections and Maintenance Activities6.8.2.
Distribution transformers and substation inspection frequencies depend on the size of transformer. Small pole-mounted transformers are inspected on five-yearly cycles concurrent with the circuit inspections. Ground-mounted transformers receive a six-monthly and five-yearly safety inspection, a five-year routine inspection and condition monitoring on a frequency determined by transformer capacity.

Return to Index106 ASSET MANAGEMENT PLAN ELECTRICITY NETWORKS FY2010 – FY2019
Distribution Transformer Condition Monitoring and Maintenance Summary6.8.3.
The types of conditions monitoring and maintenance carried out on distribution transformers include:
Inspect transformer enclosure condition and locks for security;•
Inspect transformer tank and general fittings;•
Check Maximum Demand Indicator if fitted;•
Oil testing (acidity, dielectric strength & moisture tests performed on transformers •>200 kVA at prescribed intervals unless the transformer is completely sealed);
Check and change breathers;•
Earth testing; and•
Specific maintenance is carried out as a result of condition monitoring or reliability •assessmen, and the transformer will be refurbished if physical and economic criteria are met.
Distribution Transformer Replacement Profile6.8.4.
Distribution Transformer Replacement Profile
Rep
lace
men
t C
ost
($00
0)
$0
$2,000
$4,000
$6,000
$8,000
$10,000
$12,000
Year of Replacement (FY)ODV Replacement Cost (March 2009 quantities in $2004 terms) (includes midlife crossarms)
Current Replacement Cost (including 1.6 capital efficiency factor)
9 year rolling average, Current Replacement Cost (including 1.6 capital efficiency factor)
50 Year Average (Current Replacement Cost) ($2008)
2009 AMP Renewal Budget (Real 2009$)
2010
2011
2012
2013
2014
2015
2016
2017
2018
2019
2020
2021
2022
2023
2024
Figure 6.16: Distribution Transformer Replacement Profile.
Figure 6.16 indicates that distribution transformer replacement costs are set to increase steadily. This is because of rapid network development in the pas, resulting in year-by-year increases in equipment being installed. This ageing profile is thought to be slightly pessimistic however, as the load cycles of some distribution transformers result in them lasting longer than their standard lives. However, our analysis so far shows that distribution transformers may exhibit a wider variation of the average standard life than other assets. Older transformers are lasting longer (due to tank material) than their more modern equivalents.
There are some instances where distribution transformers need to be replaced before their standard life. Examples of this include:
Replacement due to capacity change, where the age or condition of the changed •transformer makes its reuse uneconomic;
Asset replacement due to actual condition;•
Unplanned defect repairs as a result of third-party damage;•
Overhead transformer to pad-mount conversions due to seismic strength;•
Overhead line to underground conversions; •
Severe corrosion in harsh coastal environments; and•
Manufacturing defects (e.g. inadequate corrosion protection).•
Condition Overview6.8.5.
General condition monitoring shows that most transformers are in a condition that would be expected for their age, although some in harsh coastal areas have deteriorated faster than expected, and newer transformers are showing signs of tank deterioration at a much younger age than their older counterparts. The condition of urban ground-mounted transformers is monitored frequently to ensure both service performance and public safety.
Often the LV panel associated with the distribution substation needs to be replaced for capacity or safety reasons. A recent design change has been instigated to ensure that LV cable entry is not forced and to ensure the integrity of insulation on the terminations.
Due to the nature of the surrounding soil, earth banks often need to be upgraded.
Some distribution transformers are replaced on age, but much replacement is due to:
Fault or damage that leads to reactive renewal.•
Poor condition discovered on inspection. This may trigger immediate or deferred •renewal.
Increased load requirement. This is either because of underlying load growth or due •to a customer initiated project.
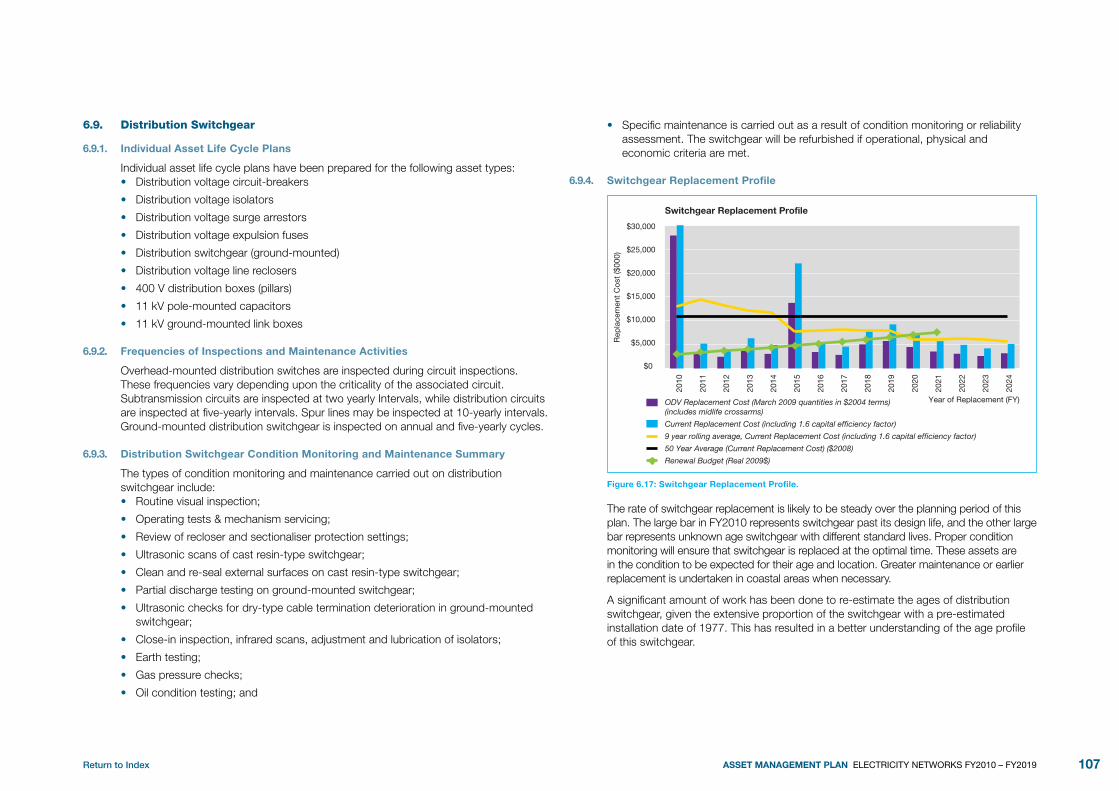
Return to Index 107ASSET MANAGEMENT PLAN ELECTRICITY NETWORKS FY2010 – FY2019
distribution Switchgear6.9.
Individual Asset Life Cycle Plans6.9.1.
Individual asset life cycle plans have been prepared for the following asset types:Distribution voltage circuit-breakers•
Distribution voltage isolators•
Distribution voltage surge arrestors•
Distribution voltage expulsion fuses•
Distribution switchgear (ground-mounted)•
Distribution voltage line reclosers•
400 V distribution boxes (pillars) •
11 kV pole-mounted capacitors•
11 kV ground-mounted link boxes•
Frequencies of Inspections and Maintenance Activities6.9.2.
Overhead-mounted distribution switches are inspected during circuit inspections. These frequencies vary depending upon the criticality of the associated circuit. Subtransmission circuits are inspected at two yearly Intervals, while distribution circuits are inspected at five-yearly intervals. Spur lines may be inspected at 10-yearly intervals. Ground-mounted distribution switchgear is inspected on annual and five-yearly cycles.
Distribution Switchgear Condition Monitoring and Maintenance Summary6.9.3.
The types of condition monitoring and maintenance carried out on distribution switchgear include:
Routine visual inspection;•
Operating tests & mechanism servicing;•
Review of recloser and sectionaliser protection settings;•
Ultrasonic scans of cast resin-type switchgear;•
Clean and re-seal external surfaces on cast resin-type switchgear;•
Partial discharge testing on ground-mounted switchgear;•
Ultrasonic checks for dry-type cable termination deterioration in ground-mounted •switchgear;
Close-in inspection, infrared scans, adjustment and lubrication of isolators;•
Earth testing;•
Gas pressure checks;•
Oil condition testing; and•
Specific maintenance is carried out as a result of condition monitoring or reliability •assessment. The switchgear will be refurbished if operational, physical and economic criteria are met.
Switchgear Replacement Profile6.9.4.
Switchgear Replacement Profile
Rep
lace
men
t C
ost
($00
0)
$0
$5,000
$10,000
$15,000
$20,000
$25,000
$30,000
Year of Replacement (FY)ODV Replacement Cost (March 2009 quantities in $2004 terms) (includes midlife crossarms)
Current Replacement Cost (including 1.6 capital efficiency factor)
9 year rolling average, Current Replacement Cost (including 1.6 capital efficiency factor)
50 Year Average (Current Replacement Cost) ($2008)
Renewal Budget (Real 2009$)
2010
2011
2012
2013
2014
2015
2016
2017
2018
2019
2020
2021
2022
2023
2024
Figure 6.17: Switchgear Replacement Profile.
The rate of switchgear replacement is likely to be steady over the planning period of this plan. The large bar in FY2010 represents switchgear past its design life, and the other large bar represents unknown age switchgear with different standard lives. Proper condition monitoring will ensure that switchgear is replaced at the optimal time. These assets are in the condition to be expected for their age and location. Greater maintenance or earlier replacement is undertaken in coastal areas when necessary.
A significant amount of work has been done to re-estimate the ages of distribution switchgear, given the extensive proportion of the switchgear with a pre-estimated installation date of 1977. This has resulted in a better understanding of the age profile of this switchgear.

Return to Index108 ASSET MANAGEMENT PLAN ELECTRICITY NETWORKS FY2010 – FY2019
There are occasions when switchgear needs to be replaced before its standard life. Examples include:
Asset replacement due to actual condition;•
Unplanned defect repairs as a result of third-party damage;•
Network reconfiguration to achieve operational flexibility, improved reliability or •efficiency; and
Replacement to remove safety hazards associated with the equipment. •
Most overhead switchgear replacement is reactive.•
The condition of urban ground-mounted switchgear is monitored frequently to ensure serviceability and public safety. Other than the exceptions noted below, these assets are in good condition as appropriate for their location and age.
Several failures of one type of oil-filled ring main unit have occurred because of apparent poor design, poor assembly or water ingress. Some remedial work has been carried out in accordance with the manufacturer’s instructions. Operating restrictions are in place for this switchgear, and a renewal programme has been established in advance of its design life.
A significant amount of Magnefix resin-insulated switchgear is in service, but the majority is in good condition and is housed in dry, clean environments. Replacement is planned only where the current rating is causing operating restrictions, deteriorated resin components are resulting in partial discharge, or where the units are open points between feeders.
The following types of switchgear are being targeted for replacement:
Remaining SD series 1;•
Magnefix (especially in high salt areas and in Tokoroa where fog causes partial •discharge); and
J2/ETV2 Long and Crawford and earlier models.•
The criticality of switchgear is considered when determining order of replacement, with units at feeder open points being viewed as most important.
A pilot programme has been carried out in the Western region to test the condition of oil-filled distribution switchgear. The results showed that the oil-filled switchgear population is generally in very good condition.
Air-break switches and fuse isolators are inspected periodically and repaired or replaced as problems are detected and no programme for replacing them is considered necessary. The age of many of them is not recorded, and they are serviced at intervals prescribed by Powerco’s Ground Mounted Switchgear Maintenance standard or when found faulty. They are replaced as found necessary but not systematically replaced.
Zone Substation Equipment6.10.
Individual Asset Life Cycle Plans6.10.1.
Individual asset life cycle plans have been prepared for the following asset types:
66/11kV power transformers•
33/11kV power transformers•
66 kV and 33kV circuit-breakers•
66kV and 33kV isolators•
33kV surge arrestors•
66 kV 33kV and 11kV busbars•
33kV and 11kV protection relays•
33kV instrument transformers•
Zone substation supply batteries and charging system•
Distribution voltage circuit-breakers•
DC supply systems•
SCADA remote terminal units•
Distribution voltage instrument transformers•
Earthing systems•
Zone substation buildings and security fences•
Frequencies of Inspections and Maintenance Activities6.10.2.
Zone substation equipment receives a three-month visual inspection with special inspections and maintenance generally being carried out at yearly, three-yearly, five-yearly and 10-yearly intervals.

Return to Index 109ASSET MANAGEMENT PLAN ELECTRICITY NETWORKS FY2010 – FY2019
Zone Substation Condition Monitoring and Maintenance Summary6.10.3.
The types of condition monitoring and maintenance performed on zone substation equipment include:
(a) Zone substation transformers and tapchangers:
Visual inspection for mechanical deterioration and damage•
Tap changer contact and mechanism maintenance•
Dehydrating breather maintenance•
Fans/pumps operational checks•
General operating tests and maintenance•
Oil tests (degree of polymerisation, dielectric strength, moisture, acidity)•
Insulation resistance/polarisation tests•
Infra-red scans•
(b) Circuit-breakers and switchboards:
Visual inspection for mechanical wear, damage and serviceability•
General operational tests and maintenance, monitor operational performance•
High-voltage test•
DC insulation test•
Contact resistance test•
Partial discharge condition monitoring•
(c) Inspection and testing is also conducted on ancillary items at zone substations, including:
Protection relays•
Instrument transformers•
Isolators•
SCADA remote terminal units•
Buswork and surge arrestors•
Batteries and charger•
Buildings, fences and enclosures•
Earthing system•
LVAC supply•
Zone Substation Replacement Profile6.10.4.
Zone Substation Replacement Profile
Rep
lace
men
t C
ost
($00
0)
$0
$2,000
$4,000
$5,000
$10,000
$40,000
$35,000
$30,000
$20,000
$15,000
$45,000
Year of Replacement (FY)ODV Replacement Cost (March 2009 quantities in $2004 terms)
Current Replacement Cost (including 1.9 capital efficiency factor)
9 year rolling average, Current Replacement Cost (including 1.9 capital efficiency factor)
50 Year Average (Current Replacement Cost) ($2008)
2009 AMP Renewal Budget (Real 2009$)
2010
2011
2012
2013
2014
2015
2016
2017
2018
2019
2020
2021
2022
2023
2024
Figure 6.18: Zone Substation Replacement Profile.
Figure 6.18 shows a large amount of equipment due for replacement in 2010. Most of this is load control equipment that is beyond its standard design life, and plans for its replacement are set out in Powerco’s Load Control Asset Management Plan. Two plants are programmed for installation in FYE 2010 and five in FYE 2011. The replacement cost bars on this graph assume that like is replaced with like. Because zone substation equipment is complicated, subordinate age profiles of zone substation and protection and control equipment are shown in Figures 6.20 to 6.27.
Zone substation equipment undergoes regular condition monitoring, and is replaced when its condition indicates that replacement is advisable. The figure indicates significant variation in replacement cost from year to year, and some replacement will have to be advanced or deferred to smooth out the capital requirement and workload.
Assets sometimes need to be replaced before their standard life. Reasons for this include:
Asset replacement due to actual condition;•
Reliability issues, including spares and ability to service;•
Replacement due to operational constraint or safety issues;•
Insulator/structure replacement in heavy pollution areas, or other environmental factors;•
Replace/reposition zone substation due to load changes;•
Environmental compliance issues.•

Return to Index110 ASSET MANAGEMENT PLAN ELECTRICITY NETWORKS FY2010 – FY2019
Zone Substation Switchgear 6.10.5.
Figure 6.19: 33kV Zone Substation Switchgear at Hamilton St.
There are about 200 33kV or 66kV circuit-breakers on Powerco’s networks, with ages ranging from new to 45 years. The standard life of these is 40 years for outdoor and 45 years for indoor. While it is expected that all of these are serviceable, lack of parts makes maintaining some of the older units difficult. Because of the large number installed between 1970 and 1985, which will reach their standard age between 2010 and 2025, some of the oldest units are programmed for replacement. Some of the withdrawn units are retained for spares to support in service units.
Many 11kV oil circuit-breakers, mostly Reyrolle LMT, were installed between 1960 and 1980. Reyrolle considers these to have a 25-year life, but their standard life is 45 years. Powerco’s experience is that circuit-breakers older than 45 years, while sometimes failing due to faulty auxiliary contacts, are still performing satisfactorily, and although no spare parts are available from the manufacturer, there are enough Reyrolle spare second-hand units around that maintaining them is not a problem.
Several older switchboards or individual circuit-breakers have been identified as requiring replacement due to condition, lack of earthing equipment or lack of replacement spare parts.
The 33kV and 11kV switchgear is inspected in conjunction with line, transformer or substation inspections. These assets are generally found in the condition to be expected for their age and location. Greater maintenance or earlier replacement is undertaken in coastal areas when necessary.
Figure 6.20 shows an age profile of zone substation switchgear (11kV, 33kV and 66kV switchgear). In this graph, the peaky bar of 25 to 30 years is because of unknown age switchgear and the low amount of switchgear in the new to five-year category is because the age profile results from ODV asset registers around three years old.
Zone Substation Switchgear
Rep
lace
men
t Cos
t ($0
00)
0
15 t
o 20
20 t
o 25
30 t
o 35
25 t
o 30
35 t
o 40
40 t
o 45
45 t
o 50
50 t
o 55
10 t
o 15
5 to
10
0 to
5
5,000
10,000
15,000
20,000
Age (years)
25,000
Focus to be on renewing these in
next five years
Figure 6.20: Age Profile for Zone Substation Switchgear.

Return to Index 111ASSET MANAGEMENT PLAN ELECTRICITY NETWORKS FY2010 – FY2019
Zone Transformers6.10.6.
Figure 6.21: Zone Substation Transformers at Te Puke.
Given the relatively small number of zone transformers, their high value and their condition being monitored by regular DGA testing, zone transformers will be replaced only when necessary. When a zone transformer does need to be renewed, a larger transformer is generally purchased and transformers are relocated or “trickled down” the network to allow more optimal utilisation. Aged transformers are retired to sites of low supply risk (refer to Section 7.8.4). This strategy also provides a newer transformer for larger loads where increased reliability and fault tolerance is more important. The age profile of Powerco’s zone substation transformers is shown in Figure 6.22.
Zone Substation Transformers
Rep
lace
men
t C
ost
($00
0)
0
15 t
o 20
20 t
o 25
30 t
o 35
25 t
o 30
35 t
o 40
40 t
o 45
45 t
o 50
50 t
o 55
10 t
o 15
5 to
10
0 to
5
4,000
2,000
10,000
8,000
6,000
12,000
18,000
14,000
16,000
20,000
Age (years)
Focus to be on retiring these in next five years
May need mid life refurbishment
Figure 6.22: Zone Substation Transformer Age Profile.
Zone Substation DC Supplies6.10.7.
Obsolete batteries and chargers are being systematically replaced. This is a relatively low-cost, but critically important, item. An age profile for DC Supplies is shown in Figure 6.23.
Zone Substation DC Supply Systems
Rep
lace
men
t C
ost
($00
0)0
6 to
8
8 to
10
12 t
o 14
10 t
o 12
14 t
o 16
16 t
o 18
18 t
o 20
4 to
6
2 to
4
0 to
2
100
400
300
200
500
800
600
700
900
Age (years)
Focus of renewal effort
Figure 6.23: Age Profile for Zone Substation DC Supplies.

Return to Index112 ASSET MANAGEMENT PLAN ELECTRICITY NETWORKS FY2010 – FY2019
Substation Buildings6.10.8.
Buildings are generally in a well-maintained condition, with substation building maintenance being carried out as needed, such as repainting and re-roofing. Significant renewals are usually co-ordinated with extensions or other zone substation upgrade or renewal work. Figure 6.24 shows an age profile and condition profile for Zone Substation Buildings. Poor condition means that there are non-compliances, such as seismic strength, potential flooding or Building Code requirements.
3000 4000
3000
2000
1000
00
500
1000
1500
2000
2500
Are
a (s
q m
)
Are
a (s
q m
)
ConditionConstruction YearPre 1950
1950 - 59
1960 - 69
1970 - 79
1980 - 89
1990 - 99
2000 - 09
Zone Substation Building Age Profile Zone Substation Building Condition
Poor Average Good Very Good
Figure 6.24: Condition and Age Profiles for Zone Substation Buildings.
Protection and Control Equipment6.11.
Individual Asset Life Cycle Plans6.11.1.
Individual asset life cycle plans have been prepared for the following protection and control asset types:
33kV protection relays•
11kV protection relays•
SCADA RTU outstations•
SCADA master station•
SCADA supply batteries and charging system•
Ripple injection plants•
Frequencies of Inspections and Maintenance Activities6.11.2.
Protection and Control equipment receives a three-month visual inspection with special inspections and maintenance generally being carried out at yearly, two-yearly, five-yearly and 10-yearly intervals.
Protection and Control Condition Monitoring and Maintenance Summary6.11.3.
The types of conditions monitoring and maintenance performed on protection and control equipment include:
Protection maintenance testing to guarantee asset integrity;•
Protection setting review to ensure that the equipment being protected will be •adequately served by the relay settings;
Protection setting verification on-site;•
Protection discrimination and control issues. Replacing equipment no longer •capable of required discrimination;
Protection system philosophy review to enhance network protection;•
SCADA I/O integrity testing between input and master-station; and•
Communication systems.•
Protection Relays6.11.4.
Protection Systems
Rep
lace
men
t C
ost
($00
0)
0
1,000
4,000
3,000
2,000
5,000
9,000
8,000
6,000
7,000
10,000
Age (years)
15 t
o 20
20 t
o 25
30 t
o 35
25 t
o 30
35 t
o 40
40 t
o 45
45 t
o 50
10 t
o 15
5 to
10
0 to
5
Figure 6.25: Age Profile for Protection Systems.

Return to Index 113ASSET MANAGEMENT PLAN ELECTRICITY NETWORKS FY2010 – FY2019
Older electro-mechanical relays begin to lose reliability with age, and newer electronic relays become obsolete as protocols are developed and replacement parts become unavailable. Over the past few years, Powerco conducted several reviews and equipment upgrades in the Eastern and Western regions to improve the reliability of its protection systems. Similar reviews and upgrades will continue in conjunction with the planned network developments. The age profile of protection relays and systems is shown in Figure 6.25. A Protection Systems Asset Management Plan presents a programme of protection equipment replacements until 2014. While this is based on age and type of relay, relay performance and actual replacement, or upgrade of protection systems, is reliability or risk-driven.
The deterioration of the older electro-mechanical protection equipment begins to influence its reliability after 25-30 years of service. In addition, the older equipment is becoming technically inferior as the variety of functions, such as data acquisition and interrogation now provided by newer systems are becoming standard features. The replacement programme for ageing equipment is expected to continue over the next decade as many relays in this category are now approaching or have exceeded their useful life.
The growth happening in Tauranga and the demand for faster fault clearance has necessitated an upgrade of older protection schemes. This work is now completed.
In the Palmerston North area, the network has been constructed to allow multiple supplies to various substations. This configuration, coupled with the in feed from the Tararua windfarm, greatly improves the security of supply to the district. However, the existing non-unit protection systems installed in the district have not been designed to fully complement this and several undesirable trippings have occurred. To address this deficiency, the possibility of introducing unit protection schemes to particular parts of the networks is being developed.
Powerco has collated the protection configuration technical information from all regions into a single reference database. This has enhanced the management of this key engineering information. Data maintenance and upgrades of this facility will continue.
SCADA and Communications6.11.5.
As a broad policy, open architecture systems are adopted whenever possible with a view to facilitating future development.
Powerco has replaced its Eastern Region SCADA Master Station with a new OSI Monarch system. The plan is to migrate the Western Region to this same platform in the next two years (also described in Section 8.6.3).
All Dataterm SCADA RTUs have exceeded their supportable life span. Powerco has implemented a project to replace all the Dataterm RTUs with modern RTUs. The new RTUs support the proposed migration to the DNP3 protocol as the preferred protocol for Master Station to RTU communication. The Dataterm replacement project is scheduled for completion prior to the rollout of the new Monarch SCADA system into the Western region.
SCADA & Communications Systems
Rep
lace
men
t C
ost
($00
0)
0
1,000
2,500
2,000
1,500
3,000
3,500
4,000
Age (years)
6 to
8
8 to
10
12 t
o 14
10 t
o 12
14 t
o 16
16 t
o 18
18 t
o 20
4 to
6
2 to
4
0 to
2
Figure 6.26: SCADA and Communications System Age Profile.
Communication transmission systems will be renewed and developed utilising digital radio, fibre and copper transmission mediums to build an inter-region, high-capacity backbone. This will then enable digital cross-connectability to zone substation level and provide valuable inter-area communications. The improved management, availability and control that can be seen from a digital transmission system will enable Powerco to provide diverse routing and industry standard communication protocols throughout its operational network.
An age profile of SCADA and Communications system equipment is shown in Figure 6.26. While there are variously aged RTUs, these are still performing reliably. The main focus will be ensuring that the protocols used by these RTUs are compatible with the new master stations.

Return to Index114 ASSET MANAGEMENT PLAN ELECTRICITY NETWORKS FY2010 – FY2019
Load Control Plants6.11.6.
Load (ripple) control systems are described in detail in Powerco’s Load Control System Asset Management Plan. From this, an age profile of injection plants is presented in Figure 6.27. The plan identifies that many of the injection plants are well beyond their standard life and this means that the availability of spare parts is a concern.
While load control has been used in New Zealand for the past 60 years, over the last decade, much renewal work on load control injection plants and equipment, especially in Powerco’s Western region, has been deferred. The legislated requirement to split the ownership of electricity distribution lines and retail business components did not encourage investment in load control because it lay in between these two functions. For instance, in Powerco’s network area, Powerco owns the ripple injection plants but third parties own the receive relays.
In the last few years, however, greater certainty has emerged. For instance, the Electricity Commission’s model use of system agreement stipulates that grid and network security of supply and control of transmission peaks take priority over gentailers’ interests. Further, the Electricity Commission’s advanced metering guidelines specify that smart meters should be added to respond to a ripple signal sent via distributors.
As a consequence of past deferrals, Powerco’s load control systems need renewal investment, especially in the Western region, to ensure they can adequately continue to meet the levels of service identified in the load control AMP and the requirements of Powerco’s connection standard.
The load control development and life cycle asset management plan includes a prioritised list of issues and indicates required capital investment profile to address urgent and long-term issues. The application of the management plan will require the co-operation of all stakeholders to ensure the sustainable operation of an effective load management system. Modern plants have features that make them perform better than their predecessors. The plan lays out a five-year programme for transmitter replacement, which, instead of being like-for-like replacement, takes into account advances in technology and a strategy around plants situated at GXPs.
Load Control Injection Plants
Rep
lace
men
t C
ost
($00
0)
0
1,000
3,000
2,000
4,000
5,000
6,000
Age (years)
15 t
o 20
20 t
o 25
30 t
o 35
25 t
o 30
35 t
o 40
40 t
o 45
45 t
o 50
10 t
o 15
5 to
10
0 to
5
Figure 6.27: Age Profile of Load Control Injection Plants.
Metering System Instrument Transformers6.11.7.
Where the instrument transformers are used to provide inputs to power meters that are used by energy companies to provide energy consumption data for reconciliation in the New Zealand energy market, the transformers are required to meet the accuracy standards defined in the Electricity Governance Regulations 2003, which have replaced the MARIA codes of practice. All instrument transformers used for this purpose are adequately rated.
A High Voltage Metering Unit Asset Management plan has been substantially completed. Issues identified by the plan will be addressed on a case-by-case basis. In general, the existing assets are considered capable of providing acceptable levels of service.
The major upcoming renewal work for the zone substation assets is summarised in Table 6.2. It should be noted that the majority of subtransmission replacements involve upgrading rather than like-with-like replacement, and they are included in this plan as development projects.
GXP Metering Systems 6.11.8.
Most of Powerco’s GXP metering is in excess of 20 years old and is in need of renewal. When renewal takes place, new technologies will be adopted as set out in Section 8.6.

Return to Index 115ASSET MANAGEMENT PLAN ELECTRICITY NETWORKS FY2010 – FY2019
Street Lighting Control Assets6.11.9.
Maintenance of Powerco owned control relays and fuse bases is generally carried out on a reactive basis, where equipment is serviced or replaced as required when evidenced by performance issues. Present owners of street lighting control receivers will need to be consulted with regard to upgrading legacy receivers to match the operating parameters of any new injection equipment. Maintenance of Powerco owned street lighting supply conductors (5th wire) is carried out in reactive fashion as part of general low voltage fault response.
Critical and Emergency Spares6.12.
Powerco has an inventory of holdings and requirements for critical spares and this is kept as a standard on the Business Management System. Powerco’s contractors are charged with managing and maintaining the critical spares. The ages of the critical spares match the ages of their associated assets. From time to time, the inventory is reviewed for up-to-dateness and adequacy.
Holdings of emergency spares are kept by Powerco’s contractors. The contractors are required to hold certain stock levels to cater for emergency situations. There are also close relationships with suppliers and other utilities that can provide stock levels in short times if needed.
network Renewal Project Summary6.13.
Major renewal projects residing in the Improvement Register (of value typically greater than $500,000, or specifically mentioned in the AMP) to FY15 are summarised in Table 6.2 , along with their options and the Asset Management driver.
The contents of the Improvement Register are assessed using a multi-stakeholder assessment process (Coin) whereby projects are reviewed against a set of four strategic objectives representing stakeholder needs under which constraints are applied (refer to Section 2.6). The summaries do not cater for any projects that have delayed implementation or are carried over from one year to another.
The expenditure totals in Table 6.2 reflect the expenditure forecasts in Section 9.

Return to Index116 ASSET MANAGEMENT PLAN ELECTRICITY NETWORKS FY2010 – FY2019
Table 6.2: Major Renewal Projects
Potential Projects Project Driver
AMP Reference Section Options
Replacement and Renewal Project FY2011 FY2012 FY2013 FY2014 FY2015
4OHMisc pole replacements $1,041,000 $1,030,000 $1,030,000 $950,000 $950,000 Asset Integrity; Safety 6.6.8 Tolerate worse relibility 4OH Blitz, Western Region $600,000 $750,000 $950,000 $1,150,000 Asset Integrity; Safety 6.6.8 Tolerate worse relibility DOHMisc complete distribuition overhead replacements $330,000 $200,000 Reliability; Safety 6.6.7 Tolerate worse relibility Misc conductor replacements $550,000 $640,000 $100,000 Reliability; Safety 6.6.7 Tolerate worse relibility Misc pole replacements $3,525,000 $3,430,000 $2,455,000 $50,000 Reliability; Safety 6.6.7 Tolerate worse relibility Misc crossarm replacements $30,000 $40,000 $80,000 Reliability; Safety 6.6.7 Tolerate worse relibility DOH Blitz, Western Region $3,383,000 $4,600,000 $5,100,000 $5,600,000 $6,100,000 Reliability; Safety 6.6.7 Tolerate worse relibility SOHMisc crossarm replacements $280,000 $125,000 Reliability; Safety 6.6.6 Tolerate worse relibility Misc combined pole and crossarm replacements $100,000 $80,000 Reliability; Safety 6.6.6 Tolerate worse relibility Misc insulator replacements $150,000 $150,000 Reliability; Safety 6.6.6 Tolerate worse relibility Misc pole replacements $260,000 $395,000 $280,000 Reliability; Safety 6.6.6 Tolerate worse relibility SOH Blitz, Western Region $978,000 $2,300,000 $2,800,000 $3,300,000 $3,800,000 Reliability; Safety 6.6.6 Tolerate worse relibility 4UGMisc OHUG program works $150,000 Stakeholder requirement 6.7.7 Misc LV cable/equipment works $495,000 $350,000 $350,000 $391,000 $250,000 Asset Integrity; Safety 6.7.7 Do nothing - accept H&S risk, reliability issues DUGMisc iron pothead replacements $65,000 $65,000 $65,000 $65,000 $65,000 Reliability; Safety 6.7.6 Tolerate cable failures Misc deteriorated cable replacements $657,800 $1,468,200 $762,000 $652,000 Reliability 6.7.6 Tolerate cable failures Palmerston North CBD HV UG Cable replacement $579,200 $539,800 $545,800 $534,600 $586,600 Reliability 6.7.4 Tolerate cable failures SUGMisc 33kV cable replacements due to TP changes $450,000 Asset Integrity 6.7.5 Misc deteriorated cable replacements $250,000 Reliability 6.7.5 Tolerate cable failures AENMisc RAPs assessment & implementation $318,000 $110,000 $110,000 $110,000 $110,000 Asset Integrity; Safety 6.4.5 Renew lines COMMisc Repeater battery charger replacements $28,500 $28,500 $28,500 $28,500 $25,000 Asset Integrity; Reliability 6.11.5 Do nothing, take risk of losing communications Misc Repeater DC battery replacements $30,000 $30,000 $30,000 $30,000 $25,000 Asset Integrity; Reliability 6.11.5 Do nothing, take risk of losing communications Misc RTU renewals $40,000 Asset Integrity; Reliability 6.11.5 Do nothing - accept H&S risk, more maintenance DABMisc ABS reactive renewals $635,000 $715,000 $665,000 $665,000 $665,000 Asset Integrity; Reliability 6.9.4 Do nothing - accept H&S risk, more maintenance DGSMisc switchgear replacements $35,000 $65,000 Asset Integrity; Reliability 6.9.4 Do nothing - accept H&S risk, more maintenance DLFMisc links/fuse reactive renewals $50,000 $50,000 $50,000 $50,000 $50,000 Asset Integrity; Reliability 6.9.4 Do nothing - accept H&S risk, reliability issues DOT
Misc DOT replacements $130,000 $130,000 $130,000 $130,000 $130,000 Asset Integrity; Reliability 6.8.4 Do nothing - accept H&S risk, reliability issues Replace pole mount transformers $900,000 $900,000 $900,000 $900,000 $900,000 Asset Integrity; Reliability 6.8.4 Do nothing - accept H&S risk, reliability issues DUT
Misc outdated ground mount transformer replacements
$555,000 $170,000 Asset Integrity; Reliability 6.8.4 Do nothing - accept H&S risk, reliability issues
Misc cable replacements $130,000 Asset Integrity; Reliability 6.8.4 Do nothing - accept H&S risk, reliability issues Misc deteriorated ground mount transformer replacements
$265,880 $399,490 $380,000 $395,000 $350,000 Asset Integrity; Reliability 6.8.4 Do nothing - accept H&S risk, reliability issues
Replace ground mount transformers $1,650,000 $1,650,000 $1,650,000 $1,650,000 $1,650,000 Asset Integrity; Reliability 6.8.4 Do nothing - accept H&S risk, reliability issues
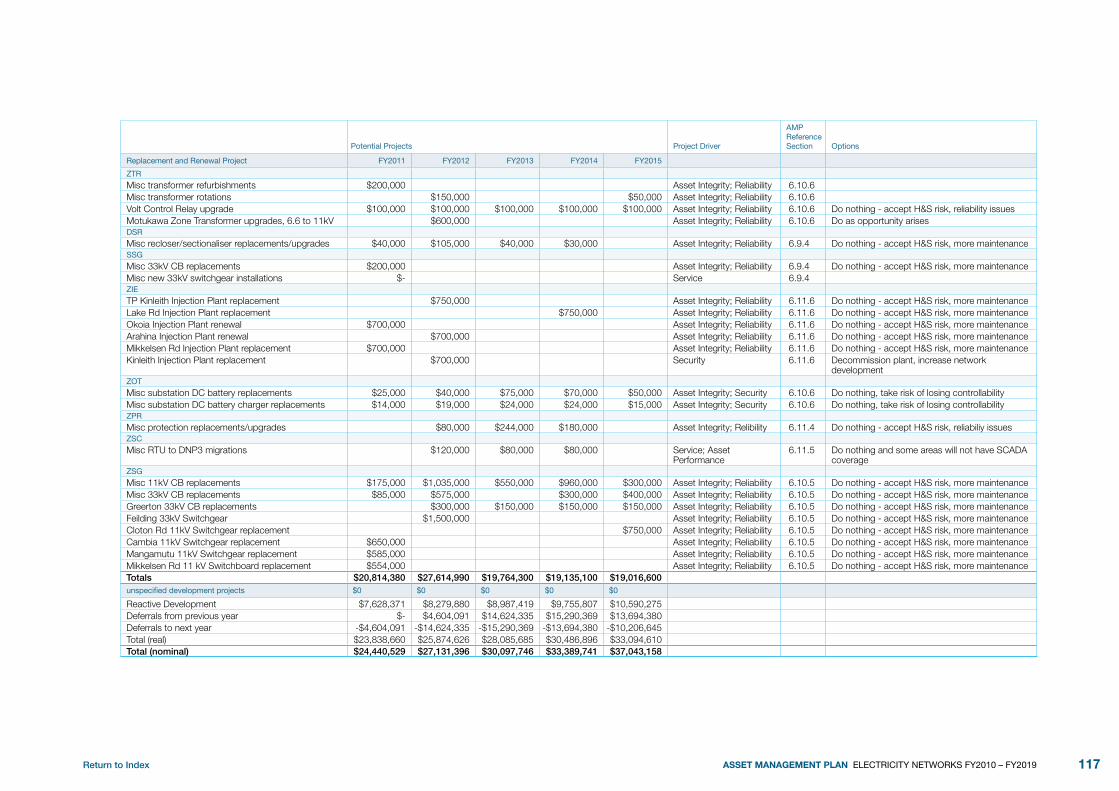
Return to Index 117ASSET MANAGEMENT PLAN ELECTRICITY NETWORKS FY2010 – FY2019
Potential Projects Project Driver
AMP Reference Section Options
Replacement and Renewal Project FY2011 FY2012 FY2013 FY2014 FY2015
ZTR
Misc transformer refurbishments $200,000 Asset Integrity; Reliability 6.10.6 Misc transformer rotations $150,000 $50,000 Asset Integrity; Reliability 6.10.6 Volt Control Relay upgrade $100,000 $100,000 $100,000 $100,000 $100,000 Asset Integrity; Reliability 6.10.6 Do nothing - accept H&S risk, reliability issues Motukawa Zone Transformer upgrades, 6.6 to 11kV $600,000 Asset Integrity; Reliability 6.10.6 Do as opportunity arises DSR
Misc recloser/sectionaliser replacements/upgrades $40,000 $105,000 $40,000 $30,000 Asset Integrity; Reliability 6.9.4 Do nothing - accept H&S risk, more maintenance SSG
Misc 33kV CB replacements $200,000 Asset Integrity; Reliability 6.9.4 Do nothing - accept H&S risk, more maintenance Misc new 33kV switchgear installations $- Service 6.9.4 ZIE
TP Kinleith Injection Plant replacement $750,000 Asset Integrity; Reliability 6.11.6 Do nothing - accept H&S risk, more maintenance Lake Rd Injection Plant replacement $750,000 Asset Integrity; Reliability 6.11.6 Do nothing - accept H&S risk, more maintenance Okoia Injection Plant renewal $700,000 Asset Integrity; Reliability 6.11.6 Do nothing - accept H&S risk, more maintenance Arahina Injection Plant renewal $700,000 Asset Integrity; Reliability 6.11.6 Do nothing - accept H&S risk, more maintenance Mikkelsen Rd Injection Plant replacement $700,000 Asset Integrity; Reliability 6.11.6 Do nothing - accept H&S risk, more maintenance Kinleith Injection Plant replacement $700,000 Security 6.11.6 Decommission plant, increase network
development ZOT
Misc substation DC battery replacements $25,000 $40,000 $75,000 $70,000 $50,000 Asset Integrity; Security 6.10.6 Do nothing, take risk of losing controllability Misc substation DC battery charger replacements $14,000 $19,000 $24,000 $24,000 $15,000 Asset Integrity; Security 6.10.6 Do nothing, take risk of losing controllability ZPR
Misc protection replacements/upgrades $80,000 $244,000 $180,000 Asset Integrity; Relibility 6.11.4 Do nothing - accept H&S risk, reliabiliy issues ZSC
Misc RTU to DNP3 migrations $120,000 $80,000 $80,000 Service; Asset Performance
6.11.5 Do nothing and some areas will not have SCADA coverage
ZSG
Misc 11kV CB replacements $175,000 $1,035,000 $550,000 $960,000 $300,000 Asset Integrity; Reliability 6.10.5 Do nothing - accept H&S risk, more maintenance Misc 33kV CB replacements $85,000 $575,000 $300,000 $400,000 Asset Integrity; Reliability 6.10.5 Do nothing - accept H&S risk, more maintenance Greerton 33kV CB replacements $300,000 $150,000 $150,000 $150,000 Asset Integrity; Reliability 6.10.5 Do nothing - accept H&S risk, more maintenance Feilding 33kV Switchgear $1,500,000 Asset Integrity; Reliability 6.10.5 Do nothing - accept H&S risk, more maintenance Cloton Rd 11kV Switchgear replacement $750,000 Asset Integrity; Reliability 6.10.5 Do nothing - accept H&S risk, more maintenance Cambia 11kV Switchgear replacement $650,000 Asset Integrity; Reliability 6.10.5 Do nothing - accept H&S risk, more maintenance Mangamutu 11kV Switchgear replacement $585,000 Asset Integrity; Reliability 6.10.5 Do nothing - accept H&S risk, more maintenance Mikkelsen Rd 11 kV Switchboard replacement $554,000 Asset Integrity; Reliability 6.10.5 Do nothing - accept H&S risk, more maintenance Totals $20,814,380 $27,614,990 $19,764,300 $19,135,100 $19,016,600 unspecified development projects $0 $0 $0 $0 $0
Reactive Development $7,628,371 $8,279,880 $8,987,419 $9,755,807 $10,590,275 Deferrals from previous year $- $4,604,091 $14,624,335 $15,290,369 $13,694,380 Deferrals to next year -$4,604,091 -$14,624,335 -$15,290,369 -$13,694,380 -$10,206,645 Total (real) $23,838,660 $25,874,626 $28,085,685 $30,486,896 $33,094,610 Total (nominal) $24,440,529 $27,131,396 $30,097,746 $33,389,741 $37,043,158
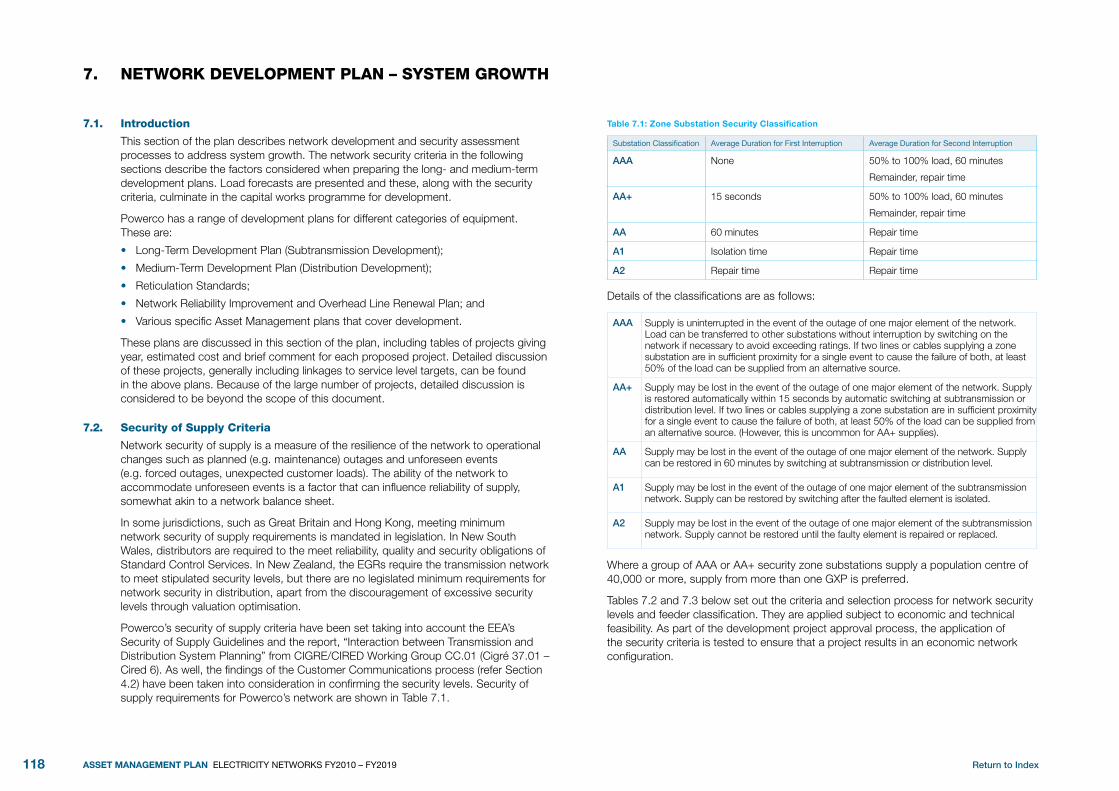
Return to Index118 ASSET MANAGEMENT PLAN ELECTRICITY NETWORKS FY2010 – FY2019
nETwoRk dEVELoPMEnT PLAn – SYSTEM gRowTh7.
Introduction7.1.
This section of the plan describes network development and security assessment processes to address system growth. The network security criteria in the following sections describe the factors considered when preparing the long- and medium-term development plans. Load forecasts are presented and these, along with the security criteria, culminate in the capital works programme for development.
Powerco has a range of development plans for different categories of equipment. These are:
Long-Term Development Plan (Subtransmission Development);•
Medium-Term Development Plan (Distribution Development);•
Reticulation Standards; •
Network Reliability Improvement and Overhead Line Renewal Plan; and •
Various specific Asset Management plans that cover development.•
These plans are discussed in this section of the plan, including tables of projects giving year, estimated cost and brief comment for each proposed project. Detailed discussion of these projects, generally including linkages to service level targets, can be found in the above plans. Because of the large number of projects, detailed discussion is considered to be beyond the scope of this document.
Security of Supply Criteria7.2.
Network security of supply is a measure of the resilience of the network to operational changes such as planned (e.g. maintenance) outages and unforeseen events (e.g. forced outages, unexpected customer loads). The ability of the network to accommodate unforeseen events is a factor that can influence reliability of supply, somewhat akin to a network balance sheet.
In some jurisdictions, such as Great Britain and Hong Kong, meeting minimum network security of supply requirements is mandated in legislation. In New South Wales, distributors are required to the meet reliability, quality and security obligations of Standard Control Services. In New Zealand, the EGRs require the transmission network to meet stipulated security levels, but there are no legislated minimum requirements for network security in distribution, apart from the discouragement of excessive security levels through valuation optimisation.
Powerco’s security of supply criteria have been set taking into account the EEA’s Security of Supply Guidelines and the report, “Interaction between Transmission and Distribution System Planning” from CIGRE/CIRED Working Group CC.01 (Cigré 37.01 – Cired 6). As well, the findings of the Customer Communications process (refer Section 4.2) have been taken into consideration in confirming the security levels. Security of supply requirements for Powerco’s network are shown in Table 7.1.
Table 7.1: Zone Substation Security Classification
Substation Classification Average Duration for First Interruption Average Duration for Second Interruption
aaa None 50% to 100% load, 60 minutes
Remainder, repair time
aa+ 15 seconds 50% to 100% load, 60 minutes
Remainder, repair time
aa 60 minutes Repair time
a1 Isolation time Repair time
a2 Repair time Repair time
Details of the classifications are as follows:
aaa Supply is uninterrupted in the event of the outage of one major element of the network. Load can be transferred to other substations without interruption by switching on the network if necessary to avoid exceeding ratings. If two lines or cables supplying a zone substation are in sufficient proximity for a single event to cause the failure of both, at least 50% of the load can be supplied from an alternative source.
aa+ Supply may be lost in the event of the outage of one major element of the network. Supply is restored automatically within 15 seconds by automatic switching at subtransmission or distribution level. If two lines or cables supplying a zone substation are in sufficient proximity for a single event to cause the failure of both, at least 50% of the load can be supplied from an alternative source. (However, this is uncommon for AA+ supplies).
aa Supply may be lost in the event of the outage of one major element of the network. Supply can be restored in 60 minutes by switching at subtransmission or distribution level.
a1 Supply may be lost in the event of the outage of one major element of the subtransmission network. Supply can be restored by switching after the faulted element is isolated.
a2 Supply may be lost in the event of the outage of one major element of the subtransmission network. Supply cannot be restored until the faulty element is repaired or replaced.
Where a group of AAA or AA+ security zone substations supply a population centre of 40,000 or more, supply from more than one GXP is preferred.
Tables 7.2 and 7.3 below set out the criteria and selection process for network security levels and feeder classification. They are applied subject to economic and technical feasibility. As part of the development project approval process, the application of the security criteria is tested to ensure that a project results in an economic network configuration.

Return to Index 119ASSET MANAGEMENT PLAN ELECTRICITY NETWORKS FY2010 – FY2019
Powerco’s security criteria are deterministic rather than probabilistic. At the concept design stage, however, larger projects are required to pass an economic assessment and a multi-stakeholder assessment. Generally, projects that meet deterministic criteria will also fulfil probabilistic criteria although this is not always the case and it is possible that a project that ensures network security criteria are met is deferred in favour of another security-enhancing project that offers a better economic benefit.
Table 7.2: Zone Substation Security Level Selection
Load Type
Maximum Group Demand
< 1MVA 1 – 5MVA 5 – 12MVA >12MVA
F1 AA AA AA+ AAA
F2 A1 AA AA+ AAA
F3 A2 AA AA AA
F4 A2 A1 A1 n/a
F5 A2 A2 A1 n/a
Powerco has some zone substations where provision of this security level is not economically viable. In these cases, particular care is taken to ensure that the critical components of the supply system are as reliable as possible. Some substation busbars require AAA security, where the design of the network makes its provision technically infeasible. These are being progressively upgraded to AA+ security. Some network architectures, particularly those in Wanganui and Valley, have been based historically on the premise that transformer failure is rare and that should a transformer need to be taken out of service in a preplanned manner, switching can be performed on the distribution network. These network architectures fulfil security levels up to AA class, but are not necessarily ideal for CBD areas or sensitive industrial loads.
Table 7.3: Distribution Feeder Classifications
Classification Description
F1 Large Industrial
F2 Commercial / CBD, town population > 10,000
F3 Urban Residential, town population > 5,000
F4 Rural
F5 Remote Rural
Security levels for large customers are agreed upon by negotiation. For example, Kinleith Paper Mill requires a high supply reliability level and this is, to some extent, reflected in the levels of security provided at the site. In such cases the security criteria are tested to ensure they result in an economic network configuration.
network Capacity Criteria7.3.
There are four perspectives for determining capacity in an electricity distribution network:
The normal operational capacity of an asset (usually this is dictated by the •temperature at which the asset is allowed to operate under normal conditions);
The ability of the asset to maintain adequate voltage;•
The fault capacity of an asset, either thermal or mechanical; and•
The asset’s economic capacity (i.e. where the marginal cost of increasing the •conductor size equates to the marginal cost of NPV of losses).
Design Operational Temperatures7.3.1.
Network asset capacity is usually dictated by the operational temperatures set out in Table 7.4. These capacity targets have changed following revisions to the line design standard and use of better information. Network capacity is monitored through the long-term, medium-term and short-term planning process with improvement initiatives included in the works plan.
Table 7.4: Target Maximum Temperatures for Capacity Constraints
Asset Management Driver: Asset Performance
AssetNormal Operation - Maximum Temperatures
Fault Conditions – Maximum Temperatures
XLPE cable conductor 90oC 250oC
PILC cable conductor 70oC 160oC
HDCu Overhead Line 50oC (70oC in some cases) 200oC
AAAC/1120 Overhead Line; AAC Overhead Line; PVC Covered Overhead Line
50oC (70oC in some cases) 160oC
ACSR Overhead Line 50oC (70oC in some cases) 150oC
Galv Steel Overhead Lines 50oC (70oC in some cases) 400oC
Transformer Hot Spot (Emergency) 115oC -
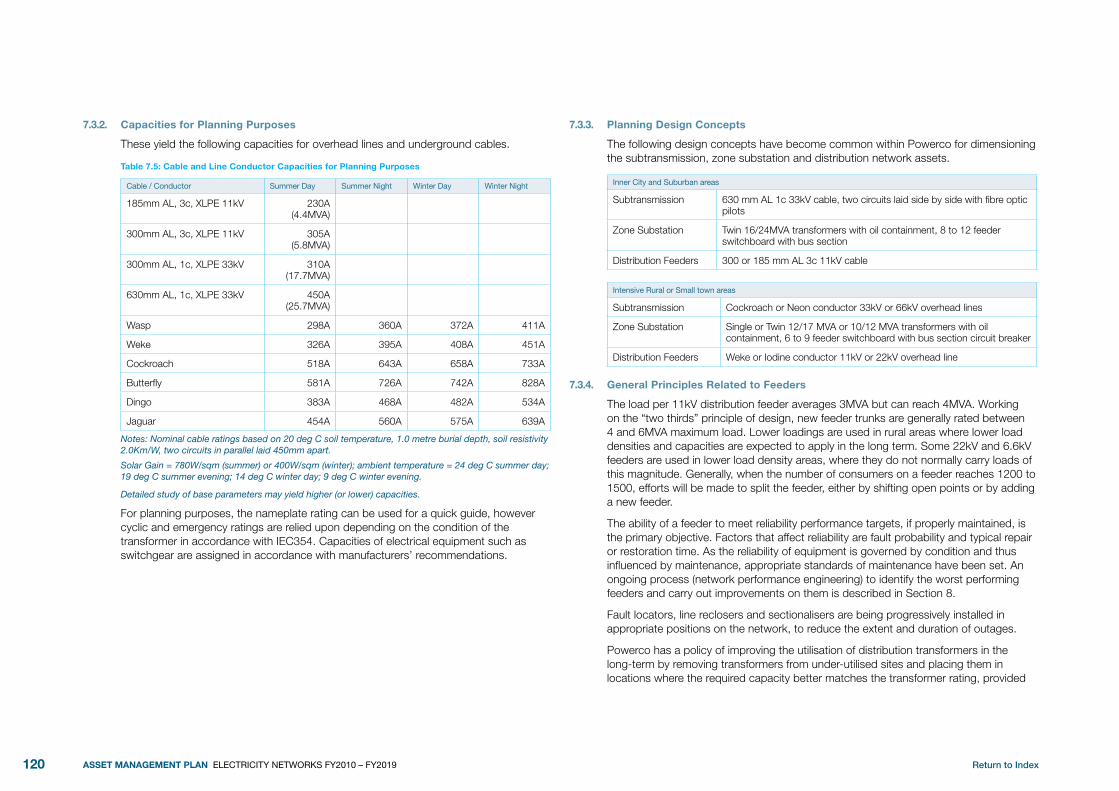
Return to Index120 ASSET MANAGEMENT PLAN ELECTRICITY NETWORKS FY2010 – FY2019
Capacities for Planning Purposes7.3.2.
These yield the following capacities for overhead lines and underground cables.
Table 7.5: Cable and Line Conductor Capacities for Planning Purposes
Cable / Conductor Summer Day Summer Night Winter Day Winter Night
185mm AL, 3c, XLPE 11kV 230A (4.4MVA)
300mm AL, 3c, XLPE 11kV 305A (5.8MVA)
300mm AL, 1c, XLPE 33kV 310A (17.7MVA)
630mm AL, 1c, XLPE 33kV 450A (25.7MVA)
Wasp 298A 360A 372A 411A
Weke 326A 395A 408A 451A
Cockroach 518A 643A 658A 733A
Butterfly 581A 726A 742A 828A
Dingo 383A 468A 482A 534A
Jaguar 454A 560A 575A 639A
Notes: Nominal cable ratings based on 20 deg C soil temperature, 1.0 metre burial depth, soil resistivity 2.0Km/W, two circuits in parallel laid 450mm apart.
Solar Gain = 780W/sqm (summer) or 400W/sqm (winter); ambient temperature = 24 deg C summer day; 19 deg C summer evening; 14 deg C winter day; 9 deg C winter evening.
Detailed study of base parameters may yield higher (or lower) capacities.
For planning purposes, the nameplate rating can be used for a quick guide, however cyclic and emergency ratings are relied upon depending on the condition of the transformer in accordance with IEC354. Capacities of electrical equipment such as switchgear are assigned in accordance with manufacturers’ recommendations.
Planning Design Concepts7.3.3.
The following design concepts have become common within Powerco for dimensioning the subtransmission, zone substation and distribution network assets.
Inner City and Suburban areas
Subtransmission 630 mm AL 1c 33kV cable, two circuits laid side by side with fibre optic pilots
Zone Substation Twin 16/24MVA transformers with oil containment, 8 to 12 feeder switchboard with bus section
Distribution Feeders 300 or 185 mm AL 3c 11kV cable
Intensive Rural or Small town areas
Subtransmission Cockroach or Neon conductor 33kV or 66kV overhead lines
Zone Substation Single or Twin 12/17 MVA or 10/12 MVA transformers with oil containment, 6 to 9 feeder switchboard with bus section circuit breaker
Distribution Feeders Weke or Iodine conductor 11kV or 22kV overhead line
General Principles Related to Feeders7.3.4.
The load per 11kV distribution feeder averages 3MVA but can reach 4MVA. Working on the “two thirds” principle of design, new feeder trunks are generally rated between 4 and 6MVA maximum load. Lower loadings are used in rural areas where lower load densities and capacities are expected to apply in the long term. Some 22kV and 6.6kV feeders are used in lower load density areas, where they do not normally carry loads of this magnitude. Generally, when the number of consumers on a feeder reaches 1200 to 1500, efforts will be made to split the feeder, either by shifting open points or by adding a new feeder.
The ability of a feeder to meet reliability performance targets, if properly maintained, is the primary objective. Factors that affect reliability are fault probability and typical repair or restoration time. As the reliability of equipment is governed by condition and thus influenced by maintenance, appropriate standards of maintenance have been set. An ongoing process (network performance engineering) to identify the worst performing feeders and carry out improvements on them is described in Section 8.
Fault locators, line reclosers and sectionalisers are being progressively installed in appropriate positions on the network, to reduce the extent and duration of outages.
Powerco has a policy of improving the utilisation of distribution transformers in the long-term by removing transformers from under-utilised sites and placing them in locations where the required capacity better matches the transformer rating, provided

Return to Index 121ASSET MANAGEMENT PLAN ELECTRICITY NETWORKS FY2010 – FY2019
it is cost-effective to do so. In general, an under-utilised transformer is noted, and is moved when a more appropriate site is identified. Utilisation is poor where oversized transformers are installed for electric motors powering irrigation and frost protection schemes, and in remote rural locations where diversity is low and the difference between peak load and ADMD is large.
Underground versus Overhead Construction7.3.5.
Powerco’s policy on overhead versus. underground construction is as follows:
Overhead lines in urban areas will be replaced with overhead lines at the end of their •economic life, unless funding for the uneconomic portion of underground conversion can be obtained from an outside source;
New urban circuits will be constructed underground in accordance with the district •plan; and,
New rural circuits will be constructed overhead unless there is a specific consumer •request for underground, such as a rural lifestyle block subdivision. In this case, the design must be in line with Powerco standards, and the full additional cost must be met by the consumer.
Powerco’s main underground programme is an arrangement with the Palmerston North City Council for underground conversion prescribed areas. This programme is almost complete and prioritises the undergrounding of older lines. Projects in other areas will be considered as they are requested.
Voltage Fluctuation Criteria7.3.6.
Particularly in rural areas, the limiting feature of the network is voltage variation rather than conductor capacity. Voltage fluctuations on the subtransmission network should be limited to the capabilities of tap changers. At the distribution level, voltage variation is limited to the statutory allowable voltage variations to end use consumers. Power factor correction (shunt capacitors) and voltage regulators can be used to reduce the fluctuations of voltage. The following are planning guidelines on allowable voltages.
Network Allowable voltage fluctuation
Subtransmission +5%, -10%
Distribution +5%, -5%
Low Voltage +6%, -6%
Voltage Selection7.3.7.
Both 66kV and 33kV will continue to be used as appropriate for the subtransmission network, reinforced or extended as required. For some areas of the Coromandel Peninsula and the Bay of Plenty, 110kV is being considered as a possible option.
Elsewhere, 11kV will remain the primary distribution voltage, with existing 6.6kV updated only where performance or economic advantages require it. Individual areas of the network may be constructed at or uprated to 22kV if there is a performance or economic advantage.
Transformer Ratings7.3.8.
Powerco conducted a major review of the ratings of its zone substation transformers using the methodology of IEC354, and a set of rating tables has been produced covering all zone substations at ambient temperatures from 0OC to 30OC. The 20OC ratings are used throughout this section.
Planning Considerations7.4.
Long-Term Planning (Subtransmission)7.4.1.
The long-term development plan deals with the subtransmission network and zone substations. Key issues taken into account in subtransmission network planning are:
Forecast growth rate for electrical load at existing zone substations;•
The horizon year load densities within the supply area related to zone substation •utilisation;
Development of the subtransmission system, with particular reference to the total •number and size of zone substations foreseen in the horizon year;
The need for effective utilisation of capital investment on the network;•
The need to meet objectives for supply reliability, quality and safety;•
Reinforcement strategy beyond the horizon year; and•
Replacement of aged assets to maintain the average age of the network assets.•
Long-term distribution planning is carried out annually, within the framework of 15-year rolling cycles.
Medium-Term Planning (Distribution)7.4.2.
The key planning criteria that guide the development of the distribution network include:
Area forecast load growth;•
Asset utilisation;•
Reliability performance;•
Quality of supply performance;•
Industrial, commercial and residential developments affecting specific areas of •supply;
Demand-side management (DSM) initiatives;•

Return to Index122 ASSET MANAGEMENT PLAN ELECTRICITY NETWORKS FY2010 – FY2019
The results of Powerco’s price/quality consultation and focus group consultations;•
Legislation allowing non-economic supplies to be discontinued after 2013;•
Service criteria met; and •
Distribution standards review.•
Medium-term distribution planning is carried out annually, within the framework of five-year rolling cycles. This shorter time frame matches the lead time required for budgeting and implementing capital works at distribution level.
Kinleith Paper Mill7.4.3.
Development planning of the electrical distribution assets at Kinleith is dependent on and coupled with the plans for developing the plant. These, in turn, are coupled to the forestry industry, world pulp and paper markets and the value of the New Zealand dollar. Regular meetings are held with mill management to discuss long-term plans.
Planning Criteria – Low-Voltage Reticulation Planning7.4.4.
Key low-voltage system planning issues are as follows:
Upgrading existing supplies to existing customers; •
Selection of an appropriate ADMD;•
Connecting new customers, particularly infill housing customers;•
Loading of distribution substations;•
Legislation on non-economic supplies after 2013;•
Voltage and other quality-of-supply complaints and suggestions; and•
Adherence to, and economics of, standard reticulation designs.•
Low-voltage planning is undertaken in line with standard reticulation designs and After Diversity Maximum Demand (ADMD) criteria. Typically this is combined with capital works planning at all levels.
The economics of low-voltage system coverage, conductor sizes and distribution substation size for different load densities are reviewed periodically to accommodate changes in unit costs and new construction techniques. The cost efficiency of standard implementation associated with LV networks is being assessed on an ongoing basis.
Increases in the ADMD per consumer are being considered, particularly as appliances such as air conditioning become more popular. Determining an accurate ADMD for new industrial subdivision consumers is always difficult, although a figure of 25kVA per customer is the minimum.
Infill customers have the potential to disrupt existing low-voltage networks because the network characteristics end up having to change significantly. This is a particularly expensive problem in places like Mount Maunganui, where original reticulation was designed for quarter-acre sections, but now there can be eight units per quarter-acre section, fed by a new reticulation system of much larger size.
Holiday accommodation often adds to the LV and MV distribution system during short periods of the year when some parts of the network become heavily loaded. The difficulty with this form of load is the low associated revenue, coupled with the heavy impact it can have on network performance.
Load forecasting7.5.
Introduction7.5.1.
This section provides and describes the load forecasts. Load forecasting for the purposes of the Asset Management process is based on growth in peak-time demands. Peak requirements need to be understood to determine the required capacity of a lines infrastructure that will support local load growth. The volume forecasts are also reviewed.
The most significant influences on demand growth continue to result from changes in population/household composition and the growth/relocation of industry. Internal migration patterns thus have a strong influence on the observed demand growth. Government initiatives to promote energy efficiency and the preference for renewable sources of energy have been considered in preparing the forecast growth.
Development of known industry changes – such as oil and gas exploration and development; and primary sector changes and infrastructure such as ports – account for step changes seen in the forecast below. The establishment of major new industry can have a considerable impact within a short time frame in the level of demand experienced in any given locality. The possibility of new spot loads is monitored through key account managers, Resource Management Act notifications and consumer consultation. The forecast figures for growth given below lean somewhat to the high side, reflecting a conservative approach. Programmed work can be deferred if demand increases at a slower rate than forecast and brought forward if demand accelerates. It is usually better to defer work.
It should be acknowledged that load forecasting is not an exact science and is only as good as the snapshot of the best information available at the time of consolidating the data. Powerco has made every effort to take account of each of the variables described in the processes below in Section 7.5.5 and 7.5.8, however these projections can be altered at any time as new information becomes available.

Return to Index 123ASSET MANAGEMENT PLAN ELECTRICITY NETWORKS FY2010 – FY2019
Regional Influences7.5.2.
Positive population growth of significant magnitude is being experienced in parts of the Eastern Region, although there are differences in the form that this growth takes. In Powerco’s Tauranga subregion (the Western Bay of Plenty), growth continues to be driven by high levels of inward migration. Should sustainable employment opportunities become available, this could be expected to add impetus to the growth already being experienced. In contrast, on the east coast of the Coromandel the most significant influence on growth in demand derives from a temporary but major increase in short-term residents during holiday periods. Population growth in the more southern part of the Eastern Region is relatively low although changes in the pattern of rural land use and allied growth in industry are expected to become important drivers.
Population growth in most of Powerco’s Western Region is expected to continue along a relatively modest growth path. The main provincial urban areas, notably Palmerston North and to a lesser extent, New Plymouth, are experiencing large growth. There is also increased interest in coastal residential development throughout the region. Again, changes in rural land use are having an impact in some parts.
Changing Consumer Technologies and Demand7.5.3.
Historically, national electricity demand has grown at an average rate of 2.7% annually. This growth is the result of both increases in the number of total consumers and consumption per consumer. Growth in demand within Powerco’s network has tended to mirror the national trends.
The uptake of increasingly power-hungry electronics means that the average amount of electricity per person is increasing and, by 2020, home entertainment systems are expected to account for around 45% of total household consumption.
At the same time, changing technology has the power to transform the electricity distribution sector. This could involve fuel-switching – the use of alternative sources of fuel for water and space heating; adoption of electric cars – these could use household electricity supply to recharge and potentially sell unused electricity back to the grid; and micro-generation – the generation of zero- to low-carbon heat and power by individual consumers, small businesses and communities to meet their own needs.
Solar Photovoltaic (PV) Cells have an expanding market worldwide with several multinational corporations involved in their development and manufacture, but they are hampered by high costs and are not projected to be able to compete with grid-supplied electricity for another 20 years unless there is a breakthrough in technology or generous government subsidies.
Micro Wind Generation is a mature technology with a growing international market. It has a potential break-even point with grid-supplied electricity in the next seven to 12 years. However, siting issues will mean that uptake will likely to be concentrated in rural areas.
There are two types of micro heat and power technologies, fuel cells and engine-based units. However, the high price of both of these technologies is a significant barrier to their uptake for the foreseeable future, and units with a high heat-to-electricity ratio do not appear to be particularly suited to the New Zealand consumer.
Our view, in conclusion, is that micro-generation is not likely to affect the consumption of grid-supplied electricity for the next 20 years.
The forecast assumes that domestic fuel switching, like the increasing penetration of solar water heating will be compensated by a similar increase in electric heat pump space heating.
Larger embedded or distributed generation schemes have not been included in the volume forecast because as long as there is separate metering of these generators, the volumes conveyed on the network are inclusive of any embedded or distributed generation. Implementation of RAPs schemes is at present, on too small a scale to noticeably affect the forecast: any uncertainty on this will be catered for through the prudent forecast. The zone substation demand forecast will accommodate any distributed or embedded generation schemes as they arise.
Impact of Demand Side Management Initiatives7.5.4.
The impact of energy savings campaigns such as calls for dry year energy restraint can have the impact of reducing energy consumption and volumes transported. The impacts of these campaigns can reduce the volumes by around 5%. Lines companies find the dry year savings campaigns cannot be accurately predicted. They are not built into the volume forecast and are therefore a risk to the forecast.
The installation of “smart” meters by some retailers has the potential to affect peak demands. On the one hand, new meters may mean more accurate meter readings which could reduce the overall demands. In our experience there has not yet been a noticeable move by most customers to control their time of use because they have a “smart” meter. On the other hand, the smart meter roll out is having a beneficial impact on the numbers of working ripple receive relays, leading to greater ability to control of thermal storage load (or, the duty on a dwindling number of operational receivers is improving).
Another demand side management initiative is the proposal to audit the customer power factor at various places on the network. This is driven by the Electricity Commission’s requirement that power factor should be above 0.95 at the GXP at peak load times.

Return to Index124 ASSET MANAGEMENT PLAN ELECTRICITY NETWORKS FY2010 – FY2019
Overall Powerco’s load factor is good. Much of this is due to the effective control of GXP peak demands through the load control system. While the forecast assumes a constant load factor, improvement in the numbers of operational receive relays may enable load factor improvements. Any improvements gained will increase the likelihood that the actual demands are below the prudent forecast, leading to the potential to defer some investments. Conversely, changes in appliances (eg heat pumps) may reduce the load factor. Changes in load factor will be monitored each year as part of the forecasting process.
Volume Load Forecasting Process7.5.5.
Powerco’s volume forecast methodology has three inputs. A statistical regression is based on the historical (and remainder of year forecast if done in the middle of a year) Gross Domestic Product (GDP) and population, regressed against actual volume consumption. This analysis produces a set of betas and intercepts for forecasting volumes. Error measures are as used as part of the least squares regression.
In algebraic terms, Powerco’s volume forecast model is:
Y = X0 + (X1 * ß1) + (x2 * ß2) + ε
Where:
Y Demand to be calculated
X0 Previous years demand
X1 Δ GDP
X2 Δ Households
ß1 Weighting factor for GDP figure
ß2 Weighting factor for Population figure
ε Random error
Volume Elasticity with GDP and Population7.5.6.
The drivers of growth in electricity usage and demand include economic growth, population and household growth. GDP growth is a significant driver of demand for commercial and industrial consumption. Although important, GDP is less of a driver for domestic electricity demand. The figure below shows the correlation between GDP and electricity usage. As noted, this correlation is very strong, particularly for industrial consumers.
1974
1978
1982
1986
1990
1994
1998
2002
2006
GDP Volume
Relationship between GDP and electricity volume
Rea
l GD
P $
95/9
6
Con
sum
ptio
n (G
Wh)
0
20,000
80,000
60,000
40,000
100,000
120,000
140,000
0
10,000
5,000
25,000
20,000
15,000
30,000
35,000
40,000
Electricity volume displayed resilience and was affected little by the weak economic conditions in the late 1980s and early 1990s
Source: Electricity Commission
Figure 7.1: GDP and Electricity Volume
Population and household growth is a significant driver of customer connection growth. Consequently, population growth and the number of people per household are the most significant factors in determining residential consumption and demand growth (refer to the figure below).
1974
1978
1982
1986
1990
1994
1998
2002
2006
Households Domestic Volume
National household and domestic volume
Num
ber
of H
ouse
hold
s (0
00s)
Dom
estic
vol
ume
(GW
h)
0
400
200
1,200
1,000
600
800
1,400
1,600
1,800
0
2,000
8,000
6,000
4,000
10,000
12,000
14,000
CAGR: 1.57%
CAGR: 1.58%
Figure 7.2: Household Numbers and Electricity Volume

Return to Index 125ASSET MANAGEMENT PLAN ELECTRICITY NETWORKS FY2010 – FY2019
The graphs below show Powerco’s regional GDP growths and forecasts. The areas covered by Powerco’s footprint, has experienced strong GDP growth. Energy volumes from monthly reported figures have been used to produce the graphs shown below. GDP (sourced from NZIER) is closely correlated with energy volumes (particularly during periods of high growth) and this can be seen in the graphs. Also graphed are the energy volumes against interest rates and because Powerco has a large rural base, agricultural output.
The econometric forecasts are NZIER forecasts. These predict GDP growth rates to remain low during FY10 followed by a pick up in FY11.
Year ending June
2003 2004 2005 2006 2008 2009 20102007 201220113500
3700
3900
4100
4300
4500
4700
4900
GW
h
Historical Volumes April 10 AMP Forecast
Real GDP ($b)
Year ending June
2003 2004 2005 2006 2008 2009 20102007 201220110%
1%
2%
3%
4%
5%
6%
7%
8%
9%
10%
3500
3700
3900
4100
4300
4500
4700
4900
GW
h
Energy Conveyed vs Interest Rates
Historical Volumes April 10 AMP Forecast
90 day bank bill rates (%) Volume Growth Rate (June) (%)
$ b
illio
n
Year ending June
2003 2004 2005 2006 2008 2009 20102007 201220113500
3700
3900
4100
4300
4500
4700
4900
GW
h
Historical Volumes April 10 AMP Forecast
Agricultural Gross Output ($b)
10
12
14
16
18
20
22
24
$ b
illio
n
Energy Conveyed vs Agricultural Output
110
115
120
125
130
135
140
145
Energy Conveyed vs GDP
Year ending June
2003 2004 2005 2006 2008 2009 20102007 201220113500
3700
3900
4100
4300
4500
4700
4900
GW
h
Historical Volumes April 10 AMP Forecast
Real GDP ($b)
Year ending June
2003 2004 2005 2006 2008 2009 20102007 201220110%
1%
2%
3%
4%
5%
6%
7%
8%
9%
10%
3500
3700
3900
4100
4300
4500
4700
4900
GW
h
Energy Conveyed vs Interest Rates
Historical Volumes April 10 AMP Forecast
90 day bank bill rates (%) Volume Growth Rate (June) (%)
$ b
illio
n
Year ending June
2003 2004 2005 2006 2008 2009 20102007 201220113500
3700
3900
4100
4300
4500
4700
4900
GW
h
Historical Volumes April 10 AMP Forecast
Agricultural Gross Output ($b)
10
12
14
16
18
20
22
24
$ b
illio
n
Energy Conveyed vs Agricultural Output
110
115
120
125
130
135
140
145
Energy Conveyed vs GDP
Figure 7.3: Powerco Electricity Volumes against Econometric Data

Return to Index126 ASSET MANAGEMENT PLAN ELECTRICITY NETWORKS FY2010 – FY2019
Growth in new customer connections (measured using registry data and looking at ICP’s that retailers have switched from ‘ready’ to ‘active’ status (which effectively ‘looks through’ various historical retailer data issues) has trended at between 5,000 and 4,000 (in round numbers) in recent years. This is illustrated in the following chart.
0
1000
2000
3000
4000
5000
6000
2005 2006 2007 2008 2009
No.
ICP
s C
reat
ed
Year Ending 31 March
ICP Creation Trend
Figure 7.4: New ICP Additions
Powerco’s footprint has experienced significant population and household growth as shown in Table 7.6.
Table 7.6: Forecast Population Growths
Eastern Region Forecast Population Growth
2007 2011 2016CAGR (07-11)
CAGR (07-16)
Thames Valley 98,550 101,750 103,950 0.8% 0.6%
Tauranga 152,700 167,300 184,100 2.3% 2.1%
Total Eastern 251,250 269,050 288,050 1.7% 1.5%
Source: NZIER
Western Region Forecast Population Growth
2007 2011 2016CAGR (07-11)
CAGR (07-16)
Taranaki 107,290 110,170 112,350 0.7% 0.5%
Manawatu 198,300 206,200 213,400 1.0% 0.8%
Wairarapa 39,540 40,750 41,740 0.8% 0.6%
Total Western 345,130 357,120 367,490 0.9% 0.7%
Source: NZIER
NZ West East
Projected increase in number of households 2001-2021(%) 28.0% 10.2% 34.1%
Source: Statistics NZ
Electricity Volume Forecast7.5.7.
The historical and forecast drivers of growth have driven substantial growth in Powerco’s volume and connection numbers during the past decade. Based on the drivers of electricity usage and their associated forecasts, this growth is projected to continue. The medium-term, top-down growth forecasts are shown in Figure 7.5 and Table 7.7 below.
Actual & Forecast Eastern Volumes vs Waikato/ Bay of Plenty Real GDP
Financial Year
GW
h
$ b
illio
n
2006
2007
2008
2003
2004
2005
2009
2010
2011
2012
2013
2014
21
22
23
24
25
26
27
1800
1900
2000
2100
2200
2300
2400
2500
2600 Real GDP
CAGR 2.6%
Historical Volumes April 10 AMP Forecast
Taranaki/ Manawatu Wanganui GDP

Return to Index 127ASSET MANAGEMENT PLAN ELECTRICITY NETWORKS FY2010 – FY2019
Actual & Forecast Western Volumes vs Taranaki/ Manawatu Wanganui Real GDP
Financial YearHistorical Volumes April 10 AMP Forecast
Taranaki/ Manawatu Wanganui GDP
GW
h
$ b
illio
n
2006
2007
2008
2003
2004
2005
2009
2010
2011
2012
2013
2014
12.0
12.5
13.0
13.5
14.0
14.5
2000
2100
2200
2300
2400
2500
CAGR 1.1%
Figure 7.5: Powerco Electricity Volume Forecast
Table 7.7 Forecast growth in electricity volumes (2010 -2015)
kWh Growth forecast (Electricity Only)
Assumption 2010 2011 2012 2013 2014 2015
Eastern Region (Model) 1.25 1.75 2.25 2.50 2.50 2.50
Western Region (Model) 1.25 1.25 1.25 1.25 1.25 1.25
Eastern Region (medium recession scenario) 1.5 1.5 2.5 2.5 2.5 2.5
Western Region (medium recession scenario) 0.67 0.67 1.0 1.0 1.0 1.0
Zone Substation Load Forecasting Process7.5.8.
The process used by Powerco for peak demand forecasting is similar to the process for forecasting energy volumes except that the starting point is MW demands rather than GWh energy volumes and the GDP and population factors are broken down into a local level. The model assumes that load factors and summer and winter peaks are static: analysis on load factors and summer / winter peaks shows that over the last eight or so years, this has been the case. The chart below shows the process for zone substation demand forecasting diagrammatically:
Presently embedded generation is having a very limited impact on the demand forecasts. Where it is installed, it is taken into account in the forecasts. Often, embedded generation has the impact of increasing the forecast growth at a GXP
or zone substation because it offsets the underlying demand leaving a smaller denominator for the growth percentage to be calculated from.
Changes in rural land use are having a marked effect in some areas, notably including the increase in electricity demand required to power irrigation pumps. Attention has been directed towards developing a better understanding of such influences and to taking appropriate cognisance of them in the forecast. The assumed outlook for local growth in both agriculture and associated process industries acknowledges observed trends and relevant commentaries, including aspects noted in discussion with economic development agencies.
Close attention to the land use policies and (intended) zoning provisions adopted by territorial planning authorities allows closer definition of where growth in population and/or industry is likely to occur. It thus provides for better definition of the zone substation locations where increased demand is likely to be experienced. In relatively low-growth districts where the location of future subdivisions and industrial parks has not been so closely defined, attention has nonetheless been given to geographical constraints on future development.
The forecast is generally expressed in absolute peak demand and 98th percentile maximum demands. Which peak demand to use depends on the purpose it is used for. The 98th percentile maximum demand is the normal peak demand used for system growth planning as it eliminates most load transfers between substations. The absolute peak demand is used if load transfers need to be taken into account.
STEP 2
Allocate GDP and population forecasts (from the Dept of Statistics) by each network zone (zone substation area). Because the statistical data was by TLA area, the network zones areas do not match, so a best fit interpolation was applied, judged by reviewing maps and local information.
STEP 3
Undertake a two element regression for each zone substation using local GDP and local population forecasts as inputs and the recent actual maximum demand as the starting point.
STEP 4
Adjust the forecast where necessary to cater for known step load charges due to large consumers (both increases and decreases in load), known local subdivision activity and known local land use/zoning changes. For prudent forecast adjustments should err toward the high side.
Convert MW to MVA
use the forecast for system growth planning .
STEP1
Obtain historical zone substation demands from zone substation half hourly metering data. If not available, obtain Maximum Demand Indicator (MDI) and/or LT40 readings from zone substation.

Return to Index128 ASSET MANAGEMENT PLAN ELECTRICITY NETWORKS FY2010 – FY2019
Forecast Demand at Zone Substations7.5.9.
Tables 7.8 to 7.13 provide a forecast of the peak demand (in MVA) at the various zone substations within each of Powerco’s subregions. Growth figures are for the area currently supplied from each substation location. Where it will become impractical to increase the capacity of existing substations to accommodate long-term load growth options, such as load transfers, network reinforcement or non-network solutions will be investigated. In some cases this will include the installation of new substations at strategic locations.
Other points to be noted include:
The figures presented in the following tables are for peak demand values and growth •figures before the impact of the recession.
Provision is made for the effect that changes in the mix of domestic and business •consumers may have on the demand peak.
The maximum half-hourly average figure is the highest half-hourly peak. It may have •occurred temporarily – when load was being transferred, for example. However, as such transfers may be repeated, items of equipment with little or no cyclic capability, such as switchgear and cable, need to be sized to accommodate such loads.
The 98th percentile half-hourly average is the load level used for determining •transformer ratings and load transfer capability, for instance.
Provision for something on the minimum load growth level.•
Impact of Uncertainties in the Forecasts7.5.10.
Powerco runs two forecasting philosophies - probable and prudent. The probable is the base forecast and the prudent forecast is a somewhat higher forecast that allows for upside risk in the growth project. Generally the probable forecast is used for volume forecasting and the prudent forecast is used for planning the capacity and security levels in the network.
Because the load demand forecast is one of the main drivers of development capital expenditure in order to provide adequate network capacity and security, a prudent forecast is used. The prudent forecast allows for the natural variations in demand that occur due to variations in the diversity of load and allows some wriggle room should actual demand growth exceed the forecasts.
Graphed below is the aggregate of the historical actual and forecast zone substation 98% demands. This portrays the growth in network maximum demand showing the difference between the “prudent” and “probable” forecasts.
Zone Substation Maximum Demand Growth
Per
centa
ge
Gro
wth 3.0%
2.0%
1.0%
0.0%
-1.0%
-2.0%
5.0%
4.0%
Powerco Powerco Prudent Powerco Probable
Eastern Eastern Prudent Eastern Probable
Western Western Prudent Western Probable
2005 2006 2007 2008 2009 2010 F 2011 F 2012 F 2013 F2013 F 2015 F
Year
Figure 7.6: Powerco Aggregate Maximum Demand Growth
The Forecast7.5.11.
Forecast peak power demands for each zone substation in the Powerco network follow in Table 7.8 to Table 7.13 on the following pages.
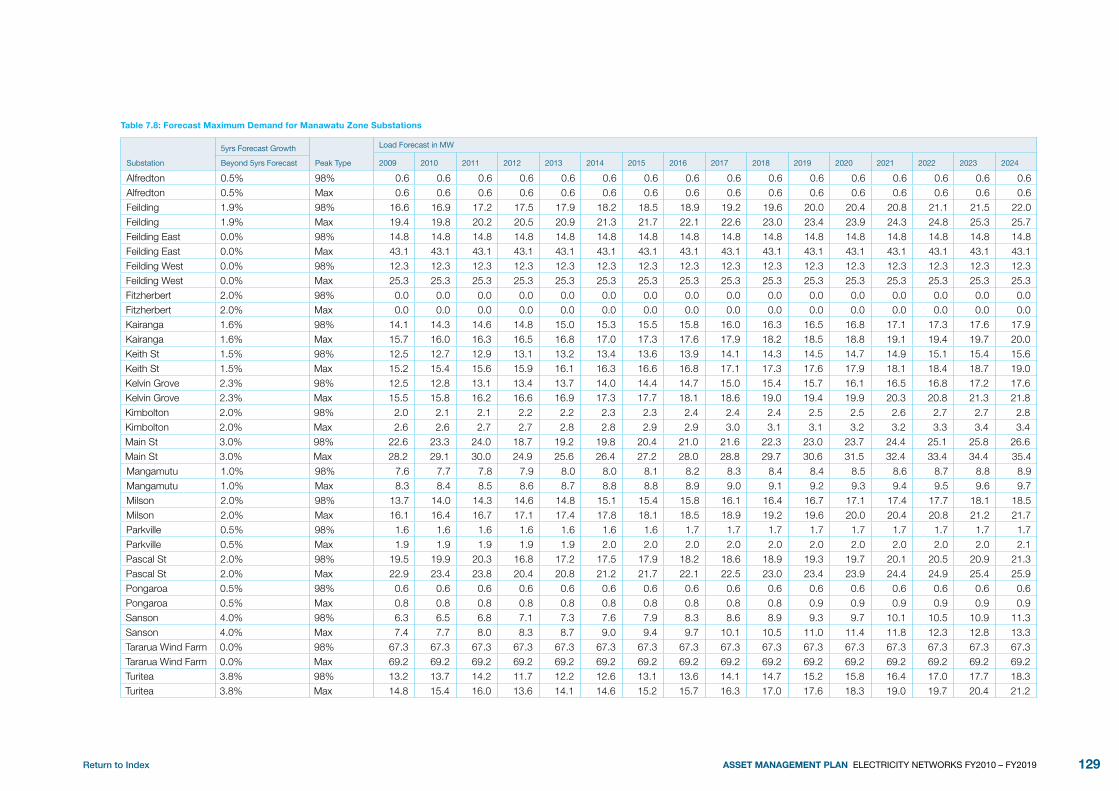
Return to Index 129ASSET MANAGEMENT PLAN ELECTRICITY NETWORKS FY2010 – FY2019
Table 7.8: Forecast Maximum Demand for Manawatu Zone Substations
Substation
5yrs Forecast Growth
Peak Type
Load Forecast in MW
2009 2010 2011 2012 2013 2014 2015 2016 2017 2018 2019 2020 2021 2022 2023 2024Beyond 5yrs Forecast
Alfredton 0.5% 98% 0.6 0.6 0.6 0.6 0.6 0.6 0.6 0.6 0.6 0.6 0.6 0.6 0.6 0.6 0.6 0.6Alfredton 0.5% Max 0.6 0.6 0.6 0.6 0.6 0.6 0.6 0.6 0.6 0.6 0.6 0.6 0.6 0.6 0.6 0.6Feilding 1.9% 98% 16.6 16.9 17.2 17.5 17.9 18.2 18.5 18.9 19.2 19.6 20.0 20.4 20.8 21.1 21.5 22.0Feilding 1.9% Max 19.4 19.8 20.2 20.5 20.9 21.3 21.7 22.1 22.6 23.0 23.4 23.9 24.3 24.8 25.3 25.7Feilding East 0.0% 98% 14.8 14.8 14.8 14.8 14.8 14.8 14.8 14.8 14.8 14.8 14.8 14.8 14.8 14.8 14.8 14.8Feilding East 0.0% Max 43.1 43.1 43.1 43.1 43.1 43.1 43.1 43.1 43.1 43.1 43.1 43.1 43.1 43.1 43.1 43.1Feilding West 0.0% 98% 12.3 12.3 12.3 12.3 12.3 12.3 12.3 12.3 12.3 12.3 12.3 12.3 12.3 12.3 12.3 12.3Feilding West 0.0% Max 25.3 25.3 25.3 25.3 25.3 25.3 25.3 25.3 25.3 25.3 25.3 25.3 25.3 25.3 25.3 25.3Fitzherbert 2.0% 98% 0.0 0.0 0.0 0.0 0.0 0.0 0.0 0.0 0.0 0.0 0.0 0.0 0.0 0.0 0.0 0.0Fitzherbert 2.0% Max 0.0 0.0 0.0 0.0 0.0 0.0 0.0 0.0 0.0 0.0 0.0 0.0 0.0 0.0 0.0 0.0Kairanga 1.6% 98% 14.1 14.3 14.6 14.8 15.0 15.3 15.5 15.8 16.0 16.3 16.5 16.8 17.1 17.3 17.6 17.9Kairanga 1.6% Max 15.7 16.0 16.3 16.5 16.8 17.0 17.3 17.6 17.9 18.2 18.5 18.8 19.1 19.4 19.7 20.0Keith St 1.5% 98% 12.5 12.7 12.9 13.1 13.2 13.4 13.6 13.9 14.1 14.3 14.5 14.7 14.9 15.1 15.4 15.6Keith St 1.5% Max 15.2 15.4 15.6 15.9 16.1 16.3 16.6 16.8 17.1 17.3 17.6 17.9 18.1 18.4 18.7 19.0Kelvin Grove 2.3% 98% 12.5 12.8 13.1 13.4 13.7 14.0 14.4 14.7 15.0 15.4 15.7 16.1 16.5 16.8 17.2 17.6Kelvin Grove 2.3% Max 15.5 15.8 16.2 16.6 16.9 17.3 17.7 18.1 18.6 19.0 19.4 19.9 20.3 20.8 21.3 21.8Kimbolton 2.0% 98% 2.0 2.1 2.1 2.2 2.2 2.3 2.3 2.4 2.4 2.4 2.5 2.5 2.6 2.7 2.7 2.8Kimbolton 2.0% Max 2.6 2.6 2.7 2.7 2.8 2.8 2.9 2.9 3.0 3.1 3.1 3.2 3.2 3.3 3.4 3.4Main St 3.0% 98% 22.6 23.3 24.0 18.7 19.2 19.8 20.4 21.0 21.6 22.3 23.0 23.7 24.4 25.1 25.8 26.6Main St 3.0% Max 28.2 29.1 30.0 24.9 25.6 26.4 27.2 28.0 28.8 29.7 30.6 31.5 32.4 33.4 34.4 35.4Mangamutu 1.0% 98% 7.6 7.7 7.8 7.9 8.0 8.0 8.1 8.2 8.3 8.4 8.4 8.5 8.6 8.7 8.8 8.9Mangamutu 1.0% Max 8.3 8.4 8.5 8.6 8.7 8.8 8.8 8.9 9.0 9.1 9.2 9.3 9.4 9.5 9.6 9.7Milson 2.0% 98% 13.7 14.0 14.3 14.6 14.8 15.1 15.4 15.8 16.1 16.4 16.7 17.1 17.4 17.7 18.1 18.5Milson 2.0% Max 16.1 16.4 16.7 17.1 17.4 17.8 18.1 18.5 18.9 19.2 19.6 20.0 20.4 20.8 21.2 21.7Parkville 0.5% 98% 1.6 1.6 1.6 1.6 1.6 1.6 1.6 1.7 1.7 1.7 1.7 1.7 1.7 1.7 1.7 1.7Parkville 0.5% Max 1.9 1.9 1.9 1.9 1.9 2.0 2.0 2.0 2.0 2.0 2.0 2.0 2.0 2.0 2.0 2.1Pascal St 2.0% 98% 19.5 19.9 20.3 16.8 17.2 17.5 17.9 18.2 18.6 18.9 19.3 19.7 20.1 20.5 20.9 21.3Pascal St 2.0% Max 22.9 23.4 23.8 20.4 20.8 21.2 21.7 22.1 22.5 23.0 23.4 23.9 24.4 24.9 25.4 25.9Pongaroa 0.5% 98% 0.6 0.6 0.6 0.6 0.6 0.6 0.6 0.6 0.6 0.6 0.6 0.6 0.6 0.6 0.6 0.6Pongaroa 0.5% Max 0.8 0.8 0.8 0.8 0.8 0.8 0.8 0.8 0.8 0.8 0.9 0.9 0.9 0.9 0.9 0.9Sanson 4.0% 98% 6.3 6.5 6.8 7.1 7.3 7.6 7.9 8.3 8.6 8.9 9.3 9.7 10.1 10.5 10.9 11.3Sanson 4.0% Max 7.4 7.7 8.0 8.3 8.7 9.0 9.4 9.7 10.1 10.5 11.0 11.4 11.8 12.3 12.8 13.3Tararua Wind Farm 0.0% 98% 67.3 67.3 67.3 67.3 67.3 67.3 67.3 67.3 67.3 67.3 67.3 67.3 67.3 67.3 67.3 67.3Tararua Wind Farm 0.0% Max 69.2 69.2 69.2 69.2 69.2 69.2 69.2 69.2 69.2 69.2 69.2 69.2 69.2 69.2 69.2 69.2Turitea 3.8% 98% 13.2 13.7 14.2 11.7 12.2 12.6 13.1 13.6 14.1 14.7 15.2 15.8 16.4 17.0 17.7 18.3Turitea 3.8% Max 14.8 15.4 16.0 13.6 14.1 14.6 15.2 15.7 16.3 17.0 17.6 18.3 19.0 19.7 20.4 21.2

Return to Index130 ASSET MANAGEMENT PLAN ELECTRICITY NETWORKS FY2010 – FY2019
Table 7.9: Forecast Maximum Demand for Taranaki Zone Substations
Substation
5yrs Forecast Growth
Peak Type
Load Forecast in MW
2009 2010 2011 2012 2013 2014 2015 2016 2017 2018 2019 2020 2021 2022 2023 2024Beyond 5yrs Forecast
Bell Block 2.3% 98% 16.1 16.4 13.3 13.6 13.9 14.2 14.6 14.9 15.3 15.6 16.0 16.3 16.7 17.1 17.5 17.9
Bell Block 2.3% Max 18.3 18.7 15.6 16.0 16.4 16.7 17.1 17.5 17.9 18.3 18.8 19.2 19.6 20.1 20.5 21.0
Brooklands 1.8% 98% 16.2 16.5 13.1 13.3 13.5 13.8 14.0 14.3 14.5 14.8 15.1 15.3 15.6 15.9 16.2 16.5
Brooklands 1.8% Max 21.8 22.2 18.9 19.3 19.6 19.9 20.3 20.7 21.0 21.4 21.8 22.2 22.6 23.0 23.4 23.8
Cambria 1.5% 98% 12.5 12.7 12.9 13.0 13.2 13.4 13.6 13.9 14.1 14.3 14.5 14.7 14.9 15.1 15.4 15.6
Cambria 1.5% Max 15.8 16.1 16.3 16.5 16.8 17.0 17.3 17.6 17.8 18.1 18.4 18.6 18.9 19.2 19.5 19.8
Cardiff 0.5% 98% 1.2 1.2 1.2 1.2 1.2 1.2 1.2 1.2 1.2 1.2 1.2 1.2 1.3 1.3 1.3 1.3
Cardiff 0.5% Max 1.3 1.3 1.3 1.4 1.4 1.4 1.4 1.4 1.4 1.4 1.4 1.4 1.4 1.4 1.4 1.4
City 1.9% 98% 17.6 17.9 17.5 17.8 18.2 18.5 18.9 19.2 19.6 20.0 20.3 20.7 21.1 21.5 21.9 22.3
City 1.9% Max 21.2 21.6 21.2 21.6 22.0 22.4 22.9 23.3 23.8 24.2 24.7 25.1 25.6 26.1 26.6 27.1
Cloton Rd 1.5% 98% 7.2 7.3 7.4 7.5 7.6 7.8 7.9 8.0 8.1 8.2 8.4 8.5 8.6 8.7 8.9 9.0
Cloton Rd 1.5% Max 8.9 9.0 9.1 9.3 9.4 9.6 9.7 9.9 10.0 10.2 10.3 10.5 10.6 10.8 10.9 11.1
Douglas 1.0% 98% 1.3 1.3 1.3 1.3 1.3 1.3 1.3 1.4 1.4 1.4 1.4 1.4 1.4 1.4 1.5 1.5
Douglas 1.0% Max 1.8 1.8 1.8 1.8 1.8 1.8 1.9 1.9 1.9 1.9 1.9 2.0 2.0 2.0 2.0 2.0
Eltham 1.5% 98% 9.0 9.1 9.2 9.4 9.5 9.7 9.8 10.0 10.1 10.3 10.4 10.6 10.7 10.9 11.0 11.2
Eltham 1.5% Max 9.9 10.0 10.2 10.4 10.5 10.7 10.8 11.0 11.2 11.3 11.5 11.7 11.8 12.0 12.2 12.4
Inglewood 1.2% 98% 4.1 4.1 4.2 4.2 4.3 4.4 4.4 4.5 4.5 4.6 4.6 4.7 4.7 4.8 4.8 4.9
Inglewood 1.2% Max 5.4 5.5 5.5 5.6 5.7 5.7 5.8 5.9 5.9 6.0 6.1 6.1 6.2 6.3 6.4 6.4
Kaponga 0.5% 98% 2.8 2.8 2.8 2.8 2.8 2.8 2.8 2.9 2.9 2.9 2.9 2.9 2.9 2.9 3.0 3.0
Kaponga 0.5% Max 3.0 3.1 3.1 3.1 3.1 3.1 3.1 3.2 3.2 3.2 3.2 3.2 3.2 3.3 3.3 3.3
Kapuni 2.0% 98% 6.7 6.9 7.0 7.1 7.3 7.4 7.6 7.7 7.9 8.0 8.2 8.4 8.5 8.7 8.9 9.0
Kapuni 2.0% Max 9.1 9.3 9.4 9.6 9.8 10.0 10.2 10.4 10.6 10.9 11.1 11.3 11.5 11.7 12.0 12.2
Katere 2.0% 98% 0.0 0.0 8.0 8.2 8.3 8.5 8.7 8.8 9.0 9.2 9.4 9.6 9.8 9.9 10.1 10.3
Katere 2.0% Max 0.0 0.0 8.0 8.2 8.3 8.5 8.7 8.8 9.0 9.2 9.4 9.6 9.8 9.9 10.1 10.3
Livingstone 0.5% 98% 2.4 2.4 2.4 2.4 2.4 2.5 2.5 2.5 2.5 2.5 2.5 2.5 2.5 2.6 2.6 2.6
Livingstone 0.5% Max 2.7 2.7 2.7 2.7 2.7 2.8 2.8 2.8 2.8 2.8 2.8 2.8 2.9 2.9 2.9 2.9
Manaia 2.5% 98% 5.5 5.7 5.8 5.9 6.1 6.2 6.4 6.6 6.7 6.9 7.1 7.2 7.4 7.6 7.8 8.0
Manaia 2.5% Max 6.5 6.6 6.8 7.0 7.1 7.3 7.5 7.7 7.9 8.1 8.3 8.5 8.7 8.9 9.1 9.3
Mangorei 0.0% 98% 2.9 2.9 2.9 2.9 2.9 2.9 2.9 2.9 2.9 2.9 2.9 2.9 2.9 2.9 2.9 2.9
Mangorei 0.0% Max 3.5 3.5 3.5 3.5 3.5 3.5 3.5 3.5 3.5 3.5 3.5 3.5 3.5 3.5 3.5 3.5

Return to Index 131ASSET MANAGEMENT PLAN ELECTRICITY NETWORKS FY2010 – FY2019
Substation
5yrs Forecast Growth
Peak Type
Load Forecast in MW
2009 2010 2011 2012 2013 2014 2015 2016 2017 2018 2019 2020 2021 2022 2023 2024Beyond 5yrs Forecast
McKee 0.0% 98% 0.9 0.9 0.9 0.9 0.9 0.9 0.9 0.9 0.9 0.9 0.9 0.9 0.9 0.9 0.9 0.9
McKee 0.0% Max 0.9 0.9 0.9 0.9 0.9 0.9 0.9 0.9 0.9 0.9 0.9 0.9 0.9 0.9 0.9 0.9
Motukawa 1.0% 98% 1.0 1.0 1.0 1.0 1.0 1.0 1.1 1.1 1.1 1.1 1.1 1.1 1.1 1.1 1.1 1.2
Motukawa 1.0% Max 1.3 1.3 1.3 1.3 1.3 1.3 1.4 1.4 1.4 1.4 1.4 1.4 1.4 1.5 1.5 1.5
Ngariki 0.5% 98% 2.0 2.1 2.1 2.1 2.1 2.1 2.1 2.1 2.1 2.1 2.1 2.2 2.2 2.2 2.2 2.2
Ngariki 0.5% Max 2.2 2.3 2.3 2.3 2.3 2.3 2.3 2.3 2.3 2.4 2.4 2.4 2.4 2.4 2.4 2.4
Oakura 5.0% 98% 2.6 2.7 2.8 3.0 3.1 3.3 3.4 3.6 3.8 4.0 4.2 4.4 4.6 4.8 5.1 5.3
Oakura 5.0% Max 3.1 3.3 3.4 3.6 3.8 4.0 4.2 4.4 4.6 4.8 5.0 5.3 5.6 5.8 6.1 6.4
Oaonui 0.0% 98% 1.4 1.4 1.4 1.4 1.4 1.4 1.4 1.4 1.4 1.4 1.4 1.4 1.4 1.4 1.4 1.4
Oaonui 0.0% Max 1.7 1.7 1.7 1.7 1.7 1.7 1.7 1.7 1.7 1.7 1.7 1.7 1.7 1.7 1.7 1.7
Pohokura 10.0% 98% 1.4 1.5 1.7 1.8 2.0 2.2 2.4 2.7 2.9 3.2 3.5 3.9 4.3 4.7 5.2 5.7
Pohokura 10.0% Max 1.8 2.0 2.2 2.4 2.7 2.9 3.2 3.5 3.9 4.3 4.7 5.2 5.7 6.3 6.9 7.6
Pungarehu 0.5% 98% 2.8 2.8 2.8 2.8 2.8 2.8 2.9 2.9 2.9 2.9 2.9 2.9 2.9 3.0 3.0 3.0
Pungarehu 0.5% Max 4.7 4.7 4.8 4.8 4.8 4.8 4.9 4.9 4.9 4.9 5.0 5.0 5.0 5.0 5.1 5.1
Strathmore 0.0% 98% 0.3 0.3 0.3 0.3 0.3 0.3 0.3 0.3 0.3 0.3 0.3 0.3 0.3 0.3 0.3 0.3
Strathmore 0.0% Max 0.5 0.5 0.5 0.5 0.5 0.5 0.5 0.5 0.5 0.5 0.5 0.5 0.5 0.5 0.5 0.5
Tasman 0.5% 98% 5.8 5.8 5.8 5.8 5.9 5.9 5.9 6.0 6.0 6.0 6.1 6.1 6.1 6.1 6.2 6.2
Tasman 0.5% Max 6.5 6.5 6.5 6.6 6.6 6.6 6.7 6.7 6.7 6.8 6.8 6.8 6.9 6.9 7.0 7.0
TP Moturoa 2.2% 98% 16.9 17.3 17.7 18.1 15.4 15.7 16.1 16.4 16.8 17.1 17.5 17.9 18.3 18.7 19.1 19.5
TP Moturoa 2.2% Max 20.0 20.4 20.8 21.3 18.7 19.1 19.5 19.9 20.4 20.8 21.3 21.7 22.2 22.7 23.2 23.7
Waihapa 0.0% 98% 1.2 1.2 1.2 1.2 1.2 1.2 1.2 1.2 1.2 1.2 1.2 1.2 1.2 1.2 1.2 1.2
Waihapa 0.0% Max 1.2 1.2 1.2 1.2 1.2 1.2 1.2 1.2 1.2 1.2 1.2 1.2 1.2 1.2 1.2 1.2
Waitara East 1.0% 98% 4.4 4.4 4.5 4.5 4.6 4.6 4.6 4.7 4.7 4.8 4.8 4.9 4.9 5.0 5.0 5.1
Waitara East 1.0% Max 5.3 5.4 5.4 5.5 5.5 5.6 5.7 5.7 5.8 5.8 5.9 6.0 6.0 6.1 6.1 6.2
Whareroa 1.0% 98% 3.5 3.5 3.5 3.6 3.6 3.6 3.7 3.7 3.7 3.8 3.8 3.9 3.9 3.9 4.0 4.0
Whareroa 1.0% Max 5.0 5.1 5.1 5.2 5.2 5.3 5.3 5.4 5.5 5.5 5.6 5.6 5.7 5.7 5.8 5.8

Return to Index132 ASSET MANAGEMENT PLAN ELECTRICITY NETWORKS FY2010 – FY2019
Table 7.10: Forecast Maximum Demand for Tauranga Zone Substations
Substation
5yrs Forecast Growth
Peak Type
Load Forecast in MW
2009 2010 2011 2012 2013 2014 2015 2016 2017 2018 2019 2020 2021 2022 2023 2024Beyond 5yrs Forecast
Aongatete 3.0% 98% 4.3 4.5 3.1 3.2 3.3 3.4 3.5 3.6 3.7 3.8 3.9 4.0 4.2 4.3 4.4 4.5
Aongatete 3.0% Max 6.3 6.5 5.2 5.3 5.5 5.7 5.8 6.0 6.2 6.4 6.6 6.8 7.0 7.2 7.4 7.6
Atuaroa 4.0% 98% 5.8 6.0 6.2 6.5 6.7 7.0 7.3 7.6 7.9 8.2 8.5 8.9 9.2 9.6 10.0 10.4
Atuaroa 4.0% Max 6.8 7.0 7.3 7.6 7.9 8.2 8.6 8.9 9.3 9.6 10.0 10.4 10.8 11.3 11.7 12.2
Hamilton St 3.5% 98% 11.6 12.0 12.4 12.9 13.3 13.8 14.3 14.8 15.3 15.8 16.4 16.9 17.5 18.1 18.8 19.4
Hamilton St 3.5% Max 14.0 14.5 15.0 15.5 16.1 16.6 17.2 17.8 18.4 19.1 19.8 20.5 21.2 21.9 22.7 23.5
Katikati 3.0% 98% 5.7 5.9 6.0 6.2 6.4 6.6 6.8 7.0 7.2 7.4 7.6 7.9 8.1 8.3 8.6 8.9
Katikati 3.0% Max 7.0 7.2 7.4 7.6 7.8 8.1 8.3 8.6 8.8 9.1 9.3 9.6 9.9 10.2 10.5 10.8
Kauri Point 2.0% 98% 2.0 2.0 2.1 2.1 2.1 2.2 2.2 2.3 2.3 2.4 2.4 2.5 2.5 2.6 2.6 2.7
Kauri Point 2.0% Max 2.7 2.8 2.8 2.9 2.9 3.0 3.0 3.1 3.2 3.2 3.3 3.4 3.4 3.5 3.6 3.6
Matua 1.5% 98% 7.9 8.0 8.1 8.2 8.4 8.5 8.6 8.7 8.9 9.0 9.1 9.3 9.4 9.6 9.7 9.8
Matua 1.5% Max 9.3 9.4 9.6 9.7 9.9 10.0 10.2 10.3 10.5 10.6 10.8 11.0 11.1 11.3 11.5 11.6
TP Mt Maunganui 4.0% 98% 15.0 15.6 16.2 16.9 17.5 18.2 19.0 19.7 20.5 21.3 22.2 23.1 24.0 25.0 26.0 27.0
TP Mt Maunganui 4.0% Max 19.5 20.3 21.1 22.0 22.8 23.8 24.7 25.7 26.7 27.8 28.9 30.1 31.3 32.5 33.8 35.2
Omokoroa 5.0% 98% 7.1 7.4 9.3 9.8 10.2 10.8 11.3 11.9 12.4 13.1 13.7 14.4 15.1 15.9 16.7 17.5
Omokoroa 5.0% Max 9.0 9.4 11.4 12.0 12.6 13.2 13.8 14.5 15.3 16.0 16.8 17.7 18.5 19.5 20.4 21.5
Otumoetai 2.0% 98% 12.6 12.9 13.2 13.4 13.7 14.0 14.2 14.5 14.8 15.1 15.4 15.7 16.0 16.4 16.7 17.0
Otumoetai 2.0% Max 17.5 17.8 18.2 18.5 18.9 19.3 19.7 20.0 20.4 20.9 21.3 21.7 22.1 22.6 23.0 23.5
Papamoa 6.0% 98% 18.7 19.8 21.0 22.3 23.6 25.0 26.5 28.1 29.8 31.6 33.5 35.5 37.6 39.9 42.3 44.8
Papamoa 6.0% Max 22.8 24.2 25.7 27.2 28.8 30.6 32.4 34.3 36.4 38.6 40.9 43.3 45.9 48.7 51.6 54.7
Pongakawa 2.0% 98% 4.6 4.7 2.8 2.9 2.9 3.0 3.0 3.1 3.2 3.2 3.3 3.4 3.4 3.5 3.6 3.6
Pongakawa 2.0% Max 5.5 5.6 3.8 3.8 3.9 4.0 4.1 4.1 4.2 4.3 4.4 4.5 4.6 4.7 4.8 4.9
Te Puke 3.0% 98% 17.0 17.5 16.0 16.5 17.0 17.5 18.0 18.6 19.1 19.7 20.3 20.9 21.5 22.2 22.9 23.5
Te Puke 3.0% Max 18.9 19.5 18.1 18.6 19.2 19.7 20.3 20.9 21.6 22.2 22.9 23.6 24.3 25.0 25.7 26.5
TP_Tauranga 4.5% 98% 22.0 23.0 24.0 25.1 20.2 21.1 22.1 23.1 24.1 25.2 26.3 27.5 28.8 30.1 31.4 32.8
TP_Tauranga 4.5% Max 26.5 27.7 29.0 30.3 25.6 26.8 28.0 29.2 30.6 31.9 33.4 34.9 36.4 38.1 39.8 41.6
Triton 4.0% 98% 20.1 20.9 21.8 12.6 13.1 13.7 14.2 14.8 15.4 16.0 16.6 17.3 18.0 18.7 19.4 20.2
Triton 4.0% Max 24.1 25.0 26.0 17.1 17.8 18.5 19.2 20.0 20.8 21.6 22.5 23.4 24.3 25.3 26.3 27.4
Waihi Rd 3.5% 98% 13.9 14.1 14.2 14.3 14.5 14.6 14.8 14.9 15.1 15.2 15.4 15.5 15.7 15.8 16.0 16.2
Waihi Rd 3.5% Max 15.6 15.8 15.9 16.1 16.3 16.4 16.6 16.8 16.9 17.1 17.3 17.4 17.6 17.8 18.0 18.1
Welcome Bay 3.5% 98% 14.8 15.3 15.8 16.4 17.0 17.6 18.2 18.8 19.5 20.1 20.8 21.6 22.3 23.1 23.9 24.8
Welcome Bay 3.5% Max 19.1 19.7 20.4 21.1 21.9 22.6 23.4 24.2 25.1 26.0 26.9 27.8 28.8 29.8 30.8 31.9

Return to Index 133ASSET MANAGEMENT PLAN ELECTRICITY NETWORKS FY2010 – FY2019
Table 7.11: Forecast Maximum Demand for Valley Zone Substations
Substation
5yrs Forecast Growth
Peak Type
Load Forecast in MW
2009 2010 2011 2012 2013 2014 2015 2016 2017 2018 2019 2020 2021 2022 2023 2024Beyond 5yrs Forecast
Baird Rd 2.0% 98% 6.8 6.9 7.1 7.2 7.3 7.5 7.6 7.8 7.9 8.1 8.3 8.4 8.6 8.8 8.9 9.1
Baird Rd 2.0% Max 9.9 10.1 10.3 10.5 10.7 10.9 11.2 11.4 11.6 11.8 12.1 12.3 12.6 12.8 13.1 13.3
Browne St 2.0% 98% 6.1 6.2 6.3 6.5 6.6 6.7 6.9 7.0 7.1 7.3 7.4 7.6 7.7 7.9 8.0 8.2
Browne St 2.0% Max 10.9 11.1 11.3 11.5 11.7 12.0 12.2 12.5 12.7 13.0 13.2 13.5 13.8 14.0 14.3 14.6
Coromandel 2.0% 98% 3.0 3.0 3.1 3.1 3.2 3.3 3.3 3.4 3.5 3.5 3.6 3.7 3.8 3.8 3.9 4.0
Coromandel 2.0% Max 4.0 4.1 4.1 4.2 4.3 4.4 4.5 4.6 4.7 4.8 4.8 4.9 5.0 5.1 5.2 5.4
Farmer Rd 2.0% 98% 6.0 6.1 6.2 6.3 6.5 6.6 6.7 6.9 7.0 7.1 7.3 7.4 7.6 7.7 7.9 8.0
Farmer Rd 2.0% Max 6.9 7.0 7.2 7.3 7.5 7.6 7.8 7.9 8.1 8.2 8.4 8.6 8.7 8.9 9.1 9.3
Kerepehi 1.0% 98% 6.6 6.7 6.7 6.8 6.9 6.9 7.0 7.1 7.1 7.2 7.3 7.4 7.4 7.5 7.6 7.7
Kerepehi 1.0% Max 7.9 8.0 8.1 8.2 8.3 8.3 8.4 8.5 8.6 8.7 8.8 8.9 8.9 9.0 9.1 9.2
Lake Rd 1.0% 98% 4.5 4.5 4.6 4.6 4.7 4.7 4.8 4.8 4.9 4.9 5.0 5.0 5.1 5.1 5.2 5.2
Lake Rd 1.0% Max 5.3 5.4 5.4 5.5 5.6 5.6 5.7 5.7 5.8 5.8 5.9 6.0 6.0 6.1 6.1 6.2
Maraetai Rd 2.0% 98% 7.9 8.1 8.2 8.4 8.6 8.7 8.9 9.1 9.3 9.4 9.6 9.8 10.0 10.2 10.4 10.6
Maraetai Rd 2.0% Max 9.5 9.7 9.9 10.1 10.3 10.5 10.7 10.9 11.1 11.3 11.6 11.8 12.0 12.3 12.5 12.8
Matatoki 1.0% 98% 3.4 3.4 3.4 3.5 3.5 3.5 3.6 3.6 3.7 3.7 3.7 3.8 3.8 3.8 3.9 3.9
Matatoki 1.0% Max 4.9 4.9 5.0 5.0 5.1 5.1 5.2 5.2 5.3 5.3 5.4 5.5 5.5 5.6 5.6 5.7
Mikkelsen Rd 2.0% 98% 12.1 12.4 12.6 12.9 13.1 13.4 13.7 13.9 14.2 14.5 14.8 15.1 15.4 15.7 16.0 16.3
Mikkelsen Rd 2.0% Max 13.3 13.6 13.9 14.1 14.4 14.7 15.0 15.3 15.6 15.9 16.2 16.6 16.9 17.2 17.6 17.9
Morrinsville 1.0% 98% 7.5 7.6 7.6 7.7 7.8 7.9 8.0 8.0 8.1 8.2 8.3 8.4 8.4 8.5 8.6 8.7
Morrinsville 1.0% Max 9.5 9.6 9.7 9.8 9.9 10.0 10.1 10.2 10.3 10.4 10.5 10.6 10.7 10.8 10.9 11.0
Paeroa 1.0% 98% 6.0 6.1 6.1 6.2 6.2 6.3 6.4 6.4 6.5 6.6 6.6 6.7 6.8 6.8 6.9 7.0
Paeroa 1.0% Max 8.0 8.0 8.1 8.2 8.3 8.4 8.5 8.5 8.6 8.7 8.8 8.9 9.0 9.1 9.2 9.3
Piako 1.5% 98% 10.6 10.7 10.9 11.0 11.2 11.4 11.6 11.7 11.9 12.1 12.3 12.4 12.6 12.8 13.0 13.2
Piako 1.5% Max 12.7 12.9 13.1 13.3 13.5 13.7 13.9 14.1 14.3 14.5 14.7 15.0 15.2 15.4 15.6 15.9
Putaruru 1.0% 98% 9.3 9.4 9.5 9.6 9.7 9.8 9.9 10.0 10.1 10.2 10.3 10.4 10.5 10.6 10.7 10.8
Putaruru 1.0% Max 10.8 10.9 11.0 11.1 11.2 11.3 11.4 11.5 11.7 11.8 11.9 12.0 12.1 12.3 12.4 12.5
Tahuna 1.0% 98% 4.7 4.7 4.7 4.8 4.8 4.9 4.9 5.0 5.0 5.1 5.1 5.2 5.2 5.3 5.4 5.4

Return to Index134 ASSET MANAGEMENT PLAN ELECTRICITY NETWORKS FY2010 – FY2019
Substation
5yrs Forecast Growth
Peak Type
Load Forecast in MW
2009 2010 2011 2012 2013 2014 2015 2016 2017 2018 2019 2020 2021 2022 2023 2024Beyond 5yrs Forecast
Tahuna 1.0% Max 5.7 5.8 5.8 5.9 5.9 6.0 6.1 6.1 6.2 6.2 6.3 6.4 6.4 6.5 6.6 6.6
Tairua 2.0% 98% 5.1 5.2 5.3 5.4 5.5 5.6 5.7 5.8 6.0 6.1 6.2 6.3 6.4 6.6 6.7 6.8
Tairua 2.0% Max 7.6 7.7 7.9 8.0 8.2 8.4 8.5 8.7 8.9 9.1 9.2 9.4 9.6 9.8 10.0 10.2
Thames 1.0% 98% 10.7 10.8 10.9 11.0 11.2 11.3 11.4 11.5 11.6 11.7 11.8 12.0 12.1 12.2 12.3 12.4
Thames 1.0% Max 14.0 14.1 14.2 14.4 14.5 14.7 14.8 15.0 15.1 15.3 15.4 15.6 15.7 15.9 16.0 16.2
Tirau 1.0% 98% 7.5 7.6 7.7 7.7 7.8 7.9 8.0 8.1 8.1 8.2 8.3 8.4 8.5 8.6 8.6 8.7
Tirau 1.0% Max 8.1 8.2 8.3 8.4 8.5 8.6 8.6 8.7 8.8 8.9 9.0 9.1 9.2 9.3 9.4 9.4
Tower Rd 2.0% 98% 6.9 7.0 7.2 7.3 7.5 7.6 7.8 7.9 8.1 8.3 8.4 8.6 8.8 8.9 9.1 9.3
Tower Rd 2.0% Max 8.8 9.0 9.2 9.4 9.5 9.7 9.9 10.1 10.3 10.5 10.8 11.0 11.2 11.4 11.6 11.9
Waharoa 0.0% 98% 5.7 5.7 5.7 5.7 5.7 5.7 5.7 5.7 5.7 5.7 5.7 5.7 5.7 5.7 5.7 5.7
Waharoa 0.0% Max 6.6 6.6 6.6 6.6 6.6 6.6 6.6 6.6 6.6 6.6 6.6 6.6 6.6 6.6 6.6 6.6
Waihi 1.0% 98% 13.9 14.1 14.2 14.3 14.5 14.6 14.8 14.9 15.1 15.2 15.4 15.5 15.7 15.8 16.0 16.2
Waihi 1.0% Max 15.6 15.8 15.9 16.1 16.3 16.4 16.6 16.8 16.9 17.1 17.3 17.4 17.6 17.8 18.0 18.1
Waihi Beach 2.0% 98% 3.7 3.8 3.9 3.9 4.0 4.1 4.2 4.3 4.3 4.4 4.5 4.6 4.7 4.8 4.9 5.0
Waihi Beach 2.0% Max 5.5 5.6 5.7 5.8 5.9 6.1 6.2 6.3 6.4 6.6 6.7 6.8 7.0 7.1 7.2 7.4
Waitoa 0.0% 98% 9.6 9.6 9.6 9.6 9.6 9.6 9.6 9.6 9.6 9.6 9.6 9.6 9.6 9.6 9.6 9.6
Waitoa 0.0% Max 10.6 10.6 10.6 10.6 10.6 10.6 10.6 10.6 10.6 10.6 10.6 10.6 10.6 10.6 10.6 10.6
Walton 1.0% 98% 4.3 4.4 4.4 4.5 4.5 4.5 4.6 4.6 4.7 4.7 4.8 4.8 4.9 4.9 5.0 5.0
Walton 1.0% Max 5.2 5.2 5.3 5.3 5.4 5.4 5.5 5.5 5.6 5.6 5.7 5.8 5.8 5.9 5.9 6.0
Whangamata 1.5% 98% 4.9 4.9 5.0 5.1 5.2 5.2 5.3 5.4 5.5 5.6 5.6 5.7 5.8 5.9 6.0 6.1
Whangamata 1.5% Max 8.5 8.7 8.8 8.9 9.1 9.2 9.3 9.5 9.6 9.8 9.9 10.1 10.2 10.4 10.5 10.7
Whitianga 3.0% 98% 10.7 11.0 11.3 11.6 12.0 12.3 12.7 13.1 13.5 13.9 14.3 14.7 15.2 15.6 16.1 16.6
Whitianga 3.0% Max 14.9 15.3 15.8 16.2 16.7 17.2 17.7 18.3 18.8 19.4 20.0 20.6 21.2 21.8 22.5 23.2

Return to Index 135ASSET MANAGEMENT PLAN ELECTRICITY NETWORKS FY2010 – FY2019
Table 7.12: Forecast Maximum Demand for Wairarapa Substations
Substation
5yrs Forecast Growth
Peak Type
Load Forecast in MW
2009 2010 2011 2012 2013 2014 2015 2016 2017 2018 2019 2020 2021 2022 2023 2024Beyond 5yrs Forecast
Akura 2.4% 98% 9.6 9.9 10.1 10.3 10.6 10.8 11.1 11.4 11.6 11.9 12.2 12.5 12.8 13.1 13.4 13.7
Akura 2.4% Max 10.8 11.0 11.3 11.5 11.8 12.1 12.4 12.7 13.0 13.3 13.6 14.0 14.3 14.6 15.0 15.3
Awatoitoi 1.0% 98% 1.2 1.2 1.2 1.2 1.2 1.3 1.3 1.3 1.3 1.3 1.3 1.3 1.4 1.4 1.4 1.4
Awatoitoi 1.0% Max 1.2 1.2 1.2 1.2 1.2 1.3 1.3 1.3 1.3 1.3 1.3 1.3 1.4 1.4 1.4 1.4
Chapel 2.0% 98% 12.3 12.6 12.8 13.1 13.4 13.6 13.9 14.2 14.5 14.8 15.0 15.3 15.7 16.0 16.3 16.6
Chapel 2.0% Max 17.9 18.3 18.7 19.0 19.4 19.8 20.2 20.6 21.0 21.4 21.9 22.3 22.8 23.2 23.7 24.1
Clareville 1.0% 98% 7.0 7.1 7.2 7.2 7.3 7.4 7.4 7.5 7.6 7.7 7.7 7.8 7.9 8.0 8.1 8.1
Clareville 1.0% Max 9.5 9.6 9.7 9.8 9.9 10.0 10.1 10.2 10.3 10.4 10.5 10.6 10.7 10.8 10.9 11.0
Featherston 1.0% 98% 3.7 3.7 3.8 3.8 3.8 3.9 3.9 3.9 4.0 4.0 4.1 4.1 4.1 4.2 4.2 4.3
Featherston 1.0% Max 4.4 4.5 4.5 4.5 4.6 4.6 4.7 4.7 4.8 4.8 4.9 4.9 5.0 5.0 5.1 5.1
Gladstone 1.0% 98% 1.1 1.1 1.1 1.1 1.1 1.2 1.2 1.2 1.2 1.2 1.2 1.2 1.2 1.3 1.3 1.3
Gladstone 1.0% Max 1.1 1.1 1.1 1.1 1.1 1.2 1.2 1.2 1.2 1.2 1.2 1.2 1.2 1.3 1.3 1.3
Hau Nui 1.0% 98% 0.3 0.3 0.3 0.3 0.3 0.3 0.3 0.3 0.3 0.3 0.3 0.3 0.3 0.3 0.3 0.3
Hau Nui 1.0% Max 0.3 0.3 0.3 0.3 0.3 0.3 0.3 0.3 0.3 0.3 0.3 0.3 0.3 0.3 0.3 0.3
Kempton 1.0% 98% 3.3 3.3 3.3 3.4 3.4 3.4 3.5 3.5 3.5 3.6 3.6 3.6 3.7 3.7 3.7 3.8
Kempton 1.0% Max 4.7 4.8 4.8 4.9 4.9 5.0 5.0 5.1 5.1 5.2 5.2 5.3 5.3 5.4 5.5 5.5
Martinborough 2.0% 98% 2.9 3.0 3.0 3.1 3.2 3.2 3.3 3.4 3.4 3.5 3.6 3.6 3.7 3.8 3.9 3.9
Martinborough 2.0% Max 4.3 4.4 4.5 4.6 4.7 4.8 4.9 5.0 5.1 5.2 5.3 5.4 5.5 5.6 5.7 5.9
Norfolk 1.5% 98% 6.0 6.1 6.2 6.3 6.4 6.5 6.6 6.7 6.8 6.9 7.0 7.1 7.2 7.3 7.4 7.5
Norfolk 1.5% Max 6.0 6.1 6.2 6.3 6.4 6.5 6.6 6.7 6.8 6.9 7.0 7.1 7.2 7.3 7.4 7.5
Te Ore Ore 2.5% 98% 5.1 5.2 5.4 5.5 5.6 5.8 5.9 6.1 6.2 6.4 6.5 6.7 6.9 7.0 7.2 7.4
Te Ore Ore 2.5% Max 6.1 6.3 6.4 6.6 6.7 6.9 7.1 7.3 7.4 7.6 7.8 8.0 8.2 8.4 8.6 8.9
Tinui 0.5% 98% 0.8 0.8 0.8 0.8 0.8 0.8 0.8 0.8 0.8 0.8 0.9 0.9 0.9 0.9 0.9 0.9
Tinui 0.5% Max 0.8 0.8 0.8 0.8 0.8 0.8 0.8 0.8 0.8 0.8 0.9 0.9 0.9 0.9 0.9 0.9
Tuhitarata 1.0% 98% 2.5 2.5 2.5 2.5 2.6 2.6 2.6 2.6 2.7 2.7 2.7 2.7 2.8 2.8 2.8 2.9
Tuhitarata 1.0% Max 2.5 2.5 2.6 2.6 2.6 2.6 2.7 2.7 2.7 2.7 2.8 2.8 2.8 2.8 2.9 2.9

Return to Index136 ASSET MANAGEMENT PLAN ELECTRICITY NETWORKS FY2010 – FY2019
Table 7.13: Forecast Maximum Demand for Wanganui Substations
Substation
5yrs Forecast Growth
Peak Type
Load Forecast in MW
2009 2010 2011 2012 2013 2014 2015 2016 2017 2018 2019 2020 2021 2022 2023 2024Beyond 5yrs Forecast
Arahina 1.0% 98% 6.5 6.6 6.7 6.7 6.8 6.9 6.9 7.0 7.1 7.1 7.2 7.3 7.4 7.4 7.5 7.6
Arahina 1.0% Max 8.3 8.4 8.5 8.5 8.6 8.7 8.8 8.9 9.0 9.1 9.2 9.3 9.3 9.4 9.5 9.6
Beach Rd 3.5% 98% 6.0 6.2 6.4 6.6 6.8 7.1 7.3 7.6 7.9 8.1 8.4 8.7 9.0 9.3 9.7 10.0
Beach Rd 3.5% Max 7.7 7.9 8.2 8.5 8.8 9.1 9.4 9.8 10.1 10.5 10.8 11.2 11.6 12.0 12.4 12.9
Blink Bonnie 1.0% 98% 2.3 2.3 2.3 2.4 2.4 2.4 2.4 2.5 2.5 2.5 2.5 2.6 2.6 2.6 2.6 2.7
Blink Bonnie 1.0% Max 4.1 4.1 4.2 4.2 4.3 4.3 4.3 4.4 4.4 4.5 4.5 4.6 4.6 4.7 4.7 4.7
Bulls 3.0% 98% 4.5 4.6 4.7 4.9 5.0 5.2 5.3 5.5 5.7 5.8 6.0 6.2 6.4 6.6 6.8 7.0
Bulls 3.0% Max 5.3 5.4 5.6 5.8 5.9 6.1 6.3 6.5 6.7 6.9 7.1 7.3 7.5 7.8 8.0 8.2
Castlecliff 3.0% 98% 7.1 7.3 7.5 7.8 8.0 8.2 8.5 8.7 9.0 9.3 9.6 9.8 10.1 10.4 10.8 11.1
Castlecliff 3.0% Max 10.4 10.8 11.1 11.4 11.8 12.1 12.5 12.8 13.2 13.6 14.0 14.5 14.9 15.3 15.8 16.3
Hatricks Wharf 4.0% 98% 9.0 9.4 9.7 10.1 10.5 10.9 11.4 11.8 12.3 12.8 13.3 13.9 14.4 15.0 15.6 16.2
Hatricks Wharf 4.0% Max 11.3 11.8 12.3 12.8 13.3 13.8 14.4 14.9 15.5 16.1 16.8 17.5 18.2 18.9 19.6 20.4
Kai Iwi 1.0% 98% 1.6 1.6 1.7 1.7 1.7 1.7 1.7 1.7 1.8 1.8 1.8 1.8 1.8 1.8 1.9 1.9
Kai Iwi 1.0% Max 2.1 2.1 2.1 2.1 2.1 2.2 2.2 2.2 2.2 2.2 2.3 2.3 2.3 2.3 2.4 2.4
Ohakune 1.0% 98% 1.7 1.7 1.7 1.7 1.8 1.8 1.8 1.8 1.8 1.8 1.9 1.9 1.9 1.9 1.9 2.0
Ohakune 1.0% Max 2.2 2.2 2.2 2.2 2.3 2.3 2.3 2.3 2.3 2.4 2.4 2.4 2.4 2.5 2.5 2.5
Peat St 2.2% 98% 12.6 12.9 13.2 13.5 13.8 14.1 14.4 14.7 15.0 15.4 15.7 16.0 16.4 16.7 17.1 17.5
Peat St 2.2% Max 15.2 15.5 15.9 16.2 16.6 17.0 17.3 17.7 18.1 18.5 18.9 19.3 19.7 20.2 20.6 21.1
Pukepapa 1.3% 98% 2.8 2.9 2.9 2.9 3.0 3.0 3.1 3.1 3.1 3.2 3.2 3.3 3.3 3.4 3.4 3.4
Pukepapa 1.3% Max 8.0 8.1 8.2 8.3 8.5 8.6 8.7 8.8 8.9 9.0 9.1 9.3 9.4 9.5 9.6 9.7
Rata 0.5% 98% 1.6 1.6 1.6 1.6 1.7 1.7 1.7 1.7 1.7 1.7 1.7 1.7 1.7 1.7 1.7 1.7
Rata 0.5% Max 2.0 2.0 2.0 2.0 2.0 2.1 2.1 2.1 2.1 2.1 2.1 2.1 2.1 2.1 2.1 2.2
Roberts Ave 2.0% 98% 4.0 4.1 4.2 4.2 4.3 4.4 4.5 4.6 4.7 4.8 4.9 5.0 5.1 5.2 5.3 5.4
Roberts Ave 2.0% Max 9.2 9.3 9.5 9.7 9.9 10.1 10.3 10.5 10.7 10.9 11.2 11.4 11.6 11.8 12.1 12.3
Taihape 1.0% 98% 6.1 6.2 6.2 6.3 6.3 6.4 6.5 6.5 6.6 6.7 6.7 6.8 6.9 6.9 7.0 7.1
Taihape 1.0% Max 6.1 6.2 6.2 6.3 6.3 6.4 6.5 6.5 6.6 6.7 6.7 6.8 6.9 6.9 7.0 7.1
Taupo Quay 2.0% 98% 7.4 7.5 7.7 7.8 8.0 8.1 8.3 8.5 8.6 8.8 9.0 9.2 9.3 9.5 9.7 9.9
Taupo Quay 2.0% Max 10.8 11.1 11.3 11.5 11.7 12.0 12.2 12.5 12.7 13.0 13.2 13.5 13.7 14.0 14.3 14.6
TP Ohakune 1.0% 98% 1.7 1.7 1.7 1.7 1.8 1.8 1.8 1.8 1.8 1.8 1.9 1.9 1.9 1.9 1.9 2.0
TP Ohakune 1.0% Max 2.2 2.2 2.2 2.2 2.3 2.3 2.3 2.3 2.3 2.4 2.4 2.4 2.4 2.5 2.5 2.5
TP Waverley 1.5% 98% 3.3 3.3 3.4 3.5 3.5 3.6 3.6 3.7 3.7 3.8 3.8 3.9 3.9 4.0 4.1 4.1
TP Waverley 1.5% Max 3.7 3.8 3.8 3.9 3.9 4.0 4.0 4.1 4.2 4.2 4.3 4.4 4.4 4.5 4.6 4.6
Waiouru 0.5% 98% 2.7 2.7 2.7 2.7 2.7 2.7 2.7 2.8 2.8 2.8 2.8 2.8 2.8 2.8 2.9 2.9
Waiouru 0.5% Max 3.2 3.2 3.2 3.2 3.2 3.2 3.3 3.3 3.3 3.3 3.3 3.3 3.4 3.4 3.4 3.4
Wanganui East 1.0% 98% 4.5 4.5 4.6 4.6 4.7 4.7 4.8 4.8 4.9 4.9 5.0 5.0 5.1 5.1 5.2 5.2
Wanganui East 1.0% Max 6.2 6.3 6.4 6.4 6.5 6.6 6.6 6.7 6.8 6.8 6.9 7.0 7.0 7.1 7.2 7.2

Return to Index 137ASSET MANAGEMENT PLAN ELECTRICITY NETWORKS FY2010 – FY2019
Impacts of distributed generation and non network options7.6.
Distributed Generation Policy7.6.1.
Powerco’s Distributed Generation Policy follows the requirements of the Electricity Governance (Connection of Distributed Generation Regulations) 2007. In addition, it details Powerco’s Network Management, Health and Safety, and Connection policies, along with pertinent industry rules and standards. The policy is reviewed annually due to the fast changing nature of distributed generation development.
The policy describes the application process, time frames applicable, disputes resolution process, terms of connection and applicable fees. It also outlines requirements for the recovery of network support or avoided cost of transmission payments available to generators.
Powerco’s Distributed Generation Policy is published on the company’s website, along with detailed advice and links to relevant standards. A dedicated guide document is also available to electricity retailers to assist in responding to customer enquiries regarding DG.
Powerco is recognising the RMA provisions and the NZ Energy Strategy as they pertain to Distributed Generation in the discussions it enters into with territorial authorities regarding the policies and rules included in Regional and District plans. The broad intent is to avoid the need to generate electricity thorough the burning of fossil fuels.
Distributed Generation Impacts7.6.2.
Use of Remote Area Power Supplies has been described in Section 6.4 in the context of deferring renewal expenditure.
Powerco has undertaken various studies on using various forms of generation to defer major network developments. One study briefly investigated the option of constructing banks of diesel generation at various places in Coromandel. However the study concluded that diesel generation in this area would be an expensive way of providing network security. Another investigation reviewed the feasibility of using gas fired generation to offset additional demand growth on the Valley spur, and showed a low viability.
There will likely be impacts on remote rural supply brought about by combinations Photo-voltaics and batteries as the costs for these reduce, but these will not necessarily defer system growth driven network developments, rather they will most likely impact renewal investments.
Non Network Options7.6.3.
Non network options are described in Section 4.3.6.
Acquisition of new Assets7.7.
Where appropriate and economically viable, Powerco will continue to acquire new assets. This may be by acquiring sections of the network owned by consumers or new subdivisions. Those carrying out subdivision development have shown little inclination to retain ownership and it is anticipated that this trend will continue for the duration of this plan.
Subtransmission development Plan7.8.
A Long-Term Development Plan (LTDP), separate from this Asset Management Plan, has been prepared for Powerco’s networks to assess each zone substation on Powerco’s networks, considering the loadings and security standards required of it during the planning period and its ability to meet these. A programme of subtransmission development projects required has been prepared from this information, and is presented in Table 7.27.
The LTDP is updated whenever significant changes to loads are known, but at least once a year. The subtransmission performance drivers are reviewed, and the development plan is updated to satisfy changed network conditions. The LTDP reviews each zone substation, considering the GXP, the subtransmission network, the transformer and switchgear capacity and the security level required. The data required to make these assessments follows, along with comments on the capacity and security of each zone substation.
LTDP Preparation Process – Zone Substations7.8.1.
Figure 7.7 shows the process of assessing the network against various criteria, determining work required and entering it into the LTDP. This highlights that the level of detail in the assessment of each project is inappropriate for inclusion in this AMP.

Return to Index138 ASSET MANAGEMENT PLAN ELECTRICITY NETWORKS FY2010 – FY2019
No
Yes
YesNo
Determine Equipment ReliabilitySpares/Service availability
Transformer(s), Tap Changer(s), Switchgear
Reliability Data
Powerco Data/Experience External Date (EEA, ESAA)
age Profile
Transformer(s), Switchgear
Load Growth
Historical, Demographic and Business Data
Capacity
Rating, Environment, Overload Capacity
Substation details
Standard of Construction, Condition, Age Profile
Feeder Loads
From SCADA, from MDIs, from spot readings
Determine Equipment Performance Capability
Determine Substation Performance Capability
Prepare Load Forecasts
Determine Required Substation Performance
Compare
Determine Solution and Timing
Record Result in LTDP
REQUIREMENTS MET TO 2020
OPTIMUM?
Standards
LTDP
For each substation
Figure 7.7: LTDP Preparation Process – Zone Substation.
Grid Exit Points7.8.2.
The development of the network is dependent on the present and planned future capacity and security of the 26 grid exit points supplying it (refer Table 7.14). Regular discussions with Transpower (refer Section 2.10) are held to co-ordinate Powerco’s and Transpower’s respective development plans. The following situations are under consideration:
A new GXP for the Piako area is currently in the design stages. This installation will •be built by Independent Transmission Services Ltd adjacent to the existing Piako zone substation, and is scheduled for completion mid 2011. This will address the long-term supply capacity and security concerns in the area presently supplied by Waihou GXP;
A new GXP at Papamoa East is proposed to cater for the large-scale urban and •industrial developments planned for Papamoa East, Wairakei and Rangiuru. Independent Transmission Services Ltd is currently conducting line route, easement and site procurement investigations. This site will need to be commissioned c. 2014, or earlier if possible.
A new GXP is planned for Putaruru, which will provide an alternative supply for •Putaruru, Tirau and Lake Rd substations, enabling their security of supply to be strengthened. Independent Transmission Services Ltd is currently conducting line route, easement and site procurement investigations.
Te Matai GXP security has been enhanced by the addition of a second transformer •bank, commissioned in April 2009.
The Kaitimako GXP has been completed by the installation of a single 75MVA •110/33kV transformer. The Welcome Bay zone substation load of approximately 16MVA has been transferred permanently from the Tauranga 33kV bus to the new GXP
T4 at the Tauranga 33kV GXP is being upgraded from 30MVA to 120MVA. This •project is under way and scheduled for completion in late 2010. A project to upgrade the 33kV switchyard to an indoor bus will follow closely.
The demand at the 11kV bus at Mt Maunganui GXP exceeds its firm capacity •and, due to the rate of development, the ability to transfer load to Papamoa and Triton substations is diminishing. The new Matapihi zone substation adjacent to Mt Maunganui GXP is scheduled for completion in early 2010, while Transpower’s upgrade of Mt Maunganui GXP to a firm capacity of 75MVA is scheduled for completion In October 2010.
The security of supply offered by Transpower’s 110kV circuits into the Tauranga area •is affected by the Poike Tee. A small number of spans between Kaitimako and Poike have limited capacity. This situation is under ongoing discussion with Transpower, who are promoting a regional study of transmission issues in the wider Bay Of

Return to Index 139ASSET MANAGEMENT PLAN ELECTRICITY NETWORKS FY2010 – FY2019
Plenty. A progressive step will be the upgrading of the Tarukenga-Kaitimako circuits from 110kV to 220kV, and the installation of interconnection assets at Kaitimako. Transpower currently have this Grid Upgrade Proposal before the Electricity Commission, and it is expected to be approved in late 2009.
Transpower has prepared an operating protocol to open the 110kV bus at •Mangamarie GXP under high north-to-south power flows. The opening of the bus reduces security of supply to Powerco’s Tararua and Wairarapa networks from N-1 to N;
Planning for the renewal of the transformers and 33kV switchgear at Masterton is •under way. This provides the opportunity to upgrade the capacity to 60MVA firm from the present 30MVA;
An upgrade of the capacity at Stratford GXP is being discussed with Transpower; •
Discussions are under way with Transpower over the provision of spare transformers •for Waverley, Ohakune and Mataroa. Transpower are building a fleet of “national spare” transformers which will be cold stored at strategic locations.
In late 2009, Transpower initiated a series of connection risk reviews, assessing •current and future risks at individual GXPs. Connected parties were invited to participate, with the result that to date, Powerco and Transpower have carried out site visits and assessments at Bunnythorpe, Kopu, Waikino and Waihou GXPs.
Price Quality consultation was carried out with consumers In Taihape and Waiouru •with the result that the status quo was preferred - N security at Mataroa over N-1 at greater cost. Transpower are basing one of their “national spare” transformers at Mataroa.
Waverley GXP is to get a capacity upgrade to 10MVA, while remaining a single •transformer GXP. Increased demand became apparent at Waverley during the dairy season of 2009-2010, with the single transformer running to capacity at times. It is thought that this increase is as a result of increased dairying, Industry and irrigation activity. Demand management is made difficult by the fact that there is no load control available at Waverley. The transformer upgrade is at least two years away, so demand side participation measures may need to be explored.
The Electricity Commission’s load management strategy is being watched with •interest. This will dictate whether investment in load control systems is viable.
.

Return to Index140 ASSET MANAGEMENT PLAN ELECTRICITY NETWORKS FY2010 – FY2019
Table 7.14: Grid Exit Point Loads and Capacities
GXP Transformer Rating MVABranchLimit
(MVA) [1]
Firm Capacity
(MVA)Limiting Factor [2]
Max Export 98% (MW)
Max Import 98% (MW)
S/gear owner[3]
Desired security
class
2009 Supply
Security [4]
Brunswick (BRK) 1 x 39 39 39(N) Trans 0 24.3 TP AAA AA [5]
Bunnythorpe (BPE) 2 x 83 83 83 Trans 0 72.5 P AAA AAA
Carrington St (CST) 2 x 75 62 62 Prot 0 43.7 TP AAA AAA
Greytown (GYT) 2 x20 20 20 Trans 3.6 9.65 TP AA AAA
Hawera (HWA) 2 x30 30 30 Trans 0 22.2 TP AAA AAA
Hinuera (HIN) 1 x 30,1 x 50 50 30 Trans 0 33.6 TP AAA A1 [6]
Huirangi (HUI) 2 x 20 20 20 Trans 4.2 11.5 TP AAA AAA
Kaitimako 1 x 75 75 75(N)- Trans 0 10.5 TP AA AA[7]
Kinleith (KIN) 11kV (CHH) 2 x 10, 1x 20, 2 x 30 30 30 Trans 0 65 TP - -
Kinleith (KIN) 33kV (Powerco) 30 30(N) Trans 0 15 TP AA AA [8]
Kinleith (KIN) 33kV (CHH cogen) 20 20 20 Trans 0 - 9[9] TP - -
Kopu (KPU) 2 x 60 43.4 40 Prot 0 35.6 TP AAA AAA
Linton (LTN) 2 x 100 81.7 81.7 OEL 15.2 40.0 P AAA AAA
Mangamaire (MGM) 2 x 30 27.1 27.1 OEL 0 9.5 TP AA AAA
Marton (MTN) 1 x 20, 1 x 30 19.6 19.6 OEL 0 13.5 TP AAA AAA
Masterton (MST) 2 x 30 30 30 Trans 0 35.3 TP AAA AAA [10]
Mataroa (MTR) 30 19.6 19.6(N) OEL 0 6.5 TP A1 A2 [11]
Moturoa (MRA) 2 x 23 13.6 13.6 Cable 0 16.3 TP [12] AAA AA
Mt Maunganui 33 (MTM) 1 x 20, 1 x 40 40 20 Trans 0 32.0 P AAA AA [13]
Mt Maunganui 11 (MTM) 2 x 10 10 10 Trans 0 15.5 P AAA AA [13]
Ohakune (OKN) 10 10 10(N) Trans 0 1.7 TP A1 A2 [14]
Opunake OPK) 2 x 30 13.6 13.6 OEL 0 9.5 TP AA AAA
Stratford (SFD) 2 x 20 20 20 Trans 0 20.0 TP AAA AAA
Tauranga 11 (TGA) 2 x 30 29.7 29.7 Cable 0 21.0 TP AAA AAA
Tauranga 33 (TGA) 1 x 30, 1 x 90 30 30 Trans 0 42.0 P AAA AA [15]
Te Matai (TMI) 1 x 30, 1 x 40 30 30 Trans 0 23.5 P AAA AAA
Waihou (WHU) 3 x 20 20 40 Trans 0 50.5 TP AAA AA [16]
Waikino (WKO) 2 x 30 30 30 Trans 0 28.5 TP AAA AAA
Wanganui (WGN) 1 x 20, 1x 30 20 20 Trans 0 24.2 TP AAA AA [5]
Waverley (WVY) 5 4.5 4.5(N) OEL 0 3.3 TP A1 A1[17]
Notes:
1. Information based on Transpower Branch Ratings Reports. (N) indicates single transformer GXP.
2. “OEL” in limiting factor column indicates unspecified “other equipment”.
3. TP – Transpower; P – Powerco.
4. Red denotes a security shortfall.
5. Subtransmission interconnection is available to partially back up Brunswick and Wanganui GXPs.
6. N security at Hinuera results from the single incoming 110 kV circuit. Proposed new GXPs at Putaruru and Piako will provide back up to this GXP.
7. Welcome Bay Zone Substation will be supplied from new GXP at Kaitemako from April 2009. Existing lines to Tauranga GXP will provide required backup security at AA level.
8. Kinleith T5 is backup for T4 supply to Maraetai and Baird Rd in Tokoroa but must be break before make switching.
9. Cogeneration averages 30MW at normal operation but total export depends on mill load. Powerco has no visibility of CHH 33kV load.
10. N-1 security relies on overload capacity of transformers. Upgrade planned at Masterton to 2 x 60 MVA transformers.
11. Mataroa GXP has four single-phase transformers.
12. Powerco owns incoming 33kV cable and share of transformers at this GXP. Negotiations are under way about purchasing this GXP.
13. Mt Maunganui GXP upgrade is under way and due for completion March 2010.
14. Ohakune GXP has four single-phase transformers.
15. Tauranga T4 replacement due in 2010.
16. New GXP proposed at Piako .
17. Waverley GXP has four single-phase transformers.
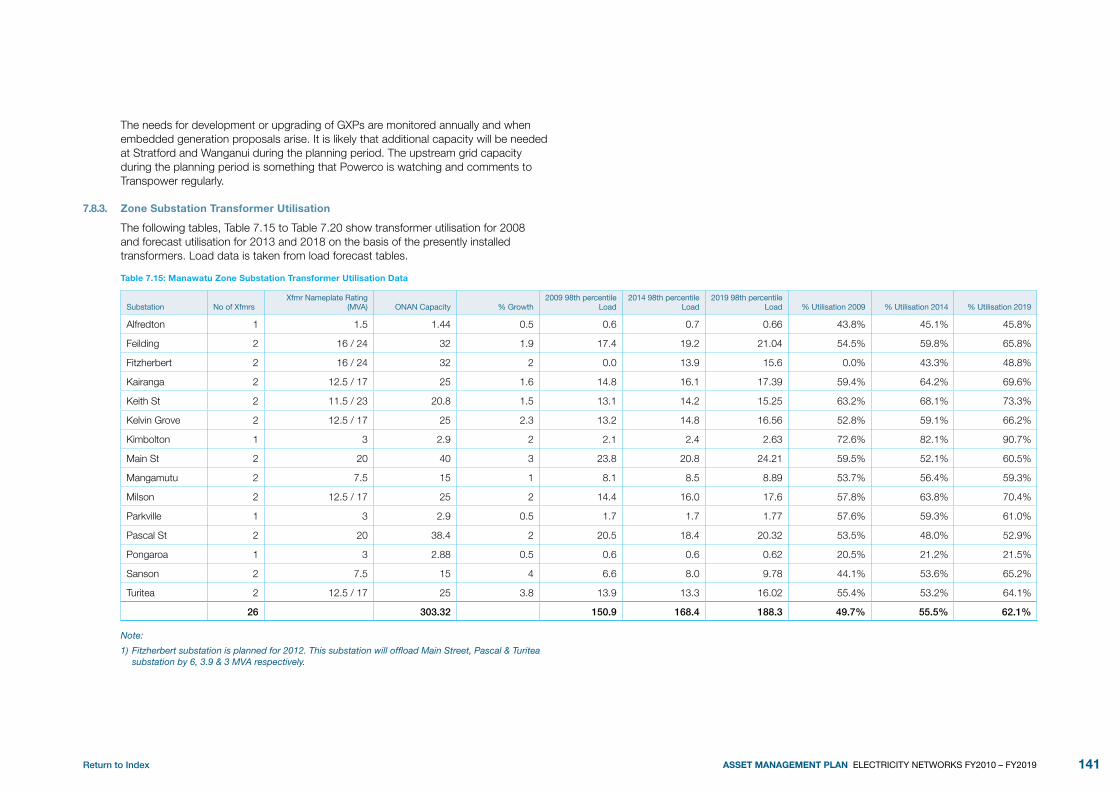
Return to Index 141ASSET MANAGEMENT PLAN ELECTRICITY NETWORKS FY2010 – FY2019
The needs for development or upgrading of GXPs are monitored annually and when embedded generation proposals arise. It is likely that additional capacity will be needed at Stratford and Wanganui during the planning period. The upstream grid capacity during the planning period is something that Powerco is watching and comments to Transpower regularly.
Zone Substation Transformer Utilisation7.8.3.
The following tables, Table 7.15 to Table 7.20 show transformer utilisation for 2008 and forecast utilisation for 2013 and 2018 on the basis of the presently installed transformers. Load data is taken from load forecast tables.
Table 7.15: Manawatu Zone Substation Transformer Utilisation Data
Substation No of XfmrsXfmr Nameplate Rating
(MVA) ONAN Capacity % Growth2009 98th percentile
Load2014 98th percentile
Load2019 98th percentile
Load % Utilisation 2009 % Utilisation 2014 % Utilisation 2019
Alfredton 1 1.5 1.44 0.5 0.6 0.7 0.66 43.8% 45.1% 45.8%
Feilding 2 16 / 24 32 1.9 17.4 19.2 21.04 54.5% 59.8% 65.8%
Fitzherbert 2 16 / 24 32 2 0.0 13.9 15.6 0.0% 43.3% 48.8%
Kairanga 2 12.5 / 17 25 1.6 14.8 16.1 17.39 59.4% 64.2% 69.6%
Keith St 2 11.5 / 23 20.8 1.5 13.1 14.2 15.25 63.2% 68.1% 73.3%
Kelvin Grove 2 12.5 / 17 25 2.3 13.2 14.8 16.56 52.8% 59.1% 66.2%
Kimbolton 1 3 2.9 2 2.1 2.4 2.63 72.6% 82.1% 90.7%
Main St 2 20 40 3 23.8 20.8 24.21 59.5% 52.1% 60.5%
Mangamutu 2 7.5 15 1 8.1 8.5 8.89 53.7% 56.4% 59.3%
Milson 2 12.5 / 17 25 2 14.4 16.0 17.6 57.8% 63.8% 70.4%
Parkville 1 3 2.9 0.5 1.7 1.7 1.77 57.6% 59.3% 61.0%
Pascal St 2 20 38.4 2 20.5 18.4 20.32 53.5% 48.0% 52.9%
Pongaroa 1 3 2.88 0.5 0.6 0.6 0.62 20.5% 21.2% 21.5%
Sanson 2 7.5 15 4 6.6 8.0 9.78 44.1% 53.6% 65.2%
Turitea 2 12.5 / 17 25 3.8 13.9 13.3 16.02 55.4% 53.2% 64.1%
26 303 .32 150 .9 168 .4 188 .3 49 .7% 55 .5% 62 .1%
Note:
1) Fitzherbert substation is planned for 2012. This substation will offload Main Street, Pascal & Turitea substation by 6, 3.9 & 3 MVA respectively.
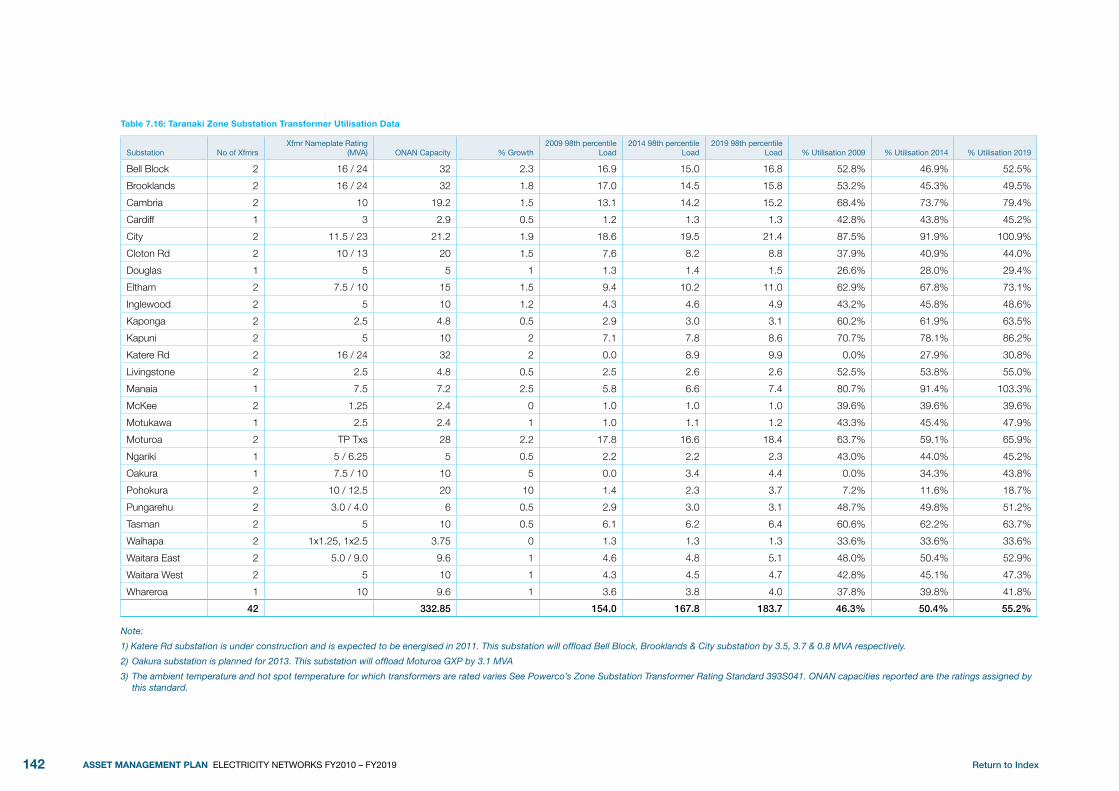
Return to Index142 ASSET MANAGEMENT PLAN ELECTRICITY NETWORKS FY2010 – FY2019
Table 7.16: Taranaki Zone Substation Transformer Utilisation Data
Substation No of XfmrsXfmr Nameplate Rating
(MVA) ONAN Capacity % Growth2009 98th percentile
Load2014 98th percentile
Load2019 98th percentile
Load % Utilisation 2009 % Utilisation 2014 % Utilisation 2019
Bell Block 2 16 / 24 32 2.3 16.9 15.0 16.8 52.8% 46.9% 52.5%
Brooklands 2 16 / 24 32 1.8 17.0 14.5 15.8 53.2% 45.3% 49.5%
Cambria 2 10 19.2 1.5 13.1 14.2 15.2 68.4% 73.7% 79.4%
Cardiff 1 3 2.9 0.5 1.2 1.3 1.3 42.8% 43.8% 45.2%
City 2 11.5 / 23 21.2 1.9 18.6 19.5 21.4 87.5% 91.9% 100.9%
Cloton Rd 2 10 / 13 20 1.5 7.6 8.2 8.8 37.9% 40.9% 44.0%
Douglas 1 5 5 1 1.3 1.4 1.5 26.6% 28.0% 29.4%
Eltham 2 7.5 / 10 15 1.5 9.4 10.2 11.0 62.9% 67.8% 73.1%
Inglewood 2 5 10 1.2 4.3 4.6 4.9 43.2% 45.8% 48.6%
Kaponga 2 2.5 4.8 0.5 2.9 3.0 3.1 60.2% 61.9% 63.5%
Kapuni 2 5 10 2 7.1 7.8 8.6 70.7% 78.1% 86.2%
Katere Rd 2 16 / 24 32 2 0.0 8.9 9.9 0.0% 27.9% 30.8%
Livingstone 2 2.5 4.8 0.5 2.5 2.6 2.6 52.5% 53.8% 55.0%
Manaia 1 7.5 7.2 2.5 5.8 6.6 7.4 80.7% 91.4% 103.3%
McKee 2 1.25 2.4 0 1.0 1.0 1.0 39.6% 39.6% 39.6%
Motukawa 1 2.5 2.4 1 1.0 1.1 1.2 43.3% 45.4% 47.9%
Moturoa 2 TP Txs 28 2.2 17.8 16.6 18.4 63.7% 59.1% 65.9%
Ngariki 1 5 / 6.25 5 0.5 2.2 2.2 2.3 43.0% 44.0% 45.2%
Oakura 1 7.5 / 10 10 5 0.0 3.4 4.4 0.0% 34.3% 43.8%
Pohokura 2 10 / 12.5 20 10 1.4 2.3 3.7 7.2% 11.6% 18.7%
Pungarehu 2 3.0 / 4.0 6 0.5 2.9 3.0 3.1 48.7% 49.8% 51.2%
Tasman 2 5 10 0.5 6.1 6.2 6.4 60.6% 62.2% 63.7%
Waihapa 2 1x1.25, 1x2.5 3.75 0 1.3 1.3 1.3 33.6% 33.6% 33.6%
Waitara East 2 5.0 / 9.0 9.6 1 4.6 4.8 5.1 48.0% 50.4% 52.9%
Waitara West 2 5 10 1 4.3 4.5 4.7 42.8% 45.1% 47.3%
Whareroa 1 10 9.6 1 3.6 3.8 4.0 37.8% 39.8% 41.8%
42 332 .85 154 .0 167 .8 183 .7 46 .3% 50 .4% 55 .2%
Note:
1) Katere Rd substation is under construction and is expected to be energised in 2011. This substation will offload Bell Block, Brooklands & City substation by 3.5, 3.7 & 0.8 MVA respectively.
2) Oakura substation is planned for 2013. This substation will offload Moturoa GXP by 3.1 MVA
3) The ambient temperature and hot spot temperature for which transformers are rated varies See Powerco’s Zone Substation Transformer Rating Standard 393S041. ONAN capacities reported are the ratings assigned by this standard.
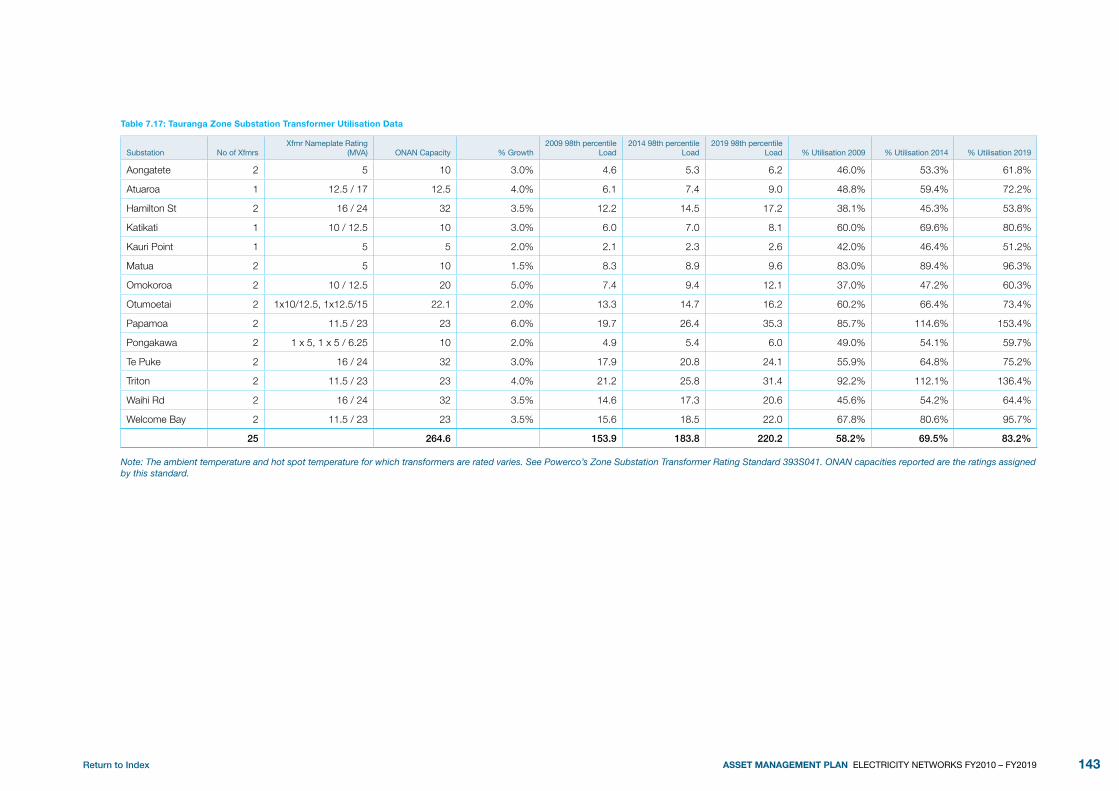
Return to Index 143ASSET MANAGEMENT PLAN ELECTRICITY NETWORKS FY2010 – FY2019
Table 7.17: Tauranga Zone Substation Transformer Utilisation Data
Substation No of XfmrsXfmr Nameplate Rating
(MVA) ONAN Capacity % Growth2009 98th percentile
Load2014 98th percentile
Load2019 98th percentile
Load % Utilisation 2009 % Utilisation 2014 % Utilisation 2019
Aongatete 2 5 10 3.0% 4.6 5.3 6.2 46.0% 53.3% 61.8%
Atuaroa 1 12.5 / 17 12.5 4.0% 6.1 7.4 9.0 48.8% 59.4% 72.2%
Hamilton St 2 16 / 24 32 3.5% 12.2 14.5 17.2 38.1% 45.3% 53.8%
Katikati 1 10 / 12.5 10 3.0% 6.0 7.0 8.1 60.0% 69.6% 80.6%
Kauri Point 1 5 5 2.0% 2.1 2.3 2.6 42.0% 46.4% 51.2%
Matua 2 5 10 1.5% 8.3 8.9 9.6 83.0% 89.4% 96.3%
Omokoroa 2 10 / 12.5 20 5.0% 7.4 9.4 12.1 37.0% 47.2% 60.3%
Otumoetai 2 1x10/12.5, 1x12.5/15 22.1 2.0% 13.3 14.7 16.2 60.2% 66.4% 73.4%
Papamoa 2 11.5 / 23 23 6.0% 19.7 26.4 35.3 85.7% 114.6% 153.4%
Pongakawa 2 1 x 5, 1 x 5 / 6.25 10 2.0% 4.9 5.4 6.0 49.0% 54.1% 59.7%
Te Puke 2 16 / 24 32 3.0% 17.9 20.8 24.1 55.9% 64.8% 75.2%
Triton 2 11.5 / 23 23 4.0% 21.2 25.8 31.4 92.2% 112.1% 136.4%
Waihi Rd 2 16 / 24 32 3.5% 14.6 17.3 20.6 45.6% 54.2% 64.4%
Welcome Bay 2 11.5 / 23 23 3.5% 15.6 18.5 22.0 67.8% 80.6% 95.7%
25 264 .6 153 .9 183 .8 220 .2 58 .2% 69 .5% 83 .2%
Note: The ambient temperature and hot spot temperature for which transformers are rated varies. See Powerco’s Zone Substation Transformer Rating Standard 393S041. ONAN capacities reported are the ratings assigned by this standard.
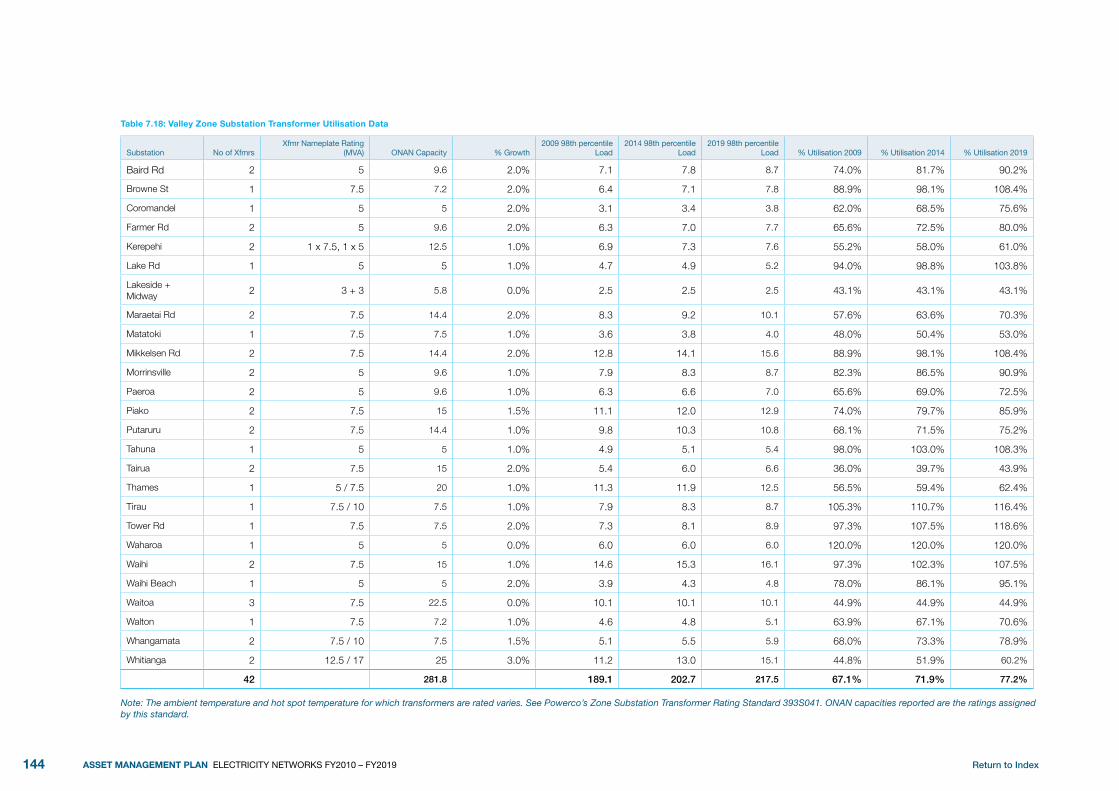
Return to Index144 ASSET MANAGEMENT PLAN ELECTRICITY NETWORKS FY2010 – FY2019
Table 7.18: Valley Zone Substation Transformer Utilisation Data
Substation No of XfmrsXfmr Nameplate Rating
(MVA) ONAN Capacity % Growth2009 98th percentile
Load2014 98th percentile
Load2019 98th percentile
Load % Utilisation 2009 % Utilisation 2014 % Utilisation 2019
Baird Rd 2 5 9.6 2.0% 7.1 7.8 8.7 74.0% 81.7% 90.2%
Browne St 1 7.5 7.2 2.0% 6.4 7.1 7.8 88.9% 98.1% 108.4%
Coromandel 1 5 5 2.0% 3.1 3.4 3.8 62.0% 68.5% 75.6%
Farmer Rd 2 5 9.6 2.0% 6.3 7.0 7.7 65.6% 72.5% 80.0%
Kerepehi 2 1 x 7.5, 1 x 5 12.5 1.0% 6.9 7.3 7.6 55.2% 58.0% 61.0%
Lake Rd 1 5 5 1.0% 4.7 4.9 5.2 94.0% 98.8% 103.8%
Lakeside + Midway 2 3 + 3 5.8 0.0% 2.5 2.5 2.5 43.1% 43.1% 43.1%
Maraetai Rd 2 7.5 14.4 2.0% 8.3 9.2 10.1 57.6% 63.6% 70.3%
Matatoki 1 7.5 7.5 1.0% 3.6 3.8 4.0 48.0% 50.4% 53.0%
Mikkelsen Rd 2 7.5 14.4 2.0% 12.8 14.1 15.6 88.9% 98.1% 108.4%
Morrinsville 2 5 9.6 1.0% 7.9 8.3 8.7 82.3% 86.5% 90.9%
Paeroa 2 5 9.6 1.0% 6.3 6.6 7.0 65.6% 69.0% 72.5%
Piako 2 7.5 15 1.5% 11.1 12.0 12.9 74.0% 79.7% 85.9%
Putaruru 2 7.5 14.4 1.0% 9.8 10.3 10.8 68.1% 71.5% 75.2%
Tahuna 1 5 5 1.0% 4.9 5.1 5.4 98.0% 103.0% 108.3%
Tairua 2 7.5 15 2.0% 5.4 6.0 6.6 36.0% 39.7% 43.9%
Thames 1 5 / 7.5 20 1.0% 11.3 11.9 12.5 56.5% 59.4% 62.4%
Tirau 1 7.5 / 10 7.5 1.0% 7.9 8.3 8.7 105.3% 110.7% 116.4%
Tower Rd 1 7.5 7.5 2.0% 7.3 8.1 8.9 97.3% 107.5% 118.6%
Waharoa 1 5 5 0.0% 6.0 6.0 6.0 120.0% 120.0% 120.0%
Waihi 2 7.5 15 1.0% 14.6 15.3 16.1 97.3% 102.3% 107.5%
Waihi Beach 1 5 5 2.0% 3.9 4.3 4.8 78.0% 86.1% 95.1%
Waitoa 3 7.5 22.5 0.0% 10.1 10.1 10.1 44.9% 44.9% 44.9%
Walton 1 7.5 7.2 1.0% 4.6 4.8 5.1 63.9% 67.1% 70.6%
Whangamata 2 7.5 / 10 7.5 1.5% 5.1 5.5 5.9 68.0% 73.3% 78.9%
Whitianga 2 12.5 / 17 25 3.0% 11.2 13.0 15.1 44.8% 51.9% 60.2%
42 281 .8 189 .1 202 .7 217 .5 67 .1% 71 .9% 77 .2%
Note: The ambient temperature and hot spot temperature for which transformers are rated varies. See Powerco’s Zone Substation Transformer Rating Standard 393S041. ONAN capacities reported are the ratings assigned by this standard.
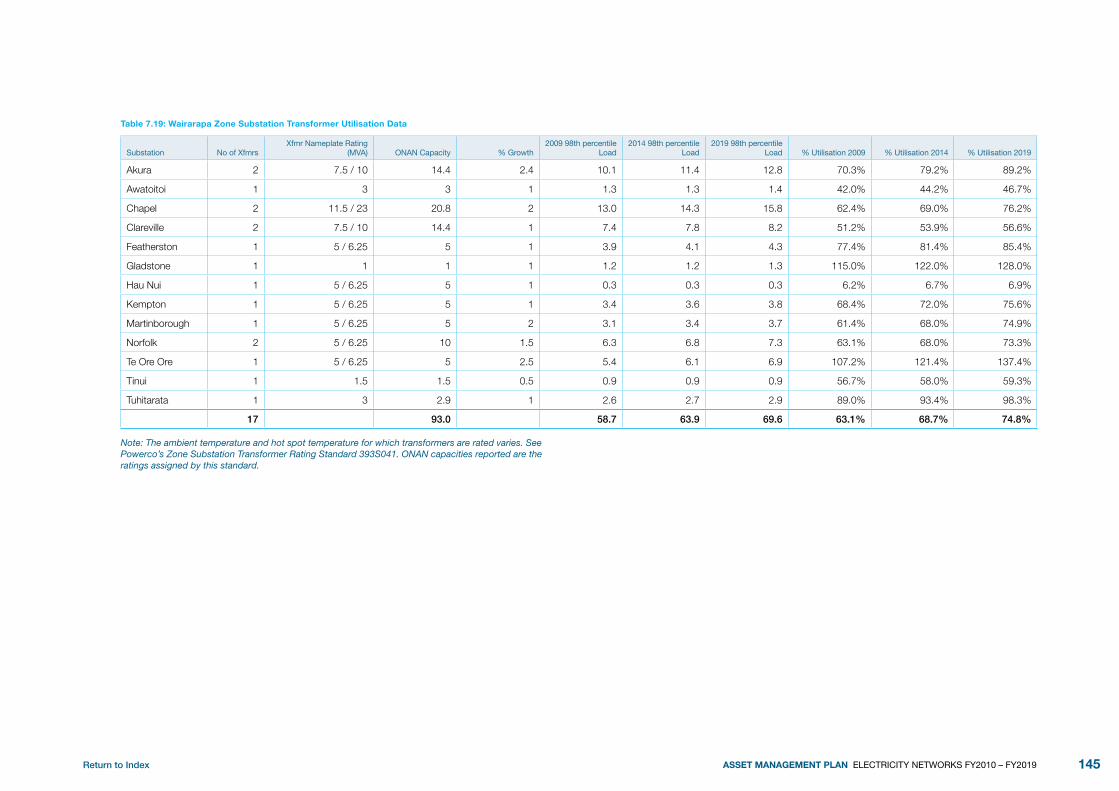
Return to Index 145ASSET MANAGEMENT PLAN ELECTRICITY NETWORKS FY2010 – FY2019
Table 7.19: Wairarapa Zone Substation Transformer Utilisation Data
Substation No of XfmrsXfmr Nameplate Rating
(MVA) ONAN Capacity % Growth2009 98th percentile
Load2014 98th percentile
Load2019 98th percentile
Load % Utilisation 2009 % Utilisation 2014 % Utilisation 2019
Akura 2 7.5 / 10 14.4 2.4 10.1 11.4 12.8 70.3% 79.2% 89.2%
Awatoitoi 1 3 3 1 1.3 1.3 1.4 42.0% 44.2% 46.7%
Chapel 2 11.5 / 23 20.8 2 13.0 14.3 15.8 62.4% 69.0% 76.2%
Clareville 2 7.5 / 10 14.4 1 7.4 7.8 8.2 51.2% 53.9% 56.6%
Featherston 1 5 / 6.25 5 1 3.9 4.1 4.3 77.4% 81.4% 85.4%
Gladstone 1 1 1 1 1.2 1.2 1.3 115.0% 122.0% 128.0%
Hau Nui 1 5 / 6.25 5 1 0.3 0.3 0.3 6.2% 6.7% 6.9%
Kempton 1 5 / 6.25 5 1 3.4 3.6 3.8 68.4% 72.0% 75.6%
Martinborough 1 5 / 6.25 5 2 3.1 3.4 3.7 61.4% 68.0% 74.9%
Norfolk 2 5 / 6.25 10 1.5 6.3 6.8 7.3 63.1% 68.0% 73.3%
Te Ore Ore 1 5 / 6.25 5 2.5 5.4 6.1 6.9 107.2% 121.4% 137.4%
Tinui 1 1.5 1.5 0.5 0.9 0.9 0.9 56.7% 58.0% 59.3%
Tuhitarata 1 3 2.9 1 2.6 2.7 2.9 89.0% 93.4% 98.3%
17 93 .0 58 .7 63 .9 69 .6 63 .1% 68 .7% 74 .8%
Note: The ambient temperature and hot spot temperature for which transformers are rated varies. See Powerco’s Zone Substation Transformer Rating Standard 393S041. ONAN capacities reported are the ratings assigned by this standard.
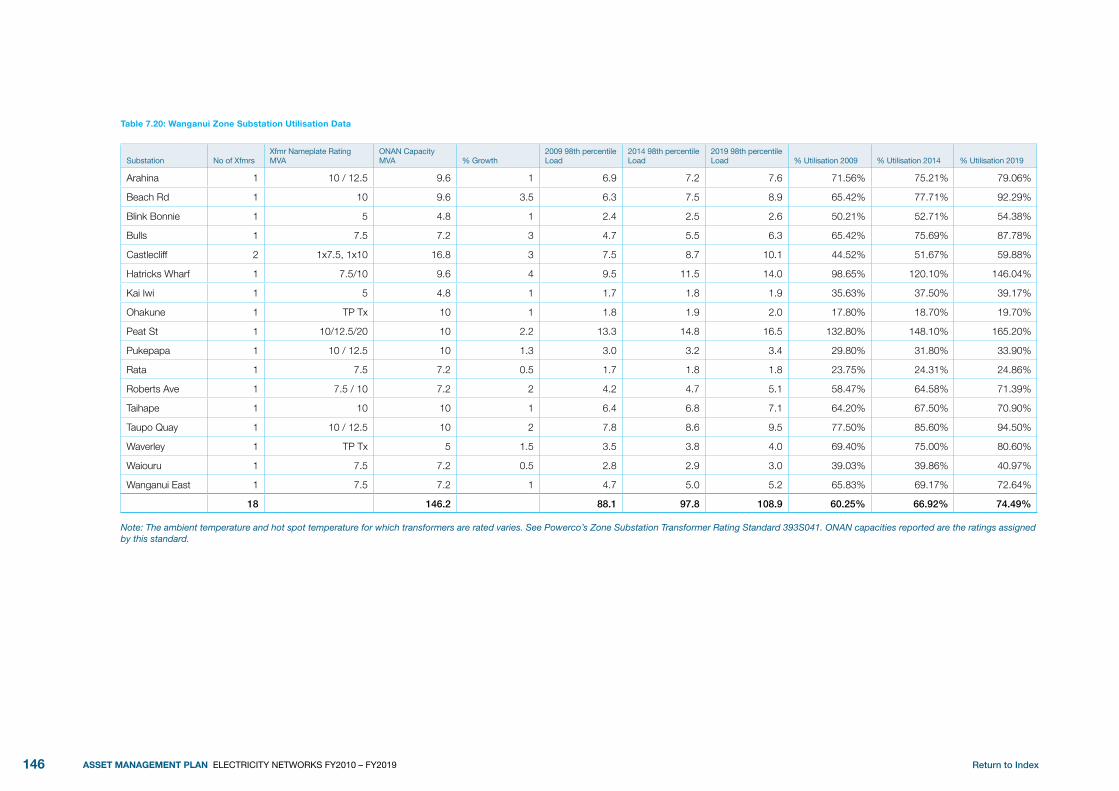
Return to Index146 ASSET MANAGEMENT PLAN ELECTRICITY NETWORKS FY2010 – FY2019
Table 7.20: Wanganui Zone Substation Utilisation Data
Substation No of XfmrsXfmr Nameplate Rating MVA
ONAN Capacity MVA % Growth
2009 98th percentile Load
2014 98th percentile Load
2019 98th percentile Load % Utilisation 2009 % Utilisation 2014 % Utilisation 2019
Arahina 1 10 / 12.5 9.6 1 6.9 7.2 7.6 71.56% 75.21% 79.06%
Beach Rd 1 10 9.6 3.5 6.3 7.5 8.9 65.42% 77.71% 92.29%
Blink Bonnie 1 5 4.8 1 2.4 2.5 2.6 50.21% 52.71% 54.38%
Bulls 1 7.5 7.2 3 4.7 5.5 6.3 65.42% 75.69% 87.78%
Castlecliff 2 1x7.5, 1x10 16.8 3 7.5 8.7 10.1 44.52% 51.67% 59.88%
Hatricks Wharf 1 7.5/10 9.6 4 9.5 11.5 14.0 98.65% 120.10% 146.04%
Kai Iwi 1 5 4.8 1 1.7 1.8 1.9 35.63% 37.50% 39.17%
Ohakune 1 TP Tx 10 1 1.8 1.9 2.0 17.80% 18.70% 19.70%
Peat St 1 10/12.5/20 10 2.2 13.3 14.8 16.5 132.80% 148.10% 165.20%
Pukepapa 1 10 / 12.5 10 1.3 3.0 3.2 3.4 29.80% 31.80% 33.90%
Rata 1 7.5 7.2 0.5 1.7 1.8 1.8 23.75% 24.31% 24.86%
Roberts Ave 1 7.5 / 10 7.2 2 4.2 4.7 5.1 58.47% 64.58% 71.39%
Taihape 1 10 10 1 6.4 6.8 7.1 64.20% 67.50% 70.90%
Taupo Quay 1 10 / 12.5 10 2 7.8 8.6 9.5 77.50% 85.60% 94.50%
Waverley 1 TP Tx 5 1.5 3.5 3.8 4.0 69.40% 75.00% 80.60%
Waiouru 1 7.5 7.2 0.5 2.8 2.9 3.0 39.03% 39.86% 40.97%
Wanganui East 1 7.5 7.2 1 4.7 5.0 5.2 65.83% 69.17% 72.64%
18 146 .2 88 .1 97 .8 108 .9 60 .25% 66 .92% 74 .49%
Note: The ambient temperature and hot spot temperature for which transformers are rated varies. See Powerco’s Zone Substation Transformer Rating Standard 393S041. ONAN capacities reported are the ratings assigned by this standard.

Return to Index 147ASSET MANAGEMENT PLAN ELECTRICITY NETWORKS FY2010 – FY2019
Transformer Utilisation and Age7.8.4.
The method of determining transformer ratings (IEC354) relies on the transformers being in good condition. Transformers that are advanced in years should be less exposed to overloads. Figure 7.8 presents the zone substation transformers by utilisation and age. The maroon oval highlights the zone transformers that have a combination of high utilisation and age. It should be borne in mind that utilisation has been defined using the ONAN transformer rating. In the case of Peat St, the utilisation based on the OFAF rating is less than 100%. Second transformers are proposed at Peat St and Manaia. A larger transformer is planned for Hatricks Wharf.
Transformer Utilisation vs Age
Util
isat
ion
(98%
ile lo
ad/O
NA
N c
apac
ity)
0%
20%
40%
60%
80%
100%
120%
140%
0 10 20 30 40 50 60
Age (yr)
Waharoa
Wanganui East
Hatricks Wharf
Tahuna
Manaia
Peat St
Urban Suburban Rural
Figure 7.8: Zone Transformer Utilisation and Age.
Zone Substation Capacity and Security Levels7.8.5.
Table 7.21 to Table 7.26 below summarise zone substation capacities and security of supply levels.
In Manawatu, transformer utilisations are between 19% and 69% with an average of 51%. Five substations do not meet Powerco’s security standards:
Kairanga, Kelvin Grove and Pascal St upgrading are in the LTDP;•
Turitea cannot be upgraded above AA+ because of the wind farm connection •arrangements. This upgrade is in the LTDP;
Upgrading Sanson above its present security levels is considered to be very costly, •but developments at Ohakea could tip the balance, making a second supply route necessary.
In Taranaki, transformer utilisations are between 7% and 84% with an average of 48%. All Taranaki substations meet Powerco’s security standards.
In Tauranga, transformer utilisations are between 28% and 90% with an average of 64%. Five Tauranga substations do not meet Powerco’s security standards: Atuaroa, Katikati, Kauri Point, Matua and Omokoroa. Plans for upgrading these are in the LTDP.
In Valley, transformer utilisations are between 28% and 108% with an average of 63%. Eleven Valley substations out of twenty four do not meet Powerco’s security standards. Of these, Coromandel is considered to be so costly as to not be viable to upgrade. The other 10 have upgrade plans in the LTDP or MTDP, although the latter will not be brought fully up to standard in all cases.
In Wairarapa, transformer utilisations are between 40% and 109% with an average of 60%. Six Wairarapa substations do not meet Powerco’s security standards, and upgrading them is technically infeasible or considered uneconomic.
In Wanganui, transformer utilisations are between 28% and 124% with an average of 66%.
It should be noted that the class capacity for AAA and AA+ security level substations is taken to be the capacity of the lowest rated incoming supply plus the load able to be transferred, or the four-hour rating of the transformer, whichever is the lesser, provided the load transfer can be carried out in four hours.

Return to Index148 ASSET MANAGEMENT PLAN ELECTRICITY NETWORKS FY2010 – FY2019
Table 7.21: Manawatu Substation Maximum Demands and Transfer Capacities
SubstationNo of Xfmrs
No of 33 kV in-feeds
Xfmr Nameplate Rating (MVA)
Xfmr Cont Rating 20deg (MVA)
Xfmr 4 Hour Rating 20deg
(MVA)
Switch-gear firm Capacity
(MVA)
Feeder Transfer
Capacity (MVA)
2009 98th percentile
Load (MVA)
2009 Maximum
Demand (MVA)
Substation Firm
Capacity (MVA)
Substation Class
Capacity (MVA)
98th Percentile
Load as % of Class
Capacity
2009 Security of
Supply
Desired Security
Class
Alfredton 1 2 1.5 1.4 1.8 7.6 0.6 0.6 0.6 0 0.6 105% A1 A1
Feilding 2 2 16 / 24 21.1 27 22.9 3 17.4 20.4 21.1 24.1 72% AAA AAA
Kairanga 2 2 12.5 / 17 15 19.1 22.9 5 14.8 16.6 15 19.1 78% AA AAA
Keith St 2 3 11.5 / 23 18.6 23.8 22.9 7.2 13.1 16.0 18.6 23.8 55% AAA AAA
Kelvin Grove 2 2 12.5 / 17 15 19.1 22.9 4 13.2 16.3 15 19 69% AA AA+
Kimbolton 1 1 3 2.9 3.6 12 0.5 2.1 2.7 0 0.5 422% A2 A1
Main St 2 3 20 20 24.8 38.1 12 23.8 29.7 20 24.8 96% AAA AAA
Mangamutu 2 2 7.5 7.5 9.3 7.6 1.6 8.1 8.8 7.5 9.1 88% AA AA+
Milson 2 2 12.5 / 17 15 19.2 22.9 7.1 14.4 17.0 15 19.2 75% AAA AAA
Parkville 1 2 3 2.9 3.7 7.6 1.6 1.7 2.0 0 1.6 104% A1 AA
Pascal St 2 4 20 19.2 24.6 38.1 8.3 20.5 24.1 19.2 24.6 83% AAA AAA
Pongaroa 1 2 3 2.9 3.7 7.6 0.7 0.6 0.9 0 0.7 84% A1 A1
Sanson 2 1 7.5 7.5 9.6 15.2 4.1 6.6 7.8 7.5 9.6 69% A2 AA+
Turitea 2 2 12.5 / 17 14.5 18.5 22.9 2 13.9 15.6 14.5 16.5 84% AA AAA
Notes: The ambient temperature and hot spot temperature for which transformers are rated varies. See Powerco’s Zone Substation Transformer Rating Standard 393S041. ONAN capacities reported are the ratings assigned by this standard.

Return to Index 149ASSET MANAGEMENT PLAN ELECTRICITY NETWORKS FY2010 – FY2019
Table 7.22: Taranaki Substation Maximum Demands and Transfer Capacities
SubstationNo of Xfmrs
No of 33 kV
in-feedsXfmr Nameplate
Rating (MVA)Xfmr Cont Rating
20deg (MVA)
Xfmr 4 Hour Rating 20deg
(MVA)
Switch-gear firm Capacity
(MVA)
Feeder Transfer
Capacity (MVA)
2009 98th percentile
Load (MVA)
2009 Maximum
Demand (MVA)
Substation Firm
Capacity (MVA)
Substation Class
Capacity (MVA)
98th Percentile
Load as % of Class
Capacity
2009 Security of
Supply
Desired Security
Class
Bell Block 2 2 16 / 24 21.1 27 22.9 4 16.9 19.2 21.1 25.1 67% AAA AAA
Brooklands 2 2 16 / 24 21.1 27 38.1 12 17.0 23.0 21.1 27 63% AAA AAA
Cambria 2 2 10 9.6 12.3 22.9 6 13.1 16.7 9.6 12.3 107% AAA AAA
Cardiff 1 1 3 2.9 3.7 7.6 1.5 1.2 1.4 0 1.5 83% A1 A1
City 2 2 11.5 / 23 20.4 26.1 22.9 8 18.5 22.3 20.4 26.1 71% AAA AAA
Cloton Rd 2 2 10.0 / 13.0 11.4 14.6 22.9 3.5 7.6 9.4 11.4 14.6 52% AAA AA+
Douglas 1 1 5 5 6.4 22.9 1.9 1.3 1.8 0 1.9 70% A1 AA
Eltham 2 2 7.5 / 10 8.8 11.3 15.2 15 9.4 10.4 8.8 11.3 84% AAA AA+
Inglewood 2 2 5 5 6.2 14.2 1 4.3 5.7 5 6 72% AA+ AA
Kaponga 2 2 2.5 2.4 3 7.6 1 2.9 3.2 2.4 3 96% AA A1
Kapuni 2 2 5 5.8 7.1 22.9 1.5 7.1 9.6 5.8 7.1 100% AAA AA+
Livingstone 2 2 2.5 2.4 3.1 7.6 0 2.5 2.8 2.4 2.4 105% AA AA
Manaia 1 1 7.5 7.2 9.2 22.9 5 5.8 6.8 0 5 116% A1 AA+
McKee 2 2 1.3 1.2 1.5 7.6 1 1.0 1.0 1.2 1.5 63% A1 AA
Motukawa 1 2 2.5 2.4 3 4.6 1.1 1.0 1.4 0 1.1 95% A2 AA
Ngariki 1 3 5 / 6.25 5.5 7 7.6 3 2.2 2.4 0 3 72% AA AA
Pohokura 2 2 10 / 12.5 10 12.8 71.4 0 1.4 1.9 12.5 12.5 12% AA+ AA+
Pungarehu 2 2 3.0 / 4.0 3.5 4.5 15.2 1 2.9 5.0 3.5 4.5 65% AA A1
Tasman 2 2 5 4.8 6.1 22.9 3 6.1 6.8 4.8 6.1 99% AA AA+
Waihapa 2 2 1x1.25, 1x2.5 1x1.2, 1x2.4 1x1.5, 1x3.1 7.6 0.6 1.3 1.3 2.4 1.5 84% A2 AA
Waitara East 2 2 5 7.9 10.1 23.8 4 4.6 5.6 7.9 10.1 46% AA A1
Waitara West 2 2 5 5 6.4 23.8 4.3 4.3 5.3 5 6.4 67% AA AA
Whareroa 1 2 10 9.6 12.3 7.6 3.8 3.6 5.3 0 3.8 96% AA A1
TP Moturoa 2 2 11.5 / 23 * * * 13 17.8 21.0 * * * AAA AAA
Note: The ambient temperature and hot spot temperature for which transformers are rated varies. See Powerco’s Zone Substation Transformer Rating Standard 393S041. ONAN capacities reported are the ratings assigned by this standard.

Return to Index150 ASSET MANAGEMENT PLAN ELECTRICITY NETWORKS FY2010 – FY2019
Table 7.23: Tauranga Substation Maximum Demands and Transfer Capacities
SubstationNo of Xfmrs
No of 33 kV in-feeds
Xfmr Nameplate Rating (MVA)
Xfmr Cont Rating 20deg (MVA)
Xfmr 2 Hour Rating (MVA)
Transformer 4 Hour Rating
(MVA)
Switch-gear firm Capacity
(MVA)
Backup Capacity Available
(MVA)
2009 98th percentile
Load (MVA)
2009 Maximum
Demand (MVA)
Substation Firm
Capacity (MVA)
Substation Class
Capacity (MVA)
98th Percentile
Load as % of Class
Capacity
2009 Security of
Supply
Desired Security
Class
Aongatete 2 2 5 5.8 8.3 7.2 22.9 5.0 4.3 6.3 7.2 12.2 35% AA A1
Atuaroa 1 2 12.5 / 17 15 22 18.6 38.1 5.0 5.8 6.8 0 5.0 115% AA AAA
Hamilton St 2 2 16 / 24 21.1 31 26.2 38.1 6.0 11.6 14.0 26.2 32.2 36% AAA AAA
Katikati 1 1 10 / 12.5 11 15.7 13.6 38.1 4.0 5.7 7.0 0 4.0 142% A1 AA
Kauri Point 1 1 5 5 7.4 6.4 7.6 2.0 2.0 2.7 0 2.0 99% A2 A1
Matua 2 1 5 5.8 8.5 7.4 22.9 3.5 7.9 9.3 0 3.5 225% A2 AA
Omokoroa 1 2 10 / 12.5 10.6 15.2 13.2 22.9 1.5 7.1 9.0 13.2 14.7 48% A2 AA
Otumoetai 2 2 10/12.5, 12.5/15 10.6, 13.2 15.6, 19.6 13.4, 13.6 22.9 4.0 12.6 17.5 13.4 17.4 73% AA AA
Papamoa 2 2 11.5/23 20.4 30 23.8 22.9 4.0 18.7 24.2 23.8 27.8 67% AAA AAA
Pongakawa 2 1 5 5 7.2 6.2 22.9 3.2 4.6 5.5 0 3.2 144% A1 A1
Te Puke 2 2 16 / 24 21.1 31 26.2 22.9 3.0 17.0 18.9 26.2 29.2 58% AAA AAA
Triton 2 2 11.5 / 23 18.6 26.6 23.1 22.9 2.0 20.1 24.1 23.1 25.1 80% AAA AA
Waihi Rd 2 2 16/24 21.1 31 26.2 38.1 5.0 13.9 15.6 26.2 31.2 45% AAA AAA
Welcome Bay 2 2 11.5 / 23 20.4 30 23.8 22.9 2.0 14.8 19.1 23.8 25.8 57% AA AA
Note:
1) The ambient temperature and hot spot temperature for which transformers are rated varies. See Powerco’s Zone Substation Transformer Rating standard 393S041.
2) ONAN capacities reported are the ratings assigned by this standard.
3) Definition of Substation Class Capacity :- Station firm Capacity (MVA) plus Backup capacity (MVA)

Return to Index 151ASSET MANAGEMENT PLAN ELECTRICITY NETWORKS FY2010 – FY2019
Table 7.24: Valley Substation Maximum Demands and Transfer Capacities
SubstationNo of Xfmrs
No of 66kV or
33kV in-feeds
Xfmr Nameplate Rating (MVA)
Xfmr Cont Rating 20deg (MVA)
Xfmr 2 Hour Rating (MVA)
Transformer 4 Hour Rating (MVA)
Switch-gear Firm Capacity
(MVA)
Backup Capacity Available
(MVA)
2009 98th Percentile
Load (MVA)
2009 Maximum
Demand (MVA)
Substation Firm
Capacity (MVA)
Substation Class
Capacity (MVA)
98th Percentile
Load as % of Class
Capacity
2009 Security of
Supply
Desired Security
Class
Baird Rd 2 1 5 4.8 7.1 6.1 22.9 5.0 6.8 9.9 0 5.0 136% AA AA
Browne St 1 2 7.5 10 14.7 12.8 22.9 3.0 6.1 10.9 0 3.0 203% A2 AA
Coromandel 1 1 5 5 7.4 6.4 22.9 0.0 3.0 4.0 0 0.0 none A2 AA
Farmers Rd 2 2 5 5.8 7.4 6.4 22.9 2.5 6.0 7.0 6.4 8.9 67% AA AA
Kerepehi 2 1 7.5 + 5 8.6 + 5.0 12.3 + 8.2 10.7 + 7.1 22.9 3.0 6.6 8.0 0 3.0 220% A2 A1
Lake Rd 1 1 5 5 7.2 6.2 22.9 2.4 4.5 5.3 0 2.4 187% A1 A1
Lakeside + Midway 2 1 3 + 3 2.9 + 2.9 4.1 3.6 n/a n/a 2.5 5.2 n/a n/a n/a n/a n/a
Maraetai Rd 2 1 7.5 7.2 10.6 9.2 22.9 4.0 7.9 9.5 0 4.0 198% A2 AA+
Matatoki 1 1 7.5 5.8 7.9 7 22.9 3.0 3.4 4.9 0 3.0 112% A2 AA+
Mikkelsen Rd 2 2 12.5/17 15 22 20 22.9 3.7 12.1 13.3 20 23.7 51% AA AA
Morrinsville 2 1 5 7 10 8.7 22.9 3.0 7.5 9.5 0 3.0 250% AA AA
Paeroa 2 2 5 4.8 6.9 6.0 22.9 3.0 6.0 8.0 6 9.0 67% AA AA
Piako 2 2 7.5 7.5 10.7 9.3 22.9 4.0 10.6 12.7 9.3 13.3 79% AA AA
Putaruru 2 2 7.5 8.3 12.1 10.6 22.9 3.5 9.3 10.8 10.6 14.1 66% A2 AA
Tahuna 1 1 5 7 10.3 9.0 22.9 3.0 4.7 5.7 0 3.0 155% A2 A2
Tairua 2 2 7.5 7.5 10.7 9.3 22.9 1.0 5.1 7.6 0 1.0 509% A2 AA
Thames T1&T2 2 1 7.5 7.5 11.1 9.9 22.9 6.1 10.7 14.0 0 6.1 176% AA AA
Thames T3 1 1 5 5 7.4 6.4 22.9 6.9 2.6 3.4 0 6.9 38% AA AA
Tirau 1 1 7.5/10 8.8 12.1 10.7 22.9 2.8 7.5 8.1 0 2.8 269% A2 AA+
Tower Rd 1 1 7.5 8.6 11.8 10.5 22.9 3.0 6.9 8.8 0 3.0 230% A2 AA
Waharoa 1 2 7.5 7.5 10.7 9.3 38.1 3.0 5.7 6.6 0 3.0 188% AA AA
Waihi 2 2 7.5 10 14.3 12.4 22.9 2.0 13.9 15.6 12.4 14.4 97% AA AA
Waihi Beach 1 1 5 5 7.4 6.4 22.9 2.0 3.7 5.5 0 2.0 185% A1 A1
Waitoa 3 3 7.5 10 14.7 12.8 22.9 0.0 9.6 10.6 20 20.0 48% AAA AAA
Walton 1 1 7.5 7.2 10.3 8.9 22.9 3.5 4.3 5.2 0 3.5 124% A1 A1
Whangamata 2 1 7.5/10 + 5 10 + 5 14.7 + 7.2 12.8 + 6.2 22.9 2.0 4.9 8.5 0 2.0 243% A2 AA
Whitianga 2 1 12.5 / 17 15 22 20 22.9 1.5 10.7 14.9 0 1.5 710% A2 AA
Note:
1) The ambient temperature and hot spot temperature for which transformers are rated varies. See Powerco’s Zone Substation Transformer Rating standard 393S041.
2) ONAN capacities reported are the ratings assigned by this standard.
3) For Tairua, it is assumed that the 66kV supply from Coroglen cannot be used because of thermal constraints through the Kauaeranga Valley.
4) Definition of Substation Class Capacity :- Station firm Capacity (MVA) plus Backup capacity (MVA)

Return to Index152 ASSET MANAGEMENT PLAN ELECTRICITY NETWORKS FY2010 – FY2019
Table 7.25: Wairarapa Substation Maximum Demands and Transfer Capacities
SubstationNo of Xfmrs
No of 33 kV
In-feedsXfmr Nameplate
Rating (MVA)Xfmr Cont Rating
20deg (MVA)
Xfmr 4 Hour Rating 20deg
(MVA)
Switch-gear firm Capacity
(MVA)
Feeder Transfer
Capacity (MVA)
2009 98th percentile
Load (MVA)
2009 Maximum
Demand (MVA)
Substation Firm
Capacity (MVA)
Substation Class
Capacity (MVA)
98th Percentile
Load as % of Class
Capacity
2009 Security of
Supply
Desired Security
Class
Akura 2 2 7.5 / 10 8.5 10.9 22.9 7 10.1 11.3 8.5 10.9 93% AA+ AA+
Awatoitoi 1 1 3 3 3.7 22.9 1.2 1.3 1.3 0 1.2 105% A2 A2
Chapel 2 2 11.5 / 23 18.6 23.8 22.9 8 13.0 18.9 18.6 23.8 55% AA+ AAA
Clareville 2 2 7.5 / 10 8.5 10.9 22.9 0 7.4 10.0 8.5 8.5 87% AA AA+
Featherston 1 2 5 / 6.25 5.5 7 22.9 2.5 3.9 4.6 0 2.5 155% A2 AA
Gladstone 1 1 1 1 1.2 22.9 0.7 1.2 1.2 0 0.7 166% A2 A1
Hau Nui 1 1 5 / 6.25 5.5 7 7.6 0 0.3 0.3 0 0 - A2 AA
Kempton 1 1 5 / 6.25 5.5 7 22.9 2.8 3.4 5.0 0 2.8 122% A2 AA
Martinborough 1 2 5 / 6.25 5.5 7 22.9 2.3 3.1 4.5 0 2.3 133% A1 AA
Norfolk 2 2 5 / 6.25 5.5 7 22.9 2.5 6.3 6.3 5.5 7 90% AAA AA+
Te Ore Ore 1 2 5 / 6.25 5.5 6.8 22.9 5 5.4 6.4 0 5 107% AA AA
Tinui 1 1 1.5 1.3 1.7 15.2 0.8 0.9 0.9 0 0.8 106% A2 A2
Tuhitarata 1 1 3 2.9 3.7 11.4 1.5 2.6 2.6 0 1.5 173% A2 AA
Note: The ambient temperature and hot spot temperature for which transformers are rated varies. See Powerco’s Zone Substation Transformer Rating Standard 393S041. ONAN capacities reported are the ratings assigned by this standard.

Return to Index 153ASSET MANAGEMENT PLAN ELECTRICITY NETWORKS FY2010 – FY2019
Table 7.26: Wanganui Substation Maximum Demands and Transfer Capacities
SubstationNo of Xfmrs
No of 33 kV In-feeds
Xfmr Nameplate Rating (MVA)
Xfmr Cont Rating 20deg (MVA)
Xfmr 4 Hour Rating 20deg (MVA)
Switch-gear firm Capacity (MVA)
Feeder Transfer Capacity (MVA)
2009 98th percentile Load (MVA)
2009 Maximum Demand (MVA)
Substation Firm Capacity (MVA)
Substation Class Capacity (MVA)
98th Percentile Load as % of Class Capacity
2009 Security of Supply
Desired Security Class
Arahina 1 1 10 / 12.5 10.6 13.6 22.9 7.2 6.9 8.7 0 7.2 95% AA AA+
Beach Rd 1 2 10 9.6 12.5 22.9 4.2 6.3 8.1 0 4.2 150% A2 AA+
Blink Bonnie 1 2 5 4.8 6.1 22.9 2.9 2.4 4.3 0 2.9 83% AA AA
Bulls 1 1 7.5 7.2 9.2 22.9 3.6 4.7 5.6 0 3.6 131% A2 AA+
Castlecliff 2 2 1x7.5, 1x10 1x7.2, 1x9.6 1x9.2, 1x12.3 22.9 2.4 7.5 11.0 7.2 9.2 81% AA AA+
Hatricks Wharf 1 2 7.5/10 8.8 11.3 22.9 8 9.5 11.9 0 8 118% AA AA+
Kai Iwi 1 1 5 4.8 6.1 15.2 2.1 1.7 2.2 0 2.1 81% A2 AA
Peat St 1 2 10/12.5/20 16.2 20.7 22.9 7.8 13.3 16.0 0 7.8 170% AA AAA
Pukepapa 1 1 10 / 12.5 8.8 11.3 22.9 6.5 3.0 8.5 0 6.5 46% AA A1
Rata 1 1 7.5 7.5 9.6 7.6 2 1.7 2.1 0 2 86% A2 A1
Roberts Ave 1 1 7.5 / 10 7.2 9.2 22.9 3.9 4.2 9.7 0 3.9 108% AA AA
Taihape 1 2 10 9.6 13.6 22.9 0.7 6.4 6.4 0 0.7 917% A1 AA+
Taupo Quay 1 2 10 / 12.5 11 14.1 22.9 6 7.8 11.4 0 6 129% AA AA+
Waiouru 1 1 7.5 7.2 9.2 15.2 0.5 2.8 3.4 0 0.5 562% A2 AA
Wanganui East 1 1 7.5 7.2 9.2 22.9 3.8 4.7 6.5 0 3.8 125% A2 AA+
TP Ohakune * * * 1.8 2.3 * * * A2 A1
TP Waverley * * * 3.5 3.9 * * * A2 A1
Note: The ambient temperature and hot spot temperature for which transformers are rated varies. See Powerco’s Zone Substation Transformer Rating Standard 393S041. ONAN capacities reported are the ratings assigned by this standard.

Return to Index154 ASSET MANAGEMENT PLAN ELECTRICITY NETWORKS FY2010 – FY2019
Manawatu Network Descriptions 7.8.6.
The following paragraphs provide a commentary of the supply arrangements covering network adequacy for the Manawatu subregion by each zone substation, along with the individual development options.
alfredton, Parkville and Pongaroa substations supply areas of northern Wairarapa. They are connected in a ring and have A1 security. Each consists of a single transformer that has sufficient installed capacity to meet forecast load growth. There are sufficient interconnections between these substations and Mangamutu for mutual support. Alfredton, Parkville and Pongaroa’s futures are under consideration and they may be disestablished.
Bunnythorpe GXP supplies the western side of Palmerston North and the country towards the Rangitikei River. Powerco owns the 33kV switchgear at Bunnythorpe. This switchgear is aged and in need of replacement.
Feilding substation supplies Feilding and the surrounding rural area, commercial, industrial, residential and rural load. It has two transformers with a capacity of 21.1MVA, which contribute to AAA security. Its capacity will be adequate for the planning period, provided the Manawatu’s District Council Long-Term Plan of 25 years-plus, showing areas available for about 3000 subdivisions, does not come to fruition. Upgrading a small section of existing and constructing a third Bunnythorpe-Feilding 33kV circuit is likely to be carried out in the early of planning period. New 33kV switchgear is planned at the same time.
Kairanga substation supplies residential consumers in South Western Palmerston North, the rural load to the south east of Palmerston North and the Fonterra milk factory at Longburn. It has two 15MVA transformers and the load is likely to exceed a single transformer capacity near the end of planning period. Two new transformers are planned for 2023. At 33kV, Kairanga and Pascal St substations are connected on an open ring from Linton GXP. Kairanga’s present security level is AA, and an upgrade of communication link for protection signal is in progress to allow operation with the ring closed, providing AAA security
Keith St substation supplies industrial, commercial and residential load in Palmerston North. It also provides support for Main St substation. The transformers were upgraded in 2003 to 18.6MVA. It has AAA security. Load has been transferred from Main St to Keith St to better utilise transformer capacity. Its capacity will be adequate for the planning period. The load on the 33kV feeders into Keith St is near to the capacity. This is being monitored and some sections of cable will need to be replaced.
Kelvin Grove substation supplies the commercial, industrial and residential load in Palmerston North and the rural load to the north. Its single transformer capacity Is likely to exceed near the end of the planning period. Two new transformers are planned for
2022. Its present security level is AA. Upgrading to AAA security is considered to be technically difficult but AA+ is achievable. Development in the area is likely to require either upgrading of the zone substation or a new zone substation in the planning period.
Longburn is a disestablished single transformer zone substation through which the Linton Kairanga line passes. Its transformer and switchgear were relocated when the dairy factory load for which it was established was shutdown. Re-establishment is being considered with potential increase in loads at Linton Army Camp, NZ Pharmaceuticals and other network configuration.
Kimbolton substation supplies the settlement of Kimbolton and the surrounding rural area. It has sufficient installed transformer capacity to the end of the planning period. Backfeeding from Feilding is possible and a regulator site has been installed to achieve this. Its security level is A2. A neutral earthing compensator is being trialled to minimise outages due to earth faults.
Main St substation supplies the Palmerston North CBD. It has a new 11kV switchboard, and a new 33kV switchboard is planned for 2008. It has AAA security. It has two 20MVA transformers and the load has exceeded a single transformer rating. Some load has already been transferred from Main to Keith and Pascal to better utilise spare transformer capacity. Further transfer to Keith St will be investigated. A new zone substation at the south end of the CBD (Fitzherbert) is anticipated in the planning period.
Mangamutu substation supplies Pahiatua, a Fonterra dairy factory and the surrounding rural area. Load growth largely depends on dairy industry load. Fans were fitted to the transformers in 2006 to increase capacity but this may be insufficient for the planning period. Transformer rotation plan includes replacing the present transformers with two 10 MVA units. Short sections of 33kV cable will need to be replaced in the near future. Its security level is AA.
Milson substation supplies the industrial, commercial and residential load in western Palmerston North, including the airport. Its security level is AAA. It has two 15MVA transformers and its capacity will need to be increased near the end of planning period or load transferred to a new zone substation, which will also reduce load off Kelvin Grove. Two new transformers are planned for 2020.
Parkville substation supplies the town of Ekatahuna and the surrounding rural area. It has one 2.9MVA autotransformer. Its security level is A2. There has been a motel and other amenities mooted for Ekatahuna. Should a 300-500kVA load eventuate, as has been forecast, the MD for 2022 would be achieved with just this one major load.
Pascal St substation supplies the industrial, commercial and residential load in central Palmerston North. Its security level is AAA and has two 19.2MVA transformers. The load will exceed a single transformer rating in the early of planning period with no load

Return to Index 155ASSET MANAGEMENT PLAN ELECTRICITY NETWORKS FY2010 – FY2019
transfer. Fitzherbert new zone substation at the south end of the CBD will alleviate load from Pascal St. and no new transfomers will be requirred in the planning period.
Pongaroa substation is a small rural substation supplying the rural load in the north eastern Wairarapa area. There is one 2.9MVA autotransformer and its security level is A1. Pongaroa can be supplied via 11kV from Mangamutu substation, although the voltage is marginal under some conditions. Its future is under consideration.
Sanson substation supplies Sanson township, Ohakea Air Force base and the surrounding rural area. The single circuit 33kV supply limits its security level to A2 and upgrading is not considered economically justified. Sanson has two 7.5MVA transformers and, with increased loads, these are operating at peak times past their firm capacity. Transformer rotation plan includes changing out the transformers with two 7.5/10MVA units in 2013. Major load increases from Ohakea Air Force base may require a new small zone substation in the area and linking up with Bulls substation could eventuate.
Turitea substation supplies Massey University, Linton Military Camp, industrial, residential and rural load to the south east of Palmerston North. It has two 12.5MVA transformers. New Fitzherbert zone substation south of the CBD will alleviate load from Turitea when a link into Massey University and Summerhill is established. There are new loads that are requiring a new feeder from Turitea to split Linton feeder into two. The Linton feeder is affected and further growth south-east of Turitea is expected. Turitea is supplied by one 33kV line from Linton GXP. A second line has been considered for providing AAA security but the existing line from Linton is short and rarely faults and there is little economic justification for it.
Tararua Wind Power (TWP), not owned by Powerco, has been configured as two groups of turbines of approximately 34MW, each in a north and south configuration and supplying Kelvin Grove and Turitea substations. At times the Northern generation supply can also be connected into Keith St substation. They are connected into Powerco by a 33kV cable network. Its capacity may be increased during the planning period.
Taranaki Network Description7.8.7.
The following paragraphs provide a commentary of the supply arrangements covering network adequacy for the Taranaki subregion by each zone substation, along with the individual development options.
Bell Block substation supplies the Bell Block industrial area, and the nearby residential and surrounding rural areas. The area offers flat industrial-zoned sites, conveniently sited for access to the highway, port and rail at reasonable cost, so further industrial load growth is likely. Its security level is AAA and its capacity is expected to be adequate for the planning period. With load growth in the Waiwhakaiho area and a new Katere zone substation being established, upgrading the existing 33kV lines from Carrington is likely in the planning period.
Brooklands Substation supplies the southern residential area of New Plymouth and the rural area to the south of the city. There is significant residential development going on in the area, and additional residential sections are being subdivided. It is a new substation, with AAA security level and adequate capacity for the planning period. To improve the substation utilisation, network reconfiguration between Brooklands, City Sub, Moturoa and the new Katere substation will be undertaken.
Cambria substation supplies the commercial and residential areas of Hawera and the immediate surrounding rural area. Its security level is AAA. It has seen unpredicted load growth in recent years and requires upgrading. The plan is to replace present 2 x 10 MVA transformers with 2 x 16/24 MVA refurbished transformers in 2010. This will provide adequate single transformer capacity to meet the load growth during planning period.
Cardiff substation supplies the rural area to the west of Stratford and provides support for Kaponga. With a security level of A1 it has a single 2.9MVA transformer, which is expected to be adequate for the planning period.
City substation supplies the central business district and surrounding residential area of New Plymouth. There is some building activity, but there is capacity for further development in the central business district where a number of retail and office premises are vacant. It has two 20.4MVA transformers and a security level of AAA. The 33kV cables supplying were replaced in 2008.
Cloton Rd substation supplies the commercial and residential areas of Stratford and the surrounding rural area. The population is static, with little building activity, although the dairy load is growing. Its security level is AAA and its capacity is expected to be adequate for the planning period.
Douglas substation supplies consumers to the east of Stratford and beyond Whangamomona. With a security level of A1, it has a single 5MVA transformer, which is expected to be adequate for the planning period.
Eltham substation supplies Eltham town and the surrounding rural area. A significant part of its load is taken by Riverlands freezing works and the Fonterra dairy products factory. Expansion of the dairy foods factories will result in a load increase. Its security level is AAA but its class capacity is exceeded and load reduction would be needed in the event of a sustained outage. New transformers are included in the planning period.
Inglewood substation supplies Inglewood town and the surrounding rural area. Its security level is AA+ and its capacity is expected to be adequate for the planning period.
Kaponga substation supplies Kaponga and the surrounding rural area. Its security level is AA and its capacity is marginal but low load growth makes reinforcement in the planning period unlikely.
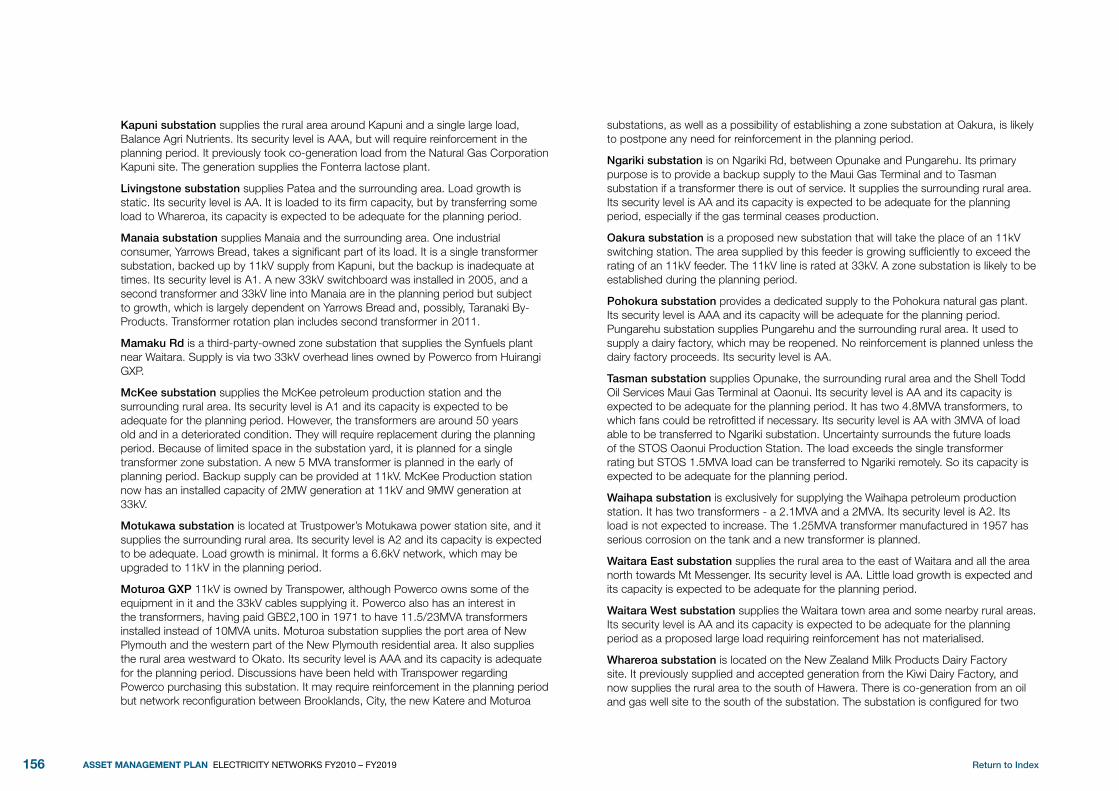
Return to Index156 ASSET MANAGEMENT PLAN ELECTRICITY NETWORKS FY2010 – FY2019
Kapuni substation supplies the rural area around Kapuni and a single large load, Balance Agri Nutrients. Its security level is AAA, but will require reinforcement in the planning period. It previously took co-generation load from the Natural Gas Corporation Kapuni site. The generation supplies the Fonterra lactose plant.
Livingstone substation supplies Patea and the surrounding area. Load growth is static. Its security level is AA. It is loaded to its firm capacity, but by transferring some load to Whareroa, its capacity is expected to be adequate for the planning period.
Manaia substation supplies Manaia and the surrounding area. One industrial consumer, Yarrows Bread, takes a significant part of its load. It is a single transformer substation, backed up by 11kV supply from Kapuni, but the backup is inadequate at times. Its security level is A1. A new 33kV switchboard was installed in 2005, and a second transformer and 33kV line into Manaia are in the planning period but subject to growth, which is largely dependent on Yarrows Bread and, possibly, Taranaki By-Products. Transformer rotation plan includes second transformer in 2011.
Mamaku Rd is a third-party-owned zone substation that supplies the Synfuels plant near Waitara. Supply is via two 33kV overhead lines owned by Powerco from Huirangi GXP.
McKee substation supplies the McKee petroleum production station and the surrounding rural area. Its security level is A1 and its capacity is expected to be adequate for the planning period. However, the transformers are around 50 years old and in a deteriorated condition. They will require replacement during the planning period. Because of limited space in the substation yard, it is planned for a single transformer zone substation. A new 5 MVA transformer is planned in the early of planning period. Backup supply can be provided at 11kV. McKee Production station now has an installed capacity of 2MW generation at 11kV and 9MW generation at 33kV.
Motukawa substation is located at Trustpower’s Motukawa power station site, and it supplies the surrounding rural area. Its security level is A2 and its capacity is expected to be adequate. Load growth is minimal. It forms a 6.6kV network, which may be upgraded to 11kV in the planning period.
Moturoa GxP 11kV is owned by Transpower, although Powerco owns some of the equipment in it and the 33kV cables supplying it. Powerco also has an interest in the transformers, having paid GB£2,100 in 1971 to have 11.5/23MVA transformers installed instead of 10MVA units. Moturoa substation supplies the port area of New Plymouth and the western part of the New Plymouth residential area. It also supplies the rural area westward to Okato. Its security level is AAA and its capacity is adequate for the planning period. Discussions have been held with Transpower regarding Powerco purchasing this substation. It may require reinforcement in the planning period but network reconfiguration between Brooklands, City, the new Katere and Moturoa
substations, as well as a possibility of establishing a zone substation at Oakura, is likely to postpone any need for reinforcement in the planning period.
Ngariki substation is on Ngariki Rd, between Opunake and Pungarehu. Its primary purpose is to provide a backup supply to the Maui Gas Terminal and to Tasman substation if a transformer there is out of service. It supplies the surrounding rural area. Its security level is AA and its capacity is expected to be adequate for the planning period, especially if the gas terminal ceases production.
Oakura substation is a proposed new substation that will take the place of an 11kV switching station. The area supplied by this feeder is growing sufficiently to exceed the rating of an 11kV feeder. The 11kV line is rated at 33kV. A zone substation is likely to be established during the planning period.
Pohokura substation provides a dedicated supply to the Pohokura natural gas plant. Its security level is AAA and its capacity will be adequate for the planning period. Pungarehu substation supplies Pungarehu and the surrounding rural area. It used to supply a dairy factory, which may be reopened. No reinforcement is planned unless the dairy factory proceeds. Its security level is AA.
Tasman substation supplies Opunake, the surrounding rural area and the Shell Todd Oil Services Maui Gas Terminal at Oaonui. Its security level is AA and its capacity is expected to be adequate for the planning period. It has two 4.8MVA transformers, to which fans could be retrofitted if necessary. Its security level is AA with 3MVA of load able to be transferred to Ngariki substation. Uncertainty surrounds the future loads of the STOS Oaonui Production Station. The load exceeds the single transformer rating but STOS 1.5MVA load can be transferred to Ngariki remotely. So its capacity is expected to be adequate for the planning period.
Waihapa substation is exclusively for supplying the Waihapa petroleum production station. It has two transformers - a 2.1MVA and a 2MVA. Its security level is A2. Its load is not expected to increase. The 1.25MVA transformer manufactured in 1957 has serious corrosion on the tank and a new transformer is planned.
Waitara East substation supplies the rural area to the east of Waitara and all the area north towards Mt Messenger. Its security level is AA. Little load growth is expected and its capacity is expected to be adequate for the planning period.
Waitara West substation supplies the Waitara town area and some nearby rural areas. Its security level is AA and its capacity is expected to be adequate for the planning period as a proposed large load requiring reinforcement has not materialised.
Whareroa substation is located on the New Zealand Milk Products Dairy Factory site. It previously supplied and accepted generation from the Kiwi Dairy Factory, and now supplies the rural area to the south of Hawera. There is co-generation from an oil and gas well site to the south of the substation. The substation is configured for two

Return to Index 157ASSET MANAGEMENT PLAN ELECTRICITY NETWORKS FY2010 – FY2019
transformers but only one is now installed. Its security level is AA, but it is loaded to its class capacity. It has a transformer rating in excess of the load and future growth requirements. The Whareroa transformer is on the transformer rotation schedule.
Tauranga Network Description7.8.8.
The following paragraphs provide a commentary of the supply arrangements covering network adequacy for the Tauranga subregion by each zone substation along, with the individual development options.
aongatete substation provides supply to Aongatete, Matakana Island, and the surrounding rural area. There are a number of cool stores and sawmills in the area. Its security level is AA. Its security level is AA and its capacity is expected to be adequate for the planning period. Its 33kV lines are being upgraded progressively.
atuaroa substation is a new zone substation that supplies the growing industrial load at the north end of Te Puke. It has AA security at present, but this will be increased when a second transformer is installed and second 33kV cable laid, depending on load growth.
Greerton switching station links the Kaimai Hydro scheme with Tauranga GXP, Aongatete and Otumoetai 33kV rings. The security of Greerton is important given the importance and number of customers it supplies.
hamilton St substation supplies Tauranga City CBD, Sulphur Point and the Port of Tauranga. Its security level is AAA and its capacity will be adequate for the planning period provided that the incoming 33kV ring is upgraded. A new zone substation at Sulphur Point is proposed for supplying businesses in this area, for backing up Matua and the supply to the CBD.
Katikati substation is a new zone substation that supplies the town of Katikati and the surrounding rural area. Its security level is AA and a second transformer is planned for installation in 2012.
Kauri Point substation supplies the area between Katikati and Waihi Beach, including some small beach settlements. A voltage regulator is located at Kauri Point substation to provide back up for parts of the 11kV network. Its security level is AA.
Matapihi substation is under construction to supply the Mt Maunganui (Bayfair) area. It is located adjacent to Transpower’s GXP and will have two 16/24MVA transformers. It will also house the SCADA hub for the Tauranga subregion, which is being installed as part of the SCADA Master Station replacement project.
Matua substation supplies the Tauranga suburban load, with some load growth expected to come from infill housing. It is loaded beyond its class capacity. AA security is desired but, due to the single supply, only A2 is available. An 11kV reinforcement is planned to restore class capacity.
Omanu substation has been proposed for sometime, this new substation will provide support to Triton Substation. A contract has been an issue for the civil work with the construction of this new substation, some preliminary site works have been started.
Omokoroa substation supplies the area north of Tauranga, a mix of rural, lifestyle blocks and urban residential consumers. Load growth for this area is significant, with the District Council signalling the possibility of more urban development. AA security is desired but, due to the single transformer, only A2 is available. A second transformer was installed in 2009. The 11kV switchboard was replaced when the second transformer banks were installed. The protection arrangements for the incoming 33kV lines are difficult to set discriminatively. New zone substations at apata may be required if the presently forecast load from horticulture in the area occurs, and in Omokoroa town itself to cater for likely population growth.
Otumoetai substation supplies the Otumoetai and Bethlehem areas of Tauranga. Steady load growth is forecast for this area. Its security level is AA and its capacity is expected to be adequate for the planning period, although the 11kV switchgear is aged and due for replacement in 2009. A new zone substation is proposed at Bethlehem to cater for load growth in the area, improve reliability of existing feeders and provide backup supply options to the other side of the Wairoa River.
Papamoa substation supplies the Papamoa area. Residential growth is continuing at a strong rate, and the load has increased rapidly. Its security level is AAA. It will exceed its firm capacity in 2009 and reinforcement options are being evaluated. Papamoa substation will require relocating in the near future to accommodate highway extensions. Substations at Te Maunga and Papamoa East are proposed to reinforce Papamoa and to cater for the high levels of load growth.
Pongakawa substation supplies rural customers in the Pongakawa area. Its security level is AA and its capacity will be adequate for the planning period. However, the limited backup capacity on the distribution network means that a second zone substation at Paengaroa is planned. the new substation at Paengaroa will be commissioned in 2011.
Tauranga CBD is supplied by a 33kV ring from Greerton and Tauranga GXP. The capacity of each of the circuits in this 33kV ring is between 25 and 28MVA, based on sandy soil. The load is roughly the same as firm capacity. A proposal to lay new transformer feeder circuits to Waihi Rd and new cables between Greerton and Tauranga GXP in FY10 will reduce the loading on this ring. Another circuit runs between Hamilton St and Triton substations (Bridge Cable), however use of this circuit to supply the CBD from Mt Maunganui or Triton from Tauranga means a drop to N security levels.
Tauranga 11kV GxP is a Transpower supply point that supplies the Gate Pa area and a large rural area past Pyes Pa and the Kaimai area. Supply is via 110/11kV transformers, with a rating of 40MVA. This means that plenty of capacity is available but the fault level

Return to Index158 ASSET MANAGEMENT PLAN ELECTRICITY NETWORKS FY2010 – FY2019
is high and there are practical difficulties with laying new feeder cables along Cameron Rd. To supply the new subdivision, a new zone substation is proposed at Pyes Pa. This will initially be supplied from Tauranga 11kV GXP at 11kV and later be converted to 33kV.
Te Puke substation supplies Te Puke and the surrounding rural area including Rangiuru freezing works. Its security level is AAA and, with the recent establishment of Atuaroa substation, its capacity will be adequate for the planning period. Nevertheless, the distribution network has limited backup capacity and a new zone substations is proposed at Rangiuru to supply the proposed Rangiuru Business Park, an industrial subdivision. The proposed Paengaroa zone substation will also assist with backing up the feeders supplied from Te Puke.
Triton substation supplies a mix of industrial and urban customers in Mount Maunganui. The industrial load at the Port of Tauranga and the surrounding area is growing steadily. Its security level is AAA although it will require reinforcement by 2013. The new Omanu substation, which is planned for 2010, will reduce the load on Triton.
Waihi Road substation supplies urban and commercial load in the centre of Tauranga. Load is expected to increase, partly due to infill housing and intensification. Its security level is AAA and its capacity will be adequate for the planning period.
Welcome Bay substation supplies the Welcome Bay area. Its security level is AA and its capacity will be adequate for the planning period. Because of the terrain, distribution feeders follow long routes to cover short distances as the crow flies and customer counts per feeder are high. A new zone substation at Poike is proposed to cater for growth and reduce the customer count per feeder.
Valley Network Description7.8.9.
The following paragraphs provide a commentary of the supply arrangements covering network adequacy for the Valley subregion by each zone substation, along with the individual development options.
Baird Road substation supplies the northern part of Tokoroa, including the CBD and the farming area just to the north of Tokoroa. It has AA security, but is loaded to its class capacity. Dairy conversions from pine plantation are occurring in this area.
Browne Street substation supplies the western side of Matamata, including the CBD and the rural area towards Cambridge. It is loaded beyond its class capacity and requires support from Tower Rd substation. Security is A2. A project to install a second transformer at Browne St has been started. Commission of this second transformer should be completed June 2010.
Coroglen switching station comprises two remotely operable 66kV switches that can provide an alternative source of supply for Whitianga and Coromandel.
Coromandel peninsula is supplied from Kopu GXP via two 66kV circuits. One of the circuits goes to Coroglen through the Kauaeranga valley. The other supplies Tairua, and then crosses over to join the other circuit at Coroglen. From Coroglen, a single circuit supplies Whitianga and Coromandel. This is a rugged area to which access is difficult. The lines are now 50 years old and in need of renewal. Given the load growth in the area, the lines have recently been uprated to work at 70 degrees. A programme of reconductoring and reconstruction is under way. A second line from Coroglen to Kaimarama is going through a Notice of Requirement process and subject to easement negotiations. This will see two lines feeding a proposed switching station at Kaimarama.
Coromandel substation is a single transformer substation, which supplies Coromandel and the surrounding areas. There is no interconnection via the 11kV network with any other substations. Major maintenance generally requires supply interruptions, although generators have been used to maintain supply. Supply is via a single 66kV line. AA security is desired, but providing a supply security greater than A2 is not presently a viable proposition.
Farmer Road substation supplies two major industrial customers plus the dairy farms in the immediate area. Both of these major customers, Tatua Dairy and Wallace Corporation have indicated that their loading requirements are likely to increase. AA+ security is desired, but due to a single 33kV supply, only AA is available. Farmer Road is supplied from a tee from a bonded double circuit line passing nearby. A new GXP is planned for the Piako area and, once the incoming supply is modified, capacity and security will be adequate for the planning period.
Kerepehi substation provides supply to most of the Hauraki Plains, including the township of Ngatea. Its security level is A1. Backup supply via the 11kV network is available from Tahuna, Paeroa, and Matatoki substations. A second substation at Mangatarata is planned to better back up Kerepehi.
Lake Road substation is sited alongside the Transpower 33kV GXP at Hinuera. It supplies farms in the Hinuera area. It has A2 security and is loaded beyond its class capacity. A new substation at Okoroire is proposed that will back up the supply in the area.
Maraetai Road substation supplies the southern part of Tokoroa and the rural area south to Kinleith. No significant increase in load is predicted during the planning period. Security is A1 and it is loaded beyond its class capacity, but this can be increased to the required AA by reinforcing feeder links to Baird Rd. A new substation is planned for Mossops Rd in the planning period.
Matatoki substation is a single transformer substation supplying the Matatoki rural area and one major customer, Thames Timber at Kopu. AA+ security is desired, but due to a single supply, only A1 is available.
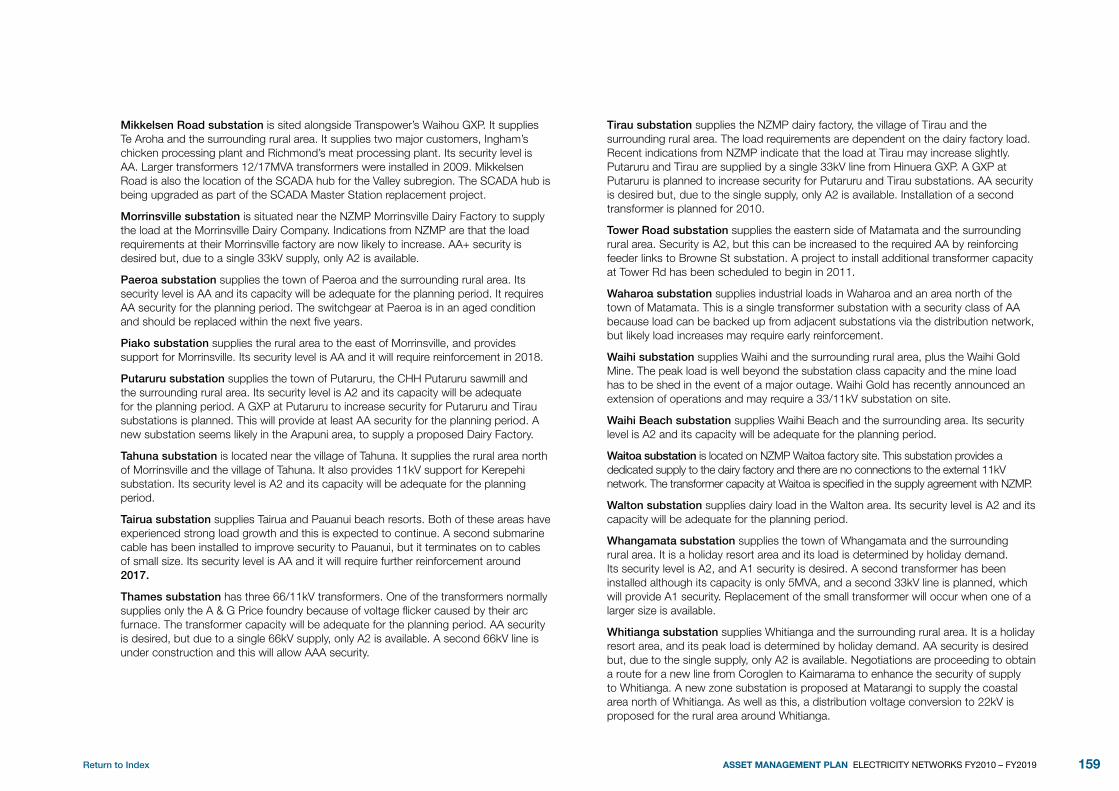
Return to Index 159ASSET MANAGEMENT PLAN ELECTRICITY NETWORKS FY2010 – FY2019
Mikkelsen Road substation is sited alongside Transpower’s Waihou GXP. It supplies Te Aroha and the surrounding rural area. It supplies two major customers, Ingham’s chicken processing plant and Richmond’s meat processing plant. Its security level is AA. Larger transformers 12/17MVA transformers were installed in 2009. Mikkelsen Road is also the location of the SCADA hub for the Valley subregion. The SCADA hub is being upgraded as part of the SCADA Master Station replacement project.
Morrinsville substation is situated near the NZMP Morrinsville Dairy Factory to supply the load at the Morrinsville Dairy Company. Indications from NZMP are that the load requirements at their Morrinsville factory are now likely to increase. AA+ security is desired but, due to a single 33kV supply, only A2 is available.
Paeroa substation supplies the town of Paeroa and the surrounding rural area. Its security level is AA and its capacity will be adequate for the planning period. It requires AA security for the planning period. The switchgear at Paeroa is in an aged condition and should be replaced within the next five years.
Piako substation supplies the rural area to the east of Morrinsville, and provides support for Morrinsville. Its security level is AA and it will require reinforcement in 2018.
Putaruru substation supplies the town of Putaruru, the CHH Putaruru sawmill and the surrounding rural area. Its security level is A2 and its capacity will be adequate for the planning period. A GXP at Putaruru to increase security for Putaruru and Tirau substations is planned. This will provide at least AA security for the planning period. A new substation seems likely in the Arapuni area, to supply a proposed Dairy Factory.
Tahuna substation is located near the village of Tahuna. It supplies the rural area north of Morrinsville and the village of Tahuna. It also provides 11kV support for Kerepehi substation. Its security level is A2 and its capacity will be adequate for the planning period.
Tairua substation supplies Tairua and Pauanui beach resorts. Both of these areas have experienced strong load growth and this is expected to continue. A second submarine cable has been installed to improve security to Pauanui, but it terminates on to cables of small size. Its security level is AA and it will require further reinforcement around 2017 .
Thames substation has three 66/11kV transformers. One of the transformers normally supplies only the A & G Price foundry because of voltage flicker caused by their arc furnace. The transformer capacity will be adequate for the planning period. AA security is desired, but due to a single 66kV supply, only A2 is available. A second 66kV line is under construction and this will allow AAA security.
Tirau substation supplies the NZMP dairy factory, the village of Tirau and the surrounding rural area. The load requirements are dependent on the dairy factory load. Recent indications from NZMP indicate that the load at Tirau may increase slightly. Putaruru and Tirau are supplied by a single 33kV line from Hinuera GXP. A GXP at Putaruru is planned to increase security for Putaruru and Tirau substations. AA security is desired but, due to the single supply, only A2 is available. Installation of a second transformer is planned for 2010.
Tower Road substation supplies the eastern side of Matamata and the surrounding rural area. Security is A2, but this can be increased to the required AA by reinforcing feeder links to Browne St substation. A project to install additional transformer capacity at Tower Rd has been scheduled to begin in 2011.
Waharoa substation supplies industrial loads in Waharoa and an area north of the town of Matamata. This is a single transformer substation with a security class of AA because load can be backed up from adjacent substations via the distribution network, but likely load increases may require early reinforcement.
Waihi substation supplies Waihi and the surrounding rural area, plus the Waihi Gold Mine. The peak load is well beyond the substation class capacity and the mine load has to be shed in the event of a major outage. Waihi Gold has recently announced an extension of operations and may require a 33/11kV substation on site.
Waihi Beach substation supplies Waihi Beach and the surrounding area. Its security level is A2 and its capacity will be adequate for the planning period.
Waitoa substation is located on NZMP Waitoa factory site. This substation provides a dedicated supply to the dairy factory and there are no connections to the external 11kV network. The transformer capacity at Waitoa is specified in the supply agreement with NZMP.
Walton substation supplies dairy load in the Walton area. Its security level is A2 and its capacity will be adequate for the planning period.
Whangamata substation supplies the town of Whangamata and the surrounding rural area. It is a holiday resort area and its load is determined by holiday demand. Its security level is A2, and A1 security is desired. A second transformer has been installed although its capacity is only 5MVA, and a second 33kV line is planned, which will provide A1 security. Replacement of the small transformer will occur when one of a larger size is available.
Whitianga substation supplies Whitianga and the surrounding rural area. It is a holiday resort area, and its peak load is determined by holiday demand. AA security is desired but, due to the single supply, only A2 is available. Negotiations are proceeding to obtain a route for a new line from Coroglen to Kaimarama to enhance the security of supply to Whitianga. A new zone substation is proposed at Matarangi to supply the coastal area north of Whitianga. As well as this, a distribution voltage conversion to 22kV is proposed for the rural area around Whitianga.

Return to Index160 ASSET MANAGEMENT PLAN ELECTRICITY NETWORKS FY2010 – FY2019
Wairarapa Network Description7.8.10.
The following paragraphs provide a commentary of the supply arrangements covering network adequacy for the Wairarapa subregion by each zone substation, along with the individual development options.
Chapel and akura substations supply the Masterton Central Business District, industrial and commercial areas, a significant part of Masterton residential area, and rural load to the north west of Masterton. Both of these substations require AAA security but presently have AA+ because the protection arrangements do not permit paralleling. A protection upgrade in Masterton is scheduled for completion by 2009. Chapel capacity is expected to be adequate for the planning period. Akura has two 8.5MVA transformers but the load has exceeded the firm capacity. Two new transformers are planned for Akura transformers in the early of planning period.
Featherston substation supplies Featherston and the surrounding rural area. Its security level is A2 and its capacity will be adequate for the planning period.
Gladstone substation is situated in a rural area to the east of Carterton, and supplies rural load. Its security level is A2. Present transformer is 1.5MVA and there are possibilities of new subdivision development which may alter the load forecast. The transformer rotation plan includes changing out the transformer with a 3MVA unit in the early stages of the planning period.
hau Nui substation is situated in south eastern Wairarapa, adjacent to the Genesis wind farm. Its primary purpose is to connect the wind farm output into the network, but it also supplies a very small rural load. Its security level is A2 and its capacity will be adequate for the planning period.
Kempton substation supplies Greytown and the surrounding rural area. Its security level is A2 and its capacity will be adequate for the planning period.
Martinborough substation supplies urban and rural load around Martinborough. Its security level is A1 and its capacity will be adequate for the planning period.
Norfolk substation is situated a few kilometres south of Masterton. It supplies several MVA of load to a single large consumer, as well as other industrial and rural load. Its security level is AAA. The load exceeds the single transformer rating and new transformers are planned for 2015.
Te Ore Ore substation is on the eastern edge of Masterton and supplies a mix of residential and rural load. Its security level is AA and its capacity will be adequate for the planning period. It is loaded to its class capacity but this, plus projected growth, can be handled by cyclic loading and load transfer. Nevertheless, it is likely to require reinforcement during the middle of the planning period.
Tuhitarata substation is situated in the southern Wairarapa area and supplies a rural load. Its security level is A2 and its capacity will be adequate for the planning period.
Tinui and awatoitoi substations are situated in rural areas to the east of Masterton, towards Castlepoint, and they supply rural loads. Their security levels are A2 and their capacities will be adequate for the planning period.
Wanganui Network Description7.8.11.
The following paragraphs provide a commentary of the supply arrangements covering network adequacy for the Wanganui subregion by each zone substation, along with the individual development options.
The Wanganui CBD subtransmission network is to be reconfigured to improve the security, reliability and asset utilisation. For Hatricks Wharf, Taupo Quay, Peat St, Beach Rd and Castlecliff substations, security levels and future reinforcement requirements will depend on the configuration adopted.
arahina substation is situated at Marton and supplies urban and rural load. Its security level is AA and its capacity will be adequate for the planning period.
Beach Road substation supplies a significant Wanganui west industrial load, including Imlay freezing works. It has one 10.6MVA transformer and its security of supply is A2. Network security is being revised and, with a major new industrial load, an additional transformer will be required. The transformer rotation plan includes installation of a second transformer in 2014. The outdoor 33kV switchgear is in a corroded condition and is planned to replace it with a new indoor 33kV switchgear in 2010.
Blink Bonnie substation is situated to the east of Wanganui, adjacent to the Transpower Wanganui GXP. It supplies the rural load to the south of Wanganui. Its security level is AA and its capacity will be adequate for the planning period. However the transformer is 53 years old and parts of the tank are corroded which needs to be monitored. The DP value is good for its age. Transformer rotation plan includes changing out the transformer in 2015.
Bulls substation supplies Bulls township and the surrounding rural load. Its security level is A2 and its capacity will be adequate for the planning period. But the load on Parewanui feeder is growing sufficiently to exceed the feeder voltage level threshold. A voltage regulating station is planned near the corner of Raumai Rd and Parewanui Rd. 6km of new 33kV line operated at 11kV will be required to feed this regulating station from Bulls substation. Construction of a new 33kV line from Bulls to Sanson substation is in progress. Part of its has been constructed from Sanson substation as a new feeder to feed large new load at Ohakea Air Force base.

Return to Index 161ASSET MANAGEMENT PLAN ELECTRICITY NETWORKS FY2010 – FY2019
Castlecliff substation supplies a portion of the city’s industrial load. Castlecliff has one 9.6MVA and one 7.2MVA transformers, and an upgrade to 2 x 9.6MVA is planned.
hatricks Wharf substation supplies part of the Wanganui CBD, the airport and some residential load south of the river. It is currently operating with a spare 7.5/10MVA transformer. A new transformer is likely to be installed during the planning period. There is an 11kV bus tie between Hatricks Wharf and Taupo Quay which can provide 10MVA load transfer capability between the two substations under non-peak load conditions.
Kai Iwi substation is situated north west of Wanganui and supplies the Wanganui City water pumping station and rural load. Its security level is A2. Its capacity is expected to be adequate for the planning period, but its 11kV backup supply is marginal for starting the water supply pumps. This situation is under investigation.
Ohakune GxP supplies Ohakune township and a large surrounding rural area. The substation is owned by Transpower with Powerco owning the 11kV switchgear. Its security level is A2. Because of its proximity to the ski-fields, a single large development could significantly alter the forecast. No reinforcement during the planning period is anticipated.
Peat St substation supplies a mix of residential and commercial loads, including the northern part of the Wanganui CBD. It is the main backup for Taupo Quay and Hatricks substations. The substation is configured for two transformers but only one is installed at present. New 33kV switchgear were installed in 2009 and a second transformer (ex Pukepapa) will be installed by 2010. Then, AA+ level of security will be achieved.
Pukepapa substation is situated adjacent to Transpower Marton GXP. It supplies rural load, but also provides a backup for Arahina and Bulls substations. Its security level is AA and its capacity is expected to be adequate for the planning period. The transformer at Pukepapa is identical to the Peat St transformer and will be relocated to Peat St. A refurbished transformer will be installed at Pukepapa.
Rata substation supplies Hunterville and the surrounding area, including 22kV distribution. Its security level is A2 and its capacity is expected to be adequate for the planning period.
Roberts ave substation is situated in Aramoho, supplying the Aramoho industrial area, and surrounding residential and rural areas. Its security level is AA and its capacity is expected to be adequate for the planning period. It provides substantial backup to Peat St.
Taihape substation supplies Taihape urban and rural load. A second transformer has been installed as a hot spare, bringing its security level to AA, although a single transformer bank at Transpower Mataroa limits the security. It has a 10 MVA transformer, which is in excess of the load and the transformer is identical to the Beach Rd. Transformer rotation plan includes changing out the transformer in 2014.
Taupo Quay substation supplies the western side of Wanganui CBD, inner residential load and the hospital. Its security level is AA. There is an 11kV bus tie between Hatricks Wharf and Taupo Quay which can provide 10MVA load transfer capability between the two substations under non peak load conditions. Reinforcement will be necessary in the planning period.
Waiouru substation is just south of Waiouru township. It supplies Waiouru, Waiouru army camp and the surrounding rural area. Its security level is A2 and its capacity is expected to be adequate for the planning period. It has one 7.2MVA transformer, which is likely to form part of a transformer rotation.
Wanganui East substation supplies the residential area on the east side of the Whanganui River and rural area to the east of Wanganui. Its security level is A2. It is loaded to its class capacity, and feeder interconnection reinforcement will be required during the planning period.
Waverley GxP supplies Waverley township and the surrounding rural area. The 11kV switchgear is owned by Transpower. Its security level is A2. The disestablishment of Waverley GXP requires careful consideration.
Fault Levels and Equipment Ratings7.8.12.
Analysis of fault levels on the network shows that equipment and cable ratings on the subtransmission network are generally adequate.
In the Tauranga distribution network, with its high levels of load growth, there are instances where small 11kV cables do not have the capability to withstand the full network fault level. Switchgear at Greerton switching station is just within its fault rating of 750MVA. When it undergoes a renewal programme, the switchgear will be uprated.
As development occurs, the fault levels will be closely scrutinised and transformer impedances will be specified to match the fault capability of the existing network.
Summary of Subtransmission Network Development7.8.13.
A summary of the major programmes of work including subtransmission development projects expected to be required during the planning period from the Long-Term Development Plan is shown in Table 7.27.
Return to Index162 ASSET MANAGEMENT PLAN ELECTRICITY NETWORKS FY2010 – FY2019
Medium-Term development Plan (distribution)7.9.
Introduction7.9.1.
Powerco’s medium term development plan (MTDP) deals with the distribution system from the zone substation to (and including) the 11kV/400V transformers.
The analysis and preparation of the MTDP includes:
Assessment of the Asset Management drivers and performance targets;•
Performance assessment of the present system;•
Review of network improvement recommendations ;•
Maintenance of appropriate levels of security of supply;•
Optimal development of the distribution system to meet consumer service •objectives; and
Focus group discussions with consumer representatives provide helpful input to the •assessment of priorities.
Medium-Term Development Planning Process7.9.2.
Powerco uses a two-pronged approach to produce its Medium-Term Development Plan, combining both bottom-up and top-down analyses.
Top-Down Analysis – Modelling of the feeders is carried out to determine those with thermal loading, voltage drop and age-related problems. These models take network data from Powerco’s GIS database and loading data from the SCADA system and MDI meters. Various techniques are used to combine this data into information on each feeder’s capability, which can then be used to initiate projects to actively develop the network.
Bottom-Up Analysis – This part of the process relies on input from the field staff, project engineers and other staff reporting on problems or deficiencies they find on the network. This data is used to drive projects to reactively develop the network.
Combining the Approaches – Using the two-pronged approach means that the network is developed proactively and, when a project is not picked up by modelling, reactively.
The projects are collated and each is ranked according to its value by safety, asset investment efficiency, reliability, environment, quality, potential of adverse litigation, operation and maintenance and shareholder value.
Where appropriate the projects are then scoped, approved and undertaken. Alternatively, projects can be postponed if they are not immediately required or cancelled if, on investigation, there is no need to proceed.
The focus group consultation process assists in linking the top-down and bottom-up processes and identifying the priority projects.
Distribution Network Upgrade Projects7.9.3.
The salient distribution network projects are shown in Table 7.27.
Reticulation Planning7.10.
Powerco has recently completed a review of its underground line design standard. This has focussed on ensuring that underground MV, LV and street lighting networks are designed in an economic fashion and to ensure that contractors design and construct underground networks to a good standard. Powerco has completed a review of its line design standards, which is awaiting final approval and implementation. These reviews will affect the design of new work being installed on the network.
Consultation with consumer groups has assisted in targeting feeder upgrades where consumers have found that supply reliability has been poor.
Implementing development Projects7.11.
Resource Consent Requirements7.11.1.
Construction of lines and zone substations can be subject to specific Resource Consent requirements. These vary across the many district council territories within Powerco’s network area. Council planners administering the District Plans are often unable to offer advice on Resource Consent requirements or the process to follow. The path towards getting resource consent is usually not clear and this can lead to delays in construction, particularly given the limited means available to many line companies to buy their way through the process. This means that development projects need to commence well in advance of the project being needed so that Resource Consent issues are settled before construction starts.
Easement Issues7.11.2.
New lines require easements to be registered on the land title. In theory, a simple landowner agreement may be all that is needed to construct a line, but the lowest risk, long-term access arrangement is an easement. Obtaining an easement is not usually a problem with lines or cables laid in subdivisions, but when a line is proposed for construction across existing titled land, an easement becomes a matter of willing buyer, unwilling seller. The stakes can become high if there is limited discretion over the route that the line can follow. Compulsory acquisition is an option in theory but the process is by no means clear.
What is needed is significant time allowed for obtaining easements before construction work starts. This means up to a 15 year view is needed on proposed lines before construction to give adequate time for easement consultation.

Return to Index 163ASSET MANAGEMENT PLAN ELECTRICITY NETWORKS FY2010 – FY2019
Major Project descriptions7.12.
The following are descriptions of the major projects currently underway and Development project summaries from FY10 to FY15 are provided in Table 7.27. The projects are presented in categories of Renewal and Development (they have not yet been separated into the Information Disclosure categories).
New Bethlehem Zone Substation 7.12.1.
Total Cost: $5 .5m Project Status: Feasibility Forecast accuracy:+/- 20%
The overarching driver for a new zone substation at Bethlehem in Tauranga is to restore capacity of supply to the Bethlehem, Otumoetai and Te Puna areas and allow for expansion to cater for load growth connected but not yet materialised, as well as ongoing growth forecast by local Council planning.
The Bethlehem area has been the focus of a great deal of residential growth since the mid 90’s, driven by previous plan changes and the attraction of good schooling and easy access to the city via the upgraded motorway. The Western Bay of Plenty District Council has released new urban structure plans for the district. Included in those plans is a future rezoning of rural land around Bethlehem to promote residential growth and to satisfy the shortage of commercial land. Those changes came into affect in 2005/6.
The suburb of Bethlehem is supplied from Otumoetai zone substation which has seen steady load growth over the last decade. The substation is considered to be well sized for the nature and density of the customers served. It comprises one 10/12.5MVA transformer and a 12.5/15MVA transformer, has a 98th percentile peak of 12.5 MVA, a ½ hour MD of 15MVA, and an estimated growth of 2%. In the past, load has been transferred off Otumoetai onto Waihi Rd and Matua substations, but the ability to share load is limited, with spare capacity on these substations intended for the future intensification developments in Tauranga City centre.
The effect of the rezoning and general infill will see a further 4 to 6MVA of residential load and 3MVA of commercial growth occurring within the next 10 to 15 years in the Tauranga West area alone, based on Smart Growth predictions. Much of the residential development in the recently rezoned area has already occurred, but occupancy rates on developed land are still low. Many of the recently reticulated subdivisions are at 30% capacity or less. Powerco has reticulated these subdivisions and is therefore obligated to provide adequate supply to future dwellings in that area. This requires network reinforcement of some description, making it impractical to ‘do nothing’. A viable alternative is to upgrade Otumoetai substation and the feeders from there into the Bethlehem area. However the NPV of the costs of that option are higher than the new zone substation option.
The demand is nearing the available capacity on the feeders in the Bethlehem area. Distribution feeder capacity is dictated by the contingent load - the load carried when
an item of the distribution network is out of service. The load will exceed the available capacity in 2012. With the new zone substation and the new feeders it provides, the loads carried by the feeders will be restored to within their available capacities.
The project involves purchasing land and constructing a zone substation in the Bethlehem area. The substation will be supplied from the nearby 33kV overhead lines. The initial proposal is for the substation to be a single bank, supplied from the existing sub-transmission circuit which runs alongside the proposed substation site, but the designs will allow for a second bank and a second transformer to be added as load dictates.
The new substation will be supplied from the 33kV ring that supplies Otumoetai, the line from which passes through the middle of the Bethlehem area.
Stage 1: Location of a suitable substation site, negotiation and land acquisition, conceptual designs and resource consenting: $1,000,000 FY10/11
This stage of the project involves the engagement of property consultants to locate and negotiate a land purchase, the actual purchase of the property, preparation of conceptual designs, impact reports etc as necessary to apply for resource consent; and the application consents.
Stage 2: Substation construction and commissioning: FY12/13/14
The construction of a substation at the new site, including a new building to house switchgear and transformers, landscaping, a single 16/24MVA 33/11kV transformer, an 11kV switchboard consisting of three feeder breakers, a bus section and incomer, with provision for a further incomer and a further three feeder breakers, with room for a further four feeders, 33kV circuit breaker board consisting of two line breakers, one transformer breaker and a bus section, alterations to the existing 11kV circuits in the area and extension of the 33kV to the substation site.
Stage 3: Expand the substation to dual transformer bank substation: FY17/18
Extension of the 11kV switchboard - consisting of three new feeder breakers, an incomer breaker, incomer cables, additional 16/24MVA transformer and additional 33kV transformer circuit breaker.
Hatricks and Taupo Quay Zone Substation Upgrade7.12.2.
Total Cost: $1 .7m Project Status: Feasibility Forecast accuracy:+/- 20%
Hatricks Wharf substation is one of three principal single transformer zone substations supplying the Wanganui central business district. It has one of the highest utilisations in Powerco’s network and this puts the supply to the CBD at significant risk. Hatricks substation and Taupo Quay are interconnected by a 10MVA 11kV cable which allows mutual support, however, the extent of that support is limited by the presently installed transformer capacity at each substation. Space constraint at each site does not allow installation of additional transformers.

Return to Index164 ASSET MANAGEMENT PLAN ELECTRICITY NETWORKS FY2010 – FY2019
The transformer presently installed at Hatricks Wharf substation is Powerco’s ‘spare’. The previous transformer’s tapchanger burnt out, and following repair this transformer was installed at Pukepapa. Pukepapa’s transformer has been removed and is being refurbished for installation as the second transformer at Peat Street. Peat Street substation presently has a single transformer, however there is space for a second transformer and it is already planned for the ex Pukepapa transformer to be installed there.
The main issue attended to by this project is that the capacity presently available at Hatricks Wharf substation is insufficient to provide the backup needed for a failure of supply to Wanganui’s CBD. This has resulted in the transformer going well into overload on occasion. Hatricks Wharf substation is about 15m from Whanganui River and space for oil containment is limited. Depending on the transformer physical size and oil volume for containment, additional space may be required. If so, the additional space would need to be leased from the Wanganui District Council.
The scope of the project is to purchase and install a new 16/24MVA transformer, upgrade of the 11kV bus and incomers, voltage control system, oil containment and earthing systems. The project involves extending the site outside the present lease boundary which is taking significant time to negotiate. This project is being done as quickly as practically possible.
Following the Hatricks Wharf upgrade it is proposed to carry out a similar upgrade at Taupo Quay. The justification is similar but not as urgent because the existing transformer capacity is larger than that at Hatricks Wharf.
New Pyes Pa Zone Substation7.12.3.
Total Cost: $4 .9m Project Status: Pre Feasibility Forecast accuracy: +/- 20%
Two major developments are occurring in the Pyes Pa / Tauriko area of Tauranga. One of these is the Grasshopper subdivision, approximately 2000 residential lots and commercial / light industrial land. This project has Council consents and is timed for completion over the next five or so years. The other Is the IMF industrial park In Tauriko, where around 360 hectares of land is being developed over a 10 year period, predominantly industrial, although bulk retail will be the focus of the early stages.
A zone substation has been planned in the Grasshopper estate. This would initially be supplied at 11kV from the Tauranga GXP and then upgraded to 33kV when needed. Making use of excavations for storm and sewage pipes, two circuits of 33kV underground cable have already been laid from the proposed substation site to the corner of Maleme and Cameron Rds.
Options for alternative solutions include running more feeders from the GXP at 11kV, and continuing to supply from existing feeders. The problem is that available space on Cameron rd for laying cables is so limited that any circuits installed must be those that are the most important. The existing distribution feeders have large numbers of
customers on them already, and they are long in length so connecting many customers on these would create further supply reliability problems.
Stage 1: Complete cable circuits and secure site: FY10/11
Work still to be done is to extend the cable circuits back to the GXP and to secure the site ready for constructing a zone substation.
Stage 2: Construct a zone substation: FY12/13
Initially running at 11kV, the new zone substation will be constructed to supply the area. New feeder cables will be connected.
New Omanu Zone Substation7.12.4.
Total Cost: $7 .3m Project Status: Concept Design Forecast accuracy: +/- 15%
The Mount Maunganui area is one of the fastest growing regions in New Zealand, with the equivalent of three zone substations currently supplying the region; Mt Maunganui GXP, Triton and Papamoa. This area has a rapidly growing load consisting of a mix of commercial, industrial and residential customers. Triton substation supplies a significant industrial area, including the non containerised operations of the Port of Tauranga. It also supplies half the residential load of the Mt Maunganui peninsula. The existing Mt Maunganui GXP is currently being reconstructed. This reconstructed GXP will continue to supply the remaining residential and industrial customers in Mt Maunganui. The loadings on the three zone substations in the region are reaching or have reached their firm capacity.
Loads are expected to exceed the 23MVA limit of the 33kV subtransmission circuits feeding Triton in 2011. Recent thermal resistivity testing in this area has shown that the backfill around these cables is susceptible to thermal runaway and the summer rating for these cables is recommended to be 15MVA. Loads are already exceeding the 19MVA IEC derived rating of the Triton transformers, although allowing for load transfer and cyclic capacity, the firm capacity will be exceeded in 2012. Loads are expected to exceed the 19MVA IEC rating of the Papamoa transformers at 15°C in 2010 allowing for cyclic loading and feeder transfer the transformer firm capacity is exceeded in 2012. With the zone substations exceeding firm capacity concurrently, the ability for one substation to back up another is constrained.
Loads are expected to exceed the 23MVA limit of the 33kV subtransmission circuits feeding Papamoa around 2013. The N-1 limit on the Mt Maunganui GXP will be 75MVA once Transpower has installed the new transformers. This limit will be reached around 2015. These two issues should be solved in time by the installation of a new GXP, preferably in the Papamoa area. The Papamoa zone substation would then be fed from this new GXP. There is little scope to transfer loads from Triton to either the Mt Maunganui or Papamoa zone substations due to the already high loads at those substations. A new zone substation is therefore required in the Omanu area.

Return to Index 165ASSET MANAGEMENT PLAN ELECTRICITY NETWORKS FY2010 – FY2019
The proposed project is to build a new zone substation in the Omanu area and supply this via new 33kV double circuit cables from the Mt Maunganui GXP. This would allow load to be transferred off the Triton and Mt Maunganui zone substations and onto the new zone substation. See Appendix 4 for diagrams showing the existing 33kV network and that following construction of the new zone substation.
Two alternative options have been considered: do nothing, reinforce Triton and defer the new zone substation. This area of the network has been a high growth area for some time and parts of the network are already under stress with their existing loads. Neither the do nothing option nor the defer option are considered viable option. The option to reinforce Triton does not offer the diversity that a new substation does and the ability to take more feeders from the site is constrained.
The proposal is to construct a two transformer substation in a new substation building in transformer feeder configuration, with twin 33kV incoming circuits. The project is under design at present. Finding the right piece of land for the site has taken two to three years and the NOR process has taken over a year to work through.
Browne St and Tower Rd Zone Substation Upgrades7.12.5.
Browne St Total Cost: $1 .5m Project Status: Concept Design Forecast accuracy: +/- 15%
Tower Rd Total Cost: $1 .5m Project Status: Feasibility Forecast accuracy: +/- 20%
The overarching driver for this project is to restore security of supply to the Matamata area and allow for expansion to cater for load growth into the future without that growth further deteriorating reliability and the ability to carry out maintenance efficiently. Matamata is supplied by two single transformer zone substations, Browne St and Tower Rd. Each substation consists of a single transformer bank with Browne Street rated at 7.5/8.6MVA and Tower Road rated at 7.5/10MVA. Both substations supply a mixture of urban and rural loads with 3108 ICP’s connected to Tower Road and 2111 ICP’s off Browne Street.
Tower Rd has a single 33 kV supply from Hinuera GXP, while Browne St has two incoming 33 kV supplies, one from Hinuera GXP and an alternative supply from Waihou GXP. There is strong 11 kV interconnection between these two substations, which until recently provided the AA security level required by Powerco standard 310S001, “Security of Supply Classification – Zone Substations”, however, load growth has meant that the ability to support one substation from another is now limited to low load times. This has an impact on SAIDI under fault situations and restricts the times at which maintenance can occur.
Neither substation has sufficient spare capacity to take up the load of the other at peak times. The load duration curves show that the Matamata load was above the transformer firm capacity for 33% of the time. The load duration curve is flat at the
Browne St nameplate capacity and so load growth amplifies the exceedance duration impact – one year of annual load growth at 2% increases the time firm capacity is exceeded to 38%. In the winter just passed, the transformers at Tower Rd and Browne St have been operating close to their alarm overload levels.
The long term plan is to extend the 33kV subtransmission from Browne Street to Tower Road, and install a second transformer bank at Tower Road, ultimately with increased capacity on all the transformers.
The project involves refurbishing the 7.5MVA transformer recently removed from Mikkelsen Road substation and installing it at Browne Street substation. The work requires the replacement of the existing 33kV switchboard to enable an additional incomer breaker to be installed. An 11kV incomer breaker recovered from Whitianga substation upgrade will be installed also. The existing switchroom is too small to accommodate the longer 33kV switchboard. A new switchroom will be constructed to house the new switchboard. Sufficient room will be made available to install up to two additional 33kV circuit breakers, one of which will be needed to link with Tower Road in the future. Alterations will be made to the existing 33kV supplies and the connections to the new transformer. Where practical, overground cable routes will be utilised. New electronic protection relays will be installed with the 33kV switchgear, new communication links will be added including time synchronisation equipment. The second transformer will be installed on a new foundation incorporating an oil containment bund. The existing block wall adjacent to T1 will provide a fire wall between T1 and the new T2. A new transformer management relay will be installed to control both transformers.
New Sulphur Point Zone Substation7.12.6.
Total Cost: $5 .3m Project Status: Pre Feasibility Forecast accuracy: +/- 25%
Tauranga has grown rapidly over the last twenty years. The Port of Tauranga has been one of the major catalysts for this growth. The Port of Tauranga’s Sulphur Point operations continue to expand, and with it, supporting industries have been attracted to the Sulphur Point area. The Sulphur point area adjoins the Tauranga CBD area and contains not only the Port of Tauranga’s container operation but recreational areas such as a marina and a number of boat ramps. Other major industry loads in the area include fish processing factories; boat building; waste water treatment facilities and more recently residential apartments. Several major developments are scheduled for the area once the economy begins to recover, these include substantial residential developments, a Marine Park initiated by Tauranga City Council, with a predicted load of 5MVA.
In 2005 the Port of Tauranga approached Powerco outlining their proposed growth strategy. Their forecast load was predicted to be 6.0MVA by 2010 with growth continuing at similar rates into the future. The existing supply to the Port of Tauranga was via an 11kV cable from Hamilton Street substation, which also supplied other

Return to Index166 ASSET MANAGEMENT PLAN ELECTRICITY NETWORKS FY2010 – FY2019
industry in the area. This supply was incapable of meeting the demands of the Port so an express cable was installed solely for the Port. At the time, it was considered that future growth much beyond 2012 could not be supplied at 11kV so the cable installed was a 33kV subtransmission cable which was configured to operate at 11kV for the interim. This was commissioned in 2006.
The New Zealand Transport Agency (NZTA) is in the process of constructing a second harbour bridge and associated motorway flyovers and off ramps collectively known as the ‘Harbour Link’ project. This is expected to be completed in 2010. A section of land has been purchased for constructing a substation from NZTA.
The project is in three stages. The first is to purchase the land and work through any consents necessary to construct a substation. The second is to construct a single transformer zone substation with indoor 33kV switchgear and six 11kV feeders in FY14. The third stage later in the planning horizon is to add a second transformer.
The new zone substation would provide the means to back up supply into the Matua area.
Tauranga CBD Reinforcement7.12.7.
Total Cost: $6 .1m Project Status: Commencing Forecast accuracy: +/- 20%
The existing 33kV subtransmission system supplying the Tauranga CBD consists of a ring connecting Waihi Rd substation and Hamilton St substation with supply originating from Tauranga Substation Grid Exit Point and Greerton Switching Station. Greerton Switching Station is linked with Tauranga Grid Exit Point via two 33kV cable circuits (Committee Circuits). Each of the routes are predominantly underground cable, with some short sections of overhead line. The Waihi Rd route follows the Kopurererua Valley and the motorway known as Route K.
Hamilton Street substation and Waihi Rd substation supply electricity to Tauranga’s Central Business District and major industry such as the container port at Sulphur Point. These load groups are of sufficient importance to require full N-1 security at subtransmission level. Both Hamilton Street substation and Waihi Road substations have undergone significant redevelopment over the last five years to meet the dramatic increase in electricity demand in the Tauranga area. This growth continues, albeit at lower levels and has increased to the point where the capacity of the subtransmission circuits is insufficient to meet the peak loads of the two substations should any portion of the ring circuit fail. As time passes, load growth means that the proportion time without full N-1 security increases.
Greerton switching station is a switchyard located approximately 1km from Tauranga substation GXP. The switchyard connects Kaimai Hydropower generation to Powerco’s network and is the connection point for sub-transmission rings supplying the Omokoroa, Aongatete, Katikati, Kauri Point, Otumoetai and Matua zone substations. The switchyard is connected to the Tauranga Grid Exit Point by way of two 33kV circuits known as
the Committee circuits. One of these circuits is fully underground; the other circuit is a mixture of underground cable and overhead line. The variation in makeup between these two circuits results in unequal load share between the two circuits.
When one of the Committee circuits is out of service, the other circuit cannot carry the full load expected unless the Kaimai Hydro scheme is running a full capacity. As the storage capacity of the scheme is limited, the time that it can run at full capacity is usually limited to a small number of hours, and during dry times it may not be able to run at a greater level than half capacity. This means that the network is not capable of adequately supplying the western part of Tauranga under contingent situations as it should be.
During winter months, the firm capacity on these circuits is exceeded over 20% of the time. A fault occurring on the one of these circuits at high load time will result in a cascade failure type outage to the Tauranga CBD, Port and area west of Tauranga.
At present, protection schemes for the Hamilton Street / Waihi Rd and Committee circuits use pilot wire to give Translay protection over the cable segments. The entire sub-transmission ring is protected by a single pilot cable which, when it is damaged anywhere along its length by third party excavators, it causes complete failure of supply to the CBD. This has happened at various times in recent years.
The reconfiguration of the cable circuits and the need to split the ring supplying Waihi Rd and Hamilton Street will require significant changes to the protection arrangements. A unit protection scheme with main and back up is needed that will clear faults quickly and discriminate accurately as is appropriate for a CBD like Tauranga’s. Options of high speed radio have been investigated but they are expensive and suffer from signal fade and do not provide the levels of availability required to ensure secure operation befitting supply to Tauranga’s CBD and Port facility.
The project consists of installing two new cable circuits between Tauranga GXP and Waihi Road substation to enable the existing cable ring supplying Waihi Rd and Hamilton Street substations to be split. To achieve this, the section of new cable on part of the route (Tauranga GXP to Greerton substation) will be installed as a replacement to the existing “Committee” cables. The redundant committee cables would then form part of the new Waihi Road subtransmission circuit.
The scope of work includes negotiating routes, easement compensation, consenting and concept design costs; detailed design, thermal resistivity testing; supply and installation of dual circuit XLPE cables between Tauranga GXP and Greerton switchyard for 40MVA capacity; supply and installation of dual circuit 630mm Al XLPE cables between Greerton switchyard and Waihi Road Substation 28MVA; supply and installation of fibre option protection and communication cabling with each of the new cable circuits; and new protection relays, settings and commissioning of the new schemes to provide unit protection over the cables.

Return to Index 167ASSET MANAGEMENT PLAN ELECTRICITY NETWORKS FY2010 – FY2019
The scope is to use a conductor capable of 26MVA summer noon rating at 50 deg C (preferably Neon 210mm² AAAC) but with design for a 70 deg C rating. The existing 11kV overhead under built line will also be upgraded. The remaining Te Puke B and C circuits between John Bird Rd and Te Puke Sub will be “coupled together” as an interim measure. A section of 33kV underground cable will be laid in Te Matai Rd opposite John Bird Rd. The conductor on Te Puke B and C circuit between Te Matai Road and Te Puke Sub and on Te Puke C circuit between Te Puke Sub and No.3 Rd will then be upgraded.
New Katere Zone Substation7.12.9.
Total Cost: $7 .9m Project Status: underway Forecast accuracy: +/- 10%
The Waiwhakaiho Valley area is situated just to the east of Fitzroy, on the eastern side of the Waiwhakaiho River. It is presently supplied by five 11kV feeders, one from NP City, two from Brooklands, and two from Bell Block Substations. All feeders are close to fully loaded, leaving little redundant capacity for any contingency and voltage performance is near the lower limit. These feeders also supply the adjacent industrial area in Katere Road and Hurlstone Drive.
Significant commercial growth has occurred in the area over the past three years, and more is expected. Powerco has in the past (October 2006) made headlines due to a low voltage issue in the Katere Road area. While this issue was later shown to be due in part to a single consumer’s inadequate LV supply (due to his load increase), the issue did highlight weaknesses in the HV supply to the area.
A new 15 lot Industrial subdivision has been zoned near Katere Rd. The first of these, Placemakers, has recently connected with a load of 500 kVA and a new supermarket connection is imminent. In April 2007, the NPDC released its “Options for Growth, A Discussion Paper” identifying the land east of Egmont Road and south of Devon Road which is adjacent to Katere Road, as recommended industrial development.
Land has been purchased on Egmont Road, near Katere Road for a new substation (refer to Board memorandum 306). Powerco has received consent from NPDC for a new substation at this site.
In summary the project scope includes provision and installation of two 33kV supply cable circuits each of 24MVA capacity; provision and installation of new 33/11kV 16/24MVA transformers and associated switchgear; construction of a substation building to accommodate the 11kV and 33kV switchgear; and 11kV distribution construction and reconfiguration (affecting eight feeders).
The following alternatives have been considered:
Alternative Likely outcomes
Do nothing. This area of the network has been a high growth area for some time. The load on the 33kV circuits that supply the CBD and west of Tauranga have reached their N-1 capacity and there is limited capability to transfer any further load off the 33kV network. It is not possible to adequately backup the CBD loads due to either high loads elsewhere. The do nothing option is not a viable option.
Non Asset Solution The available non asset solution opportunities have really already been exhausted. Load control is being used extensively to the point where we receive customer complaints, there are no particularly viable embedded generation opportunities and captive power (existing port generation) is being used when feasible.
Install a single 33kV circuit to Waihi Rd
Technically it is possible to install a single 33kV circuit between Tauranga GXP and Waihi Rd substation, along with a new circuit breaker at Waihi Rd. This would provide sufficient security to both Waihi Rd and Hamilton Street but the risks associated with the Committee circuits would not be completely mitigated. Eventually a second circuit would be required to separate Waihi Rd from Hamilton Street. This is expected to be required when the new substation at Sulphur Point in needed, in 2015. The scenario used in the attached economic analysis assumes the risk of loss of a committee circuit is effectively half that of the do nothing option, i.e. a one in thirty year event.
Defer the upgrade of the Committee circuits until the Otumoetai circuits are needed
Completing the Waihi Rd upgrade and deferring the Committee circuit upgrade would reduce project costs by $330,000 but would not provide the N-1 security level to the area west of Tauranga required. The Otumoetai circuit upgrades will be needed at a time between now and ten years’ time – their timing is not known presently.
Te Puke Subtransmission Upgrade7.12.8.
Total Cost: $1 .0m Project Status: underway Forecast accuracy: +/- 10%
Te Puke substation supplies 5,900 ICPs. It was rebuilt in 2005 with twin 16/24MVA transformers being installed. It currently has a firm capacity of 18.2MVA and peak of approx 22MVA. At present, two circuits supply Te Puke substation from Transpower Te Matai GXP, with a third available but not currently closed under the normal system configuration.
Te Puke A circuit has been upgraded to a rating of approx 24MVA. Te Puke B and C circuits comprise Wasp conductor and are still rated at 17.5MVA, and hence if the Te Puke A circuit trips, the supply to Te Puke Sub will “overload” the rating of the Te Puke B circuit, leading to a risk that the 33kV may sag excessively causing safety issues. The circuits also supply the new Atuaroa Substation. Future options exist to install a new 33kV cable from Transpower Te Matai, along Te Matai Rd, to past John Bird Rd to supply one 33kV circuit for Te Puke Substation. A new 33kV circuit breaker would then be installed at Te Matai GXP and the existing 33kV circuit could then supply Atuaroa Substation.

Return to Index168 ASSET MANAGEMENT PLAN ELECTRICITY NETWORKS FY2010 – FY2019
Options considered include:
Upgrade existing feeders, construct zone substation with one incoming 33kV circuit •over three years but this is susceptible to long supply outage from single contingent event;
Upgrade existing feeders, construct zone substation with two incoming 33kV circuits •over three years (this is the selected option);
Upgrade existing feeders, lay two new 11kV feeders and construct zone substation •with two 33kV circuits in five years’ time but this involves significant expense in laying new feeders that would only be used for a short time;
Upgrade existing feeders, defer the new substation and live with poor supply •reliability but this may invoke adverse customer reaction; and
Upgrade the existing feeders, fast track the construction of the new zone substation •with two 33kV circuits but this is not the best use of time value of money
New Paengaroa Zone Substation7.12.10.
Total Cost: $2 .5m Project Status: Feasibility Forecast accuracy: +/- 20%
A new zone substation is proposed for construction at Paengaroa to supply new load coming from new cool stores and horticultural activities. It will also provide a means of backing up the supply at Pongakawa. Initially the zone substation will be supplied from the existing 33kV Pongakawa line but a second stage will be to construct a new feeder from Te Matai GXP.
New Te Maunga Zone Substation7.12.11.
Total Cost: $4 .0m Project Status: Pre Feasibility Forecast accuracy: +/- 25%
A new zone substation is proposed for construction in the west Papamoa area. This will provide a means of supplying the area between Matapihi / Bayfair and Papamoa. As stated above for the Omanu zone substation, the existing zone substations in the Mt Maunganui and Papamoa areas are at or near firm capacity and there is little room for unscheduled events like loss of a subtransmission circuit or transformer occurring without risking loss of supply.
The proposed Te Maunga zone substation will be supplied from the Mt Maunganui GXP using the present Papamoa subtransmission circuits. Papamoa will be transferred to the proposed new GXP at Papamoa East.
Peat St Zone Substation Upgrade7.12.12.
Total Cost: $2 .0m Project Status: underway Forecast accuracy: +/- 10%
Peat St zone substation currently has a security rating of AA. This is an important zone substation supplying part of Wanganui’s CBD and AAA security is necessary. This project completes the installation of the second transformer, thereby achieving AAA security.
Previous projects have prepared the way for this. The 11kV and 33kV switchboards have switches designated for the second transformer. The ex Pukepapa transformer is a sister unit to the transformer presently at Peat St. It has been maintained, fitted with an oil pump, and the radiators fixed. It is presently being used temporarily at Cambria substation, standing in for a failed unit there. The 33kV and the 11kV cable connections remain to be completed. Some protection equipment and voltage control is required. Hatricks substation is scheduled to be upgraded. During the upgrade of Hatricks it will be particularly important that Peat St substation has both transformers installed, as it will be required to pick up a large part of Hatricks’ load.
network development Project Summary7.13.
Development project summaries from FY09 to FY14 are provided in Table 7.27. The projects are presented in categories of Renewal and Development (they have not yet been separated into the Information Disclosure categories).
The projects under the FY10 category come from the FY10 works plan. The FY11 to 15 project summaries come from the Improvement Register.
The FY11 to FY15 projects are assessed using a multi-stakeholder assessment process (known as Coin), whereby the projects are reviewed against a set of four strategic objectives representing stakeholder needs under which constraints are applied. The objectives are set out in Section 2.6.
The total expenditure amounts in Table 7.27 can be seen to confirm the forecast expenditures in Section 9.

Return to Index 169ASSET MANAGEMENT PLAN ELECTRICITY NETWORKS FY2010 – FY2019
Table 7.27: Summary of Development Projects
AMP Network Development Programme Summary
Potential Projects Project Driver
AMP Reference Section Options
System Growth Project FY2011 FY2012 FY2013 FY2014 FY2015
DOHMisc voltage quality investigations $75,000 $258,000 $40,000 Asset Performance; Service 5.2.3Misc line reconfigurations $100,000 Asset Performance; Service 7.9Misc construction of additional lines $450,000 $75,000 $180,000 $240,000 $95,000 Asset Performance; Service 7.9Misc conductor upgrades $2,726,000 $2,453,700 $1,286,000 $1,743,000 $1,245,000 Asset Performance; Service 7.9Bulls new feeder $900,000 Asset Performance; Service 7.8.11Distribution Overhead growth $1,200,000 Asset Performance; Service 7.9Cook’s Beach second Marine Link $550,000 Asset Performance; Service 7.8.9SOHMisc 33kV second line installation $75,000 $400,000 $780,000 $455,000 Load Growth; Service 7.8Misc 33kV Subtransmission upgrades $600,000 $390,000 $150,000 Asset Performance; Service 7.8Norfolk to Chapel upgrade 33kV line $550,000 Asset Performance; Service 7.8.10Huirangi to Bell Block second 33 kV line $600,000 Load Growth; Service 7.8.7Wanganui GXP to Taupo second 33kV line $750,000 Load Growth; Service 7.8.11Roberts Ave to Peat St 33kV feeder $750,000 Risk Management; Service 7.8.11 Do nothing and let Wanganui CBD remain supplied from a
single line Parewanui 33kV feeder $850,000 Load Growth; Service 7.8.11Bunnythorpe GXP to Feilding third 33kV line $1,600,000 Load Growth; Service 7.8.6Omokoroa Urban Substation Subtransmission $2,210,000 Load Growth; Service 7.8.8Te Matai/Rangiuru/Papamoa 33kV Subtransmission
$1,000,000 $1,000,000 Load Growth; Service 7.8.8
Papamoa East to Rangiuru Bus Park 33kV line $1,000,000 Load Growth 7.8.8 Increase capacity at Te Puke and add feeders, upgrade existing reliabilty and operational constraints
Omokoroa additional 33kV circuit $1,000,000 Load Growth 7.8.8 Construct new GXP at Aongatete Tokoroa South Subtransmission $1,000,000 Load Growth; Service 7.8.9Kopu to Tairua 66kV line upgrade $2,000,000 $1,000,000 $1,000,000 $1,000,000 Asset Performance; Service 7.8.9 Look for generation options in Whitianga (although none
have surfaced) Kopu to Kauaeranga 110kV line $1,000,000 $1,000,000 Asset Performance; Service 7.8.9 Look for generation options in Whitianga (although none
have surfaced) Blue Mountain establish 66kV line $960,000 $960,000 $960,000 Load Growth 7.8.9DUGMisc cable works $490,000 $100,000 $50,000 Load Growth; Service 7.8Misc new 11kV cable installation $1,429,980 $2,109,000 $550,000 $350,000 Load Growth; Service 7.8Misc 11kV cable upgrades $1,179,000 $376,000 $810,000 $500,000 $290,000 Load Growth; Service 7.8Massey/Summerhill feeders off Turitea $1,400,000 Load Growth 7.8.6 Do nothing - accept worsening reliability and operational
constaints SUGMisc cable/ripple plant installation $400,000 $180,000 $180,000 Load Growth; Service 7.8Misc 33kV cable upgrades $280,000 $100,000 Asset Performance; Service 7.8Bethlehem 33kV Subtransmission $500,000 Load Growth; Service 7.12.1 Interconnect Matua with Sulphur Pt, or do nothing and let
the existing 33kV ring overload Piako GXP 33kV reconfiguration $500,000 Load Growth 7.8.2 Upgrade Waihou GXP and enhance subtransmission to
Piako Fitzherbert 33kV upgrade $900,000 Asset Performance; Service 7.8.6Bulls to Sanson second 33kV line $1,000,000 Load Growth; Service 7.8.6NEI Substation Subtransmission and 11kV $1,000,000 Load Growth 7.8.6EP West to Keith St 33kV cable upgrade $1,000,000 Asset Performance; Service 7.8.6

Return to Index170 ASSET MANAGEMENT PLAN ELECTRICITY NETWORKS FY2010 – FY2019
Potential Projects Project Driver
AMP Reference Section Options
System Growth Project FY2011 FY2012 FY2013 FY2014 FY2015
Keith St to Main St 33KV cable replacement $1,000,000 $1,000,000 Asset Integrity; Security 7.8.11 Tolerate more maintenance and fault repair Taupo Quay 33kV OHL river crossing $1,200,000 Security? 7.8.6Pascal St Sub to Z64 upgrade $1,850,000 Asset Performance; Service 7.8.8Otumoetai 33kV cabling $3,240,000 Load Growth 7.12.7Waihi Rd to Tauranga 33kV circuits $2,000,000 $2,000,000 Load Growth; Risk
Management 7.12.7 Do nothing and accept N scurity level to CBD for growing
lengths of time. Increase the capacity of the existing subtransmission circuits
Atuaroa 33kV circuit $1,100,000 Load Growth 7.8.8 Do nothing - accept worsening reliability and operational contraints
Pyes Pa 33kV circuits $900,000 Load Growth 7.12.3 Accept worsening reliability in Kaimai area, and constrain the new connections to the Pyes Pa subdivision
DGSMisc switchgear installation $45,000 $260,000 Service 7.9DOTMisc transformer upgrades $310,000 $600,000 $600,000 $250,000 $250,000 Load Growth 7.8Motukawa transformers 6.6kV to 11kV upgrade $1,000,000 $1,000,000 Load Growth 7.8.7 Defer the changeover to 11kV DUTMisc installation of MDIs $50,000 $50,000 $60,000 Asset Performance; Service 7.9Misc new transformer installations $410,000 $80,000 Load Growth 7.9Misc upgrades overloaded transformers $310,000 $250,000 $250,000 $250,000 $250,000 Load Growth 7.9Misc OH to Ground mount conversions $31,680 Load Growth; Safety 7.9ZTRMisc works inc. incomer upgrades, install link $250,000 $350,000 Asset Performance; Service Misc transformer upgrades $200,000 Asset Performance; Service Misc transformer rotations $350,000 $650,000 $595,000 $50,000 Load Growth McKee upsize zone transformers $500,000 Load Growth Kaponga upsize zone transformers $1,500,000 Load Growth Akura upsize zone transformers, new units $1,500,000 Load Growth; Service Do nothing and accept reliability and operational constaints Taupo Quay upsize zone transformer $1,500,000 Load Growth; Service 7.12.2 Construct new substation with N-1 security between
Hatricks and Taupo Quay Hatricks zone transformer $1,500,000 Load Growth; Service 7.12.2 Live with potential for outage in Wanganui CBD Katere Rd Substation $1,740,000 Load Growth; Service 7.12.9 Defer while supplying via new of upgraded feeders, location
of load control plant Oakura upgrade to mini 33kV zone substation $2,000,000 Load Growth; Service 7.8.7 Upgrade Moturoa zone substation and increase feeder
capacity in Oakura area Eltham upsize zone transformers $2,365,000 Load Growth; Service 7.8.7Cambria upsize zone transformers $2,500,000 Load Growth; Service 7.8.7 Do nothing and accept reliability and operational constraints NEI establish substation $4,000,000 Load Growth; Service 7.8.6 Defer while supplying from new 11kV feeders, transformer
upgrades at Kelvin Grove and Milson, or zone substation at Bunnythorpe with new feeders
Fitzherbert establish substation $6,000,000 Load Growth; Service 7.8.6 Increase capacity at Main Street substation and/or Pascal substation, or purchase land vs lease land - various substation capacity and growth options. Timing depends on load growth and CBD security requirements
Omanu Substation $4,526,000 Load Growth; Service 7.12.4 Do nothing and accept increasing risk of widespread outages, increase capacity of Triton and Mt Maunganui substations and increase 11kV interconnection
Sulphur Point Substation $4,500,000 Load Growth; Service 7.12.6 Additional feeders from Hamilton St or restrict supply to businesses in the Sulphur Point area
Te Maunga Substation $4,000,000 Load Growth; Service 7.12.11 Increase transmission capacity into Mt Maunganui. Add feeders at Papamoa and Mt Maunganui. Upgrade subtransmission capacity into Papamoa

Return to Index 171ASSET MANAGEMENT PLAN ELECTRICITY NETWORKS FY2010 – FY2019
Potential Projects Project Driver
AMP Reference Section Options
System Growth Project FY2011 FY2012 FY2013 FY2014 FY2015
Rangiruru Business Park establish substation $3,000,000 Load Growth; Service 7.8.8 Increase capacity at Te Puke and add feeders, upgrade subtranmission to Te Puke
Matua alternative 33kV circuit $2,500,000 Service 7.8.8 Inrease 11kV interconnections from Otumoetai and Sulphur Pt, or do nothing and accpet reducing reliability at Matua
Papamoa East Zone Substation $2,500,000 $2,500,000 Load Growth; Service 7.8.8 Limit the connection of new customers in the Papamoa East area
Morrinsville upgrade zone transformers $2,000,000 Load Growth 7.8.9Bethlehem Substation $2,500,000 $2,000,000 Load Growth; Service 7.12.1Baird Rd Substation upgrade $2,000,000 Load Growth; Service 7.8.9Pyes Pa Substation $2,000,000 $2,000,000 Load Growth; Service 7.12.3 Accept worsening reliability in Kaimai area, and contrain the
new connections to the Pyes Pa subdivision Tirau second zone transformer $2,000,000 Asset Performance; Service 7.8.9 Do nothing and accept reliability and operational constaints,
or upgrade feeder capacity from Lake Rd and upgrade Lake Rd.
Maraetai Rd Substation upgrade $2,000,000 Load Growth; Service 7.8.9Tokoroa South Substation $1,560,000 Load Growth; Service 7.8.9Tower Rd second zone transformer $1,500,000 Load Growth; Service 7.12.5Te Puke 11kV Switchboard replacement $1,000,000 Asset Integrity; Reliability 7.8.8 Do nothing - accept H&S risk, more maintenance Katikati second zone transformer $1,000,000 Asset Performance; Service 7.8.8 Accept reduced supply reliability Matua upgrade zone transformers $1,000,000 Load Growth; Service 7.8.8 Improve 11kV backup capacity with Sulphur Pt. DRGMisc voltage regulator installation $1,085,000 $490,000 $1,010,000 $735,000 Load Growth; Service Tairua 66kV Voltage Regulator installation $2,000,000 Load Growth; Service Do nothing and accept risk of voltage collapse, or install
capacitors or install 66kV voltage regulator Taihape, Mataroa, Waiouru District upgrade $521,000 Load Growth; Service ZBGMisc land purchase and design $250,000 $480,000 $935,000 $935,000 Load Growth; Service 7.8Sulphur Point Substation $500,000 Load Growth; Service 7.12.6 Additional feeders from Hamilton St or restrict supply to
businesses in the Sulphur Point area Matarangi Substation $2,500,000 Load Growth; Service 7.8.9 Install additional 11kV or 22kV feeders from Whitianga ZIETe Puke Injection Plant upgrade $700,000 Load Growth; Service Do nothing and accept customer hot water complaints ZOTMisc substation land procurement $350,000 Load Growth; Service Misc 11kV incomer cable replacement $160,000 Asset Performance; Service Delmaney Corner Substation $500,000 Load Growth; Service ZSGMisc 33kV switchgear installation $250,000 Load Growth; Service 7.8Sanson 11kV Switchgear replacement $585,000 Asset Integrity; Reliability 7.8.6 Do nothing - accept H&S risk, more maintenance Beach Rd 11kV Switchgear & Building extension $1,000,000 Asset Integrity; Reliability 7.8.11 Do nothing - accept H&S risk, more maintenance Totals $32,362,660 $40,961,700 $25,751,000 $39,668,000 $24,806,000 unspecified development projects $0 $0 $0 $0 $0Reactive Development $1,856,827 $1,862,398 $1,867,985 $1,748,683 $1,628,648 Deferrals from previous year $- $11,009,148 $30,553,276 $34,822,451 $54,380,598 Deferrals to next year -$11,009,148 -$30,553,276 -$34,822,451 -$54,380,598 -$60,457,143 Total (real) $23,210,339 $23,279,970 $23,349,810 $21,858,535 $20,358,103 Total (nominal) $23,796,344 $24,410,713 $25,022,592 $23,939,821 $22,787,047

Return to Index172 ASSET MANAGEMENT PLAN ELECTRICITY NETWORKS FY2010 – FY2019
nETwoRk dEVELoPMEnT PLAn – PERfoRMAnCE 8. EnhAnCEMEnT
Introduction8.1.
This section of the plan describes network development to enhance the reliability, safety and environmental profile of the distribution network.
Reliability improvement is covered in Section 6.6 from the perspective of overhead line renewal, which has a tendency to worsen if left alone and, given the age profile, may require an increase in reliability target. This section covers the feeder reliability performance, historical trends and plans for automation which, while taken from the perspective of improvement, will actually be used to partly offset an ongoing worsening of reliability as the network ages.
This section of the plan also looks at Protection and Control developments, encompassing protection, SCADA, communications, load-control and metering aspects.
Environmental planning is also covered in this section. Sites have been audited for environmental performance and programmes of work have been proposed to lower the environmental risk profile posed at each site.
Safety performance enhancement involves regular reviews of safety incident investigations from which a variety of improvement actions are implemented. These range from asset-based improvements, improvements to systems and processes, training and competency improvements through to amendments of standards and protocols.
Finally, Powerco’s plans for Smart Network implementation are outlined.
Powerco has a range of enhancement plans for different performance focusses. These are:
Network Automation Plan;•
Health and Safety Incident register; and•
Environmental Improvement Plans and Standards. •
These plans are discussed in this section of the plan, including tables of projects giving year, estimated cost and brief comment for each proposed project. Detailed discussion of these projects, generally including linkages to service level targets, can be found in the above plans. Because of the large number of projects, detailed discussion is considered to be beyond the scope of this document.
Reliability Planning Considerations8.2.
Business Planning Drivers8.2.1.
Powerco’s network reliability strategy is set by the Business Plans. Reliability is mentioned three times in the FY10 to 14 Business Plan. The first is in the Review of Electricity Business Performance where it states:
Business Plan Section Statement
Review of Electricity Business Performance
Reliability levels have been static. Price has been decreasing in real terms, hence customers current price/quality trade-off has been improving. There remains an opportunity to exploit any reliability initiatives introduced into the regulatory regime.
Strategy Map Improve electricity network reliability through automation; Minimise network outages and manage load through network operating processes.
Customer Perspective Appropriate price vs quality trade-offs (reliability, timely response to faults and reasonable prices); Acceptable reliability.
Process Perspective – Manage Asset Strategy
Develop/maintain strategies for meeting service performance investment needs through the use of automation and other non-asset solution; Root cause analysis of outages to identify avoidable outages.
In summary, the focus is on:
Increasing the level of network automation;•
Renewing network to reduce the likelihood of faults happening in the first place; and •
Analysing and dealing with the root causes of faults.•
The following is the summary of drivers from the FY09 Business Plan.
Business Plan Section Statement
Improve Reliability Introduce leading measures to identify localised reliability problems before they happen.
Improve Reliability Increase the numbers of feeders and sectionalisation in the Eastern Region to decrease the number of customers per feeder and improve SAIDI.
Improve Reliability Prepare the plan for greater sectionalisation and installation of distribution automated switches and distance to fault relay at Kopu.
Improve Efficiency of Operation
Continue with blitz-type programmes.

Return to Index 173ASSET MANAGEMENT PLAN ELECTRICITY NETWORKS FY2010 – FY2019
In summary, focus is to be on:
Reducing the numbers of customers per feeder; •
Increasing the levels of sectionalisation and distribution automation; and •
Improve our ability to foresee adverse customer reactions to reliability blow-outs. •
Powerco has participated in the LEAPP reliability survey. The conclusions of the LEAPP report and a report prepared by SKM on reliability improvement are outlined in the Reliability Plan. The LEAPP report recommends a focus on network defects, automation, clarification of accountabilities and make reliability matter, and review of fault notification systems. The last two items still need to be actioned.
Reliability Performance Comparisons8.2.2.
As set out in Section 5, Powerco’s SAIDI and SAIFI do not compare favourably with the performances of other network companies of similar customer density. The variations in SAIDI year on year can be attributed to storm activity: some of Powerco’s network areas are highly susceptible to storms. The SAIFI is higher than other comparable networks. Maintaining SAIDI at previous levels has been has been part of the strategy, however network age is expected to increase, leading to a worsening of reliability.
To improve the inherent security of the network, there has been a focus on, for example:
Improving the supply security of CBD and urban areas by reducing the number of •customers per feeder by constructing more zone substations. Note that expenditure on this type of work will fall into either the expenditure category of (1) system growth or (2) reliability, safety and environment.
Applying network automation to improve the supply restoration response times to •fault events. This includes installing loop automation schemes, fault locators and fault indicators, ground fault neutralisers and reclosers.
To improve the underlying condition of assets there has been a focus on, for example, blitzing (i.e. targeting asset replacement and renewal investment on) the worst performing feeders. This targets renewal activity to where reliability is worst and seeks the best value for dollar spent. Note that expenditure on this type of work will fall into the asset replacement and renewal expenditure category.
Reliability Road Map8.2.3.
Managing electricity network reliability requires a holistic approach to customer service quality that involves every part of the electricity business and involves the entire life cycle of the network assets. That is, there is an angle that affects reliability from the conceptual planning phase, the design and construction phase, and the operation and maintenance phases.
Non Feeder Backbone Initiatives
(Worst Performing Circuits, Worst Performing devices,
UG Cable Replacement & System Inspections & Repairs, & Distribution
Automation)
Protect the
Backbone (Hardening and Sectionalising
3 PRongEd
APPRoACh
Long-Term approaches
(System Capacity, Overload, Refurbishment & Replacement of Aging
Infrastructure)
Figure 8.1: Reliability Management Triangle
A mix of different time-framed initiatives is needed for a holistic approach. Some reliability improvement initiatives can provide a quick short-term benefit at the expense of longer-term reliability. (Like eating sugar, it gives a quick burst of energy, but after a short time you feel hungry again). An example of short-term focus is curtailment of planned shutdowns. Conversely, some initiatives have a long-term horizon (such as new feeders and zone substations) where programmes are like working on a long jigsaw puzzle and where some of the expenditures (like consents) may not provide any reliability benefit for several years.

Return to Index174 ASSET MANAGEMENT PLAN ELECTRICITY NETWORKS FY2010 – FY2019
This is a point communicated in a recent E21C presentation called “Grid Modernisation” (Tony Saker, UMS, E21C Conference 2009) by means of the triangle shown in Figure 8.1. This is a service interruption reduction programme that achieves short-term performance targets and supports a long-term sustainable network. (Note: In Figure 8.1, distribution automation was not part of the E21C paper and has been added by us.)
Figure 8.2 is a map that outlines ways of maintaining and improving network reliability. It guides our reliability works and maintenance planning process. It recognises that there are six phases affecting supply outages to customers:
A network fault occurs, or an item of network equipment becomes unavailable;•
Equipment unavailable for service causes an interruption to the supply to customers;•
The interruption of supply is widespread or localised;•
The cause and location of the fault needs to be identified;•
Supply to as many customers as possible is restored in timely fashion; and•
The faulted equipment is repaired in a quality and timely fashion.•
While each of these phases requires a different focus from different parts of the business, some elements of the network management process, such as the defect management process, impact on reliability from every angle. The capital works and maintenance strategy processes require attention from all of the focus areas.

Return to Index 175ASSET MANAGEMENT PLAN ELECTRICITY NETWORKS FY2010 – FY2019
Figure 8.2: Reliability Management Map
Initiatives are characterised by their phase in the asset lifecycle and by the time focus for implementation and achieving the desired objective.
SaIDI ( = SaIFI x CaIDI)
Faults per 100km of circuit SAIFI (average number of faults experienced by the customers) CAIDI (average length of interruption for the customers)
Reduce incidence of faults on network (prevent faults from happening)
Reduce incidence of faults causing interruptions (improve resilience of network to faults)
Reduce numbers of customers exposed to interruptions Enable the cause of fault to be
pin pointed more efficiently .
Minimise CM impact to customers exposed to interruptions (non faulted parts)
Minimise CM impact to customers exposed to fault repair time (faulted parts)
Fault PreventionRectify the underlying root cause of faults. Schedule planned outages carefully.
Improve Fault Resilience Improve network security - its ability to ride through faults or shutdowns without causing loss of supply longer than 1 minute.
Reduce Customer ExposureIf an outage does occur, then limit the number of customers it affects.
Effective Fault LocationIf a fault does occur, then pin point its location quickly so that supply restoration can occur effectively and repair efforts begun. See Notes 1, 2 & 3.
Improve Outage RestorationFor customers that are affected, isolate and minimise the faulted part & restore supply to customers connected to non faulted network parts quickly & safely. See Note 2.
Minimise Repair Impact Restore supply to customers connected to faulted parts of the network quickly & safely. Restore damaged equipment to its original condition. See Notes 1 & 3.
aS
SE
T L
IFE
Cy
CLE
Ph
aS
E
By
CO
NC
EP
T
AT Asset design matches the terrain and environment eg possum guards & bird spikes installed where needed, assets located out of harm’s way. ST Asset renewal plan adequately resourced and well targeted
LT Sub transmission network security through architecture, capacity & redundancy levels appropriateMT Auto reclose applied to appropriate feeders MT Implement fault neutralisers
AT Service lines & feeder spurs fusedST Implement reclosers & sectionalisers ST Network open points well configured LT Reduce numbers of customers per feederLT Sub transmission network security through architecture, capacity & redundancy levels appropriate
LT Improve ability to pin point the location of faults through fault locators & electronic fault indicators
LT Improve backup ability of distribution network through extra feeder links and voltage regulationMT Improve fault isolation through sectionalisationMT Increase levels of remote controlMT Implement feeder automation - eg self healing networks
LT Improve backup ability on distribution networkMT Implement greater sectionalisation, more network switches
By
DE
SIG
N &
C
ON
ST
Ru
CT
ION
AT Well engineered asset component specificationAT Well engineered asset configuration eg minimise conductor clashesAT Construction techniques & quality well aligned to specifications (fit for purpose)AT Designs that allow simple isolation and earthing for removing equipment from service
LT Protection schemes well engineered, implemented & commissionedAT Designs that allow simple isolation and earthing for removing equipment from service
LT Reclosers properly setAT Designs that allow simple isolation and earthing for removing equipment from service
LT Network equipment (cables, overhead line) has the capability to withstand multiple closures onto faults during fault finding, documented asset capability.AT Designs that allow simple isolation and earthing for removing equipment from service
LT Networks designed so that cable sections & line sections can be isolated by switchesAT Limit customer numbers exposed to repair time eg limit daisy chained transformersAT Designs that allow simple isolation and earthing for removing equipment from serviceMT Complicated automation projects well communicated to fault & operations staff
AT Improve back up switching at LVAT Improve ability to connect generators for back up supplyAT Designs that allow simple isolation and earthing for removing equipment from service
Th
RO
uG
h
Ma
INT
EN
aN
CE
AT Network well maintained in good order & condition ST Vegetation issues managedAT Effective defects management ST Eyes & ears - clear channels for field staff to report network risks. Notice taken of the risks.AT Communication with 3rd party diggers
AT Protection systems well maintained. AT Field staff trained in operating and maintaining the complicated schemes.AT Effective defects management
AT Network fuses of correct size implemented. AT Effective defects management
AT Field staff have access to cable fault locating equipment & have capability to locate faults AT Effective defects management
AT Improve local fault response through availability and competency of fault staffAT Fault staff trained in automation schemesAT Effective defects management AT Clear escalation process to meet large outages
ST Optimise holdings of stores and sparesAT Enhance reactive repair processes for more timely repairAT Effective defects management
Th
RO
uG
h
NE
TW
OR
K C
ON
TR
OL AT Human error incidents reduced through training & competencyST Planned outages optimised and well coordinatedAT Network operating within its normal capacity and configurationST Operational risks well managed
AT Operations staff trained in using the fault neutralisers and protection equipment
AT Maintain close working environment with field staff at all levels
AT Improve local response through effective information flow to fault staff & controllersAT Improve information available to controllers about the fault through SCADA. AT Improve systems & procedures used by controllers for locating faults.
AT Improve local response through effective information flow between fault staff & controllersAT Improve network controller decision making, clear procedures, good trainingAT Operations staff trained in using automation schemesAT Improve systems & procedures used by controllers for isolating faults.
AT Improve systems for recording & monitoring network (“red pin”) defects.
LT = Long TermMT = Medium TermST = Short TermAT = All terms
Note 1: Quick fault location and repair also means that innate network security can be restored leading to lower risk of outage.Note 2: For some faults, locating the fault and outage restoration is done at the same time.Note 3: Locating a faulted piece of cable often has to be done as part of repair.Note 4: Effective defects management is needed at all phasesNote 5: Close operational liaison with field staff needed at all levels

Return to Index176 ASSET MANAGEMENT PLAN ELECTRICITY NETWORKS FY2010 – FY2019
Reliability Performance – Lagging Measures8.2.4.
Lagging measures of reliability performance include regularly monitoring the measures set out in Section 4. These include:
Numbers of faults per length of line; •
Numbers of interruptions per length of line; •
Number of customers per interruption; •
SAIFI; •
CAIDI; and •
SAIDI. •
Feeder performance is monitored monthly and regional performance tends to be moni-tored annually.
Reliability Performance – Leading Measures8.2.5.
Leading measures of reliability performance include:
Age profile indicators – there is a direct comparison between faults caused by •defective equipment and the age and condition of network equipment;
Network security – security represents the resilience of the operation of the network •to equipment outages, for example, its back-up ability; and
Availability of fault staff – if adequate numbers of fault staff are not available to the •network operations team, then we can expect that fault response times will be longer than they could be.
Forecast renewal needs for the network result from the equipment condition records and from asset age profiles. These are indicating that network renewal expenditures will have to increase if the numbers of faults (defective equipment) are to remain as they are. Through the worst performing feeder process, we are forecasting a trend of increasing faults causing interruptions. The age profiles show that the need for overhead hardware replacement in the Western Region is growing. These point to a need for additional gen-eral renewal work being needed in coming years, especially in the Western Region.
Global Network Reliability vs Localised Reliability8.2.6.
When analysing reliability performance, it needs to be borne in mind that regional reli-ability trends can mask local level supply reliability issues. Local level reliability issues are reviewed through the worst performing feeder process and reported on monthly. The FIDI performance of feeders by type is presented in Section 7.5.
Automation - Reliability Improvement8.3.
Maintenance of the supply reliability to Powerco’s customers will be delivered by adoption of Automation and Renewal philosophies. Powerco runs a reliability-driven overhead line renewal programme in which the aim is to maintain adequate reliability of supply (refer to Section 6.6).
The reliability plan uses the key performance indicators outlined in Section 4 to derive a five-year plan of automation and renewal projects that seeks to maintain the supply reliability performance of Powerco’s network. The plan ranks the projects derived to ensure a maximum reduction of interruptions for the money spent.
Automation Philosophy8.3.1.
According to the IEEE PES DA Tutorial 1998, automation is “a set of technologies that enable an electric utility to remotely monitor, co-ordinate, and operate distribution components in a real-time mode from remote locations”.
The driving forces for automation are to:
To reduce the effects of MAIFI (auto-reclose) on modern appliances;•
Respond to growing customer expectations towards reductions in outages;•
Reduce the consequence of service interruptions and power quality problems;•
Maintain SAIDI; •
Continually improve our propositions to customers;•
Improve efficiency;•
Improve asset utilisation;•
Detect equipment problems earlier; and•
Improve workforce productivity.•
Automation to be Applied at Zone Substations8.3.2.
The long-term intention is that zone substations will be fully automated. This may include full measurement and control of all network elements as follows;
Circuit-breakers;•
Where electro-mechanical protection equipment is employed, a minimum of earth •fault and over-current is expected for indication and control purposes;
Where numeric relays equipment is employed, it is envisaged all alarm points will be •monitored for indication and control purposes;
Auto-reclose functionality should be enabled and remotely controlled where •applicable;
Transformers; and•
Voltage, load indication and tap change control and indication.•

Return to Index 177ASSET MANAGEMENT PLAN ELECTRICITY NETWORKS FY2010 – FY2019
Automation to be Applied on Subtransmission Networks8.3.3.
Automation for subtransmission is considered on a case-by-case basis. However, in general, indication and measurement of 33kV circuit-breakers may be applied, and follow rules to be applied to distribution feeders.
As a long-term benchmark goal, spur line subtransmission circuits over 15km in length could utilise mid-circuit air-break switches or reclosers for fault isolation. Spur line circuits may have distance-to-fault indication installed, initially installed on cross-country feeders and to have approximately one LFI site per 5km of circuit length placed at strategic locations.
Automation on Distribution Networks8.3.4.
Reclosers and sectionalisers are used to sectionalise and isolate commercial, urban, rural and remote rural ICPs, as well as long feeders.
The basic configuration is that a recloser should be installed past a feeder circuit-breaker to sectionalise for different zoned ICPs, or strategically sited for the feeder length, based on faults per km in that region. Two reclosers are generally not installed downstream of each other due to protection discrimination issues, and, where additional devices are required a sectionaliser should be considered.
SCADA communications are generally required to be installed where possible.
One device may be installed per 30km of feeder where ICPs increase by 500 consecutively, with the layout of the feeder determining what type of device is required (a poor performing feeder could have an additional device added to the feeder).
New voltage regulator installations tend to be SCADA enabled for indication and control. Existing distribution regulators may be retro-fitted for SCADA operation.
Strategically placed at feeder extremities and open points, current and voltage sensors may provide real-time voltage and line current monitoring during backfeeding for fault conditions and planned outages.
Rapid fault location on rural networks minimises outage times. One method of improving response times is the installation of Line Fault Indicators (LFI) to segment the area to be patrolled. Each new LFI site will receive an individual asset ID to allow maintenance strategies to be implemented to ensure reliability, and all SCADA representation updated, as appropriate. As technology allows, remote monitor LFIs will be installed. Presently, a cost-effective method is not available for universal application.
Underground networks may have Electronic Fault Indicators (EFI) applied to aid locating faults. New work will consider the installation of additional EFIs.
Automation should be considered at mid and open points along the feeder; this will include EFIs and SCADA control indication.
Where ICP numbers exceed 1200 customers on a feeder, or the feeder represents F1, F2 or CBD feeders, then a mid-feeder remote switch/recloser (in conjunction with fault indicators) may be installed on either air break or underground switch sites. Where ICP numbers exceed 1500 customers on a feeder, or the feeder represents F1, F2 or CBD feeders, then a mid-feeder remote switch/recloser, and a remote open point switch may be installed on either air-break or underground switch sites.
Some opportunities exist where the remote control of normal open point switches can reduce outage times. In such cases, a remote-controlled device may be considered. Where the total number of ICPs between both reclosers is more than 700, or a line length exceeding 50km is found, a remote device may be installed.
There are situations where primary backfeed for a substation without an N-1 supply is required to be fed by 11kV due to a fault on the subtransmission network. The option of installing remote switches may be considered for up to three sites to give adequate backfeed capacity to the substation during off-peak load periods.
Remotely controlled switches may be installed when travel times for fault staff are excessive to operate frequently used switches, when sectionalising a feeder or applying backfeeds during unplanned outages.
Regional Reliability Performance Review8.4.
The graphs in Figure 8.3 regionalise the trends in Figure 5.4. These are lagging meas-ures (in that they look at historical performance) of the unplanned reliability performance of Powerco’s regions according to each of the phases. Figures 8.4, 8.5 and 8.6 look at the 2009 year. These highlight focus areas needing special attention (purple rings).

Return to Index178 ASSET MANAGEMENT PLAN ELECTRICITY NETWORKS FY2010 – FY2019
RC - Valued at Current Cost of Renewal
9 Year Average RC - Valued at Current Cost of Renewal Age (Years)
2006 2007 2008 2009
SA
IFI
SA
IDI M
inut
es
0
1
2
3
4
5
Regional Unplanned SAIFI excl storms
2006 2007 2008 2009
0
200
400
600
800
1000
Ratio Customers per Interruption (Unplanned) excl storms
2006 2007 2008 2009
0
5
10
15
20
25
2006 2007 2008 2009
Regional Faults (excl planned shutdowns) per 100km HV cct excl storms
0
5
10
15
20
2006 2007 2008 2009
Regional Unplanned Interruptions per 100km HV cct excl storms
0
50
100
150
200
250
300
Regional Unplanned SAIDI excl storms
2006 2007 2008 2009 0
20
40
60
80
100
120
140
160
Regional Unplanned CAIDI excl storms
Figure 8.3: Historical Regional Reliability Performance
Notes: A: The number of faults is the number of times that pieces of network equipment fail to be able to carry electricity. They can be removed from service automatically or manually. They include faults that cause interruptions, auto-recloses and faults that do not cause interruptions to customers. They exclude part-power incidents. B: Powerco’s targeted number of faults per 100 km of line is 14 for distribution lines and 6 for 33kV and 66kV subtransmission lines. Based on these, Powerco’s actual number of faults per 100km is higher, however it is not likely that these targets count auto recloses.C: Powerco’s recording processes have evolved over time so that we are gathering information about more types of faults that don’t cause interruptions than was collected previously.D: The number of interruptions is the number of times that any customer-experiences a loss of supply for greater than one minute. E: SAIFI is the average number of interruptions, greater than one minute that customers in the region experience.F: SAIDI is the average number of minutes In whichh customers in the region experience, for interruptions longer than one minute.

Return to Index 179ASSET MANAGEMENT PLAN ELECTRICITY NETWORKS FY2010 – FY2019
Faults / 100km% Faults causing Interruptions
Customers/ interuption
Minutes / interruption
TGA WR COR TGA WR COR TGA WR COR TGA WR COR
Adverse Environment 0.0 0.1 0.0 100% 43 159
Adverse Weather 2.5 1.9 4.1 38% 31% 19% 567 80 3390 74 225 63
Defective Equipment 5.6 4.9 6.1 89% 92% 89% 503 129 695 80 111 65
Foreign Interference 3.4 2.2 1.3 97% 95% 87% 1066 407 443 49 57 102
Human Error 0.1 0.1 0.2 67% 50% 50% 3009 195 365 8 24 18
Lightning 0.3 0.3 1.0 33% 0% 53% 279 908 65 78
Planned Outage 13.0 8.9 8.9 84% 91% 90% 86 46 370 171 225 88
Tree 1.4 2.0 1.2 86% 97% 85% 657 112 360 73 153 60
Unknown 5.7 5.1 8.0 26% 30% 17% 1151 288 935 32 75 104
Total 32.1 25.5 30.8 72% 74% 59% 449 134 653 67 108 76
Total unplanned 19 .1 16 .6 21 .9 64% 65% 47% 775 199 870 57 88 73
23 .1 18 .9 18 .3
12 .2 10 .8 10 .4
Figure 8.4: Tauranga, Coromandel and Wairarapa Reliability by Cause (year to 31 March 2009)
Subtrans Lines
Subtrans Cable
Zone Sub
Dist Line
Dist Cable
Subtrans Equip
Dist Equip
Taranaki 2009Unplanned
Manawatu 2009Unplanned
South Waikato 2009Unplanned
Wanganui 2009Unplanned
Coromandel 2009Unplanned
Tauranga 2009Unplanned
Wairarapa 2009Unplanned
Figure 8.5: Regional Pie Charts of Unplanned SAIDI by Faulted Equipment Type
Asset design matches the terrain and •environment eg possum guards & bird spikes installed where needed, assets located out of harm’s way.
Asset renewal plan adequately •resourced and well targeted
Network well maintained in good order •& condition
Effective defects management •
Eyes & ears - clear channels for field •staff to report network risks. Notice taken of the risks.
Communication with 3rd party diggers•
Service lines & feeder spurs fused•
Implement reclosers & •sectionalisers
Network open points well •configured
Network open points well •configured
Reduce numbers of customers •per feeder
Sub transmission network •security through architecture, capacity & redundancy levels appropriate
Increase •levels of remote control
Implement •feeder automation - eg self healing networks

Return to Index180 ASSET MANAGEMENT PLAN ELECTRICITY NETWORKS FY2010 – FY2019
Figure 8.6: Faults and Interruptions by voltage.
Manawatu Faults InterruptsLength
(km)Faults/ 100km
Ints/ 100km
EEA Target Notes
11kV UG 26 24 285 9.1 8.4 4 Underlying issue - historical jointing methods.
11kV OH 413 233 2462 16.8 9.5 14
33kV UG 1 0 32 3.1 0.0 4
33kV OH 55 8 289 19.0 2.8 6 35 auto recloses on the Mangamaire 33kV system
Taranaki Faults InterruptsLength
(km)Faults/ 100km
Ints/ 100km
EEA Target Notes
6.6/11kV UG 8 6 186 4.3 3.2 4
6.6/11kV OH 518 301 3028 17.1 9.9 14
33kV UG 2 1 15 13.3 6.7 4
33kV OH 58 14 344 16.9 4.1 6
Tauranga Faults InterruptsLength
(km)Faults/ 100km
Ints/ 100km
EEA Target Notes
11kV UG 31 26 553 5.6 4.7 4
11kV OH 294 183 1407 20.9 13.0 14
33kV UG 0 0 36 0.0 0.0 4
33kV OH 34 14 145 23.4 9.7 6 22 of the faults had unknown cause.
Valley/ Coromandel Faults Interrupts
Length (km)
Faults/ 100km
Ints/ 100km
EEA Target Notes
11kV UG 21 12 423 5.0 2.8 4
11kV OH 636 294 3295 19.3 8.9 14 Autorecloses in Waihou and Waikino areas
33kV UG 0 0 17 0.0 0.0 4
33kV OH 27 5 256 10.5 2.0 6
66kV UG 0 0 0 0.0 0.0 3
66kV OH 19 7 151 12.6 4.6 3 Coromandel 66kV reconstruction
Wairarapa Faults InterruptsLength
(km)Faults/ 100km
Ints/ 100km
EEA Target Notes
11kV UG 0 0 49 0.0 0.0 4
11kV OH 255 179 1902 13.4 9.4 14
33kV UG 0 0 2 0.0 0.0 4
33kV OH 30 15 193 15.5 7.8 6 14 faults had unknown cause
Wanganui Faults InterruptsLength
(km)Faults/ 100km
Ints/ 100km
EEA Target Notes
6.6/11kV UG
3 2 54 5.6 3.7 4
6.6/11kV OH
319 113 2497 12.8 4.5 14
22kV UG 0 0 0 0.0 0.0 4
22kV OH 23 2 121 19.1 1.7 14
33kV UG 2 2 4 57.1 57.1 4 2 faults at Roberts Ave caused this statistic
33kV OH 15 6 134 11.2 4.5 6
Graphs in Figures 8.4 to 8.6 present further information on the reliability trends. These highlight several areas of tactical response:
Numbers of faults per unit of line length in Coromandel and Tauranga are higher than •other regions. This indicates extra focus is needed on network renewal, vegetation control and foreign interference in these areas. In recent years, we have been acting on this by increasing spending on overhead line renewal in the Eastern Region – spending has been at levels significantly above what the age profiles would indicate as reasonable. However, forecasts are now showing that we should be increasing our renewal activity in Western Region areas too.
The Manawatu overhead subtransmission system is getting a large number of auto-•recloses, mainly due to the condition of the Pongaroa lines, which will be a focus of renewal.
The 33kV networks in the Tauranga, Waihou, Waikino, Greytown and Masterton GXP •regions are exhibiting a large number of faults that do not cause interruptions. These interruptions are largely of unknown cause.
Numbers of customers affected by interruptions are high in Coromandel and •Tauranga. This indicates a need for subtransmission reinforcement, fusing of feeder spurs and extra zone substations and feeders in these areas. This is recognised in past Business Plans, where Coromandel has been a focus for subtransmission expenditure, and has been recognised in capital works plans for several years with money going towards Tauranga zone substations and new feeders.
Response times to restore supply to customers are long in Wairarapa. This implies a •need to focus on SCADA-isation in this area. This point probably needs extra focus in works plans.

Return to Index 181ASSET MANAGEMENT PLAN ELECTRICITY NETWORKS FY2010 – FY2019
Reliability Tactical Overview8.4.1.
The capital works plans reflect these tactical focus points by targeting capital budget towards:
Network renewal, particularly on overhead lines, in Coromandel, Hauraki Plains •areas and Tauranga. Forward indicators show we should be increasing renewal activity in the Western Region. The renewal should be focussed on hardening the distribution feeder trunks and on subtransmission, particularly on lines supplying N security zone substations.
A high number of faults have been caused in the Palmerston North underground •distribution system. This is due to a combination of historical joint types, treeing cable and human error-type issues. It indicates a need for targeted scheduled cable renewal. For “tin can” joints, the joints need to be identified and prioritised for replacement (estimated cost $5,000 per joint). For treeing cable, carry on with the current practice of replacing failed sections of cable when identified.
Subtransmission reinforcement projects in Coromandel and Tauranga. Leading •indicators show that focus should go into the Palmerston North subtransmission network because of the continued demand growth that it has had in recent years.
New zone substations and extra feeders in Tauranga.•
Fitting of SCADA to zone substations that do not have SCADA, particularly in •Wairarapa. Improving the controllability of reclosers in the network.
Other points include:
Human error incidents need continued attention. Training - initial and ongoing - •needs to be provided to switch operators in the use of ground-mounted switch operation. The Main Street switch building, once the 33kV switchboard has been removed, could be used as a training room. Redundant ground-mounted switches can be installed to allow hands-on operations, which would also include all operations and communications with the control centre. NOC should review the checking of switching operation orders for accuracy.
Continuation of the customer consultation process Is useful, targeted to the likely •customer dissent areas (refer to Section 6).
Continue to maintain and monitor the availability and adequacy of fault response •crews.
The defects process features in every step of the network reliability of supply •improvement process. The existing defects process (BMS 399S015) is out of date and should be updated to reflect the actual process. The defects process could perhaps be integrated more into an end-to-end network renewal and maintenance process.
worst Performing feeder Analysis8.5.
The graphs given below illustrate overall trends in the number of feeders that are found to be falling short of target each year. They also illustrate the actual performance of feeders that are not meeting the target for their class.
These graphs now include the storm activity, whereas in previous years storms were excluded.
Feeder Class F1 FIDI8.5.1.
Worst Performing Feeders - Class F1
FID
I Min
utes
0
600
200
400
800
1,000
1,200
1,400
1,600
1,800
Unplanned Planned Threshold
Mcc
abe
Roa
d
Bel
l Blo
ck 4
Cra
ne S
upp
ly
Man
aia
Man
gato
ki
Woo
ds
Rd
Mat
apu
Lom
ond
Ave
Lorn
e S
t
Elth
am T
own
Nor
th
Ara
pun
i St
Ken
ned
y D
rive
Wha
rf
Kop
u
Figure 8.7: Worst Performing Feeders – Class F1.
VALLEY, MCCABE ROAD – Seven outages occurred, with tree contacts accounting for 67% of the FIDI minutes. This is a F1/F4 feeder with recloser installed, and 320 ICPs. Larger faults were generally past recloser. No works are planned for FY2011.
TARANAKI, BELL BLOCK 4 – Three unplanned outages, with a tornado accounting for 75% of the FIDI minutes. No works are planned for FY2011.
TAURANGA, CRANE SUPPLY – One fault occurred, due to a cable fault. This feeder has 66 ICPs. No works are planned for FY2011.
TARANAKI, MANAIA – Six unplanned outages, with defective equipment listed as the fault mechanisms. All outages have occurred on the F4 portion of the feeder. A recloser is planned to be installed to separate the F1 part of the feeder to the F4 part of the feeder in FY2011.
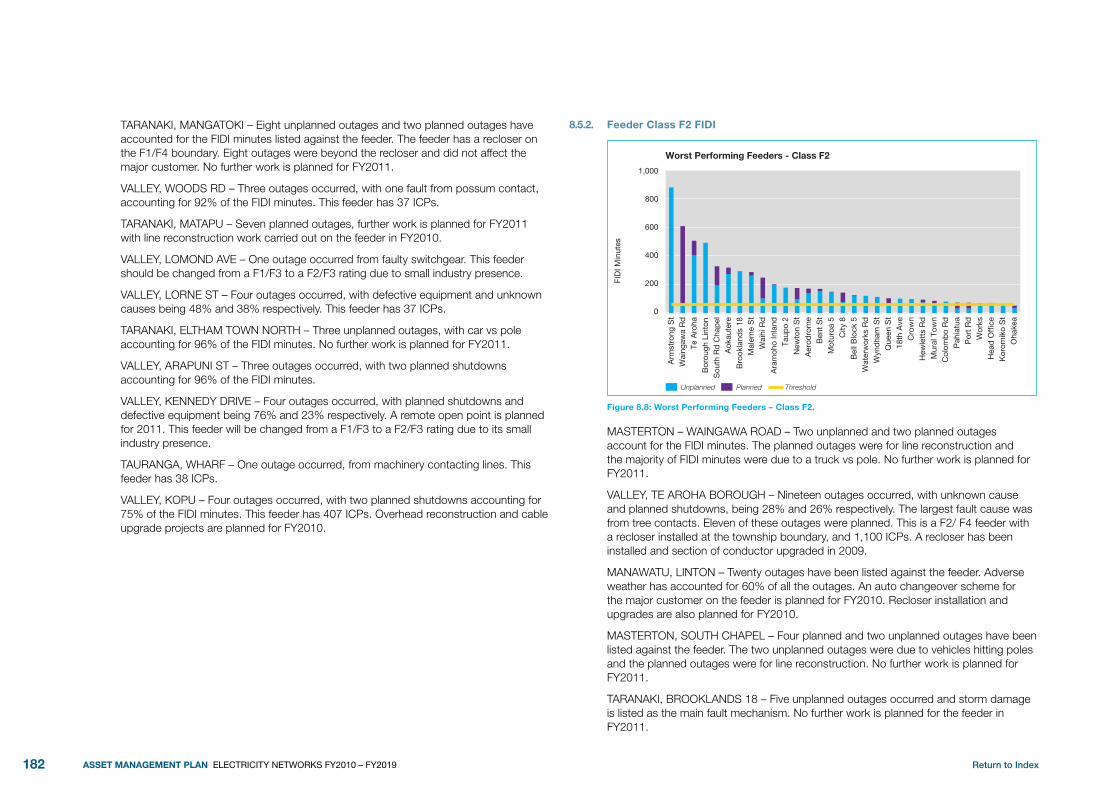
Return to Index182 ASSET MANAGEMENT PLAN ELECTRICITY NETWORKS FY2010 – FY2019
TARANAKI, MANGATOKI – Eight unplanned outages and two planned outages have accounted for the FIDI minutes listed against the feeder. The feeder has a recloser on the F1/F4 boundary. Eight outages were beyond the recloser and did not affect the major customer. No further work is planned for FY2011.
VALLEY, WOODS RD – Three outages occurred, with one fault from possum contact, accounting for 92% of the FIDI minutes. This feeder has 37 ICPs.
TARANAKI, MATAPU – Seven planned outages, further work is planned for FY2011 with line reconstruction work carried out on the feeder in FY2010.
VALLEY, LOMOND AVE – One outage occurred from faulty switchgear. This feeder should be changed from a F1/F3 to a F2/F3 rating due to small industry presence.
VALLEY, LORNE ST – Four outages occurred, with defective equipment and unknown causes being 48% and 38% respectively. This feeder has 37 ICPs.
TARANAKI, ELTHAM TOWN NORTH – Three unplanned outages, with car vs pole accounting for 96% of the FIDI minutes. No further work is planned for FY2011.
VALLEY, ARAPUNI ST – Three outages occurred, with two planned shutdowns accounting for 96% of the FIDI minutes.
VALLEY, KENNEDY DRIVE – Four outages occurred, with planned shutdowns and defective equipment being 76% and 23% respectively. A remote open point is planned for 2011. This feeder will be changed from a F1/F3 to a F2/F3 rating due to its small industry presence.
TAURANGA, WHARF – One outage occurred, from machinery contacting lines. This feeder has 38 ICPs.
VALLEY, KOPU – Four outages occurred, with two planned shutdowns accounting for 75% of the FIDI minutes. This feeder has 407 ICPs. Overhead reconstruction and cable upgrade projects are planned for FY2010.
Feeder Class F2 FIDI8.5.2.
Worst Performing Feeders - Class F2
FID
I Min
utes
0
600
200
400
800
1,000
Unplanned Planned Threshold
Arm
stro
ng S
tW
aing
awa
Rd
Te A
roha
Bor
ough
Lin
ton
Sou
th R
d C
hap
elA
okau
tere
Bro
okla
nds
18M
alem
e S
tW
aihi
Rd
Ara
moh
o In
land
Taup
o 2
New
ton
St
Aer
odro
me
Ben
t S
tM
otur
oa 5
City
8B
ell B
lock
5W
ater
wor
ks R
dW
ynd
ham
St
Que
en S
t18
th A
veC
row
nH
ewle
tts
Rd
Mur
al T
own
Col
omb
o R
dP
ahia
tua
Por
t R
dW
orks
Hea
d O
ffic
eK
orom
iko
St
Oha
kea
Figure 8.8: Worst Performing Feeders – Class F2.
MASTERTON – WAINGAWA ROAD – Two unplanned and two planned outages account for the FIDI minutes. The planned outages were for line reconstruction and the majority of FIDI minutes were due to a truck vs pole. No further work is planned for FY2011.
VALLEY, TE AROHA BOROUGH – Nineteen outages occurred, with unknown cause and planned shutdowns, being 28% and 26% respectively. The largest fault cause was from tree contacts. Eleven of these outages were planned. This is a F2/ F4 feeder with a recloser installed at the township boundary, and 1,100 ICPs. A recloser has been installed and section of conductor upgraded in 2009.
MANAWATU, LINTON – Twenty outages have been listed against the feeder. Adverse weather has accounted for 60% of all the outages. An auto changeover scheme for the major customer on the feeder is planned for FY2010. Recloser installation and upgrades are also planned for FY2010.
MASTERTON, SOUTH CHAPEL – Four planned and two unplanned outages have been listed against the feeder. The two unplanned outages were due to vehicles hitting poles and the planned outages were for line reconstruction. No further work is planned for FY2011.
TARANAKI, BROOKLANDS 18 – Five unplanned outages occurred and storm damage is listed as the main fault mechanism. No further work is planned for the feeder in FY2011.

Return to Index 183ASSET MANAGEMENT PLAN ELECTRICITY NETWORKS FY2010 – FY2019
TAURANGA, MALEME ST – Ten outages occurred, with defective equipment and tree contacts being 40% and 28% respectively, and the largest fault resulting from a cable failure. This feeder should be changed from a F2/ F4 to a F3/ F4 feeder as the Maleme Express feeder has now been commissioned.
TAURANGA, WAIHI RD – Six outages occurred, with five from planned shutdowns accounting for 59% of the FIDI minutes.
WANGANUI, ARAMOHO INLAND – Two unplanned outages have been listed against the feeder, with a car vs pole accounting for 80% of the FIDI minutes. No further work is planned for FY2011.
WANGANUI, TAUPO 2 – One unplanned outage caused all FIDI minutes listed against the feeder, no cause was found. No further work is planned for FY2011.
TAURANGA, NEWTON ST – Eight outages occurred, with planned shutdowns and foreign interference being 45% and 40% respectively, with the largest fault resulting from a truck vs pole. Minor overhead reconstruction work is planned for FY2011, and the proposed new Omanu Sub will reduce the 1,210 ICPs on this feeder.
TAURANGA, AERODROME – Eight outages occurred, with foreign interference and adverse weather being 38% and 31% respectively, with the largest fault resulting from a car vs pole. Major overhead reconstruction work was completed in 2009. The proposed new Omanu Sub will reduce ICPs on this feeder.
VALLEY, BENT ST – Five outages occurred, with defective equipment and human element being 49% and 42% respectively. This feeder has been recently reconfigured to balance ICPs and provide easier backfeed capacity should adjacent feeders fault.
TARANAKI, MOTUROA 5 – Six unplanned outages have been listed against the feeder. Three unplanned outages were due to vehicles hitting poles, 85% of all FIDI minutes. A recloser installation on the F2/F4 boundary is planned for FY2011.
TARANAKI, CITY 8 – Two outages account for KPIs against the feeder. A transformer was installed during a planned shutdown and then failed 12 hours later. No further work is planned for the feeder in FY2011.
TARANAKI, BELL BLOCK 8 – Seven unplanned and two planned outages have been listed against the feeder. Tree contacts have been listed as the main fault mechanism. Tree trimming is planned and a recloser is to be installed in FY2010.
MASTERTON, WYNDAM STREET – Four unplanned outages have been listed against the feeder. A truck vs pole accounted for 80% of all FIDI minutes. No further work is planned for FY2011.
VALLEY, QUEEN ST – Four outages occurred with two car vs pole incidents accounting for 77% of the FIDI minutes. Major overhead reconstruction works are planned for FY2011 and, due to 1300 ICPs on the feeder, a new recloser in FY2012.
TAURANGA, 18TH AVE – Three outages occurred, with one single car vs pole incident accounting for 65% of the FIDI minutes. A new recloser has been proposed for FY2011 due to 1,050 ICPs being on the feeder.
MANAWATU, CROWN – Two unplanned outages have been listed against the feeder. A transformer failure caused 50% of the FIDI minutes and a car versus pole accounting for the remaining minutes. No further work is planned for the feeder in FY2011.
TAURANGA, HEWLETTS RD – Five outages occurred, with the major one resulting from a reported bird strike accounting for 61% of the FIDI minutes. Minor overhead reconstruction works are planned for FY2011. This feeder has 44 ICPs.
TAURANGA, MURAL TOWN – Ten outages occurred, with defective equipment and planned shutdowns being 50% and 42% respectively. Minor overhead reconstruction works are planned for FY2010. This feeder had ICPs reduced and moved to the adjacent Tetley Rd feeder.
MASTERTON, COLOMBO ROAD – Two unplanned outages were listed against the feeder, with a car vs pole and an unknown outage as the fault mechanisms. No further work is planned for the feeder.
MANAWATU, PAHIATUA – Five unplanned and eight planned outages were listed against the feeder. Major line reconstruction as been carried out on the feeder during FY2010. No further work is planned for FY2011.
VALLEY, PORT RD – Two outages occurred, with the largest from a planned shutdown. A new recloser has been installed, a remote open point planned for 2010, and minor overhead reconstruction works planned for FY2011.
MANAWATU, WORKS – A failed cable pothead caused all FIDI minutes listed against the feeder. No further work is planned for FY2011.
MASTERTON, HEAD OFFICE – A truck vs pole caused all FIDI minutes listed against the feeder. No further work is planned for FY2011.

Return to Index184 ASSET MANAGEMENT PLAN ELECTRICITY NETWORKS FY2010 – FY2019
Feeder Class F3 FIDI8.5.3.
Worst Performing Feeders - Class F3
FID
I Min
utes
0
1,000
500
1,500
2,000
Unplanned Planned Threshold
Sha
w A
veFa
ctor
yB
uret
a R
dTa
rata
Tota
ra S
tP
uran
giA
shhu
rst
Som
erse
t R
dTa
ra R
dTh
ames
Coa
stW
elco
me
Bay
Bel
levu
e R
dP
asca
l St
9B
elve
der
eK
iwi S
tG
love
r R
dO
haui
tiM
osso
ps
Rd
Wai
roa
Tota
raK
eith
St
22G
ord
on S
tN
gate
aC
emet
ery
Den
big
hM
aran
gai
Rev
ans
St
Elth
am T
own
Wes
t S
tG
reen
Par
kB
rook
land
s 5
Cor
adin
e S
tC
ity 1
0C
olog
ne S
tK
eith
St
23B
each
Rd
Wai
hiB
ell B
lock
2R
ata
St
Mot
uroa
9M
iro S
tR
ober
ts L
ine
Kau
ri S
tA
wap
uni
Figure 8.9: Worst Performing Feeders – Class F3.
VALLEY, SHAW AVE – Four outages occurred, with tree contacts and lightning being 55% and 40% respectively, and the largest fault resulting from tree contacts. This feeder has 320 ICPs, with major overhead reconstruction work is planned for FY2011.
FACTORY – The feeder is classed as a F3 but has only one ICP, a mostly disused factory. One unplanned outage on the feeder has been listed. No further work is planned for the feeder.
TAURANGA, BURETA RD – Four outages occurred, with two from car vs pole incidents accounting for 94% of the FIDI minutes. This feeder has 1,043 ICPs, with major overhead reconstruction work is planned for FY2011.
VALLEY, TOTARA ST NORTH – This feeder is located near the Port in Mt Maunganui. The Omanu zone substation should provide a means of sectionalising this feeder and backing it up.
VALLEY, PURANGI – Nineteen outages occurred, with 58% of the FIDI minutes resulting from defective equipment. Two major events occurred from a cable fault and a car vs pole. Two reclosers and a remote open point exist. This feeder has 1,700 ICPs. FY2010 projects include upgrading the recloser to full loop automation and transferring approximately 500 ICPs to an adjacent feeder after a new link-line and cable are constructed.
MANAWATU, ASHHURST – Six unplanned outages and one planned outage have been listed against the feeder. Trees falling during high winds from outside the required cut zone have cause the majority of FIDI minutes listed against the feeder. No further work is planned for FY2011.
MASTERTON, SOMERSET ROAD – Three unplanned and nine planned outages have been listed against the feeder. Reconstruction work has been carried out in FY2010. No further work is planned in FY2011.
TAURANGA, TARA RD – Eight outages occurred, with defective equipment and foreign interference being 50% and 44% respectively. The two largest faults resulted from car vs pole incidents, and a blown jumper from tree contacts. This feeder has 1,850 ICPs, with a recloser and remote open point installed, and major overhead reconstruction works planned for FY2011.
VALLEY, THAMES COAST – Nine outages occurred, with a foreign interference and adverse weather being 29% and 21% respectively, and the largest fault resulting from the public cutting trees that made contact with the lines. This feeder has 1,680 ICPs with a recloser and sectionaliser installed. The sectionaliser is to be upgraded (complete with SCADA), and a new 11kV link line is planned.
TAURANGA, WELCOME BAY – Eight outages occurred, with a defective RMU and cable accounting for 76% of the FIDI minutes. This feeder has 1350 ICPs with a recloser and remote open point installed. Major overhead reconstruction works planned for FY2010.
TAURANGA, BELLEVUE RD – Six outages occurred, with foreign interference and planned shutdowns being 57% and 43% respectively. Tthe largest fault resulted from car vs pole, and four outages were planned. This feeder has 1,130 ICPs, with major overhead reconstruction works and a proposed recloser planned for FY2011.
MANAWATU, PASCAL 9 - Four unplanned and two planned outages have been listed against the feeder. Unplanned outages were due to cable joints failing and two foreign interference faults. The planned outages were for line reconstruction work. No further work is planned for the feeder in FY2011.
MASTERTON, BELVEDERE – Three unplanned outages and one planned outage have been listed against the feeder. The planned outage accounted for 40% of the FIDI minutes. One storm outage accounted for 50% of FIDI. No further work is planned for FY2011.
WANGANUI, KIWI ST – Four unplanned and one planned outage have been listed against the feeder. Two faults caused by adverse weather account for 70% of FIDI.
TARANAKI, GLOVER ROAD WEST - Four unplanned and seven planned outages were listed against the feeder in the reporting year. Major reconstruction work has been carried out in FY2010. No further work is planned for FY2011.

Return to Index 185ASSET MANAGEMENT PLAN ELECTRICITY NETWORKS FY2010 – FY2019
TAURANGA, OHAUITI – Eight outages occurred, with defective equipment and unknown cause being 58% and 28% respectively, and the largest fault caused by a defective RMU bus-coupler unit. This feeder has 1,600 ICPs, with two reclosers installed. Major overhead reconstruction, overhead upgrade works, and recloser upgrade work is planned for FY2011.
VALLEY, MOSSOPS RD – Four outages occurred, with unknown cause and defective equipment being 55% and 37% respectively, the largest fault resulted from a unknown cause from suspect cable fault. This feeder has 970 ICPs with a recloser installed.
TAURANGA, WAIROA – eight outages occurred with foreign interference and adverse weather being 38% and 37% respectively. The largest fault from an unknown cause. This feeder has 1,672 ICPs, with a recloser installed. Minor overhead reconstruction and major overhead upgrade work was completed in for 2009, with a new loop recloser planned for FY2011.
VALLEY, TOTARA – Fifteen outages occurred, with planned shutdowns accounting for 65% of the FIDI minutes from seven outages. This feeder has 545 ICPs, with a recloser installed. Major overhead reconstruction work is planned for FY2011.
MANAWATU, KEITH 22 – One unplanned outage, due to a cable termination failing and one planned outage for switch maintenance, have been listed against the feeder. No further work is planned.
MASTERTON, GORDON ST – Four unplanned outages have been listed against the feeder. Storm damage accounts for 99% of the KPI FIDI. No further work is planned for FY2011.
VALLEY, NGATEA – Thirteen outages occurred, with unknown cause and foreign interference being 36% and 32% respectively, and the largest fault resulting from a car vs pole incident. This feeder has 930 ICPs, with a recloser installed, although has a significant amount rural network and is a F3/F4 rating. Minor overhead reconstruction works planned for FY2010.
WANGANUI, CEMETERY – Three unplanned outages were listed against the feeder. Cable failure accounted for over 50% of FIDI minutes. No further work is planned for FY2011.
MANAWATU, DENBIGH – Three unplanned and one planned outage have been listed against the feeder in the reporting year. The faults were cable failures. No further work is planned in FY2011.
WANGANUI, MARANGAI – Six unplanned and four planned outages have been listed against the feeder. Major reconstruction work has been carried out on the feeder. Further reconstruction work is planned for FY2011.
TARANAKI, ELTHAM TOWN – Four unplanned outages, due to lightning strikes, were listed against the feeder. No further work is planned.
MASTERTON, WEST STREET – One unplanned outage and one planned outage were listed against the feeder. No further work is planned in FY2011.
TAURANGA, GREEN PARK – Eight outages occurred, with foreign interference and planned shutdowns being 70% and 22% respectively, and the largest fault resulting from a car vs pole incident. This feeder has 1,135 ICPs, with a recloser installed. Minor overhead reconstruction work is planned for FY2010.
TARANAKI, BROOKLANDS 5 - Thirteen unplanned and nine planned outages have been listed against the feeder. A line condition patrol is required to be completed on the feeder to identify the fault mechanisms.
CORADINE ST – One unplanned and four planned shutdowns are listed against the feeder. The feeder has had reconstruction work carried out in FY2009, which accounts for over 90% FIDI. No further work is planned.
TARANAKI, CITY 10 – One unplanned and five planned outages have been listed against the feeder. The unplanned outage was due to a cable failure. No further work is planned in FY2011.
COLOGNE ST – Seven unplanned and five planned shutdowns are listed against the feeder. Tree trimming and line reconstruction have been carried out. All planned outages have been beyond the recloser on the urban/rural boundary on the feeder. Further tree trimming is planned to be carried out in FY2011.
MANAWATU, KEITH 23 – Four unplanned and eight planned outages have been listed against the feeder. Unplanned outages have included switching errors and cable failure. Planned outages have been carried out for switch maintenance. No further work is planned for the feeder in FY2011.
VALLEY, BEACH RD WAIHI BEACH – Four outages occurred, with three from planned shutdowns accounting for 85% of the FIDI minutes. A new feeder is due to be completed in 2010 and will transfer some of the 980 ICPs currently on this feeder.
TARANAKI, BELL BLOCK 2 – Ten unplanned and three planned outages have been listed against the feeder. A line condition patrol is required to be completed on the feeder to identify the fault mechanisms.
TARANAKI, RATA STREET – One unplanned outage and two planned outages were listed against the feeder. Planned outages have accounted for over 95% of FIDI minutes listed. No further work is planned for the feeder in FY2011.
TARANAKI, MOTUROA 9 – Twenty unplanned and six planned shutdowns were listed against the feeder. Planned works have included cross-arm replacement and conductor replacement. Line reconstruction work is planned for FY2011.

Return to Index186 ASSET MANAGEMENT PLAN ELECTRICITY NETWORKS FY2010 – FY2019
Feeder Class F4 FIDI8.5.4.
Worst Performing Feeders - Class F4
FID
I Min
utes
0
1,000
500
1,500
2,500
2,000
Unplanned Planned Threshold
Mou
ntai
n
Str
athm
ore
Tow
nshi
p &
Ls
Poh
angi
na
Wes
tmer
eG
lad
ston
eTi
rohi
a-K
aran
gaha
keH
oroe
ka
Gor
don
Te P
oi
Wai
hi N
orth
Long
bus
h
War
dvi
lle
Sta
tion
Rd
Ota
mar
akau
Mat
akan
a R
d
Kai
mai
Driv
e
Ota
keho
Pae
ngar
oa
Aw
aiti
Coo
noor
Tira
umea
Wha
kam
ara
Lich
field
Ker
eone
Kon
ini
Bro
okla
nds
Wai
taw
heta
Figure 8.10: Worst Performing Feeders – Class F4.
VALLEY, MOUNTAIN – Thirteen outages occurred, with foreign interference and defects being 32% and 22% respectively. The largest fault resulted from a car vs RMU unit. This feeder has 460 ICPs and one recloser installed. Minor overhead reconstruction work is planned for FY2011.
TARANAKI, STRATHMORE – Fifteen unplanned outages and two planned outages have been listed against the feeder. The main fault mechanism has been tree contact. Powerco’s tree contractor has cleared trees off the feeder and the number of unplanned outages is decreasing. Line reconstruction is planned for FY2011.
VALLEY, TOWNSHIP & LS – Seven outages occurred, with one fault from adverse weather accounting for 94% of the FIDI minutes, during a severe storm. This feeder has 230 ICPs. No future works are planned.
MANAWATU, POHANGINA – Adverse weather, with one severe wind storm, has returned high FIDI minutes on this feeder. The feeder has had a line condition patrol carried ou,t with defects reported and repaired. A loop automation scheme was commissioned in 2009. No further work is planned for FY2011.
MASTERTON, WESTMERE GLADSTONE – Nine unplanned and nine planned outages have been listed against the feeder. The main fault mechanism has been tree contact. Powerco’s tree contractor has cleared trees off the feeder and the number of unplanned outages is decreasing. No further work is planned for FY2011.
VALLEY, TIROHIA-KARANGAHAKE – Nineteen outages occurred, with adverse weather accounting for 81% of the FIDI minutes from eight faults. This feeder has 580 ICPs, with one recloser installed. Major overhead reconstruction work is being undertaken at present.
MANAWATU, HOROWEKA – Seventeen unplanned and three planned outages have been listed against the feeder. A line condition patrol is required to be completed to identify the fault mechanisms.
VALLEY, GORDON – Twenty one outages occurred, with adverse weather accounting for 83% of the FIDI minutes, primarily from one fault. This feeder has 544 ICPs and one recloser installed. Minor overhead reconstruction works are being undertaken in 2010, with future conductor upgrades planned.
VALLEY, TE POI – Fourteen outages occurred with adverse weather accounting for 91% of the FIDI minutes primarily from one fault. This feeder has 784 ICPs and two reclosers installed. Minor overhead reconstruction and conductor upgrades works are planned for FY2012.
VALLEY, WAIHI NORTH – Twelve outages occurred, with adverse weather accounting for 78% of the FIDI minutes, primarily from one fault. This feeder has 242 ICPs. Minor overhead reconstruction is planned for FY2010 and new recloser for FY2011.
MASTERTON, LONGBUSH – Eleven unplanned and eleven planned outages have been listed against the feeder. Major reconstruction work has been carried. No further work is planned for FY2011.
VALLEY, WARDVILLE – Ten outages occurred, with adverse weather accounting for 95% of the FIDI minutes, primarily from one fault. This feeder has 345 ICPs and one recloser installed. Minor overhead reconstruction and conductor upgrades works are planned for FY2011.
VALLEY, STATION RD – Nine outages occurred, with adverse weather accounting for 96% of the FIDI minutes, primarily from one fault. This feeder has 277 ICPs. A recloser is planned for 2013.
TAURANGA, OTAMARAKAU – Thirty-two outages occurred, with foreign interference and tree contacts being 60% and 34% respectively. The largest fault resulted from a car vs pole. This feeder has 1,040 ICPs and one recloser installed. FY2010 projects include two new loop automation reclosers, major overhead reconstruction and completion of two link-line projects. A new zone substation is also planned for FY2012.

Return to Index 187ASSET MANAGEMENT PLAN ELECTRICITY NETWORKS FY2010 – FY2019
TAURANGA, MATAKANA RD – Ten outages occurred, with adverse weather foreign interference being 52% and 22% respectively, the largest fault resulting from adverse weather. This feeder has 260 ICPs and one recloser installed. Major overhead reconstruction and conductor upgrades are underway for FY2010.
TAURANGA, KAIMAI DRIVE – Forty-one outages occurred, with planned shutdowns (totalling 24) and adverse weather being 29% and 22% respectively. The largest fault resulted from adverse weather eroding the foundations of a pole site causing it to collapse. This feeder has 1,310 ICPs, 130kms of network, two reclosers, and two sectionalisers installed. Major overhead reconstruction is planned in 2012, and new Xiria circuit-breakers are to be installed in FY2011 to move 200 ICPs on to an adjacent feeder. A new zone substation is also planned for FY2015.
TARANAKI, OTAKEHO – A total of 24 outages occurred, with 12 planned shutdowns comprising 60% of the FIDI. Line reconductoring and reconstruction is under way. No further work is planned after this.
TAURANGA, PAENGAROA – Twenty-six outages occurred, with tree contacts and planned shutdowns (totalling 15) being 35% and 32% respectively. The largest fault resulted from trees on lines during a stormy period. This feeder has 940 ICPs, two reclosers and remote open point installed, and minor overhead reconstruction works planned for in FY2010. A new zone substation is also planned for FY2012.
VALLEY, AWAITI – Thirteen outages occurred, with defective equipment and adverse weather being 42% and 28% respectively. The largest fault caused during a stormy period. Major conductor upgrade work is planned in FY2011.
MANAWATU, COONOOR – Eighteen unplanned and two planned outages have been listed against the feeder. A line condition patrol is required to be completed on the feeder to identify the fault mechanisms.
MANAWATU, TIRAUMEA – Eight unplanned and two planned outages have been listed against the feeder. A line condition patrol has been completed.
TARANAKI, WHAKAMARA – Seven faults and three planned shutdowns have occurred on this feeder. The largest fault was due to a tree falling through the line causing 50% of the FIDI. Overhead line reconstruction is planned for FY10.
VALLEY, LICHFIELD – Fifteen outages occurred, with defective equipment and unknown cause being 45% and 39% respectively, and the largest fault from a overhead jumper failure. This feeder has 400 ICPs, one recloser installed, and minor overhead reconstruction works planned for in FY2010.
VALLEY, KEREONE – Nineteen outages occurred, with adverse weather accounting for 76% of the FIDI minutes, primarily from one fault. This feeder has 673 ICPs and two reclosers installed. Major conductor upgrade work is planned in FY2011.
Feeder Class F5 FIDI8.5.5.
Worst Performing Feeders - Class F5
FID
I Min
utes
0
1,000
500
1,500
2,500
2,000
Unplanned Planned Threshold
Irira
ngi
Tutu
rum
uri
Coa
st R
oad
Cas
tlep
oint
Man
gap
akeh
a
Bla
irlog
ie
Wer
aiti
Figure 8.11: Worst Performing Feeders – Class F5.
WANGANUI, IRRANGI - Five unplanned and 22 planned outages were listed against the feeder. One unplanned outage was of long duration time due to no access into the fault area due to a heavy snowfall. Major reconstruction work and recloser upgrades have been completed on the feeder. No further work is planned for FY2011.
MASTERTON, TUTURUMURI – Ten unplanned and three planned outages have been listed against the feeder. A line condition patrol has been completed. Line maintenance has been carried out in FY2009. No further work is planned for FY2011.
MANAWATU, COAST ROAD – Ten unplanned and three planned outages have been listed against the feeder. A line condition patrol has been completed. Line maintenance has been carried out in FY2009. No further work is planned for FY2011.
MASTERTON, CASTLEPOINT – Thirteen unplanned and four planned outages have been listed against the feeder. A line condition patrol has been completed. Line maintenance and tree trimming has been carried out in FY 2010. No further work is planned for FY2011.
MASTERTON, MANAPAKEHA – Four unplanned and two planned outages have been listed against the feeder. Trees were identified as the fault mechanism and have been cleared from the feeder. No further work is planned in FY2011.

Return to Index188 ASSET MANAGEMENT PLAN ELECTRICITY NETWORKS FY2010 – FY2019
Numbers of Customers per Feeder8.5.6.
Feeders by Number of Customers Supplied
0-400 401-800 801-1200 1201-1600 1601-2000 2001-2400
Num
ber
of F
eed
ers
Customer Count by Feeder
0%
10%
20%
30%
40%
50%
60%
70%
80%
90%
100%
Wanganui Wairarapa Valley Tauranga Taranaki
Feeders by Number of Customers Supplied
0
50
100
150
200
250
300
0-400 401-800 801-1200 1201-1600 1601-2000 2001-2400
Num
ber
of F
eed
ers
Customer Count by Feeder F5 F4 F3/F4 F3 F2 F1
Bisect these feeders
Manawatu
Figure 8.12: Numbers of Customers per Feeder.
As stated in Sections 4.2 and 7.3, Powerco tries to limit the number of customers per feeder to between 1200 and 1500. The numbers of customers per feeder are shown in Figure 8.12. Emphasis is given in the Development Plan to splitting the feeders with high customer numbers (inside the maroon ring) through new distribution feeders and zone substations.
Reliability Actions Summary8.5.7.
As a result of the analysis in 8.5.2 to 8.5.6, the following actions are being considered for inclusion in the FY11 works plan and future works plans.
Proposed Works Plan Action Feeder
Fit Recloser Manaia, Taranaki; Linton, Manawatu; Moturoa 5, Taranaki; Bell Block 8, Taranaki; 18th Ave, Tauranga; Port Rd, Valley; Bellevue Rd, Tauranga; Ohauiti, Tauranga; Wairoa, Tauranga; Waihi North, Valley; Otamarakau, Tauranga; Queen St, Valley
Line Reconstruction Matapu, Taranaki; Kopu, Valley; Linton, Manawatu; Newton St, Tauranga; Aerodrome Rd, Tauranga; Queen St, Valley; Mural Town, Tauranga; Pahiatua, Manawatu; Port Rd, Valley; Shaw Ave, Valley; Bureta Rd, Tauranga; Tara Rd, Tauranga; Welcome Bay, Tauranga; Bellevue Rd, Tauranga; Wairoa, Tauranga; Ohauiti, Tauranga; Ngatea, Valley; Green Park, Tauranga; Moturoa 9; Taranaki; Strathmore, Taranaki; Tirohia, Karangahake Valley; Gordon, Valley; Te Poi, Valley; Waihi North, Valley; Longbush, Wairarapa; Wardville, Valley; Otamarakau, Tauranga; Matakana, Tauranga; Kaimai Drive, Tauranga; Paengaroa, Tauranga; Whakamara, Taranaki; Lichfield, Valley
New Omanu Zone Substation
Newton St, Tauranga; Aerodrome Rd, Tauranga;
New Paengaroa Zone Substation
Otamarakau, Tauranga; Paengaroa, Tauranga
New Pyes Pa Zone Substation
Kaimai Drive, Tauranga
Cable Upgrade Kopu, Valley;
Conductor Replacement
Moturoa 9, Taranaki; Te Poi, Valley; Wardville, Valley; Matakana Rd, Tauranga; Awaiti, Valley; Kereone, Valley
New Link Line Thames Coast, Valley; Purangi, Valley; Otamarakau, Tauranga
Fit Remote Switch Port Rd, Valley; Kaimai Drive, Tauranga; Otamarakau, Tauranga; Thames Coast, Valley
Open Point Reconfiguration
Bent St, Valley
Protection and Control System development Plan8.6.
Protection Systems8.6.1.
Over the past few years, Powerco had conducted a number of reviews and equipment upgrades in the Eastern and Western regions to improve the reliability of its protection systems. Similar reviews and upgrades will continue in conjunction with the planned network developments.

Return to Index 189ASSET MANAGEMENT PLAN ELECTRICITY NETWORKS FY2010 – FY2019
The deterioration of the older electro-mechanical protection equipment begins to influence its reliability after 25-30 years of service. In addition, the older equipment is becoming technically inferior as the variety of functions, such as data acquisition and interrogation now provided by newer systems, are becoming standard features. The replacement programme for ageing equipment is expected to continue over the next decade as many relays in this category are now approaching or have exceeded their useful life.
The growth happening in Tauranga and the demand for faster fault clearance has necessitated an upgrade of older protection schemes. This work is now completed. However, new zone substation and upgrading work to the GXPs requires some realignment of protection systems on the subtransmission network.
In the Palmerston North area, the network has been constructed to allow multiple supplies to various substations. This configuration, coupled with the infeed from the Tararua windfarm, greatly improves the security of supply to the district. However, the existing non-unit protection systems installed in the district have not been designed to fully complement this and several undesirable trippings have occurred. To address this deficiency, unit protection schemes are being implemented.
Powerco has collated the protection configuration technical information from all regions into a single reference database. This has enhanced the management of this key engineering information. Data maintenance and upgrades of this facility will continue.
Dialogue with consumer representation has assisted with installation of fault-finding and fault-isolating equipment in locations having the greatest need.
Table 8.1 summarises scheduled major protection system work required to restore reliability, sensitivity and selectivity to acceptable levels. These are wrapped into larger programmes in Table 8.4.
Table 8.1: Protection Development Plan
Financial Year Region Project Status
2009/10 Manawatu Linton-Turitea TWP 33kV line protection. In progress
2009/10 Manawatu Kairanga-Linton 33kV line protection. in progress
2011/12 Manawatu Feilding 11kV protection upgrade as per Powerco’s Asset Life Cycle Plan.
New
2011/12 Manawatu Fielding 33kV line protection upgrade (part of the planned switchgear replacement).
New
2010 Manawatu Kimbolton 11kV protection upgrade (part of the planned switchgear replacement).
Preliminary design scope completed
2010 Manawatu Bunnythorpe 33kV protection upgrade (part of the planned switchgear replacement).
Design completed
2010/11 Manawatu Kelvin Grove TWP Install 33kV line protection (part of the planned CB installation).
New
2010/11 Manawatu Milson 11kV protection upgrade as per Powerco’s Asset Life Cycle Plan & install transformer differential protection on 2 x 12.5 MVA transformer.
New
2010/11 Manawatu Kairanga 11kV protection upgrade, as per Powerco’s Asset Life Cycle Plan & install transformer differential protection on 2 x 12.5 MVA transformer.
New
2010 Manawatu Main St 33kV protection upgrade (part of the planned switchgear replacement).
Under way
2011/12 Masterton Chapel install 11kV bus coupler protection to achieve AAA level security (part of planned bus coupler CB replacement).
New
2011/12 Masterton Chapel transformer protection upgrade on 2 x 10MVA transformer to achieve AAA level security.
New
2010/11 Masterton Clareville install 33kV line CBs & associated protection to achieve AA+ level security.
New
2011/12 Masterton Clareville 11kV incomer protection upgrade, install transformer differential protection (2 x 7.5 MVA transformer) & install CT’s on bus coupler (change over scheme) and Incomer (additional for TX Diffl Protection) to achieved AA+ level security.
New
2010 Wanganui Arahina 11kV protection upgrade & install transformer differential protection on 1 x 10MVA transformer (part of planned switchgear replacement).
New

Return to Index190 ASSET MANAGEMENT PLAN ELECTRICITY NETWORKS FY2010 – FY2019
Financial Year Region Project Status
2011 Wanganui Hatricks Wharf Install new 33kV line protection (part of the planned switchgear replacement).
In design stage
2010 Wanganui Taihape Install transformer differential protection on 1 x 12.5 MVA transformer (part of planned 33kV CB installation).
New
2010 Wanganui Beach Road protection upgrade (part of the planned switchgear replacement).
Underway
2010 Wanganui Peat St 11kV Incomer protection upgrade to implement fast bus scheme and improve substation level security.
New
2010 Wanganui Kai Iwi protection upgrade as per Powerco’s Asset Life Cycle Plan.
New
2010 Wanganui Waiouru 11kV protection upgrade as per Powerco’s Asset Life Cycle Plan.
New
2011 Wanganui Castlecliff 11kV protection upgrade as per Powerco’s Asset Life Cycle Plan.
New
2012 Wanganui Pukepapa 11kV protection upgrade as per Powerco’s Asset Life Cycle Plan.
New
2010 Taranaki Cambria 33kV line protection upgrade as per Powerco’s Asset Life Cycle Plan and equipment low performance level
New
2011 Taranaki Cambria 11kV protection upgrade as per Powerco’s Asset Life Cycle Plan
New
2010 Taranaki Tasman 33kV line protection & transformer differential protection upgrade (part of the planned switchgear replacement)
Underway
2010 Tauranga Pongakawa install fault locator (distance to fault) Issued
2011 Valley Coromandel install fault locator (distance to fault) New
2010 onwards
All Relay replacement programme
SCADA Systems8.6.2.
The SCADA system is required to provide real-time system control and data acquisition with 24-hour, seven-day availability. SCADA system availability is monitored and managed by the Network Operations Centre (NOC) in close co-operation with Powerco’s Information Technology group for WAN performance issues. The WAN includes back-up routes, which are provided automatically in case a primary communication circuit fails. Each of the communication hubs can act as a regional master station in the event of unrecoverable or extended WAN failure, or as part of a disaster recovery plan. Access to the SCADA for software upgrades or configuration is by way of a permitting system under the control of the NOC.
A small number of zone substation sites do not have full SCADA visibility. Powerco plans to continue upgrading existing substation SCADA facilities and install new SCADA facilities at substations with limited SCADA visibility.
The need for SCADA visibility of Transpower’s circuit-breakers at grid exit points has been identified by the Network Operation Centre. Discussions will be held with Transpower to determine the technical and commercial issues associated with Powerco acquiring SCADA data via Transpower’s proposed ICCP project.

Return to Index 191ASSET MANAGEMENT PLAN ELECTRICITY NETWORKS FY2010 – FY2019
SCADA Master Stations8.6.3.
Powerco’s Eastern and Western electricity networks are monitored and controlled by two separate SCADA systems from different vendors. The Eastern Region’s electricity network SCADA system is an OSI system which went live in 2009. The Western Region Abbey Systems SCADA system uses proprietary, ageing hardware and protocols. This closed architecture, along with limited SCADA functionality, does not provide a suitable platform for enhancing Powerco’s network and monitoring capability.
To address the issues of disparate Master Stations, a second stage of the Master Station project will integrate the Western Region’s Abbey Systems Master Station into the new Master Station. Migration is scheduled to commence in 2010.
Once fully commissioned, a new integrated SCADA Master Stations will provide Powerco with a long-term, stable SCADA Master Station platform that enhances Powerco’s existing safety, operational and business requirements, and provides a platform to readily support any future changes to the requirements of the SCADA system.
Powerco has identified that its communications paths between operational regions is poor and regional communication networks require modernisation to increase data transmission speeds and resilient voice communications.
To facilitate SCADA development within Powerco and to meet the need for a resilient voice system, communication transmission systems are being developed that will deliver inter-area and zone substation Ethernet, serial and voice communications. To this end, the installation of Phase 1 of a Digital Microwave Communications Backbone in the Eastern Region has been instigated. This will link Mikkelsen Rd (a key hub in the Eastern SCADA system) to Te Weraiti (Kaimai Ranges) and then on to Te Keha (Whiritoa), and Paul Rd (Tairua). Future phases of this development will loop up to the top of the Coromandel Peninsula and then back down to Mikkelsen Rd, thereby providing a high-capacity, reliable digital communications network.
Powerco intends to install digital radio communications in the Palmerston North area to enable line differential protection, to enhance meshed subtransmission network performance.
Communication transmission systems will be renewed and developed utilising digital radio, fibre and copper transmission mediums to build an inter-region, high-capacity backbone and to allow the implementation of the DNP3 protocol. This will then enable digital cross-connect ability to zone substation level and provide valuable inter-area communications. The improved management, availability and control that can be seen from a digital transmission system will enable Powerco to provide diverse routing and industry standard communication protocols throughout its operational network.
Tables 8.2 and 8.3 show planned development work on the SCADA and Communications systems. These are wrapped into larger programmes in Table 8.4.
Table 8.2: Communication System Development
Financial Year Region Description
2009 - 2010 Palmerston Install SEL2030.
2009 - 2010 Palmerston Substation Comms
2009 - 2010 Palmerston Digital microwave link between Mihaere Drive and TWP site
2009 - 2010 Taranaki Waitara East Zone Sub phone
2009 - 2010 Taranaki New radio link Waitara West to East Egmont (replacing Waitara East to East Egmont).
2009 - 2010 Taranaki Install new digital radio link between CA hut and Hawera and Brunswick
2009 - 2010 Palmerston SEL and other type of protection relays time-keeping
2009 - 2010 Taranaki Radio repeater Northern Polling -Taranaki
2009 - 2010 Masterton Repeater for SCADA south Wairarapa, Ngawi
2009 - 2010 Taranaki DNP3 implementation in Taranaki
2009 - 2010 Wanganui High Capacity Radio Bearer Wanganui to Palmerston
2009 - 2010 Taranaki Further develop Powerco’s VHF Voice Radio network
2009 - 2010 Tauranga Further develop Powerco’s VHF Voice Radio network
2009 - 2010 Valley Migrate Maungatawhiri and Tokatea to Land Mobile
2010 - 2011 Masterton Provide digital radio link from Morrisons to Hau Nui for the provision of SCADA communications
2010 - 2011 Palmerston High Capacity Radio Bearer Palmerston to Masterton
2010 - 2011 Wanganui Further develop Powerco’s VHF Voice Radio network
2010 - 2011 Valley Further develop Powerco’s VHF Voice Radio network
2010 - 2011 Tauranga Migrate Minden to Land Mobile
2010 - 2011 Valley Migrate Pukeitionga and Mt Te Aroha to Land Mobile
2010 - 2011 Masterton Migrate Ngaumutawa Rd to Land Mobile
2011 - 2012 Palmerston Further develop Powerco’s VHF Voice Radio network
2011 - 2012 Valley Further develop Powerco’s VHF Voice Radio network
2011 - 2012 Valley Migrate Te Keha and Mt Te Weraiti to Land Mobile
2012 - 2013 Masterton Further develop Powerco’s VHF Voice Radio network
Note: The years given in the tables indicate the intended start year for each project. Some projects will be completed in a later year. Multiple years are given for long-term projects.

Return to Index192 ASSET MANAGEMENT PLAN ELECTRICITY NETWORKS FY2010 – FY2019
Table 8.3: SCADA and Automation Development
Financial Year Substation Development Project
2010 Taranaki Migrate Cambria, Eltham, Inglewood and Transpower Stratford RTUs to DNP3
2010 Wanganui Investigate participation in Transpower’s TCCP project to provide SCADA visibility of Transpower’s breakers at Brunswick
2011 Eastern Migrate suitable RTUs to DNP3
2011 Marton Provide SCADA visibility of Transpower’s breakers at Marton GXP
2012 Western Migrate RTUs to DNP3
2012 Eastern Migrate RTUs to DNP3
2013 Western Migrate RTUs to DNP3
2013 Eastern Migrate RTUs to DNP3
2014 Western Migrate RTUs to DNP3
2014 Eastern Migrate RTUs to DNP3
Note: The years given in the tables indicate the intended start year for each project. Some projects will be completed in a later year. Multiple years are given for long-term projects.
Load-control Systems8.6.4.
Powerco has reviewed the levels of signal voltage across the network to ensure correct and reliable operation of load-control receivers. It has been identified that the performance of the load-control system has deteriorated over recent years since ownership of the injection plants and the receivers was split. A programme to replace the load-control injection plants has been identified that uses a low-frequency Decabit platform. Powerco has mandated that all new connections with controllable load shall be capable of being controlled by Powerco’s load-control system.
Metering System Instrument Transformers8.6.5.
Where instrument transformers provide inputs to power meters, development will largely be driven by customer need, such as supply augmentation.
GXP Metering Systems8.6.6.
It is planned to develop GXP Metering systems to monitor power quality and reactive power (the Electricity Commission could mandate adherence to power factor targets at GXPs).
Streetlight Supply and Control Enhancement8.7.
There is growing awareness worldwide of the opportunities for energy, cost and carbon saving by the introduction of Smart technology to public lighting infrastructure. Streetlighting currently operates under an inefficient regime of being either switched on or off. Increasingly, options for more efficient management of streetlighting are being explored by asset owners. These options include automatic dimming during off peak periods, internet- or radio-based signalling protocols, and the use of off-grid sources such as stored PV or wind-generated energy. The introduction of this new technology offers the possibility of streetlighting energy supply and control being removed from electricity distribution companies. For this reason, Powerco will monitor developments of this type, although streetlight control and supply will remain a part of Powerco’s wider Load-control System for the foreseeable future.
Environmental Enhancements8.8.
Strategic Perspective8.8.1.
As part of its environmental policy, Powerco is committed to pursuing continual improvement, and recognises that sound environmental management is consistent with the company’s vision. Powerco is committed to achieving this goal in a manner that prevents or minimises pollution and other adverse impacts on the surrounding environment, and has regard for the interests of the communities in which it operates.
As part of this, Powerco intends to comply with all statutory environmental requirements and other relevant standards and codes, and to maintain its Environmental Management System, which provides a framework for setting and reviewing environmental objectives and targets.
Environmental Site Reviews8.8.2.
Network sites are reviewed for environmental compliance from time to time. A check list is used to gather information, and a risk analysis is undertaken. The main environmental issues arising at network sites are whether the site is appropriately designated, spillage of oil and irritation from neighbours from acoustic noise. Large amounts of oil may be contained on zone substation sites and a risk exists that a spill or leak at these sites may contaminate the surrounding environment.
The check list considers such things as:
District Plan and zonings;•
Site designation;•
Bunding of transformers and tracing evidence of leaks;•
Nearby water courses and ability to contain a spill;•
Surrounding land use; and•
Vicinity of neighbouring residential dwellings.•

Return to Index 193ASSET MANAGEMENT PLAN ELECTRICITY NETWORKS FY2010 – FY2019
Sensitive Sites8.8.3.
Often when lines are constructed across sensitive land such as Department of Conservation estate, special environmental risk plans can be prepared that describe how construction and fire risks will be mitigated.
Powerco has documented procedures that guide what to do if archaeological remains are found.
In a small number of cases, there may be historical grievances with tangata whenua regarding the location of lines in insensitive and inappropriate locations. Cases like this are not simple to resolve and there should be recognition in the regulatory framework for recovering costs for lines to be relocated in such circumstances.
Environmental Action List8.8.4.
Name District
Risk that oil spill on site would contaminate surrounding environment Comments
Maraetai Rd South Waikato HIGH Site is in residential area. Risk that any spills or leaks would enter town stormwater.
Hau Nui South Wairarapa HIGH Very steep slope around site. Site run-off flows directly to farm dam. Significant risk spill or leak would contaminate dam and surrounding paddocks.
Putaruru South Waikato HIGH Evidence of previous leakage from transformer. Some site runoff will enter creek near to site.
Taihape Rangitikei HIGH Run-off from site flows directly into storm water system.
Tower Rd Matamata-Piako HIGH Site is in residential area. Risk that any spills or leaks would enter town stormwater.
Akura Masterton HIGH Run-off from site flows to nearby creek.
Walton Matamata-Piako HIGH Evidence of previous leakage from transformer. Site adjacent to sloping area. Some site run-off will enter creek near to site.
Pongaroa Tararua HIGH Run-off from site flows to nearby creek.
Arahina Rangitikei HIGH Run-off from site flows to nearby creek.
Waihi Beach Western Bay of Plenty
MEDIUM Site adjacent to sloping area. Risk that some site run-off will enter gully near to site.
Wanganui East Wanganui MEDIUM Run-off from site flows to nearby creek.
Name District
Risk that oil spill on site would contaminate surrounding environment Comments
Cardiff Stratford MEDIUM Run-off from site flows to nearby gully.
Waihi Hauraki MEDIUM Site adjacent to sloping area. Risk that some site run-off could contaminate surrounding area.
Tinui Masterton MEDIUM Run-off from site flows to nearby creek.
Alfredton Tararua MEDIUM
Featherston South Wairarapa MEDIUM
Kempton South Wairarapa MEDIUM
Norfolk Carterton MEDIUM
Te Ore Ore Masterton MEDIUM
Paeroa Hauraki LOW Spills could be managed with spill kits. Low risk of run-off contaminating surrounds.
Farmer Rd Matamata-Piako LOW Spills could be managed with spill kits. Low risk of run-off contaminating surrounds.
Mikkelsen Rd Matamata-Piako LOW Spills could be managed with spill kits. Low risk of run-off contaminating surrounds.
Piako Matamata-Piako LOW Spills could be managed with spill kits. Low risk of run-off contaminating surrounds.
Tahuna Matamata-Piako LOW Spills could be managed with spill kits. Low risk of run-off contaminating surrounds.
Browne St Matamata-Piako LOW Spills could be managed with spill kits. Low risk of run-off contaminating surrounds.
Martinborough South Wairarapa LOW Spills could be managed with spill kits. Low risk of run-off contaminating surrounds.
Tuhitarata South Wairarapa LOW Spills could be managed with spill kits. Low risk of run-off contaminating surrounds.
Parkville Tararua LOW Spills could be managed with spill kits. Low risk of run-off contaminating surrounds.
Sanson Manawatu LOW Spills could be managed with spill kits. Low risk of run-off contaminating surrounds.
Awatoitoi Masterton LOW Spills could be managed with spill kits. Low risk of run-off contaminating surrounds.
Gladstone Carterton LOW Spills could be managed with spill kits. Low risk of run-off contaminating surrounds.

Return to Index194 ASSET MANAGEMENT PLAN ELECTRICITY NETWORKS FY2010 – FY2019
Name District
Risk that oil spill on site would contaminate surrounding environment Comments
Bulls Rangitikei LOW Spills could be managed with spill kits. Low risk of run-off contaminating surrounds.
Pukepapa Rangitikei LOW Spills could be managed with spill kits. Low risk of run-off contaminating surrounds.
Rata Rangitikei LOW Spills could be managed with spill kits. Low risk of run-off contaminating surrounds.
Peat St Wanganui LOW Spills could be managed with spill kits. Low risk of run-off contaminating surrounds.
Waiouru Ruapehu LOW Spills could be managed with spill kits. Low risk of run-off contaminating surrounds.
Coromandel Thames-Coromandel
LOW Spills could be managed with spill kits. Low risk of run-off contaminating surrounds.
Substations designated HIGH risk constitute a significant risk that a leak or spill on site may result in discharge that may cause environmental harm, in breach of the Resource Management Act. It is recommended that the installation of transformer bunding at these sites be addressed in the future works programme at the earliest possible convenience.
Substations designated MEDIUM pose a much lesser risk that a leak or spill onsite may result in discharge that may cause environmental harm. It is recommended that the installation of transformer bunding at these sites be addressed in the future works programme as funding permits, or should be considered in the event of any other works being carried out at these sites.
Those substations designated as LOW risk do not pose a significant risk of a leak or spill on site resulting in discharge that may cause environmental harm, provided spill kits are available on site for emergency use.
Safety Enhancements8.9.
Safety enhancement programmes are driven from a variety of perspectives and sources. They are generally approached with risk-based techniques.
Health & Safety Plan8.9.1.
The purpose of the Health & Safety Plan is to document the proposed pathway we will take to execute and improve all areas of our health and safety performance. The main areas of focus in currently are as follows;
Committed Safety Culture•
Ensure that all Powerco Managers are aware health and safety is their responsibility, •and promote safety and wellness with all our employees
Contractors that Ascribe to “Safety First – Business Always”•
Focus on the contractor approval process and develop framework for assessing our •Training providers.
Continuous Improvement Focus to the Safe Design of the Networks•
On going identification and assessment process of risks on the network•
Review any past incidents and identify any engineering improvements that could be •implemented.
Safe Systems and Processes•
Ensure the safety systems are being managed in accordance to AS/NZS4801:2001 •which is audited using the ACC WSMP programme.
Follow industry dictated safety management systems.•
Good Information and Analysis Regarding our Safety Performance•
Improved focus on leading indicators. Develop improved reporting and investigations •processes.
Network Incident Register8.9.2.
The Network Incident Register is a database of network incidents, incident investigation reports and lists of actions to close out report recommendations. The incidents range through protection system mal-operations, switching errors, electric shock or contact by public, serious near-miss incidents and serious injuries by contract staff. Meetings are held at six-weekly intervals at senior management level to discuss investigation findings and implementation of actions pursuant to the investigations. Generally, the investigation findings are related to process or standards. Occasionally, the investigations result in retrospective upgrades of equipment deemed to be unsafe. Examples include:
A certain design of transformer tank breather fitted, whereby minimum approach •distances are encroached while the silica gel is changed;
Prevention of the use of cable joints in zone substation cable basements;•
Maintenance upgrade of a certain batch of vacuum circuit-breaker bottles;•
Need for distributed generation backfeed protection;•
Replacement of a certain quality of cable sealing ends; and •
Investigation of methods of detecting LV phase or neutral breakage or preventing the •effects.
Return to Index 195ASSET MANAGEMENT PLAN ELECTRICITY NETWORKS FY2010 – FY2019
Red Pin Defect process 8.9.3.
The Network Operations team can place “do not operate” orders on equipment if it is suspected to be unsafe. Tags are placed on SCADA and on network operational schematics until the equipment has been repaired and returned to normal service. This results in renewal and maintenance actions rather than enhancement actions.
Zone Sub Integrity Assessment 8.9.4.
Semi regular site inspections are undertaken to review the robustness, integrity, durability and operational reliability of zone substations. The aim is that sites:
Are safe and comply with legislative safety standards; •
Remain operational should an extreme event occur; •
Are appropriately secure against unauthorised entry; and •
Meet legal and environmental requirements and obligations consistent with •Powerco’s values.
Issues covered by the integrity assessments include:
Site configuration and buildings, including review of compliance with required •clearances to live equipment;
Physical site security (fences secure, locks adequate);•
Earthing systems - integrity of earthing system and mitigation of risk of life and •property from step and touch voltages;
Oil containment and operational noise (these are covered in section 8.8);•
Segregation of cables and trenches;•
Protection against earthquakes, fire, extreme weather events, floods;•
Health and safety such, as presence of asbestos and containment of batteries. •
Examples of the enhancement work that results from these reviews include:
Erection of barriers around equipment that does not meet required safety •clearances;
Fence upgrades;•
Earthing system upgrades; and •
Installation of acoustic noise abatement equipment. •
Switchgear replacements 8.9.5.
Whilst not strictly enhancements, certain types of distribution switchgear have been regarded as operationally risky for Its site. Focus on replacing distribution switchgear occurs when the switch is located at a network normally open point or in a confined space. Risk analysis is done to determine if a switch should be replaced due to safety or whether it should be operated in a “dead” configuration.
LV Switchgear and Pillar replacements 8.9.6.
Also while not strictly enhancements, work is done to replace and upgrade Low Voltage street pillars that are considered to be unsafe to members of the public. Low Voltage switchgear in certain distribution substations are also to be upgraded to allow the safer changeover of supply between transformers.
New Equipment Trials8.9.7.
New equipment, such as switches, undergo a process of trial by committee (Network Advisory Team). This is where experienced engineers and field personnel get together for the purpose of inspecting a piece of equipment for approval on the network. This process results in a report recommending the use, non-use or conditional use of a piece of equipment.
Smart network Implementation 8.10.
Previous Asset Management plans have recognised the challenges of managing ageing assets and increasing consumer expectations for network reliability. Management of the ageing network will require improved information to enable reduced fault restorations times and increased asset utilisation, and enabling improved inter-operability with embedded generators. In other words, we are having to work the existing assets harder and need to recover more quickly in the event of network plant failure while maintaining a balance with economic business objectives. The consequence of greater reliance of improved information will require an up-skilled workforce to facilitate the improvement in network reliability.
“Smart Grid” Definition8.10.1.
The terms “Smart Grid” and “Smart Networks” are used to describe a concept that encompasses a number of existing Powerco initiatives. The Smart Network concept is aimed at enabling interactions between various network elements, including embedded generation, network components and customers, as well as network operations and management.
The Smart Network has been defined as a dynamic network for two-way linking of dispersed energy sources and end-use customers, providing more dynamic information to customers with the capacity to alter their demand behaviour.
The Smart Network aims to improve performance by providing enhanced status information, automatic detection and correction of network problems (self-healing) and the provision of information to facilitate better asset utilisation and optimisation of asset replacement investment. A Smart Grid facilitates improved market interactions between consumers and suppliers enabling information interchange.
The objectives that are widely suggested for Smart Grids by vendors and other utilities are also aligned with the business needs of the Powerco business as defined in Section 2.

Return to Index196 ASSET MANAGEMENT PLAN ELECTRICITY NETWORKS FY2010 – FY2019
A business strategy that includes the adoption of the Smart Grid concept could improve network reliability and performance and assist in achieving current business objectives.
Powerco has historically not invested heavily in research and development but the opportunity exists to adopt a technology direction that is being tested and proven by other utilities. The opportunity exists within the current investment programme to take advantage of new technologies and “future proof” the network and to cope with the demands from community, regulators and government in a future carbon-constrained environment.
Technology8.10.2.
Smart Grid technology is characterised by the establishment of the two-way flow of information to create an automated widely distributed energy network. It incorporates the ability to deliver real-time information and facilitate the balance of demand and supply at the device level.
The key under-pinning technology domains that support the introduction of Smart Grids as they are at present include:
Communication architecture •
Communication protocols•
Advanced metering infrastructure•
Network automation to enable Smart Grid Self-Healing Networks•
Distributed generation/micro-grids•
Communication architecture
Smart Grid architecture can be supported by many communication technologies from mobile, wide area networks (WAN) and local area networks (LAN). Smart Grid architecture should be flexible to incorporate other communications architectures as those technologies arise. The key requirements for Smart Grid communications architectures are quality of service, availability and coverage, response timing, and data accuracy. The technology to support Smart Grid communications is presently available, However, communication availability may be partly dependent on third-party communication service providers and the extent of their networks. Further enhancement of the Powerco communications infrastructure will provide advantages now for Asset Management and for future implementation of the Smart Grid concept.
Communication Protocols
Communication protocols provide the common language for systems and equipment to talk to each other and the protocols and features envisaged for Smart Grids are contained within the IEC61850. However, DNP3 is the dominant protocol in substation automation (designed for low bandwidth SCADA applications, developed in the 1970s and, due to its vintage, lacks the flexibility afforded to new protocols in the market place), but it lacks some of the features envisioned for Smart Grids. IEC61850 organises power system data in a manner that is logical without additional
description. The logical assembly of data facilitates the management of large data sets within substation automation systems. In addition, the IEC61850 model, if applied to distribution networks beyond the substation, may allow the data to be managed efficiently. IEC61850 is currently being revised by the standards committee for deployment beyond the substation, including inter-substation communications. Even though many legacy substations contain secondary systems with DNP3 or other protocols, the organisation of power system data can be managed via protocol translators to IEC61850. At semi regular intervals, Powerco reviews the ability of substation equipment to accommodate the communication protocol requirements for Smart Grid implementation.
advanced Metering Infrastructure
Advanced Metering Infrastructure (AMI) represents the next phase of automatic meter reading, whereby the meter is responsive to two-way communications dynamically adjusting for the price of electricity, and interlacing with various loads in the metered facility. The AMI enables the “smart home”, bringing such technology such as:
Real-time pricing/hour•
Direct load-control/optimisation•
Load monitoring/sub-metering•
Remote connect/disconnect•
Outage detection and isolation•
Demand profiles•
Advanced metering infrastructure must be installed to meet the system and information needs of Powerco even if the end-consumers using the technology are not direct Powerco customers. The pilot programme to meter the customer supply transformer (the present Powerco customer interface) is aligned with the Advanced Metering Infrastructure concept and meets the current Powerco needs for improved information on transformer loading to assist in Asset Management. Powerco’s relationship with the meter owners gives the ability to obtain data on the power usage, power factor and power quality of customers with advanced meters installed.
Network automation to Support Self-healing Networks
Implementation of a Smart Grid, self-healing network requires key automated transmission and distribution systems components all operating in a co-ordinated, efficient and reliable manner. A self-healing system manages emergency conditions on a power system with predictive capability (operational and functional) with the system functionality to correct/bypass predicted and detected network problems. Self-healing grids require alternative network paths to provide customers power needs, where the self-healing grid implementation is custom-designed to meet the specific customer wants. One of the existing barriers to implementation of self-healing networks for many areas in Powerco’s network is the lack of feeder interconnections, particularly in typical rural regions, let alone the communications and high-level software to undertake
Return to Index 197ASSET MANAGEMENT PLAN ELECTRICITY NETWORKS FY2010 – FY2019
self healing operations. It should be noted that other line reliability factors must be addressed in parallel.
Distributed generation/micro-grids
Distributed generation/micro-grids include the integration of power generation, such as solar wind, and micro-turbines, energy demand via demand response, controllable loads and direct load-control. Battery and inverter technology is evolving such that the capital investment to buy energy at low cost during low-demand periods and release energy in high-demand periods to maximise revenue is becoming economically viable. Micro-grids present a challenge from a protection and control perspective. That is new protection and control philosophies will need to be developed. Distributed generation/micro-grids represent a significant change in distribution network design due to the potential for bidirectional power flows, which at present is in the infancy stage of development. Powerco have shown that, when applied to remote rural sites, distributed generation/micro-grid supplies can be a cost-effective alternative to renewing lines.
Standards8.10.3.
The Smart Gird concept is in an infancy stage and standards for understanding, let alone implementing Smart Grids are presently in development in the US and Europe only. However, communication systems and protocols to support implementation of Smart Grids are well developed, even though it is not specific to the concept or application. Common international standards on information for advanced metering infrastructure have not been developed but are presently under development in the US with the National Institute of Standards and Technology. There does not appear to be any relevant work presently under way in New Zealand or Australia on the development of new Smart Grid specific standards.
Consumer Information Pricing8.10.4.
In theory, customers can balance their energy consumption with the real time supply of energy. Variable pricing could provide consumer incentives to install their own infrastructure. The infrastructure takes advantage of low-priced energy in off-peak, but also minimises the consumption of high-priced energy in peak conditions. The distribution model within Powerco may support some consumer information pricing, where customers have access to information via alternative means including the internet. Customers may change their behaviour with software agents that have scheduling and price trigger mechanisms.
Drivers for Implementation8.10.5.
The main driver for implementing the Smart Grid concept in Powerco is to increase the reliability and utilisation of the network and its ability to deliver reliable supply to customers within an increasingly carbon-constrained based economy. The carbon-constrained economy in New Zealand is likely to include the need for:
Enhanced information for consumers on energy usage. This is not a direct impact on •Powerco at present but is expected to increase in future years;
Higher demands on network reliability, with higher levels of embedded generation;•
Increased local renewable energy with intermittent generation characteristics;•
Implementation of electric and hybrid vehicles charging, and possible energy •storage;
The capacity to shift peak loads to reduce peak demand capacity requirements;•
Enhanced Asset Management monitoring of the distribution network, resulting in •deferred replacement investment;
Deeper visualisation and control of distribution network may increase resource •flexibility and utilisation;
Enhanced asset monitoring reducing fault response times; and•
Improved workforce deployment and field-based automation.•
The advantages and capabilities of Smart Grids are aligned with Powerco business objectives and it is prudent to consider the steps required to implement the concept within the network. The next section defines a roadmap for implementation of Smart Grids within the Powerco network.
A Smart Grid Roadmap for Powerco8.10.6.
The Smart Grid roadmap is intended to encompass existing Powerco asset refurbishment programmes and augmentation where possible, and aims to align future expenditure with the needs of a future “smart” Powerco network that may be driven by Regulators, government or other stakeholders. The roadmap includes recognition of the logistical and technical challenges associated with the migration of an electrical grid with one-way power flows from central generators to dispersed loads to a grid that encompasses two-way power flows and customer interaction that is two-way and peer-to-peer. The logistical challenges include the large number of stakeholders, high complexity, change management, standards, security and regulation. The technical challenges are the availability of skilled staff able to maintain and operate a complicated multi-directional power system, “smart” equipment and suitable communication systems, data management, cyber security, data and privacy and software applications.
The ultimate “destination” for Smart Grid technology is still evolving to meet the needs of stakeholders, including regulators, manufacturers, utilities and end-users and it is likely that early adopters will undertake a higher risk of implementation. The development of standards, regulations and customer requirements will continue to shape the Smart Grid roadmap. It is therefore prudent for Powerco not to adopt an aggressive, leading position in implementation, as has been noted with the approach of other utilities in the country. However, it is also prudent for Powerco not to take a “head in the sand” approach to the concept and its evolution.

Return to Index198 ASSET MANAGEMENT PLAN ELECTRICITY NETWORKS FY2010 – FY2019
Smart Grid development will be influenced by the needs of customers (end users who may also generate, store and manage), markets (operators and participants in markets), service providers (organisations providing service to customers and utilities), operations (managers of electricity movement), bulk generation (generators of electricity for bulk movement), transmission (carriers of electricity over long distances) and distribution (distributors of electricity to and from customers).
The future of Smart Grid technologies is presently being driven primarily by regulators. Some regulators are demanding that Smart Grids provide sustainable options to customers, allowing customers to make sustainable decisions on the use of electricity. On that basis, utilities must move and consider Smart Grids to achieve objectives, such as, security, reliability and efficiency. However, longer-term objectives may include efficient meter-reading and billing, better customer service, load scheduling, load shifting, load forecasting and asset management. The future for Smart Grids may include other drivers as Smart Grid systems and strategies are implemented and the needs of customers evolve to the next generation of Smart Grid technology and strategy.
Field ForceAutomation
Smart GridSubstation
SCADAReady
Powerco Are Here
RoadmapStart
Roadmap Start
CommunicationInfrastruture
AdvancedMetering
Infrastructure
EmbeddedGeneration
Control
MicroGrids
You HaveArrived
Distribution Infrastructure
Communication/SCADA Infrastructure
Field Force Automation
Smart Grid Arrival
Action
Status
Smart Grid Roadmap
Time
Tech
nolo
gy E
olut
ion
IntegrateResources Planning /
SCADA Data andSystems
CommunicationSystems Implementation
ImplementDistribution
Interconnectors
AMIInstallation
Upgrade SCADA
PowerData
Integration
Figure 8.13: Smart Grid Roadmap
Powerco is presently in the infancy stage of the roadmap path for Smart Grid implementation. The SCADA upgrade at substations will position Powerco to undertake the next phase of Smart Grid implementation. The replacement of legacy SCADA systems is a positive step towards Smart Grid adoption as legacy SCADA systems are unlikely to support the data needs for a Smart Grid. Powerco’s position is not
substantially different to other distributors where most are considering the definition of Smart Grids and are establishing a strategy to move forward to meet the changing market environment.
Summary8.10.7.
Higher demands from Regulators and, in future, customers are likely to result in the need to enhance the existing Powerco SCADA and network infrastructure to facilitate higher levels of communication flow and network automation. The existing Powerco network infrastructure is ageing and replacement and refurbishment is managed within the current Asset Management Plan.
There is a potential benefit to be gained in a watchful, cautiously phased implementation of some Smart Grid concepts within the Powerco Asset Management Plan. This strategy is aimed at placing Powerco in a competitive position, ready to adapt to new stakeholder demands and able to take advantage of opportunities that may arise, while being conservative, minimising the obsolescence risk associated with early adoption.
Opportunities Implementation Risks
• Provisionofenhancedservicestolinkgenerators and consumers;
• EnhancedAssetManagementallowingassets to be pushed harder with better information;
• Improvedmaintenanceoptimisationandeffectiveness;
• Increasedcostsofrefurbishment,wherebrownfield design and construction costs are higher than greenfield;
• Technologypromisesofvendorsarenotrealised;
• IncreasedmaintenancecostforSmartGrid equipment;
• Whensomethinggoeswrong,itgoeswrong in a bigger way;
• Regulatoryconstraints.
The proposed Powerco Smart Grid roadmap is intended to supplement the existing asset strategy to align replacement, augmentation and refurbishment programmes with the requirements for establishing the foundations of a Smart Grid framework. This approach is intended to improve existing system reliability and responsiveness but is substantially aimed at alignment for future needs and creating option value. Powerco is in an excellent position to take advantage of the experience of other utilities in the region with low risk of adoption of technologies that later prove to be incompatible with future needs.
A moderate increase in future capital expenditure is proposed in the following areas:
Configuration and capacity of certain parts of the network for increased inter-•connectability;
Increased levels of field device automation and SCADA;•

Return to Index 199ASSET MANAGEMENT PLAN ELECTRICITY NETWORKS FY2010 – FY2019
Integration of in-field IT systems, such as work despatch and hand-held inspection •devices;
Implementation and expansion of distribution and customer interface transformer •metering, and consolidation of relationships with customer meter owners;
Alignment of communications network and standard protocols for alignment with •future Smart Grid.
Specifically, the following strategies are proposed:
Preparation of an optical fibre development plan, laying of fibre ducts with new •subtransmission cable circuits, and consideration of including optical fibre in subtransmission lines (OPGW) to assist in providing a communication backbone;
Moving towards IEC61850 compliance in substation specification and standards for •relays and control equipment;
Review Powerco information technology and field automation standards for •alignment with Smart Grid communications and operability requirements;
Initiate discussions with stakeholders and the Regulator on opportunities for •Powerco to undertake additional services and augmentation.
network Enhancement Project Summary8.11.
Reliability, Safety and Environment project summaries from FY11 to FY15 are provided in Table 8.4. The FY11 to 15 project summaries come from the Improvement Register. The FY11 to FY15 projects are assessed using a multi-stakeholder assessment process (known as Coin), whereby the projects are reviewed against a set of four strategic objectives representing stakeholder needs under which constraints are applied. The objectives are set out in Section 2.6.
The total expenditure amounts in Table 8.4 can be seen to confirm the forecast expenditures in Section 9.4.
descriptions of key Projects8.12.
The following is a detailed description of the large projects currently under way and proposed for the next twelve months. It covers the options considered and a summary of the project difficulties encountered.
Thames Coast to Manaia Link8.12.1.
Total Cost: $0 .8m Project Status: Feasibility Forecast accuracy: +/- 20%
A high number of faults have historically been recorded on cable sections of the Thames Coast Feeder. This feeder supplies customers on the Coromandel Peninsula coast north of Thames, and has in excess of 1600 customers. There Is no present supply back up route so whenever there is a fault, the customers supplied by this feeder have experience a long supply interruption, sometimes in excess of twenty hours.
Alternative options considered include use of permanent or temporary diesel generation to supply the customers and additional reclosers to sectionalise the feeder. Reclosers have already been implemented to a high extent already and further application will not yield significant extra benefits. An ABS with tails to permit the connection of temporary generation has been installed but operationally it has been found to be a difficult call to hire temporary generation due to the eight hour lead times and expense involved. Installing permanent Diesel Generation has not been ruled out but it is expensive to install and operate.
The project is to link the Thames Coast feeder with the Manaia feeder which is supplied from Coromandel. The two feeders do not meet and a length of new line 1.5km long needs to be constructed. However the ends of these feeders comprise two wire line of light conductor that needs to be upgraded to three wire line of medium conductor.
The major obstacle with this project is the acquisition of consents and easements to enable the work to begin. This has been taking several years to accomplish.
Putaruru Second Circuit 8.12.2.
Total Cost: $2 .0m Project Status: Pre Feasibility Forecast accuracy: +/- 25%
A second circuit to supply Putaruru comes about because Putaruru has a high risk of extensive SAIDI minutes caused by a line fault. There is presently no available form of alternative supply to the area. The proposal is to construct a new GXP at Putaruru which will supply the area and enable an alternative form of supply to back up the Hinuera GXP, which itself is supplied by only a single 110kV circuit. A new circuit is included in the programme to connect the new GXP to the Putaruru zone substation.
Alternative options include duplicating the line supplying Hinuera (Transpower) and constructing a second line from Hinuera to Putaruru, building a line from Litchfield GXP, taking supply for a new GXP at Arapuni, and diesel generation. The first option (duplicate lines) is, in economic terms, a more costly option overall. The Litchfield option would require step up transformers, and involves a long distance of line construction and limitations to the amount of capacity available. The volt drop across the lines from a new GXP at Arapuni would be too great when backfeeding Hinuera (capacitors could reduce this but load growth would rapidly cancel the benefits out).
Project difficulties include obtaining consents and landowner agreements, and obtaining easements.
Coroglen Kaimarama 110kV Line 8.12.3.
Total Cost: $2 .0m Project Status: Easement & Consent acquisition Forecast accuracy: +/- 20%
Whitianga and Coromandel Substation have approximately 7,000 and 2,200 customers respectively that are supplied from a single 66kV circuit supplied from Transpower’s Kopu GXP. The circuit can be backfed as far as Coroglen during moderate loading,

Return to Index200 ASSET MANAGEMENT PLAN ELECTRICITY NETWORKS FY2010 – FY2019
but there is no alternative supply if a fault should occur north of Coroglen. Coromandel Substation is supplied from Whitianga Substation on a spur circuit.
By constructing approximately 10km of 66/110kV overhead line between Coroglen and Kaimarama, this will provide a ring feed supply to Whitianga, hence increasing supply reliability and improving voltage regulation at Whitianga and Coromandel Substations. Later in this decade, it is proposed to construct the circuit to an operating voltage of 110kV to allow for future increase in load growth in the area. The line will therefore be constructed with 110kV capability, but operate in the interim at 66kV.
Alternative options are to do nothing and to install banks of diesel generation. Doing nothing has been seriously considered but with the deterioration of the existing line, there are some renewal tasks that cannot be done live line and any planned shutdowns would be of intolerable length. Furthermore, growth is forecast to be high, with Whitianga forecast to have the population of Masterton in 2025. Generation options are limited because of limited fuel availability. There is some potential for run of the river hydro but the resource available is small.
The consent process has been a long and drawn out process. After five years, it is nearing an end, leaving the way open for easement acquisition and finally construction.
Miscellaneous Cable Installations and Links8.12.4.
Total Cost: $1 .9m Project Status: Ongoing Forecast accuracy: +/- 20%
This item is a programme comprising many small projects aimed at increasing the levels of interconnection between feeders. This is in line with the “reduce CAIDI through automation” and “reduce CAIDI through adequate back up supply options” tactical focus areas.
Miscellaneous Series 1 Switch Replacements 8.12.5.
Total Cost: $4 .0m Project Status: Ongoing Forecast accuracy: +/- 20%
This item is a programme comprising many small projects aimed at phasing out higher risk profile Andelect / ABB Series 1 oil filled switches, Magnefix switchgear located in damp environments and J2 / ETV2 Long and Crawford and earlier models. The programme targets the switches located at normally open points and switches in confined spaces. While more of a renewal programme, it is included as a Reliability, Safety and Environment investment due to its driver.
Coromandel Second Transformer Bank8.12.6.
Total Cost: $1 .5m Project Status: Feasibility Forecast accuracy: +/- 20%
A second transformer is proposed at Coromandel because it is difficult to take this transformer out of service for maintenance since there is no other form of back feed into the area. Secondly, the transformer tap changer itself faces a tough working life because of the large volt drop and long subtransmission line distance - this
implies closer spaced maintenance routines and increased risk of failure. The second transformer allows a shuffle to occur amongst other 66/11kV transformers.
Alternative options include installing generation but these are expensive to implement and operate. The option of doing nothing involves lengthy regular shut downs for maintenance that are difficult to arrange with the community and consume valuable planned outage SAIDI allowances. A lead time of around twelve months is expected for order and delivery of the transformer.
Miscellaneous Noja installations and Recloser Upgrades8.12.7.
Total Cost: $5 .4m Project Status: Ongoing Forecast accuracy: +/- 20%
This is a programme of work comprising many small projects comprising installing reclosers capable of loop automation and SCADerising network switches. The aim of the programme is to improve SAIFI and CAIDI by reducing the exposure of customers to interruptions (yellow and green part of Figure 8.2), improving the restoration times to most customers through loop automation and remote control (blue and indigo part of Figure 8.2).
Miscellaneous Protection Upgrades8.12.8.
Total Cost: $1 .5m Project Status: Ongoing Forecast accuracy: +/- 20%
This is a programme of work that includes the protection replacements and upgrades described in Section 8.6.
Thames Second Subtransmission Circuit8.12.9.
Total Cost: $2 .0m Project Status: underway Forecast accuracy: +/- 25%
Thames Substation is supplied from a 5km 66kV overhead spur line that passes over rugged terrain, from Parawai Switching Point. Due to the increasing load growth and customer numbers in the region, a second 66kV line is required to give N-1 security at this substation that currently supplies almost 5,000 ICPs. A second line will enable maintenance to be carried out on the existing 66kV circuit. Only a very small amount of load can be back feed from Matatoki Substation. This project is to be staged over several years ie route selection, securing of easements, and staged line construction that is dependent on site access.
Whangamata Second Subtransmission Circuit8.12.10.
Total Cost: $3 .1m Project Status: Feasibility Forecast accuracy: +/- 25%
To improve reliability, a second subtransmission circuit is required between Waikino GXP and the town of Whangamata. Designs for the lines have been largely completed, and several years of discussions with DoC and other affected parties have taken us to the point where easements, concessions and designation is required to progress through to the construction phase of this project.

Return to Index 201ASSET MANAGEMENT PLAN ELECTRICITY NETWORKS FY2010 – FY2019
Table 8.4: Summary of Reliability, Safety and Environment Projects
AMP Network Reliability, Safety and Environment Programme Summary
Potential Projects Project Driver
AMP Reference Section Options
Reliability, Safety and Environment Project FY2011 FY2012 FY2013 FY2014 FY2015
4OH
Misc hot water scheme upgrades $115,000 Asset Performance; Service 8.6.4 Upgrade to a new decabit system Misc conductor upgrades $30,000 Asset Performance; Service 6.6.8 DOHMisc line reconductoring/renewals $395,000 $1,250,000 $1,175,000 $1,410,000 Reliability 8.5.7 Tolerate worse reliability Misc line upgrades $595,000 $585,000 $550,000 $190,000 $288,700 Asset Performance; Service 8.5.7 Misc line changes $50,000 $12,000 $50,000 $125,000 Asset Performance; Service 8.5.7 Misc construction of new lines $105,000 $70,000 $50,000 Reliability 8.5.7 Thames Coast to Manaia link 2-3 wire upgrade $500,000 Asset Performance; Service 8.12.1 Refer to detailed project description Distribution overhead reliability enhancement $2,000,000 Reliability 8.12.4 Tolerate worse reliability SOH
Kopu Kauaeranga 110kV line $200,000 Asset Performance; Service 8.12.3 Refer to detailed project description Norfolk sub emergency tie $75,000 Reliability 8.12.4 Misc LFIs installations $40,000 $40,000 Service 8.4.1 Do nothing and live without the reliability benefits these
schemes provide Putaruru 33kV circuit $2,000,000 Service 8.12.2 Construct second 33kV line to Putaruru Oakura second 33kV line $1,500,000 Service 7.8.7 Continue to rely on limitied backup capability of the 11kV
network Whangamata second 33kV line $200,000 $1,350,000 $1,500,000 Service 8.12.10 Upgrade the subtransmission capacity to Waihi and accept
existing reliability and operational constraints Omokoroa additional 33kV circuit $1,000,000 Load Growth 7.8.8 Construct new GXP at Aongatete Katikati second 33kV circuit $500,000 Load Growth; Service 7.8.8 Accept reduced supply reliability Coroglen to Kaimarama second 110kV line $2,000,000 Load Growth; Service 8.12.3 Do nothing and accept reducing reliability and operational
constrainsts, or contruct new line along the existing line route, or lay underground cable, or install generation plant a Whitianga
4UG
Misc paralleling cable installations $15,000 Service; Asset Performance 8.9.7 Misc aged/hazardous LV equipment replacements
$325,000 $425,000 $345,000 $145,000 Safety 8.9.7 Do nothing - accept H&S risk
DUGMisc additional cable installations & links $1,261,000 $400,000 $230,000 $40,000 Asset Performance;
Reliability 8.5.7 Do nothing and live without the reliability and operational
benefits these provide Misc cable changes & replacements $80,000 $235,000 $40,000 $40,000 Asset Performance;
Reliability 8.5.7 Do nothing and live without the reliability and operational
benefits these provide Misc cable upgrades $360,000 $220,000 $60,000 $25,000 Asset Performance; Service 8.5.7 Do nothing and live without the reliability and operational
benefits these provide Whangamata additional feeder to reduce ICP’s $700,000 Asset Performance; Service 8.5.7 Do nothing and live without the reliability and operational
benefits these provide SUG
Morrinsville second 33kV circuit $2,000,000 Service 7.8.9 Increase 11kV interconnections with Piako, upgrade capacity at Piako
Matua second 33 KV cable $150,000 $850,000 Service 7.8.8 Increase 11kV interconnections from Otumoetai and Sulphur Pt, or do nothing and accept reducing reliability at Matua

Return to Index202 ASSET MANAGEMENT PLAN ELECTRICITY NETWORKS FY2010 – FY2019
Potential Projects Project Driver
AMP Reference Section Options
Reliability, Safety and Environment Project FY2011 FY2012 FY2013 FY2014 FY2015
Pongakawa 33kV separation from Te Puke $500,000 Load Growth; Service 7.8.8 Increase capacity of existing feeders from Te Puke and Pongakawa, build second line to Pongakawa or decline new connections
COM
Misc communications reliability improvements $90,000 Service 8.6.2 Misc communications network changes $75,000 $80,000 Asset Integrity; Reliability 8.6.2 Do nothing - accept H&S risk, more maintenance Misc new radio/communication link installations $200,000 Service 8.6.2 Misc VHF radio & data networks developments $409,000 $270,000 $195,000 Safety; Economic Efficiency 8.6.2 Do nothing and live with the risk of limited cell phone
coverage DAB
Misc automation of difficult to access ABSs $40,000 Safety; Reliability 8.3.4 DGS
Misc Series 1 switchgear replacements $1,280,000 $730,000 $685,000 $775,000 $550,000 Asset Integrity; Safety 8.9.5 Do nothing - accept H&S risk, more maintenance Misc new switch or RMU installations $230,000 $329,000 $35,000 Reliability; Service 8.4.1 Do nothing and live without the reliability and operational
benefits these provide Misc RMU SCADArising $150,000 $175,000 $90,000 Reliability; Service 8.4.1 Do nothing and live without the reliability and operational
benefits these provide Misc concrete pad replacements $50,000 Asset Integrity; Safety 8.9.5 DUT
Misc new ground mount transformer installations
$130,000 Asset Integrity; Safety 8.9.5
Misc rusty ground mount transformer replacements
$82,186 Asset Integrity; Safety 8.9.5
ZTR
Misc second transformer installations $300,000 Asset Integrity; Reliability 8.4.1 Do nothing and accept reliability and operational constraints Misc Ground Fault Neutraliser installations $250,000 $250,000 $300,000 $250,000 $250,000 Service; Asset Performance 8.4.1 Do nothing and live without the reliability benefits these
schemes provide Misc transformer replacements $175,000 $75,000 $135,000 Asset Performance; Reliability 6.8.5 Do nothing and accept furthur outages Misc zone substation transformer works $12,000 Safety; Asset Performance Coromandel second transformer bank $1,500,000 Reliability; Service 7.8.9 Refer to detailed project description Kerepehi second 66/33kV line $1,500,000 Reliability; Service 7.8.9 Accept reduced supply reliability Matua Zone Transformer upgrades $1,000,000 Load Growth; Service 7.8.8 Improve 11kV backup capacity with Sulphur Pt. Parkville replace Auto TX with dual winding TX $650,000 Asset Performance; Reliability 7.8.6 Do nothing and accept furthur outages Purchase spare zone transformer, Eastern $600,000 Asset Performance; Service DRG
Misc Regulator installations $115,000 Load Growth Misc Regulator related works $160,000 Safety; Reliability Misc Regulator automation works $40,000 $40,000 Reliability DSR
Misc switching additions $330,000 $265,000 $235,000 $100,000 Service 8.3.4 Do nothing and live without the reliability benefits these schemes provide
Misc Noja installations or Recloser upgrades $1,566,000 $1,702,000 $995,000 $1,085,000 $50,000 Reliability; Service 8.3.4 Do nothing and live with coordination issues Misc LFIs and EFIs installations $102,200 Reliability; Service 8.3.4 Do nothing and live without the the reliability benefits these
schemes provide Misc Recloser SCADArising or increase control $265,000 $170,000 $45,000 Reliability; Service 8.3.4 Do nothing and live without the reliability and operational
benefits these provide SCA
Misc equipment SCADArising $65,000 $147,000 $50,000 Reliability; Service 8.3.4 Do nothing and live without the reliability and operational benefits these provide
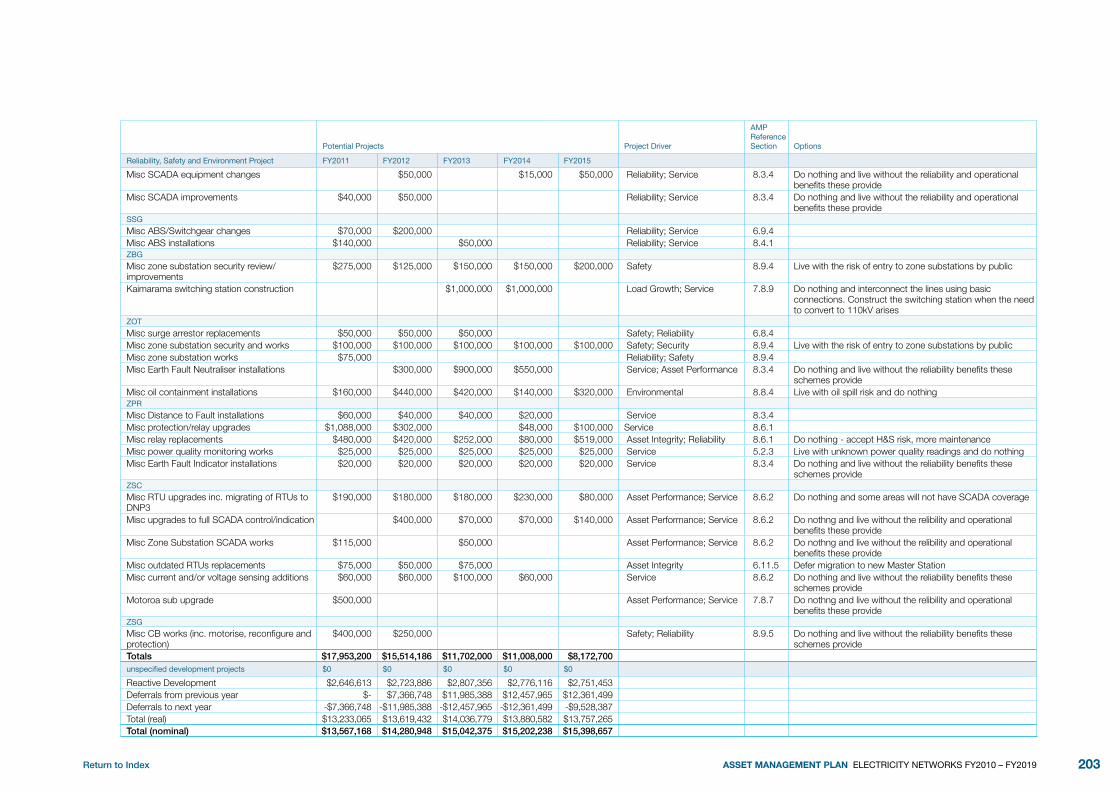
Return to Index 203ASSET MANAGEMENT PLAN ELECTRICITY NETWORKS FY2010 – FY2019
Potential Projects Project Driver
AMP Reference Section Options
Reliability, Safety and Environment Project FY2011 FY2012 FY2013 FY2014 FY2015
Misc SCADA equipment changes $50,000 $15,000 $50,000 Reliability; Service 8.3.4 Do nothing and live without the reliability and operational benefits these provide
Misc SCADA improvements $40,000 $50,000 Reliability; Service 8.3.4 Do nothing and live without the reliability and operational benefits these provide
SSG
Misc ABS/Switchgear changes $70,000 $200,000 Reliability; Service 6.9.4 Misc ABS installations $140,000 $50,000 Reliability; Service 8.4.1 ZBG
Misc zone substation security review/improvements
$275,000 $125,000 $150,000 $150,000 $200,000 Safety 8.9.4 Live with the risk of entry to zone substations by public
Kaimarama switching station construction $1,000,000 $1,000,000 Load Growth; Service 7.8.9 Do nothing and interconnect the lines using basic connections. Construct the switching station when the need to convert to 110kV arises
ZOT
Misc surge arrestor replacements $50,000 $50,000 $50,000 Safety; Reliability 6.8.4 Misc zone substation security and works $100,000 $100,000 $100,000 $100,000 $100,000 Safety; Security 8.9.4 Live with the risk of entry to zone substations by public Misc zone substation works $75,000 Reliability; Safety 8.9.4 Misc Earth Fault Neutraliser installations $300,000 $900,000 $550,000 Service; Asset Performance 8.3.4 Do nothing and live without the reliability benefits these
schemes provide Misc oil containment installations $160,000 $440,000 $420,000 $140,000 $320,000 Environmental 8.8.4 Live with oil spill risk and do nothing ZPR
Misc Distance to Fault installations $60,000 $40,000 $40,000 $20,000 Service 8.3.4 Misc protection/relay upgrades $1,088,000 $302,000 $48,000 $100,000 Service 8.6.1 Misc relay replacements $480,000 $420,000 $252,000 $80,000 $519,000 Asset Integrity; Reliability 8.6.1 Do nothing - accept H&S risk, more maintenance Misc power quality monitoring works $25,000 $25,000 $25,000 $25,000 $25,000 Service 5.2.3 Live with unknown power quality readings and do nothing Misc Earth Fault Indicator installations $20,000 $20,000 $20,000 $20,000 $20,000 Service 8.3.4 Do nothing and live without the reliability benefits these
schemes provide ZSC
Misc RTU upgrades inc. migrating of RTUs to DNP3
$190,000 $180,000 $180,000 $230,000 $80,000 Asset Performance; Service 8.6.2 Do nothing and some areas will not have SCADA coverage
Misc upgrades to full SCADA control/indication $400,000 $70,000 $70,000 $140,000 Asset Performance; Service 8.6.2 Do nothng and live without the relibility and operational benefits these provide
Misc Zone Substation SCADA works $115,000 $50,000 Asset Performance; Service 8.6.2 Do nothng and live without the relibility and operational benefits these provide
Misc outdated RTUs replacements $75,000 $50,000 $75,000 Asset Integrity 6.11.5 Defer migration to new Master Station Misc current and/or voltage sensing additions $60,000 $60,000 $100,000 $60,000 Service 8.6.2 Do nothing and live without the reliability benefits these
schemes provide Motoroa sub upgrade $500,000 Asset Performance; Service 7.8.7 Do nothng and live without the relibility and operational
benefits these provide ZSG
Misc CB works (inc. motorise, reconfigure and protection)
$400,000 $250,000 Safety; Reliability 8.9.5 Do nothing and live without the reliability benefits these schemes provide
Totals $17,953,200 $15,514,186 $11,702,000 $11,008,000 $8,172,700 unspecified development projects $0 $0 $0 $0 $0
Reactive Development $2,646,613 $2,723,886 $2,807,356 $2,776,116 $2,751,453 Deferrals from previous year $- $7,366,748 $11,985,388 $12,457,965 $12,361,499 Deferrals to next year -$7,366,748 -$11,985,388 -$12,457,965 -$12,361,499 -$9,528,387 Total (real) $13,233,065 $13,619,432 $14,036,779 $13,880,582 $13,757,265 Total (nominal) $13,567,168 $14,280,948 $15,042,375 $15,202,238 $15,398,657

Return to Index204 ASSET MANAGEMENT PLAN ELECTRICITY NETWORKS FY2010 – FY2019
fInAnCIAL9.
Introduction 9.1.
The network expenditure forecasts detail the development, renewal and maintenance expenditure to:
Maintain levels of service performance for the assets;•
Develop the assets to meet the new and future load growth; and•
Improve service performance where the service standards are not being met.•
As noted in the Executive Summary, a key focus of this AMP is on reducing the risk to adverse reliability performance (from the failure of aging assets or the loss of redundancy in the core network due to load growth). We are committing an extra $6m of capex per annum for focussed investment in security, capacity and reliability. The increase in expenditure has been made possible by the outcome of the Default Price Path (that regulates Powerco’s revenue) effective from 01 April 2010.
Assumptions and Strategic Influences Underlying the Expenditure 9.2. forecasts
Background and Significant Assumptions 9.2.1.
The purpose of this Section 9.2.1 is to provide a general level of information for customers and other stakeholders on the key assumptions that underpin the expenditure forecasts.
Powerco’s network expenditure forecasts are developed from both the bottom up and the top down, and the process of deriving these is an iterative one that seeks to optimise the levels of performance and risk (refer Section 4.1).
Working from the bottom up (principally for horizon years 0 -2), expenditure forecasts are based on identified maintenance regimes and projects identified (as set out in Sections 6, 7 and 8) (as is more particularly described in Section 9.2.3).
Working from the top down (which are compared with the bottom up forecasts and mainly used for horizon years 3 -10), the expenditure forecasts comprise the previous AMP expenditure forecast escalated for growth in line length (as a proxy for increase in assets to be inspected and maintained), inflation (as a proxy for increase in unit rates) less an efficiency factor (between 1.0% and 1.5%) and adjusted for specific issues noted and agreed to by key stakeholders during the previous year. Capital expenditure (other than customer connection or system growth) is forecast in a similar manner by escalating by inflation (as a proxy for increase in unit rates) less an efficiency factor of between 1% and 1.5%. Customer connection and system growth capex are the hardest to forecast as they driven by growth as opposed to factors that are more within the control of Powerco such as the condition of the assets, the number of assets and the costs of renewing (including maintaining) or development work on those assets.
As noted above, the top down expenditure forecasts have been adjusted for specific issues - such as the following:
Firstly, that after the acquisition of the Eastern Region network, it was discovered •that the scale of development work in the Eastern Region would have to double;
Secondly, between 2004 and 2006, renewal expenditure increased due to the •recognition that renewal activities were more expensive than previously believed and that renewal activities not done were building up;
Thirdly, in 2007, development expenditure was forecast to increase due to the high •growth rates;
Finally, in the April 2010 AMP, the Customer Connection and Asset Relocation •expenditure forecasts were reduced on account of the recession, the system growth and reliability, safety and environment expenditures were not reduced despite the reduced recessionary volumes but were instead increased by 10% on account of the higher-than-anticipated price threshold X factor.
Tota
l For
ecas
t E
xpen
ditu
re (n
omin
al $
mill
ion)
FY 2
003
F
FY 2
004
F
FY 2
005
F
FY 2
006
F
FY 2
007
F
FY 2
008
F
FY 2
009
F
FY 2
010
F
FY 2
011
F
FY 2
012
F
FY 2
013
F
FY 2
014
F
FY 2
015
F
FY 2
016
F
FY 2
017
F
FY 2
018
F
FY 2
019
F
FY 2
020
F
FY 2
021
F
Preventive Maintenance Expenditures
0
20
40
60
80
100
120
140
160
180
200
Aug 02 AMP F'cast
Actual
Increased Eastern Development 2003
Increased Development 2007
Increase in non CIW capex
Aug 03 AMP F'cast Aug 04AMP F'cast Aug 05 AMP F'cast
Oct 06 AMP F'cast Sept 07 AMP F'cast Mar 09 AMP F'cast Apr 10 AMP F'cast
Figure 9.1: AMP Expenditure Forecast against Previous AMP Expenditure Forecasts.

Return to Index 205ASSET MANAGEMENT PLAN ELECTRICITY NETWORKS FY2010 – FY2019
Strategic Influences9.2.2.
Approval of the expenditure forecasts is made at Board level. As part of this approval, the following factors are considered:
What was last year’s actual and budgeted spend, and what was the AMP forecast •expenditure for that year;
The revenue that Powerco is allowed to earn under the current default price path •and investors’ (debt and equity) expectations of earning risk adjusted returns on their investments;
The perceived level of investment risk associated with the regulatory regime •(consistency, predictability, transparency, accountability, balance, independence, efficiency); and
Individual project and annual budget justification. In particular, the regulatory •regime’s treatment of capital efficiency factor (actual project cost when compared with the ODV replacement costs) and ongoing increases in asset installation and maintenance costs will be a critical factor in the justification. That is, should the regulatory regime not properly recognise the actual cost of projects it becomes difficult for investors to justify undertaking this type of work.
Multiple Stakeholder Influences9.2.3.
Network expenditure forecasts are developed in conjunction with Asset Management planning, taking into consideration things such as the age and condition of existing assets, targeted service standards, projected growth rates, regulatory requirements, the financial position of the company and the expectations of the company’s capital providers. These considerations are summed up in the multi-stakeholder assessment process described in (Section 2.6).
The process of deriving expenditure forecasts is an iterative one that seeks to optimise the performance and risk levels in the network within these competing constraints (refer Section 4.1). In particular, projected network expenditure needs to be given consideration within the context of the revenue allowed by regulatory regime and Powerco’s mandate of delivering long-term sustainable earnings and interest payments to its capital providers.
The programme of work for a given period is passed through the Multi-Stakeholder Prioritisation process (refer to Section 2.6). With this process, the strategic values and risks associated with each potential project are weighed against their associated dollar expenditure. A decision can be made at budgeting time on the best projects to include in a work programme given a constrained budget, or the constrained budget can be varied to obtain the best strategic value outcome.
Budget reforecasts are made quarterly, allowing adjustments to the expenditure forecasts, especially if unforeseen events occur during the year.
Forecast Accuracy9.2.4.
The expenditure forecasts for FY2011 are weighed against detailed planning and assessment of the assets. The forecasts in the mid to later years have been set given the general application of the planning criteria and load growth projections to the network, and broad projections of asset condition-based renewal and maintenance needs.
Capital and Maintenance Expenditure overview9.3.
Expenditure Categories9.3.1.
Powerco has aligned its accounting systems with the Commerce Commission’s revised Information Disclosure Requirements (31 October 2008) covering the disclosure of capital and operational expenditures and forecasts. The capital expenditures are down into the following categories:
Customer Connection •
System Growth•
Asset Replacement and Renewal•
Reliability, Safety and Environment•
Asset Relocations•
Operational expenditure forecasts are broken down into these categories:
Routine and Preventive (Scheduled) Maintenance•
Fault and Emergency (Reactive) Maintenance•
Refurbishment and Renewal (Corrective) Maintenance•
In the past, Powerco has categorised the expenditure by three categories:
Development (includes enhancements and extensions): Capital expenditure on •new assets, or expenditure that materially improves the service potential and performance of the existing assets;
Renewal: Capital expenditure on the replacement of existing assets that maintains •the original level of service performance and extends the economic life of the network. For example, replacement of like with like or the refurbishment of an existing asset to provide an extension of existing life; and
Operating and maintenance: Generally, this is operational expenditure directly •associated with running the electricity distribution network that cannot be capitalised.

Return to Index206 ASSET MANAGEMENT PLAN ELECTRICITY NETWORKS FY2010 – FY2019
In this section of the AMP, the expenditure forecasts are presented in these two different ways. It should be noted that because Powerco has historically reported its expenditures internally under different categories from those required by the Information Disclosure Requirements, the expenditures by category have had to be derived by extrapolating project samples queried from Powerco’s works management system and management accounts. Therefore, while the historical recategorised expenditures have not been audited, they do outline the overall trends.
Key Asset Management Programme9.3.2.
Tables 9.1 and 9.2 below summarise the key work programmes envisaged over the next 10 years. Table 9.1 shows that the capital programme will have to adapt to the issues expected to occur, while the opex programmes are largely consistent over the planning period. The tables do not reflect the improvements in standards that are expected to arise from ongoing improvement processes.
Table 9.1: Key Capital Programme Summary
Expenditure Category Next 2 Years 3-5 Years 5-10 Years
Customer Connections
Reticulate subdivisions
Connect new customers
Upgrade existing customer connections
Distribution transformer upgrades
System Growth Construct new zone substations
Construct new subtransmission feeders & easement compensation
Install new distribution feeders
Construct new zone substations
Construct new subtransmission feeders
Accelerate resource consent and easement compensation
Install new distribution feeders
LV upgrades (particularly CBDs)
Construct new zone substations
Construct new sub-transmission Feeders & easement compensation
Install new distribution feeders
LV upgrades (particularly CBDs)
Reliability Safety and Environment
Reliability improvements: Fault neutralisers, recloser and loop automation schemes, fault locators and fault indicators
Safety and Environmental Improvements: Oil bunds, earthing upgrades, switchgear replacements (where safety is a driver)
Asset Replacement and Renewal
Overhead line renewal – cross-arm, conductor and pole replacement
Zone substation CB replacement
Overhead line renewal – cross-arm, conductor and pole replacement
Zone substation CB replacement
Overhead line renewal – cross-arm, conductor and pole replacement
Zone substation CB replacement
Cable replacements
Distribution transformer replacements
Asset Relocations
New line or cable installed through third party asset relocation request
Overhead underground conversion

Return to Index 207ASSET MANAGEMENT PLAN ELECTRICITY NETWORKS FY2010 – FY2019
Table 9.2: Key Operational Programme Summary
Expenditure Category Next 2 Years 3-5 Years 5-10 Years
System Management and Operation
Network planning
Network owner maintenance management & contract administration
Network operations
Network operating (leases, site services)
Routine and Preventive Maintenance
Network inspections
Routine servicing & overhauls
Non-routine servicing & asset relocations
Service disconnections
Contractor’s maintenance management
Refurbishment and Renewal Maintenance
Corrective network repairs resulting from scheduled inspections and fault callouts
Fault and Emergency Maintenance
Fault callouts
Immediate fault repairs
Relationship with Disclosed Expenditures9.3.3.
The Asset Management Plan expenditure actuals are aligned to the July to June operational calendar and 30 June balance date used by Powerco. The regulatory information disclosures are made with an April to March calendar year. This means that some timing discrepancies may arise between the Asset Management Plan and the regulatory disclosure information.
Capital Expenditure9.4.
Capital expenditure (capex) is expenditure that is used to create new assets or to increase the service performance or potential of an existing asset beyond its original service performance or service potential. Capital expenditure increases the value of the asset stock and is capitalised in accounting terms.
The forecast total capital expenditure to FY2021 is shown in the diagram below (blue-coloured bars) along with the actual (A) capital expenditures from the FY2006 to FY2009 periods (purple bars) and the budgeted capital expenditure for FY2010 (green bar).
In this and the other graphs below, the expenditure forecasts are denominated in nominal dollar values (as at the middle of the forecast year) in line with the disclosure requirements. To provide a reference to the degree of inflation indexation, an inflation index line is also shown in the graph. The inflation index is based on Department of Statistics figures and NZIER forecasts. Forecasts are inherently uncertain.
Generally, the forecast trend is one of a growing level of real network capital expenditure. This is largely because of the increasing requirement for renewal capex as the average age of the network increases.
Nom
inal
Exp
end
iture
($00
0)
Infla
tion
Ind
ex
0
2.000
1.750
1.500
1.250
1.000
0.750
0.500
0.250
0
20,000
40,000
60,000
80,000
100,000
120,000
140,000
160,000
2006
A
2007
A
2008
A
2009
B
2010
F
2011
F
2012
F
2013
F
2014
F
2015
F
2016
F
2017
F
2018
F
2019
F
2021
F
2020
F
Total Network Capex
Routine & Preventive Maintenance Inflation Index Financial Year
Figure 9.2: Total Network Capital Expenditure.
Treatment of Uncertainty in the Capital Expenditure Forecasts9.4.1.
Uncertainties in the Customer Connection and Asset Relocation actual versus budget figures arise due to the nature of the customer requests. Because these projects are partly recoverable, under or oversubscription of the available budget usually has a neutral impact on the company’s financial position. For this reason, variations in the actual expenditure are usually accepted by senior management and the Board.
The other capital expenditure categories each have a reactive and scheduled component. The aim of the reactive component is to provide a buffer for unforeseen events during the year. Examples of reactive work include unforeseen replacement of equipment in poor condition or replacement following storms.
Capital budgets are monitored at the end of every month and budget reforecasts are made quarterly. Underspend on the reactive budget allowances can be taken up by adding additional projects to the annual capital programme. Reactive budget overspend can be accommodated by deferring projects in the annual capital programme.
The majority of the expenditures within the capital expenditure categories of System Growth, Reliability, Safety and Environment and Asset Renewal are involved in scheduled programmes of work. A portion of the expenditures is set aside for unforeseen work. These reactive sub-categories have been set aside that cater for unforeseen or non-programmed events, such as unexpected equipment failure and storms.

Return to Index208 ASSET MANAGEMENT PLAN ELECTRICITY NETWORKS FY2010 – FY2019
Allowance is also made for opportunities to purchase land for future zone substation sites or easements for lines. In our experience, gradual land or easement banking as the opportunities arise to a well-thought-out development plan is a more efficient way of developing the network than an urgent short-term focus. When they do arise, land opportunities need to be acted on quickly.
Impact of Expenditure Forecast on Network Average Age9.4.2.
Figure 9.3 shows that the capital expenditure forecast, coupled with the shape of the network age profile, causes the network average age to increase by just over three years over the next 10 years. Influences on the asset age include:
New subdivisions mean new assets are added to the network, which leads to a •reduced average network age;
Renewal work replaces existing assets with new ones, which leads to a reduced •average network age; and
Ongoing depreciation of the existing assets leads to an increased asset age. •
The increasing asset age shown in this graph means that the incidence of asset failures will increase, leading to a growing numbers of customer outages.
Growth Capex Renewal Capex Average age Western Average age Eastern
20
22
24
26
28
30
32
34
$0
$20
$40
$60
$80
$100
$120
$140
$160
FY 2
006
FY 2
007
FY 2
008
FY 2
009
FY 2
010
FY 2
011
FY 2
012
FY 2
013
FY 2
014
FY 2
015
FY 2
016
FY 2
017
FY 2
018
FY 2
019
FY 2
020
FY 2
021
Ave
rage
Age
Tota
l Cap
ex ($
m)
Network Average Age and Forecast Capex
Figure 9.3: Forecast Network Average Age
Customer Connection Capex9.4.3.
No
min
al E
xpen
ditu
re ($
000)
Infla
tion
Ind
ex
0
2.000
1.750
1.500
1.250
1.000
0.750
0.500
0.250
0
5,000
10,000
15,000
20,000
25,000
30,000
35,000
40,000
2006
A
2007
A
2008
A
2009
B
2010
F
2011
F
2012
F
2013
F
2014
F
2015
F
2016
F
2017
F
2018
F
2019
F
2021
F
2020
F
Customer Connection Capex
Routine & Preventive Maintenance Inflation Index Financial Year
Figure 9.4: Customer Connection Capital Expenditure.
Customer Connection capex is capital expenditure primarily associated with the connection of new consumers to the network, or alterations to the connections of existing consumers, where some of the expenditure is recoverable. Customer Connection-associated capex is shown in Figure 9.4.
Assumptions behind the Customer Connection Capex Forecast 9.4.3.1
From around FY2004 until FY2008, new connection activity was at historically high levels, most notably in the Manawatu and Taranaki areas where connection activity previous to this time was light. Increased activity appears to have come from the buoyant dairy sector, oil and gas industry investment and increased industrial warehousing with Palmerston North as a distribution hub for the lower North Island. Connection activity in the Tauranga and Coromandel areas has historically been consistently high but during these years, the pace accelerated. Powerco is predicting a return to lower levels of new connection activity as the recessionary environment bites and this is reflected in the expenditure forecast.
System Growth Capex 9.4.4.
System Growth capex relates to development or enhancement of the network. This category is for work driven by:
Growth in network load, requiring an increase in network capacity;•
Restore network security (and reliability), which are below the standard or customer •expectations; and
Non-recoverable extension or upgrade of the network to connect new consumers.•

Return to Index 209ASSET MANAGEMENT PLAN ELECTRICITY NETWORKS FY2010 – FY2019
Assumptions behind the System Growth Capex Forecast9.4.4.1
The System Growth capital expenditure levels are shown in Figure 9.5. They reflect a need to increase the capacity and security in the network in order to catch up with the recent high levels of growth, particularly in Coromandel and Tauranga areas (i.e. the network is carrying a higher degree of adequacy risk than the security and capacity performance requirements indicate). Reflecting this, the system growth expenditure is maintained roughly constant in real terms over the next three years before gradually reducing due to the reduction in customer connection activity and volume growth.
As set out in the April 2009 AMP, consideration of reducing the system growth expenditures was given on account of the adverse impacts of the recession on system volumes. However, these reductions have not been made. Instead, the forecast system growth expenditures have been increased by 10% over the previous year’s forecasts in reflection of the higher than expected X factor in the CPI-X price threshold.
Nom
inal
Exp
end
iture
($00
0)
Infla
tion
Ind
ex
0
2.000
1.750
1.500
1.250
1.000
0.750
0.500
0.250
0
5,000
10,000
15,000
20,000
25,000
30,000
35,000
40,000
2006
A
2007
A
2008
A
2009
B
2010
F
2011
F
2012
F
2013
F
2014
F
2015
F
2016
F
2017
F
2018
F
2019
F
2021
F
2020
F
System Growth Capex
Routine & Preventive Maintenance Inflation Index Financial Year
Figure 9.5: System Growth Capital Expenditure.
Reliability, Safety and Environment Capex 9.4.5.
Reliability, Safety and Environment capex is associated with:
Maintaining or improving the safety of the network for the public, employees, •contractors;
Improvement of reliability or service standards; and•
Meeting environmental standards. •
Assumptions behind the Reliability, Safety and Environment Capex Forecast 9.4.5.1
Capital expenditure associated with Reliability, Safety and Environment compliance or improvement has had to be extrapolated as it has been historically recorded in Powerco’s works management system under both the network renewal and the system growth categories.
Reliability, safety and environment projects may include:
Replacement of assets due to an operational constraint or safety issues;•
Environmental compliance issues; or •
Installation of reclosers or network automation schemes to improve the reliability of •supply to consumers.
An increase in this category of expenditure is expected to be needed to cater for Powerco’s programmes of replacement of ground-mounted switches, network automation and site environmental compliance (described in Sections 6 and 8). The expenditure forecasts reflect this need.
As set out in the April 2009 AMP, the Reliability, Safety and Environment expenditures were to have been reduced somewhat on account of the recession. However, it has been decided that this should not happen. Instead, the forecast expenditures have been increased by 10% over the previous year’s forecasts in reflection of the higher than anticipated X factor in the CPI-X price threshold.
Nom
inal
Exp
end
iture
($00
0)
Infla
tion
Ind
ex
0
2.000
1.750
1.500
1.250
1.000
0.750
0.500
0.250
0
5,000
10,000
15,000
20,000
25,000
30,000
35,000
40,000
2006
A
2007
A
2008
A
2009
B
2010
F
2011
F
2012
F
2013
F
2014
F
2015
F
2016
F
2017
F
2018
F
2019
F
2021
F
2020
F
Reliability, Safety & Environment Capex
Routine & Preventive Maintenance Inflation Index Financial Year
Figure 9.6: Reliability, Safety and Environment Capital Expenditure.

Return to Index210 ASSET MANAGEMENT PLAN ELECTRICITY NETWORKS FY2010 – FY2019
Asset Replacement and Renewal Capex9.4.6.
Asset Renewal capex generally relates to meeting the progressive deterioration of the condition of network assets, or because of obsolescence of network assets. This may include replacement of existing assets where these assets have been identified as being at the end of their economic life, based on their assessed condition. As the asset replacement decision is based on the most recent condition assessment, the expenditure forecasts in the mid to later years should be taken as a general guide only. The longer term forecasts are based on age profiles and standard lives: analysis of asset condition information is the best way of forecasting renewal in the short term.
Assumptions behind the Asset Renewal Capex Forecast9.4.6.1
The expenditure forecasts take account of the life extension practices described in Section 6 and assume a small level of deferral due to the adoption of new technology.
The renewal expenditure forecasts have increased by 10% on account of the higher than anticipated X factor in the price threshold reset.
Asset Renewal capex has a need to significantly increase above existing levels because of the large number of assets commissioned in the 1950s-1970s now reaching the end of their life. The drivers for asset renewal are explained in Section 6. The forecast expenditure line (in gold) in Figure 6.9 shows that the average renewal expenditure required over the next five years is between $40 and $50 million and that renewal expenditures will need to increase beyond this over coming years. The large bars in 2010 show the replacement value of equipment that is beyond its design life. The forecast renewal expenditure has been derived by trending the present levels upwards at a fixed percentage. The rate of increase chosen was 8.6% reflecting the capability of service providers to increase capacity. The gold line in the figure shows a shortfall in early years that will eventually be caught up, implying a degree of deferral is happening based on asset condition that will eventually need to be caught up. Attendance to this shortfall will require agreement between Powerco’s owners and the Economic Regulator. Actual levels of renewal work will be dependent upon the individual project and annual budget justification, and in particular the treatment of the higher renewal costs when compared with ODV replacement costs under the regulatory regime will be a critical factor in the justification.
A consequence of overly constraining investment in asset renewal is that it then has to be managed reactively. Powerco is constantly striving to ensure an appropriate balance between scheduled and reactive work. Reactive work can be associated with long supply outages to customers, increased health and safety risks, hasty network designs that can lead to short-term patches and future liabilities, in turn leading to increased asset life cycle costs. Failure to proceed with adequate network renewal will significantly increase the likelihood that reliability of supply and safety levels will deteriorate.
Nom
inal
Exp
end
iture
($00
0)
Infla
tion
Ind
ex
0
2.000
1.750
1.500
1.250
1.000
0.750
0.500
0.250
0
10,000
20,000
30,000
40,000
50,000
60,000
70,000
80,000
2006
A
2007
A
2008
A
2009
B
2010
F
2011
F
2012
F
2013
F
2014
F
2015
F
2016
F
2017
F
2018
F
2019
F
2021
F
2020
F
Asset Replacement & Renewal Capex
Routine & Preventive Maintenance Inflation Index Financial Year
Figure 9.7: Asset Replacement and Renewal Capital Expenditure.
Asset Relocation Capex9.4.7.
Asset Relocation capex is that associated with the need to move assets as a result of third-party requests. As a capital expenditure, the expectation is that new assets would be created as a result of the relocation: a simple relocation of an existing asset is an activity that should be expensed.
Asset relocation may include:
New line/cable constructed as part of route realignment, resulting from a third-party •request; or
Overhead line to underground conversion.•
Assumptions behind the Asset Relocation Capex Forecast9.4.7.1
The significant reduction in forecast expenditure occurs because of the scheduled completion of the Palmerston North undergrounding programme, a programme to renew the aged overhead line network with underground cable as part of an agreement with the Palmerston North City Council dating back to the mid-1990s. Although not reflected in the budgeted expenditure for FY10, finalisation of this programme occurs in 2010 due to the project being rolled over from the previous year.
Asset relocations are, at best, difficult to forecast because they are driven by third parties and can involve large works – if, for example, a highway is being rerouted. They may increase if the Government embarks on fiscal stimulus policies, such as road upgrade projects.
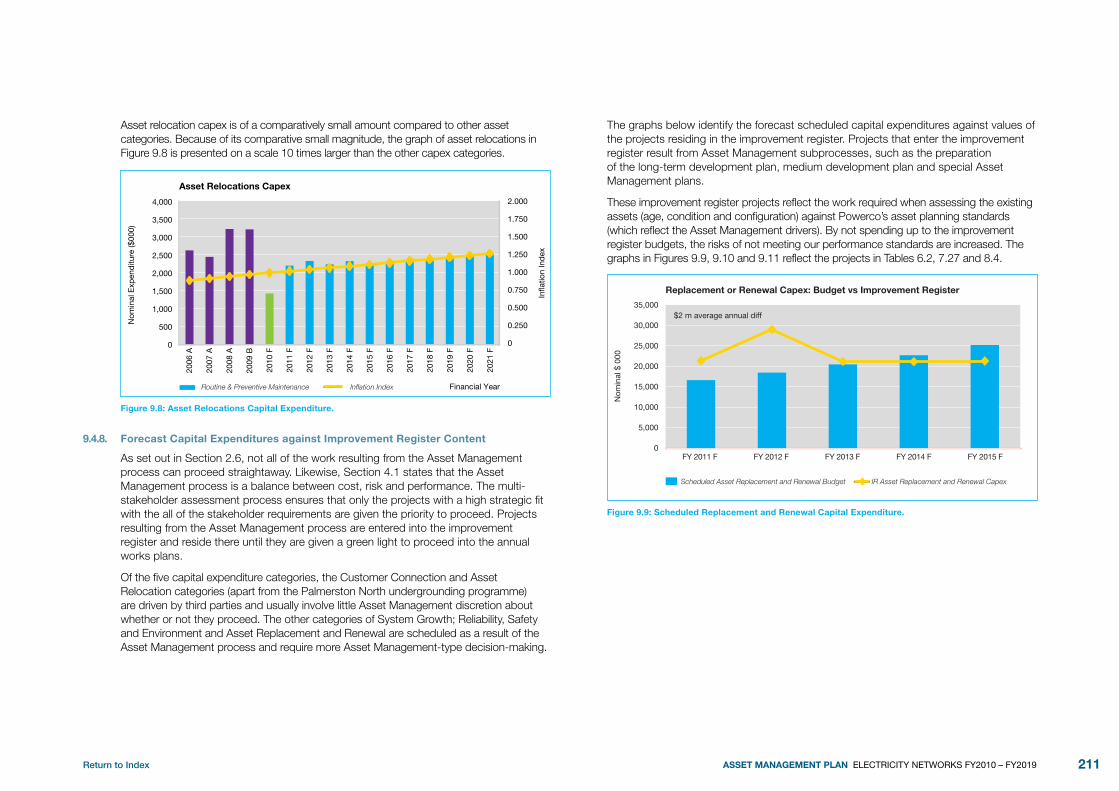
Return to Index 211ASSET MANAGEMENT PLAN ELECTRICITY NETWORKS FY2010 – FY2019
Asset relocation capex is of a comparatively small amount compared to other asset categories. Because of its comparative small magnitude, the graph of asset relocations in Figure 9.8 is presented on a scale 10 times larger than the other capex categories.
Nom
inal
Exp
end
iture
($00
0)
Infla
tion
Ind
ex
0
2.000
1.750
1.500
1.250
1.000
0.750
0.500
0.250
0
500
1,000
1,500
2,000
2,500
3,000
3,500
4,000
2006
A
2007
A
2008
A
2009
B
2010
F
2011
F
2012
F
2013
F
2014
F
2015
F
2016
F
2017
F
2018
F
2019
F
2021
F
2020
F
Asset Relocations Capex
Routine & Preventive Maintenance Inflation Index Financial Year
Figure 9.8: Asset Relocations Capital Expenditure.
Forecast Capital Expenditures against Improvement Register Content 9.4.8.
As set out in Section 2.6, not all of the work resulting from the Asset Management process can proceed straightaway. Likewise, Section 4.1 states that the Asset Management process is a balance between cost, risk and performance. The multi-stakeholder assessment process ensures that only the projects with a high strategic fit with the all of the stakeholder requirements are given the priority to proceed. Projects resulting from the Asset Management process are entered into the improvement register and reside there until they are given a green light to proceed into the annual works plans.
Of the five capital expenditure categories, the Customer Connection and Asset Relocation categories (apart from the Palmerston North undergrounding programme) are driven by third parties and usually involve little Asset Management discretion about whether or not they proceed. The other categories of System Growth; Reliability, Safety and Environment and Asset Replacement and Renewal are scheduled as a result of the Asset Management process and require more Asset Management-type decision-making.
The graphs below identify the forecast scheduled capital expenditures against values of the projects residing in the improvement register. Projects that enter the improvement register result from Asset Management subprocesses, such as the preparation of the long-term development plan, medium development plan and special Asset Management plans.
These improvement register projects reflect the work required when assessing the existing assets (age, condition and configuration) against Powerco’s asset planning standards (which reflect the Asset Management drivers). By not spending up to the improvement register budgets, the risks of not meeting our performance standards are increased. The graphs in Figures 9.9, 9.10 and 9.11 reflect the projects in Tables 6.2, 7.27 and 8.4.
Nom
inal
$ 0
00
Scheduled Asset Replacement and Renewal Budget IR Asset Replacement and Renewal Capex
FY 2011 F FY 2012 F FY 2013 F FY 2014 F FY 2015 F
Replacement or Renewal Capex: Budget vs Improvement Register
0
5,000
10,000
15,000
20,000
25,000
30,000
35,000 $2 m average annual diff
Figure 9.9: Scheduled Replacement and Renewal Capital Expenditure.

Return to Index212 ASSET MANAGEMENT PLAN ELECTRICITY NETWORKS FY2010 – FY2019
Nom
inal
$ 0
00
Scheduled System Growth Budget IR System Growth Capex
0
10,000
20,000
30,000
40,000
50,000
FY 2011 F FY 2012 F FY 2013 F FY 2014 F FY 2015 F
System Growth Capex: Budget vs Improvement Register
$13 m average annual diff
Figure 9.10: Scheduled System Growth Capital Expenditure.
Nom
inal
$ 0
00
Scheduled Reliability, Safety and Environment Budget IR Reliability, Safety and Environment Capex
FY 2011 F FY 2012 F FY 2013 F FY 2014 F FY 2015 F
Reliability, Safety or Environmental Capex: Budget vs Improvement Register
0
2,000
8,000
6,000
4,000
10,000
12,000
14,000
16,000
18,000
20,000
$2 m average annual diff
Figure 9.11: Scheduled Reliability, Safety and Environment Capital Expenditure.
As mentioned above, the projects in the Improvement Register are categorised by System Growth, Reliability, Safety and Environment and Asset Replacement and Renewal. Furthermore, the Improvement Register does not include projects of a reactive nature, where only short notice is available of the project need.
Tables 6.2, 7.27 and 8.4 show the major programmes of work for renewal and development. The FY11 to FY15 columns show the value of work from the Improvement Register in summary form.
The graphs above demonstrate that Powerco could be spending approximately $17 million per year more than it is forecasting on scheduled network capital expenditure. That is, if the regulatory environment were more amenable towards investment, Powerco could justifiably be spending this much more.
Status of Capital Programme Initiatives9.4.9.
A description of the status of completion of the capital programme against the plan is given in Section 5. The effectiveness of the capital programme is described in Sections 6, 7 and 8.
operational Expenditures9.5.
Operational expenditures are those expenditures directly associated with running the electricity distribution network that cannot be capitalised. These include maintenance expenditures required to operate or maintain the assets to achieve their original design economic lives and service potentials. Powerco’s maintenance work comprises the following:
Routine condition-monitoring;•
Routine servicing;•
Evaluation of inspection and condition-monitoring results to determine any •maintenance requirements;
Evaluating faults to predict condition-monitoring and maintenance requirements;•
Performing maintenance overhauls;•
Rotable asset relocation;•
Fault repair; and •
Network operations.•
The operating and maintenance expenditures also include direct management costs not directly associated with creating network assets, such as customer management, network planning, network operating and managing service provider relationships. They include site leases, site service charges, network insurance, charter payments and other like costs. They may include the costs of decommissioning existing assets (where a new asset is not created).

Return to Index 213ASSET MANAGEMENT PLAN ELECTRICITY NETWORKS FY2010 – FY2019
The operating and maintenance expenditure forecast has been set based on benchmarked operational costs per asset replacement cost and per system length, based on present work levels, after adjustments have been made to allow for increased service provider efficiency (downwards) and growth in system length and ODV (upwards). These are confirmed against the asset maintenance plans developed using the maintenance strategy and Powerco’s present operating practices.
The forecast total operational and maintenance expenditures to FY2021 are shown in the diagram below (blue-coloured bars) along with the actual (A) capital expenditures from the FY2006 to FY2009 periods (purple bars) and the budgeted capital expenditure for FY2010 (green bar).
The operational expenditure forecasts are denominated in nominal dollar values in line with the disclosure requirements. The inflation index is also shown in the graph.
Nom
inal
Exp
end
iture
($00
0)
Infla
tion
Ind
ex
0 0
2.000
1.750
1.500
1.250
1.000
0.750
0.500
0.25010,000
20,000
30,000
40,000
50,000
2006
A
2007
A
2008
A
2009
B
2010
F
2011
F
2012
F
2013
F
2014
F
2015
F
2016
F
2017
F
2018
F
2019
F
2021
F
2020
F
Total Direct Operational Expenditure
Routine & Preventive Maintenance Inflation Index Financial Year
Figure 9.12: Total Direct Operational Expenditure.
Treatment of Uncertainty in the Operational Expenditure Forecasts9.5.1.
The Renewal and Refurbishment and Fault and Emergency expenditure categories provide a buffer in the Operational Expenditure forecasts to cater for unforeseen events. However, greater than foreseen corrective or reactive work is less easily accommodated by varying the scheduled maintenance plan (routine inspections or services) than it is in the capital works programme. Some of the major preplanned work can be brought forward or deferred, such as painting of transformers, but these projects are generally on the fringes of the programme. Deferring maintenance increases the levels of network risk.
There is a moderate risk, therefore, that unforeseen events can cause the operational expenditures to vary significantly around the budget, leading to a Financial Performance impact. The operational expenditures are monitored against budget at the end of every month and budget reforecasts are made quarterly.
Routine and Preventive Maintenance Opex 9.5.2.
Routine and Preventive Maintenance opex is driven by pre-planned work schedules. It comprises network inspections and routine overhauls of equipment, as well as prescribed vegetation-clearing in accordance with the annual maintenance plan. It also includes maintenance of a non-routine nature such as roof replacements or relocations of rotable assets.
The asset inspections are largely driven by the need to quantify, monitor and record the potential risks to the network, the public and to employees. The routine overhauls and non-routine maintenance activities are driven by the need to maintain the integrity, performance and potential of the existing assets.
The Routine and Preventive Maintenance expenditures are those expenditures that are allowed for in the annual maintenance plan. These include condition-based monitoring, routine servicing and routine overhauls. The category includes vegetation work.
Assumptions behind the Routine and Preventive Maintenance Forecasts9.5.2.1
The subsequent fault restoration activities in the Routine and Preventive category overlap with the activities that would occur in the Renewal and Refurbishment Maintenance category. Instead, it would seem that the renewal and refurbishment category should be more aligned to delayed fault rectification work as they tend to largely involve the replacement or refurbishment of asset subcomponents. The interpretation applied is that maintenance should be categorised as Routine and Preventive if it is allowed for in the Annual Maintenance Plan.

Return to Index214 ASSET MANAGEMENT PLAN ELECTRICITY NETWORKS FY2010 – FY2019
The preventive maintenance expenditure forecasts have been set at a top-down level by prorating the historical expenditures against the expenditures associated with other forms of maintenance. The preventive maintenance expenditure forecasts are benchmarked by analysing the sum of the costs of the different maintenance tasks for each asset type. These are, in turn, determined by the product of the quantity of each maintenance task and the applicable unit rates. This analysis has been performed as part of Powerco’s five-year maintenance planning process and is summarised in the graph below. In this graph, the dark blue bars show the budgeted and forecast preventive maintenance expenditures, while the orange, pink and yellow bars show the expenditure required to fulfil the maintenance plan. Variations occur year on year in the expenditure requirement because of the differing amounts of assets in the regions being maintained.
The forecast preventive maintenance expenditures rise above the budgeted figure for FY2009 in recognition that the network length is continuing to grow and that the scale of maintenance tasks needs to increase as the assets age. Conversely, ongoing efficiency improvements have been built into the forecasts.
The graph in Figure 9.14 shows that, in general, the budget for preventive maintenance is rather short, leading to the risk that some maintenance has to be deferred, which would lead to a possible increase in public liability risk, supply reliability and possibly earlier renewal.
Nom
inal
Exp
end
iture
($00
0)
Infla
tion
Ind
ex
0
16,000
14,000
12,000
10,000
8,000
6,000
4,000
2,000
0
2.000
1.750
1.500
1.250
1.000
0.750
0.500
0.250
2006
A
2007
A
2008
A
2009
B
2010
F
2011
F
2012
F
2013
F
2014
F
2015
F
2016
F
2017
F
2018
F
2019
F
2021
F
2020
F
Routine & Preventive Maintenance
Routine & Preventive Maintenance Inflation Index Financial Year
Figure 9.13: Routine and Preventive Maintenance Expenditure.
$ 00
0
FY 2011 F FY 2010 F FY 2012 F FY 2013 F FY 2014 F FY 2015 F
Preventive Maintenance Expenditures
0
2,000
8,000
6,000
4,000
10,000
12,000
14,000
16,000
Vegetation Mgmt Requirement South Waikato CFS Rotable assets
SCADA/ Comms/ Ripple Zone Subs Requirement Dist Switchgear Requirement
Dist Tsfrmrs Requirement OH Line Requirement
Planned Maintenance Budget
UG Cable Requirement
Figure 9.14: Preventive Maintenance Expenditure.
Refurbishment and Renewal Maintenance 9.5.3.
Refurbishment and Renewal maintenance is associated with the replacement, refurbishment or renewal of items that are component parts of an asset, as described in the ODV Handbook. Powerco has interpreted this be expenditure of a corrective nature, intended to repair assets that have been found to be defective, arising either as a result of the preventive inspection programme or in response to a callout.
Assumptions behind the Refurbishment and Renewal Maintenance Forecasts9.5.3.1
The definition of this expenditure in the Commerce Commission’s October 2008 paper conflicts with the maintenance category definitions in that often opex involving renewal of components of an asset are pre-planned in nature (such as transformer repair) or they form part of first fault response (such as replacement fuses). Powerco’s interpretation applied to this form of expenditure is it is best aligned to maintenance of a corrective nature, required to restore an asset to its proper condition so that it can continue to deliver its required service performance. It comprises all defect repairs, all work identified as being required to be followed up as a result of any routine maintenance inspection task and all fault follow-up work where permanent repairs are required to replace temporary repairs.

Return to Index 215ASSET MANAGEMENT PLAN ELECTRICITY NETWORKS FY2010 – FY2019
Budgeting for these expenditures has been done by extrapolating previous years’ expenditures with due allowance for extensions to the network (increase), efficiency in service provider (decrease) and ageing of equipment (increase). Corrective maintenance is difficult to budget for if the numbers and types of repairs are not foreseeably articulated. Ideally, defect information from the maintenance management system can be used to verify the forecast, but usually the defects arise post-forecast.
A reduction in this form of expenditure has been made reflecting a need for greater Fault and Emergency maintenance.
Nom
inal
Exp
end
iture
($00
0)
Infla
tion
Ind
ex
0
2.000
1.750
1.500
1.250
1.000
0.750
0.500
0.250
2006
A
2007
A
2008
A
2009
B
2010
F
2011
F
2012
F
2013
F
2014
F
2015
F
2016
F
2017
F
2018
F
2019
F
2021
F
2020
F
0
2,000
4,000
6,000
8,000
10,000
12,000
14,000
16,000
Refurbishment & Renewal Maintenance
Routine & Preventive Maintenance Inflation Index Financial Year
Figure 9.15: Refurbishment and Renewal Maintenance Expenditure.
As a long-term trend, it is expected that, as the asset base continues to age and a greater proportion of assets reach their end-of-life, corrective maintenance costs will have to increase. Conversely, however, many of the new assets being installed, such as switchgear, require much less maintenance than their older counterparts. If a shortfall exists in the refurbishment and renewal maintenance forecast, expenditure can potentially be borrowed from the preventive maintenance budget or the corrective maintenance can be deferred, but any deferred maintenance needs to be caught up with. The status of maintenance completion is outlined in Section 5.
Fault and Emergency Maintenance9.5.4.
Fault and Emergency Maintenance is reactive in nature and generally comprises callouts to restore power.
Assumptions behind Fault and Emergency Maintenance Forecast9.5.4.1
This category is reactive in nature, being the unscheduled inspection of an asset due to failure or if it is not providing its required performance level. It comprises activities undertaken by personnel responding to a reported failure of the network, including any back-up assistance necessary at the time to restore supply, repair leaks or make safe. The work can be either temporary or permanent in nature. Where follow-up work is needed, that is deemed to be corrective in nature.
Similarly to corrective maintenance, the Fault and Emergency Maintenance has been budgeted through historical extrapolation. It is benchmarked by considering the numbers of callouts and unit cost per job.
Nom
inal
Exp
end
iture
($00
0)
Infla
tion
Ind
ex
0
2.000
1.750
1.500
1.250
1.000
0.750
0.500
0.250
0
2,000
4,000
6,000
8,000
10,000
12,000
14,000
16,000
2006
A
2007
A
2008
A
2009
B
2010
F
2011
F
2012
F
2013
F
2014
F
2015
F
2016
F
2017
F
2018
F
2019
F
2021
F
2020
F
Fault & Emergency Maintenance
Routine & Preventive Maintenance Inflation Index Financial Year
Figure 9.16: Fault and Emergency Maintenance Expenditure.
System Management and Operations Expenditures9.5.5.
System Management and Operations expenditures include the direct costs associated with managing the network. This includes electricity network site expenses such as water, phone, power, communications and site leases. It includes network planning process expenses, the non-capitalisable portion of the service provider relationship management process (contract and project management), and network operations expenses.

Return to Index216 ASSET MANAGEMENT PLAN ELECTRICITY NETWORKS FY2010 – FY2019
Assumptions behind System Management and Operations Forecast9.5.5.1
The budgeted and forecast figures assume an annual efficiency improvement of 1.5% and an increasing network length of 1% per year. The reduction of cost in 2009 was because of a higher than forecast capitalisation recovery.
The System Management and Operations forecast expenditures are expected to increase because the capabilities of the Planning and Service Delivery teams are planned to expand.
Nom
inal
Exp
end
iture
($00
0)
Infla
tion
Ind
ex
0
2.000
1.750
1.500
1.250
1.000
0.750
0.500
0.250
0
2,000
4,000
6,000
8,000
10,000
12,000
14,000
16,000
2006
A
2007
A
2008
A
2009
B
2010
F
2011
F
2012
F
2013
F
2014
F
2015
F
2016
F
2017
F
2018
F
2019
F
2021
F
2020
F
System Management & Operations
Routine & Preventive Maintenance Inflation Index Financial Year
Figure 9.17: System Management and Operations Expenditure
Status of Maintenance Initiatives9.5.6.
A description of the status of completion of the maintenance programme against the maintenance plan is given in Section 5. The effectiveness of the maintenance initiatives are described in Section 6.
Expenditure forecast Summary9.6.
The Asset Management expenditure forecasts are given in Tables 9.3 to 9.5. All values are expressed in nominal $ terms (that is, the expected purchasing power of the dollar in the year that it is forecast in). Inflation indexing has been forecast with a long-term index of 2.2%.
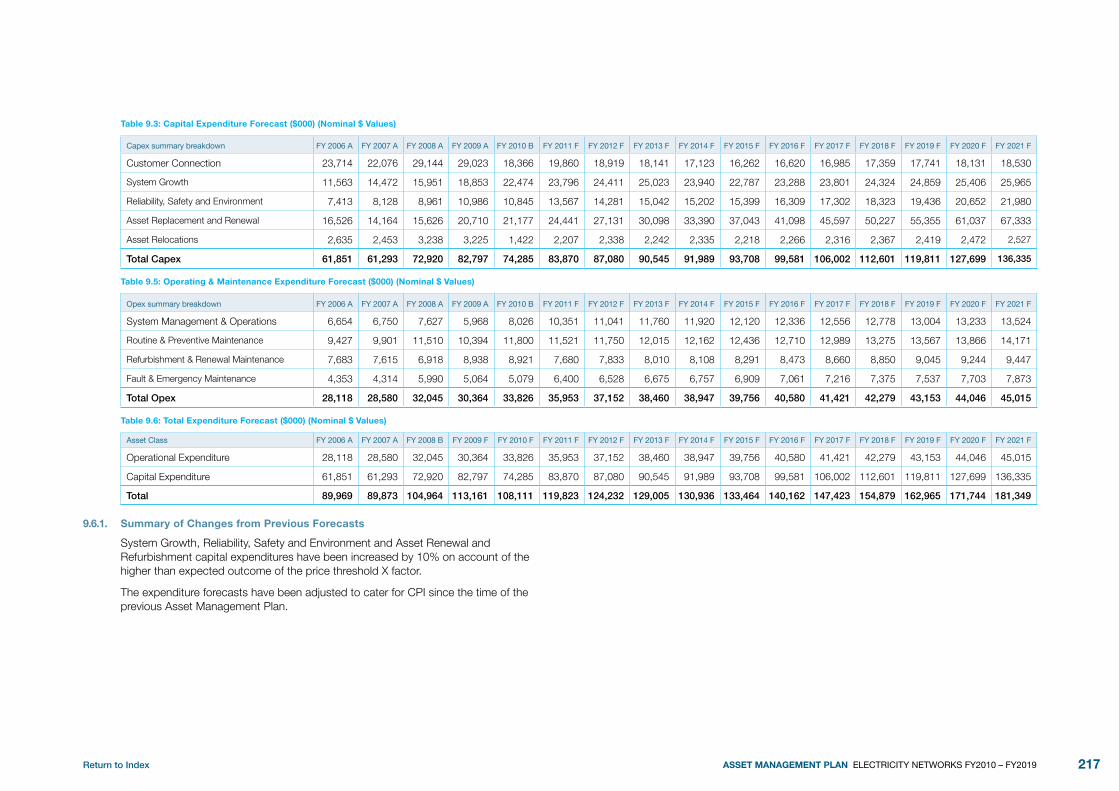
Return to Index 217ASSET MANAGEMENT PLAN ELECTRICITY NETWORKS FY2010 – FY2019
Table 9.3: Capital Expenditure Forecast ($000) (Nominal $ Values)
Capex summary breakdown FY 2006 A FY 2007 A FY 2008 A FY 2009 A FY 2010 B FY 2011 F FY 2012 F FY 2013 F FY 2014 F FY 2015 F FY 2016 F FY 2017 F FY 2018 F FY 2019 F FY 2020 F FY 2021 F
Customer Connection 23,714 22,076 29,144 29,023 18,366 19,860 18,919 18,141 17,123 16,262 16,620 16,985 17,359 17,741 18,131 18,530
System Growth 11,563 14,472 15,951 18,853 22,474 23,796 24,411 25,023 23,940 22,787 23,288 23,801 24,324 24,859 25,406 25,965
Reliability, Safety and Environment 7,413 8,128 8,961 10,986 10,845 13,567 14,281 15,042 15,202 15,399 16,309 17,302 18,323 19,436 20,652 21,980
Asset Replacement and Renewal 16,526 14,164 15,626 20,710 21,177 24,441 27,131 30,098 33,390 37,043 41,098 45,597 50,227 55,355 61,037 67,333
Asset Relocations 2,635 2,453 3,238 3,225 1,422 2,207 2,338 2,242 2,335 2,218 2,266 2,316 2,367 2,419 2,472 2,527
Total Capex 61,851 61,293 72,920 82,797 74,285 83,870 87,080 90,545 91,989 93,708 99,581 106,002 112,601 119,811 127,699 136,335
Table 9.5: Operating & Maintenance Expenditure Forecast ($000) (Nominal $ Values)
Opex summary breakdown FY 2006 A FY 2007 A FY 2008 A FY 2009 A FY 2010 B FY 2011 F FY 2012 F FY 2013 F FY 2014 F FY 2015 F FY 2016 F FY 2017 F FY 2018 F FY 2019 F FY 2020 F FY 2021 F
System Management & Operations 6,654 6,750 7,627 5,968 8,026 10,351 11,041 11,760 11,920 12,120 12,336 12,556 12,778 13,004 13,233 13,524
Routine & Preventive Maintenance 9,427 9,901 11,510 10,394 11,800 11,521 11,750 12,015 12,162 12,436 12,710 12,989 13,275 13,567 13,866 14,171
Refurbishment & Renewal Maintenance 7,683 7,615 6,918 8,938 8,921 7,680 7,833 8,010 8,108 8,291 8,473 8,660 8,850 9,045 9,244 9,447
Fault & Emergency Maintenance 4,353 4,314 5,990 5,064 5,079 6,400 6,528 6,675 6,757 6,909 7,061 7,216 7,375 7,537 7,703 7,873
Total Opex 28,118 28,580 32,045 30,364 33,826 35,953 37,152 38,460 38,947 39,756 40,580 41,421 42,279 43,153 44,046 45,015
Table 9.6: Total Expenditure Forecast ($000) (Nominal $ Values)
Asset Class FY 2006 A FY 2007 A FY 2008 B FY 2009 F FY 2010 F FY 2011 F FY 2012 F FY 2013 F FY 2014 F FY 2015 F FY 2016 F FY 2017 F FY 2018 F FY 2019 F FY 2020 F FY 2021 F
Operational Expenditure 28,118 28,580 32,045 30,364 33,826 35,953 37,152 38,460 38,947 39,756 40,580 41,421 42,279 43,153 44,046 45,015
Capital Expenditure 61,851 61,293 72,920 82,797 74,285 83,870 87,080 90,545 91,989 93,708 99,581 106,002 112,601 119,811 127,699 136,335
Total 89,969 89,873 104,964 113,161 108,111 119,823 124,232 129,005 130,936 133,464 140,162 147,423 154,879 162,965 171,744 181,349
Summary of Changes from Previous Forecasts9.6.1.
System Growth, Reliability, Safety and Environment and Asset Renewal and Refurbishment capital expenditures have been increased by 10% on account of the higher than expected outcome of the price threshold X factor.
The expenditure forecasts have been adjusted to cater for CPI since the time of the previous Asset Management Plan.
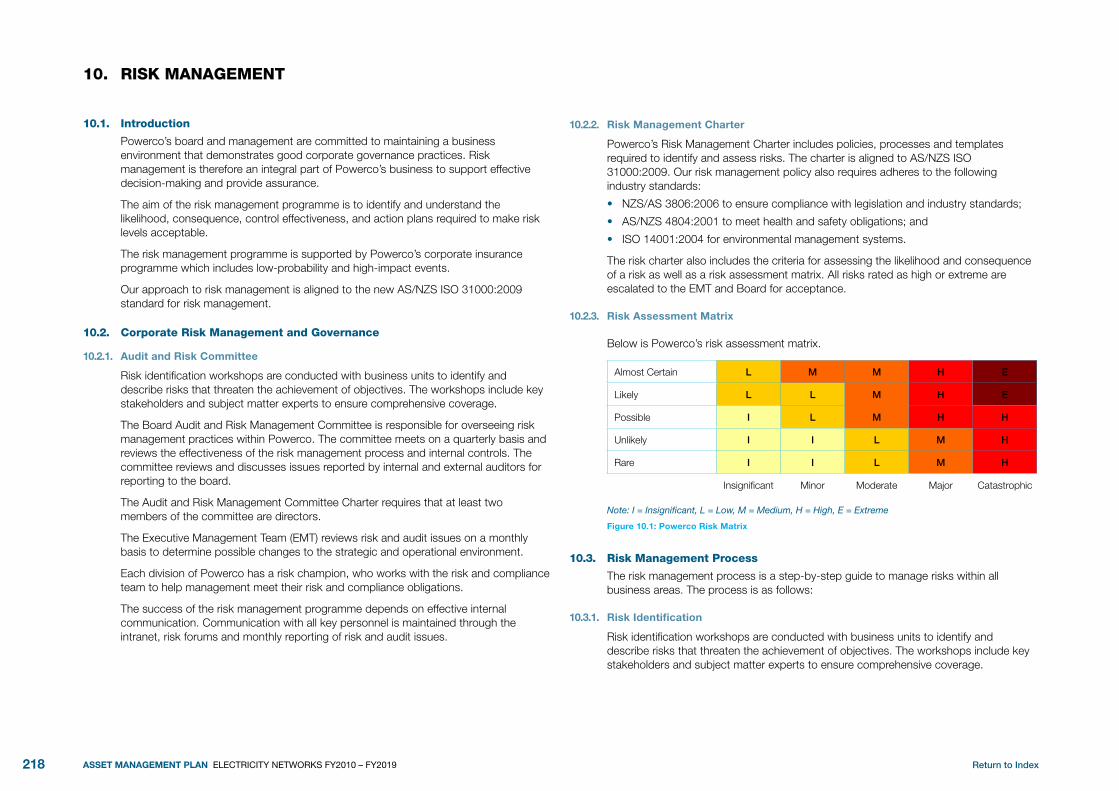
Return to Index218 ASSET MANAGEMENT PLAN ELECTRICITY NETWORKS FY2010 – FY2019
RISk MAnAgEMEnT10.
Introduction10.1.
Powerco’s board and management are committed to maintaining a business environment that demonstrates good corporate governance practices. Risk management is therefore an integral part of Powerco’s business to support effective decision-making and provide assurance.
The aim of the risk management programme is to identify and understand the likelihood, consequence, control effectiveness, and action plans required to make risk levels acceptable.
The risk management programme is supported by Powerco’s corporate insurance programme which includes low-probability and high-impact events.
Our approach to risk management is aligned to the new AS/NZS ISO 31000:2009 standard for risk management.
Corporate Risk Management and governance10.2.
Audit and Risk Committee10.2.1.
Risk identification workshops are conducted with business units to identify and describe risks that threaten the achievement of objectives. The workshops include key stakeholders and subject matter experts to ensure comprehensive coverage.
The Board Audit and Risk Management Committee is responsible for overseeing risk management practices within Powerco. The committee meets on a quarterly basis and reviews the effectiveness of the risk management process and internal controls. The committee reviews and discusses issues reported by internal and external auditors for reporting to the board.
The Audit and Risk Management Committee Charter requires that at least two members of the committee are directors.
The Executive Management Team (EMT) reviews risk and audit issues on a monthly basis to determine possible changes to the strategic and operational environment.
Each division of Powerco has a risk champion, who works with the risk and compliance team to help management meet their risk and compliance obligations.
The success of the risk management programme depends on effective internal communication. Communication with all key personnel is maintained through the intranet, risk forums and monthly reporting of risk and audit issues.
Risk Management Charter10.2.2.
Powerco’s Risk Management Charter includes policies, processes and templates required to identify and assess risks. The charter is aligned to AS/NZS ISO 31000:2009. Our risk management policy also requires adheres to the following industry standards:
NZS/AS 3806:2006 to ensure compliance with legislation and industry standards;•
AS/NZS 4804:2001 to meet health and safety obligations; and•
ISO 14001:2004 for environmental management systems.•
The risk charter also includes the criteria for assessing the likelihood and consequence of a risk as well as a risk assessment matrix. All risks rated as high or extreme are escalated to the EMT and Board for acceptance.
Risk Assessment Matrix10.2.3.
Below is Powerco’s risk assessment matrix.
Almost Certain L M M h E
Likely L L M h E
Possible I L M h h
Unlikely I I L M h
Rare I I L M h
Insignificant Minor Moderate Major Catastrophic
Note: I = Insignificant, L = Low, M = Medium, H = High, E = Extreme
Figure 10.1: Powerco Risk Matrix
Risk Management Process10.3.
The risk management process is a step-by-step guide to manage risks within all business areas. The process is as follows:
Risk Identification10.3.1.
Risk identification workshops are conducted with business units to identify and describe risks that threaten the achievement of objectives. The workshops include key stakeholders and subject matter experts to ensure comprehensive coverage.

Return to Index 219ASSET MANAGEMENT PLAN ELECTRICITY NETWORKS FY2010 – FY2019
Risk Analysis10.3.2.
Risk analysis workshops involve developing an understanding of the causes and sources of the risk, their likelihood and consequence, and existing controls.
Risk Evaluation10.3.3.
Risk evaluation allows decisions to be made on risks that need treatment and the priority of the treatment action. These priorities are based on the results of the risk analysis phase. Some risks may not require any further action if the current controls are deemed to be adequate.
Risk Treatment10.3.4.
Depending on the rating, Powerco’s risk treatment options are deliberated by management and executives. Options include the following strategies:
Risk avoidance;•
Reduction of likelihood or consequence;•
Elimination;•
Acceptance; and•
Risk sharing.•
Monitoring and Reporting10.3.5.
Powerco’s risk monitoring process aims to achieve the following:
Ensure that controls are effective and efficient;•
Identify improvement opportunities from risk assessment and incidents;•
Detect changes in the internal and external environment; and •
Identify emerging risks.•
Significant issues are escalated to senior management and Board.
key Risk Areas10.4.
Powerco’s risk management focuses on the following key areas:
Operational Continuity and Customer Relations10.4.1.
These relate to all risks that concern disruption to electricity supply and inadequate network capacity.
Adherence to network security criteria and renewal programmes are key parts of the Asset Management process, culminating in the preparation of the Asset Management Plan. A further aspect is the trade-off between price and quality of supply. An ongoing series of industry and public consultations quantifies the community’s required level of supply reliability. In accordance with industry standards, the supply security assessment process results in the Long Term Development Plan, which in turn results in the capital expenditure forecast.
The Performance Engineering process involves analysing network performance trends and developing remedies where necessary. Planned supply outages can be controlled through the network defects and fault management process. Live line techniques can often be applied, so that an outage is not needed. Other factors affecting reliability and public safety, such as vehicle collisions, trees, birds, vandalism and grass growing into equipment need to be monitored and controlled.
From a safety perspective, growing numbers of contractors working on the network mean, it is necessary for network assets to be designed, constructed and maintained to facilitate safe work practices. Important components of staff and contractor safety are regular training refreshers and competency assessments, access approval processes, and ongoing training of network controllers.
Natural Disasters are considered a major risk given that Powerco serves a wide area of the North Island, including areas that are exposed to high winds, seismic and volcanic activity, snow storms and floods, and forestry and bush areas sensitive to fire. The review of line design results from this risk profile.
The tactical response to these risks largely centres on contingency planning, with the Electricity Supply Continuity Plan being the main guiding document. The Network Operations Centre keeps an ongoing watch on weather forecasts to be forewarned of approaching storms. Powerco also maintains alliances with Civil Defence and regional councils, and takes part in Civil Defence exercises.

Return to Index220 ASSET MANAGEMENT PLAN ELECTRICITY NETWORKS FY2010 – FY2019
Environmental Management10.4.2.
To better identify and manage environmental risks and associated impacts, Powerco has joined the Landcare Research managed Enviro-MarkNZ programme. This programme sets out independently audited steps for the development of an Environmental Management System to ISO 14001:2004 standard. Powerco is actively working towards certification in this programme. The main environmental risks associated with the electricity network are:
Visual and physical encumbrances – these pertain to Powerco’s right to own assets •on the roadside or on private land. Powerco complies with the requirements set out in District Plans, the Electricity Act and the Transit Act;
Damage through oil spills and fire – Powerco aims to maintain equipment in good •condition and carry out regular inspections. Oil containment systems are being installed under a rolling refit programme or when new equipment is installed;
Health Effects from EMF – a watching brief is kept on the latest research, in •particular the work of CIGRE/CIRED Working Group 36.06, and our network operating policies include the limits in international guidelines;
Greenhouse gas emissions – SF6 gas is a potent greenhouse gas. Powerco only •uses this gas in a relatively small amount of network equipment. Powerco has a procedure for disposing of SF6 in line with national guidelines formulated as a result of a national working group in which Powerco participated;
Disposal of treated softwood poles – this is managed in accordance with local •authority guidelines. There is usually a high demand for old poles to be recycled for a variety of purposes;
PVC cables – the outer sheath can produce dioxins and furans if the cable burns •in the presence of the copper screen due to catalytic effect, e.g. when they fault. Powerco maintains equipment in good order and carries out regular inspections.
Regulatory and Legal Compliance10.4.3.
As a lifeline utility, Powerco has to comply with a variety of legislations. Risks in this domain concern complying with local government requirements, legislation, regulatory requirements and contractual obligations with service providers. Risks are managed by embedding compliance requirements into operational and maintenance processes. A review programme is also in place to ensure that existing standards are fully compliant. All changes to standards are communicated to contractors and other employees through awareness and training programmes.
Finance10.4.4.
One of the key outcomes of the risk management programme is to ensure the financial sustainability of the business. Risk management in this area relates to financial consequences of asset failure. Examples include revenue leakage and reduced throughput.
Health and Safety10.4.5.
Due to the nature of operations, health and safety of employees and third parties is recognised as a key issue. Powerco is continually working to improve health and safety practices and is guided by a number of industry standards including NZS 4801, NZS 4804 and NZS 7901. Work is also under way to implement an industry best practice hazard management system.
The risks of harm to the public and personnel are monitored through regular network inspections. During construction projects, these risks are monitored through an audit process. Security controls include operational procedures, along with systems of locks, keys and alarms, and controlled access of personnel to network sites. Dangerous sites are fenced to maintain public safety. Checks on the integrity of earthing systems are carried out regularly, as well as when equipment upgrades are carried out. Some of the changes in regulations about equipment earthing are vague and, to address this, Powerco has been participating in industry working groups. Personnel in the electricity industry are generally accustomed to safe work practices, but this is reinforced through Powerco’s culture of safety and through the field service audit process.
Powerco has an obligation under OSH legislation and the company’s own Use of System agreements with electricity retailers to provide reliable networks and a safe working environment.
Contingency Plans10.5.
Powerco has a comprehensive set of emergency response plans and procedures, which it regularly reviews and continues to develop to improve its performance in emergency situations.
Electricity Supply Continuity Plan10.5.1.
Powerco has a comprehensive set of emergency response plans and procedures, which it regularly reviews and continues to develop to improve its performance in emergency situations. Table 10.1 below provides an overview of some of the key plans and procedures that support the effective operation of the electricity network in emergency situations. The primary plan overriding all the other emergency plans and procedures is the Electricity Supply Continuity Plan (ESCP).
The ESCP sets out the composition, authority, responsibilities and the reporting structure for Electricity Emergency Response teams and resource allocation. Individual risks are not identified because procedures are designed to ensure that the support structure mobilised is appropriate to the particular emergency situation. Testing of the ESCP and training of staff is an on-going activity.

Return to Index 221ASSET MANAGEMENT PLAN ELECTRICITY NETWORKS FY2010 – FY2019
The aim of this plan is to:
“Sustain electricity network capabilities through abnormal, emergency situations by effective network management and practices.”
The plan is designed for emergencies, i.e. events that fall outside of the ordinary operation of the network that routinely deals with incidents as defined below.
Table 10.1: Key Operational Plans and Procedures for Network Incidents and Emergencies
Incidents
(Not covered by the ESCP)
An incident is an expected but unforeseeable event that can be managed within the normal operating framework of the Network Operations Centre.
These would be handled by personnel as virtually a routine job and would normally not require the presence of a Supervisor on site for the full duration of the operation.
Examples include:
Reported lines down or pole fires;
”No power” calls;
Network faults.
Emergencies
(Covered by the ESCP)
An emergency is an unplanned event that presents or has the potential to present a major disruption to the normal operation of the network. An emergency is too big a problem to be handled in a timely manner using business-as-usual resources and capabilities, e.g. without bringing in extra staff who are not on call.
Events that may cause, or be lead indicators for emergency situations mentioned above include (but are not limited to):
Natural disasters (severe storm, flooding, earthquake, volcanic eruption, cyclone, tsunami);
Major transmission network or generation failure;
Significant natural or human threat or impact to the Network Operations Centre.
A network emergency would require the presence on site of a supervisor as Site Control Officer and, depending on the classification, a Senior Manager at the emergency control centre.
General guidelines for classification of an event as an Emergency Situation are:
Loss (or potential loss) of 10,000 customers or 20MVA of load (or greater) where this is likely to be sustained for more than six hours;
Loss (or potential loss) of between 5,000 and 10,000 customers or between 10 and 20MVA of load where this is likely to be sustained for more than 10 hours;
The declaration of a Civil Defence Emergency;
The evacuation of the normal Network Operations Centre other than for a fire alarm.
The primary plan overriding all the other emergency plans and procedures is the Electricity Supply Continuity Plan (ESCP). The other plans and procedures that support the ESCP include:
Generic emergency procedures, such as the Major Network Incident and Severe •Weather Event procedures;
Specific Emergency Plans, such as the Pandemic Preparedness Plan and the •Security of Supply Response Plan, which outline specific responses that are appropriate to a specific type of emergency;
Support systems contingency plans, including the Operational Communications •Contingency Plan, SCADA Contingency Plan and the Load Management Contingency Plan, which provide guidance on how to support these critical functions when a failure occurs.; and
The Civil Defence Emergency Management and Civil Defence Liaison standards, •which guide the relationships with the Civil Defence authorities.
Major Network Event Procedures10.5.2.
Major Network Incident and Severe Weather Event Procedures outline the generic emergency response process that is used to respond to a wide range of emergencies. They provide guidelines for assessing the extent of the damage or threat, making necessary preparations and responding appropriately to severe weather events and major network incidents that cause extensive loss of electricity supply to customers. It provides a basis for communicating and establishing a common understanding of the specific roles, responsibilities, requirements and activities to be undertaken in response to severe weather events and major network incidents. It provides guidance on the appropriate response to a range of events based on their impact on the performance of the network and its ability to supply customers.
The procedures scale up to and interface seamlessly with the more comprehensive Electricity Supply Continuity Plan, which provides guidelines for Powerco’s planned response to very large scale events. Figure 9.2, which is an extract from the Major Network Incident and Severe Weather Event Procedures, provides general guidelines for assessing the severity of an emergency event in terms of its effect on the electricity network. Depending on the event and its effect (or likely effect) on the network, Powerco NOC will announce an appropriate storm response level (categorised in terms of an R – Readiness, L1 – Level 1, L2 – Level 2, or L3 – Level 3) based on one or more of the parameters detailed below. It is important to note, however, that a final assessment will need to be made on a storm-by-storm basis, with knowledge of all the relevant facts.
Based on the assessed storm response level, the procedures provide further guidance on the types and level of activities that would be deemed appropriate in responding to the event.

Return to Index222 ASSET MANAGEMENT PLAN ELECTRICITY NETWORKS FY2010 – FY2019
The procedures also identify and provide guidance on three main emergency response processes – the restoration process, the strategic management process and the stakeholder communication process.
Generic Emergency Procedures
Specific Emergency Plans
Support Systems Contingency Plans
SE
VE
RIT
Y O
F E
ME
RG
EN
CY
Electricity Supply Continuity Plan
Busines As Usual
Major Network Incident and Severe Weather Event Procedures
(Restoration, Strategy & Communications)
(L1, L2, L3)Security of Supply Response Plan
Pandemic Preparedness Plan Operational Comms Contingency Plan
SCADA Contingency Plan
Load Management Contingency Plan
NOC Disaster Recovery Plan
Figure 10.2: NOC Emergency Response Framework.
Substation Contingency Plans10.5.3.
A comprehensive set of site-specific substation contingency plans exist, which are regularly reviewed. These plans identify known local risks and operational options for dealing with local network problems that could arise.
Business Continuity Plans (Process, Information Technology and Loss of Precinct)10.5.4.
Powerco’s Business Continuity Plan (BCP) is designed to manage and support a number of scenarios, including system failure, major infrastructure failure or loss of the network operations centre. The BCP is supported by a Business Impact Analysis, which is conducted on a regular basis by business units to identify and prioritise critical infrastructure, assets and processes for recovery action. The BCP is rehearsed by the appropriate teams on a regular basis and Powerco’s IT infrastructure has been designed with built-in resilience to ensure continuity of operations.
Pandemic Contingency Plans10.5.5.
Powerco has developed a plan to prepare and respond to an influenza pandemic occurring in New Zealand. This Plan provides a basis for establishing a common understanding of the specific roles, responsibilities, requirements and activities to be undertaken in response to the pandemic in to ensure the operational integrity and continuity of the Electricity and Gas networks to their fullest possible extent, even though this may be at a reduced level, both during and after the pandemic. Due to the unpredictable nature of pandemics, the plan also considers the wider implications for the company beyond “keeping the lights on and gas fires burning”. These implications for Powerco therefore go beyond its obligations as a lifeline utility provider.
Risk Management Application to Asset Management10.6.
As set out in Section 4.1, a trade-off exists in the Asset Management process between network performance, cost and levels of network risk. The purpose of risk management from an Asset Management perspective is to manage risks that may prevent the infrastructure assets from meeting service potential targets or cause harm to people or financial loss to Powerco. The term “manage risk” may mean to reduce, eliminate, transfer or accept the risk.
The Risk Management Charter and profiles are applied to the development, renewal and maintenance of all infrastructure assets covered by the Powerco Asset Management Plan.

Return to Index 223ASSET MANAGEMENT PLAN ELECTRICITY NETWORKS FY2010 – FY2019
Risk Management Process: Review of Maintenance Methodology10.6.1.
This procedure is used to review maintenance methodologies:
Identify the hazards that present risk:
To the safety of employees and the general public;•
To the environment; and•
Of electricity supply interruptions.•
These can be caused by:
Environmental conditions, such as lightning, ice, floods, slips, land subsidence or •earthquake;
External factors, such as vehicle collision, trees, vandalism, bird strikes, possums, •uncontrolled digging or vermin/grass in kiosks;
Equipment failure, such as inherent design inadequacy, overload deterioration, •moisture ingress or corrosion;
Operational error, such as incorrect protection settings or operating wrong •equipment; or
Substandard workmanship, on such tasks as as jointing, binding, cable-laying or •terminating.
Conduct a failure mode and effects analysis (FMEA) on each class of assets and general groups of assets (i.e. zone substations). For each failure mode review the maintenance that could be performed to prevent or reduce the consequences of the failure includes:
Estimate the effects of carrying out the maintenance in reducing the likelihood and •repair time for the failure;
Calculate the cost of the maintenance or action;•
Calculate the cost of the failure where this relates to electricity supply interruptions •or environmental damage;
For safety related risk, determine the severity rating and probable frequency, and •determine what actions are required to reduce or eliminate the likelihood of the risk eventuating;
During the review consideration shall be given to the other Asset Management •drivers to ensure that there are no conflicts with the maintenance methodologies. Any conflicts that do exist should be resolved by reviewing all drivers.
Select the maintenance activities that:
Provide positive NPV;•
Are required from a health and safety standpoint; and•
Do not conflict with the other Asset Management drivers.•
In carrying out this procedure, the results of existing maintenance practices are reviewed. Feedback from the field that occurs during the maintenance may contain valuable information on the effectiveness or otherwise of the maintenance activity.
Risk Management Process: Design Overhead Lines 10.6.2.
In recent years, Powerco has experienced several significant storm events. A critical success factor of Powerco’s response to storm events is the well defined and pre-prepared emergency response structure of its Electricity Supply Continuity plan. Based on Business Continuity concepts, the supply continuity plan is scaleable and generic, and provides the framework necessary to manage response activities effectively and efficiently along regional process lines.
In some areas, the network is predominantly overhead lines and whilst it performs fairly reliably under both summer and winter conditions, it is ageing. The poles in these areas are approaching 40 years old and some degradation is evident in the line components. The original design and construction standards have proved adequate for normal weather conditions but they are increasingly becoming inadequate for storm conditions.
Powerco has adopted a limit state line design process in its design standards to future-proof the network and is in the process of rolling this out to its contractors. Firstly, there is growing concern that storms are becoming more severe and regular, and new design principles allow special consideration of storm-prone areas as the network is renewed. Secondly, there is a need for greater consistency across Powerco’s network area. As the network has grown through mergers and acquisitions, a variety of line design practices are still being used.
Limit state design processes allow a probability and return period approach to be applied to the calculation of risk-based critical loads. Overhead lines are subject to conductor static loads, personnel working aloft, temperature changes, wind loads, snow accumulation on conductors and conductor dynamic loads. The most significant influence affecting line design is the prevailing weather. As the loads vary in differing ways under different conditions, such as in exposed, high-altitude areas with low temperatures, it is unlikely that all worst-case scenario loads will be experienced coincidentally. Account can also be taken of material deterioration and material end-of-life states.
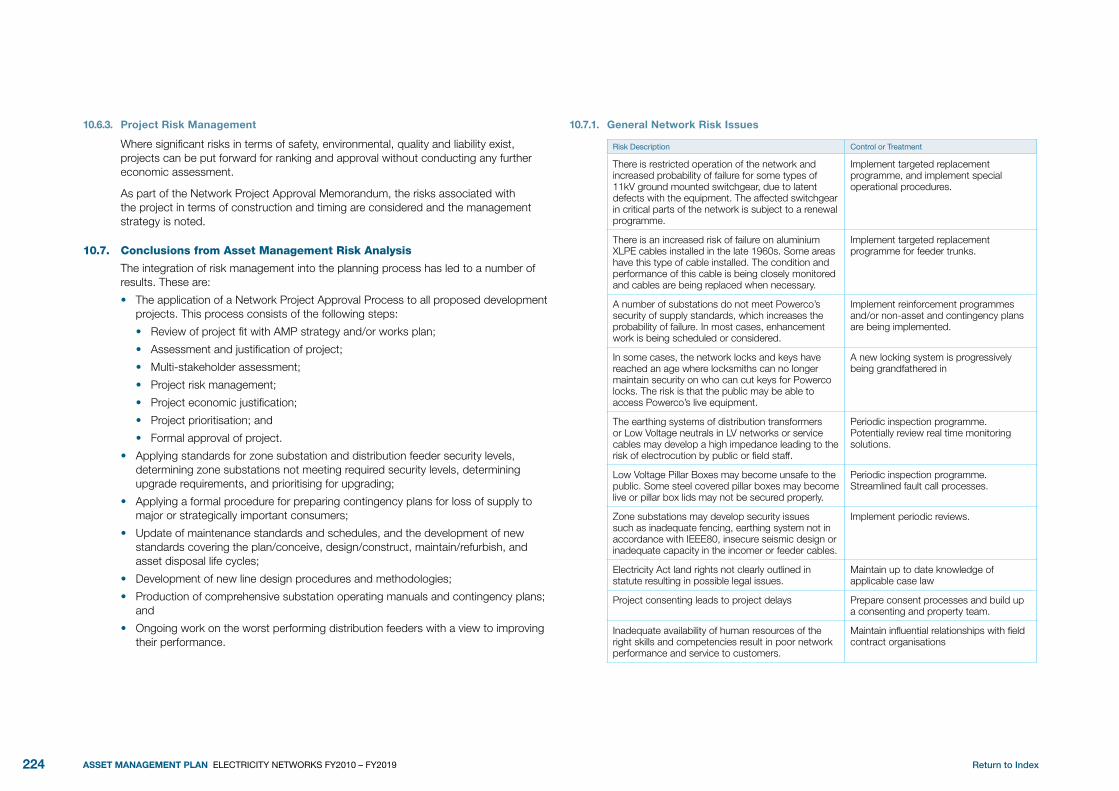
Return to Index224 ASSET MANAGEMENT PLAN ELECTRICITY NETWORKS FY2010 – FY2019
Project Risk Management10.6.3.
Where significant risks in terms of safety, environmental, quality and liability exist, projects can be put forward for ranking and approval without conducting any further economic assessment.
As part of the Network Project Approval Memorandum, the risks associated with the project in terms of construction and timing are considered and the management strategy is noted.
Conclusions from Asset Management Risk Analysis10.7.
The integration of risk management into the planning process has led to a number of results. These are:
The application of a Network Project Approval Process to all proposed development •projects. This process consists of the following steps:
Review of project fit with AMP strategy and/or works plan;•
Assessment and justification of project;•
Multi-stakeholder assessment;•
Project risk management;•
Project economic justification;•
Project prioritisation; and•
Formal approval of project.•
Applying standards for zone substation and distribution feeder security levels, •determining zone substations not meeting required security levels, determining upgrade requirements, and prioritising for upgrading;
Applying a formal procedure for preparing contingency plans for loss of supply to •major or strategically important consumers;
Update of maintenance standards and schedules, and the development of new •standards covering the plan/conceive, design/construct, maintain/refurbish, and asset disposal life cycles;
Development of new line design procedures and methodologies;•
Production of comprehensive substation operating manuals and contingency plans; •and
Ongoing work on the worst performing distribution feeders with a view to improving •their performance.
General Network Risk Issues10.7.1.
Risk Description Control or Treatment
There is restricted operation of the network and increased probability of failure for some types of 11kV ground mounted switchgear, due to latent defects with the equipment. The affected switchgear in critical parts of the network is subject to a renewal programme.
Implement targeted replacement programme, and implement special operational procedures.
There is an increased risk of failure on aluminium XLPE cables installed in the late 1960s. Some areas have this type of cable installed. The condition and performance of this cable is being closely monitored and cables are being replaced when necessary.
Implement targeted replacement programme for feeder trunks.
A number of substations do not meet Powerco’s security of supply standards, which increases the probability of failure. In most cases, enhancement work is being scheduled or considered.
Implement reinforcement programmes and/or non-asset and contingency plans are being implemented.
In some cases, the network locks and keys have reached an age where locksmiths can no longer maintain security on who can cut keys for Powerco locks. The risk is that the public may be able to access Powerco’s live equipment.
A new locking system is progressively being grandfathered in
The earthing systems of distribution transformers or Low Voltage neutrals in LV networks or service cables may develop a high impedance leading to the risk of electrocution by public or field staff.
Periodic inspection programme. Potentially review real time monitoring solutions.
Low Voltage Pillar Boxes may become unsafe to the public. Some steel covered pillar boxes may become live or pillar box lids may not be secured properly.
Periodic inspection programme. Streamlined fault call processes.
Zone substations may develop security issues such as inadequate fencing, earthing system not in accordance with IEEE80, insecure seismic design or inadequate capacity in the incomer or feeder cables.
Implement periodic reviews.
Electricity Act land rights not clearly outlined in statute resulting in possible legal issues.
Maintain up to date knowledge of applicable case law
Project consenting leads to project delays Prepare consent processes and build up a consenting and property team.
Inadequate availability of human resources of the right skills and competencies result in poor network performance and service to customers.
Maintain influential relationships with field contract organisations

Return to Index 225ASSET MANAGEMENT PLAN ELECTRICITY NETWORKS FY2010 – FY2019
Risk Description Control or Treatment
A natural disaster occurs that results in damage to networks.
Maintain adequate levels of critical spares. Maintain ongoing relationships with CDEM coordination groups. Maintain contingency plans and take part in disaster exercises when the opportunity arises.
A network event causes a serious injury or fatality. Continually reinforce health and safety culture and initiatives. If a job cannot be done safely, it should not be done.
Public cannot report in to advise network related incidents that endanger public.
NOC staffed 24/7. PABX has adequate security and backup ability.
Loss of certain records on location, attributes and condition of assets.
Ensure key information systems are populated with adequate data. Undertake data audits from field.
SCADA communications failure results in limited or no visibility of network status.
Ensure SCADA MS and communication trunks have adequate security.
Eastern Region At-Risk Situations10.7.2.
There are several situations on the Eastern networks where Powerco is at risk in the event of a fault. These are listed below. Plans to deal with these risks are being investigated.
Transmission capacity into the Tauranga region has been limited and, under some •circumstances of high demand, grid emergencies develop. As load continues to grow, more capacity is becoming urgently needed. Transpower has increased the thermal capacity of lines into Tauranga GXP and additional transformer capacity is being added at GXPs, but the Poike Tee still exists. A long term view to upgrading existing transmission lines in the area.
The ring supplying the CBD of Tauranga is presently at N-1 capacity and the •contingent load on the Committee circuits between Tauranga GXP and Greerton is above the circuit capacity. Additional capacity is planned over the next three years.
The pilots protecting the 33kV feeders supplying the Tauranga CBD are all in the •same cable. Damage to this one cable could cause loss of supply to the entire CBD. The opportunity to lay new pilots or fibre optic cable will next arise when the new 33kV feeders to Waihi Rd are laid.
Thames is supplied by a single 66kV line and, in the event of its failure, the majority •of the town’s load would be interrupted for repair time. Construction of a second line is under way.
The Waihi substation peak load is around 6MVA above its class capacity, although •much of the load results from mining operations, which have been expected for some time to reduce. Capacity increase options are subject to negotiation with the local mining company.
Zone substation capacity at Matamata is not enough to provide N-1 security level •without much switching on the distribution network. A second transformer is proposed to be installed at Brown St or Tower Rd.
Lake Rd and Waihi Beach do not meet their required security levels, but instead rely •upon switching in the distribution networks to provide back up supplies to cover for loss of equipment availability. In worst cases, back up supplies may be inadequate. The new substation is under construction for Katikati and will relieve the security of supply issue at Kauri Point.
A number of substations, such as Baird Rd, Maraetai Rd, Morrinsville, Kauri Point, •Matua, Pongakawa, Kerepehi, Matatoki, and Whangamata do not meet Powerco’s required security levels as they are supplied by single lines and do not have full distribution network support. A route for a second line to Whangamata is being worked on. However, the construction of lines is complicated significantly by the need for resource consent and landowner consent.
Putaruru and Tirau are supplied from Hinuera GXP by a single line, with very little •supply being able to be restored in the event of loss of availability. Tirau has a large dairy factory. A new GXP for Putaruru is planned to overcome this.
Whitianga and Coromandel, major tourist and holiday destinations, are supplied by a •single 66kV line. A project to obtain easements is under way to enable construction of a second 66 kV line to Whitianga, although this is taking a long time to obtain. Thermal upgrades of the existing 66kV lines have recently been completed and reconductoring of these lines is under way. The extension of the second line to Coromandel is not considered to be viable.
Because of the terrain it is difficult to back up the supply to customers in the •Coromandel Peninsula following faults on the distribution network. The network also becomes heavily loaded during holiday periods and full back up security cannot be assured.
Several substations do not have oil containment facilities and work on implementing •these is proceeding.
Recent large scale load growth in the Te Puke area has left some distribution feeders •with little back up capacity, and the surrounding terrain does not facilitate the backing up of load from adjacent feeders. The new Atuaroa Rd zone substation has recently been constructed to supplement supply at Te Puke, which will go some way to resolving these issues. The proposed substations at Paengaroa, Te Matai and Rangiuru should help resolve other areas, and more 11kV ties will be installed as landowners allow.
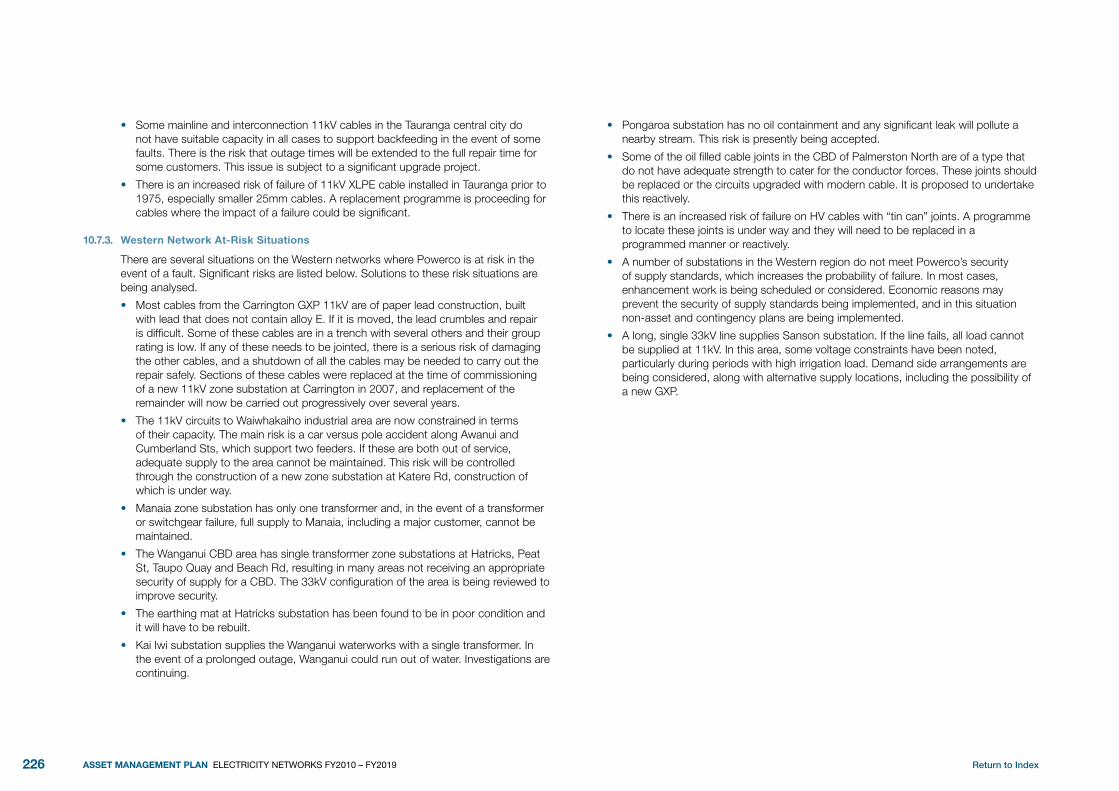
Return to Index226 ASSET MANAGEMENT PLAN ELECTRICITY NETWORKS FY2010 – FY2019
Some mainline and interconnection 11kV cables in the Tauranga central city do •not have suitable capacity in all cases to support backfeeding in the event of some faults. There is the risk that outage times will be extended to the full repair time for some customers. This issue is subject to a significant upgrade project.
There is an increased risk of failure of 11kV XLPE cable installed in Tauranga prior to •1975, especially smaller 25mm cables. A replacement programme is proceeding for cables where the impact of a failure could be significant.
Western Network At-Risk Situations10.7.3.
There are several situations on the Western networks where Powerco is at risk in the event of a fault. Significant risks are listed below. Solutions to these risk situations are being analysed.
Most cables from the Carrington GXP 11kV are of paper lead construction, built •with lead that does not contain alloy E. If it is moved, the lead crumbles and repair is difficult. Some of these cables are in a trench with several others and their group rating is low. If any of these needs to be jointed, there is a serious risk of damaging the other cables, and a shutdown of all the cables may be needed to carry out the repair safely. Sections of these cables were replaced at the time of commissioning of a new 11kV zone substation at Carrington in 2007, and replacement of the remainder will now be carried out progressively over several years.
The 11kV circuits to Waiwhakaiho industrial area are now constrained in terms •of their capacity. The main risk is a car versus pole accident along Awanui and Cumberland Sts, which support two feeders. If these are both out of service, adequate supply to the area cannot be maintained. This risk will be controlled through the construction of a new zone substation at Katere Rd, construction of which is under way.
Manaia zone substation has only one transformer and, in the event of a transformer •or switchgear failure, full supply to Manaia, including a major customer, cannot be maintained.
The Wanganui CBD area has single transformer zone substations at Hatricks, Peat •St, Taupo Quay and Beach Rd, resulting in many areas not receiving an appropriate security of supply for a CBD. The 33kV configuration of the area is being reviewed to improve security.
The earthing mat at Hatricks substation has been found to be in poor condition and •it will have to be rebuilt.
Kai Iwi substation supplies the Wanganui waterworks with a single transformer. In •the event of a prolonged outage, Wanganui could run out of water. Investigations are continuing.
Pongaroa substation has no oil containment and any significant leak will pollute a •nearby stream. This risk is presently being accepted.
Some of the oil filled cable joints in the CBD of Palmerston North are of a type that •do not have adequate strength to cater for the conductor forces. These joints should be replaced or the circuits upgraded with modern cable. It is proposed to undertake this reactively.
There is an increased risk of failure on HV cables with “tin can” joints. A programme •to locate these joints is under way and they will need to be replaced in a programmed manner or reactively.
A number of substations in the Western region do not meet Powerco’s security •of supply standards, which increases the probability of failure. In most cases, enhancement work is being scheduled or considered. Economic reasons may prevent the security of supply standards being implemented, and in this situation non-asset and contingency plans are being implemented.
A long, single 33kV line supplies Sanson substation. If the line fails, all load cannot •be supplied at 11kV. In this area, some voltage constraints have been noted, particularly during periods with high irrigation load. Demand side arrangements are being considered, along with alternative supply locations, including the possibility of a new GXP.

Return to Index 227ASSET MANAGEMENT PLAN ELECTRICITY NETWORKS FY2010 – FY2019
ASSET MAnAgEMEnT IMPRoVEMEnT11.
Introduction11.1.
This section presents a review of the foreseen initiatives to improve Powerco’s Asset Management and Customer Management practices, systems and processes. It starts with a recap of where we are presently against a view of where we would like to be in five years’ time and then describes some of the process improvements and programmes we should adopt and undertake during this time.
Review of AM Maturity 11.2.
Background11.2.1.
Powerco has a philosophy of continual improvement in its Asset Management and Customer Management processes (as well as other business processes). Powerco’s Asset Management process is described in Section 2.
A Gap Analysis assessment of the level of maturity of Powerco’s electricity network Asset Management processes is presented in Figure 11.2. This analysis is based on Section 2.4 of the International Infrastructure Management Manual (IIMM), which is summarised in Figure 11.1. The IIMM assessment reviews the level of awareness, competence and best practice. In this context, best practice has been rather arbitrarily defined: we have taken this to mean an “Asset Management nirvana” or the practical ideal.
unsatisfactory(unaware)
unsatisfactory(aware)
Poor Competent Best Practice
Figure 11.1: IIMM Gap Analysis Assessment Model
Gap Analysis11.2.2.
The Gap Analysis is a self-assessment and shows Powerco to be in the average status in terms of where it is going in its Asset Management performance. It does not seek to benchmark Powerco’s Asset Management performance with its peers. In line with its philosophy of continual business improvement, Powerco is endeavouring to continually improve its electricity network Asset Management processes, systems and practices.
One key area of focus is the ongoing improvement of information systems. Programmes of work in progress, to replace the SCADA and outage management systems with best practice, modern technology systems. Automation of maintenance management practices continues to improve asset information and data on asset condition, with the ability to use this information to drive an optimised renewal planning and condition-based maintenance programme. Also, in terms of our plans, our spending is constrained to less than the amount needed to complete all projects in the
Improvement Register.
Gap
Ana
lysi
s
Ass
essm
ent
Sco
re
Pla
n
Pro
cess
es
Dat
a an
d
Info
rmat
ion
Info
rmat
ion
Sys
tem
s
Imp
l. Ta
ctic
s
Ass
et M
anag
emen
t Pla
n (N
etw
ork
Leve
l)A
dva
nce
Ass
et M
anag
emen
t Pla
nsM
aint
enan
ce S
tand
ard
sD
esig
n an
d C
onst
ruct
ion
Sta
ndar
ds
Op
timis
ed re
new
al s
trat
egy
Dev
elop
men
t Pla
nFo
rwar
d w
ork
pro
gram
me
Mon
itorin
g Le
vel o
f Ser
vice
Kno
wle
dge
of A
sset
sC
ond
ition
Ass
essm
ents
Op
erat
ions
and
Mai
nten
ance
Per
form
ance
mon
itorin
gO
ptim
ised
Life
Cyc
le s
trat
egy
Des
ign
Pro
ject
Man
agem
ent
Rev
iew
Aud
itA
sset
Info
rmat
ion
Inte
grity
Ass
et A
ttrib
utes
Info
rmat
ion
Bac
k-up
His
toric
al c
ond
ition
mai
nten
ance
dat
aA
sset
Util
isat
ion
Mon
itorin
gFu
ture
pre
dic
tion
dat
aLi
fe C
ycle
cos
tings
Ben
chm
arki
ng d
ata
Geo
grap
hica
l Inf
orm
atio
n S
yste
ms
WM
/ Fi
nanc
ial S
yste
mM
aint
enan
ce M
anag
emen
tC
usto
mer
Req
uest
sR
isk
Man
agem
ent
Inte
grat
ion
of S
yste
ms
Pla
ns a
nd R
ecor
ds
Com
mer
cial
Tac
tics
Org
anis
atio
n/P
eop
le Is
sues
Bes
t P
ract
ice 100
95
90
85
LOW
AV
ER
AG
E G
OO
D
Co
mp
eten
t
80
75
70
65
60
55
Po
or
50
45
40
35
Uns
atis
fact
ory
(aw
are)
30
25
20
15(u
n-aw
are) 10
5
Figure 11.2: Analysis of Powerco Electricity Asset Management Capabilities
Current Score Appropriate Score (5yrs)

Return to Index228 ASSET MANAGEMENT PLAN ELECTRICITY NETWORKS FY2010 – FY2019
Commentary on the Gap Analysis11.2.3.
Comments on the Gap Analysis and links to other sections of the AMP are outlined as follows:
asset Management Plan: The Asset Management Plan and the associated suite of asset management documentation is now at the stage where a good base has been made from which improvements can be made. It is strong in the areas of strategy and policy, and improving the level of compliance of the April 2009 Asset Management Plan is a target area for improvement.
advanced asset Management Plans: This is at a relatively early stage (refer to Section 11.5). Greater use of the Asset Management process for driving business planning is an opportunity.
Maintenance Standards: The content of these is good but their structure needs improving and they need to be moved into an overall standard structure, which is being developed, and the constraints of the maintenance management system need to be factored into their content more. They are presently as fully time-based as the maintenance system allows and they benefit from increased use of condition-driven maintenance practices (refer to Section 6.3).
Design and Construction Standards: These are fairly well set out and documented and improving all the time, but their coverage is patchy and adherence to these across the business is an ongoing area of improvement (refer to Section 6.2).
Optimised asset Renewal Strategy: There is plenty of scope for asset renewal strategy to be improved, given the implementation of the Gas and Electricity Maintenance (GEM), maintenance management system. Incorporation of condition data should be improved from which targeted renewal forecasts and programmes will be able to be made (refer to Section 6.4).
Development Plans: These are well set up and documented, but there needs to be greater facilitation towards longer term resource consent application and easement acquisition campaigns, and the subtransmission network architectures in Huirangi, Wanganui and Palmerston North need long-term focus for improvement. There is scope for automated use of GIS, SCADA and PI for network modelling; dynamic line rating and optimised cable rating (refer to Section 7.12).
Forward Work Programme: The preparation of the Five-Year Plan and its incorporation into the Improvement Register is a major process advance. The Five-Year Plan process should continually improve.
Monitoring Levels of Service: This process works fairly well through the Network Performance process, although improvements in what the business does to close the loop in how customer complaints and network defects are handled can be made (refer to Section 5.3).
Knowledge of the assets: Ongoing improvements to the quality of information held in the information systems is a major opportunity for improvement, such as conductor types and sizes, protection equipment information, zone substation equipment (refer to Section 2.8 and 6.3).
Condition assessments: Ongoing improvements in the quality of asset condition assessments should be able to be made. Projects such as the adoption of mobile devices for condition assessments should improve this process (refer to Section 6.3).
Operations and Maintenance: Improvements in the quality of data in GIS and use of the new SCADA system and planned outage scheduling will improve our operations and maintenance processes (refer to Section 2.8). Management of the maintenance and the defects processes can be improved.
Performance Monitoring: The reliability monitoring process appears to be working well.
Optimised Life Cycle Strategy: A good framework exists with the Asset Life Cycle and Asset Renewal plans and ongoing improvements to these can be organic (refer to Sections 6.1 to 6.5).
Design Project Management: A continual focus on maintaining design and project management skills should be kept up, quality of designs can be improved, and we need to continue to encourage young engineers and technical professionals to enter the industry.
Review audit: This process appears to work well at a corporate level, although its visibility could be improved.
asset Information Integrity and asset attributes: Information on the assets is a core Asset Management need. Some delays have existed with the as-building of information systems. There have been improvements this year and improvements are expected to be ongoing (refer to Sections 2.8 and 6.3).
Information Back-up: At an IT level, this process has improved significantly over recent years and has now been benchmarked as best practice.
historical Condition Maintenance Data: This data is fragmented and in a variety of different locations. There is large potential for improvement here (refer to Section 6.3).
asset utilisation Monitoring and Future Prediction Data: Historical SCADA data is limited in points and Maximum Demand Information from distribution transformers is in many cases not available. Possible improvements include the use of technology. The SCADA PI system is a good enabler for operational prediction. Use of a data warehouse for holding existing data that can be extrapolated will enhance the accuracy of the future prediction processes.

Return to Index 229ASSET MANAGEMENT PLAN ELECTRICITY NETWORKS FY2010 – FY2019
Life Cycle Costings: Ongoing improvements in the assessment of project unit costs should be possible.
Benchmarking Data: Certain benchmarking can be done through use of industry-disclosed information. Internal benchmarking of unit costs by team and over time is a process that can inevitably be improved.
Geographical Information Systems: A high grade ESRI GIS has recently been installed. Connectivity has improved over last year. The system itself is world class, but its ability to extract data for use in load-flow modelling needs to be improved and certain extraction processes could be automated (refer to Section 2.8).
WM/Financial System: This system is an enterprise system but additional training could enhance the ability to report from it.
Maintenance Management: The JDE maintenance management system has been implemented, and although not a purpose-built maintenance management system, it, shows a lot of promise for providing a step change improvement in maintenance management. At time of writing, hand-held applications for this system are being deployed in the field.
Customer Requests: This process appears to work adequately although the ability to obtain reports consistently has been an issue in the past.
Risk Management: This risk management system, Methodware, is a competent system. Improvements can always be made on the communication of risks from the field staff.
Integration of Systems: Ongoing improvement will inevitably be possible with this. The Billing systems provide the potential for improvement for integration and these are expected to be replaced in the next couple of years.
Plans and Records: The accuracy of many of the drawings in the system is continually improving. Ongoing improvements in the housekeeping of these should be possible (refer to Section 2.8).
Commercial Tactics and Organisation/People Issues: The age profile of technical staff shows many staff are nearing retirement. A programme to bring in young engineering staff is being implemented.
Constraints on Asset Management Process11.2.4.
Generally, Powerco is experiencing the following constraints that are common to all network asset owners:
Financial constraints; •
General industry lack of skilled engineering resources;•
Ageing workforces;•
Changing technical compliance environment;•
Increasing community expectations around the footprint of the network and •greenhouse emissions;
Growing requirements for Road Opening Notices by TLAs;•
Short-term focus of consumers versus the long-term focus of network owners;•
Increasing traffic management costs;•
Lack of availability of specialised spare parts and constraints on field resources;•
Limitations in quality information on asset condition; and•
Limitations in the systems available to analyse the asset condition information.•
Actions around the constraints in the Asset Management process include ensuring adequate numbers of engineering staff with the right skills are available in 10 and 20 years’ time. Engineering skills take many years to build up and it is important that there is not a gap in the skill levels and access to mentors as older engineers and technical professionals retire.
Further actions include enhanced supply chain relationships to ensure adequate access to equipment and spare parts.
The purpose of the Network Performance process is to proactively monitor service quality issues and improve network service performance. The objective is to ensure the networks deliver the required performance and that any substandard performance is addressed promptly and effectively. Key improvements are noted in Section 11.3.
Improvement Initiatives 11.3.
Network Performance Process11.3.1.
The purpose of the Network Performance process is to proactively monitor service quality issues and improve network service performance. The objective is to ensure the networks deliver the required performance and that any substandard performance is addressed promptly and effectively. Key improvements made include:
Continued careful management of planned shutdown SAIDI allowances;•
Implementation of fault locators on key lines;•
Implementation of the blitz approach to line renewal activities. This approach means •that lines worked on are given a clean bill of health for 10 years;
Replacement of older reclosers with modern automated reclosers; and•
Vegetation control targeted from network reliability performance.•
The Network Improvement sub-process includes both reactive (short-term) and •proactive (long-term) performance management elements, and provides important feedback to the planning process.

Return to Index230 ASSET MANAGEMENT PLAN ELECTRICITY NETWORKS FY2010 – FY2019
Maintenance Process Improvement Initiatives 11.3.2.
Progress of the maintenance programme is monitored and reported on in two ways at Powerco. Each month, actual completion is reviewed against the plan by a maintenance project manager and the percentage of complete progress reported. This information becomes part of an overall company report to the Board of Directors. Deviations from the plan are explained and management action implemented where appropriate.
At the end of the financial year a completion certificate is put together and submitted to the senior management team. This certificate identifies any portion of the maintenance programme that was not completed so that it may be addressed in the following year. Deviations to plan are explained.
A major initiative is being undertaken during FY2008/FY2009 to implement an enterprise solution to managing the maintenance on Powerco’s networks. JDE was selected as the new maintenance management tool and a large project team has worked to integrate the software package into Powerco’s maintenance processes. This project will deliver the new maintenance plan for FY2010 as well as tracking all defects and their resolution.
Summary of Improvement Initiatives Undertaken in FY201011.3.3.
Various information system improvement initiatives are being undertaken in FY2010. These include:
Continuation of the Programme Office implantation of business-wide projects and •the associated Programme Office steering group governance and regular sponsor/business owner meetings;
A project to improve the HV connectivity in GIS is all but complete. Focus is now •moving to improving the LV connectivity. The associated connectivity enhancements are well under way;
Update of all Single Line and Relay and Instrumentation drawings for zone •substations In the Western area. This has been completed In the Eastern area;
Continued enhancements to the Maintenance Management system;•
Delivery of the SPA mobility project to introduce field electronic recording of •condition data;
Completing the Eastern region SCADA replacement project and commencing the •replacement of the Western SCADA MS with a new OSI Master Station.
Reviewing the processes and systems that support outage management.•
Some further information integrity initiatives are outlined in Section 2.8.11.
Proposed Asset Management Advancement Projects11.4.
Proposed Future Information System Projects11.4.1.
The following is a list of possible future information system improvement initiatives that are required to close the gaps outlined in Section 11.2.
Table 11.1: Possible Future Information System Projects
Asset & Customer Management Future Need Potential Action Criticality Est Cost Influence Area
Improved Information Disclosure reporting
Implement Data Warehouse programme
High $2m Entire Business
Modern and robust ICP management system
New billing and ICP management system
High $1m Billing, Commercial
Consistent SCADA Master Station platform
Migrate Western Region SCADA Master Station to OSI system.
Medium $1m Operations
Effective Outage Management System
Improve the existing Outage Management Systems, including electronic system and process for receiving, approving and notifying planned outages
Medium $1m Operations
Improve quality of information on assets
Rolling asset information audit programmes, e.g. obtain accurate conductor and cable sizes
High $200k pa
Network Info Team, Operations, Planning & SD
Improve quality of information on asset condition
Being addressed through the GEM maintenance management project and the SPA mobility project
High $200k pa
Service Delivery, Planning
Lifelines utility capacity Investigate if Business Continuity philosophies could be better applied in Powerco’s Asset Management and customer management processes
Low $20k Operations, Service Delivery, Planning,
Enhance accessibility of drawings and documents
Enhance drawing management system
Medium $200k Network Info, Planning, Service Delivery
Ensure information is available to network contractors and third parties
Review how Powerco Extranet can be enhanced
Medium $50k Service Delivery, Planning, Operations
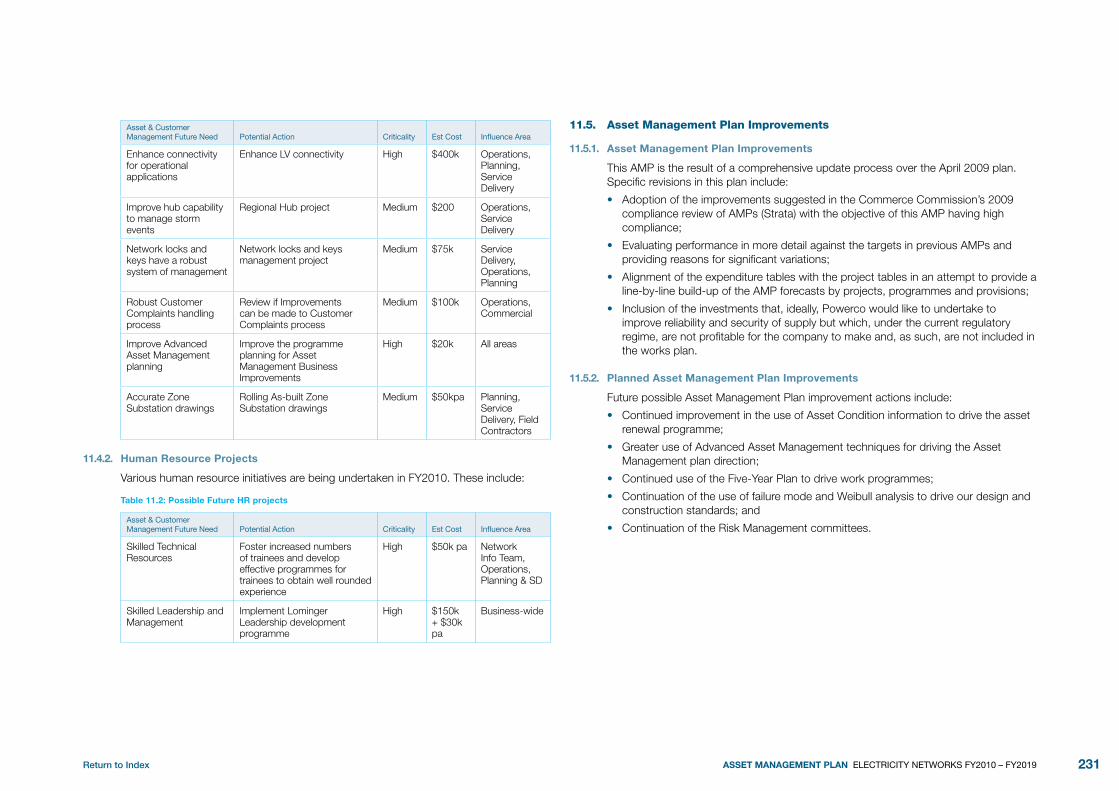
Return to Index 231ASSET MANAGEMENT PLAN ELECTRICITY NETWORKS FY2010 – FY2019
Asset & Customer Management Future Need Potential Action Criticality Est Cost Influence Area
Enhance connectivity for operational applications
Enhance LV connectivity High $400k Operations, Planning, Service Delivery
Improve hub capability to manage storm events
Regional Hub project Medium $200 Operations, Service Delivery
Network locks and keys have a robust system of management
Network locks and keys management project
Medium $75k Service Delivery, Operations, Planning
Robust Customer Complaints handling process
Review if Improvements can be made to Customer Complaints process
Medium $100k Operations, Commercial
Improve Advanced Asset Management planning
Improve the programme planning for Asset Management Business Improvements
High $20k All areas
Accurate Zone Substation drawings
Rolling As-built Zone Substation drawings
Medium $50kpa Planning, Service Delivery, Field Contractors
Human Resource Projects 11.4.2.
Various human resource initiatives are being undertaken in FY2010. These include:
Table 11.2: Possible Future HR projects
Asset & Customer Management Future Need Potential Action Criticality Est Cost Influence Area
Skilled Technical Resources
Foster increased numbers of trainees and develop effective programmes for trainees to obtain well rounded experience
High $50k pa Network Info Team, Operations, Planning & SD
Skilled Leadership and Management
Implement Lominger Leadership development programme
High $150k + $30k pa
Business-wide
Asset Management Plan Improvements11.5.
Asset Management Plan Improvements11.5.1.
This AMP is the result of a comprehensive update process over the April 2009 plan. Specific revisions in this plan include:
Adoption of the improvements suggested in the Commerce Commission’s 2009 •compliance review of AMPs (Strata) with the objective of this AMP having high compliance;
Evaluating performance in more detail against the targets in previous AMPs and •providing reasons for significant variations;
Alignment of the expenditure tables with the project tables in an attempt to provide a •line-by-line build-up of the AMP forecasts by projects, programmes and provisions;
Inclusion of the investments that, ideally, Powerco would like to undertake to •improve reliability and security of supply but which, under the current regulatory regime, are not profitable for the company to make and, as such, are not included in the works plan.
Planned Asset Management Plan Improvements11.5.2.
Future possible Asset Management Plan improvement actions include:
Continued improvement in the use of Asset Condition information to drive the asset •renewal programme;
Greater use of Advanced Asset Management techniques for driving the Asset •Management plan direction;
Continued use of the Five-Year Plan to drive work programmes;•
Continuation of the use of failure mode and Weibull analysis to drive our design and •construction standards; and
Continuation of the Risk Management committees.•

Return to Index232 ASSET MANAGEMENT PLAN ELECTRICITY NETWORKS FY2010 – FY2019
APPEndIX 1: kEY dEfInITIonS
adequacy means the ability of the electrical power network to meet the load demands under varying steady state conditions whilst not exceeding component ratings and voltage limits.
aDMD means After Diversity Maximum Demand. This refers to the average maximum demand assigned to a customer or load for network dimensioning purposes during design. Typical domestic ADMDs are in the order of 4kVA at reticulation level and 2kVA at a feeder level.
aMP means Asset Management Plan.
availability means the fraction of time a component is able to operate as intended, either expressed as a real fraction, or as hours per year.
CaIDI (Consumer average Interruption Duration Index) means the average duration of an interruption of supply per consumer who experienced an interruption in the period under consideration. The classes of CAIDI are: class A, Transpower planned outages; class B, Powerco planned outages; class C, Powerco unplanned outages; and class D, Transpower unplanned outages. CAIDI is measured in minutes per interruption.
Capital Efficiency means the ratio between the change in the networkís Optimised Deprival Value and the level of actual capital expenditure. For example, if a network project has an associated capital cost of $100,000 and brings about a valuation uplift of $20,000, then the capital efficiency is 20%. Conversely, the Capital Efficiency Factor is the inverse ñ i.e. in the above example, the factor would be five.
Capital Expenditure (Capex) means the expenditure used to create new assets or to increase the service performance or service potential of existing assets beyond the original design service performance or service potential. Capex increases the value of the asset stock, and is capitalised in accounting terms. It is subdivided into two classes, development expenditure and renewal expenditure, as defined below.
Class Capacity means the capacity of the lowest-rated incoming supply to a substation, plus the capacity that can be transferred to alternative supplies on the distribution network within the timeframe required by the substation security classification.
Consumer means an entity that receives electricity supply through a connection to Powercoís network, but is charged for the connection by an electricity retailer.
Contingency means the state of a system in which one or more primary components are out of service. The contingency level is determined by the number of primary components out of service. A ìk-levelíí contingency is, thus, the state of a system in which exactly k primary components are out of service.
Critical Spares are specialised parts that are stored to keep an existing asset in a serviceable condition. They may be consumables needed as part of a maintenance
regime or special parts that would otherwise need to be specially manufactured due to obsolescence or have a long lead time.
Customer means an electricity retailer or a consumer who obtains an electricity network connection directly from Powerco rather than through an electricity retailer. In this plan, the title “consumer” is generally used and can, for the most part, be considered to be inclusive of customers.
Cyclic Loading is defined in IEC 354 as ìLoading with cyclic variations (the duration of the cycle usually being one day), which is regarded in terms of the average amount of ageing that occurs during the cycle. The cyclic loading may either be a normal loading or a long-time emergency loadingî.
Development means activities to either create a new asset or to materially increase the service performance or potential of an existing asset.
Design Life means the period of time over which the future economic benefits (service performance or potential) embodied in an asset is designed to be consumed, or the total economic benefits, expressed in terms of production or similar units that are designed to be obtained.
Distribution Transformer means a transformer that steps distribution voltage, generally 11kV but in some cases 6.6kV or 22kV, to 400/230 volts. It has no forced cooling or on-load tap changing.
Eastern Region is the part of Powercoís electricity network supplying Tauranga, Western Bay of Plenty, Coromandel Peninsula and the area immediately to the west of the Kaimai and Mamaku ranges as far south as Kinleith (refer to Appendix 2).
Economic Life means the period from the acquisition of the asset to the time when the asset, while still capable of providing a service, ceases to be the lowest cost alternative to satisfy a particular level of service.
Emergency Spares means holdings of parts or equipment to provide a level of immunity in the network operation against a prescribed (catastrophic) failure of assets.
EPB means Electric Power Board.
Failure means an event in which a component does not operate or ceases to operate as intended. An example of the first kind is a circuit-breaker that fails to trip; an example of the second kind is a transformer that is tripped by its Buchholz relay.
FIDI (Feeder Interruption Duration Index) means the total duration of interruptions of supply that a consumer experiences in the period under consideration on a distribution feeder. FIDI is measured in minutes per customer per year.
Firm Capacity means the capacity of the lowest rated alternative incoming supply to a substation. (In the case of a single supply substation it is zero.)

Return to Index 233ASSET MANAGEMENT PLAN ELECTRICITY NETWORKS FY2010 – FY2019
Forced Outage means the unplanned loss of electricity supply due to one or more network component failures.
GxP means any transmission grid exit point from which Powerco takes supply.
ICP means installation control point, which is the point of connection of a consumer to the Powerco network.
IIMM means International Infrastructure Management Manual, 2006 Edition, published by the Association of Local Government Engineering Inc (INGENIUM) and the National Asset Management Steering (NAMS) Group.
Interruption means an unplanned loss of electricity supply of one minute or longer, affecting three or more ICPs, due to an outage on the network.
Long-time Emergency Cyclic Loading is defined in IEC 354 as ìLoad resulting from the prolonged outage of some system elements that will not be reconnected before a steady state temperature rise is reached in the transformer. This is not a normal operating condition and its occurrence is expected to be rare, but it may persist for weeks or even months and can lead to considerable ageing. However, it should not be the cause of breakdown due to thermal distribution or reduction of dielectric strengthî.
Maintenance means activities necessary for retaining an asset as near as practical to its original condition, but excluding renewal of the asset. Replacement of sub-components of an asset can be considered maintenance in this context.
MED means Municipal Electricity Department.
Outage means a loss of electricity supply.
Redundant unit means a component whose outage will not lead to a loss of electricity supply to consumers, but for which at least one contingency state exists ñ the outage of which will not lead to a loss of electricity supply for the consumer.
Refurbishment means activities to rebuild or replace parts or components of an asset, to restore it to a required functional condition and extend its life beyond that originally expected (which may incorporate some modification). Refurbishment is a renewal activity.
Reliability assessment means determining the optimum solution to any required network reinforcement by quantifying the benefits of proposed works and/or enabling a quantitative comparison of alternative system configurations.
Renewal means activities to replace an existing asset with one of equivalent service performance capability.
Repair means the restoration of the functionality of a network component, either by replacing parts or by rectifying faults.
Repair Time means the time taken to restore a faulty network component to satisfactory performance.
Replacement means the complete replacement of an asset that has reached the end of its life, to provide a similar or agreed alternative level of service.
SaIDI (System average Interruption Duration Index) means the average length of time of interruptions of supply that a consumer experiences in the period under consideration. The classes of SAIDI are: class A, Transpower planned outages; class B, Powerco planned outages; class C, Powerco unplanned outages; and class D, Transpower unplanned outages.
SaIFI (System average Interruption Frequency Index) means the average number of interruptions of supply that a consumer experiences in the period under consideration. The classes of SAIFI are: class A, Transpower planned outages; class B, Powerco planned outages; class C, Powerco unplanned outages; and class D, Transpower unplanned outages.
Scheduled Outage or Planned Outage means a planned loss of electricity supply.
Security means the ability of the network to meet the service performance demanded of it during and after a transient or dynamic disturbance of the network or an outage to a component of the network.
Service Performance means the level of electricity supply service delivered in terms of quality, capacity and reliability.
Service Potential means the total expected future service performance of an asset. It is normally determined by reference to the service performance and economic life of similar assets.
Service Provider means a contractor or business that supplies a service to Powerco.
Short-time Emergency Loading is defined in IEC 354 as ‘Unusually heavy loading due to the occurrence of one or more unlikely events which seriously disturb normal system loading, causing the conductor hot spots to reach dangerous levels and, possibly, a temporary reduction in the dielectric strength. However, acceptance of this condition for a short time may be preferable to other alternatives. This type of loading is expected to occur rarely, and it must be rapidly reduced or the transformer disconnected within a short time in order to prevent its failure. The permissible duration of this load is shorter than the thermal time constant of the transformer and depends on the operating temperature before the increase in the loading; typically, it would be less than half an hour’.
Switching Time means the time delay between a forced outage and restoration of power by switching on the network.
Western Region is the part of Powercoís network supplying the Taranaki, Wanganui, Manawatu and Wairarapa areas (refer to Appendix 3).
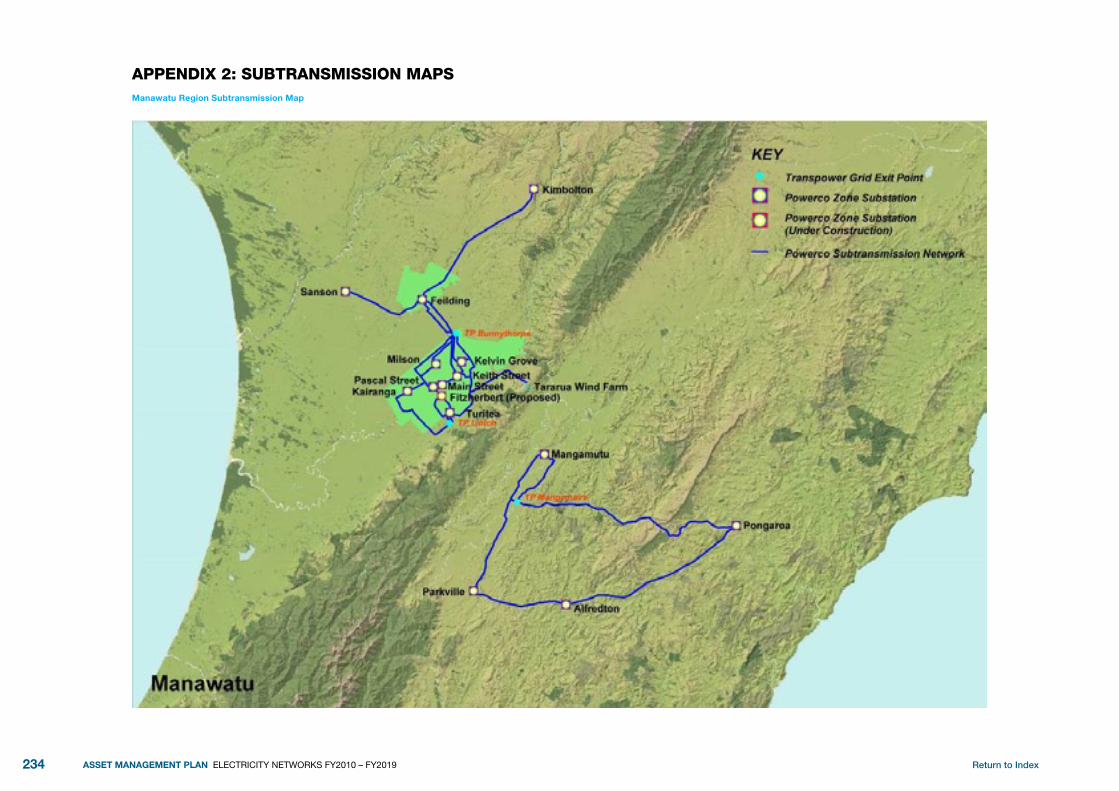
Return to Index234 ASSET MANAGEMENT PLAN ELECTRICITY NETWORKS FY2010 – FY2019
APPEndIX 2: SUBTRAnSMISSIon MAPSManawatu Region Subtransmission Map

Return to Index 235ASSET MANAGEMENT PLAN ELECTRICITY NETWORKS FY2010 – FY2019
Taranaki Region Subtransmission Map

Return to Index236 ASSET MANAGEMENT PLAN ELECTRICITY NETWORKS FY2010 – FY2019
Tauranga Region Subtransmission Map
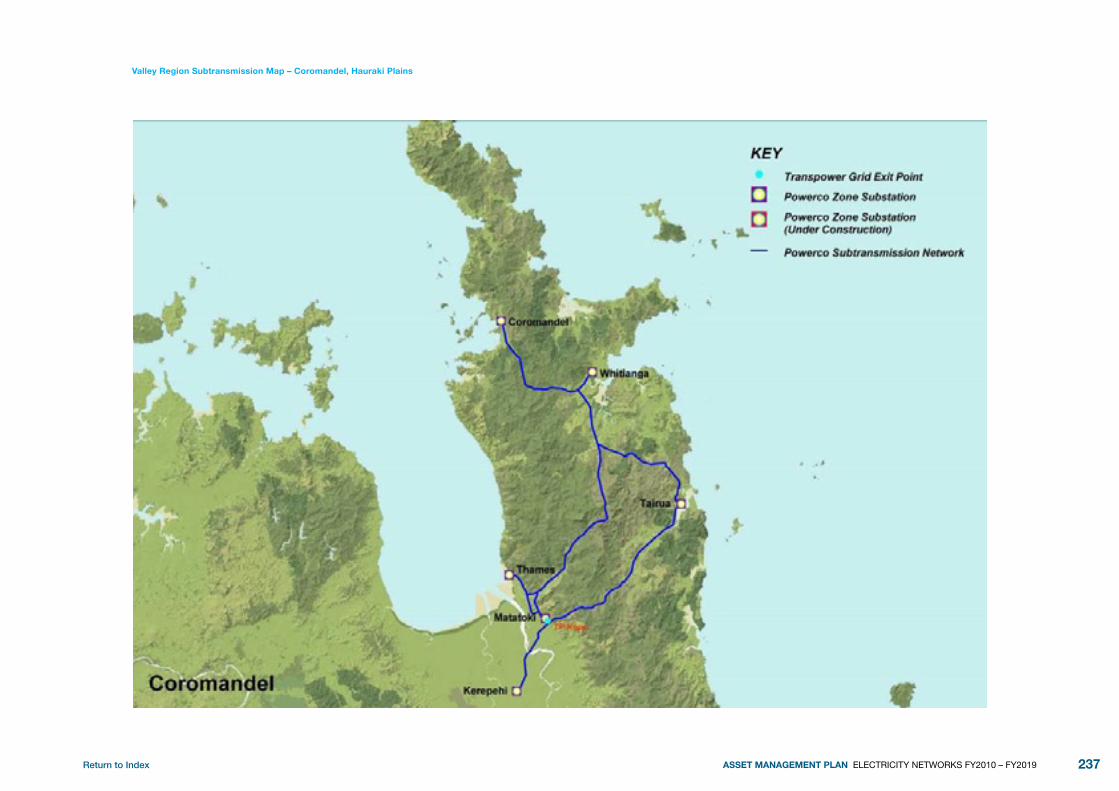
Return to Index 237ASSET MANAGEMENT PLAN ELECTRICITY NETWORKS FY2010 – FY2019
Valley Region Subtransmission Map – Coromandel, Hauraki Plains

Return to Index238 ASSET MANAGEMENT PLAN ELECTRICITY NETWORKS FY2010 – FY2019
Valley Subtransmission Map – East and South Waikato

Return to Index 239ASSET MANAGEMENT PLAN ELECTRICITY NETWORKS FY2010 – FY2019
Wanganui Region Subtransmission Map

Return to Index240 ASSET MANAGEMENT PLAN ELECTRICITY NETWORKS FY2010 – FY2019
Wanganui Region Subtransmission Map

Return to Index 241ASSET MANAGEMENT PLAN ELECTRICITY NETWORKS FY2010 – FY2019
APPEndIX 3
framework Questions for Reference11.1.
B.2 AMP Summary
Does the AMP include a summary that provides a brief overview of the AMP contents?
Section 1, Appendix 3
How effectively does the summary highlight information that the Electricity Distribution Businesses (EDB) consider significant? Is this highlighted information relevant to stakeholders and, in particular, to distribution systems users?
Section 1, Chief Exec. Statement
Is there any information in the AMP that is of particular importance or relevance to customers that is not highlighted in the summary?
Section 1
B.3 Background and objectives11.2.
B 3.1 Purpose of Plan
Does the AMP contain a purpose statement? Section 2.2
Does the purpose statement make the status of the AMP clear? For some businesses the AMP will be the key document that guides the Asset Management process. Other businesses will have a different Asset Management system in place and will write the disclosed AMP purely to meet the disclosure requirements.
Section 2.2
Figure 2.4
Does the purpose statement also include the objectives of the EDBs Asset Management planning process? To what extent are these objectives consistent with the EDBs vision and mission statements? Do the objectives show a clear recognition of stakeholder interests?
Section 2.1.2
Section 2.2
Section 2.3
Figure 2.6
B3.2 Interaction with Corporate Goals, Business Planning Processes and Plans
Does the AMP state the EDBs high-level corporate mission or vision as it relates to Asset Management?
Section 2.1.2
Section 2.5
Does the AMP identify the documented plans produced as outputs of the EDBs annual business planning process?
Section 2.5
Figure 2.6
Section 9.2
Does the AMP show how the different documented plans relate to one another with particular reference to any plans specifically dealing with Asset Management?
Figure 2.4
Section 6.1
Section 7.1,
Section 8.9.1
How well are the objectives of the EDBs Asset Management and planning processes integrated with its other business plan and goals and how well does the AMP describe this relationship?
Section 2.5
Figure 2.2
Figure 2.7
B3.3 Period to which the Plan Relates
Does the AMP specifically state the period covered by the plan? Section 2.2.1
Does the AMP state the date on which the AMP was approved by the Board of Directors?
Section 2.2.1
Form 2
B3.4 Stakeholder Interests
Does the AMP identify the EDBs important stakeholders and indicate: Section 2.3
How the interests of stakeholders are identified; Section 2.3.1
What these interests are; Section 2.3.1
How these interests are accommodated in the EDBs Asset Management practices;
Section 2.4, Section 4.2
Figure 2.7
and how conflicting interests are managed? Section 2.4
Section 2.6.2
B3.5 Accountabilities and Responsibilities for Asset Management
At the governance level, does the AMP describe the extent of Board approval required for key Asset Management plans and decisions and the extent to which Asset Management outcomes are regularly reported to the Board:
Section 2.7
At the executive level, does the AMP provide an indication of how the in-house Asset Management and planning organisation is structured?
Section 2.7
Section 2.6.1
At the field operations level, does the AMP comment on how field operations are managed, the extent to which field work is undertaken in-house and the areas where outsourced contractors are used?
Section 2.7.4
Section 2.9
Figure 2.8
B3.6 Asset Management Systems and Processes
Does the AMP identify the key systems holding data used in the Asset Management process? Does it describe the nature of the data held in each system and what this data is used for?
Section 2.8
Does the AMP comment on the completeness or accuracy of the asset data and does it identify any specific areas where the data is incomplete or inaccurate?
Section 2.8.12
Section 11.2.3

Return to Index242 ASSET MANAGEMENT PLAN ELECTRICITY NETWORKS FY2010 – FY2019
If there is a problem with data accuracy or completeness, does the AMP disclose initiatives to improve the quality of the data?
Section 2.8.12
Section 11.4.1
Does the AMP describe the processes used within the business for: managing routine asset inspections and network maintenance; planning and implementation of network development processes; and measuring network performance (SAIDI, SAIFI) for disclosure purposes?
Section 2.6
Section 2.8.6
Section 6.3
Section 7
Section 5.2
B.4 details of Assets Covered11.3.
B4.1 Description of the Distribution Area
Does the high-level description of the distribution area include: The distribution areas covered;
Section 3.1
Identification of large consumers that have a significant impact on network operations or Asset Management priorities;
Section 3.4.4 to 3.4.11
Description of the load characteristics for different parts of the network; and
Sections 3.3 and 3.4, specifically 3.3.1 to 3.3.6
The peak demand and total electricity delivered in the previous year, broken down by geographically non-contiguous network, if any?
Section 3.1
B4.2 Description of the Network Configuration
Does the AMP include a description of the network configuration that includes: Identification of the bulk electricity supply points and any embedded generation with a capacity greater than 1MW;
Section 3.2.2
Section 3.2.5
Section 7.8.2
Appendix 2
The existing firm supply capacity and current peak load at each bulk supply point;
Section 7.8.2
A description of the subtransmission system fed from bulk supply points, including identification and capacity of zone substation and the voltage of the subtransmission network;
Section 3.2.4 & 3.2.6; Section 7.8.3 to 7.8.11;
Tables 7.15 to 7.20;
Appendix 2
The extent to which individual zone substations have n-x subtransmission security.
Section 7.2;
Table 7.1 to 7.2;
Sections 7.8.3 to 7.8.11;
Tables 7.21 to 7.26;
Appendix 2
A description of the distribution system including the extent to which it is underground;
Sections 3.2.4, 3.2.7, 3.2.10; Table 3.1
A brief description of the network’s distribution substation arrangements;
Section 3.2.9
A description of the low-voltage network, including the extent to which it is underground; and
Section 3.2.10
An overview of secondary assets such as ripple injection systems, SCADA and telecommunications systems?
Section 3.2.11
B4.3 Description of the Network Assets
Does the AMP include a description of the assets that make up the distribution system that includes, for each asset category: Voltage levels; Descriptions and quantity of assets; Age profiles; Value of the assets in each category (which can be drawn from the ODV disclosure or other record bases kept by the EDB; and A discussion of the condition of the assets, further broken down as appropriate and including, if necessary, a discussion of systemic issues leading to premature asset replacement?
Section 3.2 (quantities)
Section 3.5 to 3.10 (age profiles)
Section 3.2
Section 3.5 - 3.10
B4.4 Justification for Assets
How does the EDB justify its asset base? Comment briefly whether the AMP includes any asset justification and the nature and reasonableness of the justification provided.
Section 3.2
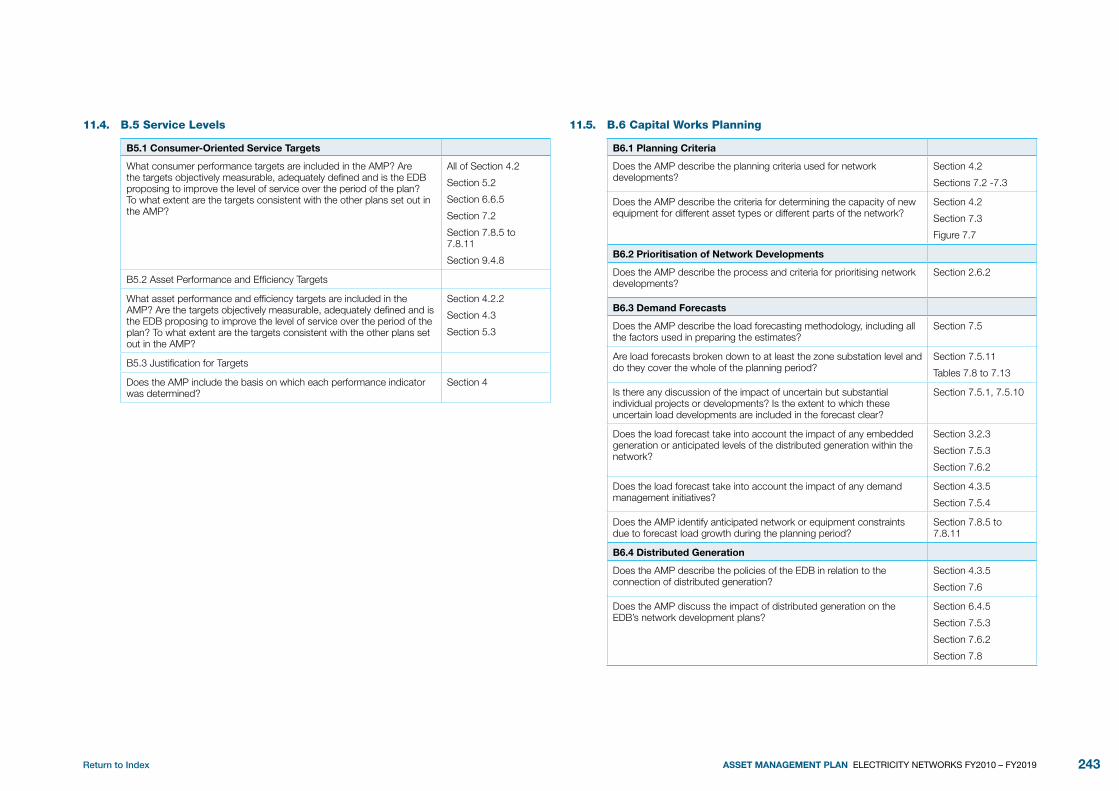
Return to Index 243ASSET MANAGEMENT PLAN ELECTRICITY NETWORKS FY2010 – FY2019
B.5 Service Levels11.4.
B5.1 Consumer-Oriented Service Targets
What consumer performance targets are included in the AMP? Are the targets objectively measurable, adequately defined and is the EDB proposing to improve the level of service over the period of the plan? To what extent are the targets consistent with the other plans set out in the AMP?
All of Section 4.2
Section 5.2
Section 6.6.5
Section 7.2
Section 7.8.5 to 7.8.11
Section 9.4.8
B5.2 Asset Performance and Efficiency Targets
What asset performance and efficiency targets are included in the AMP? Are the targets objectively measurable, adequately defined and is the EDB proposing to improve the level of service over the period of the plan? To what extent are the targets consistent with the other plans set out in the AMP?
Section 4.2.2
Section 4.3
Section 5.3
B5.3 Justification for Targets
Does the AMP include the basis on which each performance indicator was determined?
Section 4
B.6 Capital works Planning11.5.
B6.1 Planning Criteria
Does the AMP describe the planning criteria used for network developments?
Section 4.2
Sections 7.2 -7.3
Does the AMP describe the criteria for determining the capacity of new equipment for different asset types or different parts of the network?
Section 4.2
Section 7.3
Figure 7.7
B6.2 Prioritisation of Network Developments
Does the AMP describe the process and criteria for prioritising network developments?
Section 2.6.2
B6.3 Demand Forecasts
Does the AMP describe the load forecasting methodology, including all the factors used in preparing the estimates?
Section 7.5
Are load forecasts broken down to at least the zone substation level and do they cover the whole of the planning period?
Section 7.5.11
Tables 7.8 to 7.13
Is there any discussion of the impact of uncertain but substantial individual projects or developments? Is the extent to which these uncertain load developments are included in the forecast clear?
Section 7.5.1, 7.5.10
Does the load forecast take into account the impact of any embedded generation or anticipated levels of the distributed generation within the network?
Section 3.2.3
Section 7.5.3
Section 7.6.2
Does the load forecast take into account the impact of any demand management initiatives?
Section 4.3.5
Section 7.5.4
Does the AMP identify anticipated network or equipment constraints due to forecast load growth during the planning period?
Section 7.8.5 to 7.8.11
B6.4 Distributed Generation
Does the AMP describe the policies of the EDB in relation to the connection of distributed generation?
Section 4.3.5
Section 7.6
Does the AMP discuss the impact of distributed generation on the EDB’s network development plans?
Section 6.4.5
Section 7.5.3
Section 7.6.2
Section 7.8
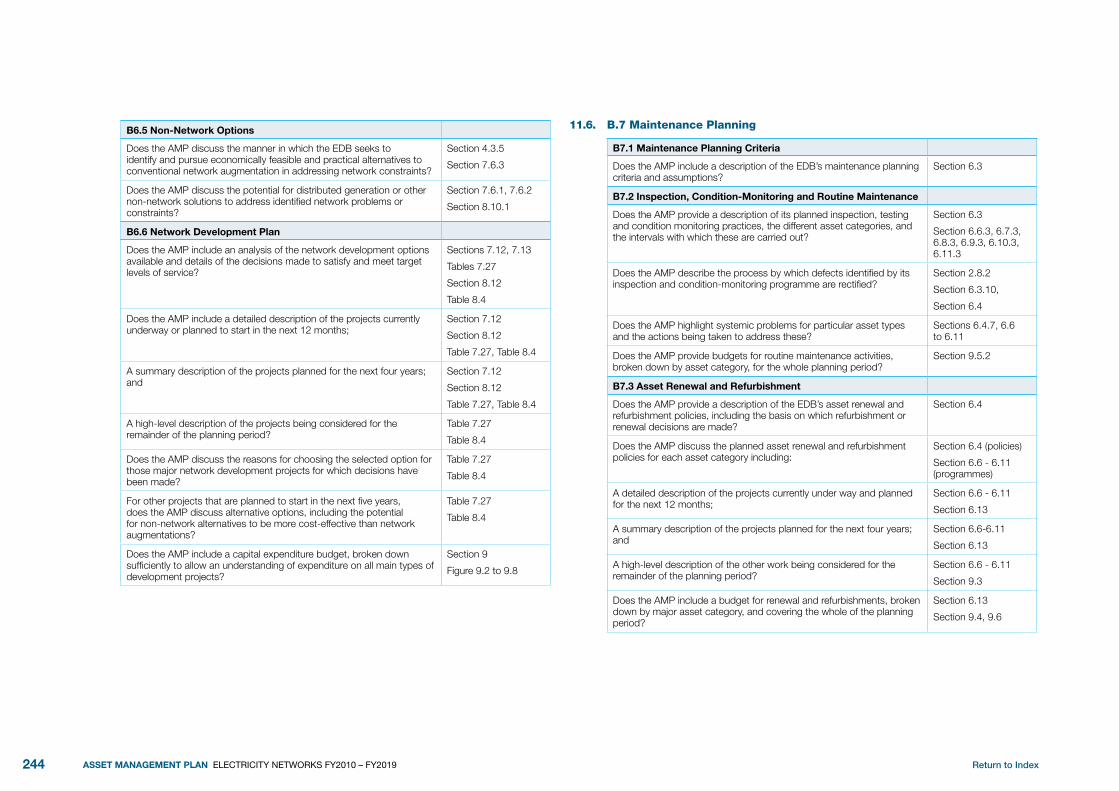
Return to Index244 ASSET MANAGEMENT PLAN ELECTRICITY NETWORKS FY2010 – FY2019
B6.5 Non-Network Options
Does the AMP discuss the manner in which the EDB seeks to identify and pursue economically feasible and practical alternatives to conventional network augmentation in addressing network constraints?
Section 4.3.5
Section 7.6.3
Does the AMP discuss the potential for distributed generation or other non-network solutions to address identified network problems or constraints?
Section 7.6.1, 7.6.2
Section 8.10.1
B6.6 Network Development Plan
Does the AMP include an analysis of the network development options available and details of the decisions made to satisfy and meet target levels of service?
Sections 7.12, 7.13
Tables 7.27
Section 8.12
Table 8.4
Does the AMP include a detailed description of the projects currently underway or planned to start in the next 12 months;
Section 7.12
Section 8.12
Table 7.27, Table 8.4
A summary description of the projects planned for the next four years; and
Section 7.12
Section 8.12
Table 7.27, Table 8.4
A high-level description of the projects being considered for the remainder of the planning period?
Table 7.27
Table 8.4
Does the AMP discuss the reasons for choosing the selected option for those major network development projects for which decisions have been made?
Table 7.27
Table 8.4
For other projects that are planned to start in the next five years, does the AMP discuss alternative options, including the potential for non-network alternatives to be more cost-effective than network augmentations?
Table 7.27
Table 8.4
Does the AMP include a capital expenditure budget, broken down sufficiently to allow an understanding of expenditure on all main types of development projects?
Section 9
Figure 9.2 to 9.8
B.7 Maintenance Planning11.6.
B7.1 Maintenance Planning Criteria
Does the AMP include a description of the EDB’s maintenance planning criteria and assumptions?
Section 6.3
B7.2 Inspection, Condition-Monitoring and Routine Maintenance
Does the AMP provide a description of its planned inspection, testing and condition monitoring practices, the different asset categories, and the intervals with which these are carried out?
Section 6.3
Section 6.6.3, 6.7.3, 6.8.3, 6.9.3, 6.10.3, 6.11.3
Does the AMP describe the process by which defects identified by its inspection and condition-monitoring programme are rectified?
Section 2.8.2
Section 6.3.10,
Section 6.4
Does the AMP highlight systemic problems for particular asset types and the actions being taken to address these?
Sections 6.4.7, 6.6 to 6.11
Does the AMP provide budgets for routine maintenance activities, broken down by asset category, for the whole planning period?
Section 9.5.2
B7.3 Asset Renewal and Refurbishment
Does the AMP provide a description of the EDB’s asset renewal and refurbishment policies, including the basis on which refurbishment or renewal decisions are made?
Section 6.4
Does the AMP discuss the planned asset renewal and refurbishment policies for each asset category including:
Section 6.4 (policies)
Section 6.6 - 6.11 (programmes)
A detailed description of the projects currently under way and planned for the next 12 months;
Section 6.6 - 6.11
Section 6.13
A summary description of the projects planned for the next four years; and
Section 6.6-6.11
Section 6.13
A high-level description of the other work being considered for the remainder of the planning period?
Section 6.6 - 6.11
Section 9.3
Does the AMP include a budget for renewal and refurbishments, broken down by major asset category, and covering the whole of the planning period?
Section 6.13
Section 9.4, 9.6

Return to Index 245ASSET MANAGEMENT PLAN ELECTRICITY NETWORKS FY2010 – FY2019
B.8 Risk Management11.7.
B.8 Risk Management
Does the AMP include details of the EDB’s risks policies and assessment and mitigation practices including:
Section 10.2
Methods, details and conclusions of risk analysis; Sections 10.3
The main risks identified; Section 10.4
Details of emergency response and contingency plans? Section 10.5
Does the AMP identify specific development projects or maintenance programmes with the objective of managing risk? Are these projects discussed and linked back to the development plan or maintenance programmes?
Section 10.3
Section 10.7
B.9 Performance Evaluation11.8.
B9.1 Financial and Physical Progress
Is the actual capital expenditure for the previous year compared with that presented in the previous AMP and are significant differences discussed?
Section 5.7.1
Figure 9.1
Is the progress of development projects against plan (as presented in the previous AMP) assessed and are the reasons for substantial variances highlighted? Are any construction or other problems experienced discussed?
Section 5.6
Is the actual maintenance expenditure compared with that planned in the previous AMP and the reasons for significant differences discussed?
Section 5.7.2
Is progress and maintenance initiatives and programmes assessed and discussed and is the effectiveness of these programmes noted?
Section 5.7.2
Section 11.3.2
B9.2 Service Level and Asset Performance
Is the measured service level and asset performance for the previous year presented for all the targets discussed under the Service Levels section of the AMP?
Sections 5.2 – 5.3
Is there a comparison between actual and target performance for the preceding year with an explanation for any significant variances?
Sections 5.2 – 5.3
B9.3 Gap Analysis
Does the AMP identify significant gaps between targeted and actual performance. If so, does it describe the action to be taken to address the situation (If not caused by one-off factors)?
Section 11.2.2
Section 11.4
Does the AMP review the overall quality of Asset Management and planning within the EDB and discuss any initiatives for improvement?
Section 11.3 & 11.5
B.10 Expenditure Forecast Reconciliations and Assumptions
Does the AMP include forecasts of capital and operating expenditure for the minimum ten year asset management planning period?
Section 9
Tables 9.3 to 9.5
Does the AMP include reconciliations of actual expenditure against forecasts for the most recent financial year for which data is available?
Section 5.7
Does the AMP identify all significant assumptions that are considered to have a material impact on forecast expenditure (capital or operating) for the planning period
Section 9.2
Sections 9.4.2 - 9.4.7
Are the significant assumptions presented and discussed in a manner that makes their sources and impacts understandable to electricity consumers?
Section 9.2
Does the AMP identify assumptions that have been made in relation to the sources of uncertainty?
Section 9.4.1

Return to Index246 ASSET MANAGEMENT PLAN ELECTRICITY NETWORKS FY2010 – FY2019