
SUMMARY ASSET MANAGEMENT PLAN - powerco.co.nz · summary asset management plan electricity networks...
36
ASSET MANAGEMENT PLAN ELECTRICITY NETWORKS FY2010 – FY2019 1 INFORMATION DISCLOSURE FOR ELECTRICITY NETWORKS JUNE 2010–2019 SUMMARY ASSET MANAGEMENT PLAN
Transcript of SUMMARY ASSET MANAGEMENT PLAN - powerco.co.nz · summary asset management plan electricity networks...
ASSET MANAGEMENT PLAN ELECTRICITY NETWORKS FY2010 – FY2019 1
INFORmATION DISCLOSURE FOR ELECTRICITY NETWORKS JUNE 2010–2019
SUMMARY ASSET MANAGEMENT PLAN
2 SUMMARY ASSET MANAGEMENT PLAN ELECTRICITY NETWORKS FY2010 – FY2019
contents
CHIEF EXECUTIVE’S STATEMENT ................................................................. 2
POWERCO AND THE NEW ZEALAND ELECTRICITY INDUSTRY ................... 4
OUR ELECTRICITY NETWORK ...................................................................... 6
ASSETS COVERED ........................................................................................ 7
THE ASSET MANAGEMENT PLAN AND PROCESS ....................................... 8
PURPOSE OF THIS AMP SUMMARY ............................................................. 9
PROCESS OVERVIEW ................................................................................... 9
ASSET MANAGEMENT STRATEGY OVERVIEW ........................................... 10
WHO WANTS WHAT FROM THE ASSETS ................................................... 11
STATE OF THE ASSETS ............................................................................... 13
PERFORMANCE AGAINST TARGET OVERVIEW .......................................... 13
RISK MANAGEMENT ................................................................................... 15
ASSET LIFECYCLE PLAN ............................................................................ 15
NETWORK DEVELOPMENT PLAN ............................................................... 17
NETWORK ENHANCEMENT ........................................................................ 18
CAPITAL EXPENDITURE .............................................................................. 18
OPERATIONAL EXPENDITURES .................................................................. 19
FINANCIAL ................................................................................................... 20
ASSET MANAGEMENT IMPROVEMENT ...................................................... 20
INFORMATION SYSTEMS ............................................................................ 21
SERVICE PROVISION STRATEGY ................................................................ 21
PROJECT MAPS .......................................................................................... 23
KEY DEFINITIONS ........................................................................................ 32

1SUMMARY ASSET MANAGEMENT PLAN ELECTRICITY NETWORKS FY2010 – FY2019

2 SUMMARY ASSET MANAGEMENT PLAN ELECTRICITY NETWORKS FY2010 – FY2019
We take the risk to reliability very seriously and have committed to further increases in expenditure to minimise this risk. This AMP commits to an additional annual $5.5 million expenditure, growing to $6.7 million by 2020. This increase has been made possible by a change to the Default Price Path (which regulates Powerco’s revenue) effective from 1 April 2010. This change means Powerco can now maintain its prices in real terms, as opposed to the previous price path, which kept Powerco’s charges 2% lower than the Consumer Price Index. We look forward to the conclusion of the current regulatory development process to provide greater certainty for further investment decisions.
The magnitude of the investment needed to renew an increasingly ageing network and increase its core security is significant. Based on our analysis, a further $17 million of annual expenditure is necessary to reduce the reliability risk to an acceptable level. This is highlighted in figure 2, which shows that even though capital expenditure has increased significantly, the network will continue to age without a further step-change increase in expenditure.
Ave
rage
Age
Network Average Age and Forecast Capex
Total Capex Average Network Age Year (ending June)
Tota
l Cap
ex ($
m)
31
30
29
28
27
26
25
24$0
$20
$40
$60
$80
$100
$120
$140
2006
2007
2008
2009
2010
2011
2012
2013
2014
2015
2016
2017
2018
2019
2021
2020
Figure 2: Network Age and Forecast Capex
cHIeF eXecUtIVe’s stAteMent
The Asset Management Plan (AMP) is an important part of Powerco’s planning framework. It describes how we will manage our electricity distribution network to meet the reliability standards of electricity supply that our customers demand and the commercial performance that our shareholders expect.
Over the past 15 years we have performed well in efficiently delivering a reliable electricity supply. In the past seven years we have doubled our expenditure on the network, even though Powerco’s charges have decreased by 6% in real terms as a result of price-constraining regulation. Despite this increased expenditure, reliability has remained static and the risk of breaching our reliability targets has materially increased. This issue is illustrated in figure 1 where there is a widening gap between target (red line) and forecast performance (blue bars)
Actual and Forecast SAIDI Reliability
SA
IDI (
Cla
ss B
+C
) min
utes
Year (Ending March)
100
150
200
250
300
350
Forecast Reliability (Apr-09 AMP Spend) Actual Reliability (excl. storms)
Forecast Reliability (Apr-10 AMP + 5% more work)Forecast Reliability (Apr-10 AMP Spend)
2019
2018
2017
2016
2015
2014
2013
2012
2011
2010
2009
2008
2007
2006
2005
2004
2003
Deterioriating reliability due to regulation constaining
expenditure (reduced)
Improvement due to increase in spend due to
CPI-0% threshold change
Improvement due to increased work done
for same money
Forecast Reliability (based on IR Spend)Target Reliability (AMP)
Regulatory ThresholdActual Reliability (incl. storms)
Figure 1: Actual and Forecast Reliability Performance
3SUMMARY ASSET MANAGEMENT PLAN ELECTRICITY NETWORKS FY2010 – FY2019
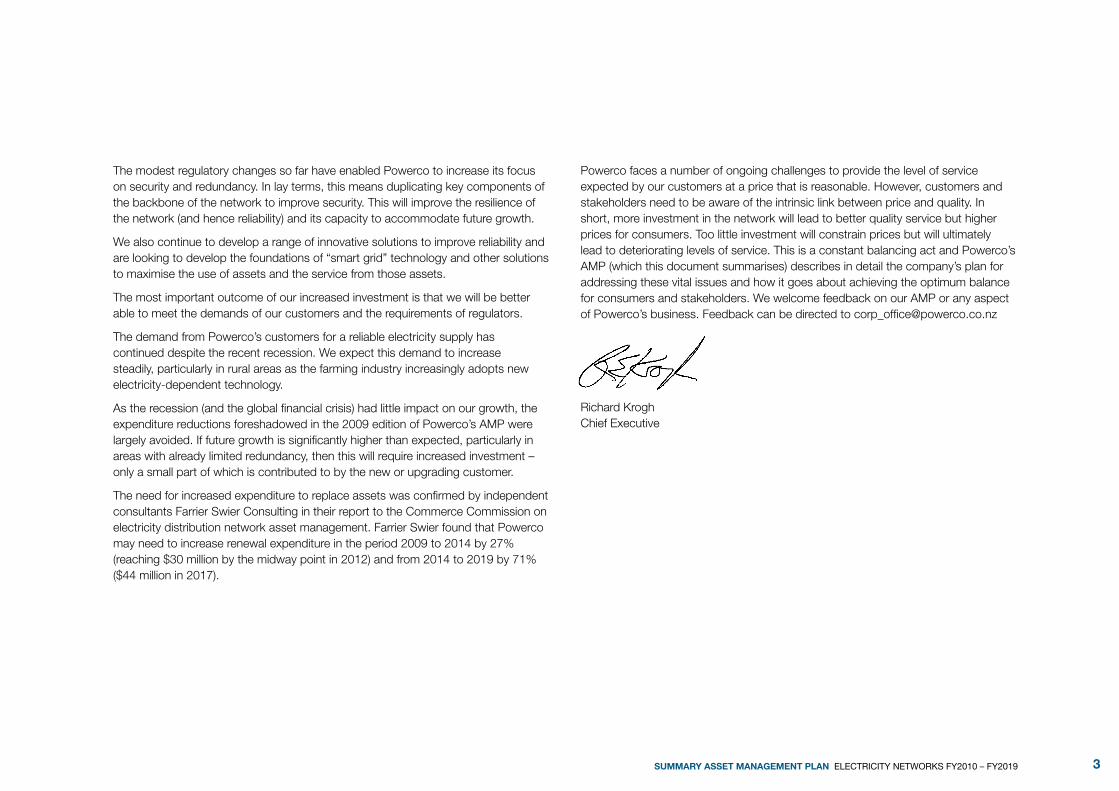
The modest regulatory changes so far have enabled Powerco to increase its focus on security and redundancy. In lay terms, this means duplicating key components of the backbone of the network to improve security. This will improve the resilience of the network (and hence reliability) and its capacity to accommodate future growth.
We also continue to develop a range of innovative solutions to improve reliability and are looking to develop the foundations of “smart grid” technology and other solutions to maximise the use of assets and the service from those assets.
The most important outcome of our increased investment is that we will be better able to meet the demands of our customers and the requirements of regulators.
The demand from Powerco’s customers for a reliable electricity supply has continued despite the recent recession. We expect this demand to increase steadily, particularly in rural areas as the farming industry increasingly adopts new electricity-dependent technology.
As the recession (and the global financial crisis) had little impact on our growth, the expenditure reductions foreshadowed in the 2009 edition of Powerco’s AMP were largely avoided. If future growth is significantly higher than expected, particularly in areas with already limited redundancy, then this will require increased investment – only a small part of which is contributed to by the new or upgrading customer.
The need for increased expenditure to replace assets was confirmed by independent consultants Farrier Swier Consulting in their report to the Commerce Commission on electricity distribution network asset management. Farrier Swier found that Powerco may need to increase renewal expenditure in the period 2009 to 2014 by 27% (reaching $30 million by the midway point in 2012) and from 2014 to 2019 by 71% ($44 million in 2017).
Powerco faces a number of ongoing challenges to provide the level of service expected by our customers at a price that is reasonable. However, customers and stakeholders need to be aware of the intrinsic link between price and quality. In short, more investment in the network will lead to better quality service but higher prices for consumers. Too little investment will constrain prices but will ultimately lead to deteriorating levels of service. This is a constant balancing act and Powerco’s AMP (which this document summarises) describes in detail the company’s plan for addressing these vital issues and how it goes about achieving the optimum balance for consumers and stakeholders. We welcome feedback on our AMP or any aspect of Powerco’s business. Feedback can be directed to [email protected]
Richard Krogh Chief Executive

4 SUMMARY ASSET MANAGEMENT PLAN ELECTRICITY NETWORKS FY2010 – FY2019
PoWeRco AnD tHe neW ZeALAnD eLectRIcItY InDUstRY
To provide relevant feedback on Powerco’s AMP, it is vital that any interested parties understand the structure of New Zealand’s electricity industry and Powerco’s role in it.
This country’s electricity industry has undergone considerable structural change over the past 12 years as the Government has worked to promote competition, reliability, and fair prices for consumers.
As part of the distribution sector, Powerco sits midway along the supply chain. It contracts with Transpower for transmission services and with generators “embedded” in our networks. At present, we do not sell electricity – we own and operate the infrastructure that delivers it from the National Grid to individual homes and businesses. Our main customers are energy retailers with whom we have wholesale “use of system” agreements. We invoice retailers for the cost of our services, which comprise delivery (including transmission charges), and maintaining and upgrading the distribution network. Retailers bundle up the cost of our services, along with their own services and those of generators, into your monthly electricity bill. Retailers, who compete for customers, set the overall price for the end consumer.
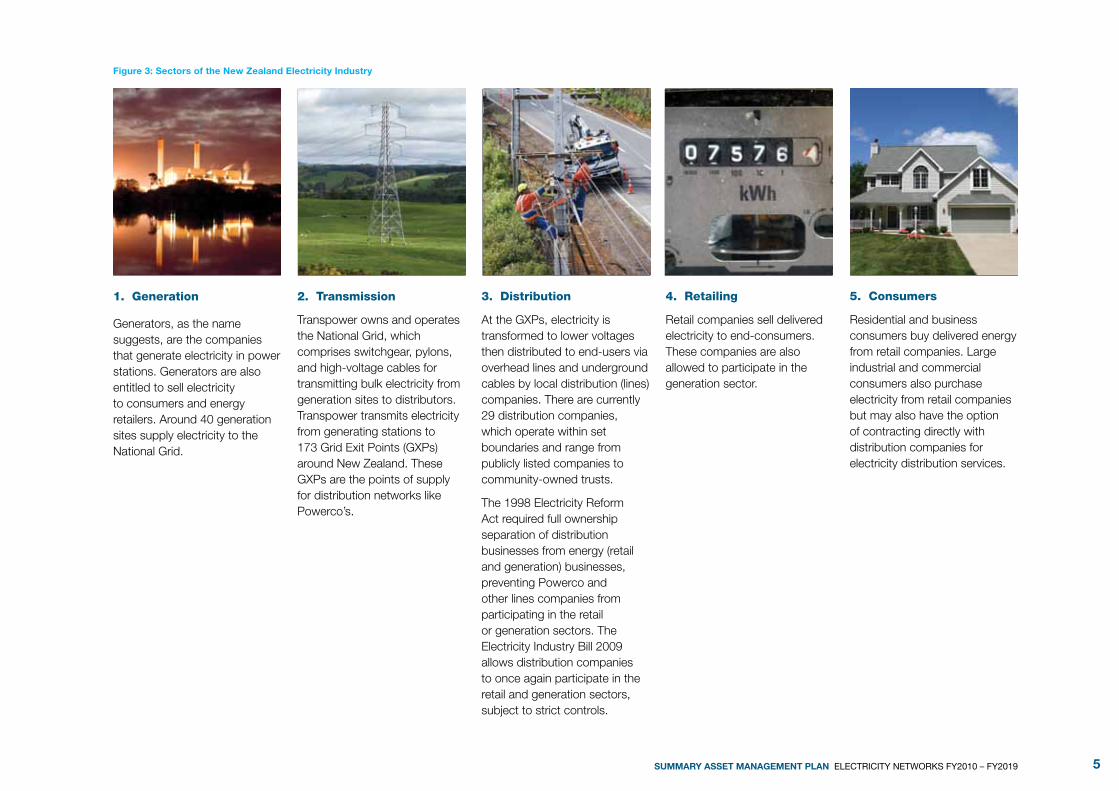
The different sectors of the industry are described next.
5SUMMARY ASSET MANAGEMENT PLAN ELECTRICITY NETWORKS FY2010 – FY2019
1. Generation
Generators, as the name suggests, are the companies that generate electricity in power stations. Generators are also entitled to sell electricity to consumers and energy retailers. Around 40 generation sites supply electricity to the National Grid.
2. transmission
Transpower owns and operates the National Grid, which comprises switchgear, pylons, and high-voltage cables for transmitting bulk electricity from generation sites to distributors. Transpower transmits electricity from generating stations to 173 Grid Exit Points (GXPs) around New Zealand. These GXPs are the points of supply for distribution networks like Powerco’s.
3. Distribution
At the GXPs, electricity is transformed to lower voltages then distributed to end-users via overhead lines and underground cables by local distribution (lines) companies. There are currently 29 distribution companies, which operate within set boundaries and range from publicly listed companies to community-owned trusts.
The 1998 Electricity Reform Act required full ownership separation of distribution businesses from energy (retail and generation) businesses, preventing Powerco and other lines companies from participating in the retail or generation sectors. The Electricity Industry Bill 2009 allows distribution companies to once again participate in the retail and generation sectors, subject to strict controls.
4. Retailing
Retail companies sell delivered electricity to end-consumers. These companies are also allowed to participate in the generation sector.
5. consumers
Residential and business consumers buy delivered energy from retail companies. Large industrial and commercial consumers also purchase electricity from retail companies but may also have the option of contracting directly with distribution companies for electricity distribution services.
Figure 3: Sectors of the New Zealand Electricity Industry

6 SUMMARY ASSET MANAGEMENT PLAN ELECTRICITY NETWORKS FY2010 – FY2019
oUR eLectRIcItY netWoRK
Powerco is New Zealand’s second largest electricity distributor. We own and operate a large network of electricity distribution assets that deliver more than 4400 GWh of electricity through 27,400km of lines and cables to more than 317,000 consumer connections. Powerco’s networks cover the Coromandel Peninsula, Thames Valley, Tauranga and Western Bay of Plenty, South and East Waikato, Taranaki, Wanganui, Rangitikei, Manawatu, Tararua and Wairarapa.
OPERATIONS
Electricity NetworksElectricity distribution networks in the Tauranga, Thames, Coromandel, Eastern and Southern Waikato, Rangitikei, Taranaki, Wanganui, Manawatu and Wairarapa regions.
Figure 4: Powerco Electricity Network Operations Map

7SUMMARY ASSET MANAGEMENT PLAN ELECTRICITY NETWORKS FY2010 – FY2019
Assets coVeReD
The full AMP, to which this summary refers, provides detailed information on Powerco’s fixed electricity network assets. The following graphs and table provide a summary of the assets covered.
$mill
ion
0
1,200
1,000
800
600
400
200
Electricity Network Replacement Cost by Asset Type
Overhead Line Underground Cable Distribution Transformers Distribution Switchgear
Zone Substations SCADA/Comms/Ripple Spares (Emergency & Critical)
Figure 5: Electricity Network Asset Replacement Cost by Asset Type (2004 ODV Valuation).
$mill
ion
0
1,200
1,000
800
600
400
200
Electricity Network Replacement Cost by Function
Subtransmission Zone Substation & GXP Protection & Control Distribution
Distribution Substation Low Voltage Spares (Emergency & Critical)
Figure 6: Electricity Network Asset Replacement Cost by Functional Category (2004 ODV Valuation).
Replacement Cost by Asset Category
Rep
lace
men
t C
ost
($00
0)
0
1,000,000
500,000
1,500,000
2,500,000
2,000,000
Assets Valued at ODV Replacement Cost
Assets Valued at Current Replacement Cost
Overhead Underground Transformers Switchgear Substations
Asset Category
Figure 7: Replacement Cost by Asset Category.
Table 1: Key Network Statistics
Key Network Stats as at 31 March 2009 Total EasternSouthern &
Western
Length of Overhead Circuit (km) 23,089 8,189 14,900
Length of Underground Circuit (km) 6,185 2,809 3,376
Subtransmission Circuit Length (km) 1,666 598 1,068
Distribution Circuit Length (km) 16,638 5,905 10,733
Low-Voltage Circuit Length (km) 10,970 4,495 6,475
Number of Zone Substations and Switching Stations 108 42 66
Zone Substation Transformer Capacity (MVA) 1,503 749 754
Distribution Transformer Capacity (MVA) 2,870 1,376 1,494

8 SUMMARY ASSET MANAGEMENT PLAN ELECTRICITY NETWORKS FY2010 – FY2019
tHe Asset MAnAGeMent PLAn AnD PRocess
With Powerco’s electricity network assets ranging in age from new to more than 50 years old, effective long-term planning is a fundamental requirement of our business. Our AMP is an integral part of that planning because it not only explains Powerco’s management and maintenance policies, but also sets out our plans for focussed investment in security, capacity and reliability of an ageing network that is facing constantly rising levels of demand. This means Powerco has increasing investment requirements as assets progressively reach the end of their useful lives.
The full AMP contains specific details on Powerco’s short- and long-range planning for network development, renewal and maintenance. In other words, the AMP is a high-level document providing management, stakeholders and any interested parties with a broad overview of Powerco’s asset management policies, asset details, service levels, capital and maintenance works planning, expenditure forecasts, risk management and performance evaluation.
Incorporating information from a range of other internal documents, the AMP sets out the performance criteria for the assets, and summarises the actions needed to achieve those performance criteria.
Developing the AMP is a key step in ensuring that the needs of all stakeholders are properly considered and incorporated into Powerco’s long-term asset management strategies. It also ensures that plans provide, subject to any regulatory constraints, the optimum balance between levels of service and the efficient costs to provide the required service. Figure 8 illustrates the structure of the full AMP and what each section is trying to address.
Who wants what from the assets?
What is the state of the assets?
What performance are we targeting from the assets? How are we doing vs. the target? What are the gaps?
How are we managing the network and solving any performance gaps?
What does this mean for the works programmes and required expenditure?
How can we improve?
Section 2Define StakeholdersDefine AM Drivers
Section 3Describe Assets
Section 4Set Performance Targets
Section 5Performance Evaluation
Section 10Analyse Network Risks
Section 6, 7 and 8Develop Work ProgrammesLinked with AM Driver
Section 9Set Expenditure Forecasts
Section 6Set Asset Lifecycle StrategyAnalyse Renewal Needs
Section 8Reliability, Safety, Environment Enhancement NeedsProtection & Control, Smart Network Development
Section 7Security Criteria Prepare Load Forecasts System Growth Needs
Section 11Develop AM Improvement Initiatives
Figure 8: Structure of Asset Management Plan and Process.

9SUMMARY ASSET MANAGEMENT PLAN ELECTRICITY NETWORKS FY2010 – FY2019
PRocess oVeRVIeW
The asset management process requires that electricity is provided at the most efficient cost. This is a process of many parts, including:
strategy Long-term strategic direction for the management of the assets and the business operations. This is the key interface for customer consultation and corporate strategy.
Planning This process involves planning for the renewal, development, maintenance and operation of the assets.
service provision This involves the delivery of construction, maintenance and operating services on the network assets.
network operations This involves the management of the real-time operation of the networks, recording network outages and approving planned outages and access to the network by service providers.
Information This involves the maintenance of, and reporting from, the asset information databases.
There is, of course, extensive and constant interaction between these processes, and with corporate, customer and regulatory management teams.
PURPose oF tHIs AMP sUMMARY
Electricity distribution networks and the asset management processes that drive them are very complex. Therefore, a huge amount of information is required to compile a thorough AMP. This complexity and level of detail can act as a barrier to providing feedback for some parties, due to a feeling of “information overload.” Powerco recognises this and that is why we have produced this AMP summary which is intended to identify the key issues relevant to the majority of interested parties. Anyone interested in Powerco’s AMP or operations in general is encouraged to read this summary to learn more about our business and what we are trying to achieve on behalf of all our stakeholders. If further information is required, Powerco’s full AMP is available at www.powerco.co.nz/Financial/Stat_Docs/Asset_Disclosures/
10 SUMMARY ASSET MANAGEMENT PLAN ELECTRICITY NETWORKS FY2010 – FY2019
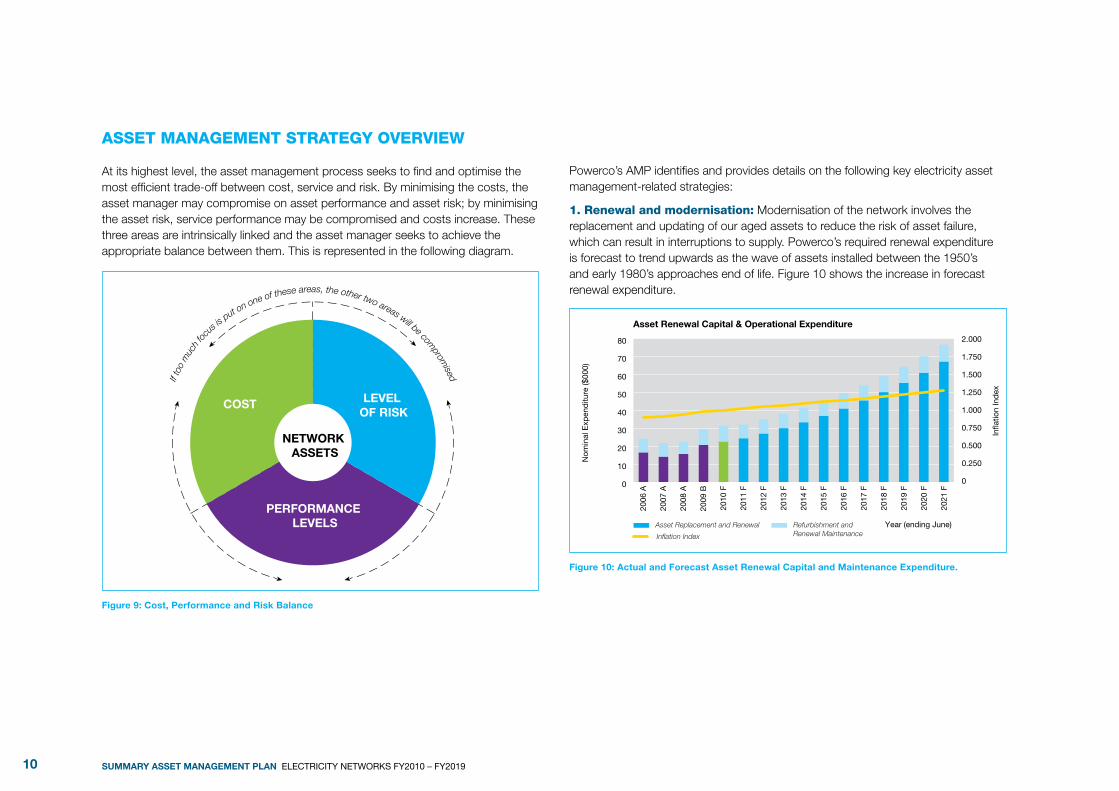
Asset MAnAGeMent stRAteGY oVeRVIeW
At its highest level, the asset management process seeks to find and optimise the most efficient trade-off between cost, service and risk. By minimising the costs, the asset manager may compromise on asset performance and asset risk; by minimising the asset risk, service performance may be compromised and costs increase. These three areas are intrinsically linked and the asset manager seeks to achieve the appropriate balance between them. This is represented in the following diagram.
NETWORK ASSETS
COST LEVEL OF RISK
PERFORMANCE LEVELS
If to
o m
uch
fo
cus i
s put on one of these areas, the other two areas will be com
promised
Figure 9: Cost, Performance and Risk Balance
Powerco’s AMP identifies and provides details on the following key electricity asset management-related strategies:
1. Renewal and modernisation: Modernisation of the network involves the replacement and updating of our aged assets to reduce the risk of asset failure, which can result in interruptions to supply. Powerco’s required renewal expenditure is forecast to trend upwards as the wave of assets installed between the 1950’s and early 1980’s approaches end of life. Figure 10 shows the increase in forecast renewal expenditure.
Infla
tion
Ind
ex
Asset Renewal Capital & Operational Expenditure
Asset Replacement and Renewal Refurbishment and Renewal MaintenanceInflation Index
Year (ending June)
Nom
inal
Exp
end
iture
($00
0)
0
2.000
1.750
1.500
1.250
1.000
0.750
0.500
0.250
0
10
20
30
40
50
60
70
80
2006
A
2007
A
2008
A
2009
B
2010
F
2011
F
2012
F
2013
F
2014
F
2015
F
2016
F
2017
F
2018
F
2019
F
2021
F
2020
F
Figure 10: Actual and Forecast Asset Renewal Capital and Maintenance Expenditure.

11SUMMARY ASSET MANAGEMENT PLAN ELECTRICITY NETWORKS FY2010 – FY2019
WHo WAnts WHAt FRoM tHe Assets?
The following figure illustrates the relationship between Powerco’s main stakeholders, their drivers and the asset management process. The diagram now includes a recognition of the business planning process as the stakeholder drivers are equally (and in some cases more appropriately) applicable to the business planning process.
Asset Management Process
Business Planning Process
Customers/Consumers
Assets
Government & Regulator
Owners & Lenders Employees & Contractors
Safety Workflow Certainty Market Costs
Service/Price Safety Load Growth
Asset Performance Asset age/condition
Development, Renewal, Maintenance, Operation
Long Term Value (Productivity & Utilisation) Risk Management
Economic Efficiency (Long-Term Interest of Consumers) Environmental Safety & Compliance
Figure 11: Powerco Stakeholders and Drivers of the Asset Management Process
2. Increasing the redundancy (duplication) of the core network: Redundancy means that if one critical component fails or needs to be taken out of service, there is another component ready to continue supply. This includes increasing zone substation capacity and installing more network automation. Powerco has identified the potential for 17 zone substations to be built and 20 additional transformer banks to be installed at existing substations over the next 10 years.
3. standardising systems and processes: This is a key strength of Powerco’s employees and a significant focus for management. Powerco has developed a common maintenance management system and an integrated, more accessible suite of information systems. There has also been continuing development of design, construction and maintenance standards, which lead to lower risk profiles in the network and less reliance on field staff. Further investment in the standardisation of systems and processes will allow us to extend asset lives.
4. Developing a “smart” network: Smart network plans, which are an addition to the 2010 AMP, aim to be self-healing and capable of shifting the load from peak times. They are something to which regulators in many countries are now paying greater attention because they are perceived to offer customers improvements in performance and cost. Smart networks, which offer flatter, more manageable patterns of demand, fit well with Powerco’s business plan objectives of improving reliability through automated solutions, and managing increasing investment profiles through non-asset solutions.

12 SUMMARY ASSET MANAGEMENT PLAN ELECTRICITY NETWORKS FY2010 – FY2019
Figure 12 below illustrates the influences of the various drivers affecting the total amount spent on the network over time.
Net
wor
k S
pen
d
Asset Management ProcessTime
Renewal
Asset Age,Condition &
Configuration
Development
Utilisation
Productivity
Long-termShareholder
value
Regulated Revenue
O&MIndirect Costs
Service LoadGrowth
Safety
Environmental
RiskMgmt
Market CostsFor Work
Figure 12: Illustration of the Influence of Asset Management Driver
The diagram reflects the current situation, which can be summarised as upwards pressure on network spend through:
• The required level of service
• Load growth
• Safety, environmental and other regulatory compliance obligations
• The market costs for field work activities
• The current attributes of the network, i.e. asset age, condition and configuration
The drivers that place downwards pressure on network expenditure are:
• Powerco’s commercial driver to achieve long-term sustainable value for its shareholders, which (in this context) is reflected in utilisation and productivity drivers.
• The regulated revenue, namely the allowable revenue and form of control.
At a strategy level, constraints, asset management drivers and the needs and interests of various stakeholders are evaluated and considered as part of the corporate planning process. These are all applied during the network planning process.
For instance, at a strategy level, the need to increase investment to manage an ageing network, load growth and worsening reliability has to be balanced against the revenue that Powerco is allowed to earn under the current Default Price Path and investors’ (debt and equity) expectations of earning risk-adjusted returns on their investment.
At a tactical and operational level in the network planning process, the investment policy and asset management strategy is shaped by Powerco’s multi-stakeholder assessment process. This process is a key part of the way in which network development and renewal programmes are formed. Powerco faces a constant balancing act to ensure the needs of consumers and stakeholders are met at the optimal levels of price and quality. Feedback from electricity retailers and consumers is essential in ensuring we achieve the best possible balance for the widest possible range of stakeholders.
To help achieve the optimal balance, projects are assessed using a multi-stakeholder optimisation process (known as Coin Optimiser), whereby the projects are reviewed against a set of four strategic objectives. The primary objectives of the optimisation process are:
• To provide a consistent approach to the development of capital works programmes that balances (potentially conflicting) stakeholder requirements;
• To eliminate (or mitigate) any high risks to public safety, network performance, customer outcomes, public relations, or employee engagement; and
• To maximise the strategic value of the portfolio of projects that make up the
capital works programme.
Further details on the optimisation process are set out in Section 2.6 of the full AMP.

13SUMMARY ASSET MANAGEMENT PLAN ELECTRICITY NETWORKS FY2010 – FY2019
stAte oF tHe Assets
The age profile by replacement costs of the entire infrastructure asset base (on current replacement costs) is presented as a nine year moving average and is shown in the diagram below.
Total Asset Replacement Cost vs Age
Rep
lace
men
t C
ost
($00
0)
0
30,000
20,000
10,000
40,000
50,000
60,000
70,000
90,000
110,000
80,000
100,000
Substations Switchgear Transformers Underground Overhead
65605550454035302520151050 ODL
Age (Years)
Figure 13: Total Asset Age Profile
Condition monitoring shows that the assets are generally in the condition expected of their age.
PeRFoRMAnce AGAInst tARGet oVeRVIeW
The following table shows Powerco’s key performance measures.
Table 2: Current Electricity Asset Performance
Electricity Measure Measure (2009) Target for 2011 Commentary
Network Reliability (SAIDI)
290.7 min/customer (actual)
196.7 min/customer (excl storms)
170 min/customer
Reliability levels have been static. Price has been decreasing in real terms, hence customers’ current price/quality trade-off has been improving
Network Reliability (SAIFI)
2.76 interruptions/customer (actual)
2.61 interruptions/customer (excl storms)
2.56 interruptions/customer
See above
Customer density
11.2 ICPs/km N/A Urban/rural mix, below weighted industry average
Average consumption
13.4 MWh/ICP N/A Low (presenting growth opportunity). Benchmarking weakness
Direct operating costs
1057 $/km 1259 $/km Efficient level of spend, in efficient quartile for the industry
Capex spend 8.7% of ODV 8.8% of ODV Efficient level of spend, around the median for the industry
Asset investment
$32,450/km, $3012/ICP
$3000/ICP Efficient, particularly when compared to similar density EDBs
Load factor 67% 65% High load factor, good spread of customer load
Capacity utilisation
29% 30% Low utilisation reflecting rural network. Benchmark weakness
Security Substation and feeder security
N/A Appropriate, standards are commensurate with load, current situation reflects more from historic standards to new standards and new load growth
Asset condition
25 years average age
Asset condition reports
N/A Asset condition well monitored, appropriate asset condition commensurate with age, but increasing investment profile

14 SUMMARY ASSET MANAGEMENT PLAN ELECTRICITY NETWORKS FY2010 – FY2019
Performance looks at the consumer-related service requirements, and the confirmation of these requirements through the consumer consultation process. It then looks at the ways in which economic efficiency is assured in the asset management process, contractor performance, safety performance, environmental matters and statutory compliance.
The targets also take into account the type of assets used across our network, and make comparisons with other New Zealand lines companies with the same customer density and ratio of overhead to underground construction. They also consider past planning practice, economic factors, recognised international best practice and safety.
Powerco achieves a balance between owner requirements and legislative, regulatory and consumer expectations in setting these performance criteria. The levels of service adopted by Powerco for its asset management plan are based on the internationally recognised measurements, SAIDI, SAIFI and CAIDI (which are acronyms for formulae covering the duration and frequency of power outages, and their customer bases) and accepted New Zealand lines companies’ best practice.
Powerco conducts an extensive Customer Communications Programme to verify that performance targets match consumer and stakeholder expectations. Consumer consultation is a requirement of the Commerce Act (Electricity Distribution Thresholds Notice 2004). The primary intention of this requirement is to ensure distribution businesses effectively consult with, and take into account, the views of their customers and stakeholders. Regardless of regulatory requirements, Powerco views consumer consultation as common sense – essentially, our job is made easier if the communities in which we operate understand who we are and how our business operates. In addition to Powerco-initiated consultation, a database is kept of all complaints and suggestions registered by its customers through Powerco’s call centre. These complaints are mapped by type for later reference in planning activities.
Economic efficiency is an important driver for maintenance, renewal and development work. A large proportion of repair work, refurbishment and asset replacement work is undertaken only after economic analysis to determine the most cost-effective solution. This frequently involves the choice between replacement and continued maintenance.
Safety is a critical driver of the asset management process. Electrical plant and equipment are capable of causing serious harm. Measures must be taken to ensure, as far as practicable, the safety of employees and the public. To this end, the network must be maintained in a way that meets statutory requirements, follows good engineering practice, and is considered safe in accordance with recognised industry standards.
Safety is determined by a combination of:
• Asset design;
• Maintaining the assets in a safe condition;
• Safe operating and work practices; and
• Statute: The Electricity Regulations, Electrical Codes of Practice and the Australian/New Zealand Standard Wiring Rules. There is also the Safety Manual – Electricity Industry (SM-EI), which contains the framework for Powerco’s safety-related network operation. Powerco has now implemented its network operating procedures to comply with the requirements of SM-EI. Additionally, there are the Building Act, the Health and Safety in Employment Act, the Hazardous Substances and New Organisms Act 1996, and various guides set out by the Electricity Engineers Association.
Powerco has adopted the practice of working as a reasonable and prudent operator to guide safe asset management practices. Its health and safety policy and procedures are set out in documents in the Powerco Business Management System. Contractors can receive instructions from the Contracts Works Manual and the Network Operations Manual, both of which are new initiatives that operate with online search applications.
The company carries out a policy of auditing its contractors for health and safety compliance, along with their quality of workmanship. Health and safety audit breaches are divided into major and minor. We have a focus on continual improvement on health and safety and have a target number of zero major breaches.

15SUMMARY ASSET MANAGEMENT PLAN ELECTRICITY NETWORKS FY2010 – FY2019
RIsK MAnAGeMent
Powerco’s Board and management are committed to maintaining a business environment that demonstrates good corporate governance practices. Risk management is therefore an integral part of the company’s business to support effective decision-making and provide assurance to staff, customers and the public, as well as shareholders and stakeholders.
The aim of the risk management programme is to identify and understand the likelihood, consequence, control effectiveness, and action plans required to make risk levels acceptable. The risk management programme, which conforms to current New Zealand standards, is supported by Powerco’s corporate insurance programme covering low-probability and high-impact events.
Asset LIFecYcLe PLAn
As Powerco’s network continues to age, more investment in renewal and maintenance is required in order to maintain current reliability levels. Powerco is spending less on asset renewal than what asset age profiles indicate should be spent; however, this must be viewed in the context of regulated allowable revenue. The required increase in replacement costs is demonstrated in the following figure.
All Assets - Replacement Profile
Rep
lace
men
t C
ost
($00
0)
0
$40,000
$20,000
$60,000
$80,000
$100,000
$120,000
Year of Replacement (FY)
$140,000
2009
2010
2011
2012
2013
2014
2015
2016
2017
2018
2019
2020
2021
2022
2023
ODV Replacement Cost (June 2007 quantities in $2004 terms)
Current Replacement Cost (including $2004 to $2007 inflationfactor and capital efficiency factor)
9 year rolling average, Current Replacement Cost (including$2004 to $2007 inflation factor and capital efficiency factor)
50 Year Average (Current Replacement Cost) ($2007)
Renewal Budget (Real 2008$)
Figure 14: Total Network Asset Replacement Profile
A number of renewal projects are described in the maps which follow in this AMP summary. The maps show the major projects Powerco wishes to undertake prior to application of the multi-stakeholder assessment process described earlier.

16 SUMMARY ASSET MANAGEMENT PLAN ELECTRICITY NETWORKS FY2010 – FY2019
Maintenance Work Types
Powerco’s maintenance work comprises the following elements:
• Maintenance management and maintenance planning;
• Routine inspections and condition assessments;
• Routine servicing;
• Non-routine servicing (overhauls);
• Fault first response, callouts;
• Asset relocations (where an asset is simply moved and not replaced);
• Evaluation of inspection and condition monitoring results to determine any maintenance or renewal requirements (this may be performed in the field at the time of inspection/condition monitoring or later by engineering staff);
• Evaluating faults to predict maintenance or renewal requirements;
• Performing corrective maintenance or renewal as a result of the above; and
• Service disconnections.
Asset Renewal Strategic Themes
Powerco’s scheduled asset renewal strategy encompasses three main themes, each of which is appropriate for the different asset types.
A run to failure strategy is applied to assets where the consequences of failure are not major and where the costs of ongoing condition monitoring may outweigh the costs of failure. This strategy is applied to equipment such as small pole-mounted distribution transformers, underground distribution feeder cable spurs, LV cables, expulsive fuses and surge arresters.
A risk and condition based replacement strategy is applied where there is a significant implication due to failure, such as major health and safety risk, significant reliability of supply consequence or a major expense in repair. This strategy is applied where ongoing condition inspections are needed to comply with regulations or where the costs of condition monitoring are small compared with the costs associated with failure. It is applied to equipment such as poles, cross-arms, important distribution feeder cables and zone substation transformers.
An age and obsolescence based replacement strategy is applied to assets with a high level of technical complexity or a high level of interconnectedness with other
network assets (that is, the operation of a system as a whole is dependent on the integrity of several assets. It includes the need to replace equipment because of availability of spares, or for standardisation or changes in technology. This strategy is applied to equipment such as zone substation switchgear, SCADA equipment and protection relays. Reactive renewal strategies are based around the need to renew assets that have failed and need to be replaced in a short time or to renew assets with a high imminent risk of failure.
Asset Renewal Forecasting Process
The most accurate means of forecasting renewal needs for the network is through knowledge of the condition of the assets. A condition-based renewal programme is the most accurate for a period of around one to five years’ hence. Beyond this, renewal forecasts are best made using age profiles.
Renewal forecasting involves determining the quantity of assets needing renewal (renewal tasks) and the unit costs per renewal task. The forecast renewal expenditure equals the product of these two factors. The asset condition information is presently being compiled in the Maintenance Management system, and so the full extent of condition-based renewal needs is still in progress.
Estimates of condition-based renewal forecasts, calculated on the information available, have been entered into Powerco’s Improvement Register and an extract of the renewal expenditure needs from this is given in Section 9.
Life Extension Practices
Various life extension techniques have been tried by Powerco, but apart from transformer refurbishment, these really apply to only specialised assets and many of the techniques have had only limited degrees of success.
Redeployment, Upgrade and Disposal of Existing Assets
Powerco is presently developing its policy on reusing second-hand materials, such as poles and conductors, and rotables, such as transformers.
Powerco is also updating its disposal policies in line with its Environmental strategy. It is not envisaged that any major network assets will need disposal that would have environmental consequences during the period covered by the full AMP.

17SUMMARY ASSET MANAGEMENT PLAN ELECTRICITY NETWORKS FY2010 – FY2019
netWoRK DeVeLoPMent PLAn
The network security criteria describe the factors considered when preparing the long- and medium-term development plans. Load forecasts are presented and these, along with the security criteria, culminate in the capital works programme for development.
Powerco has a range of development plans for different categories of equipment and customer bases.
Network security of supply is a measure of the resilience of the network to operational changes, such as planned outages (e.g. those required for maintenance), and unforeseen events (e.g. forced outages, such as those caused by equipment failure or storms, as well as unexpected customer loads). The ability of the network to accommodate unforeseen events is a factor that can influence reliability of supply, somewhat akin to a network balance sheet.
Powerco’s security of supply criteria have been set taking into account the Electricity Engineers’ Association’s Security of Supply Guidelines and the report, entitled Interaction between Transmission and Distribution System Planning, from the CIGRE/CIRED Working Group, as well as the findings of the customer communications process.
Load forecasting for the purposes of the asset management process is based on growth in peak-time demands. Peak requirements need to be understood to determine the required capacity of a lines infrastructure that will support local load growth.
The most significant influences on demand growth continue to result from changes in population and household composition, and the growth or relocation of industry. Internal migration patterns thus have a strong influence on the observed demand growth. Government initiatives to promote energy efficiency and the preference for renewable sources of energy have been considered in preparing the forecast growth.
Known industry changes – such as oil and gas exploration and development; primary sector changes; and infrastructure, such as ports – account for step changes seen in forecasts. The establishment of major new industries can have a considerable impact within a short time in the level of demand experienced in any given locality. The possibility of new spot loads is monitored through Key Account Managers, Resource Management Act notifications and consumer consultation.
Table 3 and Figure 15 below show projected demand growth for the next five years.
Table 3: Forecast growth in electricity volumes (2010 -2015)
kWh Growth forecast (Electricity Only)
Assumption 2010 2011 2012 2013 2014 2015
Eastern Region (Model) 1.25 1.75 2.25 2.50 2.50 2.50
Western Region (Model) 1.25 1.25 1.25 1.25 1.25 1.25
Eastern Region (medium recession scenario) 1.5 1.5 2.5 2.5 2.5 2.5
Western Region (medium recession scenario) 0.67 0.67 1.0 1.0 1.0 1.0
Zone Substation Maximum Demand Growth
Per
centa
ge
Gro
wth 3.0%
2.0%
1.0%
0.0%
-1.0%
-2.0%
5.0%
4.0%
Powerco Powerco Prudent Powerco Probable
Eastern Eastern Prudent Eastern Probable
Western Western Prudent Western Probable
2005 2006 2007 2008 2009 2010 F 2011 F 2012 F 2013 F2013 F 2015 F
Year
Figure 15: Powerco Aggregate Maximum Demand Growth

18 SUMMARY ASSET MANAGEMENT PLAN ELECTRICITY NETWORKS FY2010 – FY2019
netWoRK enHAnceMent
Powerco’s network enhancement plans encompass:
• Reliability improvements, which take into account feeder reliability performance, historical trends and plans for automation;
• Protection and control developments including protection, SCADA, load control and metering;
• Environmental performance and improvement;
• Safety performance enhancement; and
• Smart network implementation.
The network enhancement processes are driven by several of the “big picture” strategic themes of renewal and modernisation, automation, safety management and “smartening” the network.
The major network enhancement projects Powerco wishes to undertake are described in the maps which follow in this AMP summary. All network enhancement projects will also go through the multi-stakeholder assessment process.
cAPItAL eXPenDItURe
Capital expenditure (capex) is the budget used to create new assets or to increase the service performance or potential of an existing asset. The forecast total capital expenditure to FY2021 is shown in the diagram below.
Nom
inal
Exp
end
iture
($00
0)
Infla
tion
Ind
ex
0
2.000
1.750
1.500
1.250
1.000
0.750
0.500
0.250
0
20,000
40,000
60,000
80,000
100,000
120,000
140,000
160,000
2006
A
2007
A
2008
A
2009
B
2010
F
2011
F
2012
F
2013
F
2014
F
2015
F
2016
F
2017
F
2018
F
2019
F
2021
F
2020
F
Total Network Capex
Routine & Preventive Maintenance Inflation Index Financial Year
Figure 14: Total Network Capital Expenditure
Capital budgets, under the categories of System Growth, Reliability, Safety, Environment and Asset Renewal, are monitored at the end of every month and budget re-forecasts are made quarterly. A portion is set aside for reactive or unforeseen work, such as equipment failure or storms. Under- or over-spend in this category is accommodated by juggling other projects in the capital programme.
Allowance is also made for opportunities to purchase land for future zone substation sites or easements for lines. In our experience, gradual land or easement banking as the opportunities arise to a well-thought-out development plan is a more efficient way of developing the network than an urgent short-term focus.
19SUMMARY ASSET MANAGEMENT PLAN ELECTRICITY NETWORKS FY2010 – FY2019
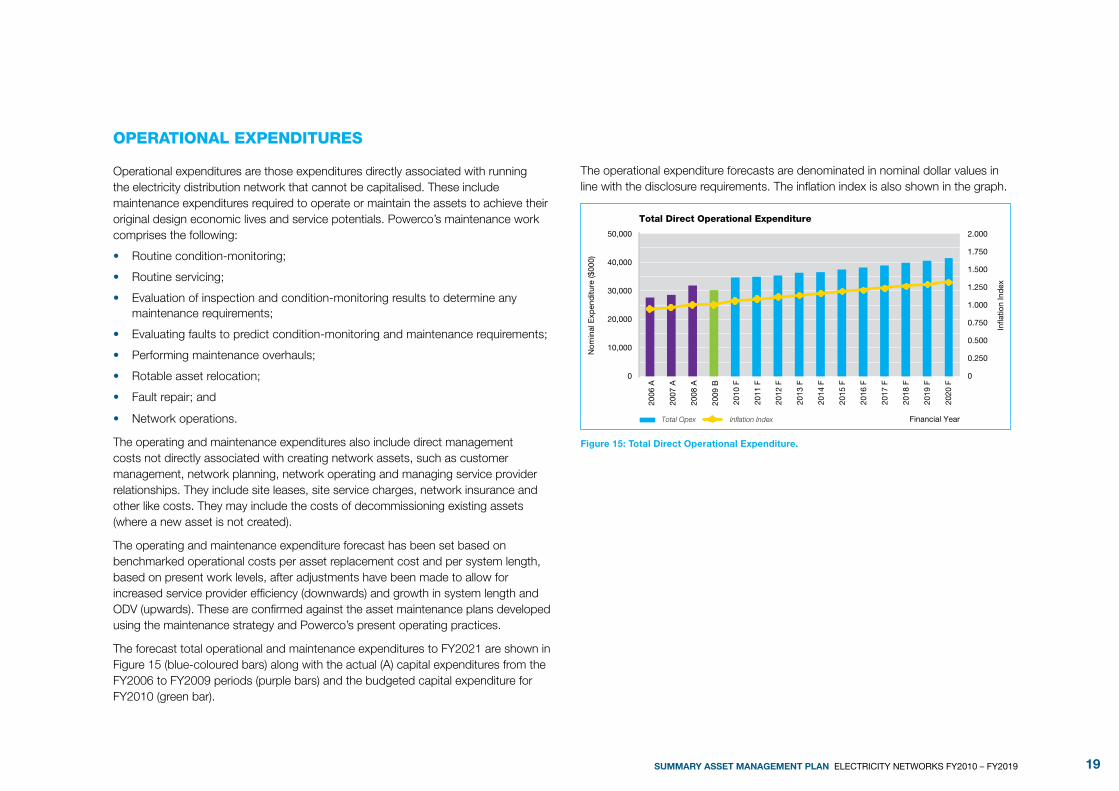
oPeRAtIonAL eXPenDItURes
Operational expenditures are those expenditures directly associated with running the electricity distribution network that cannot be capitalised. These include maintenance expenditures required to operate or maintain the assets to achieve their original design economic lives and service potentials. Powerco’s maintenance work comprises the following:
• Routine condition-monitoring;
• Routine servicing;
• Evaluation of inspection and condition-monitoring results to determine any maintenance requirements;
• Evaluating faults to predict condition-monitoring and maintenance requirements;
• Performing maintenance overhauls;
• Rotable asset relocation;
• Fault repair; and
• Network operations.
The operating and maintenance expenditures also include direct management costs not directly associated with creating network assets, such as customer management, network planning, network operating and managing service provider relationships. They include site leases, site service charges, network insurance and other like costs. They may include the costs of decommissioning existing assets (where a new asset is not created).
The operating and maintenance expenditure forecast has been set based on benchmarked operational costs per asset replacement cost and per system length, based on present work levels, after adjustments have been made to allow for increased service provider efficiency (downwards) and growth in system length and ODV (upwards). These are confirmed against the asset maintenance plans developed using the maintenance strategy and Powerco’s present operating practices.
The forecast total operational and maintenance expenditures to FY2021 are shown in Figure 15 (blue-coloured bars) along with the actual (A) capital expenditures from the FY2006 to FY2009 periods (purple bars) and the budgeted capital expenditure for FY2010 (green bar).
The operational expenditure forecasts are denominated in nominal dollar values in line with the disclosure requirements. The inflation index is also shown in the graph.
Nom
inal
Exp
end
iture
($00
0)
Infla
tion
Ind
ex
0
50,000
40,000
30,000
20,000
10,000
0
2.000
1.750
1.500
1.250
1.000
0.750
0.500
0.250
2006
A
2007
A
2008
A
2009
B
2010
F
2011
F
2012
F
2013
F
2014
F
2015
F
2016
F
2017
F
2018
F
2019
F
2020
F
Total Direct Operational Expenditure
Total Opex Inflation Index Financial Year
Figure 15: Total Direct Operational Expenditure.

20 SUMMARY ASSET MANAGEMENT PLAN ELECTRICITY NETWORKS FY2010 – FY2019
FInAncIAL
A summary of the forecast capital and maintenance expenditures over the next ten years is shown in the tables below.
Table 4: Capital Expenditure Forecast ($000) (Nominal $ Values)
Capex summary breakdown FY 2006 A FY 2007 A FY 2008 A FY 2009 A FY 2010 B FY 2011 F FY 2012 F FY 2013 F FY 2014 F FY 2015 F FY 2016 F FY 2017 F FY 2018 F FY 2019 F FY 2020 F FY 2021 F
Customer Connection 23,714 22,076 29,144 29,023 18,366 19,860 18,919 18,141 17,123 16,262 16,620 16,985 17,359 17,741 18,131 18,530
System Growth 11,563 14,472 15,951 18,853 22,474 23,796 24,411 25,023 23,940 22,787 23,288 23,801 24,324 24,859 25,406 25,965
Reliability, Safety and Environment 7,413 8,128 8,961 10,986 10,845 13,567 14,281 15,042 15,202 15,399 16,309 17,302 18,323 19,436 20,652 21,980
Asset Replacement and Renewal 16,526 14,164 15,626 20,710 21,177 24,441 27,131 30,098 33,390 37,043 41,098 45,597 50,227 55,355 61,037 67,333
Asset Relocations 2,635 2,453 3,238 3,225 1,422 2,207 2,338 2,242 2,335 2,218 2,266 2,316 2,367 2,419 2,472 2,527
Total Capex 61,851 61,293 72,920 82,797 74,285 83,870 87,080 90,545 91,989 93,708 99,581 106,002 112,601 119,811 127,699 136,335
Table 5: Operating & Maintenance Expenditure Forecast ($000) (Nominal $ Values)
Opex summary breakdown FY 2006 A FY 2007 A FY 2008 A FY 2009 A FY 2010 B FY 2011 F FY 2012 F FY 2013 F FY 2014 F FY 2015 F FY 2016 F FY 2017 F FY 2018 F FY 2019 F FY 2020 F FY 2021 F
System Management & Operations 6,654 6,750 7,627 5,968 8,026 10,351 11,041 11,760 11,920 12,120 12,336 12,556 12,778 13,004 13,233 13,524
Routine & Preventive Maintenance 9,427 9,901 11,510 10,394 11,800 11,521 11,750 12,015 12,162 12,436 12,710 12,989 13,275 13,567 13,866 14,171
Refurbishment & Renewal Maintenance 7,683 7,615 6,918 8,938 8,921 7,680 7,833 8,010 8,108 8,291 8,473 8,660 8,850 9,045 9,244 9,447
Fault & Emergency Maintenance 4,353 4,314 5,990 5,064 5,079 6,400 6,528 6,675 6,757 6,909 7,061 7,216 7,375 7,537 7,703 7,873
Total Opex 28,118 28,580 32,045 30,364 33,826 35,953 37,152 38,460 38,947 39,756 40,580 41,421 42,279 43,153 44,046 45,015
Table 6: Total Expenditure Forecast ($000) (Nominal $ Values)
Asset Class FY 2006 A FY 2007 A FY 2008 B FY 2009 F FY 2010 F FY 2011 F FY 2012 F FY 2013 F FY 2014 F FY 2015 F FY 2016 F FY 2017 F FY 2018 F FY 2019 F FY 2020 F FY 2021 F
Operational Expenditure 28,118 28,580 32,045 30,364 33,826 35,953 37,152 38,460 38,947 39,756 40,580 41,421 42,279 43,153 44,046 45,015
Capital Expenditure 61,851 61,293 72,920 82,797 74,285 83,870 87,080 90,545 91,989 93,708 99,581 106,002 112,601 119,811 127,699 136,335
Total 89,969 89,873 104,964 113,161 108,111 119,823 124,232 129,005 130,936 133,464 140,162 147,423 154,879 162,965 171,744 181,349

21SUMMARY ASSET MANAGEMENT PLAN ELECTRICITY NETWORKS FY2010 – FY2019
Asset MAnAGeMent IMPRoVeMent
Powerco has a philosophy of continual improvement in its Asset Management and Customer Management processes (as well as other business processes).
A gap analysis of the level of maturity of Powerco’s electricity network Asset Management processes is presented in the full AMP, along with specific system improvement projects.
InFoRMAtIon sYsteMs
Given Powerco’s history of growth and acquisition, the standardisation of systems and processes has been a key goal over the years and is now among the company’s major strengths.
A range of information systems have been implemented at Powerco to support the asset management processes, covering spatial network data; works and financial management; and real-time operation and control of the network. A number of significant data and system standardisation projects are currently being undertaken to enhance this core capability.
Under continual refinement is Powerco’s maintenance management system, which includes the progressive rollout of field automation. A rolling audit of network data gathers information as varied as the size of major conductor wires all the way down to the location of street lights.
seRVIce PRoVIsIon stRAteGY
Powerco has developed a service provision strategy to set the long-term direction for the management of construction and maintenance activities in line with its business model and corporate objectives. This strategy has been designed to deliver long term productivity gains and maximise design innovation. The strategy was developed in 2004 and has resulted in a move to outsourcing detailed design and (capital and operational) field work via alliance and patch based contracts.
The market principles involved enable effective control by Powerco, but with a high degree of delegation to service providers, which operate under clear and strict safety criteria. This strategy has delivered strong improvements in works completion performance – particularly involving the 5% ($6 million) increase in capital work, primarily pole replacement, being tendered in FY2010.
The delivery strategy uses competitive market principles to deliver sustainable improvements in the cost, quality and safety of construction and maintenance services on the electricity network. These include:
• Facilitating Service Provider resources with expertise matched to the work requirement in the locations required;
• Maximising the Service Provider’s control over the inputs to its services to allow it to meet the service performance level;
• Utilising competitive tension to encourage continuous improvement in the cost of the delivered service;
• Minimising the level of management of Service Providers while ensuring appropriate control is maintained to deliver the desired service outcome;
• Maintaining a high level of safety performance by Service Providers; and
• Fairly allocating risk between Powerco and the Service Provider.
Powerco’s Service Delivery strategy has delivered strong improvements in works completion performance. It is currently being reviewed to ensure that the arrangements are able to demonstrate to all stakeholders that capital and maintenance costs are efficient.

22 SUMMARY ASSET MANAGEMENT PLAN ELECTRICITY NETWORKS FY2010 – FY2019

23SUMMARY ASSET MANAGEMENT PLAN ELECTRICITY NETWORKS FY2010 – FY2019
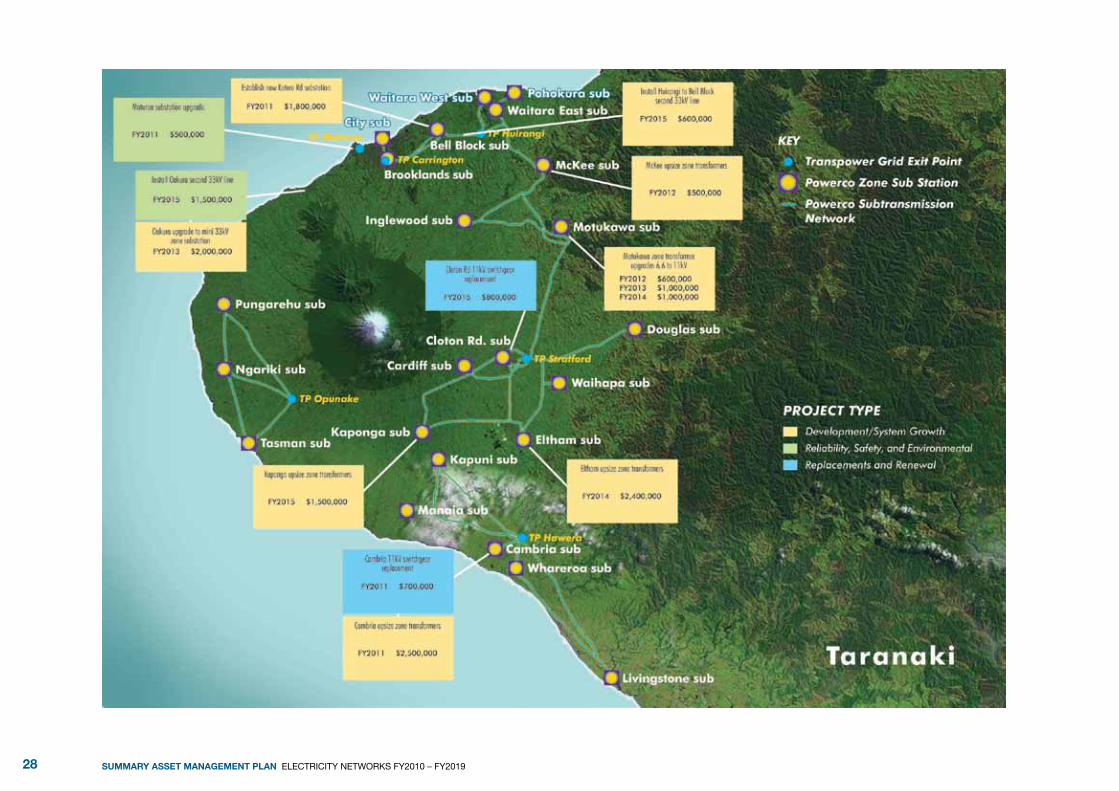
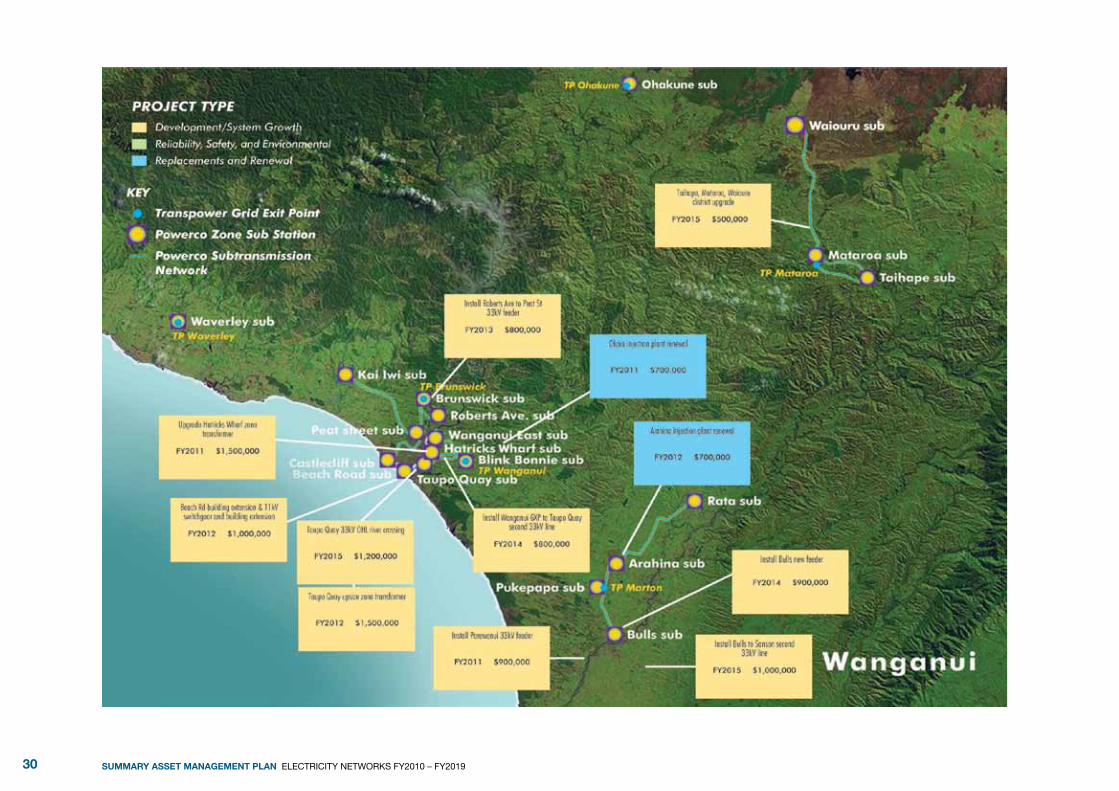
PRoJect MAPs
The following maps show a selection of the major projects Powerco plans to undertake in the next five years. However, it must be noted that because of capital constraints and Powerco’s project selection process there is no guarantee all of these projects will go ahead. It should also be noted that the maps show major projects only and Powerco plans to undertake many more projects in addition to these. More detailed lists of proposed projects are set out in sections 6.13, 7.13, and 8.12 of Powerco’s full AMP. These include smaller and miscellaneous projects as well as major blitz projects such as pole, cross-arm, and conductor replacements across entire regions.

24 SUMMARY ASSET MANAGEMENT PLAN ELECTRICITY NETWORKS FY2010 – FY2019

25SUMMARY ASSET MANAGEMENT PLAN ELECTRICITY NETWORKS FY2010 – FY2019

26 SUMMARY ASSET MANAGEMENT PLAN ELECTRICITY NETWORKS FY2010 – FY2019

27SUMMARY ASSET MANAGEMENT PLAN ELECTRICITY NETWORKS FY2010 – FY2019
28 SUMMARY ASSET MANAGEMENT PLAN ELECTRICITY NETWORKS FY2010 – FY2019

29SUMMARY ASSET MANAGEMENT PLAN ELECTRICITY NETWORKS FY2010 – FY2019
30 SUMMARY ASSET MANAGEMENT PLAN ELECTRICITY NETWORKS FY2010 – FY2019

31SUMMARY ASSET MANAGEMENT PLAN ELECTRICITY NETWORKS FY2010 – FY2019
32 SUMMARY ASSET MANAGEMENT PLAN ELECTRICITY NETWORKS FY2010 – FY2019
KeY DeFInItIons
AMP: Asset Management Plan
CAIDI (Consumer Average Interruption Duration Index): The average duration of an interruption of supply per consumer who experienced an interruption in the period under consideration (usually a year).
Capital Expenditure (Capex): The expenditure used to create new assets or to increase the service performance or service potential of existing assets beyond their original design service performance or service potential.
Conductor: Wire or cable across which electricity travels.
Consumer: A person or organisation that receives electricity supply through a connection to Powerco’s network but is charged for the connection by an electricity retailer.
Crossarm: A long piece of timber or concrete which goes across the pole and supports the overhead wire (conductor)
Distribution transformer: A transformer is a device that changes voltage. Most distribution transformers change voltage from 11kV (but sometimes 6.6kV or 22kV) down to 400 or 230 volts.
Failure: an event in which a component or piece of equipment does not operate or ceases to operate as intended.
High Voltage: Voltage greater than 1000 volts (1kV).
ICP: Installation Control Point. This is the point of connection of a consumer to the Powerco network.
Insulator: A device made of material such as porcelain or glass that does not conduct electricity well and is, therefore, used to keep overhead wires (conductor) from touching each other or the pole/crossarm.
Interruption: An unplanned loss of electricity supply of one minute or longer, affecting three or more ICPs, due to an outage on the network.
Low voltage: Voltage lower than 1000 volts (1kV)
Maintenance: Activities necessary for retaining an asset as near as practicable to its original condition but excluding renewal of the asset.
Operational Expenditures (Opex): The expenditures directly associated with running the electricity distribution network that cannot be capitalised. These include maintenance and operating expenditures.
ODV: Optimized Deprival Valuation. A methodology used to value electricity distribution network assets at the level at which they can be commercially sustained in the long term, and no more.
Outage: A loss of electricity supply.
Redundancy: Having contingency components installed on the network. If one key component fails, there is another to perform the same role, which means there is not a loss of electricity supply.
Refurbishment: Activities to rebuild or replace parts or components of an asset to restore it to a required functional condition and extend its life beyond that originally expected (which may incorporate some modification). Refurbishment is a renewal activity.
Renewal: Activities to replace an existing asset with one of equivalent service performance capability.
Repair: The restoration of the functionality of a network component, either by replacing parts or rectifying faults.
SAIDI: System Average Interruption Duration Index. The average length of time of interruptions of supply that a consumer experiences in the period under consideration (usually a year).
SAIFI: System Average Interruption Frequency Index. The average number of interruptions of supply that a consumer experiences in the period under consideration (usually a year).
Scheduled or Planned Outage: A planned loss of electricity supply e.g. to undertake essential maintenance or renewal activities.
Security: The ability of the network to meet the service performance demanded of it during and after a transient or dynamic disturbance of the network or an outage to a component of the network.
Service Performance: The level of electricity supply service delivered in terms of quality, capacity and reliability.
Service Potential: The total expected future service performance of an asset. It is normally determined by reference to the service performance and economic life of similar assets.
Sub-transmission Network: The sub-transmission network carries electricity from Transpower or generation connection points to Powerco zone substations.
Zone Substation: A major Powerco building or site housing transformers and other equipment. At zone substations, electricity is converted from sub-transmission voltage (33kV or 66kV) to distribution voltage (usually 11kV).

33SUMMARY ASSET MANAGEMENT PLAN ELECTRICITY NETWORKS FY2010 – FY2019

34 SUMMARY ASSET MANAGEMENT PLAN ELECTRICITY NETWORKS FY2010 – FY2019
WWW.POWERCO.CO.NZPowerco welcomes feedback on this AMP summary, our full AMP, or any aspect of our business. Feedback can be directed to [email protected] or 0800 POWERCO (0800 769 3726)