Assessment of the Ship Plume Dilution Study - … · Stationary Cruise Ship Plume Dilution Study...
40
Assessment of the Stationary Cruise Ship Plume Dilution Study Skagway, Alaska Alaska Department of Environmental Conservation May 5, 2009 FINAL
Transcript of Assessment of the Ship Plume Dilution Study - … · Stationary Cruise Ship Plume Dilution Study...

Assessment of the
Stationary Cruise Ship Plume Dilution Study
Skagway, Alaska
Alaska Department of Environmental Conservation
May 5, 2009
FINAL

This page was intentionally left blank.

i
Table of Contents
Executive Summary ............................................................................iv Introduction ....................................................................................... 1
Regulatory Background ........................................................................................ 1 Scientific Studies .................................................................................................. 2
Methods ............................................................................................. 6
Criteria for selecting the ships that were tested .................................................. 6 Pre‐Sampling Activities ........................................................................................ 6 Dye Injection Methodology .................................................................................. 6 Plume Monitoring Methodology .......................................................................... 7 Current and Weather Measurements ................................................................ 10
DEC methods .................................................................................................. 11
Results ................................................................................................................ 11
General ........................................................................................................... 11 Star Princess ................................................................................................... 11 Coral Princess ................................................................................................. 12 Ryndam .......................................................................................................... 12 Millennium ..................................................................................................... 16 Norwegian Star .............................................................................................. 19 Volendam ....................................................................................................... 22
Discussion ........................................................................................ 25
Applying Dilution Factors ................................................................................... 25 Modeling ............................................................................................................ 28
Conclusions ...................................................................................... 31 Acknowledgements .......................................................................... 32 References ....................................................................................... 32

ii
Table of Tables Table 1. Target Concentrations and Actual Measured Concentration .................... 7 Table 2. Maximum Measured Concentrations of Ammonia, Copper, Nickel, and
Zinc at the Point of Discharge ...................................................................... 25 Table 3. Concentrations of Pollutants Expected after Initial Dilution (2.5 Meters
from Discharge Port) .................................................................................... 26 Table 4. Concentrations of Pollutants Expected for the Range between 5 and 15
Meters ......................................................................................................... 27 Table 5. Maximum Pollutant Concentration based upon the Highest and Lowest
Dilution Factors found at 15 Meters ............................................................ 27 Table 6. Maximum Pollutant Concentration Expected in Receiving Water at 2.5
Meters and 15 Meters when Ships Comply with the Interim Effluent Limits found in the Cruise Ship Permit ................................................................... 28
Table 7. Compare Averaged Measured Dilution Factors to 2008 Computer Models for 5 to 15 meter Zone ................................................................................. 29
Table 8. Modeled Distances to Reach Dilutions that Achieve Water Quality Standards ..................................................................................................... 30
Table 9. ANOVA Results for Ammonia Average .................................................... 30

iii
Table of Figures Figure 1. EPA Ocean Survey Vessel Bold used as the Platform to Conduct the
Dilution study ................................................................................................. 4 Figure 2. Skagway Harbor Showing Cruise Ship Sampling Sites .............................. 5 Figure 3. Sea‐Bird SBE‐19 CTD Sensor with Integrated SCUFA® Fluorometer ......... 8 Figure 4. Rigid Inflatable Boat Operations .............................................................. 9 Figure 5. Sampling Transect Pattern Used to Locate Dye Plumes ......................... 10 Figure 6. Plume Distributions Near the Ryndam at 3 Meters Depth ..................... 14 Figure 7. Plume Maximum Dye Concentration vs. Distance from the Discharge
Port at 3 Meters Depth ................................................................................ 15 Figure 8. Plume Distribution Near the Millennium at 5 Meters Depth ................. 17 Figure 9. Plume Maximum Dye Concentration vs. Distance from the Discharge
Port for the Millennium ............................................................................... 18 Figure 10. Plumes Detected Near the Norwegian Star at Multiple Depths ........... 19 Figure 11. Plume Maximum Dye Concentration vs. Distance for the Norwegian
Star at 3 Meters Depth ................................................................................ 20 Figure 12. Plume Distributions near the Norwegian Star between 3‐4 meters
Depth ........................................................................................................... 21 Figure 13. Plume Distributions near the Volendam at 5 Meters Depth ................ 23 Figure 14. Plume Maximum Dye Concentration vs. Distance near the Volendam at
5 Meters Depth ............................................................................................ 24

iv
Executive Summary
This report describes a plume dilution study conducted as a partnership between the Alaska Department of Environmental Conservation (DEC) and the U.S. Environmental Protection Agency (EPA). The study was conducted by EPA’s Ocean Survey Vessel Bold in July 2008. It was designed to characterize the near‐field dilution (0 – 15 meters) that occurs to wastewater that is discharged from a stationary cruise ship.
The dilution factors in this study were calculated by taking the known concentration of a dye in the wastewater before discharge and dividing it by the concentration of the dye measured in the receiving water. For example, if a value of 100 concentration units was determined in the wastewater and a concentration of 5 was measured in the receiving water, the dilution factor would be 1/20 (e.g. 100/20 = 5).
The law under which the Large Commercial Passenger Vessel Wastewater Discharge General Permit was issued requires cruise ships to meet Alaska water quality standards at the point of discharge. The wastewater treatment systems currently installed onboard the vessels work well at removing most of the pollutants listed in the permit. However, only one of the vessels that visited Alaska in 2008 could consistently meet the water quality standards for ammonia, copper, nickel, and zinc at the point of discharge. To assess the significance of the dilution factors measured for the ships in this study, DEC divided the levels of pollutants in the wastewater effluent by the dilution factors to estimate where water quality standards could be met in the receiving water.
DEC divided the maximum reported concentrations for ammonia, copper, nickel, and zinc effluent levels from all ships that discharged in Alaska during the 2008 season by the highest dilution factor (i.e. best case; most dilution) of 1/63 found at 15 meters. In this case, water quality standards would be met in the receiving water for ammonia, copper, nickel, and zinc. When you take the most conservative approach of dividing the maximum concentration of pollutants by the lowest dilution factor of 1/28 (i.e. worst case; least dilution), nickel and zinc
v
concentrations would meet water quality standards in the receiving water. The concentrations of ammonia and copper would exceed water quality standards at 15 meters.
DEC also evaluated the dilution factors relative to current interim limits in the Large Commercial Passenger Vessel Wastewater Discharge General Permit. When the interim permit limits for ammonia, copper, nickel, and zinc concentrations in the current cruise ship permit were divided by the worst case dilution factor, the concentration of ammonia, copper, and nickel will exceed water quality standards at 2.5 meters. The concentration of zinc will meet water quality standards.
DEC then followed this same procedure for the interim permit limits using the worst case dilution at 15 meters from the ship. When the wastewater discharges from the four ships in this study comply with the interim permit limits, the concentration of all four pollutants will meet the water quality standards 15 meters (49 feet) from the discharge port.
DEC also compared the near field dilution factors predicted by the PLUMES and CORMIX computer dilution models to the observed dilution. The measured maximum dye concentrations were in fair agreement with the modeled values in the 5 – 15 meter range. The modeled values are conservative and predict higher maximum plume concentrations than field observations. Therefore, the models are more protective of the environment. However, the PLUMES and CORMIX models diverged greatly when attempting to predict dilution factors beyond 15 meters and may not be appropriate for determining far‐field dilutions.

1
Introduction
Regulatory Background
The Alaska Department of Environmental Conservation (DEC) has been protecting the waters of Alaska through the Commercial Passenger Vessel Environmental Compliance Program (a.k.a. Cruise Ship Program) since 2001. DEC provides detailed information about the Cruise Ship Program at the following web page:
http://www.dec.state.ak.us/water/cruise_ships/index.htm
Since 2001, the cruise ship industry has worked to reduce the concentration of pollutants through major upgrades to advanced treatment systems installed onboard the vessels. There have been reductions in the levels of fecal coliform bacteria, biological oxygen demand (BOD), total suspended solids (TSS), pH (a measure of acidity) and chlorine.
In 2006, voters approved a citizen initiative requiring a permit for cruise ships to discharge in Alaska waters.1 The law also required DEC to set the effluent standards equal to the Alaska water quality standards at the point of discharge. Alaska water quality standards (18 AAC 70) are designed to protect the integrity of the waterbody and to protect aquatic life. They are not typically applied as an effluent limit at the point of discharge.
Cruise ships, however, must meet the water quality standards at the point of discharge. DEC initially issued the Commercial Passenger Vessel Wastewater Discharge General Permit No. 2007DB0002 (from this point forward referred to as the “cruise ship permit”) in March 2008 and re‐issued the permit with some technical corrections on May 1, 2008.2 Current ship‐board wastewater treatment systems work well at removing most of the pollutants listed in the permit.
1 See Ballot Measure 2, 2006 at http://www.dec.state.ak.us/water/cruise_ships/Law_and_Regs/Ballot%20Measure%202%20Cruise%20Ship%20Initiative.pdf 2 The permit may be found on the following website: http://www.dec.state.ak.us/water/cruise_ships/gp/2008GP_Mod_CPVEC.pdf

2
However, DEC expected cruise ships to have difficulty meeting the water quality standards at the point of discharge for ammonia, copper, nickel, and zinc. Therefore, DEC set more lenient – interim effluent limits – for these pollutants during the 2008 and 2009 cruise ship seasons.
Only one of the vessels that visited Alaska in 2008 could consistently meet the water quality standards for ammonia and selected metals at the point of discharge.3
This report will focus on these parameters when assessing compliance with water quality standards in the receiving water.
Scientific Studies
The dilution factors discussed in this study were calculated by taking the known concentration of a dye in the pipe before discharge and dividing it by the concentration of the dye measured in the receiving water. For example, if a value of 100 concentration units was determined in the pipe and a concentration of 5 was measured in the receiving water, the dilution factor would be 1/20 (e.g. 100/20 = 5).
As a part of the Cruise Ship Program, DEC has completed and participated in studies that have provided information on the impacts cruise ship discharges have on water quality. In 2001, DEC participated in a study of the dilution of wastewater discharge plumes from large moving cruise ships (Cruise Ship Wastewater Science Advisory Panel, 2002). The Science Advisory Panel concluded very high dilution factors of 1/50,000 would conservatively be achieved behind a moving vessel (i.e. 6 knots and discharge rate of 200 cubic meters/hour).
In 2004, DEC used computer models to estimate the concentration and distribution of cruise ship wastewater discharges at three Alaska harbors; Juneau,
3 The Carnival Spirit met the long term effluent limits. However, the ship only discharged a limited quantity and selected streams of accommodation graywater through their wastewater treatment system. The ship held the majority of its wastewater for discharge outside of Alaska.

3
Ketchikan, and Skagway (DEC, 2004). The input conditions to the models in that study assumed the ships were stationary, and normal tidal and hydrographic conditions existed. Individual characteristics such as discharge pipe diameter, flow rates, and temperature of the discharge were based upon data found in the Vessel Specific Sampling Plans provided by the ship. DEC used the EPA approved computer modeling packages PLUMES and CORMIX to estimate dilutions from each individual ship. Concentrating only on the modeling reported for the conservative conditions in Skagway harbor, the dilution factors achieved in the first 2 meters ranged from 1/10 to 1/20. At a distance of 5 meters the predicted dilution factors were between 1/24 and 1/60.
In July 2008, DEC worked in partnership with the United States Environmental Protection Agency (EPA) on a study in Skagway harbor to directly measure the dilution of waste water discharge plumes from stationary cruise ships (i.e. at dock). The study was performed by DEC and EPA personnel and supported by the crew of the EPA Ocean Survey Vessel (OSV) Bold. (See Figure 1.)

4
Figure 1. EPA Ocean Survey Vessel Bold used as the Platform to Conduct the Dilution study
The 2008 study collected field data to calculate wastewater dilution discharged under worst case conditions ‐‐ from a stationary cruise ship into a confined receiving environment with limited flushing. A ship moored in Skagway Harbor represents a worst case situation for dilution.
Previous DEC computer modeling estimated stationary dilution factors between 1/24 and 1/60 occurred at just 5 meters. Therefore, the study was designed as a near field dilution study. Measurements were taken in the receiving water at intervals between the hull of the vessel up to 15 meters away (15 meters = 49 feet; 1 meter = 3.28 feet).
Discharges from six cruise ships were tested between July 7, 2008 and July 17, 2008. Discharges from two of the ships were sampled twice so a total of eight surveys were completed. The purpose of this study was to measure the real world dilution factors in marine waters to assess whether Alaska water quality

5
standards are currently being met, and to compare these actual dilutions to computer model predictions.
Figure 2 provides a detailed map of the study area in Skagway harbor. It depicts the three areas where large cruise ships dock, the Ore Terminal, Broadway, and Railroad docks. The locations of the Alaska Marine Highway System Ferry dock and the City of Skagway domestic waste water outfall are also shown.
Figure 2. Skagway Harbor Showing Cruise Ship Sampling Sites

6
Methods
Criteria for selecting the ships that were tested
DEC acknowledges the tremendous cooperation and support this project received from the officers and crew members on the vessels sampled during this work. Voluntary participation was a main criteria for study selection. Also, DEC sampled ships from the 2004 study when possible for purpose of comparison. Four of the six ships sampled had been included in the previous study. DEC also attempted to select ships with a variety of wastewater treatment systems. The ships were not selected randomly.
The following sections provide a summary of the methods used to introduce dye into the individual cruise ship wastewater streams and then to trace the resultant dye plumes in the receiving water. This summary of the methods used is based on the US EPA report entitled “Sampling Episode Report Cruise Ship Plume Dilution Study, Skagway, Alaska ”, February 25, 2009. The raw data from the plume dilution study is available in that report and its appendices.
Pre‐Sampling Activities
Visits to each of the six ships were conducted during the week prior to the start of the sampling episode to establish ship contacts, communications, and safety and emergency procedures, and to inspect sampling ports and associated fittings.
Dye Injection Methodology
A variable speed peristaltic pump was used to inject the fluorescent dye, Rhodamine WT, into the waste discharge stream at a point downstream of the wastewater treatment system. The flow in the pipe was monitored using an ultrasonic flow meter. The in‐situ concentration of dye was calculated from the known input concentration, the discharge flow rate, and injection rate. In addition, the dye concentration was measured directly downstream using a calibrated fluorometer. This instrument was used successfully in three of the four surveys where plume distributions were mapped outside the ships. Usable data was not obtained in the other cases due to instrument failures.

7
Table 1. Target Concentrations and Actual Measured Concentration
Vessel Target Concentration
µg/L Used by DEC
µg/L Star Princess 420 420
Coral Princess 1050 1050
Ryndam 754 700
Millennium 663 573 ± 218
Norwegian Star 893 606 ± 140
Volendam 918 787 ± 100 DEC used the measured concentration, when it was available, to calculate the dilution factors. Table 1 lists the dye concentration DEC used as the maximum in‐pipe concentration for each ship surveyed. The value used for the Star Princess, Coral Princess, and Ryndam was based on the calculated target concentration. For the Millennium, Norwegian Star and Volendam the maximum input was based on the mean value measured by the fluorometer and the standard deviation.
Plume Monitoring Methodology
A Sea‐Bird Profiler, model SBE‐19 CTD was used to characterize the ambient hydrographic conditions (conductivity, temperature, and depth). In addition, this instrument package, which is pictured in Figure 3, was outfitted with a fluorometer and turbidimeter to measure the dye concentrations and possible interferences. Conductivity is important because salinity (the amount of dissolved salts in the seawater) is calculated from it. The models use salinity and temperature to calculate sea water density and predict plume behavior. All parameters were measured two times per second and transmitted by cable to a laptop computer. The sensors and seawater intake hoses are located at the bottom of the instrument. In the case of the vessel Star Princess, this design prevented characterization of the surface plumes.

8
Figure 3. Sea‐Bird SBE‐19 CTD Sensor with Integrated SCUFA® Fluorometer
The CTD was deployed from the bow of a rigid inflatable boat (RIB). (See Figure 4.) At times the CTD was lowered and raised from a stationary RIB to provide a profile of the water column. In order to track the plume concentration distributions a series of arc transects were performed. To accomplish these, a hull magnet was attached above the discharge port to anchor an adjustable tether. The RIB then traversed a semicircular path at the nominal distances of 2.5, 5, 7.5, 10 and 15 meters maintained by the tether. This pattern was repeated with the CTD held at the nominal depths of 1.5, 3, 5 and 7.5 meters.

9
Figure 4. Rigid Inflatable Boat Operations

10
Figure 5. Sampling Transect Pattern Used to Locate Dye Plumes
Radial transects were used to enhance the definition of the plume distribution as shown in Figure 5. The RIB was directed either toward or away from the discharge port along a straight course at constant depth where the plumes were expected to have the least dilution and therefore the greatest concentration of dye (i.e. in the center of the plumes).
Current and Weather Measurements
Major currents near the discharge port were recorded by current meters during the plume surveys. They were deployed at 1, 3, and sometimes 5 meters.
Weather conditions during the surveys were recorded aboard the OSV Bold.

11
DEC methods
The fluorometers used to quantify the concentration of Rhodamine WT dye in the discharge and in the open waters adjacent to the vessels hulls were calibrated using a series of known dye concentrations. For the two fluorometers integrated in the CTD instrument packages, the dilutions were prepared in a 40 gallon plastic container. The entire CTD was then immersed in the dye solution. All calibrations produced curves with very low variability.
Raw data from the transects were first converted to dye concentrations in micrograms / Liter (µg/L) using the calibration curves described above. The position of the instruments was estimated for each arc and linear transect by apportioning the angle to the ship based on the total time of the transect (assuming RIB speed was relatively constant). These positions were then converted from polar to rectangular coordinates and dye distributions were plotted for a given depth using commercially available software, Surfer8. Because the CTD/fluorometer instrument package was recording data for conductivity, depth, temperature and dye concentration twice per second, the plume definition sampling appears to have been adequate. The resulting plots are a time average (i.e. think time lapse photography), not a snapshot of where the plumes were found, since the individual plumes were moving at speeds of about 10cm/sec and the entire process of mapping the area next to the ships out to a distance of 15 meters took up to 30 minutes.
Results
General
Initial attempts to characterize dye plumes from cruise ships were made on July 7, 2008 on the Millennium and July 9, 2008 on the Norwegian Star. No usable plume data was obtained in either attempt.
Star Princess
After modifying procedures by increasing the input dye concentrations, dye plumes were detected during the sampling of the Star Princess on July 10, 2008.

12
The plumes were observed at the surface moving away from the discharge port at an angle of 225° and directly along the ship’s hull at about 270°.
When the CTD is at the surface, samples are taken at about 0.8 meters. This prevented plume dilution sampling above 0.8 meters. A maximum plume value of 48 µg/L was detected at 1.3 meters depth at a distance of 10 meters from the discharge port. It is possible higher concentrations were present nearer to the surface. No arc transects were completed for this sampling, therefore there are no plume distribution plots.
Coral Princess
For most of the sampling effort during the July 11, 2008 survey of the Coral Princess, the discharge was extremely intermittent. Near the end of the sampling period, the Rhodamine WT dye concentration was increased to approximately 1,050 µg/L and substantial plumes were detected at a depth of about 3.6 meters and a distance of 5 meters from the ship. Concentrations >158 µg/L were measured at angles of 180°, 220°, and from 235° to 240°. Intermittent discharge prevented continuous sampling and the limited volume of concentrated dye solution was completely injected into the discharge pipe before the arc transects were completed, therefore there are no plume distribution plots.
Ryndam
The vessel Ryndam was sampled on July 12, 2008. Figure 6 provides a time‐averaged map of the plume concentrations. The nominal depth for this plot is 3 meters. Extensive transects were also performed at depths of 1.5, 2.5, and 4.5 meters without detecting plumes. Using an arbitrary convention for compass rose direction, zero is looking directly at the discharge port and the angle increases clockwise such that 90 is to the stern, 180 directly away from the ship and 270 to the bow. (See Figure 5.) The plume is primarily distributed along an angle of 135° from the hull. The semi‐circular arcs shown on the plot give the position of the CTD instrument at the half‐second interval sampling frequency. While the plot is not an instantaneous snapshot of the plume locations, it does represent a useful tool to compare the plume density between the different sampling events.

13
In this plot the ship is on the left axis with the direction toward the stern at the top and direction toward the bow and Northeast is to the bottom. The plume distribution is very different from the smooth and continuously varying results both computer models predict. The empirical data show plumes beyond 5 meters from the ship are defined by roughly circular zones of high dye concentration that appear to be advected away from the ship. There is very good agreement between the 135° angle of the plume train and the direction of the 4 cm/sec tidal current that was measured at 3 meters depth.

14
Figure 6. Plume Distributions Near the Ryndam at 3 Meters Depth
0 5 10 15-10
-5
0
5
10
15
5
10
20
30
40
50
60
70
80
90
100
110
120
130
µg/LDye
Ryndam - July 12, 2008 Depth = 3 meters
Meters from Hull
Metersfrom
Discharge
Port

15
Figure 7 is a plot of the comparison between the measured value for the plume maximum concentration and the values predicted by the CORMIX and PLUMES computer models. The modeling was evaluated at 5, 10, and 15 meters from the discharge port. The average modeled dilution factor 5 to 15 meters from the discharge port is about 1/30. If the measured value at 7.5 meters is included, the actual dilution factor is found to be 1/50. In this case, the models are predicting less dilution than was actually observed. In Figure 7, the error bars are plotted for the measured values based on the variation of the input dye concentration that resulted from the variation in waste water flow. The R2 value is an indicator of how well the measured values fit the linear trend line. The value of 1 means the data lie directly on the trend line. At 15 meters the dilution is estimated at 1/63.
Figure 7. Plume Maximum Dye Concentration vs. Distance from the Discharge Port at 3 Meters Depth
R² = 0.1499
0
5
10
15
20
25
30
0 5 10 15 20
CORMIX
PLUMES
Measured
Poly. (CORMIX)
Linear (PLUMES)
Linear (Measured)
Ryndam plume max vs distance
Meters from port
ug/L
16
Millennium
The vessel Millennium was sampled on July 15, 2008 and the results of the plume distribution survey are plotted in Figure 8. In this case the plume was located primarily at 5 meters depth and although the orientation of the ship and structure of the plumes were similar to those seen in the Ryndam survey, the direction the plumes were moving was completely reversed, near 270°. In the case of the Millennium sampling, the tide was flowing in and during the Ryndam sampling it was ebbing. Unfortunately the nearest current meter data we have from the Millennium survey is at 3 meters depth and the results do not correlate well with the observed plume movements.
The maximum plume concentrations observed during the Millennium survey appeared to be higher than the Ryndam values. In addition to the 5 meter depth transects plotted in Figure 8, extensive transects were also completed for depths of 1.5, 3, and 7.5 meters, however, no major plumes were detected.

17
Figure 8. Plume Distribution Near the Millennium at 5 Meters Depth
0 5 10 15-15
-10
-5
0
5
10
5
10
20
30
40
50
60
70
80
90
100
110
120
130
µg/LDye
Millennium - July 15, 2008 Depth = 5 meters
Meters from Hull
Metersfrom
Discharge
Port

18
Figure 9 details the maximum concentration measured for the Millennium. The average dilution factor for the measured maximum was 1/39 for the 5 to 15 meter range. The PLUMES model generated an average dilution factor of 1/20. The CORMIX model generated an average dilution factor of 1/12. The modeled values again predicted less dilution than was observed, but the agreement between the models show considerable divergence. The large estimated error for the observed values is based upon the measured variation in the input dye concentration. At 15 meters the measured dilution is 1/40.
Figure 9. Plume Maximum Dye Concentration vs. Distance from the Discharge Port for the Millennium
R² = 0.2801
0
10
20
30
40
50
60
70
0 5 10 15 20
CORMIX
PLUMES
Measured
Linear (CORMIX)
Poly. (PLUMES)
Linear (Measured)
Millennium Plume Max vs Distance
Meters from Discharge Port
ug/L

19
Norwegian Star
Significant plumes were found over a wider range of depths when the Norwegian Star was surveyed on July 16, 2008. Plumes were detected at 3, 4 and 5 meter depths. No plumes were found at 1.5, 2.5 and 7.5 meters. Figure 10 provides a visualization of the plumes at two levels, approximately 3.5 and 5 meters. In this plot the upper left corner would point forward toward the bow and the Northeast. The ship would still be on the left of the plot. The plumes in both the upper and lower zones appear to be advecting along an angle of 135° where 90° is at the top left corner. One apparent difference between the two plots is that one plume was mapped at the 3.5 meter level but not seen at the 5 meter depth. The other plumes at 3.5 meters were all seen at 5 meters.
Figure 10. Plumes Detected Near the Norwegian Star at Multiple Depths
5101520253035404550556065707580859095100
Norwegian Star - July 16, 2008Upper Plot depth = 3 to 4 meters Lower Plot depth = 5 meters
ug/LDye
Meters from Discharge Port
Meters
from H
ull

20
Figure 11 details the maximum concentration observed for the Norwegian Star. The average dilution factor observed 5 to 15 meters from the discharge port was 1/22. The PLUMES model average was 1/19 and CORMIX predicted 1/12. The PLUMES model, while still conservative, did appear to provide a closer approximation to the observed plume maximums. At 15 meters the dilution is estimated to be 1/28.
Figure 11. Plume Maximum Dye Concentration vs. Distance for the Norwegian Star at 3 Meters Depth
In Figure 12 the upper level from Figure 10 is shown in greater detail. While not in perfect alignment with the plume’s directions, currents with a speed of 10 cm/sec were recorded at 3 meters depth and likely contributed to the measured plume distributions.
R² = 0.7236
0
10
20
30
40
50
60
70
0 5 10 15 20
CORMIX
PLUMES
Measured
Poly. (CORMIX)
Linear (PLUMES)
Power (Measured)
Norwegian Star Plume Max vs Distance
Meters from Discharge Port
ug/L

21
Figure 12. Plume Distributions near the Norwegian Star between 3‐4 meters Depth
0 5 10 15-15
-10
-5
0
5
10
15
5
10
20
30
40
50
60
70
80
90
100
110
120
130
µg/LDye
Meters from Hull
Metersfrom
Discharge
Port
Norwegian Star - July 16, 2008 From 3 to 4 meters in depth

22
Volendam
In Figure 13, the stern of the vessel Volendam lies in the direction of the top of the page and bow and Northeast are toward the bottom. The majority of the plumes were detected at 5 meters depth and appear to be advected away at an angle of 225°, which is consistent with the direction of the incoming tide. The dominant 10 cm/sec current recorded for this depth is in fair agreement with the plume direction, but is about 15° from overlaying it directly. The maximum dye concentrations and general patterns of plume distributions appear consistent with conditions found in the other surveys.

23
Figure 13. Plume Distributions near the Volendam at 5 Meters Depth
0 5 10 15-15
-10
-5
0
5
10
15
5
10
20
30
40
50
60
70
80
90
100
110
120
130
Volendam - July 17, 2008 Depth = 5 meters
µg/LDye
Meters from Hull
Metersfrom
Discharge Port

24
The average measured plume dilution factor for the measurements between 5 and 15 meters from the ship was 1/48. In contrast to the other surveys, the PLUMES model generally predicted greater dilution factors with associated lower plume maximum values than were measured. The average dilution factor for the PLUMES model was 1/59. This value is nearly identical to the value calculated in 2004 for the Volendam for a distance of 5 meters. Compared to the measured maximum plume concentrations the PLUMES model overestimates the dilution seen near the Volendam. The CORMIX model did predict a mean dilution factor of 1/44 that was closer to the observed value of 1/48. In Figure 14, the maximum value for the CORMIX calculated plume actually overlays the observed value at 5 meters. At 15 meters the measured dilution is 1/44.
Figure 14. Plume Maximum Dye Concentration vs. Distance near the Volendam at 5 Meters Depth
R² = 0.0246
0
5
10
15
20
25
30
0 5 10 15 20
CORMIX
PLUMES
Measured
Poly. (CORMIX)
Linear (PLUMES)
Linear (Measured)
Volendam Plume Max vs Distance
Meters from Discharge Port
ug/L

25
Discussion
Applying Dilution Factors
In order to assess the significance of the dilution factors measured for each of the six cruise ships in this study, we will focus attention on the cruise ship permit requirement that discharges must meet the Alaska water quality standards at the point of discharge. The data for the 2008 cruise season show that most ships cannot consistently meet this standard for ammonia, copper, nickel and zinc.
Table 2 lists the maximum value for each of the four parameters of concern measured at the point of discharge in cruise ship effluent during 2008. The generic worst case entry indicates the maximum value detected by any large cruise ship that discharged into Alaska waters during 2008. Of the six ships in the plume dilution survey, only the Millennium would meet the water quality standards for copper and zinc4. During 2008, only one large cruise ship out of the 23 that reported data to DEC for 2008 met the water quality standards for all the parameters listed above. That vessel only discharged selected streams of accommodation graywater.
Table 2. Maximum Measured Concentrations of Ammonia, Copper, Nickel, and Zinc at the Point of Discharge
AK Water Quality Standard Ammonia (mg/L)
Cu (µg/L)
Ni (µg/L)
Zn (µg/L)
Salt water 2.9 3.1 8.2 81 Vessel
Millennium 4.6 2.3 15.8 65 Ryndam 6.2 26.6 19 110 Volendam 46 16.7 14.8 95.5 Norwegian Star 43 6 14 160 Star Princess 65 140 21 410 Coral Princess 100 88.1 17.5 208 Generic worst case 150 140 43 501 Orange = exceedance
4 There was only one sample taken of the Millennium. It only discharged to participate in the study. The other vessels regularly discharged in Alaska and had a larger sample set.

26
As effluent leaves the discharge port, it begins an initial dilution characterized by rapid and turbulent entrainment and a vertical rise, usually of a few meters. The dilutions in the near field zone which extends out to about 2.5 meters were measured during this study and ranged from about 1/4 to 1/12. The results of dividing these measured near field dilution factors into the pollutant concentrations from Table 2 are listed in Table 3. The highlighted values represent calculated concentrations over the water quality standards even after initial mixing. When dividing the maximum pollutant concentrations (e.g. Generic worst case) by worst case dilution (1/4), the concentration of all four pollutants exceed water quality standards at 2.5 meters.
Table 3. Concentrations of Pollutants Expected after Initial Dilution (2.5 Meters from Discharge Port)
AK Water Quality Standard Ammonia (mg/L)
Cu (ug/L)
Ni (ug/L)
Zn (ug/L)
Salt water 2.9 3.1 8.2 81 Vessel Factor Millennium 1/12 0.4 0.2 1.3 5.4 Ryndam 1/4 1.6 7 4.8 28 Volendam 1/6 7.7 2.8 2.5 16 Norwegian Star 1/4 11 1.5 3.5 40 Star Princess 1/9 7.2 16 2.3 46 Coral Princess 1/7 14 13 2.5 30 Generic worst case 1/4 37.5 35 11 125 Orange = exceedance
In the case of all four vessels where the plume distributions were mapped in detail between 5 and 15 meters, using the actual maximum reported ammonia, copper, nickel, and zinc concentrations from the 2008 season, the discharge from these ships would have met the water quality standards. The measured dilutions in that range were adequate to reduce the concentrations of pollutants below the criteria. The generic worst case would still exceed the water quality standards for ammonia and copper. (See Table 4.) The Star Princess and Coral Princess are not listed in Table 4 because no plume distributions were mapped due to inadequate initial dye concentration or to intermittent wastewater discharges.

27
Table 4. Concentrations of Pollutants Expected for the Range between 5 and 15 Meters
AK Water Quality Standard Ammonia(mg/L)
Cu (ug/L)
Ni (ug/L)
Zn (ug/L)
Salt water 2.9 3.1 8.2 81 Vessel FactorMillennium 1/39 0.1 0.1 0.4 1.7 Ryndam 1/50 0.1 0.5 0.4 2.2 Volendam 1/48 1.0 0.3 0.3 2.0 Norwegian Star 1/22 2.0 0.3 0.6 7.3 Generic worst case 1/22 6.8 6.4 2.0 23 Orange = exceedance
Table 5 compares calculated pollutant concentration to Alaska water quality standards at 15 meters from the hull. Both of the dilution factors used are estimates obtained from extrapolating measured plume concentrations.
If you divide the maximum measured pollutant concentration observed for 2008 (e.g. Generic worst case) by the lowest dilution factor (1/28), the concentrations of ammonia and copper exceed the water quality standards at 15 meters.
If you divide the maximum measured pollutant concentration observed for all ships during 2008 (e.g. Generic worst case) by the highest dilution factor (1/63) found at 15 meters, all four pollutants meet the water quality standards. (See Table 5.)
Table 5. Maximum Pollutant Concentration based upon the Highest and Lowest Dilution Factors found at 15 Meters
Parameter Ammonia(mg/L)
Cu (µg/L)
Ni (µg/L)
Zn (µg/L)
Alaska Water Quality Standard 2.9 3.1 8.2 81
2008 Generic Worst Case 150 140 43 501 Highest Dilution Factor 63 2.4 2.2 0.7 8.0 Lowest Dilution Factor 28 5.4 5.0 1.5 18 Orange = exceedance
When the interim permit limits for ammonia, copper, nickel, and zinc concentrations in the current cruise ship permit were divided by the worst case

28
dilution factor, the concentration of ammonia, copper, and nickel will exceed water quality standards at 2.5 meters. The concentration of zinc will meet water quality standards. All four ships would be in compliance with the water quality standards for all four pollutants 15 meters from the ship. (See Table 6.)
Table 6. Maximum Pollutant Concentration Expected in Receiving Water at 2.5 Meters and 15 Meters when Ships Comply with the Interim Effluent Limits found in the Cruise Ship Permit
Parameter Ammonia(mg/L)
Cu (µg/L)
Ni (µg/L)
Zn (µg/L)
Alaska Water Quality Standard 2.9 3.1 8.2 81
Interim Water quality standards 80.4 66 180 230 Worst Dilution factor at 2.5 meters 4 20 17 45 58 Worst Dilution Factor at 15 meters 28 2.9 2.4 6.4 8.2
Modeling
Another goal of this study was to compare the accuracy of computer models with field data.
The modeling in this study predicted considerably higher plume concentrations (i.e. less dilution) than those produced in the DEC 2004 computer modeling study. This is probably due to more input parameters (e.g. flow rate, pipe diameter, depth of port below water, etc.) in this study being measured versus being estimated. The computer models are sensitive and relatively small differences in the input parameters have a significant impact on the model results.
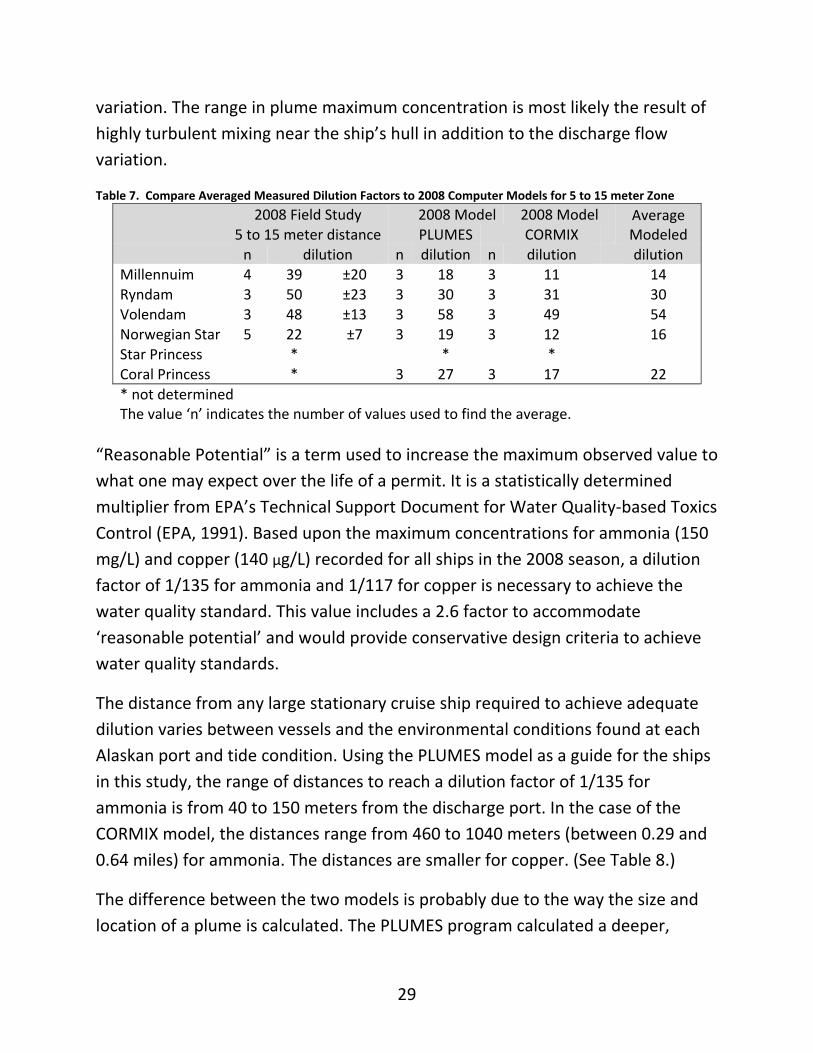
Table 7 summarizes the information plotted in Figures 7, 9, 11, and 14. Those figures compared the mean measured dilution to modeled values for the range 5 to 15 meters from the discharge port. The average dilution predicted by combining both model outputs would predict a maximum concentration higher than the measured concentration in almost all comparable cases. Therefore, the models are conservative – predicting less dilution than was actually observed ‐ and are more protective of the environment.
The one standard deviation error reported for the observed values was computed based on the measured plume concentrations. For each ship, this value is larger than that calculated based on the changing dye concentration caused by pipe flow
29
variation. The range in plume maximum concentration is most likely the result of highly turbulent mixing near the ship’s hull in addition to the discharge flow variation.
Table 7. Compare Averaged Measured Dilution Factors to 2008 Computer Models for 5 to 15 meter Zone
2008 Field Study 2008 Model 2008 Model Average Modeled 5 to 15 meter distance PLUMES CORMIX
n dilution n dilution n dilution dilution Millennuim 4 39 ±20 3 18 3 11 14 Ryndam 3 50 ±23 3 30 3 31 30 Volendam 3 48 ±13 3 58 3 49 54 Norwegian Star 5 22 ±7 3 19 3 12 16 Star Princess * * * Coral Princess * 3 27 3 17 22 * not determined The value ‘n’ indicates the number of values used to find the average.
“Reasonable Potential” is a term used to increase the maximum observed value to what one may expect over the life of a permit. It is a statistically determined multiplier from EPA’s Technical Support Document for Water Quality‐based Toxics Control (EPA, 1991). Based upon the maximum concentrations for ammonia (150 mg/L) and copper (140 µg/L) recorded for all ships in the 2008 season, a dilution factor of 1/135 for ammonia and 1/117 for copper is necessary to achieve the water quality standard. This value includes a 2.6 factor to accommodate ‘reasonable potential’ and would provide conservative design criteria to achieve water quality standards.
The distance from any large stationary cruise ship required to achieve adequate dilution varies between vessels and the environmental conditions found at each Alaskan port and tide condition. Using the PLUMES model as a guide for the ships in this study, the range of distances to reach a dilution factor of 1/135 for ammonia is from 40 to 150 meters from the discharge port. In the case of the CORMIX model, the distances range from 460 to 1040 meters (between 0.29 and 0.64 miles) for ammonia. The distances are smaller for copper. (See Table 8.)
The difference between the two models is probably due to the way the size and location of a plume is calculated. The PLUMES program calculated a deeper,

30
narrower plume. The CORMIX plume flattened out due to “trapping” in a stratified water column (i.e. one with fresh water above denser saline water, and became thin and wide).
Table 8. Modeled Distances to Reach Dilutions that Achieve Water Quality Standards
Vessel
PLUMES CORMIX Distance (m) to reach
Distance (m) to reach
Distance (m) to reach
Distance (m) to reach
1/135 1/117 1/135 1/117 ammonia copper ammonia copper
Coral Princess 40 26 553 523 Ryndam 57 44 556 510 Millennium 150 132 673 619 Norwegian Star 105 89 1040 958 Volendam 49 42 460 381
Both the CORMIX and the PLUMES models correlate well with measured field data from the discharge point up to 15 meters. However, the results from applying the two computer models to greater distances vary significantly. Therefore, it may not be appropriate to use these two computer models to predict the concentration of the pollutants in the receiving water at distances greater than 15 meters.
A one‐way analysis of variance (ANOVA) was applied to the 2008 monitoring data for ammonia to determine if the averages from the individual cruise ships could be summarized into an overall average. Table 9 lists the results of that calculation.
Table 9. ANOVA Results for Ammonia Average
Sum of Squares df Mean Square F
Between ships 140,782.28 18 7,821.24 22.16 Within each ship 64,237.11 182 352.95 Total 205,019.39 200
The calculated F value of 22.16 greatly exceeds the expected value of 2. This indicates it is not statistically valid to combine the individual ammonia averages of the ships into one pooled mean. Data from each ship must be treated separately when evaluating the dilutions of effluent from stationary vessels.

31
A one‐way analysis of variance was also performed for the 2008 monitoring data for copper and the calculated F value of 13.68 is much greater than expected value. The copper data also cannot be pooled.
It is important to note when the individual input parameters from each vessel were used, including the pipe diameters, port size and shape and the flow characteristics, the measured and modeled plume concentrations were reasonably consistent. In order to use the models effectively to predict the attainment of water quality standards, a number of requirements must be met. Each ship could be modeled individually so the physical characteristics of the discharge systems are included as inputs. The concentration of pollutants in the waste stream would be measured and characterized. In addition, realistic hydrographic inputs should be developed for each harbor where the vessel docks.
While the comparison of actual and modeled plume values determined in this study appear to be in reasonable agreement, it is important to stress the limitation of the models to capture all parameters that may lead to real world variability. The disclaimers for the models routinely state the resulting values have a variability of 50%. It was found during sensitivity testing of both models in this study that the results from CORMIX were much more sensitive to the angle and velocity assigned to the external tidal currents. This information is often not available to the modeler and it is assumed the discharge is perpendicular to the current.
Conclusions
Most vessels that discharged wastewater in Alaska during 2008 cannot consistently meet Alaska water quality standards for ammonia and selected metals at the point of discharge.
The initial dilution which occurs within the first 2.5 meters from ship is insufficient to bring the discharges into compliance for both ammonia and copper in 5 of the 6 ships that were studied. (See Table 3.)

32
When the interim permit limits for ammonia, copper, nickel, and zinc concentrations in the current cruise ship permit were divided by the worst case dilution factor, the concentration of ammonia, copper, and nickel will exceed water quality standards at 2.5 meters from the ship. All four ships would be in compliance with the water quality standards for all four pollutants 15 meters from the ship. (See Table 6.)
Between 5 and 15 meters away from the ships after additional dilution has taken place, the maximum measured dye concentrations were in fair agreement with the modeled values predicted by the PLUMES and CORMIX models. The modeled values calculated in this study produced somewhat higher maximum plume concentrations compared to those that were observed. Therefore, the models are more conservative and more protective of the environment. (See Table 7.)
Using the highest reported concentrations from the 2008 season for ammonia and copper as a worst case guide, modeled distances as great as 1040 meters and 958 meters from a discharge (0.64 and 0.59 mile respectively) may be needed to ensure compliance with the water quality standards criteria.
Both the CORMIX and the PLUMES models correlate well with the measured field data for distances up to 15 meters from the discharge point. However, the results from applying the two computer models to greater distances vary significantly. Therefore, it may not be appropriate to use these two computer models to predict the concentration of the pollutants in the receiving water at distances far from the discharge port.
Acknowledgements
DEC wishes to thank the Captain and crew of the OSV Bold for their tireless efforts in support of this project.
References
Alaska Department of Environmental Conservation, (January 26, 2004). Assessment of Cruise Ship and Ferry Wastewater Impacts in Alaska, Commercial Passenger Vessel Environmental Compliance Program.

33
Cruise Ship Wastewater Science Advisory Panel, (November, 2002). The Impact of Cruise Ship Wastewater Discharge on Alaska Waters, Section I.
State of Alaska. (2006) Ballot Measure 2. http://www.dec.state.ak.us/water/cruise_ships/Law_and_Regs/Ballot%20Measure%202%20Cruise%20Ship%20Initiative.pdf
State of Alaska, Department of Environmental Conservation. (2008). Large Commercial Passenger Vessel Wastewater Discharge General Permit No. 2007DB0002. http://www.dec.state.ak.us/water/cruise_ships/gp/2008GP_Mod_CPVEC.pdf
U.S. Environmental Protection Agency, (February 25, 2009). Sampling Episode Report Cruise Ship Plume Dilution Study, Skagway, Alaska.
U.S. Environmental Protection Agency, (March 1991). Technical Support Document For Water Quality‐based Toxics Control, EPA/505/2‐90‐001.