
Assessment of the macroeconomic impact of higher loss absorbency
39
Macroeconomic Assessment Group established by the Financial Stability Board and the Basel Committee on Banking Supervision Report Assessment of the macroeconomic impact of higher loss absorbency for global systemically important banks 10 October 2011
Transcript of Assessment of the macroeconomic impact of higher loss absorbency
Macroeconomic Assessment Group established by the Financial Stability Board and the Basel Committee on Banking Supervision
Report
Assessment of the macroeconomic impact of higher loss absorbency for global systemically important banks 10 October 2011

Copies of publications are available from:
Bank for International Settlements Communications CH-4002 Basel, Switzerland
E-mail: [email protected]
Fax: +41 61 280 9100 and +41 61 280 8100
This publication is available on the BIS website (www.bis.org).
© Bank for International Settlements 2011. All rights reserved. Brief excerpts may be reproduced or translated provided the source is stated.
ISSN 1609-0381 (print) ISBN 92-9131- 889-2 (print)
ISSN 1682 7651 (online) ISBN 92-9197-889-2 (online)
Contents
Executive summary ..................................................................................................................1 1. Introduction .....................................................................................................................3 2. Key elements of the G-SIB framework............................................................................5 3. The MAG and LEI reports ...............................................................................................7 4. Estimating the transitional costs of the G-SIB framework ...............................................8
Summary statistics for the G-SIBs shares’ of lending and total assets...........................9 Benchmark results ........................................................................................................10 International spillovers ..................................................................................................12 Distribution of results across modelling assumptions ...................................................13 The combined overall impact of Basel III and the G-SIBs capital surcharge ................15
5. Estimating the long-term benefits of the G-SIB framework ...........................................16 6. Gone-concern loss absorbency ....................................................................................20 7. Non-modelled effects ....................................................................................................20 8. Conclusion ....................................................................................................................21 Annex 1: Participants in the Macroeconomic Assessment Group..........................................23 Annex 2: Conversion from LEI equity capital ratios to Basel III equity capital ratios..............25 Annex 3: Benefits of higher loss absorbency for G-SIBs .......................................................26 Annex 4: References .............................................................................................................34
Assessment of the Macroeconomic Impact of Higher Loss Absorbency for Global Systemically Important Banks iii

Executive summary
Weaknesses at large financial institutions have often played a central role in the triggering and propagation of systemic financial crises. The 2007–09 financial crisis was only the most recent example. Since the crisis, authorities worldwide have sought ways to strengthen regulation and supervision of these institutions, including through efforts at the international level led by the Financial Stability Board (FSB) and the Basel Committee on Banking Supervision. As part of a package of measures for addressing these risks, the Basel Committee has made proposals for improving the loss absorbency of global systemically important banks (G-SIBs).
In April 2011, the FSB and Basel Committee reconvened the Macroeconomic Assessment Group (MAG) to investigate the macroeconomic costs and benefits of these proposals. The MAG comprises macroeconomic modelling experts from central banks and regulators in 15 countries and a number of international institutions. Close collaboration with the International Monetary Fund (IMF) was an essential part of this process. In its work, the MAG drew on its earlier assessment of the transitional costs of the proposals for strengthened capital and liquidity requirements under Basel III, and on the long-term cost-benefit analysis performed by the Basel Committee’s Long-term Economic Impact (LEI) study.
The costs of the G-SIB proposals stem from the adverse impact on economic activity, especially investment, of banks’ actions to increase interest rate spreads and cut lending in order to build up their capital buffers. The MAG estimated the impact of higher capital requirements on G-SIBs by scaling the impact of raising capital requirements on the banking system as a whole, reported by the MAG in 2010, by the share of G-SIBs in domestic financial systems. While these shares vary across jurisdictions, the share of the top 30 potential G-SIBs (using the Basel Committee’s proposed methodology and end-2009 data) averages about 30% of domestic lending and 38% of financial system assets in the MAG economies.
If we use lending shares as a scaling factor, raising capital requirements on the top 30 potential G-SIBs by 1 percentage point over eight years leads to only a modest slowdown in growth. GDP falls to a level 0.06% below its baseline forecast, followed by a recovery. This represents an additional drag on growth of less than 0.01 percentage points per year during the phase-in period. The primary driver of this macroeconomic impact is an increase of lending spreads of 5–6 basis points. Soon after implementation is complete, growth is forecast to be somewhat faster than trend until GDP returns to its baseline. The aggregate figures conceal significant differences across countries, which reflect differences in the role of G-SIBs in the domestic financial system and in current levels of bank capital buffers. International spillovers are also important, and in some countries are likely to be the dominant source of macroeconomic effects.
The overall results are robust to variations in key assumptions. Using a longer list of banks, scaling by assets rather than lending, shortening the implementation period, or limiting the ability of authorities to offset slower growth with monetary or macroprudential policy were all found to increase the growth impact, but not markedly.
What will be the effect of the full package of the Basel Committee’s proposals for stronger capital requirements – the set of buffers that will be required of all banks under Basel III, combined with the additional buffers to be carried by G-SIBs? The impact of the Basel III proposals, using the end-2009 global capital levels as a starting point, was calculated by the MAG in 2010. On top of this, we assume for illustrative purposes that the top 30 G-SIBs will
Assessment of the Macroeconomic Impact of Higher Loss Absorbency for Global Systemically Important Banks 1
need to raise their capital ratios by an additional 2 percentage points,1 and that both parts of the reform are implemented over eight years. Adding together these two components, we find that the impact is again quite small, with GDP at the point of peak impact forecast to have fallen 0.34% relative to its baseline level. Roughly 0.04 percentage points are subtracted from annual growth during this period, while lending spreads rise by around 31 basis points. As before, different assumptions lead to different effects, with faster implementation or a weaker monetary policy response increasing the impact on GDP.
The benefits of the G-SIB framework relate primarily to the reduction in the exposure of the financial system to systemic crises that can have long-lasting effects on the economy. The LEI estimated the benefits of Basel III by multiplying the degree to which it reduces the annual probability of a systemic crisis, by an estimate of the overall cost of a typical crisis in terms of lost output. Drawing on the LEI’s results, the MAG estimated that raising capital ratios on G-SIBs could produce an annual benefit in the order of 0.5% of GDP, while the Basel III and G-SIB proposals combined contribute an annual benefit of up to 2.5% of GDP – many times the costs of the reforms in terms of temporarily slower annual growth.
As is the case with any economic analysis, producing these estimates required making a number of assumptions. Some of these can be imposed or removed as part of the estimation process. Other aspects are more difficult to analyse. For example, the role of G-SIBs in the financial system, through their status as market leaders or through their dominant positions in certain activities, may be greater than is implied by their share in lending or assets. In this case, the macroeconomic impact of their adjustment to higher capital levels may be greater – although the benefits from strengthening their balance sheets would be greater as well. Conversely, a pullback in activity by G-SIBs may have a relatively mild impact if credit can be provided instead by smaller institutions or capital markets; this would reduce the macroeconomic cost of the stronger G-SIB requirements, but could also reduce the benefit from reducing the risks of distress at a G-SIB.
More analysis is needed to understand these effects fully. It will also be important to engage in further study of the impact of other elements of the FSB’s broader framework for global systemically important financial institutions (of which the Basel Committee’s G-SIB proposals form a part) as they are implemented, such as the proposal that unsecured and uninsured creditors be “bailed in” at the point of resolution. We will only be able to fully understand these effects, and assess the relevant costs and benefits, as more experience is gained.
1 This is a conservative assumption. If the top 30 potential G-SIBs considered here are allocated evenly into the
Basel Committee’s proposed buckets, the average capital surcharge, weighted by total assets as measured at end-2009, is 1.6%.
2 Assessment of the Macroeconomic Impact of Higher Loss Absorbency for Global Systemically Important Banks
1. Introduction
Efforts to address the risks associated with the activities of global systemically important financial institutions (G-SIFIs) have been a central aspect of the global policy response to the financial crisis of 2007–09. The Financial Stability Board (FSB) and the Basel Committee on Banking Supervision (BCBS) have developed a set of recommendations and proposals that are aimed at improving the loss absorbency of the balance sheets of such institutions and facilitating the orderly resolution of troubled institutions. This work, which has been complemented by similar efforts at the national level, aims to reduce the risk that difficulties faced by one or a small number of G-SIFIs could have a destabilising effect on the broader financial system and real economy.
As with other actions to strengthen the regulatory framework, these steps need to be implemented in such a way as to minimise any negative impact on the broader economy. The FSB and BCBS reconvened the Macroeconomic Assessment Group (MAG) to study the relevant costs and benefits. The membership of the MAG comprises macroeconomic modelling experts from central banks and regulators in 15 countries and a number of international institutions.2 The group was asked to build on the previous work by the MAG and the Basel Committee’s Long-term Economic Impact (LEI) group to assess the transitional and long-term macroeconomic implications of proposals for strengthening capital requirements.3 As was the case with the MAG’s earlier work, close collaboration with the IMF was an essential part of the process.
The methodology used by the MAG draws on the generated paths for the GDP impact of higher capital ratios on all banks that were the basis for the results published by the MAG in its December 2010 report.
In order to provide an estimate of the likely impact of requiring a subset of institutions to hold additional capital, the MAG chose to scale these estimates based on the importance of the global systemically important banks (G-SIBs) in lending and total assets for each national financial system.4 For the economies represented on the MAG, both the share of lending to the non-financial private sector and the share of total banking system assets held by the top 30 potential G-SIBs (ranked by applying the Basel Committee’s proposed methodology to end-2009 data) range from less than one tenth to about three quarters. If we multiply the share of lending in each country by the respective estimated GDP impact, and take the simple median of the result, we find that a 1 percentage point increase in capital applied to G-SIBs over an eight-year implementation period would lead to a reduction in GDP (at the point of peak impact) of 0.06% below its baseline, when international spillover effects are included. It reaches this level in the 36th quarter, that is, nine years after the start of implementation. This represents an additional drag on growth of less than 0.01 percentage points per year for nine years. If implementation is accelerated to four years, the peak GDP impact is about the same, but the greatest impact is reached in the 21st quarter, resulting in an annual growth reduction of just above 0.01 percentage points. In both cases, growth recovers towards its baseline after the point of peak impact is reached. If monetary policy is unable to counteract the slowdown on growth, the impact is somewhat greater, reaching a
2 The participants in the Group’s work are listed in Annex 1. 3 The MAG’s interim report (MAG (2010a)) can be found at http://www.bis.org/publ/othp10.htm. The MAG’s final
report (MAG (2010b)) is at http://www.bis.org/publ/othp12.htm. The LEI report (Basel Committee (2010a)) can be found at http://www.bis.org/publ/bcbs173.htm. References are listed in Annex 4.
4 The term “G-SIBs” refers to those G-SIFIs that are subject to banking regulation and supervision. The Basel Committee’s proposed standards are intended for G-SIBs alone; other regulatory groupings are developing comparable standards for other categories of G-SIFIs.
Assessment of the Macroeconomic Impact of Higher Loss Absorbency for Global Systemically Important Banks 3
peak impact (including spillovers) of 0.10% of GDP relative to baseline in either a four-year or an eight-year implementation scenario.
We can use the estimated impact of increased capital across the entire banking system as calculated by the MAG for its 2010 report and the estimated impact of further increases in capital held by G-SIBs as set out in the present report to calculate the combined impact of Basel III and the proposed G-SIB framework.
• The MAG’s 2010 report, drawing on the Basel Committee’s Quantitative Impact Study (QIS), estimated that capital levels globally need to rise 1.3 percentage points to reach the target 7% ratio (including the capital conservation buffer) specified by Basel III.5 This yields a peak GDP impact of 0.22% for eight-year implementation, and 0.25% for implementation over four years.
• Calculating the additional impact of the G-SIB framework is complicated by the fact that different G-SIBs will be subject to different capital surcharges, ranging from 1 to 2.5%, and the assignment of specific G-SIBs to buckets has not yet been decided. To arrive at a first approximation, however, we can assume that the weighted average for the capital increase applicable to G-SIBs will be about 2 percentage points.6 We can thus multiply the per-percentage-point figures for the impact of the G-SIB framework by two.
• Adding these figures together, we arrive at an overall impact of Basel III and the G-SIB framework of 0.34% if the higher capital is implemented over eight years, and 0.37% for four-year implementation. In terms of growth rates, these correspond to a reduction in GDP growth of 0.04 percentage points for the eight-year implementation scenario and 0.07 percentage points for implementation over four years.
While the previous MAG study focused on transitional costs, on this occasion the MAG was also asked to provide an assessment of the benefits of the proposed framework.
The main benefit of requiring higher loss absorbency from G-SIFIs relates to the reduction in the probability of a costly financial crisis. These benefits were analysed in the LEI report, which derived estimates based on the extensive literature on the macroeconomic costs of crises and on the role of bank capital in reducing crisis risks. For the purposes of the present study, the benefits can be said to come from raising the common equity capital ratio from 7% to about 9% – under the assumption that the main benefits of higher capital relate to a reduced risk of failure at large, systemic institutions, and that, as before, the capital of the population of G-SIBs will rise about 2 percentage points on average. Using these assumptions, and making certain adjustments to the LEI report’s figures to account for revised definitions, we find that the annual benefit of the G-SIB framework is as much as 0.5 percentage points of GDP, and that the combined benefit of Basel III and the G-SIB framework is as much as 2.5 percentage points of GDP – an order of magnitude higher than our estimates of the transitional costs. Furthermore, while the transitional impact on GDP will diminish or reverse once the higher target capital levels are reached, the benefits should be largely permanent.
There are reasons why the actual costs and benefits could be greater or less than these figures. However, even under relatively conservative assumptions about the speed of implementation, the impact of countercyclical monetary policy, the size of credit rationing
5 The report on the QIS (Basel Committee (2010b)) can be found at http://www.bis.org/publ/bcbs186.htm. 6 This is a conservative assumption. If the top 30 potential G-SIBs considered here are allocated evenly into the
Basel Committee’s proposed buckets, the average capital surcharge, weighted by total assets as measured at end-2009, is 1.6%.
4 Assessment of the Macroeconomic Impact of Higher Loss Absorbency for Global Systemically Important Banks
effects, the greater degree of market power of G-SIBs, and the longer-term costs of stronger capital standards, the estimated benefits are substantially greater than the potential costs.
These costs and benefits are evaluated at the level of the global financial system. The effects in specific national systems will depend on overall levels of bank capital in those economies as well as on capital levels in the G-SIBs that are active in those countries. Many banks worldwide have already made significant progress towards meeting the requirements, including the higher levels of loss absorbency proposed for G-SIBs. Countries in which banks are already well capitalised, and in which much of the G-SIB activity is by institutions that already have large capital buffers in place, are likely to see little or no transitional impact from strengthened capital requirements. At the same time, all countries will benefit from the reduced risk in the global system that will accompany stronger standards for global institutions.
The remainder of this report is organised as follows. Section 2 reviews the key elements of the Basel Committee’s proposed G-SIB framework. Section 3 reviews the methodology and main results of the 2010 MAG and LEI reports that are used to inform the rest of the analysis. Section 4 discusses the channels through which implementation of the framework might affect the real economy and presents the key results on the transitional costs of the G-SIB framework. Section 5 sets out the MAG’s estimation of benefits, drawing on earlier LEI work. Section 6 briefly considers elements of the G-SIB framework, notably strengthened resolution frameworks, which are difficult to model quantitatively but which could have an important role in reducing systemic risks. Section 7 concludes.
2. Key elements of the G-SIB framework
Weaknesses at large, complex financial institutions have historically been a central factor in triggering and propagating systemic financial crises. Failures in risk assessment and risk management at a small number of institutions can have large effects, disrupting activity in many related institutions and many sectors of the economy. The size and complexity of these institutions present a challenge for public authorities. Rescuing such institutions through emergency loans or capital injections can often be the only way to contain financial crises and alleviate damage to the real economy in the short run. But this comes at the cost of creating moral hazard by encouraging institutions to resume their risky behaviour after the crisis has passed. These patterns and dilemmas were especially prominent during the global financial crisis of 2007–09.
The October 2010 report of the Financial Stability Board (FSB) entitled Reducing the moral hazard posed by systemically important financial institutions7 recommended a policy framework for addressing these risks. The key elements are:
• a resolution framework and other measures to ensure that all financial institutions can be resolved safely, quickly and without destabilising the financial system and exposing the taxpayer to the risk of loss;
• a requirement that SIFIs, and initially in particular G-SIFIs, have higher loss absorbency capacity to reflect the greater risks that these institutions pose to the global financial system;
• more intensive supervisory oversight for financial institutions that may pose systemic risk;
7 FSB (2010a), available at https://www.financialstabilityboard.org/publications/r_101111a.pdf.
Assessment of the Macroeconomic Impact of Higher Loss Absorbency for Global Systemically Important Banks 5
• robust core financial market infrastructures to reduce contagion risk from the failure of individual institutions, and
• other supplementary prudential and other requirements as determined by the national authorities.
As part of this effort, the Basel Committee on Banking Supervision (BCBS) released a consultative document in July 2011 that sets out an assessment methodology and additional loss absorbency requirements that would apply to G-SIBs.8 The Basel Committee’s proposal comprises the following elements:
• An assessment methodology for identifying G-SIBs and assigning them to one of four buckets reflecting their relative systemic importance. This involves an index based on a range of indicators, reflecting the size of banks, their interconnectedness, the lack of readily available substitutes for their services, their cross-jurisdictional activity, and their complexity. These quantitative measures would be complemented by supervisory judgment to capture qualitative aspects of systemic importance. The underlying data and the assessment methodology would be periodically updated and refined to reflect changing circumstances.
• A requirement that identified G-SIBs should hold additional loss absorbency, with amounts rising from 1% for the lowest bucket to 2.5% for the highest. A fifth bucket, at present empty, would carry a 3.5% loss absorbency requirement. National authorities would be allowed to impose higher requirements on their banks if they choose to do so.
• The additional loss absorbency requirement for G-SIBs would need to be met by common equity Tier 1. The use of contingent capital for this purpose would continue to be reviewed by the Basel Committee and its parent body, the Group of Governors and Heads of Supervision, while national authorities would be free to require these instruments for any additional loss absorbency requirements.
• The requirements would be phased in between 1 January 2016 and end-2018, becoming fully effective on 1 January 2019.
Work is also under way on the other areas identified by the FSB. A set of recommendations for improvements in domestic and cross-border bank resolution were issued for public consultation in July 2011.9 Recommendations on improving supervisory intensity and effectiveness were published in November 2010.10 The Committee on Payment and Settlement Systems (CPSS) and the International Organization of Securities Commissions (IOSCO) published in March 2011 a consultative report on harmonised principles for financial market infrastructures, covering payment systems, central securities depositories, securities settlement systems and central counterparties (CCPs), and including guidance on trade repositories.11
These diverse efforts should be understood as complementary, mutually reinforcing elements of global efforts to reduce the systemic stability issues posed by SIFIs. In
8 Basel Committee (2011a), available at http://www.bis.org/publ/bcbs201.htm. 9 Consultative report (FSB (2011)) available at https://www.financialstabilityboard.org/publications/r_110719.pdf. 10 A report setting out the main recommendations (FSB (2010b)) is available at
https://www.financialstabilityboard.org/publications/r_101101.pdf. These are being followed up by supervisory self-assessments and work by standards setters to tighten their core principles, implementation standards and assessment methodologies and criteria.
11 CPSS-IOSCO (2011), available at http://www.bis.org/publ/cpss94.htm.
6 Assessment of the Macroeconomic Impact of Higher Loss Absorbency for Global Systemically Important Banks
accordance with its mandate, however, the MAG has focused on the costs and benefits related to requirements for higher going-concern loss absorbency for G-SIBs. Some remarks will also be offered on loss absorbency for failed institutions (“gone concerns”).
3. The MAG and LEI reports
The MAG was formed in February 2010 at the request of the FSB and BCBS to assess the macroeconomic effects of the transition to higher bank capital and liquidity requirements. Members of the MAG made use of forecasting and policy analysis models at their home institutions to study the costs, in terms of reduced GDP, associated with a range of scenarios for capital increases and transition paths. The median values of the estimated GDP paths produced by the members were then used to generate a plausible GDP path for a representative economy, relative to baseline forecasts, in response to a 1 percentage point increase in capital ratios. These estimates reflected the perspective of a single (domestic) economy, and thus do not take account of the effects that might prevail if many jurisdictions worldwide implemented the requirements at the same time. To address this shortcoming, an analysis performed by the International Monetary Fund (IMF) estimated the additional GDP cost that would result from spillovers of slow growth across countries. The MAG’s quantitative analysis was complemented by consultations with academics and experts in the private sector.
While the modelling techniques and methodologies differed, in general members were interested in how banks might choose to raise lending spreads and reduce lending volumes in order to achieve higher targeted capital ratios while maintaining desired target returns on equity.12 These higher spreads and reduced lending in turn weigh on growth by reducing funding for investment. In some models, lower growth prospects are counteracted by an easing of monetary policy. Eventually, banks achieve their desired capital ratios, reduce their target returns on equity to levels corresponding with their less leveraged balance sheets, and resume normal lending behaviour. In most models, these developments bring GDP closer to its baseline path after the transition period is over.
An analysis based on the models contributed to the 2010 MAG report concluded that, when implementation is over an eight-year horizon, as provided for in the Basel III framework, each percentage point of additional capital would reduce the level of GDP (at the point of peak impact) by 0.23% relative to baseline, including spillover effects as estimated by the IMF. The peak effect would be reached in the 35th quarter after implementation starts, after which growth would accelerate as GDP recovers towards its baseline level.13 In terms of growth rates, annual growth would fall by approximately 3 basis points per year for eight and three-quarter years, then run above its baseline forecast for several quarters as GDP returned to baseline. These results are sensitive to a number of assumptions. If implementation takes
12 Approaches fell into three broad categories. The most commonly used was a two-step approach. In the first
step, changes in lending spreads and volumes are estimated, based either on accounting identities, or on past adjustment behaviours by individual banks or by the banking system as a whole. In the second step, these paths for spreads and volumes are used as inputs in standard policy analysis models, using either semi-structural or dynamic stochastic general equilibrium (DSGE) techniques. A second methodology used by MAG members employed DSGE models in which the adjustments of banks to new capital and liquidity targets are modelled directly. A third methodology was to look directly at past statistical relationships between bank capital and real-side variables, through vector autoregression (VAR) or vector error correction (VEC) techniques. Members generally found that this third approach produced less stable and less reliable estimates than the other two, so the results presented here use the first two approaches.
13 These figures differ slightly from those in the December 2010 MAG report, because some members have revised and updated their model estimates since that report was produced.
Assessment of the Macroeconomic Impact of Higher Loss Absorbency for Global Systemically Important Banks 7
place over four years rather than eight, the GDP impact would be about the same, while because of the shorter time period the growth impact would be larger. The effects tend to be more modest if monetary policy is allowed to counteract slower growth; they tend to be stronger if the impact of wider credit spreads is reinforced by banks’ willingness to tighten lending standards and ration credit.
The work of the MAG was complemented by an assessment initiated by the Basel Committee on the long-term economic impact (LEI) of the proposed capital and liquidity reforms. Where the MAG studied the transition, the LEI assessed the economic benefits and costs of the stronger standards once they were fully in place. The key benefit identified by the LEI was the lower probability of banking crises and their associated output losses. The costs were mainly related to higher lending rates resulting from a higher overall cost of capital.
Like the MAG, the LEI’s analysis drew on a variety of methodologies and models. The LEI report concluded that, even under conservative assumptions, net benefits exceed net costs for a broad range of capital ratios. With respect to benefits, the report estimated that systemic banking crises occur on average every 20–25 years, yielding an average probability of a systemic crisis of 4–5% per year.14 While estimates of the costs of systemic crises vary widely, a median among plausible estimates is around 60% of pre-crisis GDP. This suggests that a 1 percentage point reduction in the annual crisis probability should yield an annual benefit of 0.6% of GDP. Based on a number of studies reviewed in the LEI report, the LEI concluded that higher bank capital ratios should contribute to a reduction in crisis probabilities. However, it should be recognised that the reduction in probability diminishes as capital increases. The probability of crisis is also affected by the prevailing economic environment which is altered by prudential policy actions. These factors generate important uncertainties around the benefit calculation. Long-term costs, meanwhile, are found to be roughly linear in capital ratios, with each increase in the capital ratio increasing loan spreads by 13 basis points and reducing GDP by 0.09% relative to its baseline forecast, a figure that is significantly below net benefits even for capital ratios well above present ones.
4. Estimating the transitional costs of the G-SIB framework
How might higher loss absorbency requirements for G-SIBs affect the real economy? In the long run, these effects should be weak or non-existent. As demonstrated by Modigliani and Miller (1958), and as emphasised in more recent analyses such as Kashyap et al (2010) and Admati et al (2011), the liability structure of banks, like that of other firms, should only affect the value of the firm through a limited number of channels, primarily the tax advantages of debt relative to equity (which should bias financing choices towards debt), the explicit and implicit government subsidies provided to certain classes of bank debt, notably deposit guarantees (another factor favouring debt), and the deadweight costs of bankruptcy (which should bias financing choices towards equity).15
Any short-term costs of higher capital are related to the adjustments that banks need to make during the transition. Banks have a number of possible avenues for meeting higher capital requirements set by regulators. One option is to issue new shares. However, raising capital externally is more costly than generating capital internally, because of adverse
14 Systemic crises were defined as those that produce a substantial shift in the level of GDP to below pre-crisis
levels, generating permanent economic losses. 15 Basel Committee (2011b) reviews the principal theoretical and empirical contributions on the real economic
impact of regulatory standards (http://www.bis.org/publ/bcbs_wp18.htm).
8 Assessment of the Macroeconomic Impact of Higher Loss Absorbency for Global Systemically Important Banks
selection costs. Banks are thus likely to meet higher capital requirements primarily through some combination of increased accumulation of retained earnings (through reduced dividend payouts and/or increased spreads of lending rates over funding costs) and reduced assets (deleveraging). To the extent that these efforts lead to higher credit spreads and lower lending, this in turn could raise costs and reduce funding for borrowers in the real economy, which will reduce GDP. Central banks can counteract the drag on the real economy by loosening monetary policy, but the effectiveness of such a response may be limited, especially in present conditions when many countries already have low or zero nominal policy rates.
Some of the macroeconomic effects of raising capital requirements on G-SIBs alone may be roughly comparable to those that would result were the same increase in capital imposed on the full population of banks, while other effects will be weaker. On the one hand, G-SIBs tend to enjoy market power in some jurisdictions that would make it easier for them to raise and maintain higher credit spreads during the transition to higher capital levels. They may also play unique roles in certain lending segments, in channelling foreign currency funding from overseas sources, or in capital market activities such as market-making or debt underwriting. Some of these responses are effectively addressed by those MAG models that explicitly take account of lending standards and credit rationing effects, while others are not. On the other hand, if G-SIBs need to reduce their lending and other activities while other banks do not, then these smaller banks may increase their activities, mitigating the real economic impact of the G-SIB requirements. It is unlikely that the impact of higher capital requirements on G-SIBs alone will be greater than that of the same capital increase applied to all banks.
In what follows, we take a balanced approach, by scaling the impact of the G-SIB capital increase by the share of G-SIBs in lending or assets in a given economy. However, it should be kept in mind that effects could also be greater or less than this, depending on whether G-SIBs have a role in the adaptability of the financial system that is greater or lesser than their proportionate share in lending or assets would suggest.
Our approach consists of multiplying estimated GDP impacts by lending shares and asset shares. This is accurate to the extent that the impact of capital surcharges on G-SIBs is a linear function of the size of these surcharges, and surcharges on G-SIBs have the same impact per percentage point of capital as do increased capital ratios on the banking system as a whole. Below we further consider reasons why this approach might over- or underestimate the relevant costs.
Summary statistics for the G-SIBs’ shares of lending and total assets
There is wide variation in the role of G-SIBs across economies (Table 1). For the economies represented on the MAG, the share of the 30 potential G-SIBs that had the highest scores using the assessment methodology in the Basel Committee’s July 2011 consultative document (estimated using 2009 data) ranges in both domestic lending and domestic financial system assets from less than 10% to about three quarters.16 The unweighted median of these G-SIB shares is 29% in the case of non-financial private lending and 35% in the case of assets. The unweighted mean is 31% for lending and 38% for assets. GDP-weighted medians and means are higher, reflecting the fact that the G-SIBs tend to have a stronger presence in the larger economies.
16 The population of G-SIBs will change as the Basel Committee refines its assessment methodology and as the
bank-level indicators evolve over time.
Assessment of the Macroeconomic Impact of Higher Loss Absorbency for Global Systemically Important Banks 9

Table 1
Shares of G-SIBs in domestic financial systems (%)
Lending to the non-financial private sector
Total financial system assets
Top 20 Top 30 Top 40 Top 20 Top 30 Top 40
Minimum 3.50 3.90 7.50 8.20 8.58 13.80
Maximum 50.46 75.21 75.77 68.98 76.64 79.53
Unweighted median 18.93 29.13 39.47 27.77 35.24 46.96
GDP-weighted median 30.39 46.18 48.70 31.48 55.51 66.81
Unweighted mean 23.63 30.85 38.54 30.41 38.02 46.31
GDP-weighted mean 32.11 40.10 43.96 43.02 52.38 57.75
Figures are summary statistics for the share of lending (or assets) in the domestic financial systems of Australia, Brazil, Canada, France, Germany, Italy, Japan, Korea, Mexico, the Netherlands, Spain, Switzerland, the United Kingdom and the United States represented by the first 20/30/40 financial institutions that would be produced by applying the methodology used in Basel Committee (2011a) to end-2009 data. Observation dates for lending and asset shares vary from December 2009 to May 2011. GDP figures are 2010 estimates from the IMF WEO database.
Sources: IMF; national data; BIS calculations.
Benchmark results
The impact of stronger G-SIB capital requirements on lending spreads and volumes is fairly modest. While not all models contributed to the MAG estimated these effects explicitly, those that did suggested a peak decline in lending volumes of about one half of 1% relative to baseline forecasts, and an increase in lending spreads of 5–6 basis points (Table 2). These figures result from scaling the volume and spread figures contributed to the 2010 MAG exercise by the shares of non-financial private sector lending accounted for by G-SIBs in different economies. If the shares of G-SIBs in financial system assets had been used as scaling factors, the spread and volume effects would have been slightly larger but qualitatively similar.
Table 2
Estimated deviations of lending spreads and volumes from baseline forecasts for a 1 percentage point increase in the target capital ratio for G-SIBs implemented over
eight years
Lending volume1 (in per cent)
Lending spreads2 (in basis points)
Q36 Q48 Q36 Q48
Unweighted median –0.53 –0.39 5.5 5.5
GDP-weighted median –0.57 –0.50 6.1 5.6
Unweighted mean –0.64 –0.63 6.0 5.6
GDP-weighted mean –1.05 –1.00 6.4 5.9 1 Results reported for 40 models. 2 Results reported for 56 models.
10 Assessment of the Macroeconomic Impact of Higher Loss Absorbency for Global Systemically Important Banks
Graph 1
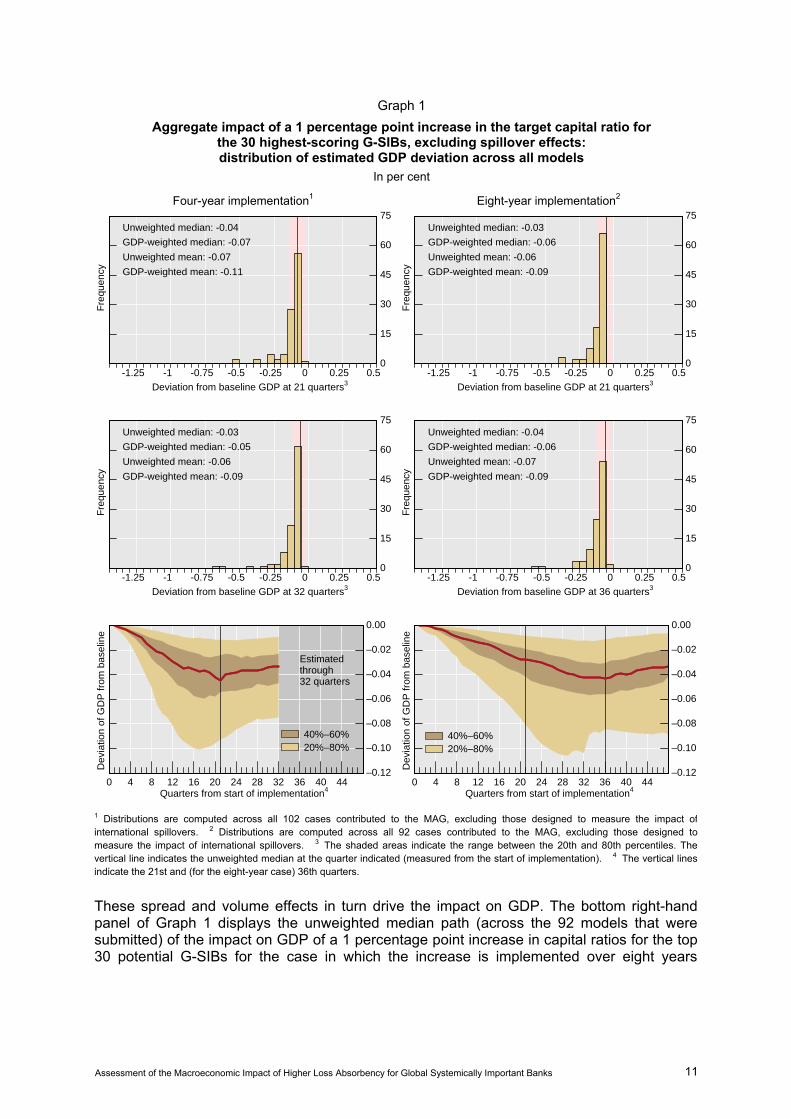
Aggregate impact of a 1 percentage point increase in the target capital ratio for the 30 highest-scoring G-SIBs, excluding spillover effects: distribution of estimated GDP deviation across all models
In per cent
Four-year implementation1 Eight-year implementation2
0
15
30
45
60
75
-1.25 -1 -0.75 -0.5 -0.25 0 0.25 0.5
Fre
quen
cy
Deviation from baseline GDP at 21 quarters3
Unweighted median: -0.04
GDP-weighted median: -0.07
Unweighted mean: -0.07
GDP-weighted mean: -0.11
0
15
30
45
60
75
-1.25 -1 -0.75 -0.5 -0.25 0 0.25 0.5
Fre
quen
cy
Deviation from baseline GDP at 21 quarters3
Unweighted median: -0.03
GDP-weighted median: -0.06
Unweighted mean: -0.06
GDP-weighted mean: -0.09
0
15
30
45
60
75
-1.25 -1 -0.75 -0.5 -0.25 0 0.25 0.5
Fre
quen
cy
Deviation from baseline GDP at 32 quarters3
Unweighted median: -0.03
GDP-weighted median: -0.05
Unweighted mean: -0.06
GDP-weighted mean: -0.09
0
15
30
45
60
75
-1.25 -1 -0.75 -0.5 -0.25 0 0.25 0.5
Fre
quen
cy
Deviation from baseline GDP at 36 quarters3
Unweighted median: -0.04
GDP-weighted median: -0.06
Unweighted mean: -0.07
GDP-weighted mean: -0.09
–0.12
–0.10
–0.08
–0.06
–0.04
–0.02
0.00
0 4 8 12 16 20 24 28 32 36 40 44Quarters from start of implementation4
Dev
iatio
n of
GD
P fr
om b
asel
ine
Estimatedthrough32 quarters
40%–60%20%–80%
–0.12
–0.10
–0.08
–0.06
–0.04
–0.02
0.00
0 4 8 12 16 20 24 28 32 36 40 44Quarters from start of implementation4
Dev
iatio
n of
GD
P fr
om b
asel
ine
40%–60%20%–80%
1 Distributions are computed across all 102 cases contributed to the MAG, excluding those designed to measure the impact of international spillovers. 2 Distributions are computed across all 92 cases contributed to the MAG, excluding those designed tomeasure the impact of international spillovers. 3 The shaded areas indicate the range between the 20th and 80th percentiles. The vertical line indicates the unweighted median at the quarter indicated (measured from the start of implementation). 4 The vertical lines indicate the 21st and (for the eight-year case) 36th quarters.
These spread and volume effects in turn drive the impact on GDP. The bottom right-hand panel of Graph 1 displays the unweighted median path (across the 92 models that were submitted) of the impact on GDP of a 1 percentage point increase in capital ratios for the top 30 potential G-SIBs for the case in which the increase is implemented over eight years
Assessment of the Macroeconomic Impact of Higher Loss Absorbency for Global Systemically Important Banks 11
(32 quarters).17 Along this median path, GDP falls steadily relative to its baseline path, reaching a level 0.04% below baseline in the 36th quarter (that is, one year after the completion of implementation) before recovering. By the last (ie the 48th) quarter, GDP has recovered to a level 0.03% below baseline. The dark shaded area in the graph contains the paths for the submitted models that generated GDP impacts between the 40th and 60th percentiles, while the lighter shaded area adds those between the 20th and 80th percentiles.
The middle right-hand panel of Graph 1 shows the distribution of GDP estimates for the 36th quarter across the models submitted. Even though there are a small number of outliers, most of the results are distributed relatively close to the median value of 0.04% reported above. Other summary statistics (the GDP-weighted median, and the weighted and unweighted means) produce a somewhat larger peak impact, reflecting the relatively greater role of G-SIBs in the larger economies represented in the MAG.
The bottom left-hand panel of Graph 1 displays the unweighted median path of the GDP impact when a 1 percentage point increase in capital ratios for a population of 30 G-SIBs is implemented over four years. The peak impact on the level of GDP occurs in the 21st quarter, or five quarters after implementation is complete. While the point of peak impact is considerably earlier than in the eight-year implementation case, the magnitude of the impact is virtually the same: the unweighted median is 0.04%, while as before the mean and GDP-weighted median impacts are somewhat larger.
International spillovers
The estimates discussed so far are based on models that look at macroeconomic impacts within a given economy. If many economies implement higher capital standards at the same time, however, this can lead to spillover effects, as tighter macroeconomic and financial conditions in the wider world reinforce the fall in domestic demand resulting from lower domestic bank lending. These effects are of particular interest in the case of G-SIBs, which are more likely than other banks to have extensive activities in multiple jurisdictions and to play an important role in global wholesale financial markets. Indeed, cross-border activity is among the criteria for systemic importance in the Basel Committee’s proposal.
As was the case for the 2010 MAG exercise, the IMF estimated these effects with the help of a structural macroeconomic model of the world economy. The IMF found that, in a model that does not allow for declines in output to be offset by monetary policy, a 1 percentage point increase in capital requirements for the top 30 potential G-SIBs would cause global GDP to fall to a level 0.14% below its baseline measure in a model which does not allow international spillover effects, and 0.18% in a model that does allow such effects, suggesting that international spillovers add 0.04% to the GDP impact under this assumption. These estimates of the peak GDP impact are essentially the same regardless of the length of time over which the capital increase is implemented (although the quarter at which the GDP impact reaches its maximum will differ). The Bank of Canada also estimated these international spillovers using BoC-GEM-Fin, a global model with a banking sector. If a monetary policy response does take place, the peak GDP impact falls to 0.04% below baseline, while international spillovers are essentially zero. A plausible if somewhat conservative approach for adjusting our pooled estimates (such as those shown in Graph 1)
17 To generate these GDP paths, estimates submitted by a given national authority were multiplied by the share
of the top 30 potential G-SIBs in lending in the corresponding economy. Some models (specifically those applicable to the euro area or to the European Union) applied to groupings of countries; these were multiplied by the weighted average of the top-30-G-SIB lending shares for the MAG members that belonged to those groups. Alternative approaches – for example, multiplying the median path across all estimates by the weighted or unweighted G-SIB share across all MAG members – produce qualitatively similar results.
12 Assessment of the Macroeconomic Impact of Higher Loss Absorbency for Global Systemically Important Banks
is to pool the IMF’s estimates that assumed a monetary policy response with those that did not. This produces an average spillover effect of 0.02% for the peak GDP impact.
Distribution of results across modelling assumptions
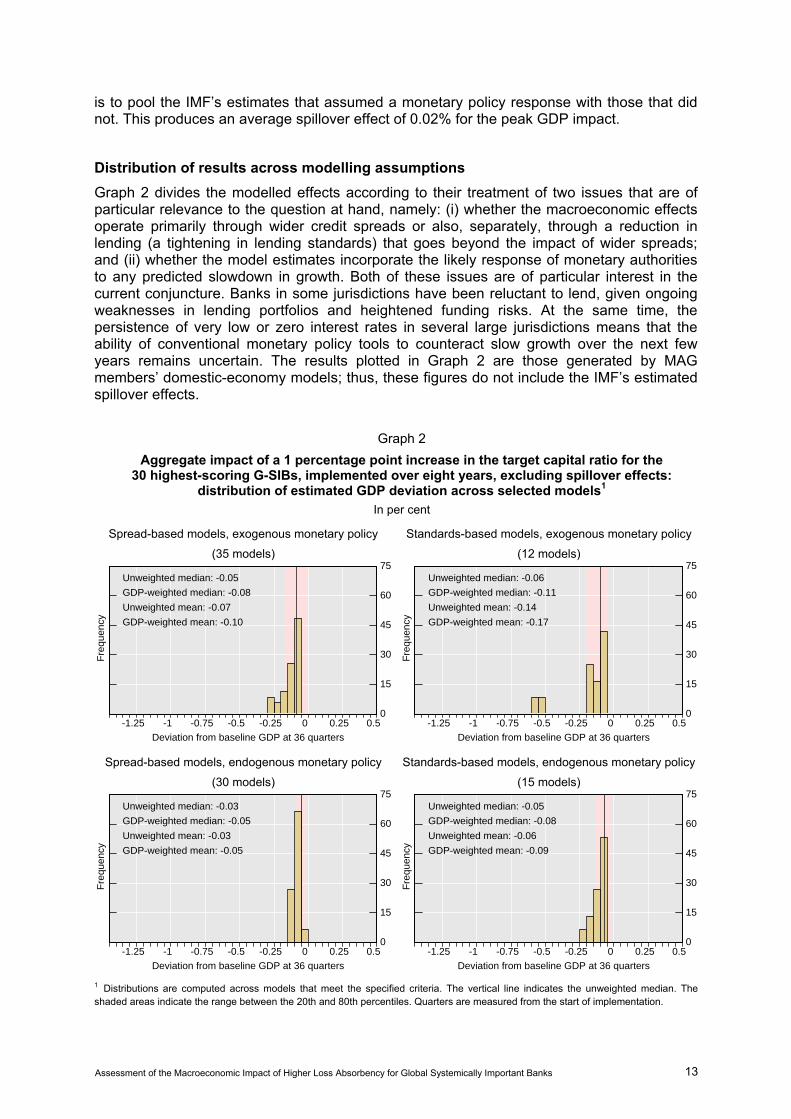
Graph 2 divides the modelled effects according to their treatment of two issues that are of particular relevance to the question at hand, namely: (i) whether the macroeconomic effects operate primarily through wider credit spreads or also, separately, through a reduction in lending (a tightening in lending standards) that goes beyond the impact of wider spreads; and (ii) whether the model estimates incorporate the likely response of monetary authorities to any predicted slowdown in growth. Both of these issues are of particular interest in the current conjuncture. Banks in some jurisdictions have been reluctant to lend, given ongoing weaknesses in lending portfolios and heightened funding risks. At the same time, the persistence of very low or zero interest rates in several large jurisdictions means that the ability of conventional monetary policy tools to counteract slow growth over the next few years remains uncertain. The results plotted in Graph 2 are those generated by MAG members’ domestic-economy models; thus, these figures do not include the IMF’s estimated spillover effects.
Graph 2
Aggregate impact of a 1 percentage point increase in the target capital ratio for the 30 highest-scoring G-SIBs, implemented over eight years, excluding spillover effects:
distribution of estimated GDP deviation across selected models1 In per cent
Spread-based models, exogenous monetary policy
(35 models)
Standards-based models, exogenous monetary policy
(12 models)
0
15
30
45
60
75
-1.25 -1 -0.75 -0.5 -0.25 0 0.25 0.5
Fre
quen
cy
Deviation from baseline GDP at 36 quarters
Unweighted median: -0.05
GDP-weighted median: -0.08
Unweighted mean: -0.07
GDP-weighted mean: -0.10
0
15
30
45
60
75
-1.25 -1 -0.75 -0.5 -0.25 0 0.25 0.5
Fre
quen
cy
Deviation from baseline GDP at 36 quarters
Unweighted median: -0.06
GDP-weighted median: -0.11
Unweighted mean: -0.14
GDP-weighted mean: -0.17
Spread-based models, endogenous monetary policy
(30 models)
Standards-based models, endogenous monetary policy
(15 models)
0
15
30
45
60
75
-1.25 -1 -0.75 -0.5 -0.25 0 0.25 0.5
Fre
quen
cy
Deviation from baseline GDP at 36 quarters
Unweighted median: -0.03
GDP-weighted median: -0.05
Unweighted mean: -0.03
GDP-weighted mean: -0.05
0
15
30
45
60
75
-1.25 -1 -0.75 -0.5 -0.25 0 0.25 0.5
Fre
quen
cy
Deviation from baseline GDP at 36 quarters
Unweighted median: -0.05
GDP-weighted median: -0.08
Unweighted mean: -0.06
GDP-weighted mean: -0.09
1 Distributions are computed across models that meet the specified criteria. The vertical line indicates the unweighted median. Theshaded areas indicate the range between the 20th and 80th percentiles. Quarters are measured from the start of implementation.
Assessment of the Macroeconomic Impact of Higher Loss Absorbency for Global Systemically Important Banks 13
As in the original MAG report, the impact of higher capital levels on GDP was larger in models that allow for rationing or lending standard effects (Graph 2, right-hand panels) than in models that do not allow for such effects (Graph 2, left-hand panels). Similarly, the macroeconomic impact of increased capital levels was larger in models that do not allow for an endogenous response of monetary policy (Graph 2, bottom panels) than in models that do (Graph 2, top panels).
The 36th quarter unweighted median impact on the level of GDP among the models that allow only for credit spread effects and do not allow for an endogenous monetary policy response is 0.05% (Graph 2, top left-hand panel). This number increases to 0.06% once standard effects are allowed, but the response of monetary policy is kept exogenous (Graph 2, top right-hand panel). The unweighted median impact on the level of GDP among the models that allow for both – standard effects and endogenous monetary policy response – is 0.05% (Graph 2, bottom right-hand panel). Finally, the unweighted median impact (0.03%) is smallest among the models that allow for an endogenous monetary policy response but do not allow for lending standard effects (Graph 2, bottom left-hand panel).
When one adds in the spillover effects estimated by the IMF, the median peak impact for all models that do not allow for a monetary policy response (that is, the models illustrated in the top panels of Graph 2) is 0.10%, while for models with endogenous monetary policy the median impact is 0.03%. With nominal policy rates at or near zero for several large economies, the conventional use of lower policy rates to implement easier policy will be severely constrained. Although central banks have used and will continue to use other tools to achieve their objectives, the effectiveness of these tools remains uncertain. This suggests that one should consider both of these estimates in assessing the macroeconomic impact of tighter capital requirements.
The experience of the financial crisis has generated increased interest in the use of macroprudential policy as a complement to monetary policy. While attention has primarily focused on the use of macroprudential policy tools to mitigate destabilising build-ups of risk, under the right conditions these tools could also conceivably be employed to counteract an excessive pullback from risk-taking in the financial system. However, many of these tools are untested and their macroeconomic effects are not yet well understood. There is an open discussion about the possible role for macroprudential policy in counteracting a potential negative impact on growth. Furthermore, the results of the analysis do not suggest excessive reactions to the implementation of the new regulatory standards.18
Table 3 shows how peak GDP impacts vary for different G-SIB populations and modelling assumptions. Small add-ons reflecting the impact of international spillovers, drawn from the IMF’s analysis, have now been added to each impact estimate. Varying the number of G-SIBs that would be affected by the capital surcharge does not affect the results significantly. Namely, raising the number of G-SIBs from 30 to 40 increases the peak impact on GDP only marginally from 0.06% to 0.08% for both the eight-year implementation case and the four-year implementation case. Similarly, decreasing the number of G-SIBs from 30 to 20 slightly lowers the peak impact on GDP for both cases.
The results are also largely unchanged when the multiplication factor is the shares of G-SIBs in total financial system assets rather than their shares of total loans to the non-financial private sector. The maximum impact on the level of GDP in all cases increases marginally, mainly due to the fact that, as noted above, G-SIBs’ shares of total assets tend to be larger than their shares of total loans to the non-financial private sector.
18 These issues are discussed further in Angelini et al (2011).
14 Assessment of the Macroeconomic Impact of Higher Loss Absorbency for Global Systemically Important Banks
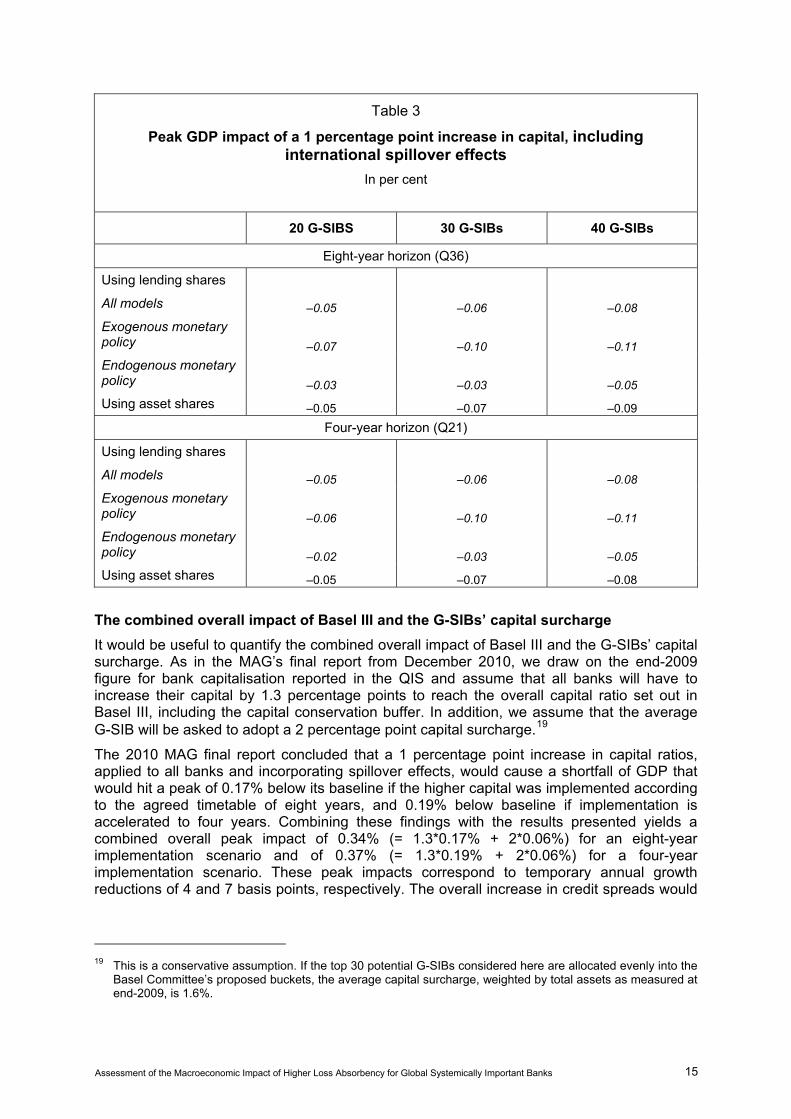
Table 3
Peak GDP impact of a 1 percentage point increase in capital, including international spillover effects
In per cent
20 G-SIBS 30 G-SIBs 40 G-SIBs
Eight-year horizon (Q36)
Using lending shares
All models –0.05 –0.06 –0.08
Exogenous monetary policy –0.07 –0.10 –0.11
Endogenous monetary policy –0.03 –0.03 –0.05
Using asset shares –0.05 –0.07 –0.09
Four-year horizon (Q21)
Using lending shares
All models –0.05 –0.06 –0.08
Exogenous monetary policy –0.06 –0.10 –0.11
Endogenous monetary policy –0.02 –0.03 –0.05
Using asset shares –0.05 –0.07 –0.08
The combined overall impact of Basel III and the G-SIBs’ capital surcharge
It would be useful to quantify the combined overall impact of Basel III and the G-SIBs’ capital surcharge. As in the MAG’s final report from December 2010, we draw on the end-2009 figure for bank capitalisation reported in the QIS and assume that all banks will have to increase their capital by 1.3 percentage points to reach the overall capital ratio set out in Basel III, including the capital conservation buffer. In addition, we assume that the average G-SIB will be asked to adopt a 2 percentage point capital surcharge.19
The 2010 MAG final report concluded that a 1 percentage point increase in capital ratios, applied to all banks and incorporating spillover effects, would cause a shortfall of GDP that would hit a peak of 0.17% below its baseline if the higher capital was implemented according to the agreed timetable of eight years, and 0.19% below baseline if implementation is accelerated to four years. Combining these findings with the results presented yields a combined overall peak impact of 0.34% (= 1.3*0.17% + 2*0.06%) for an eight-year implementation scenario and of 0.37% (= 1.3*0.19% + 2*0.06%) for a four-year implementation scenario. These peak impacts correspond to temporary annual growth reductions of 4 and 7 basis points, respectively. The overall increase in credit spreads would
19 This is a conservative assumption. If the top 30 potential G-SIBs considered here are allocated evenly into the
Basel Committee’s proposed buckets, the average capital surcharge, weighted by total assets as measured at end-2009, is 1.6%.
Assessment of the Macroeconomic Impact of Higher Loss Absorbency for Global Systemically Important Banks 15
peak at 31 basis points (= 1.3*15.5 + 2*5.5) in the eight-year implementation scenario and slightly more in the four-year implementation case.
On the one hand, the above impacts might be underestimated if G-SIBs have an outsize role (market power). We can simulate this by applying the cap surcharge to the entire banking system (ie a 100% G-SIB share). This would result in a combined overall impact of 0.56% (= 3.3*0.17%) for an eight-year implementation scenario and of 0.63% (= 3.3*0.19%) for a four-year implementation scenario. The corresponding reductions in annual growth are 6 basis points in the eight-year case and 12 basis points for four years.
On the other hand, the impacts reported in the benchmark cases might be overestimated if other banks and lending channels can expand lending to replace any pullback by G-SIBs. In this case, the impact would be closer to that which was estimated in December 2010.
The increases in capital requirements will be accompanied by the introduction of global standards for liquidity. The QIS found that, at the end of 2009, larger (“Group 1”) banks had a liquidity coverage ratio (LCR) of 83% and a net stable funding ratio (NSFR) of 93%, and that both of these ratios were close to 100% for smaller (“Group 2”) banks. Efforts to meet the liquidity and capital requirements will complement one another, since relatively higher holdings of liquid assets should reduce risk-weighted assets.20
5. Estimating the long-term benefits of the G-SIB framework
The main motivation of strengthening regulation of G-SIBs is to prevent costly financial crises.21 Such crises vary widely in terms of their depth, their duration and their impact on long-term trend growth. The relatively low number of observations makes it difficult to come to any strong conclusions about whether, and to what extent, they can be prevented through stronger capital ratios, while the variation in their GDP impact hinders a precise estimation of costs. Nevertheless, we can use the analysis that has been done on this topic to come to broad conclusions about the order of magnitude of these benefits and the factors that influence them.
The LEI report used a range of studies and methods to develop plausible estimates for all three parts of the puzzle: the probability that a crisis will occur in any given year; the real economic costs of a crisis; and the degree to which higher bank capital reduces the risk of a crisis.22
With respect to the cost of a crisis, a crucial assumption is whether a crisis has a permanent effect on output (with output resuming its pre-crisis growth rate, but on a lower path) or a
20 A conservative estimate, based on the LCR figure of 83%, might start from the observation that banks need to
increase their liquid assets by a further 20% (= (100–83)/83). Those who estimated the impact of increased liquidity requirements as part of the 2010 MAG project found that a 25% increase in liquid assets relative to total assets over four years would lead to a fall in GDP of 0.13% after eight years. This suggests that the GDP impact figures derived above should be augmented with an additional reduction of 0.10% (= (20/25)*0.13%). The figures for the slowdown of annual growth would include an additional 1 basis point in the eight-year case and 2 basis points in the four-year case.
21 Annex 3 uses bank-level data to study how higher capital reduces the riskiness of G-SIBs as perceived by the market.
22 The report notes that there has been little research on a fourth question, namely whether higher bank capital reduces the severity of a crisis once it occurs. However, the authors note that simple scatterplots of capital ratios and crisis costs seem to provide some support for the existence of such a relationship. The report also explores whether higher bank capital reduces the amplitude of fluctuations in output, concluding that it does so but only to a modest extent.
16 Assessment of the Macroeconomic Impact of Higher Loss Absorbency for Global Systemically Important Banks
temporary effect (with growth after the crisis accelerating to the point where output returns to its pre-crisis trend path). Both patterns have been observed in recent experience, and for more recent crises it is not yet possible to establish trend growth with any certainty. For studies that assume that the impact is temporary, the median cumulative discounted loss is 19% of pre-crisis GDP. Studies that assume a permanent impact find a median cumulative discounted loss of 158% of GDP. The median across all comparable models studied is 63%. None of the studies reviewed includes the 2007–09 episode, which is likely to have resulted in substantial cumulative GDP costs.
Regarding the impact of higher bank capital on the probability of a crisis, the LEI report compiles results from six models using a variety of approaches. Some use reduced-form regressions, based on the past statistical relationship between capital levels and crisis events. Others use a more structural approach, similar to the methods commonly used to measure and manage corporate credit risks, which translate banking system capital into a “distance to default” that could indicate a heightened risk of a systemic crisis. Some models look only at the impact of capital requirements on crisis probabilities, while others look at both capital and liquidity requirements. For our purposes, it is significant that several (though not all) of these models are calibrated on capital and liquidity positions at a sample of large banks. This suggests that the LEI’s meta-analysis, which was originally intended to study the impact of system-wide capital increases, should also be informative with respect to our questions about the impact of capital increases on the largest global banks.
Table 4, which is based on Table 3 of the LEI report, provides the median estimates of crisis probabilities for different capital ratios and different subsets of models. We are interested in the effect of an increase in bank capital ratios from 7%, the minimum under Basel III, to 9%, which as discussed is likely to be close to or somewhat above the average minimum across G-SIBs under the BCBS proposal. However, before relating capital ratios to crisis probabilities, we need to take account of the fact that the Basel III rules will change the definitions used in calculating both the numerator and denominator of the ratio of common equity to risk-weighted assets. Earlier definitions were used to come up with the common equity capital ratios presented in the LEI report and in the first column of Table 4 (which themselves reflect an attempt to harmonise the ratios used in the different studies). For reasons set out in Annex 2, ratios calculated under the new definitions are likely to be roughly two thirds of the ones that formed the basis of the analysis in the LEI report. We thus need to look at the crisis probabilities that correspond not to the old ratios (in the first column of Table 4) but to the new ones (in the second column).
If we use the median estimates across all six models studied in the LEI, this approach would suggest that raising capital ratios of G-SIBs from 7% to 9% should lower the crisis probability from around 1.2% per annum (the average between the figures corresponding to the 6.7% and 7.3% adjusted capital ratios in Table 2) to as little as 0.45% (the average between the figures for the 8.7% and 9.3% ratios), a reduction of 0.75 percentage points.23 It should be noted that these figures are likely to overstate the reduction in crisis probabilities, since the capital increase is likely to be somewhat less than 2 percentage points and to the extent that raising the capital of G-SIBs is not the same as raising the overall level of capital in the financial system.
23 The 0.45% figure was the median estimate among the crisis probabilities produced by the LEI’s models, which
ranged from 0 to 1.3% for this level of capital.
Assessment of the Macroeconomic Impact of Higher Loss Absorbency for Global Systemically Important Banks 17
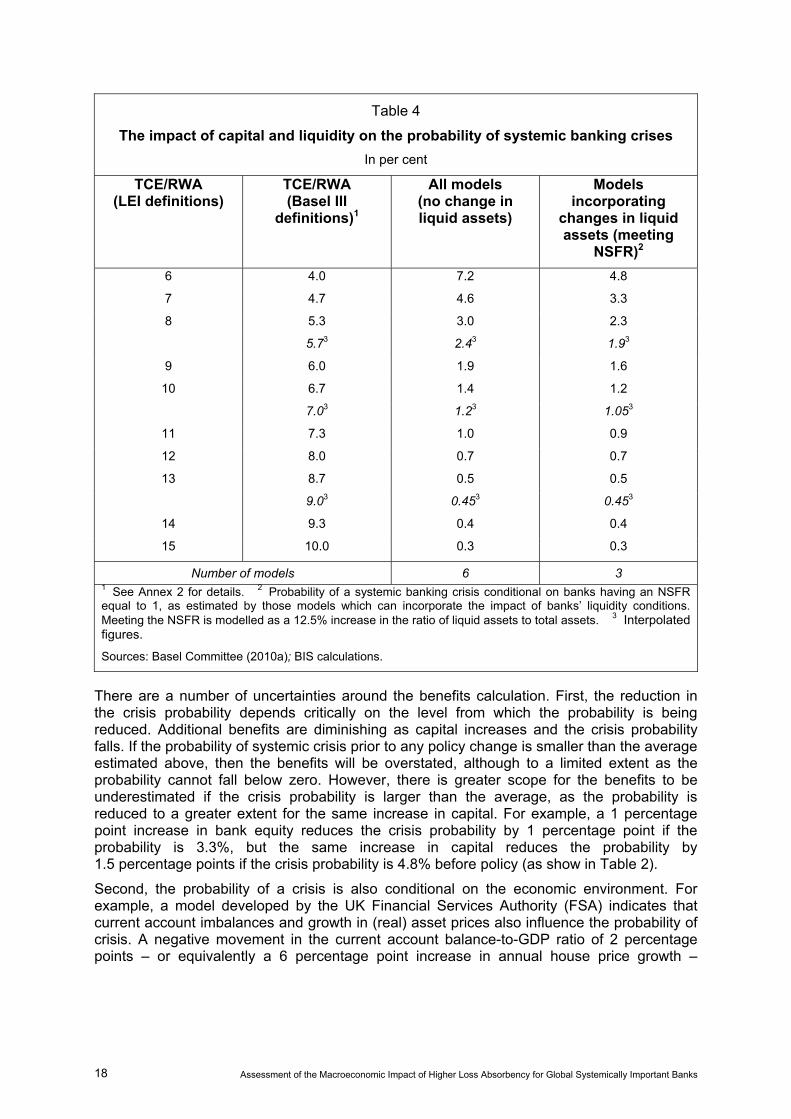
Table 4
The impact of capital and liquidity on the probability of systemic banking crises
In per cent
TCE/RWA (LEI definitions)
TCE/RWA (Basel III
definitions)1
All models (no change in liquid assets)
Models incorporating
changes in liquid assets (meeting
NSFR)2
6 4.0 7.2 4.8
7 4.7 4.6 3.3
8 5.3 3.0 2.3
5.73 2.43 1.93
9 6.0 1.9 1.6
10 6.7 1.4 1.2
7.03 1.23 1.053
11 7.3 1.0 0.9
12 8.0 0.7 0.7
13 8.7 0.5 0.5
9.03 0.453 0.453
14 9.3 0.4 0.4
15 10.0 0.3 0.3
Number of models 6 3 1 See Annex 2 for details. 2 Probability of a systemic banking crisis conditional on banks having an NSFR equal to 1, as estimated by those models which can incorporate the impact of banks’ liquidity conditions. Meeting the NSFR is modelled as a 12.5% increase in the ratio of liquid assets to total assets. 3 Interpolated figures.
Sources: Basel Committee (2010a); BIS calculations.
There are a number of uncertainties around the benefits calculation. First, the reduction in the crisis probability depends critically on the level from which the probability is being reduced. Additional benefits are diminishing as capital increases and the crisis probability falls. If the probability of systemic crisis prior to any policy change is smaller than the average estimated above, then the benefits will be overstated, although to a limited extent as the probability cannot fall below zero. However, there is greater scope for the benefits to be underestimated if the crisis probability is larger than the average, as the probability is reduced to a greater extent for the same increase in capital. For example, a 1 percentage point increase in bank equity reduces the crisis probability by 1 percentage point if the probability is 3.3%, but the same increase in capital reduces the probability by 1.5 percentage points if the crisis probability is 4.8% before policy (as show in Table 2).
Second, the probability of a crisis is also conditional on the economic environment. For example, a model developed by the UK Financial Services Authority (FSA) indicates that current account imbalances and growth in (real) asset prices also influence the probability of crisis. A negative movement in the current account balance-to-GDP ratio of 2 percentage points – or equivalently a 6 percentage point increase in annual house price growth –
18 Assessment of the Macroeconomic Impact of Higher Loss Absorbency for Global Systemically Important Banks
increases the probability of crisis from around 4.5% to 7%.24. Economic conditions prevailing in individual economies once Basel III is implemented will therefore have some influence over the level of the crisis probability, and therefore the calculated benefits of the policy.
It could be argued that, rather than looking at all of these models, we should focus on those that also simulate the impact of meeting the Basel III liquidity requirements, on the grounds that the G-SIB framework is supplementary to the Basel liquidity framework.25 In this case, we would look at the probabilities in the fourth column, and conclude that the G-SIB framework would reduce the crisis probability from 1.05% to 0.45%, a reduction of 0.60 percentage points. In this case, the crisis probabilities, and the reduction in crisis risks from higher capital, are less than in the case without liquidity requirements. This reflects the fact that the liquidity requirements themselves reduce the risk of a crisis, so that the additional benefit that can come from higher capital is less.
The next step is to multiply the reduced crisis risk by the cost of a crisis, producing an estimate for the annual benefit. The estimates presented above suggest that the G-SIB framework yields a benefit ranging from 0.09% (= 0.60*19%) of pre-crisis GDP (if crisis effects are temporary and liquidity requirements are already in place) to 1.19% (= 0.75*158%) of pre-crisis GDP (if crisis effects are permanent and liquidity requirements are not present). If we use the median of the crisis cost estimates, namely a cumulative discounted loss of 63% of GDP, the range of benefits would be from 0.38% (= 0.60*63%) to 0.47% (= 0.75*63%) of pre-crisis GDP.
Finally, in the same way that we calculated the overall transition costs, we are interested in an estimate of the overall benefit from the Basel III framework as supplemented by the G-SIB requirements. In this case, a sensible starting point would be the LEI’s estimate that the historical (pre-Basel III) frequency of crises is 4.5%. This suggests that the combination of the Basel capital rules and the proposed G-SIB framework would reduce the crisis probability from 4.5% to as little as 0.45%, a decline of 4.05 percentage points.26 As before, this may overstate the benefit, since the additional capital surcharge would apply only to G-SIBs and not to other banks. The overall benefit would range from 0.77% of GDP (if crisis effects are temporary) to 6.40% of GDP (if crisis effects are permanent). The median benefit across all models would be 2.55%.27
The LEI report also provided a measure of the long-term costs of the strengthened capital and liquidity standards. This involved a different approach from the models that were used by the MAG to estimate transitional costs, although the resulting estimated impact on GDP is of a similar order of magnitude. Using the conservative assumption that banks target a return on equity (ROE) of 15%, which is the 1993–2007 average, the LEI report finds that each percentage point increase in the capital ratio increases lending spreads by 13 basis points.
24 Based on data from the UK FSA model. The calculations are made using the average values for capital and
liquidity ratios in the UK economy prior to the recent financial crisis. The calculation is only intended to be indicative of the influence that economic variables have on the probability of crisis.
25 Against this, it might be objected that this approach removes the information contained in the excluded models (three of the six), and that the liquidity framework is still under review and may yet be modified before it is implemented.
26 One would obtain the same result if one used the models that also account for liquidity requirements (the last column of Table 4).
27 An alternative approach would be to use the crisis probabilities’ corresponding estimated common equity Tier 1 capital level reported by the QIS, 5.7%, as the starting point. In this case, the crisis probability would fall from 2.4% to 0.45%, a decline of 1.95 percentage points, producing a median benefit of 1.23% of GDP. If one used the models that account for liquidity requirements, the decline in the crisis probability would be 1.45 percentage points and the median benefit would be 0.91% of GDP.
Assessment of the Macroeconomic Impact of Higher Loss Absorbency for Global Systemically Important Banks 19
When this is combined with meeting the liquidity standards, while also taking into account the complementarity between these standards, the credit spread increase is 14 basis points. This credit spread increase is estimated to lead to a decline in output of 0.09% relative to baseline for each percentage point of capital. This in turn translates into a 0.18% decline for the G-SIB framework and a 0.30% decline when the G-SIB framework is combined with Basel III. Such a figure is less than the maximum transitional impact estimated in Section 4 above, and would reflect a scenario in which GDP recovers some, but not all, of its transition-related losses.
6. Gone-concern loss absorbency
More effective, reliable and transparent resolution regimes should help to reduce the broader systemic impact of the weakness or failure of a large institution, by reducing uncertainty in the market as to the status of transactions between that institution and the broader system. Better resolution should also reduce moral hazard, by lowering the possibility that authorities will find themselves forced to bail out institutions in order to prevent a disorderly wind-down of a failed firm. The recommendations offered by the FSB’s Consultative Document on Effective Resolution in July 2011 cover such areas as expanded resolution and powers and tools for public authorities; improved cross-border cooperation arrangements; improved resolution planning by firms and authorities; and measures to remove obstacles to resolution arising from complex firm structures and business practices.
One of the possibilities discussed in the consultative document is the power to “bail in” unsecured and uninsured creditors at the point of resolution by writing down their claims or converting them into equity. The document notes: “The objective of bail-in is to reduce the loss of value and the economic disruption associated with insolvency proceedings for financial institutions, yet ensure that the costs of resolution are borne by the financial institutions’ shareholders and unsecured creditors.” Claim-holders might be granted warrants to compensate for the chance that haircuts or writedowns turn out to be excessively large. Such a mechanism should in principle reduce the impact of a financial crisis on the broader financial system and on the real economy, as well as the cost to taxpayers, although it would not necessarily reduce the probability of a crisis. However, more experience needs to be gained with these instruments before we can understand whether and how they might alter the behaviour of creditors (both of the affected bank and of other institutions) as a bank begins to experience distress.
At present, it is difficult to provide a rigorous quantitative assessment of the costs and benefits of these proposals. Resolution regimes are complex and differ dramatically across countries, formal resolutions of SIFIs have been rare, and both contractual and statutory bail-in instruments are essentially untested. A proper assessment would have to wait until more experience with the proposed tools is gained.
7. Non-modelled effects
As with any macroeconomic estimates, there are reasons why the actual costs and benefits could be higher or lower than those described here. The 2010 MAG reports identified a number of factors that cannot be easily captured by models. These included the capacity of equity markets to absorb new volumes of bank equity issuance, the ability of banks to make adjustments to their business models and cost structures, and the ability of non-bank financial channels to provide funding to compensate for any pullback in bank lending.
20 Assessment of the Macroeconomic Impact of Higher Loss Absorbency for Global Systemically Important Banks
Most of these factors suggest that increased capital requirements would be less likely to have a significant impact on the real economy if banks were allowed a longer transition period in which to implement these requirements. Thus, a longer transition period would reduce the strain on equity markets from a large volume of new issuance, allow banks more time to modify their business models, and permit the development of channels to substitute for bank lending. However, even if regulators allow longer transition periods, market pressures may force banks to adopt an accelerated schedule for building up capital, in which case these factors will again be relevant.
All of these factors are also relevant to the impact of increased loss absorbency requirements for G-SIBs. In addition, a number of factors unique to G-SIBs could also be relevant, such as the following:
• The macroeconomic costs could be greater if G-SIBs play an outsize role in some financial systems, as market leaders or as “hubs” for certain activities, so their need to alter their balance sheet structures could have outsize effects on the real economy.
• The macroeconomic costs could be lower if G-SIBs are not able to pass their higher capital costs on to borrowers because of competition from other banks, or if they achieve the necessary adjustments by shedding non-core assets or cutting costs.
• As discussed above, monetary policy can potentially offset some of the transitional costs, but its effectiveness is difficult to assess under conditions when policy rates in many economies are at or close to zero. Macroprudential policy measures may also alter the impact of regulatory changes.
• The benefits could be greater than is estimated here if weaknesses at G-SIBs play a uniquely important role in generating and exacerbating financial crises. This could be because of the psychological impact of a large failure or because of complex network effects. In this case, strengthening their capital positions well ahead of a potential crisis would lead to an especially strong reduction in the probability and/or impact of crises.
• G-SIBs play an important role in channelling liquidity and risk capital to emerging economies. This would further increase the benefits from reducing the risk of weaknesses or failures at these institutions.
• Alternatively, it could be argued that tighter rules on G-SIBs do not protect the system from poor risk-taking decisions by small and medium-sized banks, which, if replicated across many banks, could have the same systemic impact as the weakness or failure of a large institution. This would reduce the benefits from raising requirements on G-SIBs.
More experience with the G-SIB framework will be needed in order to gain a better understanding of the nature and magnitude of these effects.
8. Conclusion
Estimates of the costs and benefits of the proposed G-SIB framework are sensitive to assumptions about a number of matters, including the number of G-SIBs subjected to higher capital, the speed of implementation, the degree to which the behaviour of G-SIBs affects the wider financial system, the impact of monetary policy, the statistical concept we use to aggregate across models (means vs medians, unweighted vs GDP-weighted), and the effects of the contemporaneous implementation of liquidity requirements. We can, however, acquire a sense of the orders of magnitude of both costs and benefits under a reasonable range of assumptions.
Assessment of the Macroeconomic Impact of Higher Loss Absorbency for Global Systemically Important Banks 21
The transitional costs of increased capital on the top 30 potential G-SIBs, as measured by the unweighted median of the maximum impact on GDP, are quite small, in the order of 0.06% for each percentage point of capital. If monetary policy is unable to counteract the slowdown in growth, the impact is somewhat greater, reaching a peak impact of 0.10% of GDP relative to baseline in either a four-year or an eight-year implementation scenario. This is true whether the requirements are implemented over four years or eight years. A four-year implementation results in a greater subtraction from growth, because the same GDP decline is concentrated in a shorter period of time.
The maximum GDP impact of all components of the Basel III, including the overall increase in buffers and the G-SIB framework, is in the order of 0.34% for an eight-year implementation scenario. The resulting subtractions from growth are small – roughly 4 basis points in the eight-year case and slightly greater in the four-year case. This would be followed by a recovery in growth towards baseline. The LEI’s estimate for the long-term cost of the framework, based on conservative assumptions, suggests that a portion of these transitional costs would not be recovered, and that GDP would remain about 0.30% below baseline. This is equivalent to a one-time cost; GDP is projected to resume its normal pattern of growth, at a level 0.30% below where it would have been without the stronger regulatory standards.
The benefits of increased capital on G-SIBs depend on an additional array of assumptions, particularly whether one assumes crises have a permanent or temporary effect on output. If one takes the median of all estimates of crisis costs, the analysis in the LEI report suggests that the G-SIB framework by itself can have an annual benefit ranging from 0.38 to 0.47% of pre-crisis GDP, depending on whether one uses a model that separately takes account of the impact of liquidity requirements. The combined benefits of Basel III and the G-SIB framework come to as much as 2½ % of pre-crisis GDP.
It should be emphasised that the benefits estimated in the LEI project are in effect received every year, since they correspond to the elimination of the risk of a costly financial crisis. They would thus be best compared to the annual subtractions from growth estimated by the MAG. In this case, the benefits far outweigh the costs, which are in the order of 1 to 1.5 basis points for the G-SIB framework alone, and 4–7 basis points for the Basel III and G-SIB reforms combined. The benefits also compare favourably with the one-time cost to GDP estimated (under the conservative assumption of a constant return on bank equity) by the LEI.
A number of factors may lead to a stronger transitional growth impact than is estimated here. These factors include limitations to the ability of monetary policy to respond to slower growth, the possibility that banks will respond by cutting back on credit more sharply than the rise in credit spreads would indicate, or the possibility that the behaviour of G-SIBs has an outsize influence on the macroeconomy. There is an open discussion about the possible role for macroprudential policy in counteracting a potential sharp negative impact on growth. Similarly, the benefits could be overstated, since some of the models used in estimating them look at system-wide capital increases rather than increases on G-SIBs alone. But even taking these factors into account, the benefits of stronger capital standards are likely to be significantly greater than the costs.
22 Assessment of the Macroeconomic Impact of Higher Loss Absorbency for Global Systemically Important Banks

Annex 1: Participants in the Macroeconomic Assessment Group
(The names in bold are of the primary representatives of the respective institutions.)
Chairman Stephen G Cecchetti Bank for International Settlements
Reserve Bank of Australia Penelope Smith Luci Ellis
Central Bank of Brazil Marcos Ribeiro de Castro
Bank of Canada Césaire Meh Sami Alpanda Carlos De Resende Jose Dorich Nikita Perevalov Hani Soubra
People’s Bank of China Jia Yandong Zheng Guihuan Wang Yu
Bank of France Laurent Clerc
Deutsche Bundesbank Thilo Liebig Alexander Schulz Barbara Meller
Bank of Italy Alberto Locarno Michele Caivano
Bank of Japan Tomoki Tanemura Ryoma Ikeda Hiro Ishizaki
Financial Services Agency, Japan Satoshi Ikeda
Bank of Korea Hoon Kim Jaemin Ryu Hyeonsoo Kim
Bank of Mexico Daniel Samano Peñaloza
Netherlands Bank Jan Willem van den End
Bank of Spain Ángel Gavilán
Swiss National Bank Jean-Marc Natal Robert Bichsel
Bank of England David Aikman
Assessment of the Macroeconomic Impact of Higher Loss Absorbency for Global Systemically Important Banks 23
Financial Services Authority, UK Peter Andrews Michael Straughan
Board of Governors of the Federal Reserve System
Michael Kiley Jae Sim
Federal Reserve Bank of New York Simon Potter
European Commission Werner Roeger
European Central Bank Frank Smets Laurent Maurin Diego Rodríguez-Palenzuela
International Monetary Fund Scott Roger Francis Vitek
Financial Stability Board Nigel Jenkinson
Basel Committee on Banking Supervision Neil Esho
Bank for International Settlements Benjamin Cohen (Secretary) Stefan Avdjiev Jhuvesh Sobrun
24 Assessment of the Macroeconomic Impact of Higher Loss Absorbency for Global Systemically Important Banks

Annex 2: Conversion from LEI equity capital ratios to Basel III equity capital ratios
The discussion of the benefits of higher capital ratios for G-SIBs in the main text rests on the meta-analysis in the LEI report of a set of studies that relate capital ratios to the probability of a banking crisis. These results are used to draw conclusions about the benefits of various levels of bank capital. However, the capital ratios used in those studies utilised definitions of risk-weighted assets and of equity capital that have been modified by the Basel III framework. Basel III introduced significant changes in deductions, exemptions and risk weights. Since these affect each bank differently depending on its asset mix and capital structure, a sensible way to translate the capital ratios used in the LEI study to Basel III capital ratios is to make use of statistical relationships revealed by the QIS and by the LEI itself.
Step 1: Adjustments to capital
The QIS indicates that
Tier 1 (Basel 2) = 1.5*TCE (Basel 3) (1)
Table A5.1 of the LEI (columns 1 and 3, averages across EU and US banks) shows that
Tier 1 (Basel 2) = 1.225*TCE (Basel 2) (2)
Combining (1) and (2)
TCE (Basel 3) = 0.8167*TCE (as used by the LEI) (3)
Step 2: Adjustments to risk-weighted assets
The QIS indicates that on average
RWA (Basel 3) = 1.23*RWA (LEI) (4)
Step 3: Adjustments to the capital ratio
Combining (3) and (4) provides an adjustment factor of 0.66, as
TCE/RWA (Basel 3) = (0.8167/1.23) TCE/RWA (LEI)
= 0.66 TCE/RWA (LEI)
Assessment of the Macroeconomic Impact of Higher Loss Absorbency for Global Systemically Important Banks 25
Annex 3: Benefits of higher loss absorbency for G-SIBs28
In this annex, we develop two approaches to illustrate the benefits of higher loss absorbency for G-SIBs. Both approaches are based on bank-level data, and support the view that, following an adverse shock, the perception of the risk of an institution increases with its systemic nature. This shows how higher loss absorbency can help to maintain the resilience of such institutions at the level of the overall banking system.
In the LEI report, several methods were implemented to estimate the benefits of higher capital requirements implemented on the whole banking system. Under some of them, probit equations were estimated to explain the probability of experiencing a financial crisis.29 The estimated relations were based on binary indications of the occurrence of a financial crisis, and the explanatory variables were either financial macroeconomic indicators or aggregated bank variables.
The high level of concentration, across banks or countries, across time and across events is likely to miss important specificities and limit the extent to which the LEI results by themselves can shed light on the benefits of the policy envisaged for the G-SIBs. Analysing a policy setting higher capital requirements on larger banks requires isolating the risk characteristics of smaller and larger banks, so as to illustrate how differences in the transmission mechanisms may justify targeted policies. Furthermore, the banking sector has recorded large changes since the beginning of the 1980s, with the progressive strengthening of the G-SIBs, along with the increased financial integration of the world economy. Given their cross-border exposure, these institutions are typically not tightly constrained by the local economic conditions but instead depend on overall worldwide financial markets and economic conditions.
In the first approach discussed in this annex, the link between the market perception of risk of default and the individual characteristics of banks is estimated. Empirical estimates of this link suggest that the perception of risk in the banks’ balance sheet is amplified for large institutions while weakened for better capitalised institutions, thereby suggesting that a capital ratio increasing with the size of the institution could equilibrate the risk across banks.
In the second approach, bivariate models of value-at-risk (VaR) are used to estimate the impact of a shock to the banking sector as a whole on the market valuation of each institution. The results suggest important differences across institutions. The findings would support the implementation of asymmetric capital requirements to cope with the potentially larger losses in marked to market capital suffered by the most systematically important institutions in case of financial distress.
Risk in bank balance sheets and risk perceived by the market
In this first approach, the link between the market perception of the risk of an institution and some of its individual characteristics is estimated with data from a panel of SIFIs. A wide range of indicators are tested to characterise, at the level of each bank, the risk in the bank balance sheet and the capacity to generate income. In the models, an interaction term is introduced to link the risk and the size, on the one hand, and the risk and the capital ratio, on the other. Hence, the models make it possible to analyse how the relationship between the
28 This annex was prepared by Laurent Maurin of the ECB. 29 See Basel Committee (2010a), Barrell et al (2010) and Kato et al (2010).
26 Assessment of the Macroeconomic Impact of Higher Loss Absorbency for Global Systemically Important Banks
risk perceived and the characteristics of the banks changes with the size of the institution and its degree of capitalisation.
The perceived risk of each bank, Zi, is specified as a function of a vector of bank-specific characteristics, income (INC), risk (RISK) and a variable, X, which reflects either the size or the capital ratio. Other factors that are not easily quantifiable – such as a business model, a bank’s strategy and specificities in the market in which the bank operates, which may all influence the perceived risk of each bank – are captured through the bank-specific intercept term, αi. Two broad categories of factors are expected to influence the perceived risk: a set of variables referring to the bank’s capacity to generate income and accumulate capital, INC, and a set related to the bank’s level of risk in the balance sheet, RISK. X represents the structural indicator which is added as an interaction term with RISK. We consider the interaction between risk and size, SIZE, on the one hand, and risk and capital ratio, RATIO, on the other.
The market perception of risk in the balance sheet is magnified for large institutions if the coefficient ϕsize in equation (1) is positive and significant. It is reduced by the degree of capitalisation if the coefficient ϕratio in equation (1) is positive and significant.
ikt
r
i
ikt
Xk
q
k
ikt
RISKk
p
k
ikt
INCki
it XRISKRISKINCZ −
=−
=−
=− +++= ....
111ϕθθα (1)
Our dataset is based on the balance sheets and income statements of euro area listed banks available from Thomson Reuters’ DataStream. It refers to 51 listed banks headquartered in Austria, Belgium, France, Germany, Greece, Italy, the Netherlands, Portugal and Spain. Data are collected at the consolidated group level, including subsidiaries and branches of individual banks.30 While observations are available before 2006, we focus on the most recent period, around the financial crisis, starting in the first quarter of 2006 and ending in the last quarter of 2010.31
Although the majority of banks report balance sheet and income statements on a quarterly basis, some banks publish interim reports only biannually. In this case, in order to ensure a large sample, the biannual data are extended to quarterly frequency by means of interpolation. Finally, in order to minimise the influence by outliers, the dataset is then censored at the 5% and 95% level prior to the estimation.32
Market perception of risk, Z, is measured on the basis of expected default frequencies (EDFs) computed by Moody’s KMV. The EDFs provide an estimate of the probability that a firm will default within a given time horizon (typically one year), based on equity prices and volatility and balance sheet data. They complement the indicators derived from balance sheet ratios and market credit risk indicators (such as corporate bond spreads and credit rating changes). From the beginning of the 2000s, the EDFs of euro area listed banks remained stable at a low level, before increasing abruptly in the wake of the financial crisis (Graph A3.1). This is true for both the mean and the dispersion as measured by the inter-quartile range, since the EDFs of the high-risk banks increased much more than those of the low-risk banks.
30 In order to avoid double-counting, individual subsidiaries reported are not included in the sample. 31 The period may contain structural breaks, due for instance to the implementation of Basel II, the setting-up of
Basel III, or the public injections of capital during the financial crisis. However, it is not possible to properly account for them given the data publicly available, and the relatively short sample of 5.5 years.
32 For more information, see Maurin and Toivanen (2011).
Assessment of the Macroeconomic Impact of Higher Loss Absorbency for Global Systemically Important Banks 27
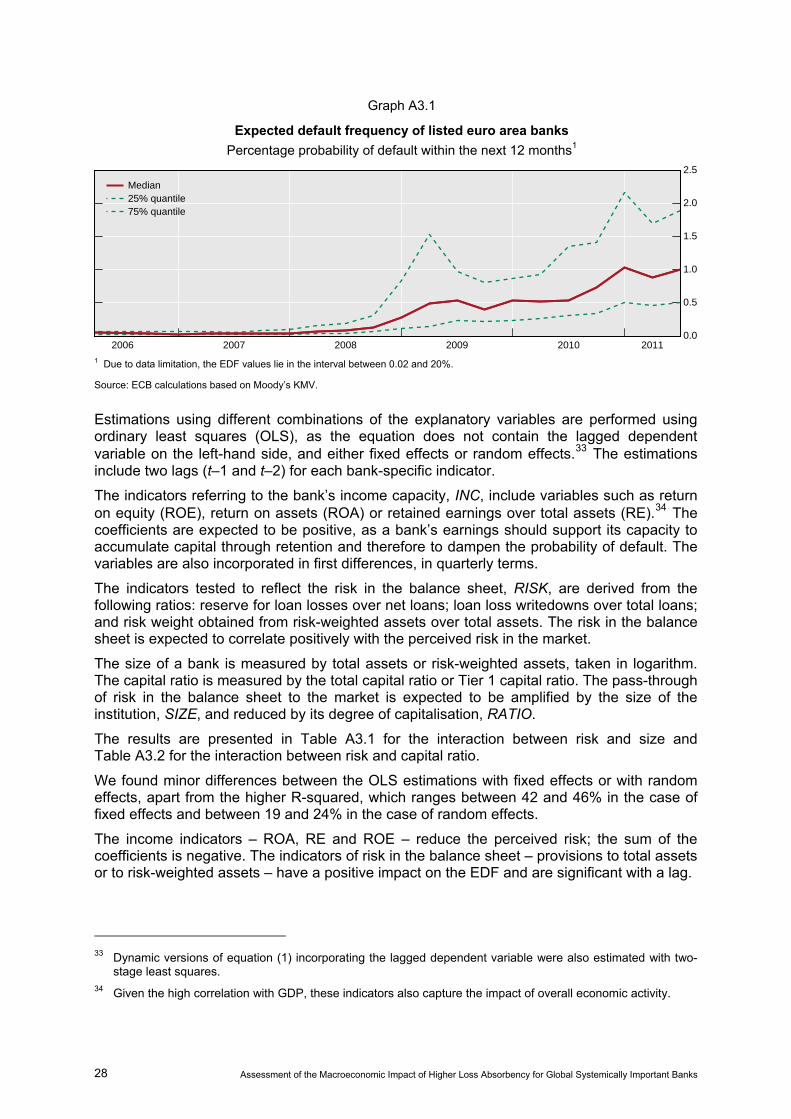
Graph A3.1
Expected default frequency of listed euro area banks
Percentage probability of default within the next 12 months1
0.0
0.5
1.0
1.5
2.0
2.5
2006 2007 2008 2009 2010 2011
Median25% quantile75% quantile
1 Due to data limitation, the EDF values lie in the interval between 0.02 and 20%.
Source: ECB calculations based on Moody’s KMV.
Estimations using different combinations of the explanatory variables are performed using ordinary least squares (OLS), as the equation does not contain the lagged dependent variable on the left-hand side, and either fixed effects or random effects.33 The estimations include two lags (t–1 and t–2) for each bank-specific indicator.
The indicators referring to the bank’s income capacity, INC, include variables such as return on equity (ROE), return on assets (ROA) or retained earnings over total assets (RE).34 The coefficients are expected to be positive, as a bank’s earnings should support its capacity to accumulate capital through retention and therefore to dampen the probability of default. The variables are also incorporated in first differences, in quarterly terms.
The indicators tested to reflect the risk in the balance sheet, RISK, are derived from the following ratios: reserve for loan losses over net loans; loan loss writedowns over total loans; and risk weight obtained from risk-weighted assets over total assets. The risk in the balance sheet is expected to correlate positively with the perceived risk in the market.
The size of a bank is measured by total assets or risk-weighted assets, taken in logarithm. The capital ratio is measured by the total capital ratio or Tier 1 capital ratio. The pass-through of risk in the balance sheet to the market is expected to be amplified by the size of the institution, SIZE, and reduced by its degree of capitalisation, RATIO.
The results are presented in Table A3.1 for the interaction between risk and size and Table A3.2 for the interaction between risk and capital ratio.
We found minor differences between the OLS estimations with fixed effects or with random effects, apart from the higher R-squared, which ranges between 42 and 46% in the case of fixed effects and between 19 and 24% in the case of random effects.
The income indicators – ROA, RE and ROE – reduce the perceived risk; the sum of the coefficients is negative. The indicators of risk in the balance sheet – provisions to total assets or to risk-weighted assets – have a positive impact on the EDF and are significant with a lag.
33 Dynamic versions of equation (1) incorporating the lagged dependent variable were also estimated with two-
stage least squares. 34 Given the high correlation with GDP, these indicators also capture the impact of overall economic activity.
28 Assessment of the Macroeconomic Impact of Higher Loss Absorbency for Global Systemically Important Banks
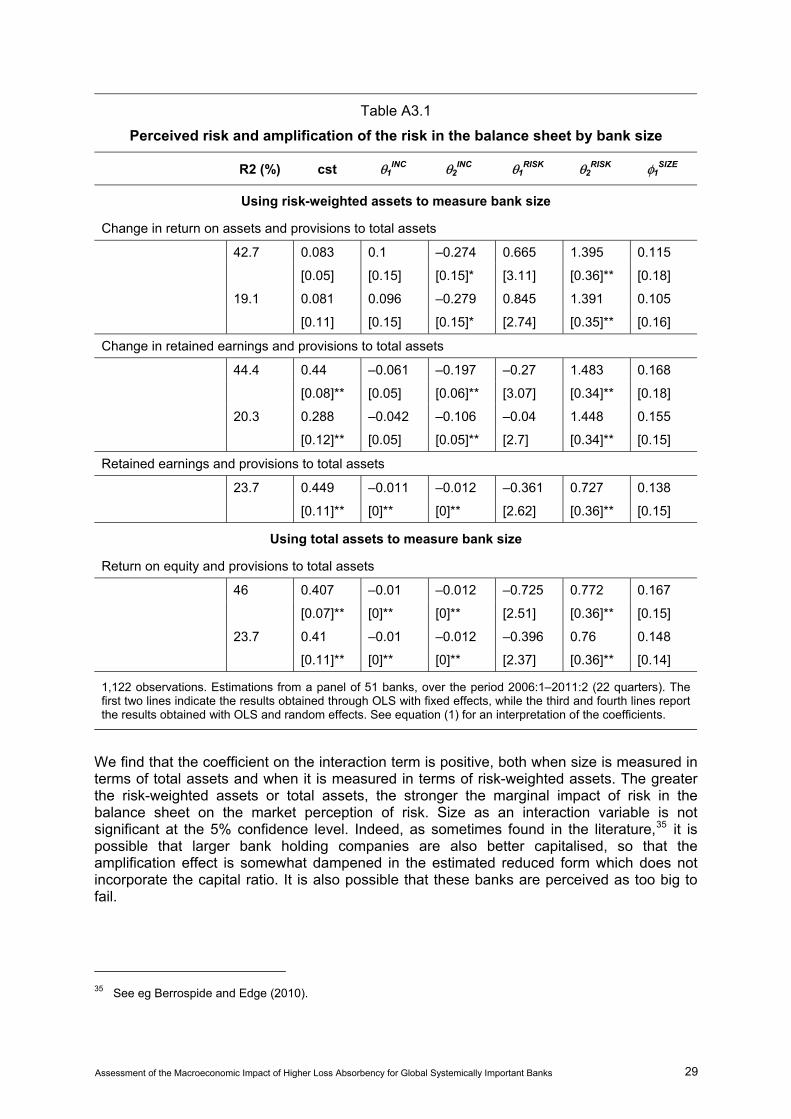
Table A3.1
Perceived risk and amplification of the risk in the balance sheet by bank size
R2 (%) cst θ1INC θ2
INC θ1RISK θ2
RISK φ1SIZE
Using risk-weighted assets to measure bank size
Change in return on assets and provisions to total assets
42.7 0.083 0.1 –0.274 0.665 1.395 0.115
[0.05] [0.15] [0.15]* [3.11] [0.36]** [0.18]
19.1 0.081 0.096 –0.279 0.845 1.391 0.105
[0.11] [0.15] [0.15]* [2.74] [0.35]** [0.16]
Change in retained earnings and provisions to total assets
44.4 0.44 –0.061 –0.197 –0.27 1.483 0.168
[0.08]** [0.05] [0.06]** [3.07] [0.34]** [0.18]
20.3 0.288 –0.042 –0.106 –0.04 1.448 0.155
[0.12]** [0.05] [0.05]** [2.7] [0.34]** [0.15]
Retained earnings and provisions to total assets
23.7 0.449 –0.011 –0.012 –0.361 0.727 0.138
[0.11]** [0]** [0]** [2.62] [0.36]** [0.15]
Using total assets to measure bank size
Return on equity and provisions to total assets
46 0.407 –0.01 –0.012 –0.725 0.772 0.167
[0.07]** [0]** [0]** [2.51] [0.36]** [0.15]
23.7 0.41 –0.01 –0.012 –0.396 0.76 0.148
[0.11]** [0]** [0]** [2.37] [0.36]** [0.14]
1,122 observations. Estimations from a panel of 51 banks, over the period 2006:1–2011:2 (22 quarters). The first two lines indicate the results obtained through OLS with fixed effects, while the third and fourth lines report the results obtained with OLS and random effects. See equation (1) for an interpretation of the coefficients.
We find that the coefficient on the interaction term is positive, both when size is measured in terms of total assets and when it is measured in terms of risk-weighted assets. The greater the risk-weighted assets or total assets, the stronger the marginal impact of risk in the balance sheet on the market perception of risk. Size as an interaction variable is not significant at the 5% confidence level. Indeed, as sometimes found in the literature,35 it is possible that larger bank holding companies are also better capitalised, so that the amplification effect is somewhat dampened in the estimated reduced form which does not incorporate the capital ratio. It is also possible that these banks are perceived as too big to fail.
35 See eg Berrospide and Edge (2010).
Assessment of the Macroeconomic Impact of Higher Loss Absorbency for Global Systemically Important Banks 29
We then turn to the estimation with the capital ratio as an interaction variable (Table A3.2). Indicators of income are again negative and significant. Risk weight and change in risk weight have a positive effect and are statistically significant, confirming the connection between the risk in a bank’s balance sheet and its riskiness as perceived by the market.
The EDFs are negatively affected by the product of the risk and the capital ratio. A higher bank capital ratio reduces the pass-through of the risk in the balance sheet to risk as perceived by the market. This can be interpreted as reflecting markets’ assessment that, for the same level of risk, the default probability is lower when the bank is better capitalised. Again, the results are not sensitive to the capital ratio used in the estimation.
To conclude, the estimated coefficients are in line with our expectations. The capacity to generate income contributes negatively to the risk perceived by the market, while, not surprisingly, the risk in the balance sheet of the institution affects the market perception of that risk. The perceived risk of an institution is amplified by its size and dampened by its degree of capitalisation. Together, the results suggest that a capital ratio increasing with the size of the institution could equilibrate risk across banks.
Asymmetric reaction of SIBs in times of market distress
In the section above, we focused on the propagation of risk across banks, from the balance sheet to the market perception. Conversely, in this section, we focus on the impact of market shocks on banks. Here, we implement regression quantile estimates which are known to be robust to extreme values. This is arguably important, since situations of severe financial strain are tail events, and we intend to portray the responses of individual financial institutions to market shocks especially under such rare circumstances.
We use a value-at-risk (VaR) concept for our measure of risk.36 The VaR of each institution, VaRi, corresponds to the maximum value it can lose with a given probability over a given horizon. We consider the case where the value is the stock market value and the limit probability is 1%. Hence, in equation (2), VaRi is the maximum stock market valuation loss that the institution would suffer at a 1% probability. Put another way, there is a 99% chance that its returns will be greater than VaRi.
( ) %1)max( =<= ii VaRreturnprobthatsuchreturnVaR (2)
We consider 22 large global banks headquartered in the European Union.37 The sample includes daily closing prices from 1 January 2000 to 31 August 2011. The data were downloaded from DataStream and transformed to weekly frequency. Weekly returns were computed as the log difference of weekly closing prices and expressed in percentage terms. The proxy for the overall index used in each bivariate quantile estimation is the EU-DS Banks – PRICE INDEX in euros, as provided by DataStream. We estimate 22 bivariate 1% quantile models between the index and each bank in the sample.
36 See Corradin et al (2011). For more technical background, see White et al (2011) and Adrian and
Brunnermeier (2010). 37 Banco Santander, Barclays, BBV Argentaria, BNP Paribas, Commerzbank, Danske Bank, Deutsche Bank,
Dexia, Erste Group Bank, HSBC, ING Groep, Intesa Sanpaolo, KBC Group, Lloyds Banking Group, Natixis, Nordea Bank, Royal Bank of Scotland Group, SEB, Société Générale, Standard Chartered, Svenska Handelsbanken and Unicredit.
30 Assessment of the Macroeconomic Impact of Higher Loss Absorbency for Global Systemically Important Banks
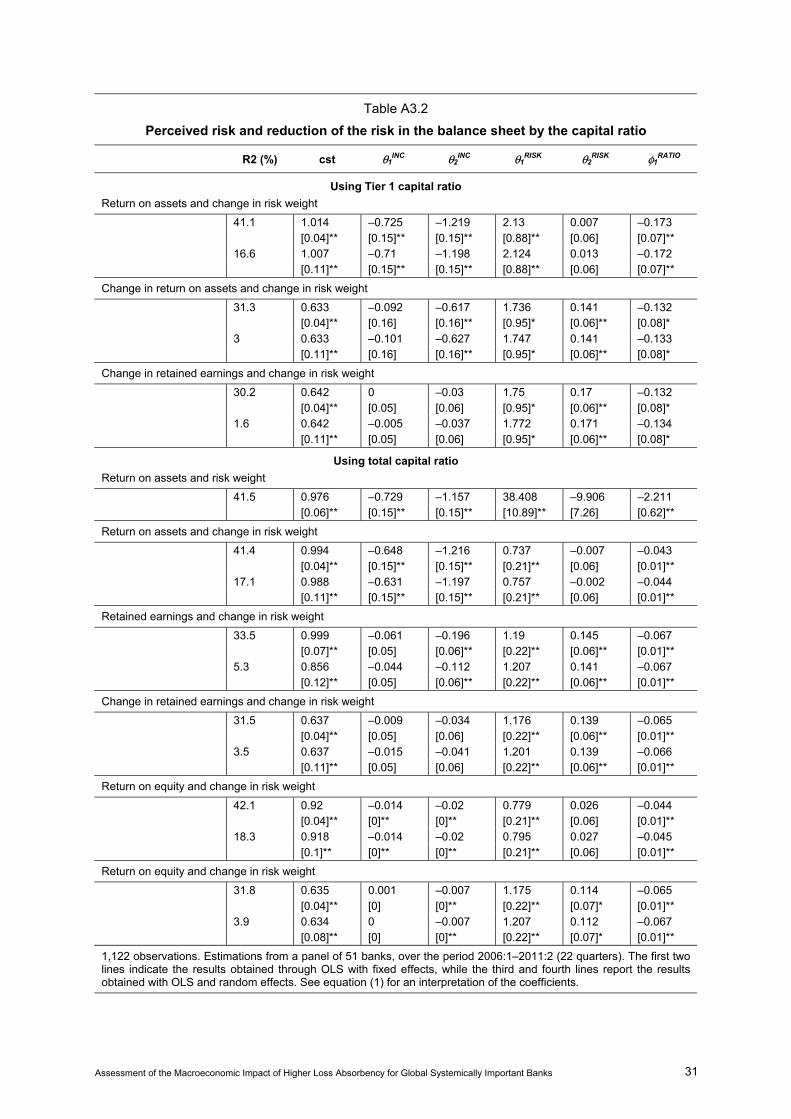
Table A3.2
Perceived risk and reduction of the risk in the balance sheet by the capital ratio
R2 (%) cst θ1
INC θ2INC θ1
RISK θ2RISK φ1
RATIO
Using Tier 1 capital ratio
Return on assets and change in risk weight
41.1 1.014 –0.725 –1.219 2.13 0.007 –0.173 [0.04]** [0.15]** [0.15]** [0.88]** [0.06] [0.07]** 16.6 1.007 –0.71 –1.198 2.124 0.013 –0.172 [0.11]** [0.15]** [0.15]** [0.88]** [0.06] [0.07]**
Change in return on assets and change in risk weight
31.3 0.633 –0.092 –0.617 1.736 0.141 –0.132 [0.04]** [0.16] [0.16]** [0.95]* [0.06]** [0.08]* 3 0.633 –0.101 –0.627 1.747 0.141 –0.133 [0.11]** [0.16] [0.16]** [0.95]* [0.06]** [0.08]*
Change in retained earnings and change in risk weight
30.2 0.642 0 –0.03 1.75 0.17 –0.132 [0.04]** [0.05] [0.06] [0.95]* [0.06]** [0.08]* 1.6 0.642 –0.005 –0.037 1.772 0.171 –0.134 [0.11]** [0.05] [0.06] [0.95]* [0.06]** [0.08]*
Using total capital ratio
Return on assets and risk weight
41.5 0.976 –0.729 –1.157 38.408 –9.906 –2.211 [0.06]** [0.15]** [0.15]** [10.89]** [7.26] [0.62]**
Return on assets and change in risk weight
41.4 0.994 –0.648 –1.216 0.737 –0.007 –0.043 [0.04]** [0.15]** [0.15]** [0.21]** [0.06] [0.01]** 17.1 0.988 –0.631 –1.197 0.757 –0.002 –0.044 [0.11]** [0.15]** [0.15]** [0.21]** [0.06] [0.01]**
Retained earnings and change in risk weight
33.5 0.999 –0.061 –0.196 1.19 0.145 –0.067 [0.07]** [0.05] [0.06]** [0.22]** [0.06]** [0.01]** 5.3 0.856 –0.044 –0.112 1.207 0.141 –0.067 [0.12]** [0.05] [0.06]** [0.22]** [0.06]** [0.01]**
Change in retained earnings and change in risk weight
31.5 0.637 –0.009 –0.034 1.176 0.139 –0.065 [0.04]** [0.05] [0.06] [0.22]** [0.06]** [0.01]** 3.5 0.637 –0.015 –0.041 1.201 0.139 –0.066 [0.11]** [0.05] [0.06] [0.22]** [0.06]** [0.01]**
Return on equity and change in risk weight
42.1 0.92 –0.014 –0.02 0.779 0.026 –0.044 [0.04]** [0]** [0]** [0.21]** [0.06] [0.01]** 18.3 0.918 –0.014 –0.02 0.795 0.027 –0.045 [0.1]** [0]** [0]** [0.21]** [0.06] [0.01]**
Return on equity and change in risk weight
31.8 0.635 0.001 –0.007 1.175 0.114 –0.065 [0.04]** [0] [0]** [0.22]** [0.07]* [0.01]** 3.9 0.634 0 –0.007 1.207 0.112 –0.067 [0.08]** [0] [0]** [0.22]** [0.07]* [0.01]**
1,122 observations. Estimations from a panel of 51 banks, over the period 2006:1–2011:2 (22 quarters). The first two lines indicate the results obtained through OLS with fixed effects, while the third and fourth lines report the results obtained with OLS and random effects. See equation (1) for an interpretation of the coefficients.
Assessment of the Macroeconomic Impact of Higher Loss Absorbency for Global Systemically Important Banks 31
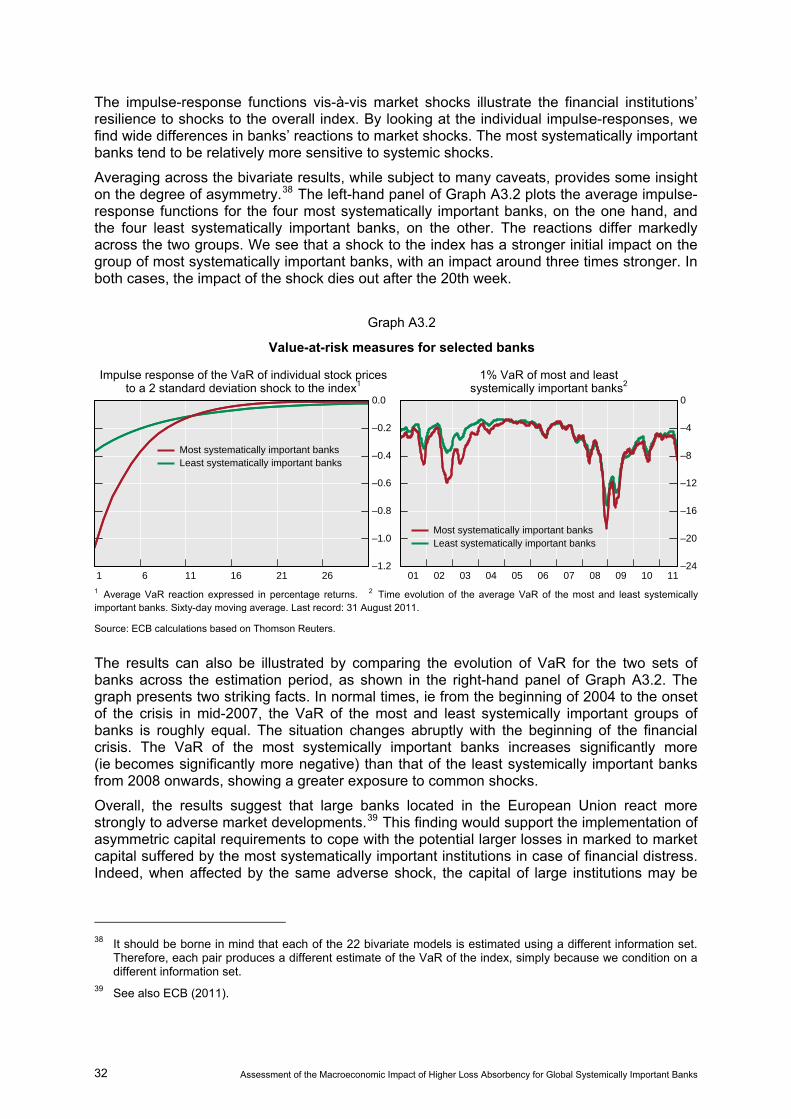
The impulse-response functions vis-à-vis market shocks illustrate the financial institutions’ resilience to shocks to the overall index. By looking at the individual impulse-responses, we find wide differences in banks’ reactions to market shocks. The most systematically important banks tend to be relatively more sensitive to systemic shocks.
Averaging across the bivariate results, while subject to many caveats, provides some insight on the degree of asymmetry.38 The left-hand panel of Graph A3.2 plots the average impulse-response functions for the four most systematically important banks, on the one hand, and the four least systematically important banks, on the other. The reactions differ markedly across the two groups. We see that a shock to the index has a stronger initial impact on the group of most systematically important banks, with an impact around three times stronger. In both cases, the impact of the shock dies out after the 20th week.
Graph A3.2
Value-at-risk measures for selected banks
Impulse response of the VaR of individual stock prices to a 2 standard deviation shock to the index1
1% VaR of most and least systemically important banks2
–1.2
–1.0
–0.8
–0.6
–0.4
–0.2
0.0
1 6 11 16 21 26
Most systematically important banksLeast systematically important banks
–24
–20
–16
–12
–8
–4
0
01 02 03 04 05 06 07 08 09 10 11
Most systematically important banksLeast systematically important banks
1 Average VaR reaction expressed in percentage returns. 2 Time evolution of the average VaR of the most and least systemically important banks. Sixty-day moving average. Last record: 31 August 2011.
Source: ECB calculations based on Thomson Reuters.
The results can also be illustrated by comparing the evolution of VaR for the two sets of banks across the estimation period, as shown in the right-hand panel of Graph A3.2. The graph presents two striking facts. In normal times, ie from the beginning of 2004 to the onset of the crisis in mid-2007, the VaR of the most and least systemically important groups of banks is roughly equal. The situation changes abruptly with the beginning of the financial crisis. The VaR of the most systemically important banks increases significantly more (ie becomes significantly more negative) than that of the least systemically important banks from 2008 onwards, showing a greater exposure to common shocks.
Overall, the results suggest that large banks located in the European Union react more strongly to adverse market developments.39 This finding would support the implementation of asymmetric capital requirements to cope with the potential larger losses in marked to market capital suffered by the most systematically important institutions in case of financial distress. Indeed, when affected by the same adverse shock, the capital of large institutions may be
38 It should be borne in mind that each of the 22 bivariate models is estimated using a different information set.
Therefore, each pair produces a different estimate of the VaR of the index, simply because we condition on a different information set.
39 See also ECB (2011).
32 Assessment of the Macroeconomic Impact of Higher Loss Absorbency for Global Systemically Important Banks

more depleted. This reaction would justify the adoption of a policy rule linking the capital requirement to the size of the institution, since such a policy would reduce the probability or amount of public capital injection in extreme cases.
Assessment of the Macroeconomic Impact of Higher Loss Absorbency for Global Systemically Important Banks 33
Annex 4: References
Admati, A, P DeMarzo, M Hellwig and P Pfleiderer (2011): “Fallacies, irrelevant facts, and myths in the discussion of capital regulation: why bank equity is not expensive”, Rock Center for Corporate Governance at Stanford University Working Paper no 86.
Adrian, T and M Brunnermeier (2010): “CoVaR”, Federal Reserve Bank of New York, Staff Reports, no 348.
Angelini, P, S Neri and F Panetta (2011): “Grafting macroprudential policies in a macroeconomic framework: choice of optimal instruments and interaction with monetary policy”, Bank of Italy Working Papers, no 801, March.
Barrell, R, E Davis, D Karim and I Liadze (2010): “The impact of global imbalances: does the current account balance help to predict banking crisis in OECD countries”, NIESR, mimeo.
Basel Committee on Banking Supervision (2010a): An assessment of the long-term economic impact of stronger capital and liquidity requirements, August.
______ (2010b): Results of the Quantitative Impact Study, December.
______ (2011a): Global systemically important banks: assessment methodology and the additional loss absorbency requirement – consultative document, July.
______ (2011b): “The transmission channels between the financial and real sectors: a critical survey of the literature”, BCBS Working Papers, no 18, February.
Berrospide, J and R Edge (2010): “The effects of bank capital on lending: what do we know, and what does it mean?”, International Journal of Central Banking, vol 6, no 4, December, pp 5–54.
Committee on Payment and Settlement Systems and Technical Committee of the International Organisation of Securities Commissions (2011): Principles for financial market infrastructures – consultative report, March.
Corradin, S, S Manganelli and B Schwaab (2011): “New methodologies for systemic risk measurement”, ECB research Bulletin, Spring.
European Central Bank (2011): “Systemic risk methodologies”, Financial Stability Review, June, pp 141–8.
Financial Stability Board (2010a): Reducing the moral hazard posed by systemically important financial institutions: FSB recommendations and time lines, November.
______ (2010b): Intensity and effectiveness of SIFI supervision: recommendations for enhanced supervision, November.
______ (2011): Effective resolution of systemically important financial institutions: recommendations and timelines, July.
Kashyap, A, J Stein and S Hanson (2010): “An analysis of the impact of ‘substantially heightened’ capital requirements on financial institutions”, working paper, May.
Kato, R, S Kobayashi and Y Saita (2010): “Calibrating the level of capital: the way we see it”, Bank of Japan Working Paper.
Macroeconomic Assessment Group (2010a): Interim report: assessing the macroeconomic impact of the transition to stronger capital and liquidity requirements, August.
______ (2010b): Final report: assessing the macroeconomic impact of the transition to stronger capital and liquidity requirements, December.
34 Assessment of the Macroeconomic Impact of Higher Loss Absorbency for Global Systemically Important Banks

Assessment of the Macroeconomic Impact of Higher Loss Absorbency for Global Systemically Important Banks 35
Maurin L and M Toivanen (2011): Risk, capital buffers and bank lending: a granular approach to the adjustment of euro area banks, European Conference on Banking and the Economy, Southampton, September.
Modigliani, F and M Miller (1958): “The cost of capital, corporation finance and the theory of investment”, American Economic Review, vol 48, pp 261–97.
White, H, T-H Kim and S Manganelli (2011): “VAR for VaR: measuring systemic risk using multivariate regression quantiles”, ECB Working Paper, forthcoming.