Assessing the Workforce Outcomes of Maryland Science,
32
Submitted by: Maryland Longitudinal Data System Center Ross Goldstein, Executive Director Michael E. Woolley, Ph.D., Principal Investigator Angela K. Henneberger, Ph.D., Director of Research Prepared by: Xiaying Zheng, MA 1 Laura M. Stapleton, Ph.D. 1 Angela K. Henneberger, Ph.D. 2 Michael E. Woolley, Ph.D. 2 1 University of Maryland, College Park 2 University of Maryland, Baltimore June 2016 Assessing the Workforce Outcomes of Maryland Science, Technology, Engineering, and Math (STEM) Postsecondary Graduates
Transcript of Assessing the Workforce Outcomes of Maryland Science,

Submitted by: Maryland Longitudinal Data System Center
Ross Goldstein, Executive Director Michael E. Woolley, Ph.D., Principal Investigator Angela K. Henneberger, Ph.D., Director of Research
Prepared by: Xiaying Zheng, MA 1
Laura M. Stapleton, Ph.D. 1
Angela K. Henneberger, Ph.D. 2
Michael E. Woolley, Ph.D. 2
1 University of Maryland, College Park 2 University of Maryland, Baltimore
June 2016
Assessing the Workforce Outcomes of Maryland Science, Technology, Engineering, and Math (STEM) Postsecondary Graduates

ii
Maryland Longitudinal Data System Center 550 West Baltimore Street
Baltimore, MD 21201 410-706-2085
[email protected] http://mldscenter.maryland.gov/
Ross Goldstein
Executive Director
James D. Fielder, Jr., Ph.D. Secretary of Higher Education, Chair MLDS Governing Board
Larry Hogan
Governor
© Maryland Longitudinal Data System Center 2016
Suggested Citation
Zheng, X., Stapleton, L. M., Henneberger, A. K., & Woolley, M. E. (2016). Assessing the Workforce
Outcomes of Maryland Science, Technology, Engineering, and Math (STEM) Postsecondary
Graduates. Baltimore, MD: Maryland Longitudinal Data System Center.
Acknowledgement
This report was prepared by the Research Branch of the Maryland Longitudinal Data System Center
(MLDSC). This report was developed under a grant from the Department of Education in fulfillment of
the Maryland State Department of Education 2012 SLDS Grant (Project 5.1. Assess STEM post-graduate
student regional job acceptance and work retention). The content of this publication does not
necessarily reflect the views or policies of the Institute of Education Sciences or the U.S. Department of
Education, and you should not assume endorsement by the federal government. The Research Branch
would like to thank the entire staff of the MLDSC for their assistance with this report.
If you have questions regarding this publication, please contact [email protected].

iii
Table of Contents
Executive Summary v
Introduction 1
A STEM Student/Worker Shortage? 1
Women and Minorities in STEM 2
Preparing Maryland STEM Postsecondary Graduates 3
Table 1: Maryland Postsecondary STEM Degrees Earned by Degree Level and Year 4
Figure 1: Maryland Postsecondary STEM Degrees Earned by Degree Level and Year 4
Table 2: Demographics of Maryland STEM Degree Earners, 2008-09 to 2012-13 5
Table 3: Demographics of Maryland Degree Earners across All Disciplines, 2008-09 to 2012-13 6
Workforce Outcomes of Maryland STEM Postsecondary Graduates 7
Table 4: Status of Maryland STEM Graduates, 2008-09 to 2012-13, First Calendar Year after Graduation 7
Figure 2: Distribution of Maryland STEM Graduates’ Four-Quarter Wages in the First Calendar Year after Graduation, 2008-09 to 2012-13
8
Table 5: Distribution of Maryland STEM Graduates’ Four-Quarter Wages in the First Calendar Year after Graduation, 2008-09 to 2012-13
9
Table 6: Distribution of Four Quarter Wages in the First Calendar Year after Graduation for Maryland STEM Bachelor’s and Master’s Degree Earners by Program Area, 2008-09 to 2012-13
10
Table 7: Top 3 Industries Employing Maryland STEM Bachelor’s Degree Earners for Four Quarters in the First Calendar Year after Graduation, 2008-09 to 2012-13
11
Table 8: Top 3 Industries Employing Maryland STEM Master’s Degree Earners for Four Quarters in the First Calendar Year after Graduation, 2008-09 to 2012-13
12
Retaining Maryland STEM Postsecondary Graduates in the Maryland Workforce 13
Table 9: Retention of Maryland STEM Certificate Earners who were Working Four Quarters in the First Calendar Year after Graduation
14
Table 10: Retention of Maryland STEM Associate Degree Earners who were Working Four Quarters in the First Calendar Year after Graduation
15
Table 11a: Retention of Maryland STEM In-state Bachelor’s Degree Earners who were Working Four Quarters in the First Calendar Year after Graduation
16
Table 11b: Retention of Maryland STEM Out-of-state Bachelor’s Degree Earners who were Working Four Quarters in the First Calendar Year after Graduation
17
Table 12a: Retention of Maryland STEM In-state Master’s Degree Earners who were Working Four Quarters in the First Calendar Year after Graduation
18
Table 12b: Retention of Maryland STEM Out-of-state Master’s Degree Earners who were Working Four Quarters in the First Calendar Year after Graduation
19
Table 13: Retention of Maryland STEM Doctorate Degree Earners who were Working Four Quarters in the First Calendar Year after Graduation
20
Summary of Findings 21
Future Research on Maryland STEM Postsecondary Graduates and the Workforce 21
References 23
Appendix 24

iv
This page intentionally left blank
v
Executive Summary
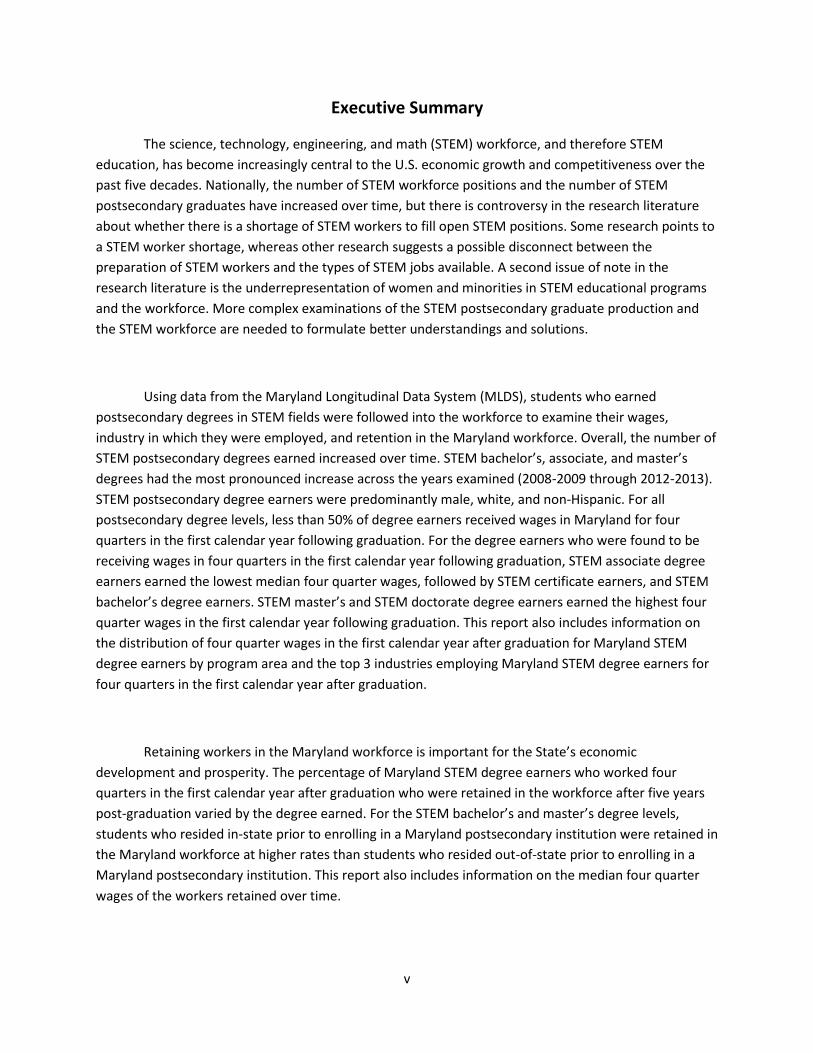
The science, technology, engineering, and math (STEM) workforce, and therefore STEM
education, has become increasingly central to the U.S. economic growth and competitiveness over the
past five decades. Nationally, the number of STEM workforce positions and the number of STEM
postsecondary graduates have increased over time, but there is controversy in the research literature
about whether there is a shortage of STEM workers to fill open STEM positions. Some research points to
a STEM worker shortage, whereas other research suggests a possible disconnect between the
preparation of STEM workers and the types of STEM jobs available. A second issue of note in the
research literature is the underrepresentation of women and minorities in STEM educational programs
and the workforce. More complex examinations of the STEM postsecondary graduate production and
the STEM workforce are needed to formulate better understandings and solutions.
Using data from the Maryland Longitudinal Data System (MLDS), students who earned
postsecondary degrees in STEM fields were followed into the workforce to examine their wages,
industry in which they were employed, and retention in the Maryland workforce. Overall, the number of
STEM postsecondary degrees earned increased over time. STEM bachelor’s, associate, and master’s
degrees had the most pronounced increase across the years examined (2008-2009 through 2012-2013).
STEM postsecondary degree earners were predominantly male, white, and non-Hispanic. For all
postsecondary degree levels, less than 50% of degree earners received wages in Maryland for four
quarters in the first calendar year following graduation. For the degree earners who were found to be
receiving wages in four quarters in the first calendar year following graduation, STEM associate degree
earners earned the lowest median four quarter wages, followed by STEM certificate earners, and STEM
bachelor’s degree earners. STEM master’s and STEM doctorate degree earners earned the highest four
quarter wages in the first calendar year following graduation. This report also includes information on
the distribution of four quarter wages in the first calendar year after graduation for Maryland STEM
degree earners by program area and the top 3 industries employing Maryland STEM degree earners for
four quarters in the first calendar year after graduation.
Retaining workers in the Maryland workforce is important for the State’s economic
development and prosperity. The percentage of Maryland STEM degree earners who worked four
quarters in the first calendar year after graduation who were retained in the workforce after five years
post-graduation varied by the degree earned. For the STEM bachelor’s and master’s degree levels,
students who resided in-state prior to enrolling in a Maryland postsecondary institution were retained in
the Maryland workforce at higher rates than students who resided out-of-state prior to enrolling in a
Maryland postsecondary institution. This report also includes information on the median four quarter
wages of the workers retained over time.

vi
This page intentionally left blank

Maryland Longitudinal Data System Center
STEM Workforce Report, Page 1 of 26
Introduction
This report focuses on students earning postsecondary degrees in the fields of science,
technology, engineering or mathematics (STEM) who apply their acquired knowledge and skills to the workforce. The STEM workforce, and therefore STEM education, has become increasingly central to the U.S. economic growth and competitiveness over the past five decades. For example, between 1950 and 2000 the STEM workforce exploded from 200,000 to 4.8 million jobs, and between 2004 and 2014 it was estimated that STEM jobs increased by another 26% (Hoffman, Starobin, Laanan, & Rivera, 2010; Langdon, McKittrick, Beede, Kahn, & Doms, 2011). The current estimate of STEM jobs is at 7.6 million, which is estimated to represent 4 to 5 percent of the U.S. workforce (Salzman, 2013). The number of postsecondary students earning degrees has also increased steadily with 17% of current U.S. graduates earning degrees in STEM disciplines, and despite some concerns expressed to the contrary, more students are taking science and math courses and doing better in them than ever before (Cannady, Greenwald, & Harris, 2014). However, recent research ranked U.S. 15 years olds as 28th in the world in math literacy and 24th in science literacy while 24 years olds ranked 20th in the world in having earned postsecondary degrees in science or engineering (Kuenzi, 2008).
In this report we briefly review some of the ongoing questions and concerns about
STEM education and the workforce, including the question of whether there is a shortage of STEM graduates emerging from our postsecondary institutions in order to fill the positions needed to keep the U.S. competitive in the world economy. We also briefly review the literature on the persistent underrepresentation of female and racial and ethnic minority students and workers in STEM fields. We then present an extensive look at the data currently available in the MLDS with respect to STEM postsecondary degree earners across Maryland and their workforce outcomes. The outcomes examined include working in the Maryland workforce, the four quarter wages of students found in the workforce, and the retention of workers in the workforce.
A STEM Student/Worker Shortage?
Nationally there are 500,000 STEM degree earners each year (currently approximately 17% of graduates each year) competing for 180,000 STEM workforce positions (Salzman, 2013). That appears to suggest there are more STEM graduates than STEM workforce positions. Therefore our education system is easily (even over-) producing the STEM graduates needed for the economy. However, much has been said and written about a shortage of STEM workers in the U.S., the need to increase the number of students in STEM fields, and the short-term solution needed to import STEM-prepared workers to fill unfilled positions (Cannady, Greenwald, & Harris, 2014). This common perception of a STEM worker shortage has been traced back in part to Steve Jobs telling President Obama that there was an engineering shortage in the U.S., which led to an announcement by President Obama’s Jobs and Competitiveness Council that the U.S. needed to produce 10,000 more engineers per year (Salzman, 2013). Such perceived shortages have led to national policy initiatives to increase the

Maryland Longitudinal Data System Center
STEM Workforce Report, Page 2 of 26
number of students choosing STEM fields and thus the supply of STEM-educated workers (including supportive immigration policies) that have included hundreds of millions of dollars in funding (Cannady, Greenwald, & Harris, 2014). Steve Jobs reportedly told President Obama in a meeting in 2011 that Apple would have located 700,000 iPhone manufacturing jobs in the U.S. (instead of China) if there had been enough engineers in the U.S. to support the operation. However, the shortage claim has since been challenged, most effectively by pointing out that manufacturing jobs would have paid an average of $42,000 per year in the U.S. while they paid just $4,800 in China (Salzman, 2013).
The strongest evidence challenging the STEM shortage claim has been the consistent research finding that, year after year, the U.S. is graduating considerably more students with degrees in STEM than there are positions in the U.S. for them to fill (Cannady, Greenwald, & Harris, 2014; Salzman, 2013). The data indicate not a shortage, but a glut. The question then emerges: do we have a shortage of STEM graduates in proportion to the number of STEM jobs each year in the U.S.? An emerging theory is that there may be critical disconnects that create these seemingly conflicting reports and perceptions of the state of the STEM workforce in the U.S. One disconnect may be that manufacturers who report shortages are seeking (and often importing) entry level workers, while many STEM graduates in the U.S. are highly trained, have degrees, and are not interested in such entry level low wage STEM jobs (Salzman, 2013). A similar hypothesis is that there are mismatches between what our postsecondary institutions prepare students to know and do and the skills for which potential STEM employers are looking (Hira, 2010).
The answer to the complex question of whether there is a STEM worker shortage is not
simple. Therefore, a simple perspective along the lines of ‘we have a STEM graduate shortage’ is not going to solve this problem. More complex examinations of the STEM postsecondary graduate production and the STEM workforce are needed to formulate better understandings and solutions (Hira, 2010; Salzman, 2013). Further, these complex examinations, theories, and solutions must be driven by the data on STEM postsecondary graduates and the STEM workforce, not anecdotes.
Women and Minorities in STEM
Women and minority students are historically underrepresented in STEM postsecondary
programs and in the STEM workforce. Although 65% of white students who enter college in a STEM field earn a STEM degree, that proportion is just 16% for Black, Hispanic, and Native American students (Museus, Palmer, Davis, & Maramba, 2011). Black workers account for only 8% of STEM workers, Hispanic workers account for another 8%, and Native American workers account for 0.7% of workers with STEM positions (Palmer, Maramba, & Dancey, 2011). The proportions of Black, Hispanic, and Native American workers in STEM positions have increased little since 1995 (Palmer, Maramba, & Dancey, 2011). The proportion of young women prepared for STEM positions is also low. Just 15% of Associate degrees in STEM programs go to

Maryland Longitudinal Data System Center
STEM Workforce Report, Page 3 of 26
female students and only 18% of four-year degrees in STEM are earned by women (Milgram, 2011).
The underrepresentation of women and minorities in STEM educational programs and
the workforce is an issue that needs study, intervention, and change. It is a social and economic justice issue that STEM careers, which often pay better than many other workforce areas, continue to have large disproportionalities. Scholars have been pointing out these disproportionalities since the 1970s, and little has changed. For the U.S. to compete in the increasingly competitive global digital economy today, we need to tap into the talents of all students. An education system that does not bring female students, who comprise over half of postsecondary students, and racial and ethnic minority students, the fastest growing segments of our population, into STEM fields at proportionally fair rates, is a serious problem.
Preparing Maryland STEM Postsecondary Graduates
Using MLDS Center data, students who earned postsecondary degrees in STEM fields were followed into the workforce to examine their wages, industry in which they were employed, and retention in the Maryland workforce. For this report, STEM fields were identified using the Classification of Instructional Program (CIP) codes that are identified as STEM by the U.S. Department of Homeland Security.1 Before discussing outcomes, in the paragraphs below, the trends in STEM degree production and the characteristics of STEM degree earners are provided.
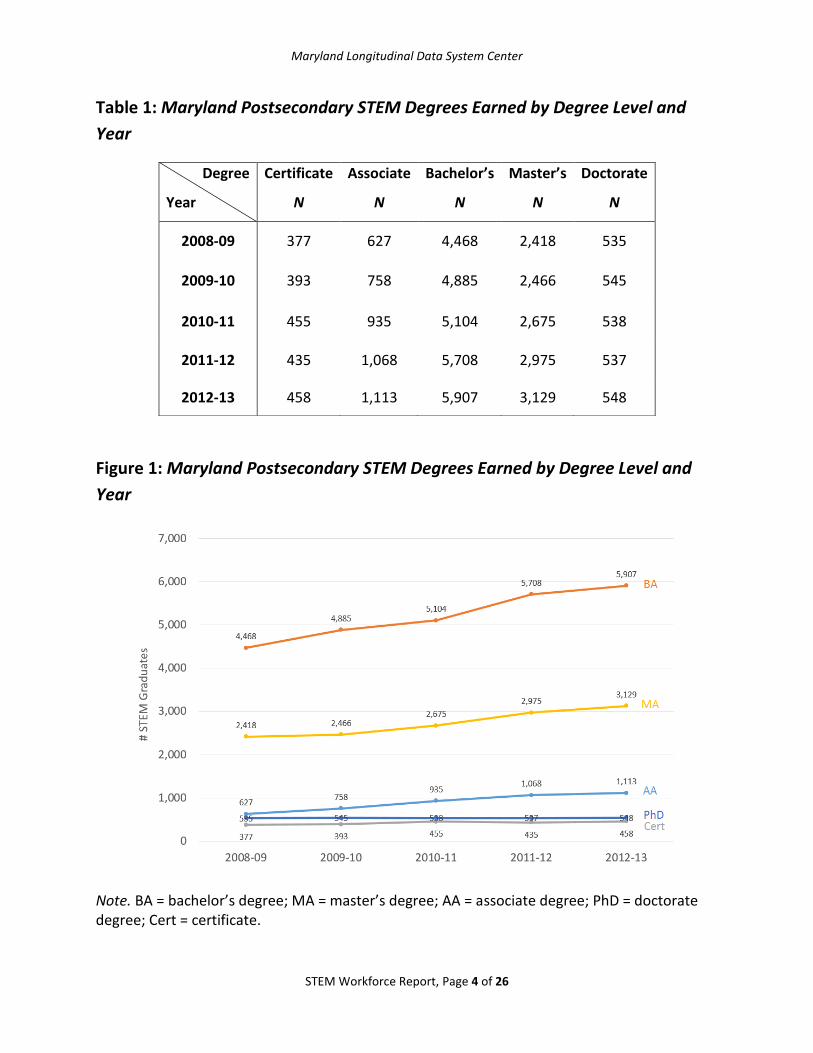
Table 1 and Figure 1 display the number of STEM certificate2, associate, bachelor’s,
master’s, and doctoral level degrees earned in Maryland postsecondary institutions by degree year between 2008-2009 and 2012-2013. Overall, the number of STEM degrees earned increased over time. STEM associate, bachelor’s, and master’s degrees had the most pronounced increase across the years examined. The number of STEM associate degrees earned in Maryland postsecondary institutions almost doubled between degree years 2008-2009 and 2012-2013. The number of Maryland STEM bachelor’s degrees earned increased by about 1,500 degrees and the number of Maryland STEM master’s degrees earned increased by about 700 degrees between degree years 2008-2009 and 2012-2013.
1 The U.S. Department of Homeland Security designates STEM fields for a 24-month STEM optional practical training extension. Fields included in the Classification of Instructional Program (CIP) two-digit series containing engineering, biological sciences, mathematics, physical sciences, and related fields are designated as STEM. Information was retrieved from https://studyinthestates.dhs.gov/eligible-cip-codes-for-the-stem-opt-extension. STEM designated degree program list is available at: https://www.ice.gov/sites/default/files/documents/Document/2016/stem-list.pdf. 2 Certificate earners may include individuals who have well-established careers and are earning an extra credential.
Maryland Longitudinal Data System Center
STEM Workforce Report, Page 4 of 26
Table 1: Maryland Postsecondary STEM Degrees Earned by Degree Level and
Year
Figure 1: Maryland Postsecondary STEM Degrees Earned by Degree Level and
Year
Note. BA = bachelor’s degree; MA = master’s degree; AA = associate degree; PhD = doctorate degree; Cert = certificate.
Degree
Year
Certificate
N
Associate
N
Bachelor’s
N
Master’s
N
Doctorate
N
2008-09 377 627 4,468 2,418 535
2009-10 393 758 4,885 2,466 545
2010-11 455 935 5,104 2,675 538
2011-12 435 1,068 5,708 2,975 537
2012-13 458 1,113 5,907 3,129 548

Maryland Longitudinal Data System Center
STEM Workforce Report, Page 5 of 26
Table 2 displays the gender, race, ethnicity, and initial residency status of Maryland STEM degree earners. STEM degree earners were predominantly male, white, and non-Hispanic. A higher proportion of STEM doctorate degree earners were Asian (32%) in comparison to the proportion of STEM degree earners at other levels. A lower proportion of STEM doctorate degree earners were Black (7%) in comparison to the proportion of STEM degree earners at other levels. The residency status indicates whether the student was an in-state or out-of-state resident prior to enrolling in a Maryland postsecondary institution. A large majority of STEM certificate (83%), associate (86%), and bachelor’s (78%) degree earners were in-state residents. A lower proportion of STEM master’s (60%) and doctorate (35%) degree earners were in-state residents, with STEM doctorate degrees having the lowest proportion of degree earners residing in-state at the time of entry into their degree program.
Table 2: Demographics of Maryland STEM Degree Earners, 2008-09 to 2012-13
Demographic Certificate Associate Bachelor’s Master’s Doctorate Gender Female 33% 29% 38% 39% 37% Male 65% 70% 59% 59% 60% Unknown 2% 1% 2% 2% 3% Race Asian 11% 10% 15% 17% 32% Black 22% 19% 17% 16% 7% White 55% 61% 56% 52% 49% Other * 5% 6% 4% 4% 3% Unknown 6% 4% 7% 11% 9% Ethnicity Hispanic 5% 6% 4% 3% 3% Not Hispanic 87% 90% 88% 83% 87% Unknown 8% 4% 8% 14% 10% Residency In-state 83% 86% 78% 60% 35% Out-of-state 12% 11% 18% 33% 56% Unknown 5% 3% 4% 7% 9% Note. “Other” race included: Hawaiian, Native American, and two or more reported races. Percentages may not add to 100 due to rounding.

Maryland Longitudinal Data System Center
STEM Workforce Report, Page 6 of 26
Table 3 displays the gender, race, ethnicity, and residency status of all Maryland degree earners, in any discipline, to serve as a comparison point for the demographic characteristics of the Maryland STEM degree earners (Table 2). In comparison to the population of Maryland degree earners, a higher proportion of Maryland STEM degree earners were male (59-70% for STEM and 36-45% for all degree earners) and Asian (10-32% for STEM and 4-18% for all degree earners) and a lower proportion was Black (7-22% for STEM and 10-26% for all degree earners). The proportion of Maryland STEM degree earners that were Hispanic (3-6%) was approximately equal to the proportion of all Maryland degree earners that was Hispanic (3-6%). A lower proportion of STEM master’s (60%) and doctorate (35%) degree earners were in-state residents in comparison to the proportion of all Maryland degree earners that were in-state master’s (67%) and doctorate (54%) degree earners.
Table 3: Demographics of Maryland Degree Earners across All Disciplines, 2008-09 to 2012-13
Demographic Certificate Associate Bachelor’s Master’s Doctorate
Gender Female 58% 62% 56% 58% 53% Male 36% 36% 40% 38% 45% Unknown 6% 2% 4% 4% 2% Race Asian 4% 6% 8% 9% 18% Black 26% 23% 22% 21% 10% White 57% 62% 58% 54% 60% Other * 4% 5% 3% 3% 3% Unknown 9% 4% 9% 12% 8% Ethnicity Hispanic 5% 6% 4% 3% 3% Not Hispanic 82% 89% 86% 82% 87% Unknown 13% 5% 10% 14% 9% Residency In-state 78% 88% 78% 67% 54% Out-of-state 9% 9% 16% 25% 40% Unknown 13% 4% 6% 8% 6% Note. “Other” race included: Hawaiian, Native American, and two or more reported races. Percentages may not add to 100 due to rounding.
Maryland Longitudinal Data System Center
STEM Workforce Report, Page 7 of 26
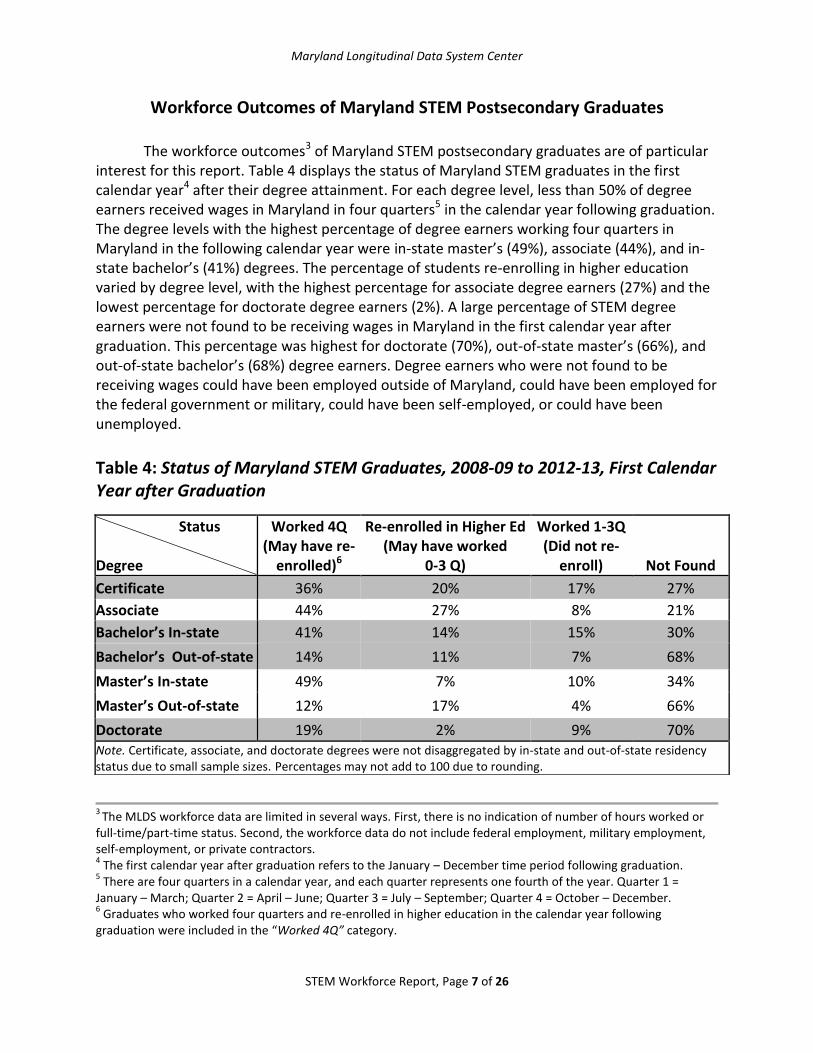
Workforce Outcomes of Maryland STEM Postsecondary Graduates The workforce outcomes3 of Maryland STEM postsecondary graduates are of particular interest for this report. Table 4 displays the status of Maryland STEM graduates in the first calendar year4 after their degree attainment. For each degree level, less than 50% of degree earners received wages in Maryland in four quarters5 in the calendar year following graduation. The degree levels with the highest percentage of degree earners working four quarters in Maryland in the following calendar year were in-state master’s (49%), associate (44%), and in-state bachelor’s (41%) degrees. The percentage of students re-enrolling in higher education varied by degree level, with the highest percentage for associate degree earners (27%) and the lowest percentage for doctorate degree earners (2%). A large percentage of STEM degree earners were not found to be receiving wages in Maryland in the first calendar year after graduation. This percentage was highest for doctorate (70%), out-of-state master’s (66%), and out-of-state bachelor’s (68%) degree earners. Degree earners who were not found to be receiving wages could have been employed outside of Maryland, could have been employed for the federal government or military, could have been self-employed, or could have been unemployed.
Table 4: Status of Maryland STEM Graduates, 2008-09 to 2012-13, First Calendar Year after Graduation
3 The MLDS workforce data are limited in several ways. First, there is no indication of number of hours worked or
full-time/part-time status. Second, the workforce data do not include federal employment, military employment, self-employment, or private contractors. 4 The first calendar year after graduation refers to the January – December time period following graduation.
5 There are four quarters in a calendar year, and each quarter represents one fourth of the year. Quarter 1 =
January – March; Quarter 2 = April – June; Quarter 3 = July – September; Quarter 4 = October – December. 6 Graduates who worked four quarters and re-enrolled in higher education in the calendar year following
graduation were included in the “Worked 4Q” category.
Status Degree
Worked 4Q (May have re-
enrolled)6
Re-enrolled in Higher Ed (May have worked
0-3 Q)
Worked 1-3Q (Did not re-
enroll) Not Found
Certificate 36% 20% 17% 27%
Associate 44% 27% 8% 21%
Bachelor’s In-state 41% 14% 15% 30%
Bachelor’s Out-of-state 14% 11% 7% 68%
Master’s In-state 49% 7% 10% 34%
Master’s Out-of-state 12% 17% 4% 66%
Doctorate 19% 2% 9% 70% Note. Certificate, associate, and doctorate degrees were not disaggregated by in-state and out-of-state residency status due to small sample sizes. Percentages may not add to 100 due to rounding.
Maryland Longitudinal Data System Center
STEM Workforce Report, Page 8 of 26
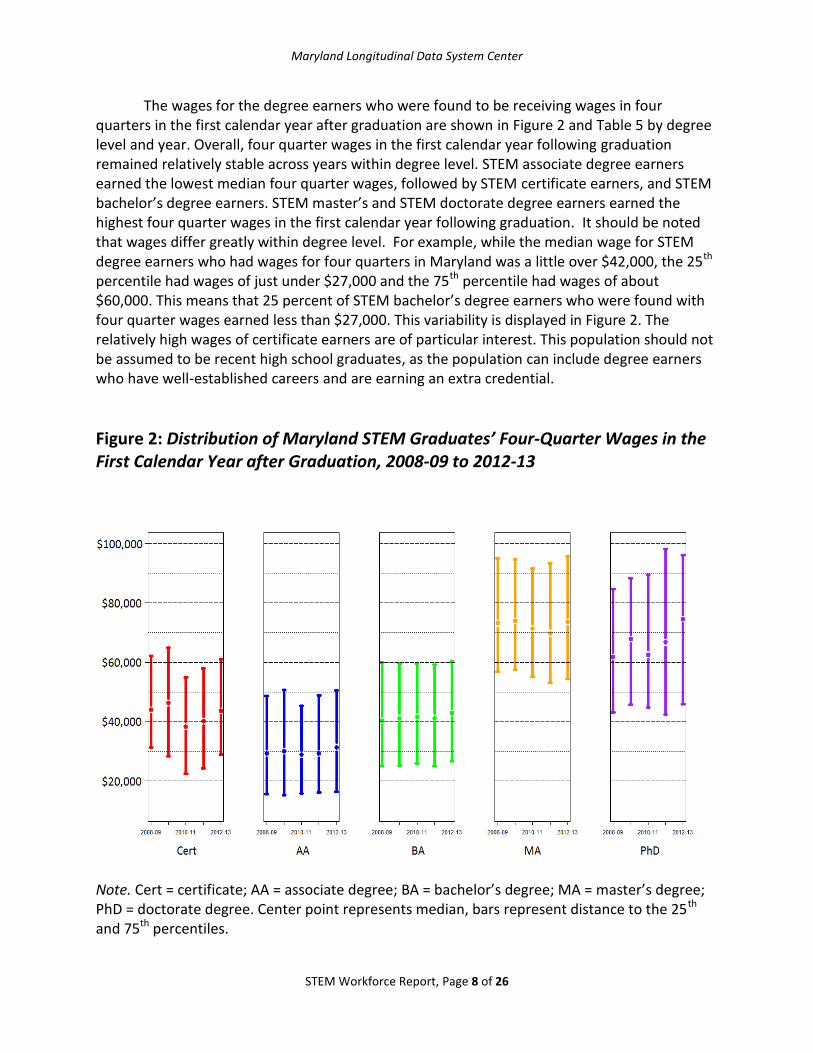
The wages for the degree earners who were found to be receiving wages in four quarters in the first calendar year after graduation are shown in Figure 2 and Table 5 by degree level and year. Overall, four quarter wages in the first calendar year following graduation remained relatively stable across years within degree level. STEM associate degree earners earned the lowest median four quarter wages, followed by STEM certificate earners, and STEM bachelor’s degree earners. STEM master’s and STEM doctorate degree earners earned the highest four quarter wages in the first calendar year following graduation. It should be noted that wages differ greatly within degree level. For example, while the median wage for STEM degree earners who had wages for four quarters in Maryland was a little over $42,000, the 25th percentile had wages of just under $27,000 and the 75th percentile had wages of about $60,000. This means that 25 percent of STEM bachelor’s degree earners who were found with four quarter wages earned less than $27,000. This variability is displayed in Figure 2. The relatively high wages of certificate earners are of particular interest. This population should not be assumed to be recent high school graduates, as the population can include degree earners who have well-established careers and are earning an extra credential.
Figure 2: Distribution of Maryland STEM Graduates’ Four-Quarter Wages in the First Calendar Year after Graduation, 2008-09 to 2012-13
Note. Cert = certificate; AA = associate degree; BA = bachelor’s degree; MA = master’s degree; PhD = doctorate degree. Center point represents median, bars represent distance to the 25th and 75th percentiles.

Maryland Longitudinal Data System Center
STEM Workforce Report, Page 9 of 26
Table 5: Distribution of Maryland STEM Graduates’ Four-Quarter Wages in the First Calendar Year after
Graduation, 2008-09 to 2012-13
Degree Level Degree Year
N Median 25th Percentile 75th Percentile
Certificate
2008-2009 125 $44,095 $31,243 $62,221 2009-2010 124 $46,317 $28,321 $64,841 2010-2011 185 $38,393 $22,407 $54,914 2011-2012 164 $40,205 $24,246 $57,936 2012-2013 166 $43,650 $28,863 $61,102
Associate
2008-2009 302 $29,287 $15,639 $48,736 2009-2010 338 $29,974 $15,162 $50,662 2010-2011 416 $28,958 $15,728 $45,267 2011-2012 455 $29,249 $16,158 $48,845 2012-2013 474 $31,382 $16,341 $50,522
Bachelor’s
2008-2009 1,551 $40,335 $25,083 $59,839 2009-2010 1,723 $41,169 $25,266 $59,542 2010-2011 1,901 $41,590 $25,976 $59,475 2011-2012 2,006 $41,162 $24,999 $59,093 2012-2013 2,037 $42,927 $26,683 $60,308
Master’s
2008-2009 923 $73,130 $56,718 $94,923 2009-2010 900 $73,983 $57,504 $94,687 2010-2011 968 $71,385 $55,106 $91,590 2011-2012 1,081 $69,782 $53,022 $93,332 2012-2013 1,009 $73,592 $54,357 $95,663
Doctorate
2008-2009 116 $61,836 $43,204 $84,587 2009-2010 85 $67,876 $45,724 $88,392 2010-2011 105 $62,589 $44,711 $89,557 2011-2012 103 $66,672 $42,430 $98,100 2012-2013 115 $74,483 $45,956 $96,055

Maryland Longitudinal Data System Center
STEM Workforce Report, Page 10 of 26
While Table 5 shows wages across all STEM fields, Table 6 displays the distribution of four quarter wages in the first calendar year after graduation for STEM bachelor’s and master’s degree earners by STEM program area. The program areas displayed here had the highest number of graduates earning STEM bachelor’s and STEM master’s degrees. For each STEM program area displayed, master’s degree earners earned higher median wages than bachelor’s degree earners. Of the STEM program areas displayed, the highest median wage was associated with earning a degree in computer and information sciences and support services, followed closely by earning a degree in engineering. The distribution of four quarter wages in the first calendar year after graduation for bachelor’s and master’s degree earners for all STEM program areas can be found in the Appendix. The Appendix also includes the distribution of four quarter wages in the first calendar year after graduation for certificate, associate, and doctorate degree earners by STEM program area.
Table 6: Distribution of Four Quarter Wages in the First Calendar Year after Graduation for Maryland STEM Bachelor’s and Master’s Degree Earners by Program Area, 2008-09 to 2012-13
Bachelor’s Master’s
CIP2 Code
Program Area N Median 25th
Percentile 75th
Percentile N Median
25th Percentile
75th Percentile
11
COMPUTER AND INFORMATION SCIENCES AND SUPPORT SERVICES
2,865 $57,190 $40,717 $74,066 1,893 $85,085 $64,455 $111,723
13 EDUCATION -- -- -- -- 876 $59,208 $52,338 $68,963
14 ENGINEERING 1,603 $57,069 $46,261 $66,020 1,076 $81,885 $68,465 $98,232
26 BIOLOGICAL AND BIOMEDICAL SCIENCES
2,561 $26,640 $16,733 $35,899 604 $56,399 $44,065 $73,307
27 MATHEMATICS AND STATISTICS
574 $41,531 $25,388 $50,391 126 $73,314 $53,263 $94,920
40 PHYSICAL SCIENCES 545 $31,519 $17,852 $44,161 127 $60,002 $42,736 $85,239
Note. CIP2 = Classification of Instructional Programs 2 digit code.

Maryland Longitudinal Data System Center
STEM Workforce Report, Page 11 of 26
Table 7 displays the top three industries employing STEM bachelor’s degree earners for four quarters in the first calendar year after graduation by selected STEM program areas. The program areas displayed here had the highest number of graduates earning STEM bachelor’s degrees. The industry was categorized using the North American Industry Classification System (NAICS), which is determined by the employer. The top industry employing bachelor’s degree earners in computer information sciences and support services was computer systems design services, and the top industry employing bachelor’s degree earners in engineering was engineering services. The top industry employing both biological and biomedical sciences and physical sciences bachelor’s degree earners is colleges, universities, and professional schools. The top industry employing mathematics and statistics bachelor’s degree earners is elementary and secondary schools. Perhaps reflecting the theory of a mismatch between training and demand in STEM industries, it is of note that the 3rd most likely industry for bachelor’s degree earners from biological and biomedical sciences to be found is temporary help services, and similarly, for mathematics and statistics, full-service restaurants. It is important to note that the NAICS code is a classification of the industry, not the occupation. Therefore, there is no information provided on the job duties of the degree earner while employed in the industry.
Table 7: Top 3 Industries Employing Maryland STEM Bachelor’s Degree Earners for Four Quarters in the First Calendar Year after Graduation, 2008-09 to 2012-13 CIP2 Program Area N 1st Industry 2nd Industry 3rd Industry
11 COMPUTER AND INFORMATION SCIENCES AND SUPPORT SERVICES
2,865 Computer Systems Design
Services Custom Computer
Programming Services Engineering Services
26 BIOLOGICAL AND BIOMEDICAL SCIENCES
2,561 Colleges, Universities, and
Professional Schools General Medical and
Surgical Hospitals Temporary Help Services
14 ENGINEERING 1,603 Engineering Services Computer Systems Design
Services
Aeronautical and Nautical System and Instrument
Manufacturing
27 MATHEMATICS AND STATISTICS
574 Elementary and
Secondary Schools Colleges, Universities, and
Professional Schools Full-Service Restaurants
40 PHYSICAL SCIENCES 545 Colleges, Universities, and
Professional Schools Temporary Help Services Pharmacies and Drug Stores
Note. CIP2 = Classification of Instructional Programs 2 digit code. Industry was categorized using the North American Industry Classification System (NAICS).
Maryland Longitudinal Data System Center
STEM Workforce Report, Page 12 of 26
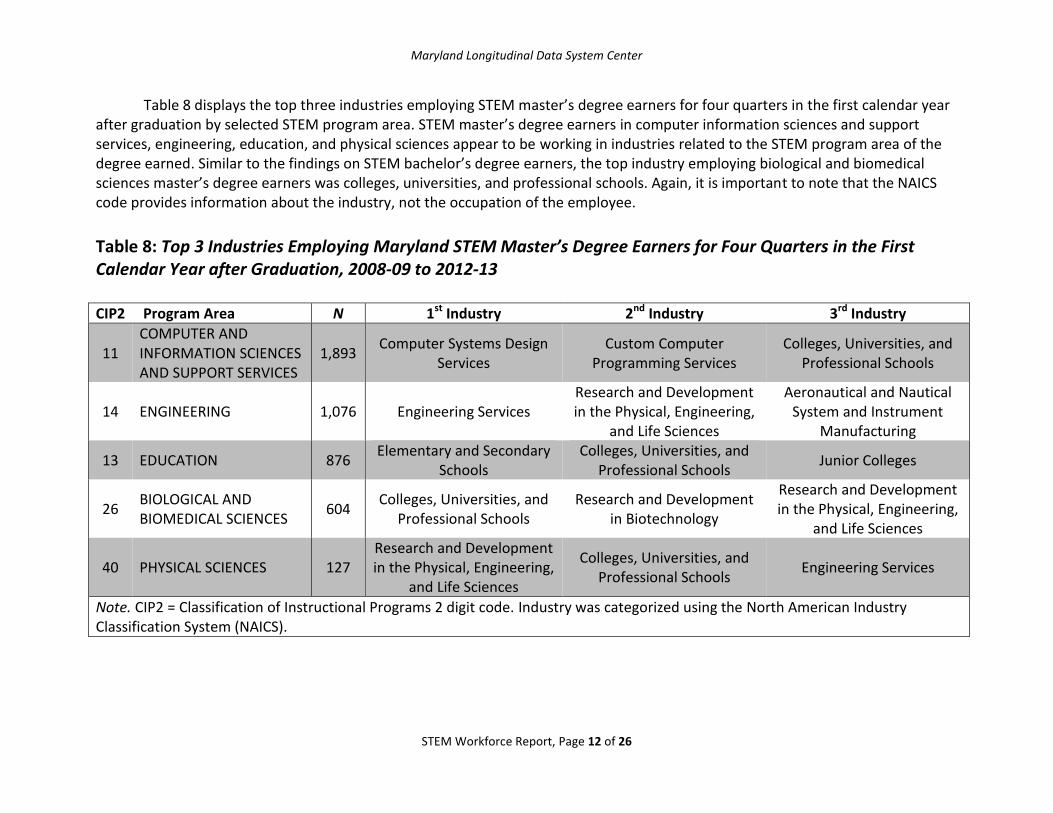
Table 8 displays the top three industries employing STEM master’s degree earners for four quarters in the first calendar year after graduation by selected STEM program area. STEM master’s degree earners in computer information sciences and support services, engineering, education, and physical sciences appear to be working in industries related to the STEM program area of the degree earned. Similar to the findings on STEM bachelor’s degree earners, the top industry employing biological and biomedical sciences master’s degree earners was colleges, universities, and professional schools. Again, it is important to note that the NAICS code provides information about the industry, not the occupation of the employee.
Table 8: Top 3 Industries Employing Maryland STEM Master’s Degree Earners for Four Quarters in the First Calendar Year after Graduation, 2008-09 to 2012-13 CIP2 Program Area N 1st Industry 2nd Industry 3rd Industry
11 COMPUTER AND INFORMATION SCIENCES AND SUPPORT SERVICES
1,893 Computer Systems Design
Services Custom Computer
Programming Services Colleges, Universities, and
Professional Schools
14 ENGINEERING 1,076 Engineering Services Research and Development in the Physical, Engineering,
and Life Sciences
Aeronautical and Nautical System and Instrument
Manufacturing
13 EDUCATION 876 Elementary and Secondary
Schools Colleges, Universities, and
Professional Schools Junior Colleges
26 BIOLOGICAL AND BIOMEDICAL SCIENCES
604 Colleges, Universities, and
Professional Schools Research and Development
in Biotechnology
Research and Development in the Physical, Engineering,
and Life Sciences
40 PHYSICAL SCIENCES 127 Research and Development in the Physical, Engineering,
and Life Sciences
Colleges, Universities, and Professional Schools
Engineering Services
Note. CIP2 = Classification of Instructional Programs 2 digit code. Industry was categorized using the North American Industry Classification System (NAICS).
Maryland Longitudinal Data System Center
STEM Workforce Report, Page 13 of 26
Retaining Maryland STEM Postsecondary Graduates in the Maryland Workforce
Retaining workers in the Maryland workforce is important for the State’s economic development and prosperity. Therefore, the next several tables display the retention and median four quarter wages over time for Maryland STEM certificate (Table 9), associate (Table 10), in-state bachelor’s (Table 11a), out-of-state bachelor’s (Table 11b), in-state master’s (Table 12a), out-of-state master’s (Table 12b), and doctorate (Table 13) degree earners. It is important to note that the retention rates are calculated for the Maryland STEM degree earners who were working for four quarters in Maryland in the calendar year following graduation. Many Maryland STEM degree earners did not work four quarters in Maryland in the calendar year following graduation (see Table 4), and these degree earners were not included in the retention tables. Tables 9-13 also display the percentage of Maryland STEM degree earners who were working four quarters in the first calendar year after graduation who re-enrolled in higher education over time where sample sizes allow. The percent others category may include degree earners who were working fewer than four quarters in the Maryland workforce or were not found in the Maryland workforce. Again, it is important to note that students who were not found in the workforce could have been employed outside of Maryland, could have been employed for the federal government or military, could have been self-employed, or could have been unemployed.
A few trends and highlights are noteworthy from Tables 9-13. First, the five year retention rate of Maryland STEM degree earners working four quarters in the first calendar year after graduation varied by the degree earned. The five year retention rate ranged from 52% (Maryland STEM out-of-state master’s degree earners; see Table 12b) to 78% (Maryland STEM certificate earners; see Table 9). Second, in-state residents who earned Maryland STEM bachelor’s (67% after five years; see Table 11a) and master’s (75% after five years; see Table 12a) degrees were retained in the workforce at higher rates than out-of-state residents earning Maryland STEM bachelor’s (58% after five years; see Table 11b) and master’s (52% after five years; see Table 12b) degrees, respectively. Third, of Maryland STEM graduates who were still earning wages for four quarters over time, the median four quarter wage was higher after five years in comparison to the median four quarter wage in the first calendar year after graduation. For example, Maryland STEM doctorate degree earners in degree year 2008-2009 who were working four quarters in the first calendar year after graduation earned a median four quarter wage of about $62,000 in the first year. In the fifth year, the median four quarter wage of those who were still earning wages for four quarters was about $93,000 (see Table 13).

Maryland Longitudinal Data System Center
STEM Workforce Report, Page 14 of 26
Table 9: Retention of Maryland STEM Certificate Earners who were Working Four Quarters in the First Calendar Year after Graduation
# Worked 4Q
Years after Graduation
Degree Year
1 Year 2 Years 3 Years 4 Years 5 years
2008-09 125
% Worked 4Q 100% ≥85% 86% 82% 78%
Median 4Q Wage $44,095 $48,652 $49,385 $52,831 $56,941
% Others ≤15% 14% 17% 22%
2009-10 124
% Worked 4Q 100% ≥85% ≥85% 81%
Median 4Q Wage $46,317 $48,489 $53,556 $57,736
% Others ≤15% ≤15% 19%
2010-11 185
% Worked 4Q 100% 90% 81%
Median 4Q Wage $38,393 $43,240 $49,922
% Others 10% 19%
2011-12 164
% Worked 4Q 100% 85%
Median 4Q Wage $40,205 $46,551
% Others 16%
2012-13 166
% Worked 4Q 100%
Median 4Q Wage $43,650
% Others
Note. 4Q = four quarters; % Others = degree earners who were working fewer than four quarters in the Maryland workforce or were not found in the Maryland workforce. For this table, due to small sample sizes, the percentage of students who re-enrolled in higher education was included in the % Others category. Percentages may not add to 100 due to rounding.

Maryland Longitudinal Data System Center
STEM Workforce Report, Page 15 of 26
Table 10: Retention of Maryland STEM Associate Degree Earners who were Working Four Quarters in the First Calendar Year after Graduation
# Worked 4Q
Years after Graduation
Degree Year
1 Year 2 Years 3 Years 4 Years 5 years
2008-09 302
% Worked 4Q 100% 86% 81% 75% 76%
Median 4Q Wage $29,287 $35,944 $42,889 $47,658 $49,261
% re-enrolled in Higher Ed
9% 6% 13% 16%
% Others 5% 14% 13% 9%
2009-10 338
% Worked 4Q 100% 85% 80% 75%
Median 4Q Wage $29,974 $35,112 $41,697 $47,840
% re-enrolled in Higher Ed
5% 8% 8%
% Others 9% 12% 17%
2010-11 416
% Worked 4Q 100% 83% 69%
Median 4Q Wage $28,958 $36,500 $42,953
% re-enrolled in Higher Ed
7% 11%
% Others 9% 19%
2011-12 455
% Worked 4Q 100% 82%
Median 4Q Wage $29,249 $36,897
% re-enrolled in Higher Ed
8%
% Others 11%
2012-13 474
% Worked 4Q 100%
Median 4Q Wage $31,382
% re-enrolled in Higher Ed
% Others
Note. 4Q = four quarters; % Others = degree earners who were working fewer than four quarters in the Maryland workforce or were not found in the Maryland workforce. Percentages may not add to 100 due to rounding.

Maryland Longitudinal Data System Center
STEM Workforce Report, Page 16 of 26
Table 11a: Retention of Maryland STEM In-state Bachelor’s Degree Earners who were Working Four Quarters in the First Calendar Year after Graduation
# Worked 4Q
Years after Graduation
Degree Year
1 Year 2 Years 3 Years 4 Years 5 years
2008-09 1,307
% Worked 4Q 100% 84% 77% 71% 67%
Median 4Q Wage $40,053 $48,446 $53,362 $57,397 $63,914
% re-enrolled in Higher Ed
3% 5% 6% 5%
% Others 13% 18% 23% 28%
2009-10 1,568
% Worked 4Q 100% 85% 75% 71%
Median 4Q Wage $40,930 $46,871 $52,406 $59,904
% re-enrolled in Higher Ed
4% 6% 6%
% Others 11% 19% 23%
2010-11 1,752
% Worked 4Q 100% 82% 74%
Median 4Q Wage $41,085 $48,973 $55,411
% re-enrolled in Higher Ed
4% 5%
% Others 14% 21%
2011-12 1,844
% Worked 4Q 100% 81%
Median 4Q Wage $41,011 $48,254
% re-enrolled in Higher Ed
4%
% Others 15%
2012-13 1,907
% Worked 4Q 100%
Median 4Q Wage $42,483
% re-enrolled in Higher Ed
% Others
Note. 4Q = four quarters; % Others = degree earners who were working fewer than four quarters in the Maryland workforce or were not found in the Maryland workforce. Percentages may not add to 100 due to rounding.

Maryland Longitudinal Data System Center
STEM Workforce Report, Page 17 of 26
Table 11b: Retention of Maryland STEM Out-of-state Bachelor’s Degree Earners who were Working Four Quarters in the First Calendar Year after Graduation
# Worked 4Q
Years after Graduation
Degree Year
1 Year 2 Years 3 Years 4 Years 5 years
2008-09 127
% Worked 4Q 100% 72% 70% 65% 58%
Median 4Q Wage $35,158 $51,330 $52,570 $51,870 $54,750
% Others 27% 30% 35% 42%
2009-10 129
% Worked 4Q 100% 74% 60% 51%
Median 4Q Wage $41,169 $50,724 $52,162 $59,628
% Others 26% 39% 49%
2010-11 131
% Worked 4Q 100% 69% 56%
Median 4Q Wage $46,134 $53,695 $64,213
% Others 30% 44%
2011-12 148
% Worked 4Q 100% 65%
Median 4Q Wage $44,003 $56,868
% Others 35%
2012-13 117
% Worked 4Q 100%
Median 4Q Wage $54,072
% Others
Note. 4Q = four quarters; % Others = degree earners who were working fewer than four quarters in the Maryland workforce or were not found in the Maryland workforce. For this table, due to small sample sizes, the percentage of students who re-enrolled in higher education was included in the % Others category. Percentages may not add to 100 due to rounding.

Maryland Longitudinal Data System Center
STEM Workforce Report, Page 18 of 26
Table 12a: Retention of Maryland STEM In-state Master’s Degree Earners who were Working Four Quarters in the First Calendar Year after Graduation
# Worked 4Q
Years after Graduation
Degree Year
1 Year 2 Years 3 Years 4 Years 5 years
2008-09 655
% Worked 4Q 100% 93% 85% 79% 75%
Median 4Q Wage $73,286 $80,000 $84,538 $88,799 $93,452
% Others 7% 15% 21% 25%
2009-10 776
% Worked 4Q 100% 91% 81% 79%
Median 4Q Wage $75,396 $81,520 $85,126 $90,923
% Others 10% 18% 22%
2010-11 844
% Worked 4Q 100% 89% 80%
Median 4Q Wage $73,627 $77,347 $83,374
% Others 11% 20%
2011-12 919
% Worked 4Q 100% 85%
Median 4Q Wage $71,043 $78,133
% Others 15%
2012-13 861
% Worked 4Q 100%
Median 4Q Wage $75,740
% Others
Note. 4Q = four quarters; % Others = degree earners who were working fewer than four quarters in the Maryland workforce or were not found in the Maryland workforce. For this table, due to small sample sizes, the percentage of students who re-enrolled in higher education was included in the % Others category. Percentages may not add to 100 due to rounding.

Maryland Longitudinal Data System Center
STEM Workforce Report, Page 19 of 26
Table 12b: Retention of Maryland STEM Out-of-state Master’s Degree Earners who were Working Four Quarters in the First Calendar Year after Graduation
# Worked 4Q
Years after Graduation
Degree Year
1 Year 2 Years 3 Years 4 Years 5 years
2008-09 82
% Worked 4Q 100% ≥85% 74% 62% 52%
Median 4Q Wage $61,072 $66,053 $72,191 $74,680 $81,593
% Others ≤15% 25% 38% 48%
2009-10 92
% Worked 4Q 100% 84% 71% 60%
Median 4Q Wage $61,190 $66,386 $72,447 $78,055
% Others 16% 29% 40%
2010-11 105
% Worked 4Q 100% 81% 64%
Median 4Q Wage $62,867 $71,589 $75,193
% Others 19% 36%
2011-12 136
% Worked 4Q 100% 82%
Median 4Q Wage $62,547 $66,112
% Others 18%
2012-13 123
% Worked 4Q 100%
Median 4Q Wage $63,590
% Others
Note. 4Q = four quarters; % Others = degree earners who were working fewer than four quarters in the Maryland workforce or were not found in the Maryland workforce. For this table, due to small sample sizes, the percentage of students who re-enrolled in higher education was included in the % Others category. Percentages may not add to 100 due to rounding.

Maryland Longitudinal Data System Center
STEM Workforce Report, Page 20 of 26
Table 13: Retention of Maryland STEM Doctorate Degree Earners who were Working Four Quarters in the First Calendar Year after Graduation
# Worked 4Q
Years after Graduation
Degree Year
1 Year 2 Years 3 Years 4 Years 5 years
2008-09 116
% Worked 4Q 100% 79% 72% 66% 59%
Median 4Q Wage $61,836 $75,259 $80,693 $84,306 $92,938
% Others 21% 29% 35% 42%
2009-10 85
% Worked 4Q 100% ≥85% 73% 69%
Median 4Q Wage $67,876 $72,485 $74,576 $80,673
% Others ≤15% 27% 30%
2010-11 105
% Worked 4Q 100% 84% 72%
Median 4Q Wage $62,589 $68,277 $78,406
% Others 16% 28%
2011-12 103
% Worked 4Q 100% 84%
Median 4Q Wage $66,672 $80,878
% Others 16%
2012-13 115
% Worked 4Q 100%
Median 4Q Wage $74,483
% Others
Note. 4Q = four quarters; % Others = degree earners who were working fewer than four quarters in the Maryland workforce or were not found in the Maryland workforce. For this table, due to small sample sizes, the percentage of students who re-enrolled in higher education was included in the % Others category. Percentages may not add to 100 due to rounding.

Maryland Longitudinal Data System Center
STEM Workforce Report, Page 21 of 26
Summary of Findings
The number of Maryland STEM postsecondary degree earners increased over time between academic years 2008-2009 and 2012-2013. Maryland STEM postsecondary degree earners were predominantly male, white, and not Hispanic. Additionally, Maryland STEM postsecondary degree earners were predominantly in-state residents prior to enrolling in Maryland postsecondary education, with the exception of Maryland STEM doctorate degree earners who were predominantly out-of-state residents prior to enrolling in Maryland postsecondary education. For each STEM postsecondary degree level, less than half of degree earners were employed for four quarters in the Maryland workforce in the calendar year following graduation. For each STEM degree level examined, the four quarter wages in the calendar year following graduation remained relatively stable across years. However, wages varied greatly for each degree level within a year. Of the STEM postsecondary degree earners who were employed for four quarters in the Maryland workforce in the calendar year following graduation, retention in the workforce after five years ranged from 52%-78%, depending on the degree level earned.
Future Research on Maryland STEM Postsecondary Graduates and the
Workforce
A number of future directions for research on Maryland STEM postsecondary graduates and the workforce are of interest. First, with additional years of longitudinal data, data from the Maryland Longitudinal Data System (MLDS) could be used to follow students from high school to postsecondary education and into the workforce. This research could offer information about the associations between high school attendance, coursework, and assessment scores and postsecondary STEM graduation. Examination of high school data can also begin to offer some information about the emergence of STEM disparities by gender, race, and ethnicity. These disparities likely arise prior to postsecondary entry, and additional years of longitudinal data will enable the examination of this long-term trend. Second, with expanded data collections from partner agencies, data from the MLDS could be used to examine high school and postsecondary education STEM course taking patterns. For example, it may be interesting to examine whether passing advanced placement STEM courses in high school is associated with increased likelihood of enrolling in a STEM program area in postsecondary education. With new course taking information collected by the Maryland Higher Education Commission (MHEC), it will be possible to examine whether taking particular STEM courses in postsecondary education is associated with increased likelihood of receiving a postsecondary degree in STEM and/or being employed in a STEM industry. Third, with the expansion in the number of longitudinal years of data available and the improved data collections from partner agencies, data from the MLDS could be used to run multivariate predictive models examining STEM postsecondary education. For example, data could be used to predict which students are likely to enroll in and graduate from postsecondary STEM program areas and which postsecondary STEM graduates are likely to be employed in a STEM industry in Maryland. This type of

Maryland Longitudinal Data System Center
STEM Workforce Report, Page 22 of 26
predictive modeling can offer valuable information to target practice and policy aimed at improving STEM postsecondary education.

Maryland Longitudinal Data System Center
STEM Workforce Report, Page 23 of 26
References
Cannady, M. A., Greenwald, E., & Harris, K. N. (2014). Problematizing the STEM pipeline metaphor: Is the STEM pipeline metaphor serving our students and the STEM workforce? Science Education, 98, 443-460.
Hira, R. (2010). U.S. policy and STEM workforce system. American Behavioral Scientist, 53, 949-
961. Hoffman, E., Starobin, S. S., Laanan, F. S., & Rivera, M. (2010). Role of community colleges in
STEM education: Thoughts on implications for policy, practice, and future research. Journal of Women and Minorities in Science and Engineering, 16, 85-96.
Kuenzi, J. J. (2008). Science, Technology, Engineering, and Mathematics (STEM) Education:
Background, Federal Policy, and Legislative Action. Washington DC: Congressional Research Service.
Langdon, D., McKittrick, G., Beede, D., Kahn, B., & Doms, M. (2011). STEM: Good jobs now and
in the future. Washington DC: U.S. Department of Commerce, Economics and Statistics Administration.
Milgram, D. (2011). How to recruit women and girls to the science, technology, engineering,
and math (STEM) classroom. Technology and Engineering Teacher, 71, 4-11. Museus, S. D., Palmer, R. T., Davis, R. J., & Maramba, D. C. (2011). Racial and Ethnic Minority
Students Success in STEM Education. San Francisco, CA: Wiley. Palmer, R. T., Maramba, D. C., & Dancey, T. E. (2011). A qualitative investigation of factors
promoting the retention and persistence of students of color in STEM. The Journal of Negroe Education, 80, 491-504.
Salzman, H. (2013). What shortages? The real evidence about the STEM workforce. Issues in
Science and Technology, 29 (4), 58-67.

Maryland Longitudinal Data System Center
STEM Workforce Report, Page 24 of 26
Appendix Table A.1. Distribution of Four Quarter Wages in the First Calendar Year after Graduation for Maryland STEM Certificate and Associate Degree Earners by Program Area, 2008-09 to 2012-13
CIP2 Code
Program Area Certificate Associate
N Median
4Q Wage 25
th
Percentile 75
th
Percentile N
Median 4Q Wage
25th
Percentile
75th
Percentile
03 NATURAL RESOURCES AND CONSERVATION
-- -- -- -- ≤15 $10,301 $6,740 $16,341
10 COMMUNICATIONS TECHNOLOGIES/ TECHNICIANS AND SUPPORT SERVICES
≤10 * * * 28 $12,081 $6,458 $23,593
11 COMPUTER AND INFORMATION SCIENCES AND SUPPORT SERVICES
335 $47,292 $29,827 $66,105 766 $34,104 $17,507 $55,558
14 ENGINEERING ≤10 $139,051 $118,814 $159,288 194 $15,944 $9,498 $35,606
15 ENGINEERING TECHNOLOGIES AND ENGINEERING-RELATED FIELDS
356 $38,196 $23,479 $53,718 702 $31,971 $19,201 $49,565
26 BIOLOGICAL AND BIOMEDICAL SCIENCES ≤10 $58,913 $52,404 $58,930 -- -- -- --
27 MATHEMATICS AND STATISTICS -- -- -- -- ≤15 $21,560 $11,812 $36,400
30 MULTI/INTERDISCIPLINARY STUDIES -- -- -- -- 56 $16,544 $8,979 $24,641
41 SCIENCE TECHNOLOGIES/TECHNICIANS 34 $35,389 $26,442 $46,721 102 $29,287 $16,858 $46,518
43 HOMELAND SECURITY, LAW ENFORCEMENT, FIREFIGHTING AND RELATED PROTECTIVE SERVICES
-- -- -- -- ≤15 $18,819 $13,745 $23,892
45 SOCIAL SCIENCES 14 $42,136 $32,808 $50,595 -- -- -- --
49 TRANSPORTATION AND MATERIALS MOVING
≤10 $38,393 $23,102 $59,171 70 $29,474 $20,186 $42,384
51 HEALTH PROFESSIONS AND RELATED PROGRAMS
≤10 $66,616 $38,980 $77,008 40 $38,146 $30,767 $48,194
52 BUSINESS, MANAGEMENT, MARKETING, AND RELATED SUPPORT SERVICES
≤10 $60,224 $34,500 $85,948 -- -- -- --
Note. CIP2 = Classification of Instructional Programs 2 digit code. The following STEM program areas did not have any certificate or associate degree earners between 2008-09 and 2012-13 who were working four quarters in the first calendar year after graduation: AGRICULTURE, AGRICULTURE OPERATIONS, AND RELATED SCIENCES (CIP2 = 01), COMMUNICATION, JOURNALISM, AND RELATED PROGRAMS (CIP2 = 09), EDUCATION (CIP2 = 13), PHYSICAL SCIENCES (CIP2 = 40), PSYCHOLOGY (CIP2 = 42). *Wages were suppressed due to uniqueness of the data.

Maryland Longitudinal Data System Center
STEM Workforce Report, Page 25 of 26
Table A.2. Distribution of Four Quarter Wages in the First Calendar Year after Graduation for Maryland STEM Bachelor’s and Master’s Degree Earners by Program Area, 2008-09 to 2012-13
CIP2 Code
Program Area Bachelor’s Master’s
N Median 4Q
Wage 25th Percentile 75th Percentile N
Median 4Q Wage
25th Percentile 75th Percentile
01 AGRICULTURE, AGRICULTURE OPERATIONS, AND RELATED SCIENCES
133 $30,111 $19,248 $36,262 ≤20 $38,672 $16,024 $47,993
03 NATURAL RESOURCES AND CONSERVATION 408 $30,131 $21,321 $40,958 ≤20 $38,529 $23,278 $54,829
09 COMMUNICATION, JOURNALISM, AND RELATED PROGRAMS
≤15 $40,084 $31,631 $47,075 -- -- -- --
10 COMMUNICATIONS TECHNOLOGIES/ TECHNICIANS AND SUPPORT SERVICES
80 $29,964 $15,166 $41,224 -- -- -- --
11 COMPUTER AND INFORMATION SCIENCES AND SUPPORT SERVICES
2,865 $57,190 $40,717 $74,066 1,893 $85,085 $64,455 $111,723
13 EDUCATION -- -- -- -- 876 $59,208 $52,338 $68,963
14 ENGINEERING 1,603 $57,069 $46,261 $66,020 1,076 $81,885 $68,465 $98,232
15 ENGINEERING TECHNOLOGIES AND ENGINEERING-RELATED FIELDS
84 $47,843 $30,575 $58,671 ≤20 $62,218 $51,769 $94,531
26 BIOLOGICAL AND BIOMEDICAL SCIENCES 2,561 $26,640 $16,733 $35,899 604 $56,399 $44,065 $73,307
27 MATHEMATICS AND STATISTICS 574 $41,531 $25,388 $50,391 126 $73,314 $53,263 $94,920
30 MULTI/INTERDISCIPLINARY STUDIES ≤15 $25,121 $10,076 $30,547 21 $35,624 $33,900 $41,572
40 PHYSICAL SCIENCES 545 $31,519 $17,852 $44,161 127 $60,002 $42,736 $85,239
41 SCIENCE TECHNOLOGIES/TECHNICIANS ≤15 $11,907 $7,562 $16,252 -- -- -- --
42 PSYCHOLOGY -- -- -- -- ≤20 * * *
43 HOMELAND SECURITY, LAW ENFORCEMENT, FIREFIGHTING AND RELATED PROTECTIVE SERVICES
107 $33,519 $24,104 $44,601 54 $46,958 $32,973 $54,014
49 TRANSPORTATION AND MATERIALS MOVING ≤15 $24,237 $19,717 $35,099 -- -- -- --
51 HEALTH PROFESSIONS AND RELATED PROGRAMS 152 $50,728 $43,659 $58,117 79 $50,890 $44,212 $68,613
52 BUSINESS, MANAGEMENT, MARKETING, AND RELATED SUPPORT SERVICES
70 $42,723 $30,966 $51,985 -- -- -- --
Note. CIP2 = Classification of Instructional Programs 2 digit code. The following STEM program areas did not have any bachelor’s or master’s degree earners between 2008-09 and 2012-13 who were working four quarters in the first calendar year after graduation: SOCIAL SCIENCES (CIP2 = 45). *Wages were suppressed due to uniqueness of the data.

Maryland Longitudinal Data System Center
STEM Workforce Report, Page 26 of 26
Table A.3. Distribution of Four Quarter Wages in the First Calendar Year after Graduation for Maryland STEM Doctorate Degree Earners by Program Area, 2008-09 to 2012-13
CIP2 Code Program Area
Doctorate
N Median 4Q
Wage 25
th Percentile 75
th Percentile
01 AGRICULTURE, AGRICULTURE OPERATIONS, AND RELATED SCIENCES ≤15 $45,598 $36,008 $52,011
03 NATURAL RESOURCES AND CONSERVATION ≤15 * * *
11 COMPUTER AND INFORMATION SCIENCES AND SUPPORT SERVICES 55 $101,249 $76,985 $132,720
13 EDUCATION 20 $77,716 $69,791 $109,009
14 ENGINEERING 157 $74,647 $50,189 $96,055
26 BIOLOGICAL AND BIOMEDICAL SCIENCES 134 $47,693 $38,567 $72,823
27 MATHEMATICS AND STATISTICS 33 $82,064 $52,793 $103,813
30 MULTI/INTERDISCIPLINARY STUDIES ≤15 $47,236 $35,723 $67,959
40 PHYSICAL SCIENCES 78 $60,084 $48,350 $71,214
42 PSYCHOLOGY ≤15 $48,196 $35,394 $73,038
51 HEALTH PROFESSIONS AND RELATED PROGRAMS ≤15 $83,690 $45,445 $97,970
Note. CIP2 = Classification of Instructional Programs 2 digit code. The following STEM program areas did not have any doctorate degree earners between 2008-09 and 2012-13 who were working four quarters in the first calendar year after graduation: COMMUNICATION, JOURNALISM, AND RELATED PROGRAMS (CIP2 = 09), COMMUNICATIONS TECHNOLOGIES/TECHNICIANS AND SUPPORT SERVICES (CIP2 = 10), ENGINEERING TECHNOLOGIES AND ENGINEERING-RELATED FIELDS (CIP2 = 15), SCIENCE TECHNOLOGIES/TECHNICIANS (CIP2 = 41), HOMELAND SECURITY, LAW ENFORCEMENT, FIREFIGHTING AND RELATED PROTECTIVE SERVICES (CIP2 = 43), SOCIAL SCIENCES (CIP2 = 45), TRANSPORTATION AND MATERIALS MOVING (CIP2 = 49), BUSINESS, MANAGEMENT, MARKETING, AND RELATED SUPPORT SERVICES (CIP2 = 52). *Wages were suppressed due to uniqueness of the data.