Assessing the impact of CCTV - CCTV User Group
176
Home Office Research Study 292 Assessing the impact of CCTV Martin Gill Angela Spriggs The views expressed in this report are those of the authors, not necessarily those of the Home Office (nor do they reflect Government policy). Home Office Research, Development and Statistics Directorate February 2005
Transcript of Assessing the impact of CCTV - CCTV User Group
Home Office Research Study 292
Assessing the impact of CCTV
Martin GillAngela Spriggs
The views expressed in this report are those of the authors, not necessarily those of the Home Office (nor do they reflect Government policy).
Home Office Research, Development and Statistics DirectorateFebruary 2005

Home Office Research Studies
The Home Office Research Studies are reports on research undertaken by or on behalf ofthe Home Office. They cover the range of subjects for which the Home Secre t a ry hasre s p o n s i b i l i t y. Other publications produced by the Research, Development and StatisticsDirectorate include Findings, Statistical Bulletins and Statistical Papers.
The Research, Development and Statistics Directorate
RDS is part of the Home Office. The Home Office's purpose is to build a safe, just and tolerantsociety in which the rights and responsibilities of individuals, families and communities arep roperly balanced and the protection and security of the public are maintained.
RDS is also part of National Statistics (NS). One of the aims of NS is to inform Parliament andthe citizen about the state of the nation and provide a window on the work and perf o rm a n c eof government, allowing the impact of government policies and actions to be assessed.
T h e re f o re –
R e s e a rch Development and Statistics Directorate exists to improve policy making, decisiontaking and practice in support of the Home Office purpose and aims, to provide the public andParliament with information necessary for informed debate and to publish information forfuture use.
First published 2005© Crown copyright 2005 ISBN 1 84473 581.8
ISSN 0072 6435
Assessing the impact of CCTV

Foreword
This study represents a major advance in our knowledge about CCTV. No previous researchhas examined in such detail the issues faced in ensuring effective operation of CCTVsystems. The authors have undertaken a painstaking analysis of the effectiveness of systems,both with respect to the impact on crime as recorded by the police and wider measuresbased on victimisation rates, fear of crime and other information collected via local surveys.The authors have demonstrated that while CCTV can be a powerful tool in combating crime,it has to be recognised that the contexts in which CCTV systems operate are very variable,as are the systems themselves. CCTV can appear to be a simple measure to implement, butthis is far from being the case in reality. This report, together with its associated reports,provides invaluable information to assist in developing the full potential of CCTV systems.
Dr Chris KershawProgramme DirectorResearch, Development and StatisticsHome Office Crime Reduction and Community Safety Group
i

Acknowledgements
There are a lot of people who in different ways have contributed to this research. We wouldp a rticularly like to thank all those individuals from the projects under evaluation for theircooperation. Many individuals from a wide array of agencies gave a lot of time andalthough we cannot name them we do recognise the enormous contribution that collectivelythey made. Without them this project would not have been possible.
We would also like to thank the Home Office team for their support. Initially Barry Webb,Gwendolyn Brandon, Moritz Flockenhaus, Tom Levesley, Amanda Martin and Ian Shortwere involved, and latterly Peter Grove and Chris Kershaw who were very supportive andoffered very good advice and made an important contribution to this work. We would liketo thank all those who at various points served on the project, especially Kate Painter notleast for her assistance in getting started, but also to Graeme Gerrard, Colin Knowles, ColinPhillips, Ian Wassell and Garry Parkins. We would particularly like to thank DavidFarrington for his advice and encouragement.
Finally, to all those others who at various points assisted us, too many to mention, we wouldlike to record our thanks here.
The Home Office would like to thank the three anonymous peer reviewers for their valuablecomments on this report.
ii
Assessing the impact of CCTV

Contents
Page Foreword i
Acknowledgements ii
Executive summary v
1. CCTV in perspective 1
2. Setting the scene: location of CCTV systems 13
3. Does CCTV work? Its impact on crime and the fear of crime 19
4. What influences CCTV’s operation? 63
5. Economic evaluation of CCTV schemes 97
6. Conclusions -reflections on the effectiveness of CCTV 115
Appendix A: Methodology 123
Appendix B: List of Home Office crime categories 137
Appendix C: Changes in individual crimes and significance levels 139
Appendix D: Characteristics of CCTV systems 141
Appendix E: Characteristics of CCTV control rooms 143
Appendix F: Costs of individual CCTV systems 145
References 153
iii

The Authors
M a rtin Gill is Director of Perpetuity Research & Consultancy International (PRCI) and aP rofessor of Criminology at the University of Leicester. He was the Director of the CCTVevaluation and is contactable on [email protected].
Angela Spriggs was the Project Manager and Research officer in the Department ofCriminology at the University of Leicester for the duration of the study.
All the following worked in a variety of research roles during the period of the evaluationand made a major contribution to the project:
Jenna AllenJavier ArgomanizJane BryanMartin HemmingPatricia JessimanDeena KaraJonathan KilworthRoss LittlePolly SmithDaniel SwainSam Waples
iv
Assessing the impact of CCTV

Executive summary
Aims and Methods
This report evaluates 13 Closed Circuit Television Camera (CCTV) projects (comprising 14separate systems) implemented in a range of contexts, including town centres, city centres,car parks, hospitals and residential areas. The projects were funded under Phase 2 of theHome Office CCTV Initiative. The research covered a number of different aspects:
● Police recorded crime statistics were used to measure changes in levels of crimein the intervention areas and in comparable control areas before and after theCCTV systems were installed. Where appropriate, changes in crime patterns inthe surrounding areas were also assessed, in order to measure any displacementor diffusion of benefit effects.
● Public attitude surveys were conducted in 12 areas to assess changes in publicp e rceptions of CCTV in the intervention areas and comparable control are a sb e f o re and after the installation of CCTV. These included residential in-homesurveys and town/city centre in-street surveys.
● R e s e a rchers identified other crime reduction initiatives operating within theintervention and control areas, so that it could be assessed to what extent theseoffered alternative explanations for changes in crime levels.
● Information was gathered on the process by which the project designers choseCCTV, and account was taken of the extent to which CCTV was evaluated as ameans of addressing local problems.
● The technical specification and design as well as the process of implementing andinstalling the CCTV systems were examined.
● Control room operations, including working relationships with external agenciessuch as the police, and control room management were assessed.
● The economic impact of each CCTV system was assessed.
v
The main objective of the crime data analysis was to measure the impact of the CCTV pro j e c t son crime and fear of crime. For the analysis a quasi-experimental model was adopted and theaim was as far as possible to achieve Level 3 of the Maryland Scientific Methods Scale( S h e rman et al. 2002). This re q u i res a measurement of change in the incidence of crimeb e f o re and after the installation of CCTV in both an intervention area (re f e rred toh e n c e f o rw a rd as the ‘target area’), and a control area. Furt h e rm o re, the analysis aimed tom e a s u re change for a significant length of time following implementation. The crime dataanalysis suff e red, however, from implementation delays and failures, the lack of a suitablec o n t rol, and limited access to data, which in some cases re n d e red it less robust than planned.
Impact on crime
● All the systems had the broad objective of reducing crime. Out of the 13 systems1
evaluated six showed a relatively substantial reduction in crime in the target areac o m p a red with the control area, but only two showed a statistically significantreduction relative to the control, and in one of these cases the change could beexplained by the presence of confounding variables. Crime increased in sevenareas but this could not be attributed to CCTV. The findings in these seven areaswere inconclusive as a range of variables could account for the changes in crimelevels, including fluctuations in crime rates caused by seasonal, divisional andnational trends and additional initiatives.
● A number of quantifiable aspects of systems, which could have explained theimpact measured were investigated and it was found that certain types of systemwere more effective than others:
- Systems installed in a mixed category of areas (e.g. car parks, a hospital andvarious other areas covered by one system) displayed the most encouragingresults in terms of reduction in crime, particularly in car parks.
- Town centre and residential systems showed varied results, with crime goingdown in some areas and up in others.
- Residential redeployable schemes appeared to show no long-term reduction incrime levels. However, the cameras were dealing with short - t e rm pro b l e m s ,which require sensitive measures to detect the impact of the cameras.
Assessing the impact of CCTV
vi
1 No police recorded crime statistics were available for Westcap Estate, hence crime levels were analysed for 13of the 14 systems.

● Certain types of offence were affected more than others:
- Impulsive crimes (e.g. alcohol-related crimes) were less likely to be re d u c e dthan premeditated crime (e.g. theft of motor vehicles).
- Violence against the person rose and theft of motor vehicles fell in the targetareas in accordance with national trends in recorded crime.
● Some system attributes had more effect than others:
- Camera coverage was positively correlated (r = 0.51) to effect size. However,this was not statistically significant (p<.05)2.
- I n c reased camera density (numbers of cameras installed per unit area) wasrelated to effect size only where the number of cameras installed in an areahad not reached saturation point.
- T h e re are indications that CCTV is more effective in sites with limited andcontrolled access points, such as entrances and exits to the area.
● Spatial displacement was not common but did occur:
- One system showed evidence of displacement of overall crime into thesurrounding area.
- Another showed displacement of burglary into the surrounding area.
- Another showed displacement of vehicle crime into the gaps in coveragebetween cameras.
- None of the factors outlined above determine exactly how well a system willwork, but they can work together to reduce crime.
vii
Executive summary
2 Unless stated otherwise, the statistical significance level used throughout the report is p<.05

Public attitudes to CCTV following implementation
● Public attitude surveys were carried out before and after the installation of CCTVin 12 diff e rent areas: nine residential estates and three city/town centres. Thesurveys covered five main issues:
Awareness of cameras● Individuals were usually aware of cameras in their area; levels of aware n e s s
ranged from 61 to 97 per cent and were highest in small residential areas. Publicawareness of CCTV increased as the number of cameras per unit area increased;r = 0.32 (not statistically significant).
Worry about being a victim of crime● Members of the public worried less about becoming victims of crime in the
i n t e rvention area following the installation of CCTV, but this was statisticallysignificant in only three areas. Wo rry about being affected by crime declinedsignificantly more than in the control area in just two areas.
● Changes in worry about crime did not appear to be affected by type of area.
● Respondents who were aware of the cameras actually worried more often aboutbecoming a victim of crime than those who were unaware of them. Knowing thatcameras were installed in an area did not necessarily lead to a reinforced feelingof security among respondents.
Feelings of safety● Feelings of safety increased in all but one of the areas surveyed following CCTV
installation. In three areas the increase in feelings of safety was greater than inthe control area. However, none of the results was statistically significant.
Reported victimisation● Eight schemes led to a reduction in the percentage of respondents who reported
having been victims of crime after, compared with before, the installation ofCCTV. Four of these eight recorded a larger reduction in victimisation than thecontrol. However, none of the data were statistically significant.
Assessing the impact of CCTV
viii

● In six residential areas the number of reported incidents increased or decreasedin line with changes in recorded crime levels generally, so tending to confirm thereliability of the recorded crime data.
● Victimisation did not appear to be affected by the type of area the CCTV systemwas installed in.
● Wo rry about being a victim of crime declined in seven areas in step with a re d u c t i o nin re p o rted victimisation. This suggests that worry about being a victim of crime wasd i rectly related to crime levels, rather than the mere presence of the cameras.
Changes in behaviour● Respondents rarely changed their behaviour following the installation of CCTV:
across the areas surveyed only from two to seven per cent visited places they hadp reviously avoided. This is substantially fewer than the 15 per cent of pre -implementation respondents who thought that CCTV would encourage them tovisit places they avoided.
● The presence of CCTV did not discourage people from visiting places. Only oneper cent of respondents said they avoided places once CCTV had been installed.
Support for CCTV● The pro p o rtion of respondents happy or very happy about having cameras in
their area declined in nine areas following their installation; in five of these thereduction was statistically significant. However, the level of support of CCTVremained high at over 70 per cent of the sample in all but one area.
● Concerns regarding the implication for civil liberties decreased slightly followingthe implementation of CCTV. Whereas 17 per cent of respondents expressed suchconcern prior to its installation, this declined from two to seven percentage pointspost CCTV installation.
Perceived effectiveness of CCTV● In residential areas, the proportion of those who perceived the impact of CCTV to
be positive decreased following its installation in all the areas surveyed:
ix
Executive summary

- Respondents were less likely to think that people reported more incidents to thepolice once CCTV was installed, although in all cases over a third ofrespondents thought that this was the case.
- They were less likely to think that the police responded more quickly toincidents following CCTV installation, although the proportion of respondentswho thought that this occurred varied from 12 per cent to 60 per cent.
- They were less likely to think that crime had got lower following installation ofCCTV, although 27 to 70 per cent thought that it had.
What factors influence CCTV’s operation?
● The characteristics that determine whether a CCTV system meets its objectives fallunder five headings: scheme objectives, management, density, camera coverageand positioning, technical characteristics and operation of the control room. Itwas not possible to identify a link between the outcomes and the characteristicsidentified because the key characteristics had a bearing in various degrees on allthe areas surveyed, and the presence of any one characteristic was not linked toan outcome. The key characteristics are discussed below:
Project objectives● Many projects did not have clear objectives. Partly this reflected an uncritical
view that CCTV was ‘a good thing’ and that specific objectives were unnecessary.It also typified a lack of understanding of what effects CCTV could achieve andthe types of problems it was best suited to alleviate.
● Installation of CCTV created demands by neighbouring town centres to ‘catch-up’with systems of their own. The claimed successes of existing projects reinforcedthese demands and relieved planners of the need to consider other alternatives.
● The existence of funding for CCTV created pre s s u re to bid for it, often in theabsence of reliable intelligence indicating where CCTV would be likely to havemost effect. Where statistics were gathered, they were sometimes inexpert l yproduced or were even distorted, having being compiled to support a bid.
Assessing the impact of CCTV
x

Management● A scheme must be properly managed and this re q u i res access to technical expert i s e ,
full engagement of end-users and the appointment of a suitable project manager.
● Many schemes relied too heavily on technical consultants whose work was notscrutinised, largely because no one had the qualification to question what wasbeing done. Since a consultant was dispensed with in many cases, planners wereunable to challenge the technical sales pitches of equipment suppliers.
● Some systems failed to engage properly with end-users, most notably the police.This might be as a result of a loss of interest in the system and reluctance to usethe evidence supplied by the cameras. The police could also be reluctant tosupply intelligence, which would be helpful in the monitoring process.
● A willing project manager was sometimes difficult to find – only five out of the 13schemes appointed a manager with previous CCTV experience. Lack of interestand lack of knowledge on the part of project managers compromised the abilityof schemes to meet their objectives.
Density, camera coverage and positioning● As a result of the lack of guidance on how many cameras to bid for, the number
and density of cameras varied widely between schemes. However, systems with ahigh density of cameras did not necessarily produce a greater reduction in crime.
● Similarly, the level of camera coverage varied. Too little coverage tends to preventefforts to track offenders for detective and evidential purposes. Camera coverageis linked to camera positioning and needs to take account of the nature of thearea to be monitored and the objectives of the CCTV system.
● Only seven of the 13 projects had a stru c t u red pro c e d u re for deciding thepositioning of cameras. Police intelligence was invaluable when positioningdecisions were taken, as (for extensions to existing schemes) was the input of theoperators who were to monitor them. Operators sometimes found that thecameras were not positioned in the best way to enable them to perform the tasksthat were set for them. Many errors in the positioning of cameras arose from over-reliance on the technical manager to the exclusion of other parties.
xi
Executive summary
Assessing the impact of CCTV
xii
Technical characteristics● The type of camera used and the way that it was mounted influenced whether a
system was useful for live monitoring, for providing good quality re t ro s p e c t i v eevidence, for deterring would-be offenders, for reassuring the public, or for acombination of these. The systems used two types of camera, static or pan, tiltand zoom (PTZ), and these were either box or dome mounted.
● Designers pre f e rred PTZ cameras, which were more likely to be monitored asoperators could control their field of vision and there f o re found them moreinteresting to operate. To ensure adequate coverage of an area required manyPTZ cameras with overlapping fields of vision, which is an expensive option.
● A further advantage of PTZ cameras is that they can be seen to move, so they arebetter at reassuring the public. Whether they deter and detect crime is open toquestion; some cameras were programmed to ‘auto-tour’ an area and there wasa consensus among operators and managers that offenders were unlikely to bedeterred for long by such a set-up. Cameras on auto-tour also caused frustrationwhen those reviewing recorded images found that the cameras had only recordedpart of an incident before being trained somewhere else by the pre-programming.
● Some cameras were unable to cope with artificial lighting in the hours ofdarkness. Residential areas in particular often had inappropriate levels and typesof lighting, which led to the cameras being regarded primarily as a deterrent anda reassurance to residents.
● The evaluation took place during a period when many system designers wereswitching from analogue to digital recording methods. Control rooms using digitaltechnology often lacked confidence that they would obtain the full advantagesthat should accrue from faster searching and recording capabilities.
Operation of the control room● Control room operation was an important determinant of a CCTV system’s ability
to detect crime. The monitoring schedule is certainly an issue here: six of the 13control rooms were staffed for less than 24 hours a day.
● The control rooms relied on intelligence and communication from the public aboutincidents in progress in order to direct surveillance. In practice, levels of incomingand outgoing communication were low.

● The presence of a one-way or two-way police radio in the control room wasfound to be beneficial, enabling operators to locate incidents at least as quicklyas did police officers, and to observe police intervention.
● Another form of communication was the retail/pub radio schemes, whichaccounted for the reporting and observation of significant numbers of incidents.
● Outward communication from the control room was assisted in some cases by theability to patch images through to monitors in police CAD rooms and otherlocations within the police station.
Overall● The use of CCTV needs to be supported by a strategy outlining the objectives of
the system and how these will be fulfilled. This needs to take account of localcrime problems and prevention measures already in place.
xiii
Executive summary

Assessing the impact of CCTV
xiv

1
1. CCTV in perspective
The CCTV initiative was set up under the Home Office Crime Reduction Pro g r a m m eannounced in 1998, and £170 million was made available for funding of a total of 684CCTV projects. These have been installed in a wide range of locations, including car parks,town and city centres, and residential areas. This report sets out the main conclusions of aprocess and impact3 evaluation of 134 out of the 352 CCTV projects set up under RoundTwo of the initiative, and aims to show whether CCTV was effective in those cases.
This chapter defines CCTV and reviews previous research work on the subject. It moves onto discuss the effectiveness of CCTV judged by some key criteria, which points to theconclusion that as far as CCTV is concerned the jury is still out. The review identifies somegaps in research and this leads on to a discussion of the methodology employed for thepresent study.
What is CCTV?
Closed Circuit Television Cameras (CCTV) have become an important crime prevention andsecurity measure. Cameras collect images, which are transferred to a monitor- re c o rd i n gdevice of some sort, where they are available to be watched, reviewed and/or store d .CCTV is a situational measure that enables a locale to be kept under surveillance remotely.This makes it possible for the police, and other law and regulatory agencies such as privatesecurity, to respond to incidents when alerted, and to have information about what to lookfor when they arrive. The storing of images means that post-incident analysis helpful to aninvestigation can be facilitated. However, there are many different types of CCTV systemsand they have different capacities to meet a variety of objectives.
Despite the tendency within the criminological literature to discuss CCTV as if it were asingle measure, CCTV systems can differ quite markedly. Cameras can be static (focusing ona single view), or can pan, tilt and zoom (moved by operators, or placed on ‘tours’ tosurvey a succession of scenes); they can be fixed (permanently installed in one location);
3 P rocess evaluation includes CCTV project design issues, control room operations and project management.Impact is evaluated through police recorded statistics, public attitude surveys and an economical assessment ofeach project.
4 O r i g i n a l l y, 17 projects were chosen for evaluation; however, four projects were not implemented within theevaluation timetable.
redeployable (moved around power points within an area), or mobile (placed in vehiclesand transported to where they are needed); they can transmit analogue or digital images,via cable or wireless links. The images can be re c o rded in diff e rent ways with diff e re n timplications for quality. The many methods of storing and manipulating images havedifferent implications as regards the type and speed of monitoring that can be carried out.The availability of specialised uses, such as number plate and facial recognition, hasgenerated yet more potential applications of this flexible technology.
CCTV systems may embody several of these technical features. There are a number of pointsthat need to be highlighted here. First, the technical specification of a system may wellimpact on its effectiveness; this is a topic that has received little attention from criminologicalevaluators. Second, this is emerging technology, and assessments at any particular point intime need to take account of this. Third, technical considerations are an important elementin the evaluation of systems. This does not mean that those evaluating CCTV need to betechnical experts, but technical expertise does need to be consulted. In part i c u l a r, it iscrucial to clarify that the technical specification is consistent with the objectives set.
However, the technology is only one part of a CCTV system. No system can work without ac o n t rol room, and there is wide variation in the way that these operate. They can bemonitored full-time or for a limited number of hours a week, and by a dedicated operator orby one who has other duties besides CCTV monitoring. Staffing levels vary greatly, and sodo the types of areas surveyed, including town centres, residential areas and car parks.T h e re are also a range of control room cultures, management styles, and methods ofcommunicating with the police. All of these factors, and others5, influence the way thecontrol room operates.
Many systems also incorporate the installation, or improvement, of street lighting in theirdesign and often such improvements are made at the same time as the cameras are installed.These are then treated as part of the scheme design rather than as confounding factors.
What do we know about the impact of CCTV?
There is a growing amount of literature on CCTV, which includes several CCTV magazinesfor professionals, and academic studies examining diff e rent aspects of CCTV (e.g. Gill,2003; McCahill, 2002; Norris and Armstrong, 1999; Norris, et al. 1998). These studiesadd substantially to our understanding of how CCTV works, but none of them sets out to
Assessing the impact of CCTV
2
5 For example, Evett, C. and Wood, J. (2004): Designing a Control Room. CCTV Image. Spring pp24-25.
tackle the issue of effectiveness. Much of the public interest has been on the threat thatCCTV poses to civil liberties, and concerns about ‘big brother’, and on understanding therole of surveillance more broadly6.
H o w e v e r, the question of the effectiveness of CCTV has not been entirely ignore d .Researchers have discussed the effects of CCTV in different environments. The problem forpolicy purposes, as summaries of these have shown (NACRO, 2002; Phillips, 1999; Welshand Farrington, 2002) is that sometimes the effect is positive, sometimes negative, andsometimes neutral. Cost-effectiveness has been largely ignored. More o v e r, we know littleabout why the impact appears so variable; there are no studies that have incorporatedp rocess and impact evaluations, presented findings in a way that enables the causes ofsuccess and failure to be articulated, or point out the lessons to be drawn. In the past, thosewho have funded research have set other priorities.
Nevertheless, the evaluations that have been undertaken have provided important insights(see Newburn and Hayman, 2002). Some of the salient findings are summarised hereagainst some of the key objectives of CCTV.
Does CCTV reduce crime?
There is evidence that CCTV is more effective in some contexts than others, and certainlymore effective against some types of crime than others. Generally speaking, property crimesseem more susceptible to the impact of CCTV (e.g. Brown, 1995) especially thefts from andof vehicles (e.g. Skinns, 1998; Tilley, 1993), while personal crimes such as assault are lesslikely to be influenced (Deismann, 2003). Welsh and Farrington’s (2002) review found thatCCTV had no effect on crimes of violence, but a significant impact on vehicle crime.
A comprehensive review of the effect of CCTV on crime rates has been undertaken byWelsh and Farrington (2002). They reviewed 22 studies that met the minimum acceptables t a n d a rds of the Campbell Collaboration (see, Farrington, 1997; Welsh and Farr i n g t o n ,2002). Specifically, this lays down that studies must meet Level 3 of the Maryland ScientificMethods Scale (Sherman et al. 2002) and this requires a measurement of the incidence ofcrime before and after the installation of CCTV, in both a target and control area. Welshand Farrington concluded that 11 showed a desirable effect on crime, five an undesirableeffect, that no clear evidence of effect was apparent in another five, and that in one case it
3
CCTV in perspective
6 Clearly, an assessment of the attitudes towards the threat posed by CCTV to civil liberties may be informed by abetter understanding about its effectiveness, including its cost-effectiveness.
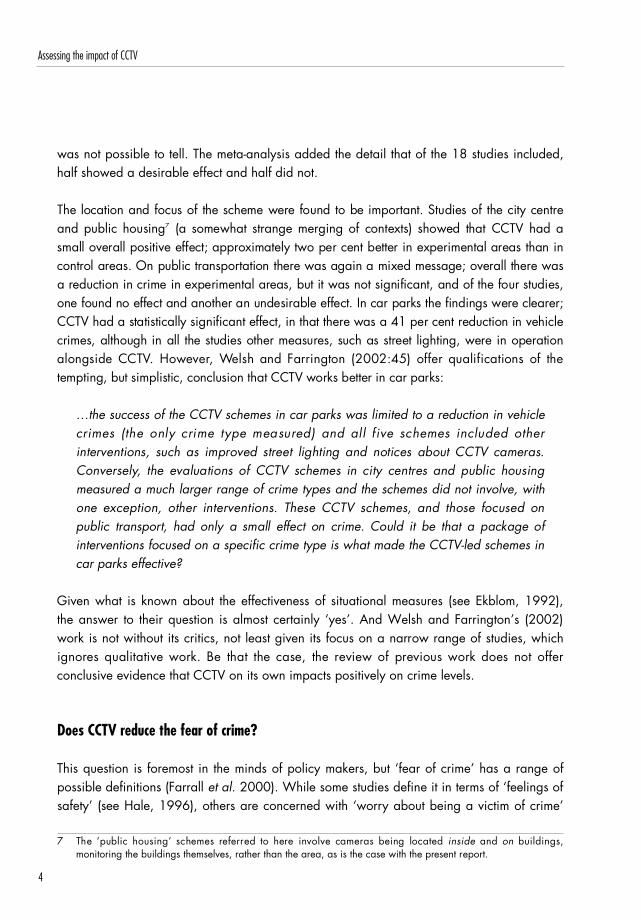
was not possible to tell. The meta-analysis added the detail that of the 18 studies included,half showed a desirable effect and half did not.
The location and focus of the scheme were found to be important. Studies of the city centreand public housing7 (a somewhat strange merging of contexts) showed that CCTV had asmall overall positive effect; approximately two per cent better in experimental areas than inc o n t rol areas. On public transportation there was again a mixed message; overall there wasa reduction in crime in experimental areas, but it was not significant, and of the four studies,one found no effect and another an undesirable effect. In car parks the findings were cleare r ;CCTV had a statistically significant effect, in that there was a 41 per cent reduction in vehiclecrimes, although in all the studies other measures, such as street lighting, were in operationalongside CCTV. However, Welsh and Farrington (2002:45) offer qualifications of thetempting, but simplistic, conclusion that CCTV works better in car parks:
…the success of the CCTV schemes in car parks was limited to a reduction in vehiclecrimes (the only crime type measured) and all five schemes included otherinterventions, such as improved street lighting and notices about CCTV cameras.C o n v e r s e l y, the evaluations of CCTV schemes in city centres and public housingmeasured a much larger range of crime types and the schemes did not involve, withone exception, other interventions. These CCTV schemes, and those focused onpublic transport, had only a small effect on crime. Could it be that a package ofinterventions focused on a specific crime type is what made the CCTV-led schemes incar parks effective?
Given what is known about the effectiveness of situational measures (see Ekblom, 1992),the answer to their question is almost certainly ‘yes’. And Welsh and Farrington’s (2002)work is not without its critics, not least given its focus on a narrow range of studies, whichi g n o res qualitative work. Be that the case, the review of previous work does not off e rconclusive evidence that CCTV on its own impacts positively on crime levels.
Does CCTV reduce the fear of crime?
This question is foremost in the minds of policy makers, but ‘fear of crime’ has a range ofpossible definitions (Farrall et al. 2000). While some studies define it in terms of ‘feelings ofsafety’ (see Hale, 1996), others are concerned with ‘worry about being a victim of crime’
Assessing the impact of CCTV
4
7 The ‘public housing’ schemes re f e rred to here involve cameras being located i n s i d e and o n b u i l d i n g s ,monitoring the buildings themselves, rather than the area, as is the case with the present report.

(see Hale, 1996; Furstenburg, 1971). However, neither definition is perfect. Whilst feelingsof safety can be influenced by a range of different factors, many of which are unaffected bycrime, levels of worry are highly subjective and ‘worry’ can mean diff e rent things todifferent individuals.
M o re recent studies measuring public attitudes towards CCTV have been concerned mainlywith public ‘feelings of safety’, but here too the findings are mixed. While some studies haveconcluded that CCTV does make people feel safer (Sarno et al., 1999), this is not necessarilythe whole story. Ditton (2000) found that one of the main impacts was making those whoa l ready feel safe, feel even safer. More o v e r, relatively low percentages say they would usepublic areas more as a consequence of feeling safer; 22 per cent after dark and eight per centduring the day in Bennett and Gelsthorpe’s (1996) study, and 15 per cent in both Ditton’s(2000) and Spriggs et al. ’s (2005) work. But these results were not tested after the event.
In any event, in order to feel safe, people need to notice the cameras, and it seems thatmany do not (Ditton, 2002; Dixon et al. (forthcoming); Honess and Charman, 1992). Also,there is some evidence that a belief in the value of cameras in increasing feelings of safetyis linked to generally positive views about CCTV (e.g. Spriggs et al., 2005).
Does CCTV deter crime?
Phillips (1999) underlined the need to demonstrate the deterrent effect of CCTV bypublicising the risk it poses to offenders. But what do offenders think? Short and Ditton(1998) found some scope for optimism, in that some offenders said they were deterred andothers resorted to less serious offences. Evidence from Gill and Loveday (2003) suggeststhat, in general, offenders take a blasé attitude to appearing in court and do not perceiveCCTV to be a serious problem. The one optimistic sign is that those who had been caughton camera were significantly more likely to view CCTV as a threat. Perhaps as more arecaught on CCTV, and as offenders become aware of this, the threat it is seen to pose willincrease. Understanding whether this will stop them offending or influence their behaviour insome other way must await further research.
Does CCTV help in catching and prosecuting offenders?
Early concerns that CCTV might become a substitute for police officers (Honess andCharman, 1992) do not appear to have been realised; indeed the public appear to favour
5
CCTV in perspective
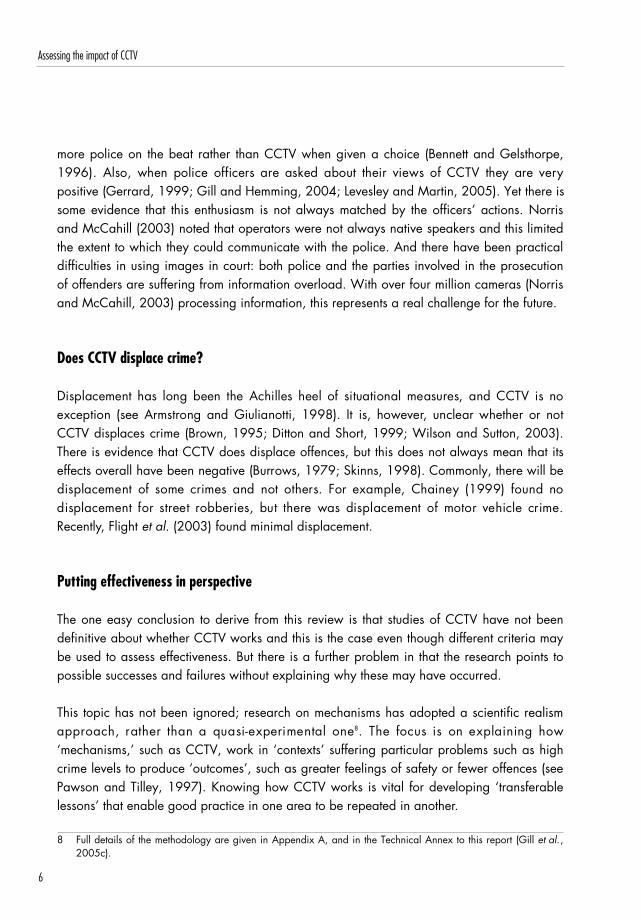
more police on the beat rather than CCTV when given a choice (Bennett and Gelsthorpe,1996). Also, when police officers are asked about their views of CCTV they are verypositive (Gerrard, 1999; Gill and Hemming, 2004; Levesley and Martin, 2005). Yet there issome evidence that this enthusiasm is not always matched by the officers’ actions. Norrisand McCahill (2003) noted that operators were not always native speakers and this limitedthe extent to which they could communicate with the police. And there have been practicaldifficulties in using images in court: both police and the parties involved in the prosecutionof offenders are suffering from information overload. With over four million cameras (Norrisand McCahill, 2003) processing information, this represents a real challenge for the future.
Does CCTV displace crime?
Displacement has long been the Achilles heel of situational measures, and CCTV is noexception (see Arm s t rong and Giulianotti, 1998). It is, however, unclear whether or notCCTV displaces crime (Brown, 1995; Ditton and Short, 1999; Wilson and Sutton, 2003).There is evidence that CCTV does displace offences, but this does not always mean that itseffects overall have been negative (Burrows, 1979; Skinns, 1998). Commonly, there will bedisplacement of some crimes and not others. For example, Chainey (1999) found nodisplacement for street robberies, but there was displacement of motor vehicle crime.Recently, Flight et al. (2003) found minimal displacement.
Putting effectiveness in perspective
The one easy conclusion to derive from this review is that studies of CCTV have not beendefinitive about whether CCTV works and this is the case even though different criteria maybe used to assess effectiveness. But there is a further problem in that the research points topossible successes and failures without explaining why these may have occurred.
This topic has not been ignored; research on mechanisms has adopted a scientific realisma p p roach, rather than a quasi-experimental one8. The focus is on explaining how‘mechanisms,’ such as CCTV, work in ‘contexts’ suffering particular problems such as highcrime levels to produce ‘outcomes’, such as greater feelings of safety or fewer offences (seePawson and Tilley, 1997). Knowing how CCTV works is vital for developing ‘transferablelessons’ that enable good practice in one area to be repeated in another.
Assessing the impact of CCTV
6
8 Full details of the methodology are given in Appendix A, and in the Technical Annex to this report (Gill et al.,2005c).

The mechanism, that is the process by which CCTV could and does bring about change,has been discussed in several studies. Listed below are a number of mechanisms, devisedby Tilley (1993), which seek to explain how CCTV may work:
● Caught in the act – CCTV could reduce crime by increasing the likelihood thatp resent offenders will be caught, stopped, removed, punished and there f o redeterred.
● You’ve been framed – CCTV could reduce crime by deterring potential offenderswho will not want to be observed by CCTV operators or have evidence againstthem captured on camera9.
● Nosy parker – a reduction could take place because more natural surveillance isencouraged as more people use the area covered by CCTV. This may deteroffenders who fear an increased risk of apprehension.
● Effective deployment – CCTV may facilitate the effective deployment of securitys t a ff and police officers to locations where suspicious behaviour is occurr i n g .Their presence may deter offenders, or may mean they are caught in the act.
● Publicity (general) – this may assist in deterring offenders.
● Publicity (specific) – CCTV cameras and signs show people are taking crimeseriously, and thus offenders may be deterred.
● Time for crime – CCTV may have less of an impact on crimes that can be donequickly as opposed to those that take a longer time, as offenders assume that theywill have enough time to avoid the cameras, or to escape from police officers andsecurity staff.
● Memory jogging – publicity about CCTV encourages potential victims to be moresecurity conscious and to take precautionary measures.
● Appeal to the cautious – those who are more security-minded use the areas withCCTV, driving out the more careless who may be vulnerable to crime elsewhere.
7
CCTV in perspective
9 An extension to this mechanism; police, door staff and shop assistants were observed indicating the presence ofCCTV to potential troublemakers, thus deterring them from committing an offence.

Gill and Turbin (1998; 1999; and see Sarno et al. 1999) have suggested othermechanisms:
● CCTV may give third parties (shop staff, members of the public, householders)more confidence to challenge offenders, thereby preventing or deterring them.
● By viewing CCTV monitors, police and others may be able to more eff e c t i v e l ypinpoint trouble spots, times, activities etc., and anticipate/remove crime catalysts.
H o w e v e r, as the authors note, CCTV may not always operate positively. Gill and Tu r b i n(1999) have identified a number of negative effects that CCTV could have:
● Officials’ (police etc.) and third parties’ vigilance may decrease as they begin torely on CCTV, creating both additional possibilities for crime and reducing thebenefits of vigilance.
● CCTV may reduce natural surveillance as fewer people use the area, becausethey dislike the idea of being watched.
What studies have shown is that CCTV was successful on some criteria and unsuccessful onothers. It is there f o re important to understand the many potential benefits of CCTV whenconsidering effectiveness. Understanding the different aims of CCTV, and the mechanismsby which those aims are to be realised, provides a theory of how CCTV should work, and ahypothesis for the evaluation. Even this, though, is complicated. Objectives are not alwaysclearly set, and they may change over time (Ditton et al. 1999). More o v e r, pre c i s e l ybecause CCTV systems differ, and contexts can be enormously complicated, comparing thefindings of one study with those of another re q u i res close attention to detail, whichfrequently does not appear in evaluation reports.
There is one other aspect of CCTV that is important in any discussion about impact, and thatis the cost-effectiveness of CCTV. For policy purposes, the ultimate test of a positive impact iswhether it can be reproduced at a cost-effective price. This is another topic where there is acrucial gap in knowledge.
Assessing the impact of CCTV
8

Conclusion
R e s e a rch on the effectiveness of CCTV has painted a somewhat confusing picture. There areplenty of studies showing successes, but plenty highlighting failures too. The most robust studies,a c c o rding to the criteria deemed acceptable according to the Campbell Collaboration,compound the confusion. While CCTV in some locations, and car parks are the best example,show some success, it is typically introduced alongside other measures. No single study appearsto have included a process and impact evaluation taking account of the various objectives andseeking to develop transferable lessons for good practice. More o v e r, residential areas havereceived scant coverage and there is little knowledge about whether CCTV works there.
This study
The present evaluation can only fill some of the gaps highlighted above. The work wasimpeded by implementation delays and failures, which in some cases led to schemes beingdropped from the evaluation, and lack of access to data, which in some cases rendered theanalyses less robust than had been hoped. In the presentation of findings that follows,important findings and trends that emerge from those schemes where the data allowed amore rigorous analysis are highlighted.
The findings were derived from a process and impact evaluation of 13 CCTV projects thatreceived money under Phase 2 of the CCTV Initiative. These systems were installed across arange of sites including town centres, city centres, car parks and residential areas, and others,which incorporate diversity of a diff e rent kind, including an industrial estate, a park, art e r i a lroads and hospitals. Some of the findings relating to the process evaluation have beenpublished already (Gill et al. 2003; Smith et al. 2003), but this is the first time the findings onimpact have been made available. Specifically, this study incorporates the following elements:
● A quasi-experimental and realist approach incorporating a cost-eff e c t i v e n e s sevaluation. It measured the impact of CCTV on levels of recorded crime and fearof crime, and identified the mechanisms, which explain this impact.
● A measurement of changes in levels of crime and fear of crime in the intervention are aand a comparable control, before and after the CCTV system had been installed1 0.
9
CCTV in perspective
10 Systems were often installed over a period of several months, varying from one to, in one extreme case, eightmonths. The two-year pre-intervention period was measured retrospectively from the point at which the first polewas installed, whereas the two-year post-implementation period was measured from the point at which the firstcamera was connected to the control room and monitored.

C o n t rol areas were selected because of their similar socio-demographic andgeographical characteristics and crime pro b l e m s .
● Time series analysis was conducted on the crime data to account for fluctuationsin crime levels over time. It measured changes in crime levels during two yearsprior to and two years following installation of CCTV where the timescale of theevaluation allowed11.
● W h e re appropriate any changes in crime in a buffer area were assessed, inorder to measure any displacement or diffusion of benefits.
● The identification of other interventions being carried out within the target areaand control areas, so that any confounding factors could be accounted for.
● The process that led to the choice of CCTV, and the extent to which CCTV wasevaluated as a solution to local problems.
● The evolution of the aims and objectives of projects tracing any changes thatoccurred over the course of time.
● The management of CCTV schemes.
● The technical specification and design of the CCTV system and any complicationsthat arose.
● The process of implementing and installing the CCTV systems.
● The control room operations, including the work of operators and themanagement approaches to overseeing their work.
● The costs of the schemes.
Outline of report
Chapter 2 presents a description of the projects that were evaluated and highlights therange of different contexts of systems, including their type and size.
Assessing the impact of CCTV
10
11 Eight out of the 14 projects under evaluation.

Chapter 3 describes the impact of CCTV on crime, disorder and fear of crime. Chapter 4evaluates the characteristics of CCTV schemes that can facilitate a project meeting, or notmeeting, its objectives. The key characteristics can be grouped under five headings: systemobjectives, management of the projects, density, coverage and positioning of cameras,technical characteristics, and control room operation.
Chapter 5 presents a financial assessment, identifying the outputs of each project andcomparing these with the inputs invested in each. It outlines the potential costs and benefitsof CCTV before detailing the actual cost of each system. It then suggests whether the CCTVsystems were cost-effective.
Chapter 6 assesses what has been learnt about the effectiveness of CCTV. It outlines thec i rcumstances in which it appears to have worked, or not worked, and the impact thatparticular characteristics of CCTV systems have.
11
CCTV in perspective

Assessing the impact of CCTV
12
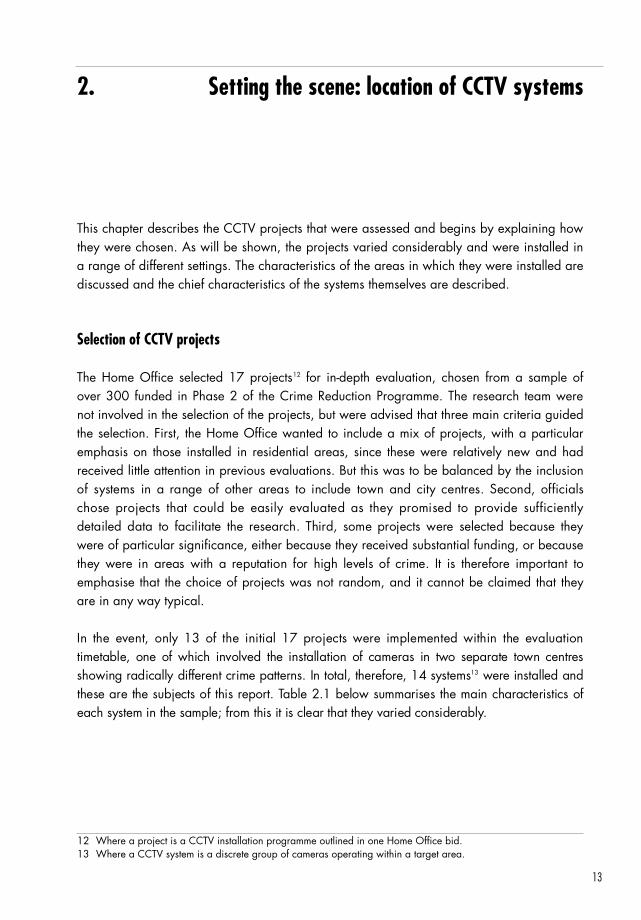
2. Setting the scene: location of CCTV systems
This chapter describes the CCTV projects that were assessed and begins by explaining howthey were chosen. As will be shown, the projects varied considerably and were installed ina range of different settings. The characteristics of the areas in which they were installed arediscussed and the chief characteristics of the systems themselves are described.
Selection of CCTV projects
The Home Office selected 17 projects12 for in-depth evaluation, chosen from a sample ofover 300 funded in Phase 2 of the Crime Reduction Programme. The research team werenot involved in the selection of the projects, but were advised that three main criteria guidedthe selection. First, the Home Office wanted to include a mix of projects, with a particularemphasis on those installed in residential areas, since these were relatively new and hadreceived little attention in previous evaluations. But this was to be balanced by the inclusionof systems in a range of other areas to include town and city centres. Second, off i c i a l schose projects that could be easily evaluated as they promised to provide suff i c i e n t l ydetailed data to facilitate the re s e a rch. Third, some projects were selected because theywere of particular significance, either because they received substantial funding, or becausethey were in areas with a reputation for high levels of crime. It is there f o re important toemphasise that the choice of projects was not random, and it cannot be claimed that theyare in any way typical.
In the event, only 13 of the initial 17 projects were implemented within the evaluationtimetable, one of which involved the installation of cameras in two separate town centre sshowing radically diff e rent crime patterns. In total, there f o re, 14 systems1 3 w e re installed andthese are the subjects of this re p o rt. Table 2.1 below summarises the main characteristics ofeach system in the sample; from this it is clear that they varied considerably.
13
12 Where a project is a CCTV installation programme outlined in one Home Office bid. 13 Where a CCTV system is a discrete group of cameras operating within a target area.
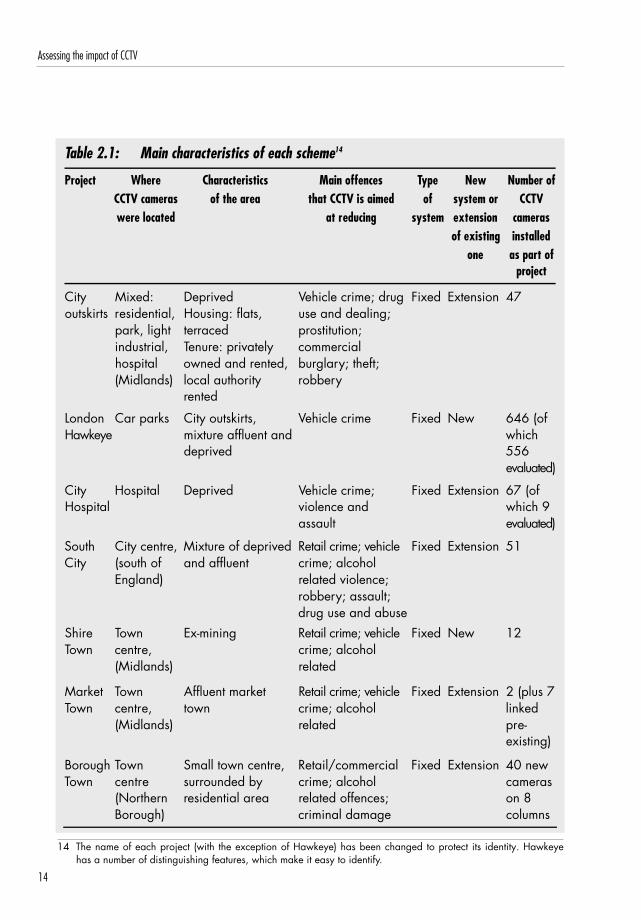
Table 2.1: Main characteristics of each scheme14
Project Where Characteristics Main offences Type New Number of CCTV cameras of the area that CCTV is aimed of system or CCTV were located at reducing system extension cameras
of existing installed one as part of
project
Assessing the impact of CCTV
14
Cityoutskirts
Mixed:residential,park, lightindustrial,hospital(Midlands)
DeprivedHousing: flats,terracedTenure: privatelyowned and rented,local authorityrented
Vehicle crime; druguse and dealing;prostitution;commercialburglary; theft;robbery
Fixed Extension 47
LondonH a w k e y e
Car parks City outskirts,mixture affluent anddeprived
Vehicle crime Fixed New 646 (ofwhich556e v a l u a t e d)
CityHospital
Hospital Deprived Vehicle crime;violence andassault
Fixed Extension 67 (ofwhich 9e v a l u a t e d)
SouthCity
City centre,(south ofEngland)
Mixture of deprivedand affluent
Retail crime; vehiclecrime; alcoholrelated violence;robbery; assault;drug use and abuse
Fixed Extension 51
ShireTown
Towncentre,(Midlands)
Ex-mining Retail crime; vehiclecrime; alcoholrelated
Fixed New 12
MarketTown
Towncentre,(Midlands)
Affluent markettown
Retail crime; vehiclecrime; alcoholrelated
Fixed Extension 2 (plus 7linkedpre-existing)
BoroughTown
To w nc e n t re(NorthernBorough)
Small town centre,surrounded byresidential area
Retail/commercialcrime; alcoholrelated offences;criminal damage
Fixed Extension 40 newcamerason 8columns
14 The name of each project (with the exception of Hawkeye) has been changed to protect its identity. Hawkeyehas a number of distinguishing features, which make it easy to identify.
Project Where Characteristics Main offences Type New Number of CCTV cameras of the area that CCTV is aimed of system or CCTV were located at reducing system extension cameras
of existing installed one as part of
project
15
Setting the scene: location of CCTV systems
N o rt h e rnEstate
Residential (NorthEngland)
DeprivedHousing: flats;Tenure: localauthority
Criminal damage,vehicle crime,burglary, juveniledisorder
Fixed New 11
We s t c a pEstate
Residential (WestLondon)
Deprived Housing: flats,terraced Tenure: localauthority
Fear of crime Fixed Extension 12
E a s t c a pEstate
Residential (Kent)
DeprivedHousing: terracedTenure: localauthority rented
Burglary, criminaldamage, vehiclecrime, communitydisorder
Fixed New 12
D u a lEstate
2 residential, 1 main ro a d(Kent)
DeprivedHousing: semi-detached, flatsTenure: localauthoritySome shops
Anti-socialbehaviour,harassment
Fixed New 14
S o u t h c a pEstate
Residential(SouthLondon)
Deprived Housing: flatsTenure: localauthority
Robbery; burglary;drug dealing andusing; prostitution;graffiti; vehiclecrime
Fixed Extension 148
Borough Residential(KentBorough)
Borough-wideMixed affluence
Anti-socialbehaviour
Rede-ploy-able
New 8camerason anylamp-post
DeployEstate
3 Residential1 station1 shoppingarea (Kent)
Deprived Housing: flats, semi-detached housing Tenure: rented HA
Vehicle crime;burglary; criminaldamage; fly-tipping; disorder
Rede-ploy-able
New 11

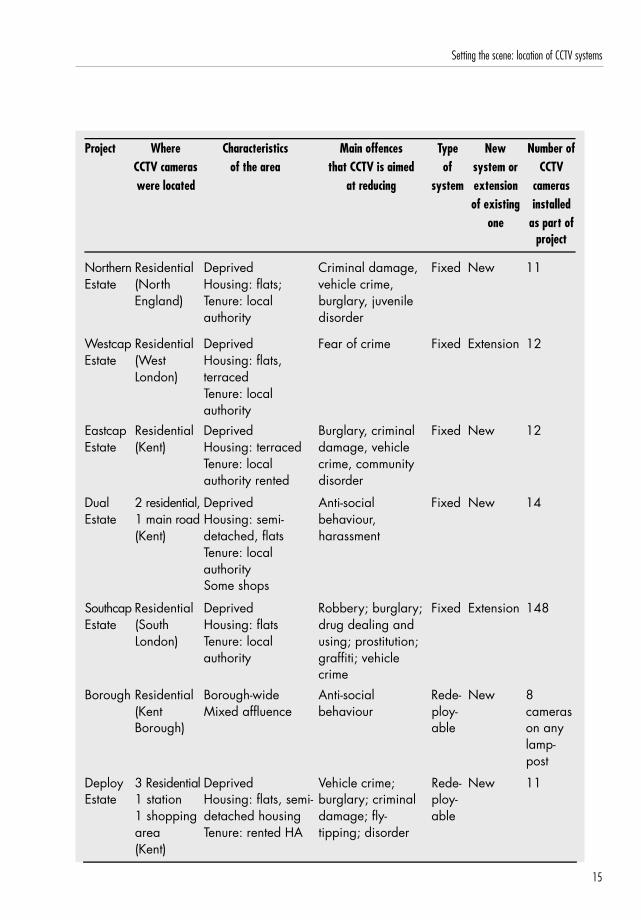
Seven of the final sample were located in residential areas, reflecting the Home Off i c e ’sparticular wish to assess the effectiveness of CCTV in these places. In addition, three systemswere installed in urban centres, one in a city centre, one in and around a hospital, one in60 car parks spread across London, and another in a range of different areas including aresidential area, a park, an industrial area and a hospital. Moreover, some parts of systemscovered other types of areas, such as shopping precincts, a station and a main road. Theareas were located in different parts of England, including the North East, the North West,the Midlands and the South West, but half of the residential systems were in the London andKent conurbations.
Area characteristics
The residential areas in the sample were similar in at least some respects. They were allurban, being situated within a mile or two of town or city centres. Generally, they weredeprived relative to their surroundings, in wards which were in the top ten per cent of themost deprived in the UK15. Thus, residential areas tended to consist of social housing, andt h e re was an abundance of flats, although the sample also included estates, or parts oftowns, with a high proportion of semi-detached and terraced properties.
H o w e v e r, the areas presented a disparate range of crime and disorder problems. Mostresidential areas suffered from low-level crime and disorder such as anti-social behaviour,juvenile disorder and criminal damage, and these are commonly associated with areas ofdeprivation (compare for instance Simmons and Dodd, 2003). However, whilst thre ep rojects presented o n l y these problems, others commonly suff e red from more seriouso ffences such as drug use and abuse, shop theft, burg l a ry and vehicle crime. One are a(Southcap Estate) suff e red from a range of more serious crimes, such as assault andro b b e ry, in addition to having what was considered a serious drugs problem. Thesedistinguished it from all other residential areas.
The town and city centres shared fewer characteristics, but presented similar crime anddisorder problems. The areas varied in size from a couple of streets to a mile square; theyw e re located throughout England and included shire, metropolitan and borough centre s ;and they varied from a city centre of high deprivation to a relatively affluent market town.All the town and city centres suffered from shoplifting during the day and alcohol-relatedviolence at night, as well as a high rate of vehicle crime. In the city centre, there was a highproportion of other offences such as robbery, theft, assault and drug-use/supply.
Assessing the impact of CCTV
16
15 Index of Multiple Deprivation 2000; http://www.neighbourhood.statistics.gov.uk

One scheme (Hawkeye) consisted of 60 car parks, varying in size from 20 to 300 spaces.They were attached to the public transport system north of London and were spread acrossa wide area, stretching from the outskirts of the city centre to 20 miles north. While somecar parks were situated within relatively affluent areas, others were not. Certainly the vehiclecrime rates for the car parks varied considerably: one or two suffered from high rates ofvehicle-related crime but the majority experienced extremely low levels. Four suffered over100 vehicle-related incidents in the year prior to installation of CCTV, whilst 25 suff e re dfewer than ten incidents a year.
The size of the systems
The sample comprised systems of a range of sizes. Seven of the 14 systems consisted ofbetween eight and 18 cameras, of which five were installed in residential areas. Foursystems of between 40 and 70 cameras were installed across different types of area. Twosystems were much bigger than the rest. In one residential area, with more serious crimeproblems, 175 cameras were installed, and the London car park system consisted of 600cameras installed in 60 car parks.
Fixed or redeployable systems?
The sample consisted mostly of fixed systems, where individual cameras could not be movedf rom one location to another. Only two systems were redeployable, and these diff e re dmarkedly in their level of flexibility. In one system, the cameras could be installed on any ofa fixed number of poles in residential areas, a shopping precinct and a station. In the othersystem, the cameras could be installed on lamp-posts. These were installed in re s i d e n t i a lareas, along main roads and outside pubs and amenities.
New systems/additions to old systems?
Seven of the projects extended existing CCTV systems whilst others were installed in areaswith no experience of this measure. The system extensions included all but one of the townor city centre schemes, as well as two installed in residential areas. All the entirely newsystems were installed in residential areas, except the 600-camera car park system.
17
Setting the scene: location of CCTV systems

Summary
The CCTV systems differed markedly both in terms of type and location. This offered theopportunity to assess the importance of context in examining the impact of the systems. Thefindings are discussed in Chapter 3.
Assessing the impact of CCTV
18

3. Does CCTV work?Its impact on crime and the fear of crime
This chapter assesses the impact of CCTV on crime, disorder and the fear of crime. It alsoaims to measure the extent to which the specific objectives of individual CCTV systems havebeen met. It explores some of the mechanisms that enabled certain CCTV systems to havean impact, and the factors that prevented others from doing so.
The section headed Impact on crime measures the change in police recorded crime acrossall the systems covered by the present study, following the installation of CCTV. It identifiesthe systems showing a reduction or an increase in all relevant crime and, wherea p p ropriate, it explores whether these changes could be attributed to the CCTV systemrather than other factors. Where the changes can be attributed to the CCTV system itidentifies the mechanisms by which the system is likely to have achieved this outcome.
The impact of CCTV on particular types of offence is then discussed. This is important for atleast two reasons. First, random fluctuations in individual crimes could cancel out the impactof CCTV. Second, previous studies have shown that CCTV systems can influence therecorded levels of different offences in a number of ways. The changes in crime patternsacross all the systems are measured before changes in individual cases are identified andthe mechanisms behind these explored.
F i n a l l y, the section assesses the impact of a range of (quantitative) variables such as thelevel of camera coverage and the types of camera.
The section headed Public attitudes to CCTV following its installation investigates the impactof CCTV on public perceptions by re f e rence to the findings of a public attitude surv e ycarried out in nine residential and three town or city centres15 prior to and then after theinstallation of CCTV. It reports on awareness of CCTV in each area, assessing its impact onfear of crime, on behaviour, and on levels of support for CCTV.
The final section summarises the main findings that emerge from the study.
19
15 The public attitude survey included a project which was subsequently excluded from the evaluation. Cameraswere installed in this area but significant delays to implementation meant that a full evaluation could not beconducted within the research period.

Analysis of data
The main objective of the crime data analysis was to measure the particular impact of theCCTV projects on a variety of outcomes. Police crime statistics and public attitudes to CCTVwere examined in a number of ways. The exact methodology used is described in an on-linereport (see Gill et al. 2005c).
A quasi-experimental model of evaluation was used with the aim of achieving wherepossible Level 3 of the Maryland Scientific Methods Scale (Sherman et al. 2002), whichrequires a measurement of change of crime both before and after the installation of CCTV inboth a target and control area. Furthermore, it aimed to measure change for a significantlength of time following implementation.
In practice, the achievement of Level 3 was constrained by the difficulty of identifying asuitable control for each target area and the unavailability or poor quality of police crimedata. Moreover, many projects were slow to come into operation. Table 3.1 examines thequality of data used in the analysis, highlighting the projects for which a suitable controla rea was identified, the number of months for which crime data were available afterimplementation, whether a public attitude survey was conducted in the area, and thep recision of the disaggregated crime data supplied by the police. Projects are ord e re daccording to the quality of data available and the length of the follow-up period. It can beseen that seven projects had a comparable control, achieving Level 3 of the Mary l a n dScientific Methods Scale (Sherman et al. 2002); one of these had only four months of datafollowing full implementation. Six of the seven control areas were within the same policedivision as the target area and one was located in another police force. Where no controlcould be identified, crime rates were compared with those in the division17. Surveys werecarried out in ten18 projects, covering 12 target areas.
Assessing the impact of CCTV
20
17 However, the results in this study give little indication that a control area provides a better comparison than thedivision. In two systems for which both control and divisional data were available within the same police forcedivision (Eastcap and Northern Estate) analysis was carried out to assess the impact of the choice of control onthe interpretation of the results, particularly the relative effect size ratio between the control and the target areas.Little detectable difference in impact was found. In Eastcap Estate, the relative effect size comparing a controlarea with the target, was 1.03 as against 0.9 comparing the division with the target, and the correspondingconfidence intervals were 0.62-1.44 and 0.71-1.09 re s p e c t i v e l y. In Nort h e rn Estate the relative effect size,comparing a control area with the target, was 1.34 as against 1.23 comparing the division with the target, withcorresponding confidence intervals of 0.78-1.90 and 0.89-1.57 respectively. Further, subsequent examinationof trends in crime data indicated that in some instances the division was a better control than a control area, ascrime trends in the division more closely matched those in the intervention (or target) area than those in thecontrol area.
18 A public attitude survey was conducted in North City even though it was not subject to a full evaluation.
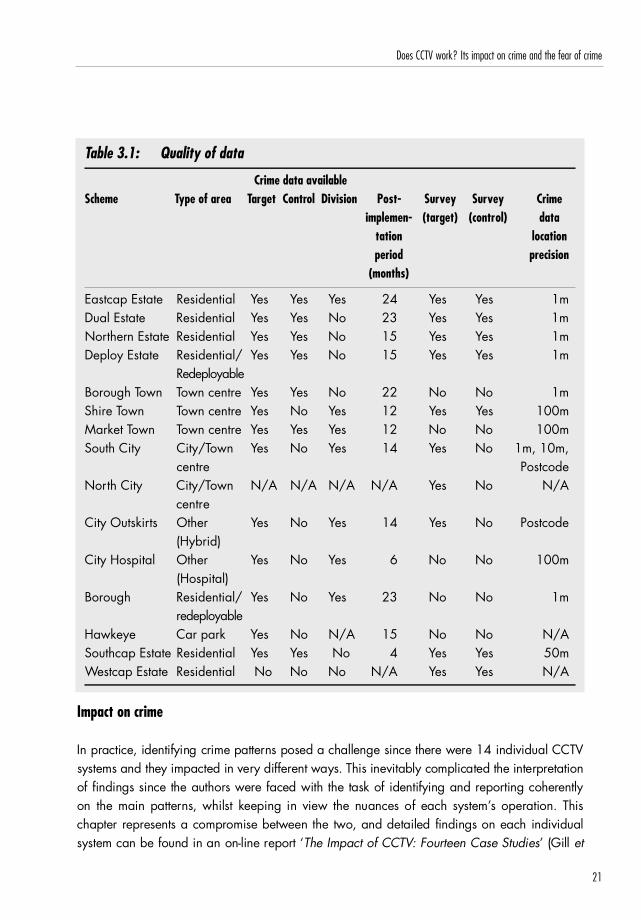
Table 3.1: Quality of data
Crime data availableScheme Type of area Target Control Division Post- Survey Survey Crime
implemen- (target) (control) data tation locationperiod precision
(months)
Eastcap Estate Residential Yes Yes Yes 24 Yes Yes 1mDual Estate Residential Yes Yes No 23 Yes Yes 1mNorthern Estate Residential Yes Yes No 15 Yes Yes 1mDeploy Estate Residential/ Yes Yes No 15 Yes Yes 1m
R e d e p l o y a b l eBorough Town Town centre Yes Yes No 22 No No 1mShire Town Town centre Yes No Yes 12 Yes Yes 100mMarket Town Town centre Yes Yes Yes 12 No No 100mSouth City City/Town Yes No Yes 14 Yes No 1m, 10m,
centre PostcodeNorth City City/Town N/A N/A N/A N/A Yes No N/A
centreCity Outskirts Other Yes No Yes 14 Yes No Postcode
(Hybrid)City Hospital Other Yes No Yes 6 No No 100m
(Hospital)Borough Residential/ Yes No Yes 23 No No 1m
re d e p l o y a b l eHawkeye Car park Yes No N/A 15 No No N/ASouthcap Estate Residential Yes Yes No 4 Yes Yes 50mWestcap Estate Residential No No No N/A Yes Yes N/A
Impact on crime
In practice, identifying crime patterns posed a challenge since there were 14 individual CCTVsystems and they impacted in very diff e rent ways. This inevitably complicated the interpre t a t i o nof findings since the authors were faced with the task of identifying and re p o rting cohere n t l yon the main patterns, whilst keeping in view the nuances of each system’s operation. Thischapter re p resents a compromise between the two, and detailed findings on each individualsystem can be found in an on-line re p o rt ‘The Impact of CCTV: Fourteen Case Studies’ (Gill e t
21
Does CCTV work? Its impact on crime and the fear of crime
a l . 2005b). In addition more detailed information on South City, Hawkeye and Nort h e rnEstate can be found in online re p o rts (Gill et al. 2005e, Gill et al. 2005f and Gill et al. 2 0 0 5 grespectively). These re p o rts have been produced to provide additional insights for CCTVsystems located in a city centres, car parks and residential are a s .
All systems had the overall objective of reducing crime, and the following results reflect thechanges in the aggregate level of all relevant offences, i.e. those the majority of which couldbe affected by the implementation of CCTV. For example, offences such as theft andviolence against the person that generally occur within a public place were included, whilethose that occur in private, such as theft in a dwelling, were not (see Appendix B for a fulllist of Home Office offences used). However, there are a number of aspects which must betaken into account.
Changes in all relevant crime The first task is to measure the absolute change in crime for each system following theinstallation of CCTV. A summary of findings is provided in Table 3.2. The table identifies anumber of features for each system, including the type of area (residential, town centre orother), and the type of comparison area used. It shows the absolute and percentage changein the level of crime in both the target and control area before and after CCTV wasinstalled. In most cases crime levels in the 12 months prior to installation were comparedwith levels for the 12 months following the systems’ ‘live date’19. In two cases (City Hospitaland Southcap Estate), only six months post-implementation data were available at the timeof the analysis.
The relative effect size column compares the change in recorded crime levels in a targetarea with that in the control to provide a relative measure of the difference between the two.Where this is greater than one, there was either a greater reduction in recorded crime levelsin the target area relative to the control, or a smaller increase in the target relative to thecontrol, so that in effect the relative crime levels in the target area are lower than the crimelevels in the control. The larger the number, the greater the difference between the two. Forinstance, the relative effect size of 1.38 in City Outskirts demonstrates that the reduction inrecorded crime in the target area was large compared with that in the control. Conversely,when the relative effect size is less than one, there is a greater increase in the target arearelative to the control, or a smaller reduction in the target area compared with the control,so that the relative crime levels in the target area are greater than those in the control. The
Assessing the impact of CCTV
22
19 Where the live date is the point at which some cameras in the system send images to the control room, whichare then monitored.

smaller the number the greater the difference. Whether or not the difference between thet a rget and the control is statistically significant depends on the width of the confidenceintervals (see Gill et al. 2004c).
In the table, systems are listed according to the type of area in which they were installed,with those with the greatest impact on recorded crime being listed first in each category. Itcan be seen that the percentage reduction in re c o rded crime levels in Hawkeye wassubstantially greater than that in all other areas (73 per cent). In the absence of a suitablec o n t rol for the Hawkeye system, the changes in vehicle crime were compared with thechanges in British Tr a n s p o rt Police (BTP) re c o rded vehicle crime for England (excludingLondon Underground) and these showed a statistically significant reduction.
This reduction can be explained in part by the type of system and the type of crimeanalysed. The cameras were installed exclusively in car parks in order to reduce vehiclecrime, and the analysis was concerned with vehicle crime only. Previous studies have shownCCTV to be particularly effective against these types of crime in car parks. In contrast, for allother systems the percentage change in all relevant crimes was measured, including thosewhich are showing a downward national trend (e.g. burg l a ry) (see Crime Statistics inEngland and Wales 200420) as well as those showing an increase (e.g. violence against theperson). Cumulatively these could cancel each other out.
23
Does CCTV work? Its impact on crime and the fear of crime
20 Based upon the summary of re c o rded crime data from 1898 to 2002/3 and Crime in England and Wa l e s2003/4. Available from http://www.homeoffice.gov.uk/rds/recordedcrime1.html

Assessing the impact of CCTV
24
21 The type of control could have influenced the effect size and confidence intervals. Both divisional and controlarea data were available for two areas (Eastcap Estate and Northern Estate) and the relative effect sizes andconfidence intervals were calculated comparing both division and target and control and target areas. However,these had showed no appreciable impact. For Eastcap Estate the relative effect size and confidence intervalswere 0.90 and 0.71-1.09 respectively. In Northern Estate these were 1.23 and 0.89-1.57 respectively.
* *
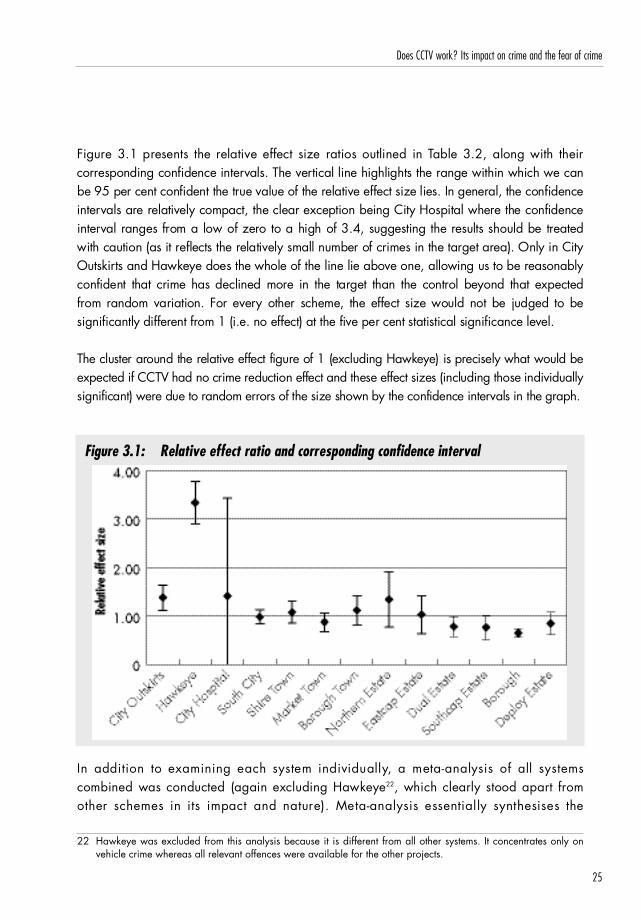
F i g u re 3.1 presents the relative effect size ratios outlined in Table 3.2, along with theirc o rresponding confidence intervals. The vertical line highlights the range within which we canbe 95 per cent confident the true value of the relative effect size lies. In general, the confidencei n t e rvals are relatively compact, the clear exception being City Hospital where the confidencei n t e rval ranges from a low of zero to a high of 3.4, suggesting the results should be tre a t e dwith caution (as it reflects the relatively small number of crimes in the target area). Only in CityO u t s k i rts and Hawkeye does the whole of the line lie above one, allowing us to be re a s o n a b l yconfident that crime has declined more in the target than the control beyond that expectedf rom random variation. For every other scheme, the effect size would not be judged to besignificantly diff e rent from 1 (i.e. no effect) at the five per cent statistical significance level.
The cluster around the relative effect figure of 1 (excluding Hawkeye) is precisely what would beexpected if CCTV had no crime reduction effect and these effect sizes (including those individuallysignificant) were due to random errors of the size shown by the confidence intervals in the graph.
Figure 3.1: Relative effect ratio and corresponding confidence interval
In addition to examining each system individually, a meta-analysis of all systemscombined was conducted (again excluding Hawkeye2 2, which clearly stood apart fro mother schemes in its impact and nature). Meta-analysis essentially synthesises the
25
Does CCTV work? Its impact on crime and the fear of crime
22 Hawkeye was excluded from this analysis because it is different from all other systems. It concentrates only onvehicle crime whereas all relevant offences were available for the other projects.

available information about a topic in order to arrive at a single summary estimate. Inthe present case the analysis was carried out to determine whether there was asignificant reduction in crime following installation of the CCTV projects. Two estimatesw e re made: the unweighted mean effect and the inverse variance weighted mean eff e c t .These two estimates provide diff e rent estimates of the likely effect the CCTV projects hadon crime rates.
The unweighted mean effect, the best estimate of the overall effect of CCTV if diff e rent amountsof crime reduction were expected in diff e rent sites was 1.02 with an associated 95 per centconfidence interval of +/– 0.14, implying there was no significant overall effect on crime.
If, on the other hand we assume that CCTV had the same effect in each system, masked onlyby the differences in variation, a better measure of overall effect size is provided by theinverse variance weighted mean (see, Egger et al. 1995; Lipsey and Wilson, 2001). Theestimated value of this was 0.88 with associated 95 per cent confidence limits of +/– 0.06.These results suggest that there was an overall i n c r e a s e in re c o rded crime followinginstallation of CCTV. However, these results are skewed by one (redeployable) system(Borough), which showed a significant increase in crime in the intervention period. This isinconsistent with the assumption of the same effect across sites. There are also doubts aboutthe estimated error for this system, and when this particular system was excluded from thecalculations, the overall effect size was 0.96 with +/– 0.08 95 per cent confidence limits,again suggesting that there was no overall effect on crime.
Patterns of changeFrom the above analyses the following patterns emerge.
Reduction in recorded crimeOut of the 13 systems analysed2 3, six showed a reduction in all relevant crime: CityOutskirts, Hawkeye, Northern Estate, City Hospital, South City and Shire Town. All exceptSouth City had a relative effect size greater than one and there f o re showed a gre a t e rreduction in the target than the control area, suggesting that CCTV could have played a rolein reducing crime in these areas. However, only two (City Outskirts and Hawkeye)p e rf o rmed statistically significantly better than their respective control areas following theintroduction of CCTV.
Assessing the impact of CCTV
26
23 Although included in the initial evaluation programme, no police recorded crime statistics were available forWestcap Estate.

Two other possible explanations for the changes in crime levels can be ruled out: first, thatthey reflect crime trends, which began before the CCTV systems were installed and, second,that they are attributable to confounding factors.
Prevailing crime trendsFigure 3.2 shows the level of crime mapped against the car parks in the Hawkeye systemwhich were live at any one time. It shows a steady decrease in crime as car parks becamelive, suggesting that in this system the reduction in vehicle crime could be attributed to theinstallation of CCTV.
Figure 3.2: Changes in crime levels against number of car parks with CCTV.
However, as shown in Figure 3.3, a different story emerges for the City Outskirts system.Figure 3.3 shows the recorded crime trends in the target area relative to the division and thebuffer area, also displaying the date of installation of camera poles and the live date of thesystem. Six months before poles were erected in the target area, the entire divisionexperienced a large increase in crime, coinciding with the introduction of new Home Officecounting rules24 Three months before the poles were erected crime levels began to decline
27
Does CCTV work? Its impact on crime and the fear of crime
24 The pattern of crime changes in the relevant police force precludes the adjustment of crime levels to take intoaccount changes in counting rules (Simmons et al, 2003).
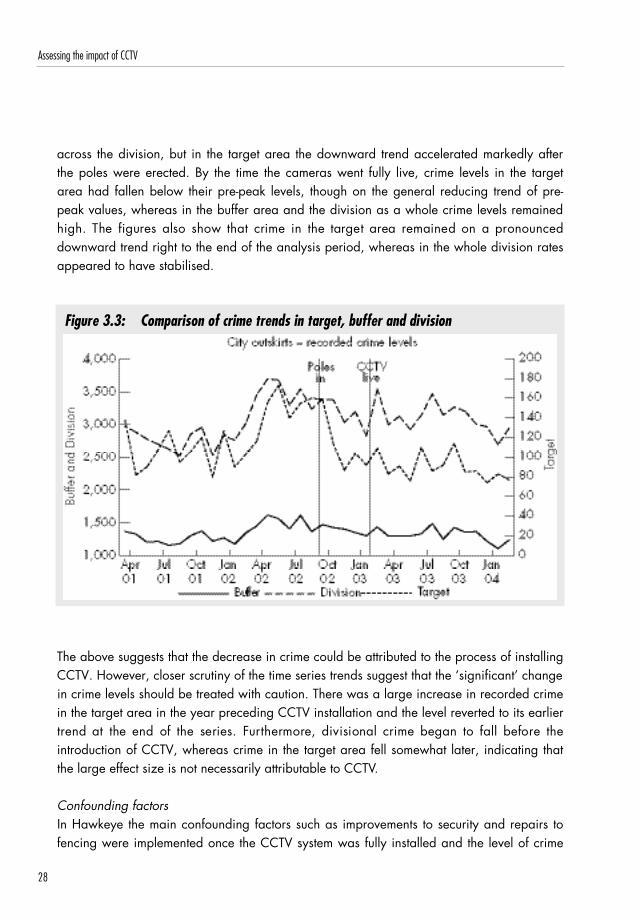
across the division, but in the target area the downward trend accelerated markedly afterthe poles were erected. By the time the cameras went fully live, crime levels in the targetarea had fallen below their pre-peak levels, though on the general reducing trend of pre-peak values, whereas in the buffer area and the division as a whole crime levels remainedhigh. The figures also show that crime in the target area remained on a pro n o u n c e ddownward trend right to the end of the analysis period, whereas in the whole division ratesappeared to have stabilised.
Figure 3.3: Comparison of crime trends in target, buffer and division
The above suggests that the decrease in crime could be attributed to the process of installingCCTV. However, closer scrutiny of the time series trends suggest that the ‘significant’ changein crime levels should be treated with caution. There was a large increase in recorded crimein the target area in the year preceding CCTV installation and the level reverted to its earliert rend at the end of the series. Furt h e rm o re, divisional crime began to fall before theintroduction of CCTV, whereas crime in the target area fell somewhat later, indicating thatthe large effect size is not necessarily attributable to CCTV.
Confounding factorsIn Hawkeye the main confounding factors such as improvements to security and repairs tofencing were implemented once the CCTV system was fully installed and the level of crime
Assessing the impact of CCTV
28

was already low. However, in City Outskirts a number of factors could have accounted forthe 28 per cent reduction in overall crime. The new CCTV system was supported byimprovements in lighting in November 2002, which coincided with the reduction in crimelevels. A further two potential confounding factors,- major renovation works to the arboretum( M a rch 2003) and the establishment of a visual communication link between the contro lroom and the police (April 2003), occurred immediately after the system went live.H o w e v e r, by this time crime levels were already levelling out, and CCTV may still becredited with the earlier positive effect.
ConclusionsCCTV can definitely be said to have reduced overall levels of recorded crime in only onesystem, Hawkeye, and this is worthy of further scrutiny. First, there were large discrepanciesin the severity of the crime problems across the 58 car parks evaluated. Some suff e re dv i rtually no crime even before CCTV was installed, while others suff e red a high level.T h e re f o re, the car parks were divided into high2 5, medium2 6 or low risk2 7 c a t e g o r i e sa c c o rding to the seriousness of the crime problem before CCTV was installed. Table 3.3below shows the change in each category of car park.
Table 3.3: Changes in vehicle crime in high, medium and low risk car parks.
Type of Target Target Control Control Is this Relative Confidence car park absolute change absolute change significant effect intervals
change (%) change (%) size
High risk 555-111 –80 12,590-11,335 –10 Yes 4.5 3.65-5.55Medium risk 190-72 –62 12,590-11,335 –10 Yes 2.38 1.8-3.14Low risk 49-31 –37 12,590-11,335 –10 No 1.42 0.9-2.25
The reduction in vehicle crime was greater (80 per cent) for those car parks that had thehighest ratio of crimes per parking space before the cameras were installed, and this wasstatistically significant. These tended to be the larger car parks, which suff e red gre a t e rabsolute levels of crime.
Medium and low-risk car parks showed smaller, but nevertheless marked decreases (62 percent and 37 per cent respectively). However, in low-risk car parks this was not significant.These tended to comprise fewer spaces and suffered low absolute levels of crime prior to
29
Does CCTV work? Its impact on crime and the fear of crime
25 0.24-1.48 offences per space in the year preceding CCTV installation26 0.8-0.23 crimes per space in the year preceding CCTV installation 27 0-0.7crimes per space in the year preceding CCTV installation.

installation. Hence a 37 per cent reduction in crime represents a decrease from only 49 to31 offences in a year across all 21 low-risk car parks.
In terms of the mechanisms by which this system operated, it is likely that it worked througha mixture of detection and deterrence. Many offences were detected by the provision ofphotographic evidence about (known) prolific offenders to the police, leading to their arrestand prosecution. Interviews with vehicle squad police officers indicated that a few offendersw e re responsible for several offences and the new CCTV system provided additionalevidence, which allowed multiple offences to be attributed to one offender, thus increasingthe detection rate.
C o n t rol room re c o rds showed that during the period of the evaluation 14 pieces of evidence permonth were provided to the police, which related to a significant pro p o rtion of the 442 8 c r i m e sper month committed in the car parks. Interviews with police suggested that the majority ofimages were of good enough quality to be helpful. Further evidence for the use of CCTVfootage to increase the detection of crime was provided by the police detection rate for criminalo ffences, which increased from nine per cent in 2001-2002 to 27 per cent in 2003-20042 9.
H o w e v e r, the detection effect can account for only a pro p o rtion of the total reduction incrime. The operators were keen, but there were not many screens for viewing images from allthe cameras and, since car parks were not that busy, viewing them was routine and evenboring. It is likely, there f o re, that the system also worked through deterrence. The camerasw e re of box design and were clearly visible, and there was clear signage at the entrance toeach car park. Furt h e rm o re, there was 95-100 per cent coverage of the car parks and itwould be apparent to would-be offenders that they could not easily avoid the cameras’ gaze.
Increase in crimeThe remaining seven target areas all experienced an increase in crime ranging from 0.3 –73 per cent (Market Town, Borough Town, Eastcap Estate, Dual Estate, Southcap Estate andBorough), and in five of these (Market Town, Dual Estate, Southcap Estate, Borough andDeploy Estate) the relative effect size was less than one indicating that the increase in thetarget area was greater than that in the control. This suggests that CCTV could possibly haveincreased recorded crime in these areas; and this could have resulted from an increase inre p o rting. For instance, the presence of CCTV could have prompted more individuals toreport crime to the police, or alternatively the police could have become more aware ofcrime in the areas in which CCTV was installed.
Assessing the impact of CCTV
30
28 Based on pre-installation figures. 29 Statistics provided to the fieldworker.
However, none of these results was incompatible with the view that the differences had beenwholly due to chance variation. In only one of these target areas (Borough) was the increasestatistically significant. However, in this scheme crime rose in both the buffer and targ e tareas in the 12 months following the intervention and then fell back to the pre-interventionvalues. This is likely to be due to a change unconnected to CCTV.
Aspects that could be linked with changes in recorded crime levels As described below there are a number of characteristics which could be linked toreductions in crime.
Type of CCTV systemThe first characteristic of CCTV systems which could be linked to an overall change in re c o rd e dcrime levels was the location of the system. Those installed in areas which were neither town norcity centres nor residential areas witnessed the greatest percentage reduction in crime. This mayhave been influenced by the accessibility of the areas. For example, the majority of car parkswithin the Hawkeye system and the City Hospital site were surrounded by physical boundaries.Access points to these sites were there f o re generally easily controlled and even more so after thei n t roduction of CCTV, whereas town centres and residential streets provide open access.
Residential systems re c o rded varying results; in only one was there actually a (non-significant) reduction in crime; in another the increase was smaller than in the comparisonarea. For the remaining four, including both redeployable schemes, the percentage increasein crime was greater than in the comparison area.
None of the town centre systems showed a statistically significant difference in the targetarea relative to the control, although Market Town showed a larger increase in the targetarea than the control.
To summarise, those schemes installed in areas which were neither residential nor town orcity centres showed a greater reduction in crime, whereas the effects of CCTV in residentialor town or city centre areas varied. Redeployable schemes showed no reduction in long-term crime levels. However, both redeployable schemes were intended to address short-termcrime problems, so this is less surprising.
Camera layout and typesIt is possible that the relative effect size is related to the characteristics of the camerasystems. Table 3.4 gives details of the numbers of cameras within each target area as wellas camera density and camera coverage.
31
Does CCTV work? Its impact on crime and the fear of crime

Table 3.4: Camera details of each system
System Type No. of evaluated Camera density Percentage of target cameras (cameras/km2) area covered by cameras
(camera coverage)
City Outskirts Hybrid 47 64 68Hawkeye Car Park 556 N/A 95-100 *City Hospital Hospital 9 67 76South City Town centre 51 73 72Shire Town Town centre 12 94 76Market Town Town centre 9 93 34Borough Town Town centre 40 325 70Northern Estate Residential 11 127 87Eastcap Estate Residential 10 29 29Dual Estate Residential 10 11 9Southcap Estate Residential 148 184 73Areas C and D Residential 40 253 88Borough Residential/ 8 N/A N/A
RedeployableDeploy Estate Residential/ 11 25 ** 34 **
Redeployable (on 19 poles)
* Based on information obtained from system installers. ** Calculated on maximum coverage, assuming a camera on each pole. At any one time camera coverage will
be less than the maximum.
Camera density is calculated by dividing the number of cameras within the target area byits size. Results are given as cameras per square kilometre. The camera coverage area isthe area that can theoretically be seen by the cameras, technically known as the camera’sviewshed (see Gill et al. 2005c to see how this is calculated). Results are given as apercentage of the target area which can be seen by the cameras.
Assessment of camera coverage showed that those systems with a large coverage tended toreduce crime more than those with smaller coverage. A positive correlation of 0.51 betweencamera coverage and effect size was found. This however was not significant30.
Assessing the impact of CCTV
32
30 A two-tailed Pearson Correlation was used. All projects were included except for Borough, which was omittedowing to the nature of the system. CCTV was installed in a spasmodic fashion as a reaction to crime hotspotareas, whereas all other systems had a designated target area. It was therefore not possible to obtain a reliablecamera coverage measure for Borough.

No such effect was noted for camera density when all systems were included in the analysis( c o rrelation of –0.06). However, two systems (Southcap Estate and Borough Town) hadparticularly high densities and small effect sizes, and when these were removed from theanalysis there was a (non-significant) correlation of 0.51. This suggests that there is agenerally positive relationship between density and crime reduction, but that the installationof large numbers of cameras provides no additional benefit. Numbers of cameras are not asimportant as their being strategically placed so as to view as much of the intended targetarea as possible.
Attempts to measure the effect of static cameras on recorded crime levels relative to pan, tiltand zoom (PTZ) cameras were inconclusive. Only one system (Hawkeye) used staticcameras exclusively, and although this area showed a huge decrease in re c o rded crimefollowing installation of CCTV, unlike other systems it measured only vehicle crime. Thecameras were installed in enclosed car parks, and provided almost 100 per cent coverage.All of these factors could account for the change in the level of crime. One other system( B o rough Town) combined static and pan tilt and zoom cameras and this showed amarginal increase in crime following installation of CCTV.
The above analysis used all relevant offences as indicators of perf o rmance. It is entire l ypossible that this catch-all categorisation hides some important impacts on individual crimetypes. Consequently, data on the individual offences was analysed separately.
Impact on different types of offence It has been shown that the CCTV schemes produced no overall effect on all relevant crimeviewed collectively; however it is possible that they impacted upon a particular type ofoffence, and this section examines that possibility.
Table 3.5 below summarises how the incidence of particular types of offence changed in thet a rget area as compared with their respective control areas after the implementation ofCCTV. Only those schemes where a relative effect size could be calculated (i.e. no zerofigure for offences in the before or after period in either the target or control areas) wereincluded; furt h e rm o re, Hawkeye was excluded from this analysis because only vehicleoffences were recorded and the data included offences that were not included within thevehicle crime category of the other schemes31.
33
Does CCTV work? Its impact on crime and the fear of crime
31 Hawkeye vehicle offences include criminal damage to vehicles which are part of the criminal damage crimetype category of the other schemes.

Table 3.5: Summary of the effect on each crime type since the installation of CCTVacross all schemes
Effect on Burglary Criminal Public Violence Vehicle Theft Theft Shoplifting Other crime since damage order against crime from of vehicle theftCCTV the vehicleinstalled person
Reduced 3 3 0 1 3 3 2 0 1(statistically significant)Reduced (non- 3 3 3 3 3 2 6 4 4statistically significant)
Increased 1 3 1 0 1 0 1 2 1(statistically significant)
I n c reased (non- 5 2 6 7 5 6 3 3 5statistically significant)
Relative 1.03 0.97 0.85 1.02 1.05 0.96 1.20 0.87 1.01effect sizeC o n f i d e n c e 0.79- 0.73- 0.67- 0.94- 0.81- 0.72- 0.88- 0.65- 0.75-intervals32 1.35 1.28 1.08 1.12 1.35 1.28 1.63 1.18 1.36
Significance (p< .05)Other theft refers to all theft not included within shoplifting and vehicle crime.
Taking burg l a ry as an example, six schemes experienced a reduction that was greater than thereduction within their respective control areas, although this reduction was statisticallysignificant in only three cases. A further six schemes experienced an increase in the rate ofb u rg l a ry relative to the control, although only in one was the diff e rence statistically significant.
For each crime type, overall effect sizes across all schemes were calculated, again using theinverse variance weighted mean. Given the effectiveness of CCTV in reducing crime inHawkeye vehicle crime could be expected to display a similar trend across all schemes.H o w e v e r, there appears to have been little effect on vehicle crime insofar as the estimated
Assessing the impact of CCTV
34
32 These confidence intervals have been estimated using the standard formula for the variance of the relative effectsize based on the natural logarithm. No adjustment for overdispersion was made since the variance / meanratio across all the major crime categories and locations was 1.4, and this was not too diff e rent from theexpected Poisson figure of 1.0.
e ffect size was 1.05. Investigating this further it is interesting to note that theft of motorvehicles and theft from motor vehicles (which together make up the vehicle crime category )displayed diff e rent patterns. The respective effect sizes indicate that theft of a motor vehicledisplayed the greatest reductions in the number of offences compared with their contro la reas. Public order offences displayed the least welcome results. However, none of theo ffence types showed a statistically significant change overall. There is thus little evidence thatCCTV reduces any of the relevant individual types of crime, at least judging by police data.
From the summary figures in Table 3.5 some general trends are evident. Those offences thata re often considered impulsive and influenced by alcohol, for example public order andviolence against the person (VAP), were seen to increase in number more in the target areasthan in their respective control areas. Public order offences increased in six out of tenrelevant schemes, while VAP rose in seven out of 11 relevant schemes. However, most ofthese changes were not statistically significant compared with the control. This could beattributed to the small numbers in each crime category, but equally these changes in crimecould be more indicative of a national upward trend in recorded violent crime (see CrimeStatistics in England and Wales 200433) than any effect of the CCTV systems. Table 3.5 alsoindicates that theft of motor vehicles showed a reduction in the majority of schemes.However, it was statistically significant in only two cases. Again, these results reflect thosefor crime in England and Wales, which have shown a reduction in Theft of a Motor vehicle(TOMV) since 199934.
Changes in individual crime types in specific project areasWhilst the above draws on the findings relating to all the systems studied for this report, thefollowing highlights the changes in crime (albeit small) in individual areas which allow us todetermine what effect CCTV might have had in specific circumstances.
Vehicle crimeSeven systems showed a fall in vehicle crime (including Hawkeye), and in two of these thechange was statistically significant (City Outskirts and Hawkeye). Table 3.6 shows therelevant changes in vehicle crimes across systems. The changes in Hawkeye could beattributed to the CCTV system as there were no significant confounding factors occurring atthe same time. So to some extent could those in Eastcap Estate, Deploy Estate and MarketTown, although the small numbers mean that any changes could be attributed to naturalvariance in crime figures so any conclusions should be drawn with caution.
35
Does CCTV work? Its impact on crime and the fear of crime
33 Based upon the summary of re c o rded crime data from 1898 to 2002/3 and Crime in England and Wa l e s2003/4. Available from http://www.homeoffice.gov.uk/rds/recordedcrime1.html
34 Op cit.

However, the declines in City Outskirts, City Hospital and South City could be attributed toconfounding factors occurring in the area as well as random variation in the case of SouthCity and City Hospital.
Table 3.6: Changes in vehicle crime one year following installation of CCTV
Absolute Target Control Control Is this Relative Confidence change change absolute change significant effect limits
(%) change (%) size
High risk 555-111 –80 12,590-11,335 –10 Yes 4.5 3.65-5.55City Outskirts 279-126 –55 6,993-6,412 –8 Yes 2.03 1.35-2.73Hawkeye 794-214 –73 12,590-11,335 –10 Yes 3.34 2.86-3.91City Hospital* 12-3 –75 1,201-1,486 24 N/A N/A N/ASouth City 1,641-972 – 41 17,825-12,912 –27 No 1.22 0.84-1.64Market Town 15-11 –27 4,072-3,827 –6 N/A N/A N/AEastcap Estate 77-69 –10 27-29 7 No 1.2 0.26-2.14Deploy Estate 164-152 –7 107-95 –11 No 0.96 0.58-1.33
* Based on six months post-implementation data.N A : Relative effect size not measured because of small numbers (n < 30 in target in either before or after periods).
In the City Hospital scheme vehicle crime declined by 75 per cent (from 12 to 3 offences) inthe six months after the cameras were installed. Although these are extremely small figuresthey account for most of the reduction in total crime in City Hospital (from 18 to 12 offencesoverall). However, it is unlikely that any relevant impact was produced by the camerasalone. CCTV was erected alongside a new perimeter fence and improved lighting, and thecombined effect could have acted as an effective deterrence to offenders. The fencinglimited easy access to the site. Cameras were pole-mounted at each gate and were highlyvisible, and lighting levels improved across the greater part of the site.
The reduction in crime could be attributed to other factors, as would be suggested by thefact that a downward trend in crime levels began before CCTV was installed (see Gill e ta l . 2005b). Local police conducted two high-profile operations consisting of thedistribution of leaflets and posters warning people of the dangers of vehicle crime. Thisbegan in March 2002, which was before the peak in crime, but gathered momentum. InMay 2003 the police mounted another high-visibility operation, which could havep roduced the peak.
Assessing the impact of CCTV
36
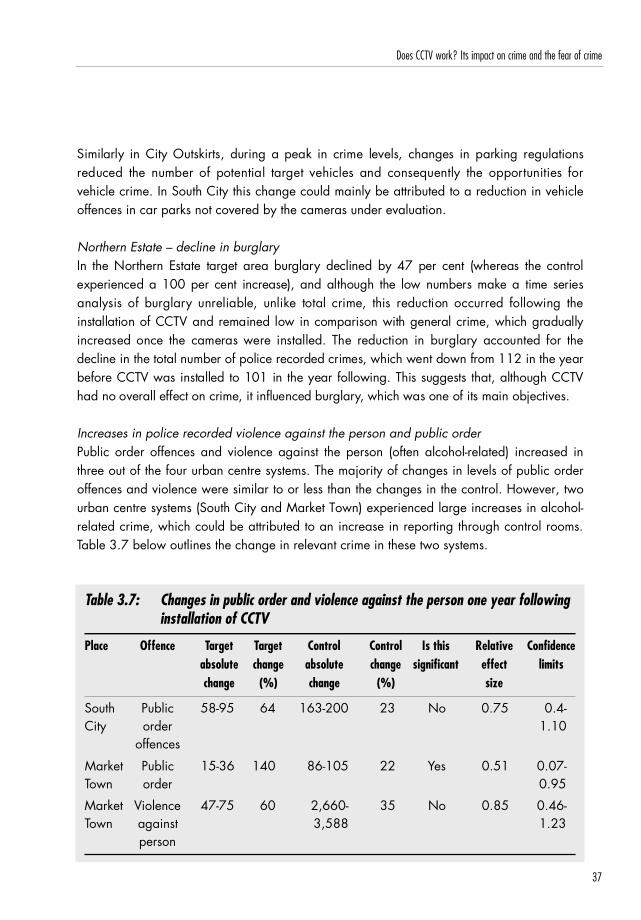
Similarly in City Outskirts, during a peak in crime levels, changes in parking re g u l a t i o n sreduced the number of potential target vehicles and consequently the opportunities forvehicle crime. In South City this change could mainly be attributed to a reduction in vehicleoffences in car parks not covered by the cameras under evaluation.
Northern Estate – decline in burglary In the Nort h e rn Estate target area burg l a ry declined by 47 per cent (whereas the contro lexperienced a 100 per cent increase), and although the low numbers make a time seriesanalysis of burg l a ry unreliable, unlike total crime, this reduction occurred following theinstallation of CCTV and remained low in comparison with general crime, which graduallyi n c reased once the cameras were installed. The reduction in burg l a ry accounted for thedecline in the total number of police re c o rded crimes, which went down from 112 in the yearb e f o re CCTV was installed to 101 in the year following. This suggests that, although CCTVhad no overall effect on crime, it influenced burg l a ry, which was one of its main objectives.
Increases in police recorded violence against the person and public orderPublic order offences and violence against the person (often alcohol-related) increased inthree out of the four urban centre systems. The majority of changes in levels of public orderoffences and violence were similar to or less than the changes in the control. However, twourban centre systems (South City and Market Town) experienced large increases in alcohol-related crime, which could be attributed to an increase in reporting through control rooms.Table 3.7 below outlines the change in relevant crime in these two systems.
Table 3.7: Changes in public order and violence against the person one year followinginstallation of CCTV
Place Offence Target Target Control Control Is this Relative Confidence absolute change absolute change significant effect limitschange (%) change (%) size
South Public 58-95 64 163-200 23 No 0.75 0.4-City order 1.10
offences
Market Public 15-36 140 86-105 22 Yes 0.51 0.07-Town order 0.95
Market Violence 47-75 60 2,660- 35 No 0.85 0.46-Town against 3,588 1.23
person
37
Does CCTV work? Its impact on crime and the fear of crime
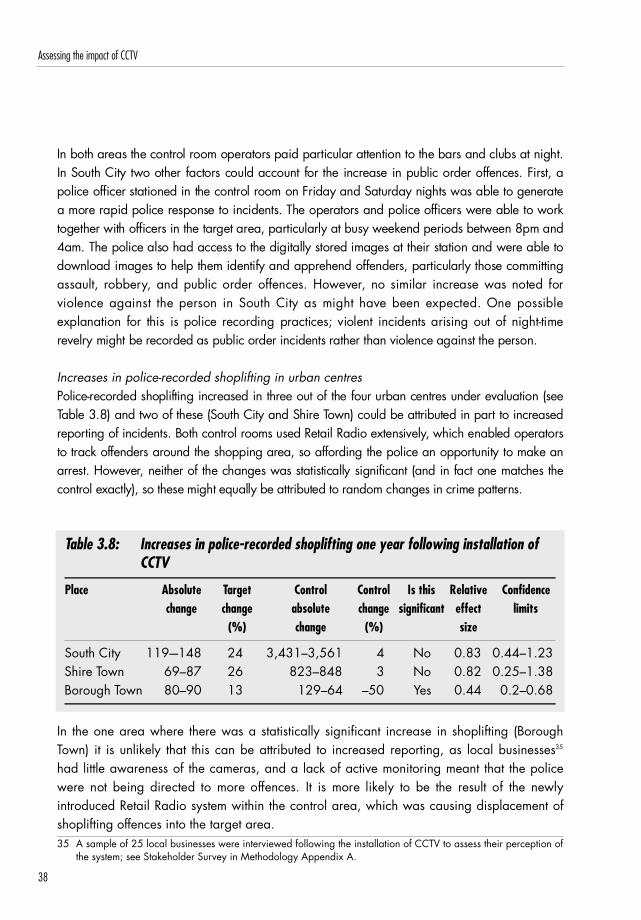
In both areas the control room operators paid particular attention to the bars and clubs at night.In South City two other factors could account for the increase in public order offences. First, apolice officer stationed in the control room on Friday and Saturday nights was able to generatea more rapid police response to incidents. The operators and police officers were able to worktogether with officers in the target area, particularly at busy weekend periods between 8pm and4am. The police also had access to the digitally stored images at their station and were able todownload images to help them identify and apprehend offenders, particularly those committingassault, ro b b e ry, and public order offences. However, no similar increase was noted forviolence against the person in South City as might have been expected. One possibleexplanation for this is police re c o rding practices; violent incidents arising out of night-timere v e l ry might be re c o rded as public order incidents rather than violence against the person.
Increases in police-recorded shoplifting in urban centres P o l i c e - re c o rded shoplifting increased in three out of the four urban centres under evaluation (seeTable 3.8) and two of these (South City and Shire Town) could be attributed in part to incre a s e dre p o rting of incidents. Both control rooms used Retail Radio extensively, which enabled operatorsto track offenders around the shopping area, so aff o rding the police an opportunity to make ana rrest. However, neither of the changes was statistically significant (and in fact one matches thec o n t rol exactly), so these might equally be attributed to random changes in crime patterns.
Table 3.8: Increases in police-recorded shoplifting one year following installation ofCCTV
Place Absolute Target Control Control Is this Relative Confidence change change absolute change significant effect limits
(%) change (%) size
South City 119-–148 24 3,431–3,561 4 No 0.83 0.44–1.23Shire Town 69–87 26 823–848 3 No 0.82 0.25–1.38Borough Town 80–90 13 129–64 –50 Yes 0.44 0.2–0.68
In the one area where there was a statistically significant increase in shoplifting (BoroughTown) it is unlikely that this can be attributed to increased reporting, as local businesses35
had little awareness of the cameras, and a lack of active monitoring meant that the policew e re not being directed to more offences. It is more likely to be the result of the newlyintroduced Retail Radio system within the control area, which was causing displacement ofshoplifting offences into the target area.
Assessing the impact of CCTV
38
35 A sample of 25 local businesses were interviewed following the installation of CCTV to assess their perception ofthe system; see Stakeholder Survey in Methodology Appendix A.

Declines in shoplifting – Area B (Dual Estate)Shoplifting decreased by 59 per cent in one area (Area B in Dual Estate) but this was notstatistically significant. This could possibly be due to the concentration of cameras aroundthe shopping area at the centre of the estate, which acted as a deterrent. There was noRetail Radio system in the area.
Table 3.9: Decreases in police-recorded shoplifting one year following installation ofCCTV
Absolute Target Control Control Is this Relative Confidence change change absolute change significant effect limits
(%) change (%) size
Shoplifting 39–16 –59 2–4 100 No 4.88 –4.37–14.12
Small-scale drugs operationsIn two systems (City Outskirts and South City) there is limited evidence to suggest that CCTVassisted in special drugs operations. In South City there was a small increase in dru goffences (from 16 to 34), which could be linked to two police operations directed at drugoffenders in the target area. In City Outskirts there was no overall change in the level ofdrugs offences (the number of offences went from 44 in the year before CCTV was installedto 45 in the year following). However, the closure of a major drugs den in the target areacould have been counterbalanced by a number of police-run operations involving the CCTVcameras during the evaluation period.
Table 3.10: Changes in police-recorded drug offences one year following installation ofCCTV
Place Target Target Division Division Is this Relative Confidence absolute change absolute change significant? effect limitschange (%) change (%) size
South City 16–34 113 700–964 38 No 0.65 0.18–1.12City Outskirts 44–45 2 799–730 –9 No 0.89 0.42–1.36
39
Does CCTV work? Its impact on crime and the fear of crime

Change in pattern of crime Diffusion of benefits and displacement of crime are often associated with the installation ofCCTV (see, Arm s t rong and Giulianotti, 1998). These phenomena have been considere dwithin this evaluation using Geographical information Systems (GIS) and time series analysisin those target areas where either overall crime, or a particular type of offence decreased.
For the analysis, the buffer zone was taken in its entirety and changes in crime levels in thislocation were compared with those in the target area. The buffer zone (that is the are as u rrounding the target; see Gill et al. 2005c for information on how these zones were defined)was also split into smaller areas to investigate the extent of crime movement (see Figure 3.4.)
Figure 3.4: Schematic diagram demonstrating how the buffer zone has been treatedduring small-scale analysis.
Out of the six target areas that experienced an overall reduction in crime, whetherstatistically significant or not, only one displayed any movement of crime into the buff e rzone. Hawkeye could not be included within this analysis because the necessarydisaggregated crime data were not available. Relevant findings are summarised in Table3.11 below.
Assessing the impact of CCTV
40

Table 3.11: Summary of displacement
Scheme Offence Area A Area B Percentage Percentage Crime pattern affected change in Area A change in Area B change
(absolute change) (absolute change)
City Total Target Ring 1 –28 (–428) –9.3 (–569) Diffusion Outskirts relevant of benefits
crime
City Total Target Ring 2 –28 (–428) 6.8 (302) Spatial Outskirts relevant displacement
crime
Northern Burglary Target Ring 1 –47 (13) 11 (13) Spatial Estate displacement
Eastcap Vehicle Within Rest of –38(23) 94 (15) Internal Estate Crime 100m of target spatial
CCTV displacement
Borough Total Within Rest of –25 (–44) 29 (46) Internal Town relevant 100m of target spatial
crime CCTV displacement
The City Outskirts target area experienced a 28 per cent (428 crimes) reduction inoverall crime, while within the buffer zone crime fell by four per cent (634 crimes).H o w e v e r, taking the buffer as a series of 1/3-mile concentric rings around the targ e tp e r i m e t e r, a diff e rent pattern emerges. In Ring 1 overall crime decreased by 9.3 per cent(569 crimes), whilst an increase of 6.8 per cent (302 crimes) occurred in Ring 2. Alla reas outside this experienced a 6 per cent decrease in crime levels. The divisional crimelevels remained relatively stable during the same period, showing a one per centreduction, indicating that diff e rent processes were at play within these areas. Thed e c rease in Ring 1 may indicate diffusion of benefits from the target area to theimmediate surrounding area, while the increase in Ring 2 may be due to displacement.H o w e v e r, a number of additional crime reduction initiatives were taking place within thea reas under investigation and these could have reduced re c o rded crime levels in theinner buffer area, and also displaced crime into the outer buffer independently of theCCTV system. There f o re, the increase in Ring 2 cannot be solely attributed todisplacement caused by the implementation of CCTV.
41
Does CCTV work? Its impact on crime and the fear of crime
Geographical displacement was also examined for those offence types that declineddramatically within the target area. Only one witnessed possible displacement eff e c t s ,namely burglary in Northern Estate.
N o rt h e rn Estate displayed a 47 per cent (13 crimes) decrease in burg l a ry. Over the sameperiod the one-mile radius buffer zone also experienced a two per cent (17) decrease. Again,when the buffer zone was divided into 1/3-mile concentric rings, burg l a ry rates in Ring 1i n c reased by 11 per cent (13 crimes), while Rings 2 and 3 increased by one per cent (2crimes) and decreased by ten per cent (32) re s p e c t i v e l y. It is suggested that the increase inb u rg l a ry seen in ring 1 can be attributed to the implementation of CCTV within the target are a .
In addition to looking for geographical displacement from the target area into surroundinglocations, where possible small-area displacement was investigated within the target areasthemselves. This was achieved by comparing the area within 100 metres of the CCTVcameras with the area within the target but outside of this distance. Such analysis wasbased upon the assumption that the geographical areas were not homogeneous and thattherefore smaller-scale changes in crime patterns may have been taking place, which werelost in the broader area analysis.
Such small-scale analysis of the target areas revealed that crime could be displaced withinthe target area itself. In Eastcap Estate the greater part of the decline in crime levelso c c u rred within the vicinity of the cameras (up to 100 metres from the cameras). Incomparison, outside of this area but still in the target area, the level of most types of offenceincreased. Vehicle crime in particular saw a decrease of 38 per cent (23 cases) around thecameras compared with a 94 per cent (15 crimes) increase outside this area. This indicatesdisplacement from where the cameras can see to where they cannot on a smaller scale thanis usually considered, a phenomenon that could be called ‘internal spatial displacement’.This was also observed to a lesser extent in Borough Town.
T h e re are two reasons why internal displacement may not have been observed in other schemes.First, most had a high level of camera coverage leaving little space between the cameras and,second, the inadequacy of the available crime data. Such analysis re q u i res the provision of datawhich is accurate to the nearest one metre, but this was not provided for all projects.
In summary, geographical displacement occurred infrequently in the evaluated projects. Two ofthe three cases of such displacement were attributed solely to the installation of CCTV, as noother confounding factors were present. There was one possible case of diffusion of benefits,but it could also be explained by the effect of confounding factors present in the are a .
Assessing the impact of CCTV
42

Figure 3.5: Change detection map
SummaryThe above results indicate that the CCTV schemes that have been assessed had little overalleffect on crime levels. Even where changes have been noted, with the exception of thoserelating to car parks, very few are larger than could be due to chance alone and all couldin fact represent either chance variation or confounding factors. Where crime levels went upit is not reasonable to conclude that CCTV had a negative impact.
However, there are some characteristics of CCTV systems which appear to influence crimelevels. Those systems providing a high level of coverage appear to show a greater reductionin crime than those that do not, and the effect is increased where the area covered by thecameras is enclosed.
Impact on public attitudes
This section summarises the results of public attitude surveys carried out in 12 different areascovered by all or part of the CCTV systems under evaluation, before and after the CCTVsystems were installed. These include nine residential areas and three city/town centre s .While 11 of these areas were subject to a full evaluation, one (North City), where cameraswere installed during the evaluation period and therefore would have been observed by thepublic, did not achieve stability36 and therefore could not be fully evaluated.
43
Does CCTV work? Its impact on crime and the fear of crime
(see Gill et al. 2005c) showing only those areasthat have experienced a change in crime overtwo standard deviations from the mean changein crime between the before and after periods.This highlights those areas where change hasbeen most significant. +2sd indicates are a sw h e re crime has decreased and –2sd thosea reas experiencing an increase in crime. Thisshows the trend in Eastcap Estate’s target areaof particularly vehicle crime being displacedaway from the camera to those areas thatcannot be monitored by CCTV.
36 The system underwent a number of technical changes after it became operational, and the control ro o munderwent a number of alterations to monitoring practice. This meant that the system did not achieve full stabilitywithin the evaluation’s required timeframe.

The surveys were designed to assess the extent to which one of the CCTV systems’ mainobjectives, namely reducing fear of crime, had been achieved across all areas. They alsom e a s u red whether the introduction of CCTV in an area changed public opinion; forinstance, whether public support for CCTV declined once they had experience of it. This isp a rticularly significant in residential areas where the large-scale installation of CCTVcameras is a relatively new trend.
The surveys tested the following hypotheses:
1. CCTV reduces worry about being a victim of crime.2. CCTV increases feelings of safety.3. CCTV reduces reported victimisation levels.4. CCTV encourages individuals to venture into areas that they previously avoided
during the day and at night.
Table 3.12 reveals the sample size of each survey conducted pre- and post-implementation.
Table 3.12: Survey sample sizes pre- and post-implementation
Pre-implementation survey sample size Post-implementation survey sample sizeTarget area Control area Target area Control area
City Outskirts 382 N/A 421 N/ANorth City 593 N/A 600 N/ASouth City 640 N/A 625 N/AShire Town 442 426 422 425Northern Estate 172 215 168 242Westcap Estate 352 249 347 234Eastcap Estate 265 267 236 214Dual Estate:
Area A 114 110Area B 401 417 408 399
Southcap Estate 421 410 399 414Deploy Estate:
Area E 324 302Area F 321 305 301 311
Total 4,427 2,099 4,339 2,239
NA: No control area was surveyed.
Assessing the impact of CCTV
44

The surveys intended to measure changes in five different aspects: fear of crime; impact onrespondents’ behaviour; re p o rted victimisation; support for CCTV; and awareness andpublic understanding of how the CCTV system works.
Public awareness of CCTVIf people’s fear of crime as a result of the installation of CCTV, or their opinion about CCTVbased on experience of it, are to change, they must first be aware that it has been installed.Table 3.13 below shows the levels of awareness amongst the respondents in each surveyand the means by which they became aware of the presence of CCTV. Generally,individuals in all areas were aware of the cameras, although the proportion of respondentsfrom one scheme to another who were aware of them varied considerably (ranging from 61per cent to 97 per cent).
The highest level of awareness was measured in small residential estates, ranging from 61per cent (Area F) to 97 per cent (Area A). This increased as the number of cameras per unita rea increased (Area F had a density of 26 cameras per km_ and Area A one of 173cameras per km_). Overall, there was shown to be a positive correlation (0.32) betweena w a reness levels and camera density, although it was non-significant. There was also adifference between town and city centres; awareness levels in North City and South Citywere almost equal (around 64 per cent), which were both ten percentage points lower thanin Shire Town (74 per cent). This suggests that there is less awareness of CCTV in large citycentre areas where perhaps the cameras add little to the large amounts of street furniturealready present.
45
Does CCTV work? Its impact on crime and the fear of crime
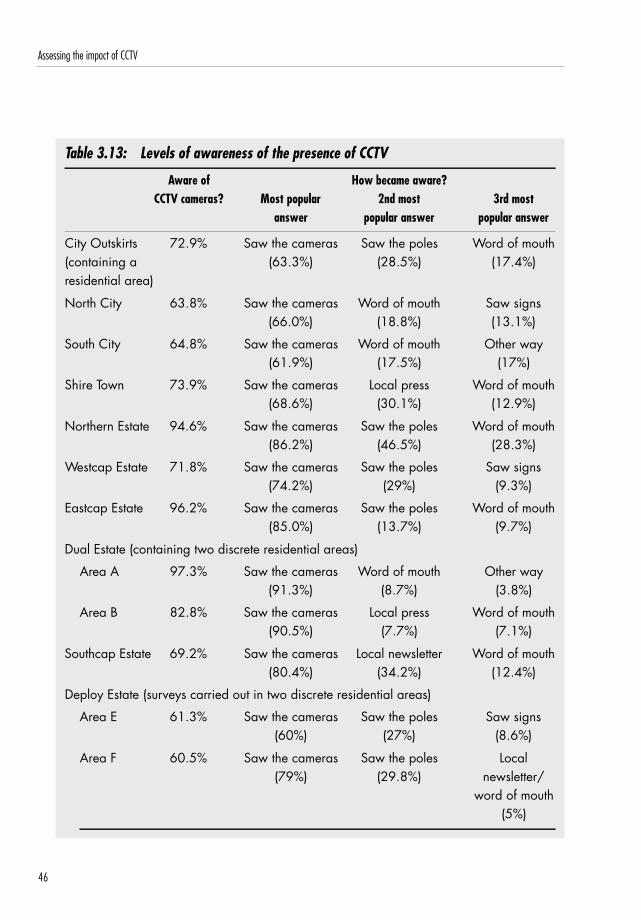
Table 3.13: Levels of awareness of the presence of CCTV
Aware of How became aware?CCTV cameras? Most popular 2nd most 3rd most
answer popular answer popular answer
City Outskirts 72.9% Saw the cameras Saw the poles Word of mouth(containing a (63.3%) (28.5%) (17.4%)residential area)
North City 63.8% Saw the cameras Word of mouth Saw signs (66.0%) (18.8%) (13.1%)
South City 64.8% Saw the cameras Word of mouth Other way (61.9%) (17.5%) (17%)
Shire Town 73.9% Saw the cameras Local press Word of mouth (68.6%) (30.1%) (12.9%)
Northern Estate 94.6% Saw the cameras Saw the poles Word of mouth (86.2%) (46.5%) (28.3%)
Westcap Estate 71.8% Saw the cameras Saw the poles Saw signs (74.2%) (29%) (9.3%)
Eastcap Estate 96.2% Saw the cameras Saw the poles Word of mouth (85.0%) (13.7%) (9.7%)
Dual Estate (containing two discrete residential areas)
Area A 97.3% Saw the cameras Word of mouth Other way (91.3%) (8.7%) (3.8%)
Area B 82.8% Saw the cameras Local press Word of mouth (90.5%) (7.7%) (7.1%)
Southcap Estate 69.2% Saw the cameras Local newsletter Word of mouth (80.4%) (34.2%) (12.4%)
Deploy Estate (surveys carried out in two discrete residential areas)
Area E 61.3% Saw the cameras Saw the poles Saw signs (60%) (27%) (8.6%)
Area F 60.5% Saw the cameras Saw the poles Local (79%) (29.8%) newsletter/
word of mouth (5%)
Assessing the impact of CCTV
46

Fear of crime A reduction in fear of crime was a key objective of all the projects. In order to determinewhether CCTV played a part in reducing levels of fear of crime, the survey explored thefollowing two aspects:
● p e o p l e ’s worry about being a victim of crime in the area in which CCTV wasinstalled.
● people’s feelings of safety in the area in which CCTV was installed.
Each of these aspects will be discussed separately.
Worry about being a victim of crime in the target areaTable 3.14 shows the levels of worry about being a victim of crime before and after theinstallation of CCTV37, as well as comparing levels of worry in the target and control area(relative effect size).
The table reveals that in all areas surveyed there was a reduction in worry about being avictim of crime in the area in which CCTV was installed. However, in only four areas (AreaB, Area E, Southcap Estate, and Westcap Estate) was this reduction higher than that in thecontrol area (i.e. the relative effect size was greater than one) (NB, South City and NorthCity had no control area). Area B and Westcap Estate revealed significantly larg e rreductions in worry about crime than their respective control areas.
There are no noticeable differences in levels of worry about being a victim of crime acrossthe diff e rent types of area; the town/city centres experienced similar reductions to theresidential areas.
47
Does CCTV work? Its impact on crime and the fear of crime
37 It should be noted that the post-implementation surveys were conducted approximately 14-20 months after thep re-implementation surveys, which means that seasonal changes may have had an impact on fear of crimelevels. However, this was unavoidable, as it was necessary to conduct the pre-implementation survey before theinstallation of the poles, and in most cases the system did not become live for many months following theinstallation. Therefore, in order to conduct the post-implementation survey 12-months after the system went ‘live’,there often had to be a longer period between surveys.

Table 3.14: ‘Worry about being a victim of crime in the target area’ before and afterthe CCTV installation
Scheme Percentage & (N) ‘Worried about crime’ Percentage point change Relative effect sizebefore after in 'Worry about crime'
City Outskirts 35 (129) 20 (83) –14South City 9 (57) 4 (21) –6 (day) No control
24 (145) 17 (95) –8 (night)North City 8 (45) 4 (22) –4 (day)
18 (88) 13 (64) –5 (night) No controlShire Town 8 (37) 5 (22) –3 (day) N too small
33 (220) 21 (236) –12 (night) 0.80Northern Estate 26 (43) 23 (38) –3 0.98Westcap Estate 35 (122) 28 93) –8 1.70Dual Estate:
Area A 20 23) 10 (11) –10 N too smallArea B 35 (137) 26 (105) –9 1.60
Southcap Estate 33 (137) 31 (121) –2 1.04Deploy Estate:
Area E 33 (106) 30 (89) –3 1.05Area F 28 (89) 27 (82) –0.4 0.95
* Significance (p< .05).Figures in bold are from schemes where the target performed better than the control.
The next stage of the analysis was to test whether the cameras were the main factors thatcontributed to the significant reduction in worry about crime in Area B and Westcap Estate.In order to do that, worry about crime levels were compared with awareness of thepresence of cameras. The hypothesis was that cameras could be considered successful intackling fear of crime if those who were aware of the cameras worried less about crimethan those who were unaware.
The results seem to contradict this view. Those respondents who were aware of the camerasactually worried more often about crime than those who were not. The differences were of19 per cent in Westcap Estate, and ten per cent in Area B. These findings suggest,t h e re f o re, that the presence of CCTV in an area actually increases worry about crime,possibly because the assumed need for CCTV to be installed makes the area seem moreproblematic than the respondents had previously thought. It is also possible that those whowere aware of the cameras were more security conscious than those who were not, but the
Assessing the impact of CCTV
48
*
*
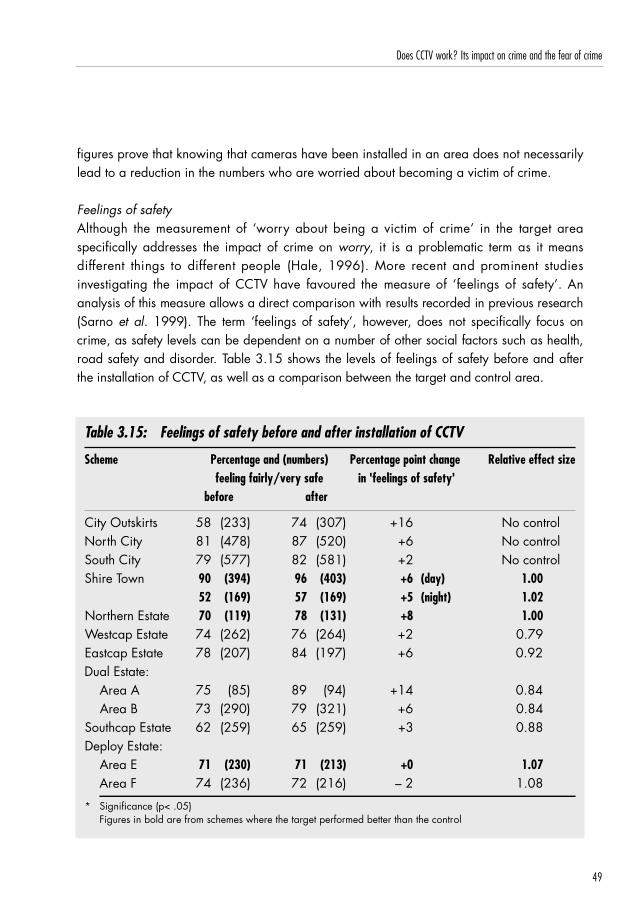
figures prove that knowing that cameras have been installed in an area does not necessarilylead to a reduction in the numbers who are worried about becoming a victim of crime.
Feelings of safetyAlthough the measurement of ‘worry about being a victim of crime’ in the target are aspecifically addresses the impact of crime on w o r r y, it is a problematic term as it meansd i ff e rent things to diff e rent people (Hale, 1996). More recent and prominent studiesinvestigating the impact of CCTV have favoured the measure of ‘feelings of safety’. Ananalysis of this measure allows a direct comparison with results re c o rded in previous re s e a rc h( S a rn o et al. 1999). The term ‘feelings of safety’, however, does not specifically focus oncrime, as safety levels can be dependent on a number of other social factors such as health,road safety and disord e r. Table 3.15 shows the levels of feelings of safety before and afterthe installation of CCTV, as well as a comparison between the target and control are a .
Table 3.15: Feelings of safety before and after installation of CCTV
Scheme Percentage and (numbers) Percentage point change Relative effect sizefeeling fairly/very safe in 'feelings of safety'
before after
City Outskirts 58 (233) 74 (307) +16 No controlNorth City 81 (478) 87 (520) +6 No controlSouth City 79 (577) 82 (581) +2 No controlShire Town 90 (394) 96 (403) +6 (day) 1.00
52 (169) 57 (169) +5 (night) 1.02Northern Estate 70 (119) 78 (131) +8 1.00Westcap Estate 74 (262) 76 (264) +2 0.79Eastcap Estate 78 (207) 84 (197) +6 0.92Dual Estate:
Area A 75 (85) 89 (94) +14 0.84Area B 73 (290) 79 (321) +6 0.84
Southcap Estate 62 (259) 65 (259) +3 0.88Deploy Estate:
Area E 71 (230) 71 (213) +0 1.07Area F 74 (236) 72 (216) – 2 1.08
* Significance (p< .05)Figures in bold are from schemes where the target performed better than the control
49
Does CCTV work? Its impact on crime and the fear of crime

The table reveals that feelings of safety increased in all areas surveyed except for one (Area F).In just three areas, the increase in feelings of safety was higher than that in the control (Nort h e rnEstate, Area E and Shire Town); however, the diff e rences between the target and control werenon-significant. These findings support those of Sarno et al. (1999) in their evaluation of CCTVin Southwark Town Centre. They found that almost two-thirds of respondents who were aware ofthe cameras said they felt safer as a result of CCTV; 90 per cent indicated feeling safer duringthe day, whilst this went down to 45 per cent during the night.
As with worry about being a victim of crime, there was no difference in levels of feelings ofsafety across the different types of area. Town/city centres experienced increases in feelingsof safety similar to those for the residential areas.
Reported victimisationIn the course of the pre- and post-implementation surveys the respondents were askedwhether they had been victims of various types of incident38 in the previous 12 months39.Following on from the previous section, these reported victimisation levels could be used toclarify whether or not there was a connection between victimisation and fear of crime.Previous studies have shown a relationship between the two (Spriggs et al. 2005) in thesense that fear of crime declined as levels of reported victimisation decreased.
The possible relationship between reported victimisation40 and fear of crime following theinstallation of CCTV was analysed; Table 3.16 below shows the change in worry aboutbeing a victim of crime and the change in the number of victims.
Assessing the impact of CCTV
50
38 P e s t e red, insulted or harassed; harassed by young people in the street; harassed by drunken disord e r l yindividuals; harassed by people using or dealing in drugs; assaulted; robbed; car stolen or broken into; burgled;harassed due to skin colour or ethnic origin; property damaged or vandalised.
39 For projects, which were implemented late (all town centre systems and Southcap Estate), the year periodoverlaps with part of the pre-implementation stage.
40 Figures come from the surveys not the police crime data.

Table 3.16: Comparison between change in worry about crime and proportion ofrespondents victimised following the installation of CCTV
Scheme Percentage point change in proportion Percentage point change of respondents victimised41 in worry about crime
City Outskirts 0.1 –14South City –12 –8 (after dark)Shire Town –4 –10 (after dark)Northern Estate –0.7 –3Westcap Estate –10 –8Eastcap Estate –4 Not applicableDual Estate
Area A –22 –10Area B –2 –9
Southcap Estate 7 –2Deploy Estate
Area E 0.7 –3Area F 6 –0.4
It was found that, generally, those areas where worry about being a victim of crimedeclined tended to experience larger reductions in the pro p o rtion of individuals whoreported being victimised. For example, Westcap Estate saw an eight per cent reduction inworry about crime, and a ten per cent reduction in the number of reported victims. In sevenof the surveyed areas, worry about being a victim of crime declined alongside a reductionin the number of reported victims.
Southcap Estate, however, experienced the opposite: worry about being a victim of crimewent down by 2 per cent and reported victimisation increased by four per cent. A possibleexplanation for this is that although there was an increase in reported victimisation, this wasan increase of just four crimes, which is a negligible figure considering the size of thesample (approximately 400). Also, Southcap Estate’s recorded crime data were flawed onmany levels42, which brings into question the accuracy of this comparison.
51
Does CCTV work? Its impact on crime and the fear of crime
41 These figures demonstrate the percentage change in the number of victims re p o rting having been victimisedbefore and after the installation of CCTV.
42 Owing to late implementation, just six months’ post-implementation crime data was used. Also, this includedcrimes from within just one-third of the target area. The survey, on the other hand, was conducted across theentire target area.

The relationship in the post-implementation responses between re p o rted victimisation andw o rry about being a victim of crime was measure d4 3. The results revealed a significantrelationship (<.01) in all nine residential areas in the sense that those who were victimisedw e re more likely to be worried about being a victim of crime than those who were notvictimised. Similar patterns were found in the town/city centres; however, the relationshipwas not significant. This finding suggests that worry about being a victim of crime is directlyrelated to victimisation levels on the estate, rather than the mere presence of the cameras.
The change in the number of victims after the installation of CCTV (see Table 3.15) revealedlarge variations across the areas but no discernible pattern according to the type of area, orcrime category.
A further analysis of reported victimisation levels revealed that eight schemes experienced areduction in the percentage of respondents who reported having been victims of crime afterthe installation of CCTV. Substantial percentage reductions were recorded for Area A (–22),South City (–14), and Westcap Estate (–10).
Of these eight, four had a larger reduction in victimisation than the control (Area A,Westcap Estate, Northern Estate, and Shire Town), but in none of the four was the differencestatistically significant44. Two areas, South City and North City, did not have a control.
Levels of victimisation can also be measured in terms of the actual number of incidentsbefore and after the installation of CCTV, rather than the number of victims. This measureenables a more reliable comparison to be made with re c o rded crime, as it takes intoaccount total victimisation levels. Table 3.17 shows the comparison between the percentagechange in recorded crime and the percentage change in victimisations.
Table 3.16 shows whether an increase or decrease in recorded crime was in line with achange in the number of reported victimisations. To make possible a reliable comparison, itwas necessary to use only the figures for those crime categories in the re p o rt e dvictimisations that were also included in the re c o rded crime data. As a result, the fivecategories of harassment were excluded from the measure. The town/city centre surveys didnot include a measure of victimisation, so they are not included in the table.
Assessing the impact of CCTV
52
43 Using the Pearson’s Chi Square Test.44 The lack of statistical significance could be due to the small numbers of reported victimisations in the majority of
projects.

Table 3.17: Comparison between percentage point change in recorded crime andpercentage point change in quantity of reported incidents
Project Percentage point change in Percentage point change in Percentage change in police recorded crime data quantity of reported incidents reported harassment
(excluding harassment45)
City Outskirts –28 –24 12Northern Estate –10 –22 13Eastcap Estate 2 +21 –8Westcap Estate N/A –34 –1Dual Estate:
Area A –32 –66 –4Area B +8 –35 18
Southcap Estate 14 +18 1Deploy Estate:
Area E +57 –33 9Area F +4 +18 11
The findings reveal that the change in the number of re p o rted incidents (excludingharassment) is consistent with the change in re c o rded crime in the majority of schemes.Where there was a reduction in recorded crime, there was also a reduction in the numberof re p o rted incidents, and vice versa, thus verifying the reliability of the re c o rded crimedata. However, there were two exceptions: Areas B and E. Area B saw a reduction in thequantity of re p o rted incidents (excluding harassment), but an increase in re p o rted crime,which could be the result of increased reporting to the police, as in Area E.
Changes in behaviour (impact of CCTV on respondents’ actions)It is also possible that respondents would have changed their behaviour or routines once CCTVwas installed. Respondents were asked in the pre-implementation survey whether they wouldgo into areas that they currently avoided if CCTV was installed. In the post-implementations u rv e y, they were then asked whether they had gone into areas they previously avoided nowthat CCTV had been installed. Table 3.18 shows the percentage diff e rence betweenanticipated and actual behaviour before and after the installation of CCTV.
53
Does CCTV work? Its impact on crime and the fear of crime
45 i.e. those experiencing any of the types of harassment outlined in footnote 35 above.
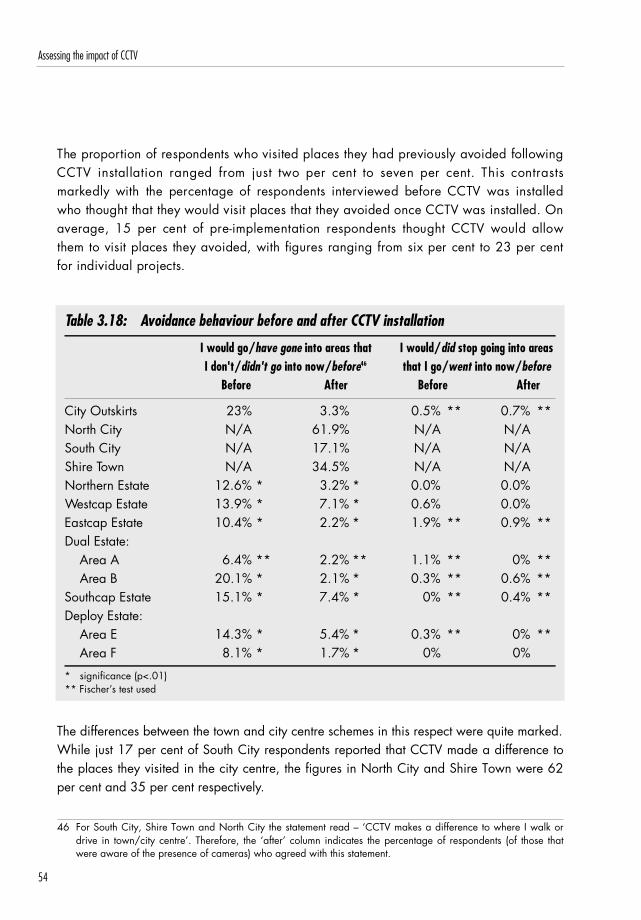
The pro p o rtion of respondents who visited places they had previously avoided followingCCTV installation ranged from just two per cent to seven per cent. This contrastsmarkedly with the percentage of respondents interviewed before CCTV was installedwho thought that they would visit places that they avoided once CCTV was installed. Onaverage, 15 per cent of pre-implementation respondents thought CCTV would allowthem to visit places they avoided, with figures ranging from six per cent to 23 per centfor individual projects.
Table 3.18: Avoidance behaviour before and after CCTV installation
I would go/have gone into areas that I would/did stop going into areas I don't/didn't go into now/before46 that I go/went into now/before
Before After Before After
City Outskirts 23% 3.3% 0.5% ** 0.7% **North City N/A 61.9% N/A N/ASouth City N/A 17.1% N/A N/AShire Town N/A 34.5% N/A N/ANorthern Estate 12.6% * 3.2% * 0.0% 0.0%Westcap Estate 13.9% * 7.1% * 0.6% 0.0%Eastcap Estate 10.4% * 2.2% * 1.9% ** 0.9% **Dual Estate:
Area A 6.4% ** 2.2% ** 1.1% ** 0% **Area B 20.1% * 2.1% * 0.3% ** 0.6% **
Southcap Estate 15.1% * 7.4% * 0% ** 0.4% **Deploy Estate:
Area E 14.3% * 5.4% * 0.3% ** 0% **Area F 8.1% * 1.7% * 0% 0%
* significance (p<.01)** Fischer’s test used
The differences between the town and city centre schemes in this respect were quite marked.While just 17 per cent of South City respondents reported that CCTV made a difference tothe places they visited in the city centre, the figures in North City and Shire Town were 62per cent and 35 per cent respectively.
Assessing the impact of CCTV
54
46 For South City, Shire Town and North City the statement read – ‘CCTV makes a difference to where I walk ordrive in town/city centre’. Therefore, the ‘after’ column indicates the percentage of respondents (of those thatwere aware of the presence of cameras) who agreed with this statement.

The most plausible explanation for why CCTV in South City failed to encourage many moreindividuals into areas, which they previously avoided is that, even when CCTV was installedthey were not necessarily in a position to alter their behaviour or routines. The majority ofplaces visited by individuals were on the way to places that they routinely visited, such asshops or workplaces.
On the other hand, respondents were not discouraged from visiting places because CCTVcameras were installed there. Only one per cent of the respondents said that they avoidedplaces now that CCTV cameras were installed.
On the whole, these findings suggest that there is no connection between worries aboutbeing a victim of crime and avoidance behaviour. They also indicate that re s p o n d e n t sbelieved CCTV would have an impact on their avoidance behaviour (encouraging them tovisit places they previously avoided), but in practice this rarely occurred.
Support for CCTVIt was found that, generally, the proportion of respondents happy or very happy about thepresence of CCTV cameras declined over the evaluation period, although it remained quitehigh and robust with results ranging from 69 per cent to 96 per cent (see Table 3.19). Themost dramatic change was witnessed in Area A, with a significant reduction in support forCCTV from 89 per cent to 69 per cent. Considering that individuals did not significantlychange their behaviour once the cameras were installed, even though they believed theywould and that support for CCTV declined, it would appear that the idea of CCTV was farmore appealing in theory than it proved in practice.
55
Does CCTV work? Its impact on crime and the fear of crime

Table 3.19: Support for CCTV pre- and post-implementation
Very/fairly happy about CCTV % DifferenceBefore After
City Outskirts 93.5% 90.8% –2.7North City 95.8% 95.7% –0.1South City 78.5% 81.2% 2.7Shire Town 93% ** 79.7% ** –10.6Northern Estate 79% * 77% * –2Westcap Estate 88.0% 78.5% –9.5Eastcap Estate 80.4% ** 72% ** –8.4Dual Estate:
Area A 89.2% ** 68.9% ** –20.3Area B 95.2% 92.9% –2.3
Southcap Estate 93.0% 91.6% –1.4Deploy Estate:
Area E 96% ** 88.5% ** –7.5Area F 95% * 89.8% * –6.2
* Significance (p<.05).** Significance (p<.01).
Civil libertiesThe questionnaires explored the issue of civil liberties and the degree to which respondentsfelt that CCTV was an invasion of privacy. This is a long-standing issue connected with theuse of surveillance systems. With the exception of Deploy Estate and Southcap Estate,concerns about privacy weakened slightly after the installation of the cameras (the previousfigures were also small) ranging from two per cent to seven per cent. This seems to indicatethat residents did not consider the cameras to be as intrusive once they were installed asthey had previously thought. It is important to mention, however, that the number ofrespondents who were concerned about this issue was low even before the system wasimplemented; the largest percentage was in Southcap Estate (23 per cent), but in generalranged from 12 per cent to 19 per cent.
The issue of civil liberties does not, therefore, explain the reduction in support for CCTV, aslevels of concern over privacy, which were low before the installation of CCTV, remainedlow afterwards.
Assessing the impact of CCTV
56

Perceived impact of CCTVThe residential surv e y4 7 respondents showed general disillusionment with the effectiveness of thecameras. The percentage of people agreeing with statements claiming positive effects from thec a m e r a s4 8 d e c reased substantially in comparison with the pre - s u rvey figures (see Table 3.20).The table reveals that across all areas, and in response to all three statements, there was areduction in the perceived effectiveness of CCTV. This was particularly evident in relation to thestatement ‘with CCTV, the level of crime has got lower’; there was a 12 per cent to 55 per centd rop in the pro p o rtion of respondents who agreed with this statement after CCTV was installed.
Table 3.20: Percentage point change in perceived effectiveness of CCTV afterinstallation
With CCTV… People would report/have Police would respond/have Level of crime would
reported more incidents responded more quickly get/has got lowerBefore After Before After Before After
City Outskirts 72.1 58.8 60.2 * 34.8 * 78.1 * 48.6 *Northern Estate 81.4 65.9 79.7 * 59.7 * 81.7 * 69.7 *Westcap Estate 69.7 53.1 59.2 ** 48.4 ** 81.4 * 55.1 *Dual Estate:
Area A 67 * 33.9 * 41.4 * 11.7 * 77.9 * 44.3 *Area B 66 * 36 * 55.6 * 20.2 * 81.2 * 27.1 *
Southcap Estate 70 58.5 57 47.7 79.7 * 65.8 *Deploy Estate:
Area E 57.8 46.7 42.5 * 29.1 * 80 * 40.8 *Area F 69.6 * 44.2 * 52.4 * 26.6 * 78.9 * 35 *
* Significance (p <.01).** Significance (p<.05).
While it must be emphasised that there was a reduction in the perceived effectiveness ofCCTV across the board, some respondents demonstrated a residual faith in CCTV.
Again there was no evidence that those schemes securing the greatest reduction in worryabout crime saw lesser reductions in the perceived impact of CCTV, which suggests thatlevels of worry about being a victim of crime were not dependent on whether or not anindividual perceived this measure to be effective.
57
Does CCTV work? Its impact on crime and the fear of crime
47 Only the residential surveys included this set of questions.48 ‘people have reported more incidents’; ‘police have responded more quickly’; ‘crime has got lower’.

However, it does begin to explain why there was a reduction in support for CCTV in themajority of areas. In those areas where there were marked reductions in support for CCTV( A rea A and Westcap Estate), there were also notable reductions in the perc e i v e deffectiveness of CCTV (for example, a 33 per cent and 26 per cent reduction in respondentsbelieving that CCTV would lower crime in Area A and Westcap Estate). However, wheret h e re were less significant reductions in support for CCTV (Southcap Estate), there werelesser reductions in the perceived effectiveness of CCTV (just 14 per cent fewer respondentsbelieved CCTV would reduce crime).
SummaryAlthough there is some evidence that there was a reduction in fear of crime following theinstallation of CCTV, there is little to suggest that this is attributable to CCTV. It is more likelyto have been a reflection of the reduction in the level of reported victimisation within theareas. CCTV certainly has not led to a measurable change in avoidance behaviour.
Furthermore, it has become evident that following the introduction of CCTV, support for itsuse decreased. This was shown not to be the result of concern over issues relating to civill i b e rties and privacy, but there is a suggestion that support has declined in step withreductions in people’s perceptions of the camera’s effectiveness; fewer respondents believedthe cameras would reduce crime.
Main findings
The following draws together the main findings from the previous two sections, summarisingthe impact on crime levels, public perceptions of CCTV, and the mechanisms by whichCCTV has operated.
Impact on crime levelsAll systems aimed to reduce crime, yet this study suggests that CCTV has generally failed toachieve this. Although police-recorded crime has decreased in six out of the 13 systems forwhich data were available, in only three cases might this decrease be attributable to CCTV,and in only two areas was there a significant decrease compared with the control.
Certain general trends appear to have emerged, although the lack of statistically significantresults and the small sample sizes render these findings merely suggestive. CCTV appears to
Assessing the impact of CCTV
58

impact differently on different types of crime, supporting the findings of earlier studies (seeWelsh and Farrington, 2002; Brown, 1995). In some cases premeditated, or more planned,o ffences, such as burg l a ry, vehicle crime, criminal damage and theft decreased in mosta reas during the evaluation period, while more spontaneous offences, such as violenceagainst the person and public order offences did not.
Vehicle crime decreased most following CCTV installation, declining in seven systems atrates from seven per cent to 75 per cent. This could be attributed partly to the nature of theareas covered by CCTV. In the evaluated systems the greatest reductions occurred in carparks, which were closed environments with a limited number of entrances and exits, andwhere CCTV could be trained on these; this supports the findings of Tilley’s (1993) study ofcar parks. The size of the reduction could also be attributed to the nature of vehicle crime,which produces quick but small gains, and where offenders are more likely to make anassessment that the level of risk is too great compared with the gain once CCTV is installed(see, Clarke and Felson, 1993).
Some crime types showed an increase following CCTV installation. This sometimes indicatedthat the presence of CCTV had brought a greater number of crimes to the attention of thepolice and thus represented a success. Recorded rates of shoplifting increased in four out ofthe five urban centre areas and in three of these the CCTV control room worked with RetailRadio link initiatives, allowing operators to liaise with local shops and so facilitating thereporting and arrest of shoplifters.
However, such factors could not explain increases in violence against the person. Althoughthis offence increased in four areas, the patterns of change varied, and in general followednational crime trends (taking into account Home Office Counting Rules).
I n c reases in overall crime levels in residential areas could be attributed to re s i d e n t sreporting more crime in the belief that CCTV would corroborate their story. In two areas therecorded crime levels rose relative to reported victimisation, as would be expected if thishad occurred. However, this evidence has to be tempered by the finding of the publicattitude survey that members of the public predominantly disagreed with the statement that‘with CCTV installed, people report more incidents’.
It is commonly believed that CCTV merely displaces crime, but there was little evidence ofgeographical displacement across the projects, supporting the findings of Flight (2003).Where three projects showed possible displacement, only two of these could be attributedto the presence of CCTV (rather than confounding factors).
59
Does CCTV work? Its impact on crime and the fear of crime

Public perceptions‘ To reduce fear of crime’ was a stated aim of the majority of projects under evaluation.Findings from the public attitude survey suggest there is little evidence that CCTVachieved this. Fear of crime decreased in all 12 areas surveyed, yet only four showed al a rger reduction than the control area. CCTV was found to have played no part inreducing fear of crime; indeed those who were aware of the cameras admitted higherlevels of fear of crime than those who were unaware of them. The reduction in fear levelswas more likely to be the result of less crime, reflected in reduced re p o rted victimisationand reduced re c o rded crime.
Generally, public support for CCTV decreased after implementation by as much as 20 percent, yet it still remained high in the majority of cases. The reduction in support was foundnot to be the reflection of increased concern about privacy and civil liberties, as thisremained at a low rate following the installation of the cameras. It would seem that supportfor CCTV was reduced because the public became more realistic about its capabilities; forexample, the number of individuals who believed CCTV would lower crime went downsubstantially post-implementation.
Mechanisms In the few cases where CCTV appears to have reduced crime, or particular crimecategories, this has been brought about through a number of key mechanisms. As CCTVshows the largest impact on premeditated or planned crime, the strongest mechanismappears to be deterrence.
While an assessment of the police use of images was outside the remit of the research, therewere not many identified cases of possible detection brought about through the transfer ofinformation between control room operators and the police. Where this was most noticeablewas in the handling of shoplifting offences in urban centres. Another system appears tohave been used in dealing with alcohol-related offences such as public order, and this cameabout through a good partnership between CCTV control rooms, the police, and otheragencies, particularly Retail and Pub Radio.
In only one system, Hawkeye (which was mainly designed to deal with vehicle crime), coulda connection be drawn between increased detection by retrospective provision of evidenceand a reduction in crime. Over 82 per cent of offences committed across the area weredetected through the provision of CCTV evidence.
Assessing the impact of CCTV
60

Clearly, the mechanisms through which a system works depend on the characteristics of thesystem and the circumstances in which it is installed. These are complex and clear patternsacross schemes and are not easy to identify. A number of characteristics of CCTV systemswere investigated during this research, including camera density and coverage. Generally,as coverage of a target area increased so did the reduction in crime. Surprisingly however,those areas with a high camera density were no more likely to act as a deterrent than thosewith lower density.
What should be made of the findings?The most obvious conclusion to be drawn from the analysis in this chapter is that CCTV is anineffective tool if the aim is to reduce overall crime rates and make people feel safer. TheCCTV systems installed in 14 areas mostly failed to reduce crime (with a single exception),mostly failed to allay public fear of crime (with three exceptions) and the vast majority ofspecific aims set for the various CCTV schemes were not achieved. Despite all this we arereluctant to draw the simple conclusion that it failed.
The dynamics of crime prevention measures are notoriously complex, but those of CCTVsystems are perhaps the most difficult to unravel. So far we have examined the mechanismsby which it was hoped that CCTV might reduce specific types of crime, allay fear of crimeand improve re p o rting to the police. At least two of these goals (reduced crime andincreased reporting) are in conflict. However, more importantly, it is not CCTV itself that canachieve these objectives, but rather the people who plan, implement, manage and operatethe systems.
The relationship of this chapter to the next is perhaps best illustrated by a sporting analogy.When the odds-on favourite fails to win the Derby, the post-race analysis focuses on bothhorse and rider. Was the horse simply not as good as had been supposed, or did the jockeyride a poor race? This chapter has concluded that CCTV has failed to meet expectations: thehorse has flopped. The next chapter assesses what sort of ride it was given.
61
Does CCTV work? Its impact on crime and the fear of crime

Assessing the impact of CCTV
62
4. What influences CCTV’s operation?
The previous chapter has shown that CCTV has worked in some areas to a limited extent buthas broadly failed to impact on recorded crime. This can be attributed in part to the designand operation of each CCTV system. The characteristics of a system that determine whetherit is likely to have a chance of success can be grouped under five headings:
● System objectives
● Management of the project
● Density, camera coverage and positioning of cameras
● Technical characteristics of the CCTV system
● Control room operation
This chapter discusses how the characteristics of the CCTV projects being assessedinfluenced their capacity to meet their objectives. It can be seen that, whilst some projectswere set up so that they met certain objectives some of the time, none achieved all of them.
System objectives
Like all crime prevention initiatives, CCTV needs to be implemented with clear objectives inmind. Apart from providing a yardstick against which to judge a scheme, a statement ofobjectives inspires confidence that the planners understood what CCTV could achieve, howthe system might achieve its aims and in what contexts. Many of the schemes beingassessed did not have clearly stated objectives, for a number of reasons.
First, CCTV was credited with the well-reported arrests of the murderers of James Bulger in1993, and later of the Brixton nail-bomber in 1999, leading to a universal assumption thatCCTV was ‘a good thing’. This lessened the need for project planners to demand evidenceto support the claims made for CCTV. There was also little need to think about whetherCCTV was the best measure to address the particular problems in the area where it was tobe applied. One project manager stated: I’m all for [more cameras]; it builds the system up
63

doesn’t it? If I had my way I’d have cameras everywhere, ‘cause they’re good. The HomeOffice endorsement of CCTV further diminished the need for planners to be seen to assessCCTV critically, as one of many possible crime reduction initiatives.
Where CCTV was already in place, its perceived success led to a demand for more of thesame. Six of the 14 evaluated systems (see Appendix D) were modernisations or expansionsof existing systems. One of them used the claimed success of CCTV in a town centre tosupport expansion into the adjacent residential area:
The Home Office bid means two new areas of the Borough will reap the benefits ofCCTV camera coverage, which has proven to help reduce crime and the fear ofcrime in and around the town centre.
(Council News Website, August 2001)
Within local authority areas, the presence of CCTV in one town centre led to pre s s u re to install itin others, and one local authority had a stated policy of installing CCTV in all its town centre s .
Funding applications were often characterised by objectives set in vague terms, such as ‘toreduce crime and disorder’ or to ‘detect and deter criminals’ (Smith et al. 2003), althoughsome were more specific; CCTV will ‘increase police deployments and response’ or ‘deterthe travelling criminal’ and ‘increase the opportunities for the detection and prosecution ofoffences’ (see Table 4.1).
Practical difficulties, which might arise in the achievement of stated objectives, were rarelyc o n s i d e red, it being generally assumed that everyone would cooperate to make CCTVwork. Thus local authorities might set as an objective for CCTV an improvement in thedeployment of police officers without re g a rd to whether the police would be likely tocooperate with the CCTV scheme. Good relationships between agencies responsible forcrime control were taken for granted, partly because of the provisions of the Crime andDisorder Act 1998. In some cases previous difficulties in communication between the policeand the local authority were ignored (see Gill et al. 2005a).
Second, the availability of funding led to a perceived obligation on local authorities to bidfor schemes intended to benefit their residents and businesses, whether or not there was anidentified need. A senior community safety team member in one partnership wrote:
The Borough did not have any strategic plan as to the need for any more CCTV. Similarly,no areas within the Borough had been prioritised as being suitable for CCTV.
Assessing the impact of CCTV
64

C o n s e q u e n t l y, the Home Office funding stream was seen primarily as a fundingopportunity not to be missed, rather than being an opportunity to address identified need.
Others doubted that CCTV was the most effective way of spending the available funds:
Other measures, far cheaper, could have been better. For example, target hardeningthe ground floor flats, providing door entry systems, gating off the estate andproviding improved lighting. I don’t know how clear the aims were defined but themoney involved (from the Home Office) made it difficult to refuse…I guess it waseffectively ‘Take the money now or lose it’.
(Housing manager)
Bidding for funding allowed local authorities to demonstrate to residents that they wereaddressing local fear of crime; ten of the 13 projects set the reduction in fear of crime as themain objective (see Appendix D). Funding for CCTV also assisted four local authorities toobtain money from other sources such as Single Regeneration Budgets, which re q u i re dmatched funding (see Appendix D). In three areas, CCTV was expected to assist in gainingstatus awards, such as Secure Car Park status (see Appendix D).
Such generic reasons for installing CCTV may have led project designers to conclude thatinstallation was virtually an end in itself; hence such vaguely stated objectives as to ‘reducecrime and disorder and the fear of crime’. Although three sets of project planners assumedthat the well-publicised successes attributable to CCTV would reassure the public, they didnot give much thought to how precisely this would be achieved, or to defining what aspectsof system design would need to be in place to achieve it.
T h i rd, bidders faced a number of constraints, which hampered their ability to pro p o s eschemes for the most needy areas. Eight projects were able to access crime statistics for theprecise intervention area including all those that showed a reduction in crime, and a furthertwo obtained them for part of the intervention area, but in other cases lack of time to makethe bid, limited availability of crime statistics and the lack of expertise of those producingthem led to target areas being identified by local reputation or police statistics for areaslarger than the target area (see Table 4.2).
Where figures were obtained, they were provided to support the funding application ratherthan for their objective value. This suggests that little has changed since, in 1991, theMorgan Report complained that problem identification was ‘opportunistic and haphazard’(Home Office, 1991: 21). As a consequence of such shortcomings, at least one pro j e c t
65
What influences CCTV’s operation?

resulted in CCTV being installed in areas where crime was in fact low; and other city/towncentres where CCTV was installed, may also have had low crime rates49.
In summary, objectives were poorly formulated because planners had so much faith inC C T V ’s efficacy that they saw little need to justify its installation, and there was little incentivefor them to consider precisely what effect CCTV might have. This was true of all systemsincluding those which re c o rded an impact on crime. Although the project planners in thesecases were clear about the nature of the problems to be addressed, and had someconception of how the system might be set up so as to address them, nevertheless they re l i e don a number of assumptions, such as the support of another agency. In all cases, objectivese m e rged as the systems became operational and were in practice determined by such factorsas the management of the CCTV systems, the ways in which camera locations were selected,technical factors and control room operations. Each of these factors will be discussed in turn .
Management
Aspects of the management of CCTV systems affected their design and operation throughoutthe bidding and implementation process, continuing into full operation.
Usually a team was specially formed to install the cameras, and its composition influenced theimplementation process (see Gill et al. 2003). Three key team characteristics determined whetherthe CCTV systems were designed to meet their objectives. Whilst the systems were on the wholereasonably well designed and implemented, nine had minor flaws, which could be attributed to thedecisions or actions of those installing the system, and in four cases design problems impactedsignificantly on the way the system operated (see Appendix D). The key characteristics were :
● Access to appropriate technical expertise
● Full engagement of end-users
● Suitability of project manager
Understandably, public service employees often lacked the desirable level of knowledge ofcomplex and rapidly changing CCTV technology. Ten out of the 13 teams contracted in the
Assessing the impact of CCTV
66
49 Crime rates were classified as low if they were below the national average for England and Wales for all crimecategories. The average in each area was calculated by setting the number of offences against population.Given the low residential populations in town and city centres, this measure does not accurately reflect therelative crime levels in these areas.

s e rvices of a technical consultant (see Appendix D). The consultants were given diff e re n troles within the project teams and in some projects took on the role of coordinating theimplementation process. In five cases, the consultants contributed to the design of technicallysound systems, with well-positioned and appropriate cameras, and control rooms providinggood-quality evidence. These included two systems, which brought a reduction in crime(Hawkeye and City Outskirts). However, no system was perfect, and it was sometimes amatter of chance whether or not a sufficient proportion of the system worked effectively.
T h e re were a number of reasons why the systems designed by consultancies had flaws.T h e re was evidence of over- reliance on the consultants’ expertise and a lack ofcommunication between the consultant and the system users. Consultants provided cheaperequipment in order to reduce costs without explaining the implications suff i c i e n t l y. Forexample, cheaper cameras could not be placed on auto-tour as the mechanisms wore out,which meant that members of the public would be less likely to see them moving. Thisreduced the impact of projects whose primary objective was to reassure the public or deteroffenders. A number of systems experienced problems with cameras being positioned tooclose to buildings or to bright lights, or amongst foliage (see Appendix D). These problemsw e re often attributed to the technical consultant, but could also be caused by a lack ofcommunication between consultants and other project members, combined with a tendencyto carry out system planning during the day, in winter, or at other times when potentialobstacles are not visible. In one case, the council used a consultant they had used forseveral years, rather than putting the contract out to a Best Value re v i e w, and he hadbecome complacent. He failed to investigate the lighting levels in a residential area despitebeing briefed to do so; consequently night-time images were virtually useless.
The four teams who did not employ a consultant were able to install their systems morequickly (as there were fewer people to liaise with). However, they were more exposed to thesales skills of suppliers, and there were fewer checks on equipment choice. One of thesystems was redeployable and used state-of-the-art technology. While it had many goodpoints, it was virtually useless for live monitoring and had a number of flaws in its recordingcapacity. It was therefore used primarily for reassuring residents by providing a physicalpresence. Whilst this meets the main objective of this system it was a relatively expensivesolution. Another installed too strong lighting, causing strobing of night-time images, whichconsiderably reduced quality. Although this system produced a reduction in crime, itoperated by deterrence and had a poor capacity to detect crime at night.
The individuals who implemented CCTV systems were often not those involved in its day-to-dayoperation. To reach full potential, the end-users should be actively engaged in the implementation
67
What influences CCTV’s operation?

p rocess in order to ensure ongoing cooperation. Five systems where this was not doneexperienced difficulties initially (see Table 4.1) and failed to bring a reduction in crime. The mainend-users of most systems were the police and there were examples of a lack of strategicplanning with the police leading to difficulties in system operation. One redeployable system wasunable to obtain police information, which would have enabled cameras to be placed inhotspots. In the case of one urban centre system, the police took little interest in the CCTV systemand were initially slow to get involved in the operational pro c e d u res of the control room.
In all cases, the key end-users (for example, police and other local authority departments)were consulted at the planning stage, but were reluctant to become involved for a range ofreasons, including differing strategic and financial priorities, a concern that the new CCTVsystem would increase workload or place a strain on already stretched financial resources,or (as in one residential area) anxiety that it would create demand for further CCTV, forwhich there was no available funding. The following case study illustrates the problems thatcan arise when there is lack of engagement.
Case study (City Hospital)The local police force had identified a hospital as a vehicle crime hotspot, and CCTV wasinstalled in the main car parks. An objective of the system was to improve patient and staffsafety by providing an immediate response following an incident. The hospital systemwould be monitored by the local authority, which would also respond to help-pointactivations. The system was initiated by a police officer who subsequently re t i red, forc i n gthe hospital trust to become the project managers. However, the Trust relied on the policeto provide CCTV expertise and it was also necessary to set up data-sharing pro t o c o l sbetween the hospital trust, police and the local authority. However, neither the localauthority nor the police provided the necessary support at crucial times in theimplementation process. The responsibility for the CCTV fell to a number of diff e re n td e p a rtments in the local authority and the hospital was not able to engage the appro p r i a t epersonnel. The police CCTV re p resentative had a number of other pressing concerns andwas not able to prioritise the hospital CCTV system. Consequently, there were severedelays in establishing the protocols for information exchange and in re s o l v i n gimplementation problems. These difficulties were not resolved within the evaluationtimetable, so that the system could only be evaluated as a possible deterrence to crime.
It was the project manager’s role to ensure that a fully functional CCTV system was installed,and all except one of the evaluated projects achieved this. A number of key characteristicsof an effective project management role were identified.
Assessing the impact of CCTV
68

The project manager must be identifiable and accessible, which seems self-evident, but threep rojects failed in this respect (see Table 4.1). The following quotation is from a pro j e c twhere no one was identified as a key contact:
When I first joined there was no key person to contact for CCTV – it felt like it waspassed from person to person. T h e r e ’s no day-to-day manager and it causes realissues. As a Community Development Worker for the area I’d get queries fromresidents and I wouldn’t know who to call. Simple things took a lot longer becausethere was no direct line of communication. I think that could have been better if ithad been planned from the start.
The projects failed to appoint a willing manager for two main reasons. No one agencywished to take responsibility for CCTV installation because of the personal and financialburden that this would place on it. In addition, CCTV fell outside the core activities of themanaging departments and so there was no obvious manager. As a result, the managementtask was foisted onto people who had other duties and who were quite likely to have littlei n t e rest in CCTV. Consequently, the projects either failed to complete implementationp roperly or remained directionless even after coming into operation, as illustrated in thefollowing case study.
Case study (Westcap Estate)A ten-camera system was installed in a high-density residential area primarilybecause funding was available, but also to re a s s u re the public. There was a lack ofstrategic direction to the project and the objectives were poorly defined. Rather thanbeing chosen as the best candidate, the project manager was chosen because therewas no alternative. His full-time role as a parks police inspector limited the time hedevoted to the project to a maximum of ten hours per week. He was not enthusiasticabout the role, which was not even officially written into his contract (‘I have acontract, where nowhere does it mention CCTV – it’s cheap to give me a job on topof a job’), and merely did the best he could in the circumstances. A colleague felts t rongly that these arrangements had had a negative impact on the management ofCCTV generally in the Boro u g h :
The fundamental problem with CCTV is that no-one has got ownership of it. X dealswith project management, but he doesn’t want it. He got lumbered with CCTV and hedoesn’t really have enough expertise or knowledge, but does enough to keep it justabove water. He’s not interested in it and he would drop it if he could.
69
What influences CCTV’s operation?
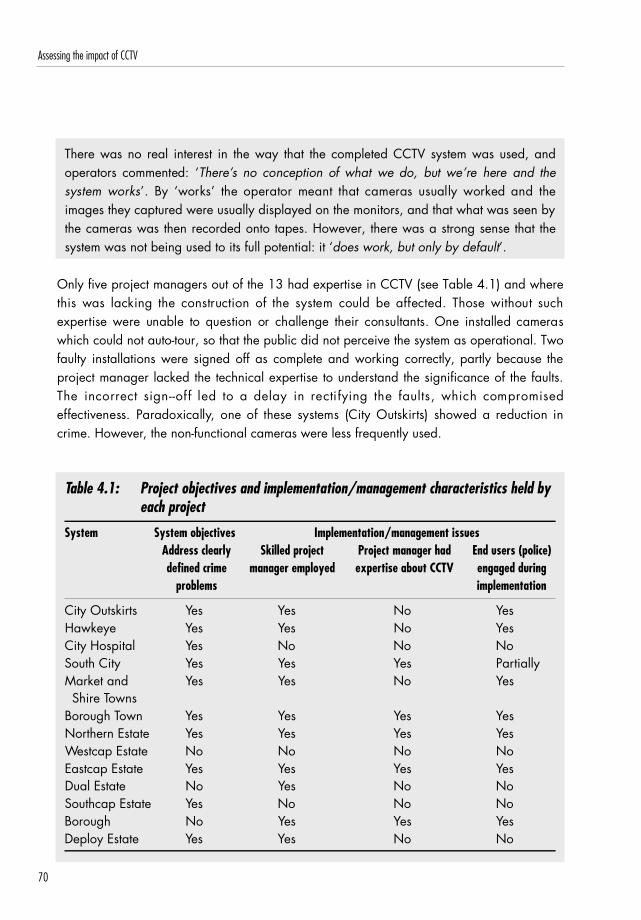
Assessing the impact of CCTV
70
There was no real interest in the way that the completed CCTV system was used, andoperators commented: ‘T h e r e ’s no conception of what we do, but we’re here and thesystem works’. By ‘works’ the operator meant that cameras usually worked and theimages they captured were usually displayed on the monitors, and that what was seen bythe cameras was then recorded onto tapes. However, there was a strong sense that thesystem was not being used to its full potential: it ‘does work, but only by default’.
Only five project managers out of the 13 had expertise in CCTV (see Table 4.1) and wherethis was lacking the construction of the system could be affected. Those without suche x p e rtise were unable to question or challenge their consultants. One installed cameraswhich could not auto-tour, so that the public did not perceive the system as operational. Twofaulty installations were signed off as complete and working correctly, partly because theproject manager lacked the technical expertise to understand the significance of the faults.The incorrect sign--off led to a delay in rectifying the faults, which compro m i s e de ffectiveness. Paradoxically, one of these systems (City Outskirts) showed a reduction incrime. However, the non-functional cameras were less frequently used.
Table 4.1: Project objectives and implementation/management characteristics held byeach project
System System objectives Implementation/management issuesAddress clearly Skilled project Project manager had End users (police) defined crime manager employed expertise about CCTV engaged during
problems implementation
City Outskirts Yes Yes No YesHawkeye Yes Yes No YesCity Hospital Yes No No NoSouth City Yes Yes Yes PartiallyMarket and Yes Yes No YesShire Towns
Borough Town Yes Yes Yes YesNorthern Estate Yes Yes Yes YesWestcap Estate No No No NoEastcap Estate Yes Yes Yes YesDual Estate No Yes No NoSouthcap Estate Yes No No NoBorough No Yes Yes YesDeploy Estate Yes Yes No No
Density, camera coverage and positioning
T h ree factors potentially impacting on the effectiveness of the systems were the density(number of cameras per unit area), the camera coverage (the amount of area that thecameras can see) and the positioning of cameras. Clearly all three are related.
The density varied widely from scheme to scheme. Eight to 12 camera systems covere dareas, which varied in geographical size from one or two streets to an entire estate, or evenseveral estates. Similarly, the number of cameras installed in town or city centres rangedfrom nine to 51.
One of the main implications of using more cameras is that they cost more to purchase andinstall. Partnerships bid for varying numbers of cameras from a small system of eight camerasup to the largest, consisting of more than 600. These systems were installed in areas ofv a rying sizes. Whilst capital cost was not the greatest concern for projects bidding for HomeO ffice funding, it is clear that they wanted bids to appear ‘sensible’ so as to maximise thechances of success, and no written Home Office guidance was provided as to what was asensible level. One partnership felt confident enough to bid for funds to install 154 camerasin a residential area with approximately 3,100 pro p e rties. In contrast, a 14-camera systemwas installed to cover two residential areas and a main road, and one of these re s i d e n t i a la reas contained only five cameras covering approximately 1,700 pro p e rties.
The statistical analysis showed a complex relationship between camera density andreduction of crime in the target area (see Chapter 3, Section A,). Whilst it is generally truethat the greater the number of cameras, the greater the reduction in crime, it is possible toinstall too many cameras in a small area so that the effect of some is reduced virtually to nil.This occurred in Areas C and D of Southcap Estate (with a density of 253 cameras perkm2), and Borough Town (325 cameras per km2).
The above can arise because the level of overlap between cameras becomes too great to beuseful. It is of far more significance that the cameras have the largest possible cameracoverage, which is brought about through careful system design. Camera coverage wasshown to be important for deterring offenders. Obviously, if the camera can see them then theycan see the camera and where it is pointing. There was evidence from the present study tosuggest that offenders were aware of the cameras’ focus, which supports the findings of earlierstudies (Gill and Loveday, 2003). From control room studies it could be seen that knownindividuals tried to hide behind street furn i t u re to avoid the cameras’ gaze; in focus gro u p sboth members of the public and offenders stated that offenders were aware of the cameras.
71
What influences CCTV’s operation?

The effectiveness of the camera coverage is attributable not least to the positioning of thecameras. Clearly, cameras have to be able to observe a target area to detect crime andgather evidence. If cameras were poorly positioned or covered too small an area thenoperators could undertake only partial monitoring and could not track offenders from onearea to another. A number of factors influenced the extent to which camera coverage andpositioning helped systems to meet their objectives and these are discussed below.
The achievement of objectives depends on proper monitoring. For reasons identified in thec o n t rol room section below, operators monitored busy urban centres at the expense ofquieter urban centres and residential areas. Cameras in quieter areas were mainly used top rovide re t rospective evidence of crime in hotspots, rather than being used to trackindividuals in live monitoring. Three residential areas had blanket coverage, while theremaining residential systems covered the main crime hotspot areas identified by the police(see Table 4.2).
The danger in covering only hotspot areas is displacement of crime, and this occurred in thecase of two residential systems, which showed a reduction of crime (Northern and EastcapEstates). This was pointed to as a possibility in another residential area where isolatedcameras were used to target anti-social behaviour:
One of my concerns…is that [the camera] might push them round our way, as it’swatching everything they do round there they might start to come round our bit of thestreet. And I have noticed that we are starting to get these, I mean my nickname forthem is White-hats, these young thugs and that. They are passing through a lot and Iam thinking why are they passing through, they come up [place] and go right backround to where you had come from, and it’s to avoid the cameras and that is theflipside they push them round to other areas.
(Resident of an estate where a single redeployable camera had been installed)
In contrast to quieter areas, busy urban centres were more constantly monitored, sop roducing substantially more live incidents. In such areas it was important that camerasoverlapped, so that there was continuity of footage from one camera to another.
Whether or not a level of coverage was sufficient for a given area also depended on theobjectives of the system. For example, extensive and inter-linking coverage was morenecessary in urban centres where the objectives of the systems required operators to pursueoffenders in order to direct shop security, pub security staff and police to targets (see controlroom section below). In residential areas, where the objectives were predominantly to
Assessing the impact of CCTV
72
reassure the public, the number and position of cameras were much less of an issue as longas some coverage was provided. Many of the crime problems (such as anti-socialb e h a v i o u r, burg l a ry and criminal damage) could be resolved by the use of re t ro s p e c t i v eevidence. Where the system was intended to address particular offences it was necessary tocover the main crime hotspot(s), and this was largely achieved.
Although the main objective of urban centre systems was to track offenders, the urbancentres being assessed for this report presented a number of features that limited the cameracoverage. Brown (1995 p: 11, see also Sarno et al. 1999) highlighted the fact thatNewcastle City Centre was ‘conducive to camera surveillance’, as ‘the streets are wide andrelatively straight, there are few subways and few obstacles that block the cameras’ view’.In the three urban areas under evaluation, cameras covered main streets only, and not sides t reets and alleyways. These areas did not lend themselves to comprehensive CCTVcoverage, as they did not contain long straight boulevard-style streets. The failure to provideblanket coverage in urban centres, where the objectives were to pursue shoplifters ora l c o h o l - related offenders and alert police and/or security staff to their location, causeddifficulties, as these quotations from CCTV operators demonstrate:
O c c a s i o n a l l y, where you may well have seen something [referring to an off e n c ebeing committed] and a person runs down a side-street and you lose them, they don’tcome out where you expect. It can be very annoying, witness something, then theyare gone.
There are a number of areas where you can lose people. You would be talking avery large number of cameras to cover all the roads. It covered all the major roads,it’s just the little windy streets.
The quotations allude to the fact that blanket coverage of areas with many small alleyswould probably be prohibitively expensive; and in some cases loss of targets was not asignificant problem, as these quotations from operators demonstrate:
Most of it [referring to target area] is covered well enough and I don’t generally haveproblems tracking people.
The busy streets are covered, but not all streets, you could argue for a camera onevery street. The important streets are covered and that’s what we need to tracktargets.
73
What influences CCTV’s operation?
Consultation with parties with knowledge of crime problems and anticipation of likely futureproblems is important for decisions about the placing of cameras, but only seven of the 13projects were found to have gone through a structured consultation process. Those that didtypically collated information about crime patterns and positioned the cameras to coverareas where crime was most prevalent (see Table 4.2). The following case study provides amore detailed account of how thorough consultation was conducted:
Case Study (South City)Two members of the ‘project team’: the crime and disorder coordinator and the polices e rgeant, as well as a technical consultant, toured the target area inspecting thep roposed camera locations. The sergeant provided crime figures on a stre e t - b y - s t re e tbasis and these were used to identify precise camera positions and fields of view. Thep a rtnership sent the plan of the proposed camera locations to local beat officers forre v i e w. As a result of this consultation, minor alterations were made and three extracameras were added.
Another project team found after consultation on camera positioning that it could addressproblems that had not initially been recognised:
Two cameras were added to the system on the outskirts…the (technical consultant)identified the need to provide coverage of the shops, as well as the entrance to theindustrial area…this means that the system can be easily extended if further fundingbecomes available.
(CCTV project manager)
O v e r- reliance on the technical manager, to the neglect of other parties, was a key issueunderlying many positioning errors. In one residential area, consultation had beenconducted, but the technical consultant was given the final decision on positioning, which inhindsight was criticised by the project manager:
The positioning is really not great…For example, camera No X. - there’s three wallsthere, we could have had a fixed camera there instead…Cameras Y and Z arecovering very similar territory. P has blurred images – it’s sited very high.
In another example, the technical manager largely conducted the design. Poor appreciationof the problems and locations in the area resulted in the absence of cameras on the mostnotoriously problematic street. This was not realised until a year after the scheme’s
Assessing the impact of CCTV
74

installation. So operators were prevented from monitoring this street. Nonetheless the systemacted as a minor deterrent, probably because two CCTV cameras were placed at each endof the street and offenders were unaware of the coverage they afforded.
Operators commonly complained that they were not consulted and there were flaws incamera positioning, which reduced the effectiveness of the system. A CCTV operator whoworked on a town centre system and needed to track individuals stated:
…if we could have seen this system before it went in we would have moved some ofthe cameras as there are a lot of gaps in the system…don’t think that the people theyhad to place the cameras are that clever – especially Camera 2, which should havebeen in the middle on a 360.
The operators in this control room experienced difficulties in pursuing offenders because thecameras were poorly linked up. Although operators were commenting with hindsight and alack of awareness of the compromises that had had to be made (such as cost and obstaclesto positioning), such consultations could have improved the system design.
Compromises were also made where project managers had to obtain consent from otherd e p a rtments or agencies whose own objectives or re s o u rces could be affected by acamera’s position. These included parks and planning and conservation departments. Therewere instances where the best location for the camera would have been where a tree stoodor where a tree would need regular pruning for the camera to work eff e c t i v e l y.Understandably, parks and conservation departments were reluctant to remove trees for thispurpose; but they were also reluctant to commit to regular pruning, and project plannersoften discovered this reluctance too late.
Finally, as described in the report50 ‘Lessons for Implementation’, system designers had totake into account the location of underg round obstacles such as mains pipes for gas,electricity and water when planning camera locations. Obstructions above ground, such asbuildings, street furn i t u re, high-sided vehicles using the area, festival decorations such asflags and lights, and tree foliage were often not given due weight, especially the lastmentioned, because camera locations were often decided in winter when tree foliage wasat its least obstructive.
Whilst the impact of these was not huge, they reduced the systems’ overall capacity tomonitor or to deter offenders.
75
What influences CCTV’s operation?
50 Gill et al. (2003): Early findings on scheme implementation, Home Office Development and Practice Report, 7.

Table 4.2: Camera coverage, density and positioning against characteristics of eachproject
Project Availability of data Camera Coverage Density Coverage adequate to meet for the target area* (% Target Area) (per Km2) objectives/type of coverage
City Outskirts Police statistics, 68 64 Yes/blanket coverage problem target area areas, Good Tracking
Hawkeye Police statistics, 95-100 N/A Yes/blanket coverage,target area all car parks.
City Hospital Police statistics, 67 76 Yes/crime hotspotstarget area
South City Police statistics, 72 73 Yes/crime hotspots,target area limited tracking
Shire Town Police statistics, 76 94 Partially/crime hotspots, half of target areas limited tracking
Market Town Police statistics, 34 93 Partially/crime hotspots, half of target areas limited tracking
Borough Town Police statistics, 70 325 Yes/crime hotspots target area
Northern Estate Police statistics, 87 127 Yes/blanket coveragetarget area
Westcap Estate Police knowledge N/A N/A Yes/crime hotspotsof hotspot areas
Eastcap Estate Police statistics, 29 29 Partially/blanket coveragetarget area main streets, one gap in
coverageDual Estate Police statistics, 9 10 Partially/crime hotspots,
part of target area limited trackingSouthcap Estate Police statistics, 73 184 Yes/blanket coverage
target areaBorough Police Knowledge N/A N/A Yes/crime hotspots
of hotspot areasDeploy Estate Crime and disorder 34 25 Partially/crime hotspots
audit
* The most appropriate form of data available to each project to assess the crime and disorder problems inthe target area.
** Based on information obtained from system installers.NA Not applicable.
Assessing the impact of CCTV
76
**

Technical characteristics of the system
This section describes how the technical characteristics of CCTV systems influenced theiroperation. Although a detailed technical analysis is outside the scope of this re p o rt, theevaluation identified three technical aspects, which had a significant impact on the systems’ability to meet a range of objectives.
The type of camera used and the way that it was mounted influenced whether the systemcould be used more effectively for live monitoring, for providing good-quality retrospectiveevidence, for deterring would-be offenders, for reassuring the public, or for a combinationof these. The systems used two types of camera, static or pan tilt and zoom (PTZ), and thesewere either box- or dome-mounted.
Static cameras were most useful for providing good quality evidence. They pointed in oned i rection and had a fixed focal length, and so they could be placed to pro v i d ecomprehensive coverage of an area. However, it was important to place them so that therecordings across the whole area were capable of providing evidential-quality images (seeAldridge, 1994). Static cameras were used exclusively in the car park system included inthe evaluation and this used the Rotakin test5 1 (Aldridge, 1989) to set the appro p r i a t ecamera coverage. The scheme also covered entrances and exits, providing records of carregistration numbers. This system had a significant impact on vehicle crime, providing ahigh proportion of images to the police for use as evidence, as well as deterring offenders.
Static cameras were unlikely to be monitored live, first, because they were boring tomonitor, as operators could not interact with the system and, second, because there wasoften a higher camera to wall monitor ratio, limiting the number of cameras that could bedisplayed and reducing the ability of operators to spot an incident. There were between 13and 17 static cameras to one wall-monitor, in contrast to PTZ camera systems, whichnormally had a ratio of between two and five cameras to one wall-monitor52. In three controlrooms, during a total of over 108 hours of monitoring, only 17 incidents were spotted liveon the static cameras, compared with an average of over 100 live incidents spotted incontrol rooms using PTZ cameras over a 48-hour period.
Designers pre f e rred PTZ cameras, which could be controlled by operators trackingo ffenders. They were better for live monitoring and for providing evidence of incidents
77
What influences CCTV’s operation?
51 The Rotakin Method is a test used to ensure that anything within view of the camera will be of sufficient size tomake possible at least the detection of a target.
52 One of the evaluated systems using PTZ cameras had a camera to monitor ratio of 17 to 1; however, this wasan exception to the norm.

spotted as operators could zoom onto a subject to obtain a better-quality picture. However,police and operators relied heavily on retrospective recording and here PTZ cameras hadseveral disadvantages. They could point in only one direction at a time, so that incidentso c c u rring outside the immediate field of vision of the camera were not re c o rded. Too v e rcome this, cameras overlapped so that each area was monitored by more than onecamera, but this was costly.
CCTV systems were also designed to re a s s u re the public and to deter offenders; bothaims being better met by cameras that can be seen to move. PTZ cameras can be set totour automatically, changing direction every few seconds. Seven systems routinely usedthis facility, four of which were intended to re a s s u re the public (see Appendix D).U n s u r p r i s i n g l y, however, members of the public and offenders also became wise to theirautomatic movement. The public were less likely to be re a s s u red and offenders were ableto predict the direction of cameras and avoid their gaze, as was re p o rted by residents ofan area covered by a redeployable camera intended to re a s s u re the public. As oneoperator commented, it is unlikely that offenders would be fooled for long byp rogrammed movement.
The automatic tour facility also helped each camera to re c o rd images from a larg e ra rea, increasing the amount of evidence available. However, the evaluation re v e a l e dexamples of cameras on automatic tour re c o rding part of an incident before movingaway at a vital moment.
Seven systems were unable to fully adapt to night-time lighting levels, which affected bothmonitoring and the quality of recorded images (see Table 4.3). This was caused by a rangeof issues including inappropriate levels of street lighting, cameras incapable of adapting tolow lighting levels (for instance by switching from colour to monochrome), and camerasbeing placed too close to strong light sources. In two of the three town centres, cameraswere adversely affected by the neon lighting of the very premises that they were supposedto be observing (see Appendix D). Four out of the seven residential area systems sufferedfrom inappropriate lighting levels around cameras, which could not be adjusted, and two ofthe night-time images were so dark as to be vir tually useless (see Appendix D).Consequently, at night the CCTV systems acted only as a deterrent or to reassure the public.M o re often the difficulties involved strobing or glare on the images and lack of focus orblurring while the cameras were in motion.
Assessing the impact of CCTV
78
Case study (Eastcap Estate)Ten cameras were installed in a small residential estate alongside improved lightingaimed at increasing the quality of the recorded images. The cameras were placed tooclose to the lights so that the images strobed or glared at night. An operator reported anoccasion when he was following a couple up a hill. The man stopped while his girlfriendc a rried on walking. The operator followed the female, but panned the camera backdown the hill to check what her partner was up to. He was unable to locate him, andpanned back to the female, by which time her partner was with her again. He reportsthat he must have panned right past him, but because of the blurring of the movingcamera image, had been unable to spot anything.
Project managers and consultants should have assessed the level of lighting and the cameraspecifications in the process of designing the CCTV system; but this was not always done.Those designing one scheme recognised the need for improved lighting, but no financialre s o u rces were available. In two cases the consultant failed to correct low lighting levelssufficiently. In another, cheap cameras were chosen to reduce the cost of the system. In twosystems cameras could be switched to monochrome, but operators either forgot to switchthem or preferred colour images.
Systems used diff e rent re c o rding equipment and settings, which affected the quality andavailability of evidence. The evaluation took place at a turning point in the development ofre c o rding technology. While six of the evaluated systems re c o rded images on the moretraditional analogue S-VHS tape, six recorded digital images on a computer hard drive, oneof which also backed up the recordings on digital tape. One system used both media (seeTable 4.3). Each medium had its advantages and disadvantages:
● Digital systems could be searched more quickly than analogue systems, saving onpolice time spent looking for evidence. The average search time on one digitalsystem under evaluation was 18 minutes compared with 40 minutes on ananalogue system.
● Images on digital hard drive maintained their quality, whereas an analogue tapewore out with use.
● Digital systems had a finite storage capacity and had to strike a balance betweenthe number of images stored and their quality, but all the digital systems underevaluation were able to store images for 31 days with no noticeable loss ofimage quality. Analogue systems were restricted only by tape volume.
79
What influences CCTV’s operation?

● Operators and control room managers lacked knowledge of digital technology in thecase of two systems, which compromised their effectiveness. In one, the hard drive wasre c o rding images for more than 31 days before automatically overwriting, but therewas insufficient understanding of re c o rding settings to adjust this. Operators also lackedconfidence or sufficient training in using the new technology to carry out searches.
All the control rooms stored images from all cameras for 24 hours a day, seven days aweek. Control rooms saved on storage space by recording the images from several camerasonto one piece of equipment, taking an image from each camera sequentially. If there weretoo many cameras attached to the equipment then the number of frames from each camerawas low and there would be only partial recording of any observed incident. The PoliceScientific Development Branch (PSDB) guidelines53, that an image from each camera shouldbe re c o rded at least three times in every two seconds, was achieved in four of the 13systems under evaluation (see Table 4.3). In two cases, (monitoring residential areas) therate of recording was extremely low, and, whereas one provided no evidence to the police,footage from the other system was described as ‘virtually useless’ by the police.
The digital systems under evaluation tended to have faster recording rates than analoguesystems, but there was no hard and fast rule. In both types of system, the biggestd e t e rminant of re c o rding rates was the amount of equipment, and system planners wereguided principally by cost and by the advice of consultants.
Control room operation
The control room operation determined whether the system was likely to assist in detectingcrime in the target area (for more detailed findings of the control rooms under evaluation, seeGill et al. 2005a). Four aspects of control room pro c e d u re were important: live monitoring;re c o rding of evidence; communication links between agencies; and the area being monitore d .
Seven of the 13 control rooms monitored for 24 hours a day, while six monitored at timesidentified by police intelligence as being marked by particularly high crime levels (seeAppendix E). One significant objective of most control rooms was to observe hotspots andto make possible immediate deployment of police officers, or (particularly in urban centres)to share intelligence between agencies to allow exclusion of known offenders, such as retailoffenders or alcohol-fuelled revellers. The control room studies revealed that the operation ofmost systems was not good enough to achieve these objectives.
Assessing the impact of CCTV
80
53 Aldridge, J. (1994): Who will be the first to test your CCTV security or safety team? CCTV OperationalRequirements Manual, Police Scientific Development Branch, no.17.
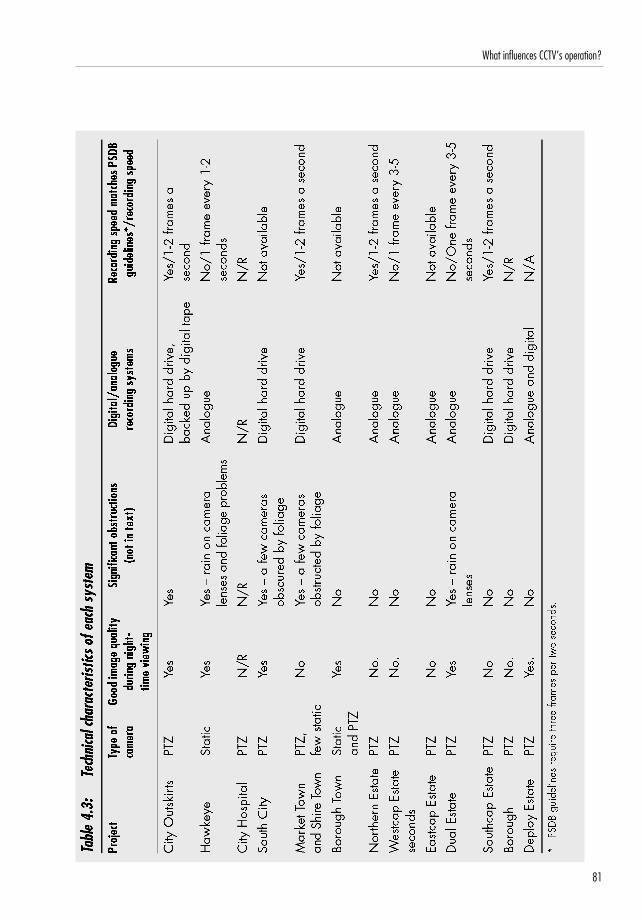
81
What influences CCTV’s operation?
As well as live monitoring, control rooms also provided recorded evidence to the police.Predictably, more evidence was provided for town and city centres, the hybrid system andthe car park system than for the residential areas (see Appendix E). Interestingly, with theexception of the car park system, those areas where there were a greater number of tapestaken as evidence were those where there was a higher level of live monitoring.
Control rooms relied on good communication with end-users, and these links influenced thetype and volume of incidents monitored and determined what happened to them.
The control rooms received a relatively small volume of communication. Control ro o mstudies54 found that only 26 per cent of incidents were prompted by outside agencies suchas police contacts and Retail and Pub Radio links, while operators themselves identified 74per cent of incidents, ranging from 45 per cent to 93 per cent across the control rooms.
Likewise, control rooms passed on a modest number of live incidents to outside agencies. Acro s sall control rooms, operators passed on information on approximately one fifth of incidents andonly one-third of incidents related to identifiable offences. A quarter of crime-related incidentsw e re re p o rted to the police. Two control rooms passed on no intelligence at all during theo b s e rvation. One monitored a car park system set up primarily to provide re t ro s p e c t i v eevidence to the police. The other system was set up mainly to re a s s u re the public by its pre s e n c eand the lack of communication did not interf e re with the achievement of this objective.
A number of incidents that were not reported would have been of potential interest to thepolice. They included ‘possible drug use’, ‘trying to break into a metal shed’, ‘very drunk,not allowed in any bars’, ‘very drunk, obstructing vehicles’, ‘abusive and violent’, ‘possibletheft from shop’, ‘abusive to shopkeeper’, ‘man wielding knife in bar’.
Communication levels were affected by a number of factors:
In three out of the 13 control rooms, police officers carried out monitoring activities for someshifts, which increased the amount of intelligence entering the control room (see Table 4.4).O fficers were able to locate crime hotspots and local offenders. Operators working in abusy city-centre system commented on the police presence in the following ways:
I quite enjoy it. They give an insight we don’t have. They recognise individuals.
Assessing the impact of CCTV
82
54 See Appendix A for methodology. For comprehensive details of the control room studies see Gill et al. (2005a).

It helps having the police in there they tell us stuff. That bench there is where thepimps sit, we could just think they were anybody and ignore them.
The police know every nook and cranny, if we lose somebody when tracking themthey will tell us look up here or there. They have foot patrol knowledge.
An operator working in a small control room monitoring a residential area made thefollowing comment:
When the police are in here, it’s much better ‘cos they know what they’re looking forand they can liaise with people on the ground – they know more what they’relooking for – the local characters.
Police presence also increased the volume of incoming communication. The police calledcontrol rooms on a total of 92 occasions (during 462 hours of control room observation)and 44 of these occurred when an officer was present.
Nine out of 13 control rooms had access to police radios (see Table 4.4). Six of these wereone-way links, which allowed operators to listen in and identify incidents in advance, and tobegin re c o rding in real time, so improving the quality of visual evidence. Across contro lrooms, 38 incidents came to the attention of operators through the overhearing of policeradio, and although this is a small number, it accounts for nearly one third of police-prompted monitoring activity. Control room operators said:
We definitely pick most of the jobs up off police radio. It’s more motivating… the jobcomes over the radio; if you get on it straightaway you can get there before the police.
We rely on the radios, they’re our eyes and ears really, to find out what’s going on.It would be better if we could talk to police on the radio as well.
T h ree schemes had two-way links allowing direct communication with officers on the gro u n d .The following operator description illustrates what happens when this link is missing:
We can watch them on the screen missing the right person, because we cannotcommunicate with them at the time…They also release the suspectsometimes…sometimes they can be following them in the car or something, and they cango right past the person they are looking for, and we watch this, but by the time we getthrough to the police Comms and this is relayed to the police car, they can be long gone.
83
What influences CCTV’s operation?

C o n t rol rooms without police radios relied either on direct lines to the police control room or onthe standard 999 number to deploy officers to the scene of an incident. Operators’ 999 callsw e re not given priority over calls from the public with the result that there was often a delay:
I had someone being beaten up for half an hour whilst I called CAD [ C o m p u t e rAided Dispatch] and in the end I had to ring 999.
C l e a r l y, if an objective of any scheme is to direct police to incidents then two-waycommunication is a prerequisite.
Three control rooms had Retail Radios55 linking the target area to the control room (see Table4.4), and calls on this prompted an average of 14 per cent of daytime live monitoringincidents. Thus, a large proportion of daytime control room activity related to shoplifting inurban centres. Two control rooms also had Pub Radio (see table 4.4), which prompted eightper cent of incidents across the control rooms. The Pub Radio accounted for a quarter ofincidents monitored in one urban centre where the objective of the system was to addressnight-time alcohol-related crime. Whilst it did not reduce crime, it ensured that intelligencewas shared between agencies.
A number of control rooms could pass images through to the police control rooms, allowingthe police to decide whether to deploy resources. In three control rooms operators simplypassed images of potential interest, leaving it to the police to recognise their significancerather than backing up their communication with a telephone call. In one case, the videolink was attached to the monitor that operators used for their regular monitoring activities sothey often had to change the image to continue working, causing frustration to the policewhen the image changed.
Good communication relied on good operator police relations. Three control rooms hadgood relationships with both patrol officers and police control centres, which prompted arelatively high level of communication into and out of the control room (see Table 4.4). Moreoften, though, this relationship was less effective. In all systems, police officers visited thecontrol room to collect evidence, but a number of forces were unlikely to contact the controlroom during an incident or would call them too late, sometimes 20 minutes after the incidenthad occurred. Operators telephoning the police control room received varying responsesdepending on who was making and receiving the call. Sometimes, operators werereprimanded for using direct lines and required to use the 999 number, which gave rise to
Assessing the impact of CCTV
84
55 Retail and Pub Radio were services linking local businesses within an area. Shops or public houses purchased aradio and contacted other members of the scheme to warn them of potential offenders, suspicious characters ortroublemakers. These services were often linked with the local CCTV control rooms.
reluctance to contact the police dire c t l y. Control room operators felt that theirprofessionalism was being imputed when they were questioned about what they had seen.One operator commented:
Every operator on this job knows how to pick up drugs. When you’re questioned tothat degree we don’t like that.
The skills, knowledge and motivation levels of the operators determined how well theyidentified live incidents and whether they succeeded in obtaining evidential-quality images.A number of factors helped to determine the level of skill and the knowledge of operators.
Control room Codes of Practice are intended to provide guidelines on monitoring practice,for example, how to operate within relevant legislation such as the Data Protection Act1998 and the Regulation of Investigatory Powers Act 2000, and how to obtain evidential-quality images. All the control rooms assessed for this report had a code of practice, butthey were of varied quality and tended to lack vital information. Many were poorly written;operators complained that their Code of Practice would ‘definitely not win the Plain EnglishAw a r d’. Explicit advice based on Police Scientific Development Branch guidelines forcontrol room operation was rare. Many quoted the data protection principles, but did notspecify how they related to monitoring behaviour. The Codes were rarely read and manyoperators denied knowledge of their existence. One operator, who did not know where thedocument was kept and admitted to not having read it, stated that:
…nothing had really happened for us to need to use it…most of it is commonknowledge anyway, like not looking through someone’s window…
Operators obtained knowledge and skills with re g a rd to monitoring, relevant legislation,tape management and obtaining evidential-quality images from training, most of which wasprovided in-house. Evidence-gathering skills and knowledge of relevant legislation were alsopassed on through formal one- or two-day operator training courses, and operatorsrecognised the benefit of these:
I went on a X security course and was taught about image quality. The Home Officehave certain requirements for evidential images. Take these people, you can look atthem at distance and you can monitor them because they cannot be identified. Youonly really look at people if you really need to…obtrusiveness and stuff.
(Control room operator)
85
What influences CCTV’s operation?

An operator stated that the courses taught him:
What [ I ] can and can’t look at or shouldn’t look at and…the requirements forevidential purposes… you zoom in for identification and zoom out so you can seewhat is going on around it.
Another said that he:
…kind of knows about laws but it told you what you can and can’t do. If footage isto stand up in court you have to get head to their knees, I was not doing job as goodas should have been.
And a further operator pointed out that:
X was useful [it taught you] what things to look for, how to write logs, what to lookfor and how to describe people.
However, most operators felt they lacked training and that this affected their ability to dotheir job well; one commented that he experienced:
…silly little problems that are down to training, like police ask us to do something tothe image and we can’t because of lack of training.
Eleven out of the 14 CCTV systems were monitored from control rooms that wereresponsible for monitoring CCTV installed in other geographical areas (see Appendix E),and this had a significant impact on surveillance of the evaluated area. The camerascomprised a relatively small proportion of the total number of cameras in the control rooms,and received a corresponding amount of attention. In a 48-hour period, the maximumnumber of incidents occurring in any of the evaluated areas was 57, but this was unusualand occurred in a city- centre system. More usually, 20 or fewer incidents were identified,and in three residential areas the number was fewer than six (see Appendix E).
F u rt h e rm o re, many of the evaluated systems received less attention than would beexpected taking into account the pro p o rtion of cameras in the control room, which theyaccounted for. All of the residential areas, one hybrid area and one of the town centresystems were monitored alongside relatively busy urban centres, which dominated theoperators’ attention.
Assessing the impact of CCTV
86

In three out of the five residential areas fewer incidents were identified per camera. Forexample, a residential system covered by 12 cameras, making up 13 per cent of those inthe control room, accounted for only seven per cent of incidents monitored by the operators.A number of factors contributed to the lower level of monitoring in quieter areas.
1. They were less interesting to monitor.
2. Less intelligence was received about crime problems in those areas.
3. Operators had little knowledge of the geographical layout and the crimeproblems.
4. External agencies such as retail/pub radio directed the attention of the operatorsto town and city centre areas.
5. Monitoring of quieter areas was affected by the control room layout; two areasunder evaluation were monitored from a separate monitoring station, which wasnot occupied when the control room was short-staffed, and another showed theimages from 148 cameras on ten monitors (see Table 4.4).
One operator working in a control room that monitored several town centres stated that:
It is really difficult to spend time monitoring the Borough and Nearby Town camerason a weekend late shift because Big Town is so busy…but it’s OK, because they arealways recorded.
This neglect of quieter areas had a range of impacts. Operators were less likely to spot alive incident in residential or quieter areas, but would rely principally on recorded evidence.However, this evidence would be of lower quality because operators could manipulate there c o rded image only of incidents that they spotted live. This limited the usefulness of thesystem as a whole to one of deterrence to offenders and reassurance of residents.
87
What influences CCTV’s operation?

Assessing the impact of CCTV
88

89
What influences CCTV’s operation?

Linking characteristics and crime statistics
CCTV systems are a complex mix. Tables 4.5 and 4.6 below summarise the maincharacteristics of each CCTV system evaluated, in an attempt to match them with the crimeoutcomes described in Chapter 3. The lack of significant findings in the statistical analysismakes it difficult to link particular characteristics of a CCTV system with a part i c u l a routcome, but it is immediately obvious that, whilst most systems were designed reasonablywell and had few glaring faults, no system was perfect. For example, Hawkeye, whereCCTV had the largest impact, had problems with foliage and rain on the camera lenses,which reduced image quality.
No one characteristic consistently caused a system to ‘fail’ or ‘succeed’. For instance,B o rough Town and Hawkeye CCTV systems were well designed, but both suff e red from arelatively high camera-to-operator ratio, which reduced the potential for live monitoring.H o w e v e r, this had a greater impact on the Borough Town system, as this aimed to re d u c ea l c o h o l - related disorders by relying on operators to spot an incident live and to deploypolice officers to the scene. Hawkeye, on the other hand, aimed to reduce vehicle crime,which could be addressed by deterrence or by adequate provision of evidence to thepolice, and this meant that live monitoring was less crucial to its ‘success’. There f o re, thei m p o rtance of each characteristic for the effectiveness of each system varies from onep roject to another. This illustrates the importance of taking the objectives and mechanismof the system into account when defining what characteristics are crucial to the ‘success’of the system.
This then underlines the importance of considering the objectives of a system whendetermining the effect that the presence or absence of a particular characteristic has on itsoperation. For instance, the Hawkeye system was essentially a reactive system, insofar asthe police regularly used CCTV evidence as an investigative tool, and the operators’ tapemanagement skills contributed to the availability of this evidence. Blanket coverage of thet a rget area meant that most offences committed in the target area were caught on tape.Therefore, a lack of active monitoring and poor communication with the police did not havea major impact on the effectiveness of the system.
Although in a number of areas CCTV did not affect the overall level of crime, it did have animpact on individual crime categories, and this can be explained by the presence of one ormore of the characteristics identified in Tables 4.5 and 4.6. For instance, in South City, thescheme increased reporting of public order offences, and having a police officer stationedin the control room, operating a police radio, facilitated this increase in re p o rting. The
Assessing the impact of CCTV
90
scheme also contributed to an increase in the number of reported instances of shoplifting,which occurred because operators were linked into a Retail Radio system. This allowedthem to pass intelligence to the police and shop security guards. This is a further illustrationof the fact that the objectives of a scheme, and the types of crimes it aims to tackle,influence the characteristics that are vital for its ‘success’.
It is not possible to link the presence of any of the characteristics to overall crime outcomes.T h e re have been schemes that have demonstrated elements of good practice; however,there is no one shining example that combines all of these elements. The tables illustrate thefact that a range of factors can contribute to the effectiveness of a scheme and they interactin different ways. This seriously complicates, indeed it prevents, the establishment of a directlink between a particular characteristic and a particular outcome.
91
What influences CCTV’s operation?

Assessing the impact of CCTV
92

93
What influences CCTV’s operation?

Assessing the impact of CCTV
94

95
What influences CCTV’s operation?

Assessing the impact of CCTV
96

5. Economic evaluation of CCTV Schemes
Introduction
An important aspect of the study of CCTV projects, which has not been covered in recentresearch, is the broad economic balance. Earlier research has focused on the effectivenessof systems and neglected to provide an evaluation of the economic costs and benefits ofCCTV. Economic evaluation can be defined as:
The comparative analysis of alternative courses of action in terms of both their costsand their consequences.
(Drummond, 1997)
As this definition implies, economic evaluation is comparative in method. Given resourceconstraints, and therefore the fact that all possible interventions cannot be provided, it isn e c e s s a ry to consider both the costs and the economic consequences of altern a t i v ei n t e rventions. The term economic evaluation covers a range of methodologies, and thea p p ropriate choice depends to a large extent on the data that is available. Two of thepossible methodologies have been used for the purposes of the current study, a cost-effectiveness analysis (CEA) and a cost-benefit analysis (CBA).
A cost-effectiveness analysis compares interventions with a common outcome (such as crimereduction or reduction in fear of crime) to discover which produces a given level of outcomefor the minimum amount of resources. This analysis provides a method that policy-makerscan use to identify the best alternative when the value of the expected outcome cannot bem e a s u red in monetary terms, so preventing a full cost-benefit analysis, or where a cost-benefit analysis would be inappropriate, for example when policy choice is constrained.
A cost-benefit analysis measures both costs and benefits in monetary values and calculatesnet monetary gains or losses. The comparison of costs and benefits results in a ratio value,with values greater than one indicating that the monetary value of the benefits of the pro j e c toutweigh the costs of implementing and running it. Whilst it has not been possible, asdetailed further on to provide monetary values for all possible outcomes within thisevaluation, it was felt that valuing reduction in crime (as this was a principal aim in almost allp rojects) would offer an important insight into the relative merits of the projects. Additionally,w h e re projects do not produce a ratio greater than one, partial monetarisation of outcomesindicates how valuable other outcomes need to be to make the project wort h w h i l e .
97

The remainder of this chapter provides the details re q u i red to complete the economicevaluation. The next section identifies the possible outcomes from the implementation ofCCTV projects, who these outcomes affect and the processes through which they work. Anoutline of how outcomes may be measured and valued forms the basis for the followingsection. The focus then switches to identifying, measuring and valuing the resources utilisedby projects. These two aspects, costs and outcomes, are brought together in the subsequentcost-effectiveness and cost-benefit analyses.
Identification of outcomes
No economic evaluation can be drawn up unless it is clear which factors might change as aconsequence of a CCTV project being implemented. Over the last decade there has been arapid growth in the number of CCTV schemes operating within the UK. This increase hasprimarily been based upon the premise that installing CCTV will lead to two principaloutcomes: a decrease in the level of crime and a reduction in the fear of crime experiencedby individuals. Fear of crime is in fact just one of a number of community benefits that mayresult from the policy. For example, CCTV is often used as part of a regeneration strategyfor an area; and the mere presence of CCTV is viewed by some as an indication thatcommunities are safe.
These claims underscore the need to appreciate the benefits that CCTV brings and the bestmeans of achieving them. Tables 5.1a and 5.1b relate the possible outcomes to those whoare likely to be affected by these outcomes and also the process by which the outcomes maycome about. The potential benefits are those which produce savings and are outlined inTable 5.1a, whereas 5.1b summarises the additional costs that are incurred if CCTV systemsoperate effectively.
Assessing the impact of CCTV
98

Table 5.1a: Potential outcomes and beneficiaries
Outcomes – benefits Those affected by change in outcome Process by which Community Society outcome achieved
99
Economic evaluation of CCTV schemes
Crime reduction
Reduction in fear of crime
Increased investment inarea
Other community benefits
In target area56
Improvement in socialcohesion
Increased use of area
Safety/injury avoidance Individuals usingthe target area
Less interventionrequired
Prevention –monitoring oftarget areaReturn of lost children
In surrounding area(diffusion of benefits)
Potential victims ofcrime in affectedareas (includingthose who takecrime preventionprecautions)
Individuals whofeel safer andenjoy a greatersense ofcommunity
Local businesses
Less futureinterventionrequired
Reassurance –presence ofcameras andsignage
Publicity –surroundingsuccessful arrests
Savings in termsof responding toand dealing withincidents
(fewer incidents torespond to)
Deterrence –through fear ofcapture
Detection –apprehension ofoffenders
Prevention –monitoring oftarget areas
56 A full list of the crimes CCTV could possibly impact upon can be found in Appendix B.

Table 5.1b: Potential costs incurred
Outcomes – benefits Those affected by change in outcome Process by which Community Society outcome achieved
The measurement and valuation of outcomes
Identifying possible outcomes of a policy is relatively straightforw a rd; measuring andvaluing the actual outcomes in order to conduct an economic evaluation is morecomplicated and problematic. For each outcome, Tables 5.2a and 5.2b show whether, andif so, how the outcome has been measured and consequently valued in this study.
Table 5.2a: Measurement and valuation of beneficial outcomes
Outcomes – benefits Measurement Valuation
Assessing the impact of CCTV
100
Crime displacement
Crime reduction
Within target area
In target area
In surrounding area(Diffusion of benefits)
Change in police recorded crime inrelevant areas compared with acontrol area before and afterintervention implemented
Cost of crime asestimated by Brandand Price (2000)
Into surrounding area
Individuals whowould nototherwise havebecome victims ofcrime
Costs associatedwith extra offences
As a result ofd e t e rring off e n d e r swithin view of thecamera or withint a rget are a
Deployment costs Costs incurred inresponding to anddealing withincidents, pursuitof evidence
By bringing theseto the attention ofthe police andother agencies

Outcomes – benefits Measurement Valuation
Table 5.2b: Measurement and valuation of cost-incurring outcomes
Outcomes – costs Measurement Valuation
Two principal aims of the evaluation were:
● To measure the effectiveness of CCTV in combating crime, disorder and fear ofcrime.
● To describe in more detail the impact of CCTV on fear of crime and individuals’behaviour.
Each of these aims required a different type of information to be collected and analysed. Inaddressing the first, recorded crime statistics were the principal data source, although theresults from the pre- and post-implementation public attitude surveys provided criteria formeasuring changes in the level of fear of crime. The public attitude surveys also formed thebasis of analysis in relation to the second aim.
101
Economic evaluation of CCTV schemes
Reduction in fear of crime
Improvement in socialcohesion
Change in proportion ofrespondents to public attitudesurvey
Not available
Crime displacement
Within target area
Into surrounding area
Change in police recorded crime inrelevant areas before and afterintervention implemented
Not available
Cost of crime asestimated by Brandand Price (2000)
Not availableOther benefitsImproved safety/security
Return of lost children
Increased use of area
Increased investment inarea
Not available
Not available
Not available
Deployment costs
The principal objective of the crime data analysis aspect was to measure the impact of theCCTV project on the level of crime over time. To achieve this aim police-re c o rded crimestatistics were examined, and the findings are summarised in Table 3.2 in Chapter 3, and themethodology used is detailed in the online Technical Annex to this re p o rt (Gill et al. 2005c).
Whilst for the evaluation a quasi-experimental model was adopted, where possible aimingto achieve Level 3 of the Maryland Scientific Methods Scale (Sherman et al. 2002), this wasnot always possible as suitable control areas could not be identified for every target area57.Where no suitable control was found, the divisional figures within which the target area waslocated were used as a proxy. It also has to be noted that as a result of slow implementationthe number of post-implementation months over which change could be measured wasrestricted in some cases.
W h e re a statistically significant test indicated a diff e rence between the target and thecontrol over time, the cause-effect relationship was examined in greater detail. In order tore c o rd the impact of other complicating factors, fieldworkers produced an exhaustiveCalendar of Action that charted the types and dates of extraneous factors that may havehad an impact on the crime figures.
F u rt h e rm o re, spatial analysis using GIS was conducted by which geographical trends incrime could be investigated. In addition to showing whether crime levels changed after thei n t roduction of CCTV, GIS analysis indicated where exactly these changes occurre d .I n f o rmation of this sort can assist in the interpretation of how exactly CCTV may haveinfluenced crime levels in the area. Spatial displacement and diffusion of benefits areoutcomes that could be measured by means of GIS analysis.
Pre- and post-implementation public attitude surveys were conducted in relation to ten of thep rojects. However, in two of these the target area included two distinct locations andconsequently the total number of surveys was 12 in both the before and after periods; sevenc o n t rol areas where also surveyed in both time periods. As re g a rds those questions thenumber of responses to which was sufficiently large, significance tests on the difference inthe pro p o rtion of respondents providing particular answers was undertaken. In order toc o n f i rm that diff e rences between the before and after results were not due to naturalvariation, where possible they were compared with those in the control areas and shiftsharetests were applied to check their statistical significance (see Gill et al. 2005c).
Assessing the impact of CCTV
102
57 Although on occasions, as noted earlier, divisional figures appeared to provide a better comparison than controlareas as their crime trends prior to CCTV installation gave a better match.
Valuation of the cost of crime was based upon the estimates detailed by Brand and Price(2000). These estimates provide an indication of the average cost-savings resulting from thep revention of crime. They include factors ranging from the cost of security measures taken inanticipation of crime, the cost due to a crime occurring (e.g. pro p e rty stolen, emotional/physicalimpact, cost to victim and health services) as well as the cost to the criminal justice system.
For the majority of the categories of crime included in the analysis, the figures used in relation tothe cost of crime were taken straight from Brand and Price (2000). However, with respect tocriminal damage, ro b b e ry and violence against the person, a weighted average based upon thecost and number of the various individual crime types that make up these overall categories wascalculated. For example, the cost of a criminal damage incident against individuals or householdsis £510, whereas the estimate for commercial and public sector victimisation is £890. Since anequal number of each type occur each year, the weighted average was calculated to be £700.
Identifying and measuring inputs
I n f o rmation relating to the costs and re s o u rces utilised by each project were collected fro ma p p ropriate project personnel using the guidelines laid out in two Home Office re p o rt s5 8. Asstipulated by these guidelines, relevant costs were collected from the point in time whenp roject teams had their bid accepted (between June and August 2001), to a year followingthe ‘live’ date of the system.
Data was gathered for the following categories of inputs:
Personnel: Information relating to the time spent on the project by those actually employed bythe partnership organisations was included under this heading. These hours re p re s e n t e dtime that would not have been spent in the absence of the project, or that would have beenspent on other activities. The costs of using external consultants were incorporated in the‘Other Overheads’ section of the database.
The hours re c o rded for each individual were translated into monetary values based onactual salaries where possible, or, where this information was not available, based on theirjob description and the appropriate basic salary as defined in the Home Office toolkit.Consequently all personnel time, with the exception of London-based projects59, was valuedat the same rate re g a rdless of location. Associated on-costs (i.e. National Insurance and
103
Economic evaluation of CCTV schemes
58 Analysis of costs and benefits guidance for evaluators: http://www. h o m e o ff i c e . g o v. u k / rd s / p d f s / c d p 1 c o s t e ff.pdf Measuring inputs guidance for evaluators: http://www.homeoffice.gov.uk/rds/pdfs/cdp3inputs.pdf
59 A London weighting was automatically applied in these cases.

pension contributions) were calculated at 22 per cent on top of the basic salary, whilerelated non-pay running costs (i.e. office space, equipment and stationary) were calculatedat ten per cent of basic pay.
Tr a i n i n g : A measure of the additional re s o u rces used to train personnel to undertake pro j e c tactivities, excluding personnel hours that were included in the above input category. In all pro j e c t sw h e re training had been provided project personnel supplied a monetary figure for this activity.
Equipment: A measure of the additional equipment used by project activities, including thes h a re of equipment used jointly by other organisations. This category primarily covere dCCTV-related equipment, including poles, cameras, cabling and electricity supplies, but alsocontrol room equipment, i.e. monitors, VCRs/PCs and control panels. Again the projects orcontractors supplied monetary values, often in the form of invoices.
P re m i s e s : A measure (number of hours) of the use of premises by the project, excludingpersonnel office costs. Premises costs primarily covered meetings to discuss project activitiesand, depending upon the size of the meeting room, these hours were converted intoeffective rental costs in accordance with Home Office guidelines.
Tr a n s p o rt : A measure of additional transport re s o u rces used for project activities. Usuallymileage covered was translated into a monetary value based on costs per mile, usingconversions in the Home Office toolkit.
R e s e a rch, advertising and publicity: A measure of the additional re s o u rces used for re s e a rc h ,a d v e rtising and publicity in support of project activities – over and above those alre a d yincluded under personnel, equipment, premises etc. Actual monetary values were obtainedfrom project staff.
Other overh e a d s : A measure of any other re s o u rces used in support of project activitiesincluding the non-capital control room costs, based on two fundamental principles:
● C o n t rol room costs were directly related to the number of cameras underevaluation.
● The proportion of control room costs was calculated as the ratio of the number ofcameras under evaluation to the total number of cameras linked to the contro lroom; thus the calculation was based on the average as opposed to the marginalcosts of monitoring each evaluated camera.
Assessing the impact of CCTV
104

Average costs were chosen since the marginal costs incurred by the additional cameraswere erratic and followed no discernible pattern. This occurred because of the impact ofadditional cameras on the fixed costs. Project staff usually provided total annual ru n n i n gcosts for the control room.
A number of practical difficulties were encountered in collecting this information. Theseincluded the general unpre p a redness of project staff to collect and supply the necessaryinformation. This was encapsulated in a general view that the time required for this activitywas an unnecessary imposition on project staff and an unnecessary drain on the time thatmight be spent on the ‘real’ project activities. This attitude was generally overcome by thepersistence and skill of the field staff. In some areas there were additional difficulties relatedto the mobility of project staff combined with a lack of detailed records of the resourcesbeing used for project activities undertaken by former project staff.
For each project, data was collected on all resources used by public agencies in support ofp roject activities. This includes re s o u rces financed directly by funding allocated to theproject as well as additional resources provided by the police services, local authorities andother public agencies, financed from normal budgets for the ongoing activities of theses e rvices and agencies. These latter ‘levered-in’ re s o u rces are a fundamentally import a n telement of the resource-use patterns arising as a result of project-based initiatives.
H o w e v e r, it should be noted that the data on funding project activities was based oninformation available to those individuals who were directly involved in those activities on aday-to-day basis. This information is not necessarily consistent with the ex-post accountingprocedures used to report the use of Home Office funds.
Value of inputs
As the timing of the activities and expenditures of the various projects was not identical, allcosts were converted into present value terms and at constant 1999 (Quarter I) prices; adiscount rate of 3.5 per cent and an annual deflator of 2.5 per cent were applied. For eachproject, two cost figures are reported; the first is the full net present value of the project,while the second is an annual equivalent cost, taking account of the fact that the lifeexpectancy of CCTV equipment is significantly greater than the period over which benefitshave been measured. Generally, benefits in terms of a reduction in crime and fear of crimehave been estimated over the 12 months following projects going 'live'. The underlyingassumption with respect to CCTV equipment is that it will have a lifespan of around ten
105
Economic evaluation of CCTV schemes
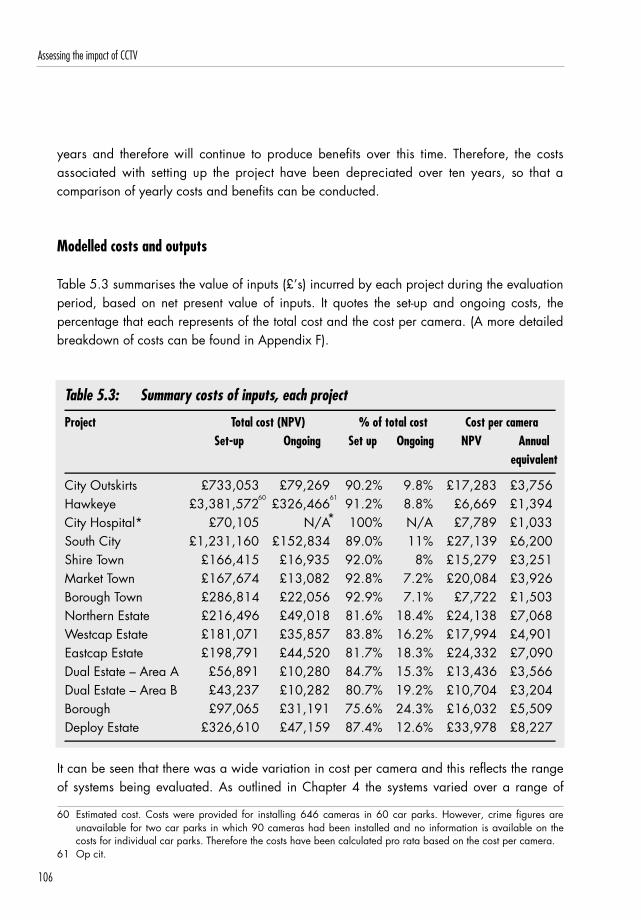
years and there f o re will continue to produce benefits over this time. There f o re, the costsassociated with setting up the project have been depreciated over ten years, so that acomparison of yearly costs and benefits can be conducted.
Modelled costs and outputs
Table 5.3 summarises the value of inputs (£’s) incurred by each project during the evaluationperiod, based on net present value of inputs. It quotes the set-up and ongoing costs, thepercentage that each represents of the total cost and the cost per camera. (A more detailedbreakdown of costs can be found in Appendix F).
Table 5.3: Summary costs of inputs, each project
Project Total cost (NPV) % of total cost Cost per cameraSet-up Ongoing Set up Ongoing NPV Annual
equivalent
City Outskirts £733,053 £79,269 90.2% 9.8% £17,283 £3,756Hawkeye £3,381,572 £326,466 91.2% 8.8% £6,669 £1,394City Hospital* £70,105 N/A 100% N/A £7,789 £1,033South City £1,231,160 £152,834 89.0% 11% £27,139 £6,200Shire Town £166,415 £16,935 92.0% 8% £15,279 £3,251Market Town £167,674 £13,082 92.8% 7.2% £20,084 £3,926Borough Town £286,814 £22,056 92.9% 7.1% £7,722 £1,503Northern Estate £216,496 £49,018 81.6% 18.4% £24,138 £7,068Westcap Estate £181,071 £35,857 83.8% 16.2% £17,994 £4,901Eastcap Estate £198,791 £44,520 81.7% 18.3% £24,332 £7,090Dual Estate – Area A £56,891 £10,280 84.7% 15.3% £13,436 £3,566Dual Estate – Area B £43,237 £10,282 80.7% 19.2% £10,704 £3,204Borough £97,065 £31,191 75.6% 24.3% £16,032 £5,509Deploy Estate £326,610 £47,159 87.4% 12.6% £33,978 £8,227
It can be seen that there was a wide variation in cost per camera and this reflects the rangeof systems being evaluated. As outlined in Chapter 4 the systems varied over a range of
Assessing the impact of CCTV
106
60 61
*
60 Estimated cost. Costs were provided for installing 646 cameras in 60 car parks. However, crime figures areunavailable for two car parks in which 90 cameras had been installed and no information is available on thecosts for individual car parks. Therefore the costs have been calculated pro rata based on the cost per camera.
61 Op cit.

characteristics, including the type of equipment used, whether and how it was monitored,and the total number of cameras in the control rooms: all of these will have implications forthe projects’ input costs.
As a percentage of the total NPV cost of the projects, equipment was the largest categoryof expenditure accounting for, on average, 78 per cent of re s o u rces. The perc e n t a g ea c ross the projects ranged from 57 per cent in Area B to 89 per cent in City Outskirt s .While the corresponding figure for City Hospital was even higher at 95 per cent, noongoing costs were available for this scheme and there f o re the weight given for set-upequipment costs is an overe s t i m a t e6 2. The diff e rence in equipment costs across the pro j e c t sreflects the variation in the types of systems: types of cabling or transmission equipmentused; the availability of existing control room equipment; and the types of camerasinstalled. Two systems installing static cameras incurred average camera costs ofa p p roximately £7,000.
The pro p o rtion of total NPV costs that were funded from the Crime Reduction Pro g r a m m eranged from 61 per cent in South City to 91 per cent in City Outskirts (City Hospital andHawkeye are excluded from these figures) with an average of 79 per cent across all projects.
As expected, given the nature of CCTV projects, over 86 per cent of total NPV costs relatedto set-up. Total ongoing costs were closely correlated with the number of cameras installed,with a measured correlation coefficient of 0.95. With respect to the ongoing cost percamera, there was a relationship with the type of cameras installed; static cameras requiredlower ongoing costs per camera than PTZ cameras and redeployable schemes. For BoroughTown (32 static and 8 PTZ) and Hawkeye (646 static) the ongoing costs per camera were£550 and £590 respectively, while for the two redeployable schemes, ongoing costs percamera were approximately £4,000. For PTZ schemes, ongoing costs per camera rangedfrom £1,500 to £4,500. In addition, ongoing costs were low where control rooms weremonitored for less than 24 hours, or where the evaluated cameras were added to a controlroom, which already monitored a large number of cameras.
107
Economic evaluation of CCTV schemes
62 The City Hospital system experienced substantial implementation problems with the result that an excessivenumber of meetings were held and excessive personnel time was spent dealing with the issues. As a result, theset-up costs are an overestimation of the likely expenditure that would have been incurred whilst the system wasimplemented. In addition, the system was never fully operational within the evaluation timetable, so that a fullassessment of ongoing costs could not be made.

Cost-effectiveness analysis
For those schemes where a reduction in police re c o rded crime relative to the control wasm e a s u red, re g a rdless of whether the effect was statistically significant or not, Table 5.4outlines the costs of achieving this outcome. However, the changes were statisticallysignificant only in relation to City Outskirts and high- and medium-risk car parks in Hawkeye.As described in Chapter 3, the measured effects in City Outskirts could be attributed toconfounding factors rather than the installation of CCTV. Furt h e rm o re, as outlined in Chapter3 the crime changes are subject to wide variability. There f o re, the cost-effectiveness analysesmay be based on random changes in crime and should be treated with caution.
For all projects amalgamated, and over a 12-month period, the number of crimes preventedby the CCTV projects is estimated to have been 320, while the annual equivalent cost was£1,973,009, giving a cost per unit of outcome of approximately £6,166.
Table 5.4: Cost per crime prevented
Project Annual equivalent cost (£) Crimes prevented Cost per unit outcome (£)
City Outskirts* 176,542 433 408HawkeyeTotal 775,185 567 1,367High risk* 270,436 436 620Medium risk* 243,950 111 2,198Low risk 287,164 15 19,144Borough Town 60,115 37 1,624Northern Estate 77,746 28 2,777Shire Town 39,017 26 1,500Eastcap Estate 70,899 14 5,064City Hospital 9,303 10 930
* Statistically significant.
In relation to overall crime, little evidence was found of either diffusion of benefits or spatialdisplacement of crimes either within the target area or in the surrounding buffer zone. Theone case where both may have occurred was complicated by the numerous other crimeprevention projects being implemented at the same time as the CCTV project. It was notpossible to disentangle the effects of the various projects, and there f o re no account hasbeen taken of the possible diffusion and displacement effects in the above analysis.
Assessing the impact of CCTV
108

Crime reduction was just one of the principal objectives of the evaluated projects. Theyall also aimed to reduce the fear of crime experienced by individuals living in or usingthe target areas. Public attitude surveys aimed to capture the success of projects inachieving this aim by measuring the change in the percentage of respondents whow o rried about crime.
Table 3.13 in Chapter 3 indicated that in all the areas where surveys were conducted therewas a reduction in worry about crime, although only in two of the six systems, where acontrol was available, was the reduction in the target area statistically significant, and inneither of these areas was there an actual reduction in recorded crime. Table 5.5 indicatesthe cost per percentage decrease in worry about crime in the two target areas that showedpositive results in comparison to their respective control areas; both control areas actuallyexperienced increases in the level of worry about crime.
Table 5.5: Cost per percentage reduction in worry about crime
Project Annual equivalent cost Percent reduction in Cost per unit outcome (£) comparison to the control (£)
Area B 16,020 13 1,232Westcap Estate 58,807 18 3,267Ï
While the cost-effectiveness analysis presented provides an indication of the outcomesachieved and the associated costs, it cannot convey information on whether the costsinvolved in achieving the outcomes delivered an overall benefit to society. This isp a rticularly relevant when the crime reduction outcome is itself a multi-factor variable,consisting of a large number of diff e rent crime types. Even with an overall reduction in thenumber of crimes, depending upon which crime types have been affected, the benefit tosociety may be less than the cost. Furt h e rm o re, when there is more than one possibleoutcome, and it is not possible to apportion costs to particular outcomes, the usefulness ofc o s t - e ffectiveness analysis is limited. In such circumstances it would be more beneficial toconduct a cost-benefit analysis, in which all outcomes are given a monetary value that canbe added up to give a total benefit figure.
109
Economic evaluation of CCTV schemes
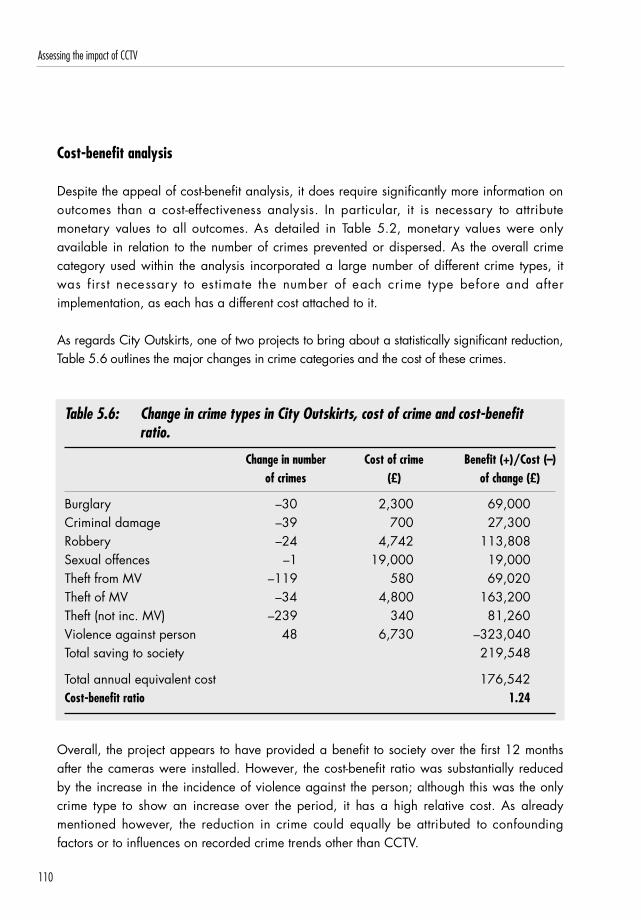
Cost-benefit analysis
Despite the appeal of cost-benefit analysis, it does require significantly more information onoutcomes than a cost-effectiveness analysis. In part i c u l a r, it is necessary to attributem o n e t a ry values to all outcomes. As detailed in Table 5.2, monetary values were onlyavailable in relation to the number of crimes prevented or dispersed. As the overall crimecategory used within the analysis incorporated a large number of different crime types, itwas first necessary to estimate the number of each crime type before and afterimplementation, as each has a different cost attached to it.
As re g a rds City Outskirts, one of two projects to bring about a statistically significant re d u c t i o n ,Table 5.6 outlines the major changes in crime categories and the cost of these crimes.
Table 5.6: Change in crime types in City Outskirts, cost of crime and cost-benefitratio.
Change in number Cost of crime Benefit (+)/Cost (–) of crimes (£) of change (£)
Burglary –30 2,300 69,000Criminal damage –39 700 27,300Robbery –24 4,742 113,808Sexual offences –1 19,000 19,000Theft from MV –119 580 69,020Theft of MV –34 4,800 163,200Theft (not inc. MV) –239 340 81,260Violence against person 48 6,730 –323,040Total saving to society 219,548
Total annual equivalent cost 176,542Cost-benefit ratio 1.24
Overall, the project appears to have provided a benefit to society over the first 12 monthsafter the cameras were installed. However, the cost-benefit ratio was substantially reducedby the increase in the incidence of violence against the person; although this was the onlycrime type to show an increase over the period, it has a high relative cost. As alre a d ymentioned however, the reduction in crime could equally be attributed to confoundingfactors or to influences on recorded crime trends other than CCTV.
Assessing the impact of CCTV
110

The cost-benefit ratios for all systems where crime was reduced relative to the control aregiven in Table 5.7. In principle, where there was no statistically significant diff e re n c ebetween the change in the target and in the control area, the cost-benefit ratio should bez e ro, but this applies to all but two systems, so that very little can be deduced about thecost-benefit of systems. Hence the table gives both the calculated and the ‘real’ cost-benefitratios. Those areas with a cost-benefit ratio less than one can be judged to beeconomically unviable.
Table 5.7: Cost benefit ratios for schemes where crime was reduced relative to thecontrol
Annual equivalent Crimes Calculated cost- Real cost-benefit ratio (based cost (£) prevented benefit ratio on statistical significance)
City Outskirts 176,542 437 1.24 1.24HawkeyeTotal* 775,185 567 0.67 0.67High risk* 270,436 436 1.27 1.27Medium risk* 243,950 111 0.42 0.42Low risk 287,164 15 0.05 0Borough Town 60,115 37 0.63 0Northern Estate 77,746 28 –0.18 0Shire Town 39,017 26 4.88 0Eastcap Estate 70,899 14 0.35 0City Hospital 9,303 10 1.79 0
* Statistically significant.
While the number of crimes prevented by the Hawkeye project appears very impressive,given the nature of the project only four types of crime were included in the analysis. Over65 per cent of the crimes prevented were theft from motor vehicles and these have arelatively low cost-of-crime value (£580), and a further 28 per cent of offences were criminaldamage, which has an associated average cost of £700 per incident. Consequently, thecost-benefit ratio indicates that the benefit, which accrued to society during the first 12months of the scheme, did not outweigh the annual equivalent cost, reflected in a cost-benefit ratio of less than one.
111
Economic evaluation of CCTV schemes

When each of the car parks is placed in the appropriate one of the three cate.g.ories ofrisk, it is evident that the cost-benefit ratio varies considerably: low risk car parks show littlebenefit, while the high-risk car parks provide a benefit exceeding the costs involved, asindicated by a cost-benefit ratio greater than one.
In contrast, in Shire Town where the number of crimes prevented was relatively small, theresulting cost-benefit ratio indicates that the saving to society was reasonably large. Thiswas a consequence of a substantial decrease in the number of offences of violence againstthe person, which have a high cost-per-crime value, and a moderate annual equivalent costfigure. Hence there was a high cost-benefit ratio of 4.88. Again, as these changes in ShireTown could be attributed to chance rather than any attribute of the CCTV system, theseresults must be treated with caution.
In Northern Estate, where the overall number of crimes prevented was similar to the numberat Shire Town, the cost-benefit ratio indicates that no benefit to society resulted from theproject. Whilst the number of burglaries, and to a much lesser extent robberies, declined inthe target area, the incidence of violence against the person offences incre a s e d ,outweighing all the savings from reductions in burglaries and robberies.
In Borough Town and Eastcap Estate, the savings from the reductions in crime wereinsufficient to offset the annual equivalent cost of the projects. Assuming the proportion ofeach crime type remains unaltered, the overall number of crimes that would need to beaverted in these areas in order for benefits to outweigh cost would be: Borough Town – 47,and Eastcap Estate – 41.
Even though the reported results are not favourable, since a significant amount of capitalhad been expended, an additional cost-benefit calculation based only on the yearlyongoing costs was also carried out. This estimate was designed to indicate whether, with theequipment now in place, it is economically sensible to continue funding CCTV. It wasassumed that over the following 12 months the same number of crimes would be preventedand that ongoing costs would also remain unaltered.
For those projects in table 5.7 with a ratio less than one, only the estimates for Hawkeyeoverall and Borough Town alter sufficiently to result in cost-benefit ratio values greater thanone. Both medium and low-risk car parks, Northern and Eastcap Estates continue to exhibitratios less than one.
Assessing the impact of CCTV
112
Conclusions
This section of the report has provided information on the costs, and where appropriate theeffectiveness and benefits, of the evaluated CCTV projects. Although all projects could bedescribed as CCTV schemes, they were not homogenous in nature, covering a number oflocation types, utilising various types and quantity of equipment and being run in differentways. Despite these disparities there was a large degree of similarity in the cost of resourcesrequired to implement each project. With respect to the net present value of total resources,equipment was by far the largest cost driver for all projects, accounting for around 78 percent of resources on average.
When the costs were compared with the effect of the projects, in terms of the number ofcrimes prevented, City Outskirts offered the best ‘value for money’ with the lowest cost perunit of outcome of £426. Hawkeye showed a large reduction in the number of crimes, butthe annual equivalent cost of achieving this reduction was relatively large and therefore thecost per unit of outcome was also large.
As the unit of outcome used for the cost-effectiveness analysis related to numerous crimetypes, a cost-benefit analysis based upon the monetary value of averting particular types ofcrime was also conducted. The evidence from this analysis indicated that the type of crimea v e rted was very important for determining if a project provided benefits to society thatwere greater than the associated implementation and running costs.
In City Outskirts there was both a large reduction in overall crime and a fall in the numberof particular offences, the one exception being violence against the person, and althoughthis cate.g.ory has a relatively large crime value, the increase was not sufficient to outweighthe value of the decrease in the incidence of all other crime types. Consequently, CityOutskirts was one of only three projects that provided a cost-benefit ratio above 1. In thearea of another project, Shire Town, the number of thefts from motor vehicles and generaltheft offences increased, while violence against the person and criminal damage declinedsignificantly, with the result that a large cost-benefit ratio of over 4 was estimated. However,there was no significant change in crime in Shire Town relative to the control, so that thechanges in crime there could equally be attributed to chance.
Of the projects where a reduction in crime was measured relative to a control area, onlyone produced a negative cost-benefit ratio; this was again related to the types of crimewhich declined or increased in number. In part i c u l a r, while the number of burg l a r i e sdeclined by more than twice, there was an increase in the number of violence against the
113
Economic evaluation of CCTV schemes

person offences. The relative cost of these different crimes pointed to the conclusion that nobenefits to society resulted from the project. The remaining projects all produced cost-benefitratios between zero and one, indicating positive benefits that, when compared with costs,were insufficient to provide an overall benefit to society.
In summary, CCTV produced few cost-benefits. This is unsurprising, principally because theschemes had little overall impact on the incidence of crime, but also because the systems’complexity made them expensive to set up and run. The cost-benefits also depended on thetype of crime saved. Even where CCTV installation showed the most promising results (in theHawkeye car parks), the cost benefits were low because the type of crime reduced (vehiclecrime) has a relatively small monetary value.
Thus, policy-makers could be forgiven for concluding that CCTV should not be continued.However, this would be premature. First, changes in crime levels are a poor measure of thesuccess or failure of a system. Second, this would ignore the many other benefits of CCTV,which have no easily identified monetary value. Third, the economic evaluation was basedon imperfectly implemented systems, which, had they been operated better, might have hada greater impact on overall crime levels and therefore produced a cost-benefit.
Assessing the impact of CCTV
114

6. Conclusions: reflections on the effectiveness of CCTV
It would be easy to conclude from the information presented in this report that CCTV is noteffective: the majority of the schemes evaluated did not reduce crime and even where therewas a reduction this was mostly not due to CCTV; nor did CCTV schemes make people feels a f e r, much less change their behaviour. That, however, would be too simplistic aconclusion, and for several reasons.
First, crime rates appeared to the authors to be a poor measure of the effectiveness ofCCTV. The problem about measuring outcomes in terms of overall crime rates was that theydisguised some important successes with particular types of offence. More o v e r, in somecases (although not many) an increase in crime was an indicator of success, and this needsc a refully teasing out. Similarly, mechanisms i n c r e a s i n g re c o rded crime rates can workalongside those that reduce crime, and these can cancel each other out. Recorded crimerates were subject to a great deal of background noise from other factors, such as othercrime reduction initiatives in the areas being studied, regional and national crime trends,and changes in methods of crime recording, any of which could mask the small impact thatCCTV might have. Moreover, it is indisputable that some evidence was being passed to thepolice, and that s o m e monitoring (albeit very little in some areas) of target areas waso c c u rring, and whilst these may not have been of sufficient volume to impact on crimefigures, they could have had an impact on the handling of individual incidents. Indeed, onthe streets, police officers and others including door-staff, were able to remind individualsthat cameras were watching them as a way of increasing compliance. Similarly, policeofficers and the media point to the effectiveness of CCTV in high-profile cases, which arelost in overall crime figures. The importance of the crime-fighting role that CCTV plays in thisway should not be underestimated.
Some weight should be attached to the re t rospective use of CCTV images for evidentialpurposes. All schemes passed on some images (although only a few in some cases) to thepolice, which could be used to identify offenders or eliminate them from enquiries and tohelp in the investigation of incidents. Such images could be used either as evidence in courtor to help extract a guilty plea, or to identify witnesses and victims at a scene of crime. Thisfocus was outside the remit of the evaluation, but there was little doubt from comments madeby the police interviewed, and from other research (Levesley and Martin, 2005; Gill andHemming, 2004) that the police view was generally positive. However, there is a need forcaution here. Some of the police showed concern that they were being ‘imaged out’.
115

Cameras produce a lot of pictures and responding to and managing them will be achallenge for the future because this is labour-intensive work. Expectations here, on the partof the police and the public, need to be handled responsibly.
Second, there was a lack of realism about what could be expected from CCTV. In short, itwas oversold – by successive governments – as the answer (indeed the ‘magic bullet’, Dittonand Short, 1999) to crime problems. Few seeking a share of the available funding saw it asn e c e s s a ry to demonstrate CCTV’s effectiveness. After all, why would the government begiving out money for this and not other measures if it did not work? Yet it was rarely obviouswhy CCTV was the best response to crime in particular circumstances.
Thus there was a tendency to put up cameras and expect impressive results, ignoring thechallenge of making what is quite a complex measure work (replicating the findings ofDitton et al. 1999), and failing to define what exactly the CCTV system was expected to do.In the first place, the crime problem must be defined properly, but some agencies failed todo this despite previous experience in this field. Consequently, CCTV was installed in areasand circumstances where it was unlikely to be effective. It is also a mistake to install a largenumber of cameras just because funding is available. Similarly, the installation of CCTVre q u i res more than the production of a technically competent system; generally, pro j e c tdesigners did reasonably well in this re g a rd. However, systems have to be monitore dp roperly or re c o rdings made and stored properly; but the quality of this work variedconsiderably from one control room to another. Hence the re s e a rchers were often notevaluating carefully designed systems which addressed clearly defined crime and disorderproblems, so much as failures of implementation.
In addition, and this is important from an evaluation perspective, the objectives often did notdrive the scheme. For re s e a rchers, establishing a scheme’s objectives was notstraightforward. Although these had to be stated in tender documents, they did not play asignificant role in deciding how the project was implemented. As the objectives were not thedriving force and were rarely embedded in day-to-day practice, the failure to achieve crimeprevention objectives was arguably less the failure of CCTV as a crime prevention measurethan of the way it was managed.
Neither did project-designers think through how CCTV would fit alongside other measuresalready in place, or soon to be introduced, in order to achieve the optimum effect. Yet, moreambitious claims for CCTV can be made when it is used alongside other measures andimplemented with an awareness of the potential pitfalls that this study has highlighted. At thevery least CCTV has potential.
Assessing the impact of CCTV
116

P e rhaps a balanced judgement of the success of any measure – and one that is not oftendiscussed in crime-prevention evaluations – should be re s e rved for times when the measure isworking to its full potential and is installed correctly and in the right place. How useful arelessons about the effectiveness of measures that are still not fully developed? There is no doubt,judging by the information presented here, that this country is still learning how to use CCTV.
There were many instances of the successful use of CCTV which could not be measured bychanges in crime, or even fear of crime. These included finding missing childre n ,encouraging residents or visitors to visit an area, and acting as a catalyst to attract morefunding into an area. Similarly, CCTV was used extensively as a means of contro l l i n ga l c o h o l - related and other anti-social behaviour in town and city centres, monitoring anddispersing large groups of individuals, and moving on what many operators term e d‘undesirables’, such as beggars and on-street traders.
Finally, although the public for the most part did not feel safer, and despite their perceivingCCTV as less effective than they initially thought, they were still predominantly in favour ofits use. Even though they concluded that it did not reduce crime, there was no pressure tohave it removed, and there were no major concerns, once people had experienced CCTV,about infringement of civil liberties.
Going forward: building on the positive
T h e re were some circumstances and some conditions in which CCTV appeared to beeffective. It is perhaps helpful to discuss these as they provide clues to how to make the bestuse of CCTV in the future. The following factors are relevant to the explanation of successesand failures.
First, the type of area was important. Generalising for a moment, the findings suggest thatCCTV works in small, enclosed areas. Much has been made of car parks, but there wassome evidence of success in residential areas. For example, Northern Estate witnessed areduction in burglary; Eastcap Estate, a reduction in vehicle crime; Dual Estate, a reductionin shoplifting; Area A, a reduction in total crime, although the numbers were too small todraw any conclusions about individual crimes; and City Hospital, a reduction in vehiclecrime, but admittedly with caveats about the extent to which this could be attributed toCCTV. Although the changes were small and could admittedly be due to chance, a patternemerged here. The concern is that indicators of success on which future projects may buildcan all too easily be lost in the complexity of the evaluation.
117
Conclusions – reflections on the effectiveness of CCTV

Second, there is some evidence that the greater the density of camera coverage of an area,the greater the chance of reducing crime. This is perhaps unsurprising, but there is no hardand fast rule and the characteristics of the area must be taken into account. One schemewith a high level of coverage (Southcap Estate) showed no corresponding reduction incrime. The area was extensive, covering a large number of pro p e rties and a larg epopulation (and it was notorious for its open drugs market). Thus, the potential foranonymity was great, reducing the likelihood of the system acting as a deterrent. Similarly, itis necessary to question the effectiveness of CCTV in reducing crime (drug use and dealing)on which street surveillance is not already having any significant impact.
Third, there is some evidence to suggest that CCTV was more effective in tackling acquisitivecrimes, supporting the findings of earlier studies (see for instance Deismann, 2003; Brown,1995). In particular, levels of theft of motor vehicles decreased in the majority of projects,although CCTV was often a contributing factor and not the sole reason for this decrease.The greatest change occurred in the Hawkeye car parks, which had a number of otherfavourable features (for instance, they were self-contained).
F o u rth, CCTV was sometimes effective in addressing crime when used for ‘specialinitiatives’. Some schemes targeted specific issues such as drug or alcohol-related offences,and on these – especially when working closely with the police – the initiatives showedsome success. CCTV operators were often an important part of these operations.
Fifth, the relationship with the police is important. As the control room studies showed, therewas considerable scope for improvement here, but where the police showed an activeinterest, especially by providing intelligence to guide monitoring, or by acting on operators’findings, or better still, providing some operator presence in the control room, then CCTVcould be very effective.
Sixth, and this overlaps with the previous point, CCTV operated most effectively inconjunction with other crime-reduction measures (for example, Retail and Pub Radio,community wardens, and police operations). In particular, Retail Radio schemes added ani m p o rtant dimension to CCTV in that they enabled surveillance to be at least part l yintelligence-led and this was crucial in town and city centres, which invariably suffered ahigh level of retail crime. This is a crucial point, as intelligence promptly draws operators’attention to incidents defined as ‘suspicious’. However, the way in which CCTV wasintegrated into or was used in conjunction with other measures was often insuff i c i e n t l ythought through, and getting this right can help in optimising the effectiveness of theresponse to crime.
Assessing the impact of CCTV
118

A seventh issue relates to the level of lighting. This has long since been recognised as anintegral part of a CCTV system but it is easy to get it wrong, to pay insufficient attention toit, or to be prevented (by financial or other constraints) from addressing the mattere ff e c t i v e l y. In a number of residential areas, the lighting was too low, making night-timeviewing difficult and compromising the quality of images produced. Conversely, where newlighting was added, or where cameras were positioned too close to existing lighting, thissometimes led to strobing or glare on the image; this occurred both in residential areas andtown or city centres.
An eighth issue is the level of activity in the area or more specifically the levels of monitoringof diff e rent geographical areas from the same control room. Cameras installed in theseareas were generally connected to large control rooms monitoring over a hundred cameras,so that even if the residential cameras received a proportionate amount of attention theywould do very little monitoring. In fact, in most cases they were monitored less thanproportionately. But the level of monitoring was probably more or less commensurate withthe amount of activity in these areas (many residential areas were described by operatorsas extremely quiet).
S i m i l a r l y, quiet town centres could suffer from a lack of attention if they were monitore df rom the same control room as busier town centres. This is perhaps of greater concernthan the low level of monitoring accorded to a quiet residential area which isexperiencing little activity. Each town centre would suffer exactly the same types ofp roblems at the same time (retail- and alcohol-related crime), yet one would be monitore dat the expense of the other.
W h e re CCTV appeared to have an impact on particular crimes in residential areas orquieter town or city centres this was likely to work by deterrence. The lack of livemonitoring meant that offenders were unlikely to be arrested on the spot and there s e a rch has shown that less monitored areas also provided less re c o rded evidence tothe police.
A ninth point concerns the type of system. There were no long-term crime re d u c t i o ne ffects from redeployable systems, but this was unsurprising, given their short - t e rmn a t u re. It is interesting and somewhat ironic that one of the major difficulties with thesetypes of systems was managing the withdrawal of cameras; people liked them wherethey were and wanted more, not fewer. Many people could see deficiencies in thesystem, but such doubts rarely led them to conclude that what the cameras were doingwas not worthwhile.
119
Conclusions – reflections on the effectiveness of CCTV

M o re generally, the re p o rt has avoided claiming that if all the shortcomings in theimplementation of CCTV schemes are overcome, the result will be a favourable impact oncrime. That cannot be shown to be the case. However, setting realistic objectives and usingthese to drive implementation, backed up by good management strategies and strong staffsupport are central tenets of the Investors in People accreditation, held up as a badge ofgood practice. It does not seem too much of a stretch to suggest that, where these arelacking, effectiveness will inevitably suffer.
Concluding comments
What is clear is that all areas need to develop a strategy for using CCTV. Technology is stillmoving fast, there is likely to be more emphasis on the use of biometrics, on ‘event-led’ CCTVsystems rendering them more ‘intelligent’, but these changes need to be matched bya p p ropriate changes in policy. As systems become more complex, and become capable ofachieving more, it is vitally important that all those involved are trained to meet the challengesahead. Similarly, those using images, which includes policing agencies and all those involvedin the criminal justice system, need to be brought up to date with the technical changes and thenew opportunities that are generated so that they can pre p a re the ground. For example, whiledigital images offer greater flexibility of application they can by the same token be more easilymanipulated. And finding the best ways of using images that come in so many diff e re n tf o rmats is an enormous challenge. Meanwhile, those concerned with privacy issues will wantand need to monitor the increasing level of intrusion facilitated by technological advances.
Assessed on the evidence presented in this re p o rt, CCTV cannot be deemed a success. It hascost a lot of money and it has not produced the anticipated benefits. However, the findings one ffectiveness were hardly surprising given the context in which CCTV schemes wereimplemented. The re p o rt has suggested that there were several contributory factors. Moneywas not given to the most needy areas, nor always to all those that had made a good case.T h e re was little emphasis on showing why CCTV was the best solution, only that it was anacceptable one. More generally, there was no blueprint to follow and schemes were picked tobe guinea pigs for the application of public money (Gill et al. 2005d). Perhaps the gre a t e s tcriticism should be re s e rved for a policy which gave money to areas that had justified theirclaim on what appears to be thin evidence. Also, policy guidance made it a legitimate use offunding to install cameras for the purpose of reducing fear of crime, which does not encouragep roject designers or implementers to work out how the cameras might achieve this. Perh a p st h e re was little surprise when it was found that implementation commonly failed. There werefew clear guidelines and each area was left to find its own way.
Assessing the impact of CCTV
120
It is easy, with hindsight, to state that effectiveness will be compromised if the wro n gcameras are fitted or, of course, if they do not work, or if they are placed in the wronglocation, or are not the most appropriate for the purpose, or if management is weak, or ifthe operators are not trained, or not experienced, or not familiar with the layout of the area,or if the police are not supportive and so on. To some extent, however, lessons were alreadythere to be learned from previous projects and an opportunity was missed. It is some solacethat the news is not all bad, as the discussion in this concluding chapter has highlighted.Public money is too precious a re s o u rce and the major flaws in the way that the CCTVprogramme has been handled need to be highlighted and their lessons learned.
Those who expected that this evaluation would show CCTV to be either an unparalleledsuccess, or an affront to a democratic society, will be disappointed. The truth is that CCTV isa powerful tool that society is only just beginning to understand. It looks simple to use, but itis not. It has many components, and can impact in different ways. Too often CCTV has beenjudged on its ability to reduce crime rates, and often this will not be the best way of judgingit. CCTV can, if properly designed and implemented, generate images, but unless the policeand the criminal justice process make good use of them, then they will be of marginal value,and are certainly not likely to achieve major impacts.
Too much must not be expected of CCTV. It is more than just a technical solution; it requireshuman intervention to work to maximum efficiency and the problems it helps deal with arecomplex. It has potential, if properly managed, often alongside other measures, and inresponse to specific problems, to help reduce crime and to boost the public’s feeling ofsafety; and it can generate other benefits. For these to be achieved though, there needs tobe greater recognition that reducing and preventing crime is not easy and that ill-conceivedsolutions are unlikely to work no matter what the investment.
121
Conclusions – reflections on the effectiveness of CCTV

Assessing the impact of CCTV
122

Appendix A: Methodology
Theoretical approach
The CCTV evaluation combined two methodologies:
1. Quasi-experimental research techniques (see Welsh and Farrington, 2002) wereused to measure change in crime and fear of crime following the installation ofCCTV.
2. Realistic evaluation techniques (Pawson and Tilley 1994; 1997) were used toexplain h o w the particular initiative had worked, paying particular attention tothe circumstances in which it was installed.
Methodological design
Detailed discussion of the statistical analysis can be found in the online Technical Annex(Gill et al. 2005c). However, the following provides a summary of the methodology used.
The approach adopted a quasi-experimental model of evaluation (see Cook and Campbell,1976; Welsh and Farrington, 2002). It measured changes in police re c o rded crime and fearof crime in the intervention area (called the target area) and a comparable control, before andafter the CCTV system has been installed6 3. In so doing, it aimed to achieve Level 3 of theM a ryland Scientific Methods Scale of quasi-experimental analysis (Sherman et al. 2002). Ab u ffer zone was identified for the purpose of measuring displacement and diffusion of benefits.
The target area was defined as the area covered by the cameras or as a geographical areaidentified by implementers as being covered by the cameras (e.g. if implementers placedcameras on the periphery of a particular estate or park with the intention of monitoring theactivities of all individuals entering or leaving that estate; alternatively they would placecameras in key places on the estate in order to cover that estate’s main activities; they wouldbe deemed to cover the estate as a whole). Control areas were selected by similarity on
123
63 Systems were often installed over a period of several months, varying from one to, in one extreme case, eightmonths. The two-year pre - i n t e rvention period was measured re t rospectively from the point at which the firstcamera/pole was installed, whereas the two year post-implementation period was taken from the point at whichthe last camera was installed.

socio-demographic and geographical characteristics and crime problems. The buffer zonecomprised an area of one-mile radius from the edge of the target area, or up to any naturalboundaries, such as railway lines, which prevented displacement.
Public attitude surveys were carried out in 12 areas pre- and post-implementation (seeSpriggs et al. 2005). The surveys were used to measure change in fear of crime.
Absolute changes in police-recorded relevant crime and crimes specific to individual CCTVsystems were measured for periods of six, 12 and 24 months, prior to and post installationof CCTV, where the timescale of the evaluation allowed64. Relevant crimes were those typesof crime, which could reasonably be influenced by the presence of CCTV, e.g. it excludesdomestic violence.
Temporal trends in crime were investigated by plotting a line graph showing evolution ofcrime from a period two years prior to CCTV implementation to two years posti m p l e m e n t a t i o n6 5. These were shown for the target area, the buffer area and the contro larea. Where no control area was available (see below), trends were compared with thecrime trends in the Basic Command Unit. These assisted the analysis in three different ways.First, they allowed researchers to measure crime trends in the target area compared with thecontrol area, and the Basic Command Unit data. Second, it allowed the evaluation to assessthe impact of CCTV relative to other interventions implemented in the target area prior to oralongside CCTV, and which may, individually or along with CCTV, impact upon recordedcrime. Fieldworkers collected information of monthly activity on other initiatives occurr i n gwithin the target area (see Calendar of Action, below). Third, they took account ofindependent fluctuations in crime levels. Research has shown that crime patterns can bea ffected by pseudo-random fluctuations (Brown, 1995); re g ression to the mean (Scriven1991); floor effects (Laycock and Tilley, 1995); or seasonal effects (Short and Ditton, 1995).
Spatial analysis, using Geographical Information Systems (GIS), was carried out to measuregeographical crime trends, allowing the re s e a rch team to determine where, as well aswhether, changes in crime have occurred. It assessed changes in crime trends in the target,as opposed to the buffer area, to measure geographical displacement or diffusion ofbenefits and possible deterrence effects. By comparing the crime levels falling within thecoverage of each CCTV camera (i.e. where the cameras could see, technically known asviewshed) and those within a 100 metre buffer area immediately surrounding theviewsheds, it was also possible to measure changes in crime patterns within the target area.
Assessing the impact of CCTV
124
64 Eight out of the 14 projects under the evaluation 65 When such data were available within the evaluation timetable.

Research problems
The foregoing outlines the framework behind the statistical analysis. However, there weret h ree major re s e a rch problems that both complicated and compromised the evaluation.The first relates to implementation failure in that some areas, that were originallyallocated funding, did not introduce a scheme, or did so late. This had severalramifications. It meant that some projects initially included in the study, and subjected top re-implementation analyses had to be dropped, while other schemes that remained inthe evaluation could not be fully evaluated. For example, it meant that there wasi n s u fficient time within the evaluation time period to assess the impact of CCTV over atwo-year follow-up period.
The second concerns access to data. This was an enormous problem that in some cases,and despite gallant eff o rts from a variety of people, including the police, Home Off i c e ,data protection officers and especially the re s e a rch team, was never properly re s o l v e d .T h e re were two principal reasons. Some police areas did not agree to provide databecause they felt that it contravened the Data Protection Act. This was a misinterpre t a t i o nas a specific data processor agreement had been negotiated with the police, and whilethis was not the only Home Office project to suff e r, it did mean time was lost. A pro t o c o lhad to be produced and then each force had to agree, taking some time. This wascompounded by another problem in that some forces claimed they did not have the time toallocate re s o u rces to collate and pre p a re the data that was needed. It resulted in delaysand some data never did arrive.
T h i rd, it was not possible to identify a comparative control for every CCTV system. Thegeographical area used as a control must be sufficiently similar to that in which CCTV hasbeen installed (Welsh and Farrington, 2002) taking into account key characteristics such asnature, size, layout and crime problems. Yet some areas such as city centres were unique.The area must also have no existing CCTV system, or at least one, which is stable, but theevaluation took place at a time when virtually all town centres and hospitals were in theprocess of expanding already existing systems.
So while the aim had been to achieve a Level 3 evaluation (Sherman et al. 2002), this wasnot possible in all cases, and for reasons that proved outside the control of the evaluators.Moreover, in some cases, and particularly car parks and small residential systems, the levelof crime was so low it meant that meaningful analysis was not possible.
125
Appendix A

Realistic evaluation/qualitative methods
A range of research methodologies and data-sets were combined to determine the contextin which the CCTV systems were installed and, therefore, the characteristics, which help toexplain why a CCTV system had a particular impact. A range of diff e rent data-sets wasobtained from each system.
For each project one fieldworker would take primary responsibility for liaising with projects t a ff, carrying out qualitative interviews, attending project meetings and obtaining keyproject information, statistics, and copies of key documents. The fieldworker monitored thep roject throughout the implementation phase to a period one year following the date onwhich the system became fully operational, or up to the end of the evaluation period,whichever was the sooner66. As projects became live, the bulk of project activity was centredround the control room, and fieldwork activities shifted accordingly.
Desk-based study of documentation
A range of different documents was studied as part of the evaluation. These included thefollowing:
● The initial bid documents submitted to the Home Office.● Minutes from steering group meetings initially set up to supervise the installation
of the CCTV system and in two cases carried on to monitor the ongoing operationof the system.
● Control room Codes of Practice.● Tender documents and other documentation outlining the technical specifications
of the CCTV systems.
These provided a range of information:
● The degree of strategic planning and operation behind the CCTV systems, andtheir stated aims and objectives.
● Details of the technical specifications of the systems.
Assessing the impact of CCTV
126
66 As a number of projects implemented relatively late in the evaluation period it was possible to obtain only a fewmonths’ post-implementation data.
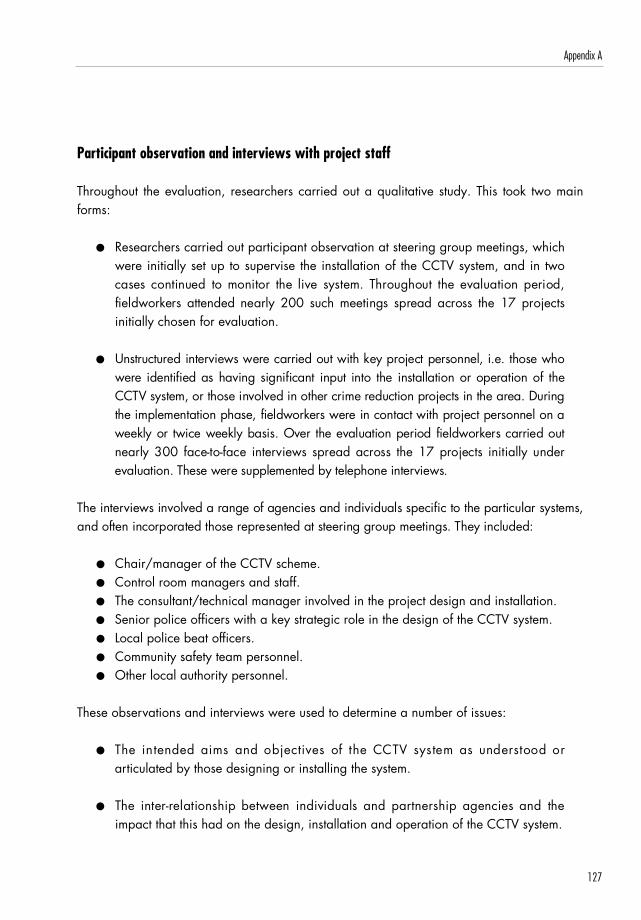
Participant observation and interviews with project staff
Throughout the evaluation, researchers carried out a qualitative study. This took two mainforms:
● Researchers carried out participant observation at steering group meetings, whichwere initially set up to supervise the installation of the CCTV system, and in twocases continued to monitor the live system. Throughout the evaluation period,fieldworkers attended nearly 200 such meetings spread across the 17 pro j e c t sinitially chosen for evaluation.
● U n s t ru c t u red interviews were carried out with key project personnel, i.e. those whow e re identified as having significant input into the installation or operation of theCCTV system, or those involved in other crime reduction projects in the area. Duringthe implementation phase, fieldworkers were in contact with project personnel on aweekly or twice weekly basis. Over the evaluation period fieldworkers carried outnearly 300 face-to-face interviews spread across the 17 projects initially underevaluation. These were supplemented by telephone interviews.
The interviews involved a range of agencies and individuals specific to the particular systems,and often incorporated those re p resented at steering group meetings. They included:
● Chair/manager of the CCTV scheme. ● Control room managers and staff. ● The consultant/technical manager involved in the project design and installation.● Senior police officers with a key strategic role in the design of the CCTV system.● Local police beat officers.● Community safety team personnel.● Other local authority personnel.
These observations and interviews were used to determine a number of issues:
● The intended aims and objectives of the CCTV system as understood orarticulated by those designing or installing the system.
● The inter- relationship between individuals and partnership agencies and theimpact that this had on the design, installation and operation of the CCTV system.
127
Appendix A
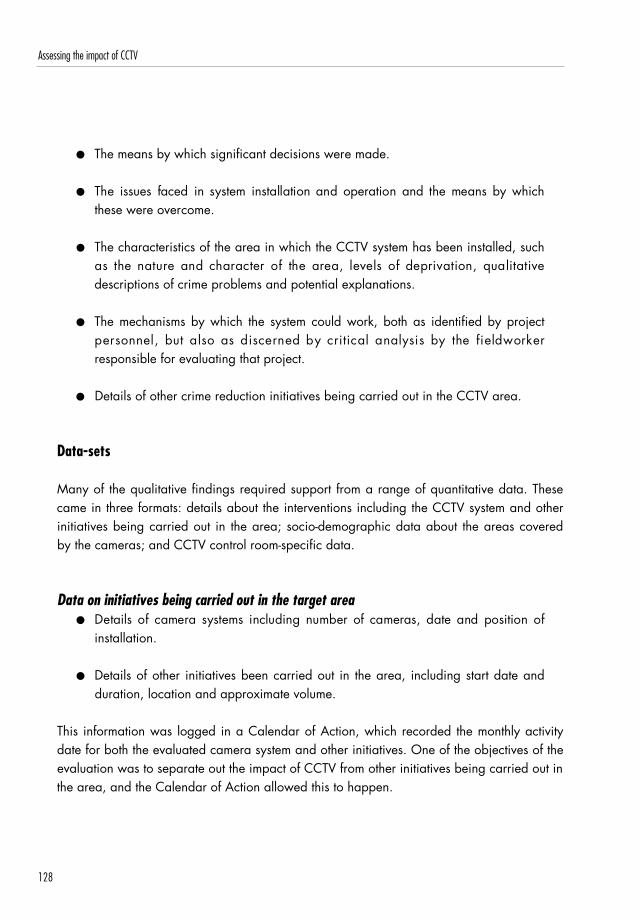
● The means by which significant decisions were made.
● The issues faced in system installation and operation and the means by whichthese were overcome.
● The characteristics of the area in which the CCTV system has been installed, suchas the nature and character of the area, levels of deprivation, qualitativedescriptions of crime problems and potential explanations.
● The mechanisms by which the system could work, both as identified by projectpersonnel, but also as discerned by critical analysis by the fieldworkerresponsible for evaluating that project.
● Details of other crime reduction initiatives being carried out in the CCTV area.
Data-sets
Many of the qualitative findings required support from a range of quantitative data. Thesecame in three formats: details about the interventions including the CCTV system and otherinitiatives being carried out in the area; socio-demographic data about the areas coveredby the cameras; and CCTV control room-specific data.
Data on initiatives being carried out in the target area● Details of camera systems including number of cameras, date and position of
installation.
● Details of other initiatives been carried out in the area, including start date andduration, location and approximate volume.
This information was logged in a Calendar of Action, which recorded the monthly activitydate for both the evaluated camera system and other initiatives. One of the objectives of theevaluation was to separate out the impact of CCTV from other initiatives being carried out inthe area, and the Calendar of Action allowed this to happen.
Assessing the impact of CCTV
128

Socio-demographic data about the target areaSocio-demographic data were obtained for the areas in which the CCTV systems wereinstalled. These were from a number of sources, including Indices of Multiple Deprivation,and 2001 Census data. These formed two purposes:
● To inform the context into which the CCTV systems have been installed.
● To allow population densities to be calculated, allowing an estimate of relativecrime rates to be obtained.
Control room dataWhere available, two samples of data were collected from a sample 67 of control rooms fromthe date when the system became fully operational to the end of the evaluation period68:
● Incident and occurrence logs, providing information on the number, type and dateof incidents monitored by the control room operators, both in the control room asa whole and, where these can be separated, the target area.
● The date and time of tapes seized from the control room, and the type of incidentaddressed. The local police normally obtained these.
These data were used to measure the following:
● The absolute level of control room activity in the target area, in order to determinewhether CCTV could have reasonably been expected to impact on crime levels.
● The pro p o rtion of control room activity in the target area, compared with theother areas monitored from the same control room, to determine whether controlroom, or monitoring activity, was biased towards different areas connected to thesame control room.
129
Appendix A
67 The sample was chosen according to availability of relevant data as well as to represent the different types ofsystems.
68 This varied between projects. The objective was to carry out an in-depth evaluation of the CCTV system for aperiod of one year following the date of full operation (taken at the point at which all cameras in the systemwere producing a picture capable of being monitored from the control room or where the system had reached astable state, taking into account camera faults or breakdowns which were an inte.g.ral part of most systems).There were a number of systems which achieved full operation too late in the evaluation timetable to evaluate fora period of one year.

● The type of incidents being addressed by control room operators or policeobtaining evidence, and therefore the type of crimes, which could reasonably beexpected to be influenced by control room activity.
Control room study
An in-depth control room study was carried out for each CCTV project under evaluation. Theaim of the study was to determine how the operation of the CCTV control room contributedto the effectiveness of the CCTV system under evaluation.
The aims of the study were as follows:
● To examine the technical aspects of the control room and the cameras.● To examine the operators’ proficiency, attitudes, and behaviour.● To examine the number and type of events that were monitored and the context in
which they were monitored.● To examine technical links and working relationships between the CCTV control
room and other agencies, most notably the police and retail/pub radio schemes.● To examine all of the above for CCTV, but most importantly to assess the impact
on the effectiveness of the evaluated CCTV system.● These issues provided a context for the record of incident logs and tape seizures
obtained for the whole of the evaluation period (see above).
In order to achieve these aims an observational study was carried out in each control room.The control room was observed for 48 hours (or pro rata where the control room wasm o n i t o red for less than 24 hours per day). A total of 462.5 hours was spent observ i n gcontrol rooms. Each type of shift was observed in a one-week period to cover time of day,and weekday and weekend operation. These reflected the shift patterns of the control roomsbeing studied, which changed across systems. There were four main types of shift patterns;2 x 12- hour shifts per day, 3 x 8-hour shifts per day, and varying shift patterns throughoutthe week. Each control room study was carried out at least two months after the new systemwas fully operational, to ensure that the control room operators were used to the newcameras and that the system was operating to full capacity.
The observation comprised three main tasks: quantitative study, qualitative interview, andobservation.
Assessing the impact of CCTV
130

Quantitative studyThe quantitative study had three main aspects.
a) Each time an operator actively monitored a target for one minute or more6 9 w a srecorded, regardless of the nature of this target. Information collected included descriptionof target, reasons for watching (where these could be determined), time surveillance startedand how long it was maintained, cameras used, and what actions operators took as a resultof the surveillance.
b) Number of calls to the control room, via telephone or radio, was noted. Origin of call,and action taken by the operators as a result, was also recorded.
c) Operator breaks away from monitoring screen, whether scheduled, or due to other tasksetc. was recorded.
Qualitative studyDuring each of the shifts a semi-stru c t u red interview was carried out with one of theoperators. Topics covered included training, attitude to the job, perceptions of the newCCTV system, working relationships with the police and other incidents.
ObservationDuring the shifts, re s e a rchers observed operator behaviour, attitudes to work, what theymonitored, and how they responded to contact with other agencies.
Cost-effectiveness and cost-benefit analysis
C o s t - e ffectiveness and cost-benefit analyses were carried out on each CCTV system,following Home Office guidelines70, and total costs were calculated using the Home Officecosts database. The following input costs were collected from each project:
● Personnel costs – accounts for personnel time spent by individuals involved in theset-up and progress of the project.
131
Appendix A
69 Defined as an incident by (Norris and McCahill, 2003)7 0 ‘Analysis of costs and benefits guidance for evaluators’ http://www. h o m e o ff i c e . g o v. u k / rd s / p d f s / c d p 1 c o s t e ff . p d f
‘Measuring inputs guidance for evaluators’ http://www.homeoffice.gov.uk/rds/pdfs/cdp3inputs.pdf

● Equipment costs – includes cost and installation of all CCTV equipment, controlroom hardware, installation and cost of cabling and maintenance costs.
● Transport – includes vehicle hire as well as transport costs.● Training – where applicable includes training of operators.● Other overheads – includes all other costs including work carried out under a
fixed contract. Specifically, a number of projects employed a consultant to assistwith the design and implementation of the system – these fees amounted toapproximately ten per cent of total costs.
● Premises – any property used to run the system, including meeting rooms. ● Advertising and publicity.
Costs were divided into two phases: set-up (those incurred in making the system operational)and ongoing costs (those incurred once the system was operational).
Costs were collected by interviews with individual staff followed by a self-completioninformation grid, where the individuals were not able to produce the information at the time.Such information was supplemented by documentary evidence including biddingdocuments, invoices and bills.
Stakeholder interviews
A stakeholder survey was conducted in two project areas: Borough Town and Market Town.It aimed to determine local businesses’ perceptions of the CCTV system, and to pro v i d em o re rich and contextual information re g a rding public perceptions of CCTV. Morespecifically, it aimed:
1. To determine local businesses’ understanding of the proposed/new CCTVscheme.
2. To determine the level of involvement by local businesses in the design, fundingand implementation of the scheme.
3. To determine local businesses’ attitudes towards the introduction of the CCTVscheme.
4. To determine the potential, or actual, impact that CCTV will have on the localbusinesses.
Assessing the impact of CCTV
132

5. To determine how the actions of local businesses will impact upon the effect of theCCTV scheme.
6. To determine local businesses’ desired impact of CCTV.
A sample of 25 businesses from within each target area was randomly selected to undergoa semi-structured qualitative questionnaire lasting approximately 30minutes. The target areawas defined to include all areas within coverage of the new cameras, including pubs,restaurants, takeaways, retailers, and various service providers.
The sample was categorised into retail, service providers and pub/leisure, ensuring that avalid cross-section of the businesses within the areas was selected. Wherever possible, themanager, owner, or landlord of the business was questioned.
Focus groups
Focus groups were carried out in two areas in which redeployable cameras in Borough hadbeen installed. Their purpose was to explore how much the presence of the CCTV camera(s)actually affected the people living in these areas. The following issues were discussed:
● Crime and disorder problems experienced● Awareness of CCTV installed in the area● Opinions about CCTV installed in the area● Its perceived impact● Feelings about its removal.
The focus groups were convened by local councillors or local authority workers in each are a .14 attended the first, of whom most were over fifty, and only four were men. All had lived in thevillage for at least two years and eight of those present had been living there for about 20 yearsor longer. A camera had been deployed in the village for 16 months before the focus gro u pwas conducted, occasionally supplemented by a second camera elsewhere in the village.
The second was attended by nine members of a local residents’ group: all were over thirty,four were women and five were men. All the respondents had lived in the avenue for atleast two years; however, some of the respondents had lived on the avenue most of theirlives. A camera has been deployed on the avenue twice, for a total of eight months beforethe focus group was conducted.
133
Appendix A
Both focus group discussions lasted for an hour and a half in total, and were led mainly byone re s e a rc h e r, with another two asking additional questions. The two supporting re s e a rc h e r salso acted as scribes, and the discussion was re c o rded and subsequently transcribed.
Research issues: obtaining police-recorded crime data
The research was compromised by delays in obtaining police-recorded crime data. This wasa major problem and in future researchers and fund holders requiring such data would beadvised to bear the following points in mind:
● F o rces are inundated with requests for data and often have limited re s o u rc e savailable. Some forces demanded payment for this service and it is suggestedthat this be built into any future tender for research monies.
● Crime prevention measures are rarely implemented across discrete police units(beats, divisions), and the most time-consuming element of obtaining data isextracting that relevant to the specific research area. This will have implicationsfor the research costings. It should either be built into the anticipated funding forpolice forces, or researchers should ensure that they have the in-house expertise toextract these data (in particular, access to GIS expertise).
● Location-specific crime data falls under the remit of the Data Protection Act 1998.
● The process of negotiating access to any data, and particularly that which fallsunder the remit of the Data Protection Act 1998, is extremely time-consuming andneeds to begin immediately following the award of research funding. This is athree-way process involving researchers, relevant force representatives and fundholders. This will culminate in a data sharing agreement to be signed by all forcesand researchers (of which this research has developed a prototype).
● Some data protection issues may remain, which may restrict the potential of theresearch.
● The police re q u i re stringent security arrangements (BS 7799) for the storage of datafalling under the remit of the Data Protection Act 1998, and this will invariablyre q u i re changes both to security pro c e d u res and buildings. Research org a n i s a t i o n swould be advised to identify where such data are likely to be stored and obtain aninitial security assessment immediately following the award of re s e a rch funding.
Assessing the impact of CCTV
134

● Negotiation of access to data is an ongoing process requiring continuedpersonnel resources and this should be borne in mind by both fund holders andresearchers when setting the research timetable.
● R e s e a rchers and fund-holders should be pre p a red for delays in obtaining datacaused by lack of communication between data protection officers and dataproviders, changes in police staffing, inappropriate referrals by police personneland a number of other issues raised. In an example from this evaluation, onea rea failed to deliver on police data because they were still raising dataprotection issues over a year after the data-sharing agreement had been signed.
135
Appendix A

Assessing the impact of CCTV
136

Appendix B: List of Home Office crime categories
The following table summarises the Home Office (HO) Level one crime codes used in theclassification for this evaluation. This includes only those offences that could be feasiblyaffected by the implementation of CCTV. While every effort has been made to fit in withHome Office classifications, this has not always been possible, as the authors were notusing the second level codes, which specify more precisely what each offence is.
HO code Offence type HO code Offence type
1 Violence against the person 54 Theft2 Violence against the person 56 Criminal damage4 Violence against the person 57 Criminal damage5 Violence against the person 58 Criminal damage8 Violence against the person 59 Criminal damage13 Violence against the person 64 Public order17 Sexual offences 65 Public order19 Sexual offences 66 Public order20 Sexual offences 92 Drug offences25 Sexual offences 104 Violence against the person27 Sexual offences 105 Violence against the person28 Burglary 115 Firearm offences29 Burglary 125 Public order30 Burglary 126 Theft**31 Burglary 130 Theft***33 Going equipped 131 Theft***34 Robbery 137 Theft37 Theft*** 139 Sexual offences39 Theft 149 Criminal damage44 Theft 165 Sexual offences45 Theft** 182 Be.g.ging46 Theft* 802 Dangerous driving47 Theft 803 Dangerous driving48 Theft*** 804 Dangerous driving49 Theft* Shoplifting** Theft from motor vehicles*** Theft of motor vehicles
Theft from motor vehicles and Theft of motor vehicles comprise vehicle crime.
137

Assessing the impact of CCTV
138

Appendix C: Changes in individual crimes andsignificance levels
139

Assessing the impact of CCTV
140
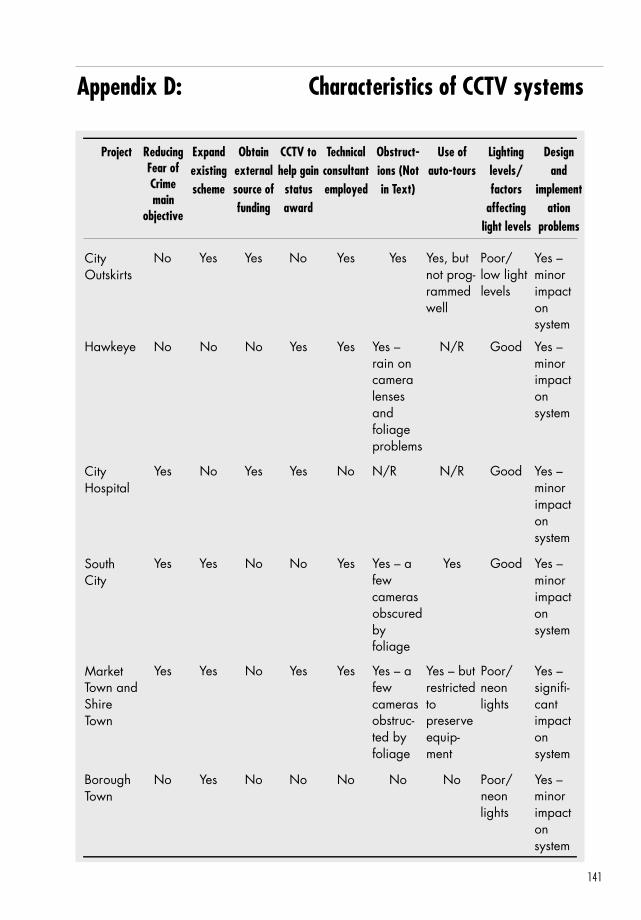
Appendix D: Characteristics of CCTV systems
141
CityOutskirts
No Yes Yes No Yes Yes Yes, butnot prog-rammedwell
Poor/low lightlevels
Yes –minorimpactonsystem
Hawkeye No No No Yes Yes Yes –rain oncameralensesandfoliageproblems
N/R Good Yes –minorimpactonsystem
CityHospital
Yes No Yes Yes No N/R N/R Good Yes –minorimpactonsystem
SouthCity
Yes Yes No No Yes Yes – afewcamerasobscuredbyfoliage
Yes Good Yes –minorimpactonsystem
MarketTown andShireTown
Yes Yes No Yes Yes Yes – afewcamerasobstruc-ted byfoliage
Yes – butrestrictedtopreserveequip-ment
Poor/neonlights
Yes –signifi-cantimpactonsystem
BoroughTown
No Yes No No No No No Poor/neonlights
Yes –minorimpactonsystem
ReducingFear ofCrimemain
objective
Project Expandexistingscheme
Obtainexternalsource offunding
CCTV tohelp gain
statusaward
Technicalconsultantemployed
Obstruct-ions (Notin Text)
Use ofauto-tours
Lightinglevels/factors
affectinglight levels
Designand
implementation
problems

Assessing the impact of CCTV
142
NorthernEstate
Yes No No No Yes No Yes – buttechnicalfaults
Poor/low lightlevels
Yes –minorimpactonsystem
WestcapEstate
Yes Yes Yes No Yes No Yes Poor/low lightlevels
Yes –minorimpactonsystem
EastcapEstate
Yes No No No No No No Verypoor/lightingtoobright
Yes –signifi-cantimpactonsystem
DualEstate
Yes Yes No No Yes Yes –rain oncameralenses
Yes, butrestrictedtopreservee q u i p m e n t
Good Yes –signifi-cantimpactonsystem
SouthcapEstate
Yes No Yes No Yes No No Poor/low lightlevels
Yes –minorimpactonsystem
Borough Yes No No No Yes No No Poor/low lightlevels
Yes –signifi-cantimpactonsystem
DeployEstate
Yes No No No Yes No Yes, buttechnicalfaults
Good Yes –minorimpactonsystem
ReducingFear ofCrimemain
objective
Project Expandexistingscheme
Obtainexternalsource offunding
CCTV tohelp gain
statusaward
Technicalconsultantemployed
Obstruct-ions (Notin Text)
Use ofauto-tours
Lightinglevels/factors
affectinglight levels
Designand
implementation
problems

Appendix E: Characteristics of CCTV control rooms
Project Control room also Monitoring Total control Proportion of Tapes taken for monitors other hours per day room incidents total incidents evidence geographical monitored over monitored in the (per week)*
areas 48-hrs of target areaobservation
City Outskirts Yes 24 181 20% 2.1
Hawkeye No 16 17 100% 3.5(not Sundays)
City Hospital N/A N/A N/A N/A N/R
South City Yes 24 142 40% N/R
Market Town Yes Average 9 20 100% 1.75and Shire To w n
Borough Town Yes 16-19 53 4% 0.5
Northern Estate Yes 24 158 8% 0.42
Westcap Estate Yes 24 42 12% N/R
Eastcap Estate Yes 24 178 11% 0.83
Dual Estate Yes Average 7 65 21% 0.92
Southcap Estate Yes 24 119 4% 0.33
Borough N/A N/A N/A N/A N/R
Deploy Estate Yes 24 183 5% N/R
* Residential areas calculated from all tapes taken over a sample of 12-weeks over one-year period. Town/Citycentres calculated as an average.
143

Assessing the impact of CCTV
144

Appendix F: Costs of individual CCTV systems
The following tables detail the value of inputs (£’s) utilised by each project during theevaluation period. Costs are split by category (e.g. personnel, equipment), source (CRP, nonCRP) and whether they refer to set-up or ongoing71 inputs. Additionally, the tables include am e a s u re of the number of cameras installed by the project and the associated cost percamera based on both the total net present value of inputs and the annual equivalent total.
City Outskirts
Input (£) Set-up Ongoing Total %CRP Non-CRP CRP Non- CRP
Personnel 0 5,845 0 6,393 12,238 1.5Other 12,276 241 0 47,058 59,576 7.3Equipment 714,065 0 9,688 0 723,753 89.1Premises 0 67 0 16,129 16,196 2.0Transport 0 33 0 0 33 0.0Advertising 0 525 0 0 525 0.1NPV total 726,342 6,711 9,688 69,581 812,322% 89.4 0.8 1.2 8.6Annual equivalent 94,753 0 1,286 0 96,038equipmentAnnual equivalent total 107,029 6,711 1,286 69,581 184,607Number of cameras 47Cost per camera (NPV) 17,283Cost per camera (AE) 3,928
145
71 Set-up costs refer to costs incurred during the design and installation of the system. Ongoing costs refer to costsincurred after the system becomes ‘live’.

Hawkeye72
Input (£) Set-up Ongoing Total %
Personnel 185,094 53 185,147 4.3Other 321,725 335,932 657,657 15.3Equipment 3,417,534 0 3,417,534 79.3Premises 0 43,327 43,327 1.0Training 1,638 0 1,638 0.0Transport 315 0 315 0.0Advertising 2,642 0 2,642 0.1NPV Total 3,928,949 379,312 4,308,261% 91.2 8.8Annual equivalent equipment 453,490 0 453,490Annual equivalent total 964,904 379,312 1,344,216
Number of cameras 646Cost per camera (NPV) 6,669Cost per camera (AE) 2,081
Whilst the cost information for the Hawkeye scheme related to a total of 646 cameras thatwere installed, the previous effectiveness evaluation only considered the impact of 556 ofthese cameras. This difference arose as no police recorded crime statistics were availablefor those car parks where the remaining 90 cameras were installed, and it was not possibleto identify costs by specific car parks. Consequently, in the subsequent analysis thecalculated cost per camera figures are used to imply the cost-benefit of installing theevaluated 556 cameras. Multiplying the cost per camera (AE) figure by 556 gave anannual equivalent total for Hawkeye of £1,157,036. The same calculation was conductedin relation to the three categories of risk previously identified.
Assessing the impact of CCTV
146
72 It was not possible to calculate the percentage of resources funded through the Crime Reduction Programme asproject personnel could not provide the relevant information.
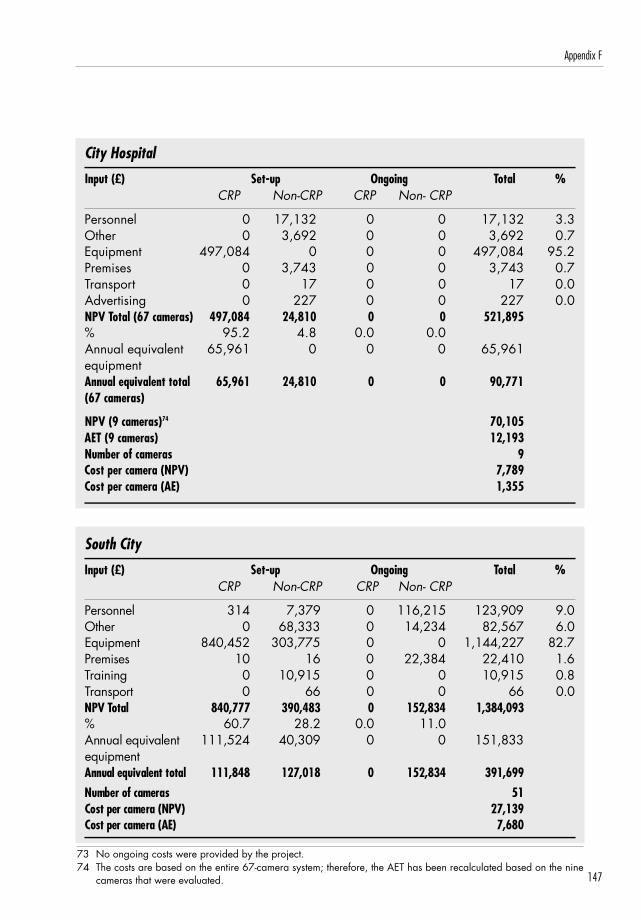
City Hospital
Input (£) Set-up Ongoing Total %CRP Non-CRP CRP Non- CRP
Personnel 0 17,132 0 0 17,132 3.3Other 0 3,692 0 0 3,692 0.7Equipment 497,084 0 0 0 497,084 95.2Premises 0 3,743 0 0 3,743 0.7Transport 0 17 0 0 17 0.0Advertising 0 227 0 0 227 0.0NPV Total (67 cameras) 497,084 24,810 0 0 521,895% 95.2 4.8 0.0 0.0Annual equivalent 65,961 0 0 0 65,961equipmentAnnual equivalent total 65,961 24,810 0 0 90,771(67 cameras)
NPV (9 cameras)74 70,105AET (9 cameras) 12,193Number of cameras 9Cost per camera (NPV) 7,789Cost per camera (AE) 1,355
South City
Input (£) Set-up Ongoing Total %CRP Non-CRP CRP Non- CRP
P e r s o n n e l 3 1 4 7 , 3 7 9 0 1 1 6 , 2 1 5 1 2 3 , 9 0 9 9 . 0O t h e r 0 6 8 , 3 3 3 0 1 4 , 2 3 4 8 2 , 5 6 7 6 . 0E q u i p m e n t 8 4 0 , 4 5 2 3 0 3 , 7 7 5 0 0 1 , 1 4 4 , 2 2 7 8 2 . 7P re m i s e s 1 0 1 6 0 2 2 , 3 8 4 2 2 , 4 1 0 1 . 6Tr a i n i n g 0 1 0 , 9 1 5 0 0 1 0 , 9 1 5 0 . 8Tr a n s p o rt 0 6 6 0 0 6 6 0 . 0NPV To t a l 8 4 0 , 7 7 7 3 9 0 , 4 8 3 0 1 5 2 , 8 3 4 1 , 3 8 4 , 0 9 3% 6 0 . 7 2 8 . 2 0 . 0 1 1 . 0Annual equivalent 1 1 1 , 5 2 4 4 0 , 3 0 9 0 0 1 5 1 , 8 3 3e q u i p m e n tAnnual equivalent total 1 1 1 , 8 4 8 1 2 7 , 0 1 8 0 1 5 2 , 8 3 4 3 9 1 , 6 9 9Number of cameras 5 1Cost per camera (NPV) 2 7 , 1 3 9Cost per camera (AE) 7 , 6 8 0
147
Appendix F
73 No ongoing costs were provided by the project.74 The costs are based on the entire 67-camera system; therefore, the AET has been recalculated based on the nine
cameras that were evaluated.

Assessing the impact of CCTV
148
Shire Town
Input (£) Set-up Ongoing Total %CRP Non-CRP CRP Non- CRP
Personnel 0 10,112 0 1,147 11,259 6.2Other 0 3,331 0 7,407 10,738 5.9Equipment 152,632 0 0 0 152,632 84.4Premises 0 81 0 8,339 8,421 4.7Training 0 222 0 0 222 0.1Transport 0 38 0 41 78 0.0NPV Total 152,632 13,783 0 16,935 183,350% 84.4 7.6 0.0 9.4Annual equivalent 20,254 0 0 0 20,254equipmentAnnual equivalent total 20,254 13,783 0 16,935 50,972Number of cameras 12Cost per camera (NPV) 15,279Cost per camera (AE) 4,248
Market Town
Input (£) Set-up Ongoing Total %CRP Non-CRP CRP Non- CRP
Personnel 0 7,629 0 866 8,494 4.7Other 0 2,413 0 5,895 8,307 4.6Equipment 151,973 5,402 0 0 157,375 87.1Premises 0 61 0 6,291 6,352 3.5Training 0 167 0 0 167 0.1Transport 0 28 0 31 59 0.0NPV Total 151,973 15,701 0 13,082 180,755% 84.1 8.7 0.0 7.2Annual equivalent 20,166 717 0 0 20,883equipmentAnnual equivalent Total 20,166 11,015 0 13,082 44,263Number of cameras 9Cost per camera (NPV) 20,084Cost per camera (AE) 4,918

Borough Town
Input (£) Set-up Ongoing Total %CRP Non-CRP CRP Non- CRP
Personnel 0 12,125 0 17,781 29,906 9.7Other 0 0 0 3,575 3575 1.2Equipment 274,461 0 0 0 274,461 88.9Premises 0 228 0 700 928 0.3NPV Total 274,461 12,353 0 22,056 308,871% 88.9 4.0 0.0 7.1Annual equivalent 36,420 0 0 0 36,420equipmentAnnual equivalent Total 36,420 12,353 0 22,056 70,829Number of cameras 40Cost per camera (NPV) 7,722Cost per camera (AE) 1,771
Northern Estate
Input (£) Set-up Ongoing Total %CRP Non-CRP CRP Non- CRP
Personnel 2,454 5,708 829 41,718 50,710 19.1Other 0 0 0 4,860 4,860 1.8Equipment 208,317 0 0 0 208,317 78.5Premises 0 17 0 1,611 1,627 0.6NPV Total 210,771 5,725 829 48,189 265,514% 79.4 2.2 0.3 18.1Annual equivalent 27,643 0 0 0 27,643equipmentAnnual equivalent Total 30,096 5,725 829 48,189 84,840Number of cameras 11Cost per camera (NPV) 24,138Cost per camera (AE) 7,713
149
Appendix F
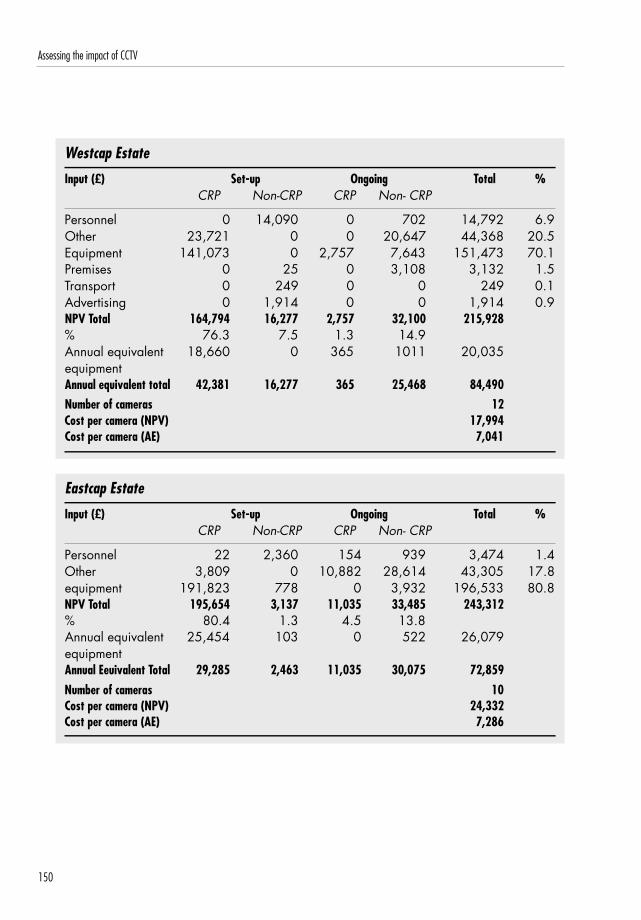
Westcap Estate
Input (£) Set-up Ongoing Total %CRP Non-CRP CRP Non- CRP
Personnel 0 14,090 0 702 14,792 6.9Other 23,721 0 0 20,647 44,368 20.5Equipment 141,073 0 2,757 7,643 151,473 70.1Premises 0 25 0 3,108 3,132 1.5Transport 0 249 0 0 249 0.1Advertising 0 1,914 0 0 1,914 0.9NPV Total 164,794 16,277 2,757 32,100 215,928% 76.3 7.5 1.3 14.9Annual equivalent 18,660 0 365 1011 20,035equipmentAnnual equivalent total 42,381 16,277 365 25,468 84,490Number of cameras 12Cost per camera (NPV) 17,994Cost per camera (AE) 7,041
Eastcap Estate
Input (£) Set-up Ongoing Total %CRP Non-CRP CRP Non- CRP
Personnel 22 2,360 154 939 3,474 1.4Other 3,809 0 10,882 28,614 43,305 17.8equipment 191,823 778 0 3,932 196,533 80.8NPV Total 195,654 3,137 11,035 33,485 243,312% 80.4 1.3 4.5 13.8Annual equivalent 25,454 103 0 522 26,079equipmentAnnual Eeuivalent Total 29,285 2,463 11,035 30,075 72,859Number of cameras 10Cost per camera (NPV) 24,332Cost per camera (AE) 7,286
Assessing the impact of CCTV
150

151
Appendix F
Dual Estate – Area A
Input (£) Set-up Ongoing Total %CRP Non-CRP CRP Non- CRP
Personnel 247 3,560 0 5,172 8,979 13.4Other 7,290 41 0 4,964 12,295 18.3Equipment 42,123 1,998 0 0 44,121 65.7Premises 1,607 12 0 2 1,621 2.4Training 0 16 63 0 79 0.1Transport 0 5 0 79 85 0.1NPV Total 51,267 5,633 63 10,217 67,180% 76.3 8.4 0.1 15.2Annual equivalent 5,590 265 0 0 5,855equipmentAnnual equivalent total 14,733 3,900 63 10,217 28,914Number of cameras 5Cost per camera (NPV) 13,436Cost per camera (AE) 5,783
Dual Estate75 – Area B
Input (£) Set-up Ongoing Total %CRP Non-CRP CRP Non- CRP
Personnel 247 3,560 0 5,172 8,979 16.8Other 7,290 41 0 4,964 12,295 23.0Equipment 29,305 1,150 0 0 30,455 56.9Premises 1,611 12 0 2 1,625 3.0Training 0 16 63 0 79 0.1Transport 0 5 0 81 86 0.2NPV Total 38,452 4,785 63 10,219 53,520% 71.8 8.9 0.1 19.1Annual equivalent 3,889 153 0 0 4,041equipmentAnnual equivalent total 13,036 3,788 63 10,219 27,106Number of cameras 5Cost per camera (NPV) 10,704Cost per camera (AE) 5,421
75 In addition to Area A and Area B, 4 cameras were also installed along a main thoro u g h f a re, however noimpact assessment has been made of these cameras and therefore cost information is not reported.
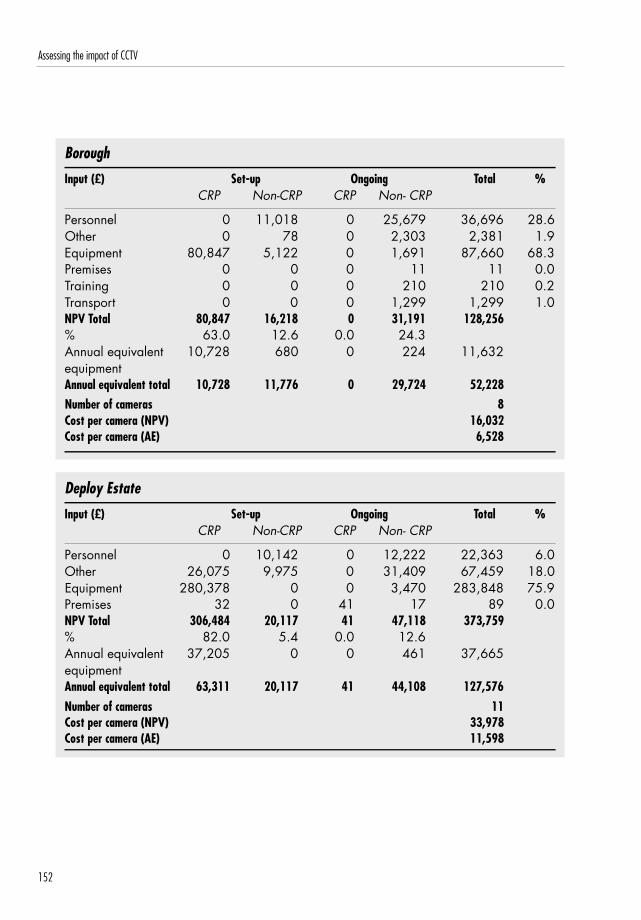
Assessing the impact of CCTV
152
Borough
Input (£) Set-up Ongoing Total %CRP Non-CRP CRP Non- CRP
Personnel 0 11,018 0 25,679 36,696 28.6Other 0 78 0 2,303 2,381 1.9Equipment 80,847 5,122 0 1,691 87,660 68.3Premises 0 0 0 11 11 0.0Training 0 0 0 210 210 0.2Transport 0 0 0 1,299 1,299 1.0NPV Total 80,847 16,218 0 31,191 128,256% 63.0 12.6 0.0 24.3Annual equivalent 10,728 680 0 224 11,632equipmentAnnual equivalent total 10,728 11,776 0 29,724 52,228Number of cameras 8Cost per camera (NPV) 16,032Cost per camera (AE) 6,528
Deploy Estate
Input (£) Set-up Ongoing Total %CRP Non-CRP CRP Non- CRP
Personnel 0 10,142 0 12,222 22,363 6.0Other 26,075 9,975 0 31,409 67,459 18.0Equipment 280,378 0 0 3,470 283,848 75.9Premises 32 0 41 17 89 0.0NPV Total 306,484 20,117 41 47,118 373,759% 82.0 5.4 0.0 12.6Annual equivalent 37,205 0 0 461 37,665equipmentAnnual equivalent total 63,311 20,117 41 44,108 127,576Number of cameras 11Cost per camera (NPV) 33,978Cost per camera (AE) 11,598

References
Aldridge, J. (1989): The Rotakin Test: A Test Target for CCTV Security Systems, ScientificResearch and Development Branch, no.16.
Aldridge, J. (1994): Who will be the first to test your CCTV security or safety team? CCTVOperational Requirements Manual, Police Scientific Development Branch, no.17.
A rm s t rong, G. and Giulianotti, R. (1998): From Another Angle: Police Surveillance andFootball Supporters, in C.Norris, J. Moran, and G. Armstrong (eds.): Surveillance, ClosedCircuit Television and Social Control, Aldershot: Ashgate.
Bennett, T. and Gelsthorpe, L. (1996): ‘Public Attitudes To w a rds CCTV in Public Places’,Studies on Crime and Crime Prevention, 5/1: 72-90.
Brand, S. and Price, R. (2000): The Economic and Social Costs of Crime. Home Off i c eResearch Study No 217. London: Home Office.
B rown, B. (1995): CCTV in Town Centres: Three Case Studies, Crime Prevention andDetection Series, no.73. London: HMSO.
B u rrows, J. (1979): The Impact of Closed Circuit Television on Crime on the LondonUnderground, in P. Mayhew, R. Clarke, J. Burrows, M. Hough and S. Winchester: Crime inPublic View, Home Office Research Study, no.49, London: HMSO.
Chainey, S. (1999): Crime Mapping Case Studies Volume 2: successes in the field. UnitedStates Institute of Justice: Washington DC.
Clarke, R.V.G and Felson, M. (1993): Routine Activity and Rational Choice. New Yo r k :Transaction Publications.
Cook, T. D., and Campbell, D. T. (1976): The design and conduct of quasi-experiments andt rue experiments in field settings. In M. D. Dunnette (ed.): Handbook of industrial andorganizational psychology. New York: John Wiley and Sons.
153
Deismann, W. (2003): CCTV: Literature Review and Bibliography, Research and EvaluationBranch, Ottawa: Royal Canadian Mounted Police.
Ditton, J. and Short, E. (1999): ‘Yes, It Works, No, It Doesn’t: Comparing the Effects ofO p e n - S t reet CCTV in Two Adjacent Scottish Town Centres’, in K. Painter and N. Ti l l e y,(eds.), Surveillance of Public Space: CCTV, Street Lighting and Crime Prevention, Monsey,NY: Criminal Justice Press.
Ditton, J., Short, E., Phillips, S., Norris, C. and Armstrong, G. (1999): The Effect of ClosedCircuit Television on Recorded Crime Rates, and on the Fear of Crime in Glasgow,Edinburgh: Central Research Unit, Scottish Office.
Ditton, J. (2000): ‘Crime and the City: Public Attitudes to CCTV in Glasgow’, British Journalof Criminology, 40, 692-709.
Ditton, J. (2002): Seasonality and fear of crime, London: Nuffield Foundation.
Dixon, J., Levine, M. and McAuley, R. (forthcoming): Street drinking legislation, CCTV andpublic space: Exploring attitudes towards public order measures. London: HMSO.
Drummond, M. (1997): Methods for the Economic Evaluation of Health Care Programmes,Second Edition. Oxford University Press.
E.g.ger, M., Davey Smith, G. and Altman D. (1995): Systematic reviews in Health Care:Meta-Analysis in Context, London: BMJ Publishing.
Ekblom, P. (1992): The Safer Cities Programme Impact Evaluation: Problem and Progress,Studies on Crime and Crime Prevention, 1:1.
Evett, C. and Wood, J. (2004): Designing a Control Room, CCTV Image, Spring, pp 24-25.
Farrall, S., Bannister, J., Ditton, J. and Gilchrist, E. (2000): ‘Social Psychology and the Fearof Crime: Re-examining a Speculative Model’, British Journal of Criminology, 40, 399-413.
Farrington, D. (1997): ‘Evaluating a Community Crime Prevention Programme’ Evaluation,157-173.
Assessing the impact of CCTV
154

Flight, S., Van Heerwaarden, Y. and Van Soomeren, P. (2003): Does CCTV Displace Crime?An Evaluation of the Evidence and a Case Study from Amsterdam, in M. Gill (ed.): CCTV,Leicester: Perpetuity Press.
F u r s t e n b e rg, F. (1971): ‘Public Reaction to Crime in the Streets’, American Scholar, 40,601-610.
Gerrard, G. (1999): Public Surveillance CCTV: An Evaluation of the Effectiveness of LocalAuthority and Police Controlled Systems. MSc Thesis, University of Cambridge.
Gill, M. and Turbin, V. (1998): ‘CCTV and Shop Theft: To w a rds a Realistic Evaluation’, in CN o rris, G Arm s t rong, and J. Moran: Surveillance, Order and Social Control, Aldershot: Gower.
Gill, M. and Turbin, V. (1999), ‘Evaluating Realistic Evaluation: Evidence From a Study ofCCTV’, in K. Painter and N. Tilley (eds.), Surveillance of Public Space: CCTV, Street Lightingand Crime Prevention, Monsey, NY: Criminal Justice Press, 179-200.
Gill, M. (2003): CCTV, Leicester: Perpetuity Press.
Gill, M. and Loveday, K. (2003): What Do Offenders Think About CCTV? In M Gill (ed.):CCTV, Leicester: Perpetuity Press.
Gill, M., Smith, P., Spriggs, A., Argomaniz, J., Allen, J., Follett, M., Jessiman, P., Kara, D.,Little, R. and Swain, D. (2003): National Evaluation of CCTV: Early Findings on SchemeImplementation, Effective Practice Guide, Home Office Development and Practice Report ,no.7, London: HMSO.
Gill, M. and Hemming, M. (2004): CCTV in a London Borough, Leicester: PerpetuityResearch and Consultancy International.
Gill, M., Spriggs, A., Allen, J., Hemming, M., Jessiman, P., Kara, D., Kilworth, J., Little, R.and Swain, D. (2005a): Control Rooms: Findings from Control Room Observations, HomeOffice Online Report, London: Home Office.
Gill, M., Spriggs, A., Allen, J., Argomaniz, J., Bryan, J., Hemming, M., Jessiman, P., Kara,D., Kilworth, J., Little, R., Swain, D. and Waples, S. (2005b): The Impact of CCTV: FourteenCase Studies, Home Office Online Report, London: Home Office.
155
References

Gill, M., Spriggs, A., Allen, J., Argomaniz, J., Bryan, J., Jessiman, P., Kara, D., Kilworth, J.,Little, R., Swain, D. and Waples, S. (2005c): Technical Annex: Methods Used in Assessingthe Impact of CCTV, Home Office Online Report, London: Home Office.
Gill, M., Collins, K., Hemming, M. and Rose, A. (2005d): Implementation of RedeployableCCTV, Home Office Online Report, London: Home Office.
Gill, M., Swain, D., Spriggs, A., Allen, J., Argomaniz, J. and Waples, S. (2005e):Assessing the Impact of CCTV – The South City Case Study, Home Office Online Report,London: Home Office.
Gill, M., Little, R., Spriggs, A., Allen, J., Argomaniz, J. and Waples, S. (2005f):Assessing the Impact of CCTV – The Hawkeye Case Study, Home Office Online Report ,London: Home Off i c e .
Gill, M., Allen, J., Spriggs, A., Argomaniz, J. and Waples, S. (2005g): Assessing the Impact ofCCTV – The Northern Estate Case Study, Home Office Online Report, London: Home Off i c e .
Hale, C. (1996): ‘Fear of crime: a review of the literature’, in International Review ofVictimology, 4, 79-150.
Home Office (1991): Safer Communities: the Local Delivery of Crime Prevention through thePartnership Approach, Home Office Standing Conference on Crime Prevention, August.
Honess, T. and Charman, E. (1992): ‘Closed Circuit Television in Public Places: ItsAcceptability and Perceived Eff e c t i v e n e s s’, Police Research Group Crime Prevention Unit,35, London: Home Office Police Department.
Laycock, G. and Tilley, N. (1995): Policing and Neighbourhood Watch: Strategic issues,Crime Detection and Prevention Series, 60. London: HMSO.
L e v e s l e y, T. and Martin, A. (2005): Police Attitudes to and use of CCTV, Online Report ,London: Home Office.
L i p s e y, M. W. and Wilson, D. B. (2001): Practical Meta-Analysis. Thousand Oaks, CA: Sage.
McCahill, M. (2002): The Surveillance Web: The Rise of Visual Surveillance in an EnglishCity, Cullompton: Willan.
Assessing the impact of CCTV
156

NACRO (2002): To CCTV or Not to CCTV? A Review of Current Research into theE ffectiveness of CCTV Systems in Reducing Crime, Community Safety Practice Briefing,London: National Association for the Care and Resettlement of Offenders.
Newburn, T. and Hayman, S. (2002) Policing , Surveillance, and Social Control: CCTVand Police Monitoring of suspects, Cullompton: Willan
Norris, C., Moran, J., and Armstrong, G., (1998): Surveillance, Closed Circuit Televisionand Social Control, Aldershot: Ashgate.
Norris, C. and Armstrong, G. (1999), ‘CCTV and the Social Structuring of Surveillance’, inK. Painter and N. Tilley (eds.): Surveillance of Public Space: CCTV, Street Lighting andCrime Prevention, Monsey, NY: Criminal Justice Press.
Norris, C. and McCahill, M. (2003): Estimating the Extent, Sophistication and Le.g.ality ofCCTV in London, in M Gill (ed.): CCTV, Leicester: Perpetuity Press.
Norris, C. and McCahill, M. (2003): On the Threshold to the Urban Panopticon: Analysingthe Employment of Closed Circuit Television (CCTV) in European Cities and Assessing itsSocial and Political Impacts, Work Package IV: CCTV systems: Their Stru c t u res andPractices. Centre for Criminology and Criminal Justice, University of Hull.
Pawson, R. and Tilley, N. (1994): ‘What Works in Evaluation Research?’ British Journal ofCriminology, 34/3: 291-306.
Pawson, R. and Tilley, N. (1997): ‘Realistic Evaluation’ London: Sage Publications.
Phillips, C. (1999): ‘A Review of CCTV Evaluations: Crime Reduction Effects and AttitudesTo w a rds Its Use’, in K. Painter and N. Tilley (eds.): Surveillance of Public Space: CCTV,Street Lighting and Crime Prevention, Monsey, NY: Criminal Justice Press, 123-156.
Sarno, C., Hough, M. and Bulos, M. (1999): Developing a Picture of CCTV in SouthwarkTown Centres: Final Report, Crime Policy Research Unit, South Bank University.
Scriven, M. (1991): Evaluation thesaurus, Fourth Edition, N e w b u ry Park, CA: Sage Publications.
Sherman, L., Farrington, D., Welsh, B. and MacKenzie, D. (2002): Evidence-Based CrimePrevention, London: Routledge.
157
References
S h o rt, E. and Ditton, J. (1995): Does CCTV Prevent Crime? An Evaluation of the Use ofCCTV Surveillance Cameras in Airdrie Town Centre, Edinburgh: Scottish Office.
Short, E. and Ditton, J. (1998): ‘Seen and Now Heard: Talking to the Targets of Open StreetCCTV’, British Journal of Criminology, 38/3: 404-428.
Simmons, J. and Dodd, T. (2003): ‘Crime in England and Wales 2002/2003’, HomeOffice Statistical Bulletin, London: Home Office. July 2003.
Simmons J., Le.g.g, C. and Hosking, R. (2003): ‘National Crime Recording Standard(NCRS): An Analysis of the Impact on Recorded Crime Part Two: Impact on Individual PoliceForces’. Home Office On-line Report 32/03 athttp://www.homeoffice.gov.uk/rds/crimeew0203.html
Skinns, D. (1998): ‘Crime Reduction, Diffusion and Displacement: Evaluating theE ffectiveness of CCTV’, in C. Norris, J. Moran, and G. Arm s t rong (eds.): S u r v e i l l a n c e ,Closed Circuit Television and Social Control, Aldershot: Aldgate.
Spriggs, A., Gill, M., Argomaniz, J. and Bryan, J. (2005): Public Attitudes Towards CCTV:Results from the Pre-Intervention Public Attitude Survey carried out in areas ImplementingCCTV, Home Office Online Report, London: Home Office.
Smith, P., Spriggs, A., Argomaniz, J., Allen, J., Jessiman, P., Kara, D., Little, R., Swain, D.,Follett, M. and Gill, M. (2003): Lessons in Implementing CCTV Schemes: An Early Review,in M Gill: CCTV, Leicester: Perpetuity Press.
Ti l l e y, N. (1993): Understanding Car Parks, Crime and CCTV: Evaluation Lessons FromSafer Cities, Crime Prevention Unit, no.42, London: HMSO.
Welsh, B. and Farrington, D. (2002): Crime Prevention Effects of Closed Circuit Television: ASystematic Review, Home Office Research Study, no.252, London: HMSO.
Wilson, D. and Sutton, A. (2003): ‘Open-Street CCTV in Australia: A Comparative Study ofEstablishment and Operation’, Report to the Criminology Research Council, Melbourn e :Department of Criminology, University of Melbourne.
Assessing the impact of CCTV
158

Websites
www.neighbourhood.statistics.gov.uk
www.homeoffice.gov.uk/rds/recordedcrime1.html
Crime Statistics in England and Wales 2004: Long-term Trends in Violence against thePerson: http://www.crimestatistics.org.uk/output/page38.asp
Analysis of costs and benefits guidance for evaluators:http://www.homeoffice.gov.uk/rds/pdfs/cdp1costeff.pdf
Measuring inputs guidance for evaluators: http://www.homeoffice.gov.uk/rds/pdfs/cdp3inputs.pdf
CCTV User Group
http://www.cctvusergroup.com/
159
References

Assessing the impact of CCTV
160