Assessing the gender pay gap in Asia’s · PDF fileAssessing the gender pay gap in...
47
Phu Huynh March 2016 ILO Asia-Pacific Working Paper Series Assessing the gender pay gap in Asia’s garment sector
Transcript of Assessing the gender pay gap in Asia’s · PDF fileAssessing the gender pay gap in...

Phu Huynh
March 2016
I LO As ia - Pa c i f i c Wor k i n g Pa per Se r i es
Assessing the gender pay gap in As ia’s
garment sector
ILO Asia-Pacific Working Paper Series
Assessing the gender pay gap in Asia’s garment sector
Phu Huynh
March 2016

Copyright © International Labour Organization 2016 First published 2016
Publications of the International Labour Office enjoy copyright under Protocol 2 of the Universal Copyright Convention. Nevertheless, short excerpts from them may be reproduced without authorization, on condition that the source is indicated. For rights of reproduction or translation, application should be made to ILO Publications (Rights and Licensing), International Labour Office, CH-1211 Geneva 22, Switzerland, or by email: [email protected]. The International Labour Office welcomes such applications.
Libraries, institutions and other users registered with a reproduction rights organization may make copies in accordance with the licences issued to them for this purpose. Visit www.ifrro.org to find the reproduction rights organization in your country. Huynh, Phu Assessing the gender pay gap in Asia's garment sector / Phu Huynh ; International Labour Organization. - Bangkok: ILO, 2016 (ILO Asia-Pacific working paper series, ISSN: 2227-4405 (web pdf)) International Labour Organization wages / wage differential / low wages / gender / discrimination / working conditions / clothing industry / shoe industry / trend / Bangladesh / Cambodia / India / Indonesia / Lao PDR / Pakistan / Philippines / Thailand / Viet Nam / Asia 13.01.3
ILO Cataloguing in Publication Data The designations employed in ILO publications, which are in conformity with United Nations practice, and the presentation of material therein do not imply the expression of any opinion whatsoever on the part of the International Labour Office concerning the legal status of any country, area or territory or of its authorities, or concerning the delimitation of its frontiers.
The responsibility for opinions expressed in signed articles, studies and other contributions rests solely with their authors, and publication does not constitute an endorsement by the International Labour Office of the opinions expressed in them.
Reference to names of firms and commercial products and processes does not imply their endorsement by the International Labour Office, and any failure to mention a particular firm, commercial product or process is not a sign of disapproval.
ILO publications and digital products can be obtained through major booksellers and digital distribution platforms, or ordered directly from [email protected]. For more information, visit our website: www.ilo.org/publns or contact [email protected]. Printed in Thailand

Regional Office for Asia and the Pacific iii
Preface
The International Labour Organization (ILO) is devoted to advancing opportunities for women and men to obtain decent and productive work. It promotes rights at work and encourages decent employment opportunities, enhanced social protection and strengthened dialogue processes in handling work-related issues. As countries in the Asia-Pacific region navigate a sustainable recovery from the global economic crisis, the ILO Decent Work Agenda and the Global Jobs Pact provide critical policy frameworks for strengthening the foundation for a more inclusive and sustainable future. Historically, garment and footwear manufacturing has been vital for economic growth and jobs for a number of Asian economies. The industry now employs more than 40 million workers, a majority of whom are women. This paper presents an in-depth analysis of gender-based wage dynamics in the sector. Based on national labour force survey data and using various econometric techniques, it presents the difference in earnings between women and men for nine developing Asian countries and examines the extent that discrimination may be a determining factor. The paper provides empirical evidence for measures and policies that would help achieve gender equality, a priority focus under the 2030 Agenda for Sustainable Development. This paper is part of the ILO Asia-Pacific Working Paper Series, which is designed to enhance our understanding of decent work issues, stimulate discussion and encourage knowledge sharing and further research that will promote decent work in Asia and the Pacific.
Tomoko Nishimoto
Assistant Director-General and Regional Director for Asia and the Pacific


Contents
Page
Preface…………………………………………………………………………………………….. iii Acknowledgements……………………………………………………………………………….. v Abstract……………………………………………………………………………………………. vii Abbreviations………………………………………………………………………………………. xi 1. Introduction…………………………………………………………………………………….. 1 2. Literature review……………………………………………………………………………….. 2 3. Description of data sources…………………………………………………………………….. 4
3.1 Labour force surveys……………………………………………………………………….. 4 3.2 Summary statistics………………………………………………………………………….. 5
4. Empirical results of the gender pay gap………………………………………………………... 7 4.1 Gender pay gap……………………………………………………………………………... 7 4.2 Wage and working time dynamics in Bangladesh………………………………………… 10 4.3 Wage determinants………………………………………………………………………… 12 4.4 Decomposition of the gender pay gap……………………………………………………… 15 4.5 Gender differences in low pay rates………………………………………………………... 17
5. Conclusion………………………………………………………………………………... 20 References………………………………………………………………………………………….. 23
List of figures 1. Male-female wage gap, raw and adjusted (per cent)…………………………………………….. 8 2. Excessive hours of work by education, subsector and sex, Bangladesh (per cent)……………… 11 3. Estimated wage premiums (per cent)…………………………………………………………….. 13 4. Blinder-Oaxaca decomposition of gender pay gap (per cent)…………………………………….15 5. Low pay rate (less than 2/3 of median hourly earnings)…………………………………………. 18
List of tables
Table 1. Estimated gender differential in pay and hours of work by education and subsector, Bangladesh………………………………………………………………………………………….. 10
Table A1. Summary statistics, full weighted samples……………………………………………… 26 Table A2. Mincer regression results with earnings as dependent variable, full weighted samples.... 28 Table A3. Blinder-Oaxaca decomposition of gender pay gap, full weighted samples……………... 32
Table A4. Logistic regression results with low pay as dependent variable, full weighted samples... 33
Regional Office for Asia and the Pacific v


Acknowledgements
This paper benefited from very helpful comments and contributions provided by ILO colleagues including Fernanda Bárcia de Mattos, Matthew Cowgill, Richard Horne, Steven Kapsos, Malte Luebker, and Makiko Matsumoto. Any errors are the sole responsibility of the author. Regional Office for Asia and the Pacific vii


Regional Office for Asia and the Pacific ix
Abstract
This paper presents the gender pay gap in the garment, textile and footwear industry in nine developing Asian economies – Bangladesh, Cambodia, India, Indonesia, the Lao People’s Democratic Republic, Pakistan, the Philippines, Thailand and Viet Nam. It finds that women earn less than men in eight of the nine countries, with the imbalance particularly sizeable in India and Pakistan. Some of the pay gap can be attributed to differences in factors such as age and education, but discrimination also appears to be a contributing determinant. Women are also more likely to be at the lower end of the wage ladder. Applying standard Mincerian wage regressions and the Blinder-Oaxaca decomposition method, the paper presents empirical evidence on gender wage gaps and wage premiums in the industry, and discusses measures that can help reduce gender disparities and discrimination in the sector.
The responsibility for opinions expressed in articles, studies and other contributions rests solely with the authors, and publication does not constitute an endorsement by the International Labour Office of the opinions expressed in them, or of any products, processes or geographical designations mentioned.
About the author
Phu Huynh is a Labour Economist in the Regional Economic and Social Analysis Unit of the ILO Regional Office for Asia and the Pacific in Bangkok.


Regional Office for Asia and the Pacific xi
Abbreviations
GTF garment, textile and footwear ICSE International Classification by Status in Employment ILO International Labour Organization ISCO International Standard Classification of Occupations ISIC International Standard Industrial Classification of all Economic Activities MFA Multi-fibre Arrangement


Regional Office for Asia and the Pacific 1
1. Introduction
Asia’s garment, textile and footwear (GTF) industry in recent years has garnered the global spotlight. Major tragedies due to unsafe factory conditions in Bangladesh and Pakistan and industrial strife over higher minimum wages in Cambodia, for example, have brought attention to the low wages and minimum standards in working conditions that often characterize the industry. Despite some progress, wages remain extremely low (Huynh, 2015; ILO, 2014). Working hours are long and often excessive as workers depend on extensive overtime to compensate for low base wages, despite the cost in terms of workers’ health and safety. Consequently, consumers and multinational apparel companies are increasing pressure for meaningful change vis-à-vis improved working conditions and compliance with labour standards that could improve the lives of tens of millions of Asia’s garment workers. Even with these challenges, the region’s garment sector continues to grow in terms of production volume, exports and jobs, and has become the garment manufacturing hub for the world. In 2014, exports grew by 5.1 per cent and reached an astounding US$601 billion, or three-fifths of the global total (Huynh, 2015; ILO, 2015). Given the labour-intensive nature of the industry, it employs a massive workforce totalling more than 40 million. That workforce is heavily comprised of young women. In developing Asia, low-end garment production provides a conduit for millions of informal workers with limited educational credentials to shift into formal manufacturing jobs with regular wages. The wage premium for making this transition provides them, in particular women, the opportunity to increase incomes and achieve economic independence. This paper looks at women workers in the GTF industry in Asia and examines their position compared to men in regard to wages, working time, occupational segregation and other dynamics. It aims to expand on the existing literature by providing new empirical estimates of the gender pay gap in the GTF sector in nine countries – namely Bangladesh, Cambodia, India, Indonesia, the Lao People’s Democratic Republic, Pakistan, the Philippines, Thailand and Viet Nam – based on representative national household survey data which have yet to be examined in this capacity. The findings provide a valuable evidence base for fostering greater gender equality in the region with the aim of promoting equal pay for work of equal value, a key target identified under Sustainable Development Goal 8 (United Nations, 2015). Elimination of discrimination in respect of employment and occupation, including working conditions and pay, is also one of the four fundamental principles and rights at work. Following this introduction, section 2 reviews the existing body of literature related to the gender pay gap in the garment sector and in particular the nine focus countries. Section 3 provides a description of the household survey data utilized for the modelling exercise, along with an analysis of key descriptive statistics. In section 4, the results of applying the standard Mincer wage regression model are discussed. The section assesses wage disparities while controlling for relative endowments and differences in marital status, geographic location, sub-industry and occupation. The section looks also at the wage determinants in the industry, and in particular the wage premiums for different levels of experience and education. Employing the Blinder-Oaxaca decomposition approach, the male-female wage differential is further analyzed to determine the extent to which they are driven by differences in relative endowments compared to factors that are unexplained and are due to differences in the returns that women and men receive for their endowments, which can signify forms of discrimination. The section

2 Regional Office for Asia and the Pacific
also presents the gender gap in low pay rates, using standard logistic regression techniques. The paper concludes with a brief summary and discussion of areas for further research.
2. Literature review
Numerous studies have looked at the wage disparity in different countries and industries and examined the drivers that affect the wages that workers receive. Mincer (1974) provides the analytical framework for undertaking an examination of wage determinants. His seminal paper looks at a sub-sample of urban, non-student men from the 1960 United States Census to assess the returns to factors of human capital such as education and experience. Numerous subsequent studies in labour economics have applied a similar human capital wage regression model – while controlling for age, sex, ethnicity, religion, marital status, education, experience, occupation, industry, geographic location, skill level, collective bargaining, and land ownership, among other factors – to analyze earnings disparities and discrimination across lines of gender, race, ethnicity and caste and the differences in the returns to relative endowments. Kunze (2000) surveys the wide body of literature specific to gender pay gaps and wage determinants and finds that male-female earnings differentials tend to be significant but biased due to model limitations. In trying to assess the drivers of wages and the extent of discrimination in the labour market, wide-ranging studies attempt to reduce the bias in the raw disparity in wages between comparator groups based on the principle that differences in relative endowments such as experience and education can account considerably for part of the differential. They attempt to produce robust estimates of the wage gap between groups while controlling for differences in human capital endowments, despite the inherent challenges resulting from data limitations. In regard to gender wage differentials specific to the garment industry, Abras (2012) looks at industry trends before and after the end of the Multi-Fibre Arrangement (MFA) in Bangladesh, India, Pakistan and Viet Nam. Controlling for characteristics like education and experience, the study finds that the returns to education increased in the post-MFA period, with the exception of India. In addition, the male-female earnings gap decreased in Pakistan and Viet Nam but increased in Bangladesh and India. Notably, the adjusted pay gap in Bangladesh exhibits a wage premium for women vis-à-vis men of 15.8 per cent in 2009. By contrast, women receive a relative wage penalty that ranges from 21.5 per cent in Viet Nam (2008) to 40.3 per cent in India (2007) to 63 per cent in Pakistan (2008). Asuyama et al. (2010) also examine firm dynamics in the Cambodian garment industry before and after the phase out of the MFA. Based on survey data collected in 2003 and 2009 on the enterprise performance of garment firms, they investigate the monthly wage gap between high-skilled and low-skilled workers when controlling for sex, experience, education and occupation. In addition to a narrowing of the skill-based wage premium during the period from 2002 to 2008, the study finds a marginal female wage penalty of only less than 4 per cent in 2008. Employing the same survey approach and analytical framework, Fukunishi and Yamagata (2013) report similar results for garment enterprises in Bangladesh, Kenya and Madagascar, where only a small gender pay gap is observed.

Regional Office for Asia and the Pacific 3
Robertson (2011) explores changes in wages in the Cambodia apparel industry from 1996 to 2007, based on household data from the Cambodia Socio-Economic Survey. Applying Mincerian wage regressions, he finds a strong correlation between wages and factors such as sex, age, education and hours of work. Overall, his results show a significant improvement in female wages in the apparel sector during that decade. In addition, the wage premium for the apparel sector relative to the average for all industries is considerable, increasing from 6.4 per cent in 1996 to 41.2 per cent in 2007, reflecting the rapid growth of the sector and its rising importance in driving the industrial base. Akram and Kashmir (2015) discuss the sizeable wage penalty for being a women in the textile and clothing sector of Pakistan. They attribute the gap to the pay scheme commonly employed. Workers in the industry are typically paid by the number of pieces produced, and therefore on the speed of their production. They posit that women generally earn less than men because of their lower output, which is again due to limitations in their working environment, poor quality management and low-productivity methods. Consequently, the piece-rate pay system forces excessive overtime to increase overall volume. But long hours lead to fatigue and accidents and high levels of clothing production that require re-work which is not compensated. Thus, the pay scheme employed itself creates an inherent earnings disadvantage for women. Wage determinants in Viet Nam’s garment industry are explored by Fontana and Silberman (2013) based on baseline worker survey data conducted under the Better Work Programme.1 The survey sample in their investigation includes 2,578 garment workers. Their findings reveal that while tertiary education is a strong predictor of higher monthly pay, lower education levels have a significantly weaker effect. In addition, the worker's gender, having children between the ages of 0 and 5 and originating from a rural area are not significant in explaining pay outcomes. By contrast, factors such as the years of experience the worker has at the factory, whether the worker has received training or whether the worker is paid by the hour as opposed to a piece-rate system are more significant determinants of usual monthly pay. El-Haddad (2011) examines data from a firm questionnaire covering 275 textile and clothing enterprises and a worker questionnaire covering 5,383 industry workers in Egypt, both conducted in 2009, and finds a sizeable male-female gap in hourly wages of 29 per cent. The gap is attributed partly to female segregation in lower paid occupations and lower-paying firms, but differences in endowments (education and experience) account for more than 70 per cent of the total wage disparity. The findings also highlight widespread wage discrimination in the Egyptian textile industry as reflected in the differences in relative returns. In sum, extensive research has examined the gender pay gap and wage determinants, but a more narrow body of literature exists that is specific to the garment industry particularly in Asia. Moreover, the existing research have often looked at survey data prior to 2010, and significantly less is known about dynamics that have taken place during the past five years. This is extremely relevant given major developments in the industry that have occurred in the past few years alone. To this end, this paper aims to fill some of these knowledge gaps. It looks at nationally representative datasets from nine household
1 Better Work is a partnership between the ILO and the International Finance Corporation that aims to improve competitiveness in the garment industry by focussing on adherence to national labour laws and core labour standards. For more information, see: www.betterwork.org/ [accessed 28 Mar. 2016].

4 Regional Office for Asia and the Pacific
surveys that were all conducted within the last five years. The nine samples are balanced geographically, including three South Asian economies (Bangladesh, India and Pakistan) and six from South-East Asia (Cambodia, Indonesia, the Lao People’s Democratic Republic, the Philippines, Thailand and Viet Nam). The study provides comparable estimates of hourly wages by sex for the industry. The gender wage gap is rigorously examined and cross-country comparisons are made in order to identify common trends and patterns across Asia, with the objective of promoting gender equality in the region’s GTF industry.
3. Description of data sources
3.1 Labour force surveys The gender wage gap analysis is based on national labour force survey data for nine countries in Asia. Annual labour force survey datasets are used, with the exception of Indonesia (August 2014), the Philippines (October 2013) and Thailand (Quarter 3, 2013). Each dataset includes variables that allow for identifying wage earners by sex in the GTF sector and for estimating an hourly pay rate. The surveys are nationally representative household surveys based on a rigorous sampling methodology and are conducted by the respective national statistical offices. Thus, they provide a robust statistical basis for undertaking the study. Unless noted otherwise, all summary and regression statistics presented in this paper apply the survey sampling weights. A critical first step in preparing the survey data for analysis is to derive an hourly wage rate based on total earnings and hours of work. For countries that produce a variable for total earnings in the preceding week of the survey, the hourly rate is estimated by applying the actual hours of work during that reference week. For countries that provide only a monthly wage figure, the hourly wage is calculated by first multiplying the monthly wage figure by 12 (based on 12 months per year) and dividing by 52 (based on 52 weeks per year) and then dividing by the actual hours of work during that reference week. India is the lone exception in which a variable for hours of work is not captured, and therefore the analysis on India is based on an estimated daily wage, not an hourly wage. For that case, the daily wage is derived by taking the total weekly earnings in the reference period and dividing by the number of days worked (in half-day units) for that same reference period. In addition, meticulous efforts are taken to harmonize other variables across the nine datasets so as to maximize the cross-country comparability of the final regressions results. For instance, this process includes normalizing the education variable into five similar categories (less than primary education, completed primary, completed lower secondary, completed upper secondary and first stage or completed tertiary). A similar approach is taken to ensure coherence of response categories for the number of years of job experience which are available for Cambodia, Indonesia and Viet Nam. In that regard, four experience classifications are applied: less than one year, one year to less than five years, five years to less than ten years, and ten years or more. The GTF sector is identified based on the industry variable in each dataset. For Indonesia, which employs the International Standard Industrial Classification of All Economic Activities (ISIC), Rev. 3, this equates to groups 17 (manufacturing of textiles), 18 (manufacturing of wearing apparel) and 19

Regional Office for Asia and the Pacific 5
(manufacturing of luggage, handbags and footwear). For the remaining eight datasets which apply ISIC Rev. 4, the comparable sectors are groups 13 (manufacturing of textiles), 14 (manufacturing of wearing apparel) and 15 (manufacturing of leather and related products). The regression model includes variables for subsectors within these three categories to the extent that further disaggregation is captured by each survey. In addition, each of the nine datasets apply the International Classification by Status in Employment (ICSE) to identify wage employees and the International Standard Classification of Occupations (ISCO) to categorize the various occupations based on the nature of the employee’s work or tasks.
3.2 Summary statistics Annex table A1 presents summary statistics by sex of the main variables for each of the nine datasets, with sample weights applied. The number of wage workers for which hourly earnings could be estimated total 18.2 million across the nine country samples, ranging from around 14,000 in the Lao People’s Democratic Republic to 4.3 million in Bangladesh and nearly 5 million in India. This reflects the vast diversity in the size of the industry workforce across the nine countries. Excluding India and Pakistan, the seven other datasets reveal the predominance of women, who account for 61.8 per cent of the total observations. In Cambodia, the share of women wage earners is the highest at 80.8 per cent, followed by Viet Nam at 76.3 per cent. By contrast, women in India and Pakistan total less than one in five of their respective sample, reflecting extremely low economic activity among women in both countries.2 In order to determine the gender pay gap, the average hourly wage is estimated by adjusting total weekly or monthly earnings by the hours of work (in the relevant period) as discussed above. Using the hourly wage is the preferable approach given that the number of hours worked is likely an important factor that drives the differences in total earnings. This is also critical given the prevalence of piece-rate pay schemes in the garment industry. Average hourly wages across the nine datasets are low overall but even lower for women compared to men. With the exception of Bangladesh, the male-female gap in estimated hourly earnings ranges from 10 per cent in Indonesia to 54.7 per cent in Pakistan. The Bangladesh sample reveals that average monthly earnings for men in fact exceed that for women by 2.7 per cent. However, male wage earners in the sample tend to work more hours than their female counterparts (54.3 hours per week compared to 49.2 hours), and therefore their average hourly earnings are actually lower. This further corroborates the importance of controlling for hours of work when analyzing the gender pay gap. Disregarding the differences in working time could result in an overestimation, or in the case of Bangladesh a misrepresentation, of the male-female gap in wages. The average age across the nine-country sample indicates that the garment industry is filled with young workers, ranging from 24.5 years (Cambodian women) to 37.7 years (Filipino women). The Cambodia sample presents the lowest mean age (less than 25 years for both women and men), while the Philippines and Thailand samples have the highest average age. This likely reflects the relative maturity and structure of the industry in the latter countries, where the industry is less attractive to younger jobseekers. By comparison, the garment industry in Cambodia has successfully recruited a young and predominantly female workforce to become the primary sector driving the country’s nascent manufacturing expansion, although some evidence shows that women often subsequently return to
2 For further discussion on low female labour force participation in South Asia, see Chaudhary and Verick, 2014.

6 Regional Office for Asia and the Pacific
agriculture after marriage or having children. The Cambodia Labour Force Survey 2012 reveals that the GTF industry accounts for 77 per cent of all manufacturing wage workers in Cambodia, by far the highest percentage among the nine countries examined. Further illustrating its comparatively younger workers, Cambodia is the only sample in which unmarried employees outnumber those with spouses. With regard to education, the sample in the majority of the countries is dominated by lower education levels, underlining the low-pay and low-value nature of Asia’s garment industry as a whole. In Bangladesh, Cambodia, India, and Pakistan for example, more than three in four have attained at most a lower secondary degree. By contrast, only in the Philippines sample does around one in five have any tertiary education. Moreover, men in each of the nine countries tend to have higher education levels than their female cohorts. In three of the datasets, namely Cambodia, Indonesia and Viet Nam, a variable for job experience is captured and included in the regression analysis. The variable indicates the length of time the employee has worked in that job for that employer. In all three, the highest share of employees have between one year to less than five years of experience, ranging from more than 40 per cent in Indonesia to around 60 per cent in Cambodia and Viet Nam. In Indonesia, around one-quarter have ten years or more experience, but in Cambodia and Viet Nam the ratio is less than one-tenth. This could point to the relatively high turnover taking place in the industry, especially in Cambodia and Viet Nam, as well as the influx of new jobseekers entering the sector in recent years. It could also indicate the tendency for workers to consider the industry for short-term prospects only given limited options for career progression. Annex table A1 also presents the composition of wage earners in each sample by subsector. Of the three subsectors, garments employ the bulk of the salaried workforce in the sample of countries. This is particularly the case for Bangladesh (more than 60 per cent), Cambodia (more than 80 per cent), the Lao People’s Democratic Republic (more than 80 per cent) and the Philippines (more than 64 per cent). The textile sector is less prominent with the notable exception of India, where it engages almost one-half of the sample. Interestingly, for men but not women in the Indonesia, Pakistan and Thailand datasets, textiles are also the leading subsector in terms of wage employment, accounting for 43 per cent, 53 per cent and 42 per cent, respectively. In comparison, the footwear and luggage subsector is a rather small employer across the nine countries. The rare exceptions however include Viet Nam (around two in five of the total sample) and Indonesia (more than one in five).
4. Empirical results of the gender pay gap This study estimates the male-female wage gap for wage earners in the GTF industry while controlling for differences in age, marital status, location, education, experience, industry and occupation. It employs the standard Mincerian model:
ln�� = � + � +�� (1) The dependent variable is the log of the employee i 's hourly wage, wi. Independent variables in the model for all nine country samples include a female dummy variable, age and age squared (signifying
Regional Office for Asia and the Pacific 7
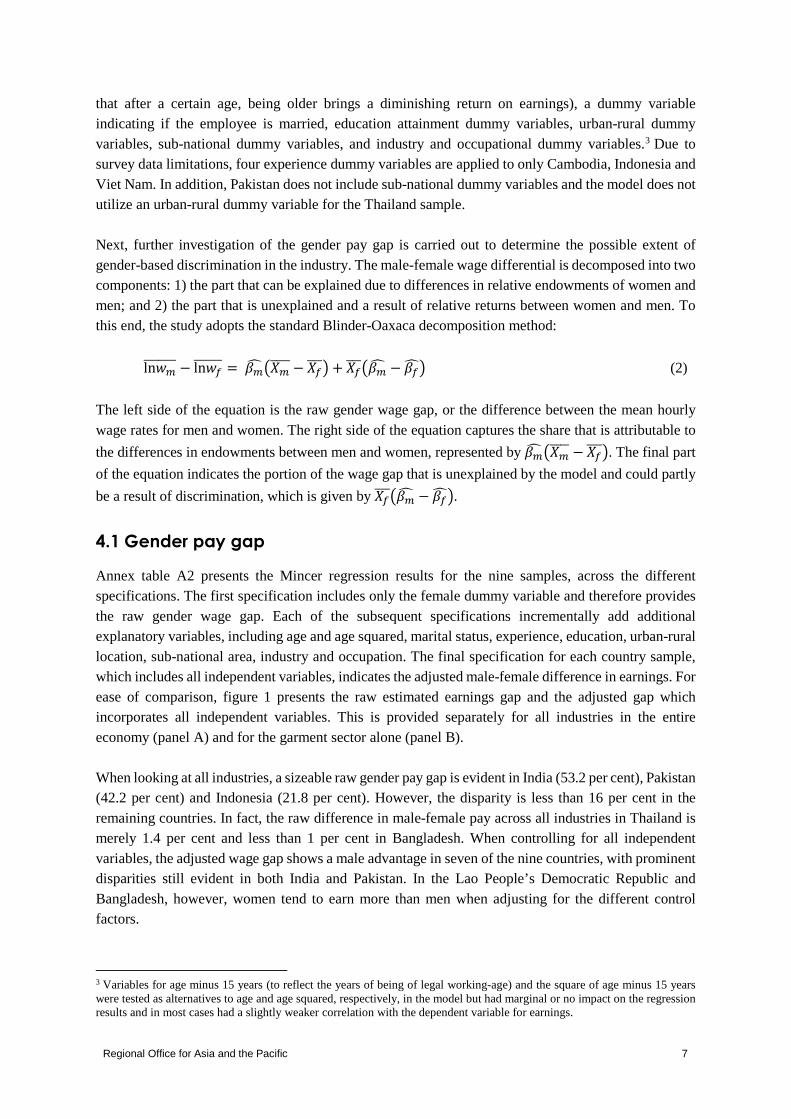
that after a certain age, being older brings a diminishing return on earnings), a dummy variable indicating if the employee is married, education attainment dummy variables, urban-rural dummy variables, sub-national dummy variables, and industry and occupational dummy variables.3 Due to survey data limitations, four experience dummy variables are applied to only Cambodia, Indonesia and Viet Nam. In addition, Pakistan does not include sub-national dummy variables and the model does not utilize an urban-rural dummy variable for the Thailand sample. Next, further investigation of the gender pay gap is carried out to determine the possible extent of gender-based discrimination in the industry. The male-female wage differential is decomposed into two components: 1) the part that can be explained due to differences in relative endowments of women and men; and 2) the part that is unexplained and a result of relative returns between women and men. To this end, the study adopts the standard Blinder-Oaxaca decomposition method:
ln�� − ln�� = ����� − �� � + �� ��� − ��� (2)
The left side of the equation is the raw gender wage gap, or the difference between the mean hourly wage rates for men and women. The right side of the equation captures the share that is attributable to
the differences in endowments between men and women, represented by ����� − �� �. The final part
of the equation indicates the portion of the wage gap that is unexplained by the model and could partly
be a result of discrimination, which is given by �� ��� − ���.
4.1 Gender pay gap
Annex table A2 presents the Mincer regression results for the nine samples, across the different specifications. The first specification includes only the female dummy variable and therefore provides the raw gender wage gap. Each of the subsequent specifications incrementally add additional explanatory variables, including age and age squared, marital status, experience, education, urban-rural location, sub-national area, industry and occupation. The final specification for each country sample, which includes all independent variables, indicates the adjusted male-female difference in earnings. For ease of comparison, figure 1 presents the raw estimated earnings gap and the adjusted gap which incorporates all independent variables. This is provided separately for all industries in the entire economy (panel A) and for the garment sector alone (panel B). When looking at all industries, a sizeable raw gender pay gap is evident in India (53.2 per cent), Pakistan (42.2 per cent) and Indonesia (21.8 per cent). However, the disparity is less than 16 per cent in the remaining countries. In fact, the raw difference in male-female pay across all industries in Thailand is merely 1.4 per cent and less than 1 per cent in Bangladesh. When controlling for all independent variables, the adjusted wage gap shows a male advantage in seven of the nine countries, with prominent disparities still evident in both India and Pakistan. In the Lao People’s Democratic Republic and Bangladesh, however, women tend to earn more than men when adjusting for the different control factors.
3 Variables for age minus 15 years (to reflect the years of being of legal working-age) and the square of age minus 15 years were tested as alternatives to age and age squared, respectively, in the model but had marginal or no impact on the regression results and in most cases had a slightly weaker correlation with the dependent variable for earnings.

8 Regional Office for Asia and the Pacific
Figure 1. Male-female wage gap, raw and adjusted (p er cent)
Panel A. All industries
Panel B. Garments, textiles and footwear
Note: Raw gap indicates the difference in estimated natural log of hourly earnings of employees (aged 15+) while controlling for only sex, and adjusted gap controls for all independent variables including sex, age, marital status, education, experience, sub-national area, economic sector and occupation. A positive gap value indicates higher earnings for men relative to women. India figures are based on the natural log of estimated daily earnings. Source: Same as Annex table A1.
Likewise, in Asia’s garment industry, women’s earnings generally lag behind that of men. The raw male-female difference in garment sector earnings is the highest in Pakistan (64.5 per cent), followed by India (34.6 per cent). In comparison, the raw pay gap ranges from around 17–25 per cent in the Philippines, Thailand and Viet Nam. When adjusting for demographic, educational, geographical, subindustry and occupational variances between women and men, a wage disparity in favour of men still exists in six of the nine countries. The adjusted wage disparity is astounding in both Pakistan (48.3 per cent) and India (39.1 per cent), but is around 11 per cent or less in the other countries.4 A key finding
4 For Pakistan, adding a dummy control variable for whether or not the employee is paid through a piece-rate system, to test the position raised by Akram and Kashmir (2015), has a very marginal effect on the adjusted pay gap likely because hours of work are controlled for in the model. It is worth noting, however, that in the Pakistan sample, 72 per cent of women are indeed
-20% -10% 0% 10% 20% 30% 40% 50% 60%
Bangladesh
Lao PDR
Cambodia
Thailand
Philippines
Viet Nam
Indonesia
India
Pakistan
Raw Adjusted
-20% -10% 0% 10% 20% 30% 40% 50% 60% 70%
Bangladesh
Lao PDR
Indonesia
Cambodia
Viet Nam
Philippines
Thailand
India
Pakistan
Raw Adjusted

Regional Office for Asia and the Pacific 9
is that in comparison to the labour market as a whole, the adjusted male-female earnings gap tends to be lower in the garment industry except in just three countries – Cambodia, India and Pakistan. This could signal a positive pattern of stronger labour market institutions and more effective governance within the garment sector vis-à-vis the broader economy. India aside, incorporating all control variables helps to reduce or reverse the gender wage gap. This reflects the general tendency across the different datasets for men relative to women to have higher educational endowments and to be less likely employed in lower paid geographical areas, subsectors and industries. The regression results for India are unique in that the adjusted pay gap exceeds the raw pay gap (difference of 4.5 percentage points). This is primarily a result of introducing sub-national state and subsector variables into the model and effectively adjusting for the larger proportion of males concentrated in states such as Uttar Pradesh and West Bengal and subsectors that exhibit lower average earnings relative to that for the full sample.5 The results for Thailand also stand out. The raw gender wage gap in the Thailand sample is 25.1 per cent, the third highest among the nine countries. However, by controlling for variances related to demography, education, geographic location, sector and occupation, the adjusted male-female pay gap falls to 7 per cent. This decrease of 18.1 percentage points is the largest among the nine countries. This is driven notably by differences in provincial locality, reflecting the higher proportion of men in the sample working in provinces with relatively higher wages such as Bangkok and Samut Prakan. Moreover, the regressions show considerable gender-based segregation across both subsectors and occupations. That is, controlling for these variables helps to adjust for the relatively higher proportion of women in lower paid subsectors and occupations. The regressions for Indonesia and the Lao People’s Democratic Republic show a common pattern. Both exhibit a raw gender pay gap that disadvantages women, but introducing all control variables generates an adjusted gap that either slightly or substantially favours women. For the Indonesia sample, the raw wage gap of 8.4 per cent falls to 0.9 per cent when controlling for the different independent variables. In particular, the marginal adjusted pay gap accounts for men in the sample generally being more experienced and educated than women and based in provinces and occupations with higher average earnings. Likewise, in the Lao People’s Democratic Republic, the raw gender gap is rather low at 3.5 per cent in favour of men and the adjusted male-female earnings gap is actually 7.1 per cent in favour of women. In particular, by controlling for the more educated profile of men in the sample relative to women, in addition to age and marital status, the results show that women would earn slightly more than men. Furthermore, adjusting for variances in occupation takes into account the disproportionate share of men in occupations that are higher paid. As discussed above, the Bangladesh sample contrasts starkly from the other eight datasets. When controlling for actual hours of work, Bangladesh is the only sample in which men earn less than women on an hourly basis. As such, the raw and adjusted gender pay gaps are 10.4 per cent and 14.4 per cent,
paid through a piece-rate system whereas the comparable ratio is only 27 per cent for men. By contrast, in the Cambodia sample, for example, only 5 per cent of men and 6 per cent of women are paid on a piece-rate basis. 5 It is worth restating that the wage figures estimated for India are daily, not hourly, wages. Given the prevalence of piece-rate pay schemes, it’s likely that the adjusted pay gap does not fully capture the differences in the time or volume of work. Thus, the results for India may represent an upward bias.
10 Regional Office for Asia and the Pacific
respectively, to the benefit of women. The adjusted pay differential in which women receive a wage premium compared to men is consistent with findings by Abras (2012).
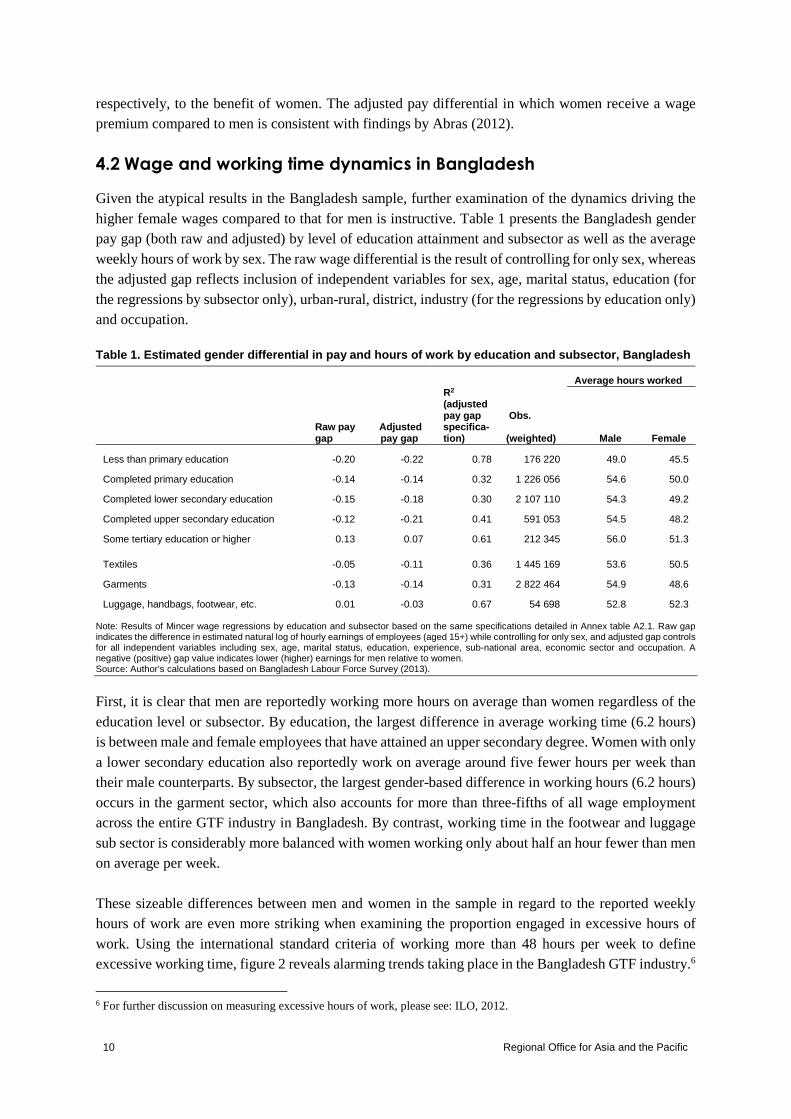
4.2 Wage and working time dynamics in Bangladesh
Given the atypical results in the Bangladesh sample, further examination of the dynamics driving the higher female wages compared to that for men is instructive. Table 1 presents the Bangladesh gender pay gap (both raw and adjusted) by level of education attainment and subsector as well as the average weekly hours of work by sex. The raw wage differential is the result of controlling for only sex, whereas the adjusted gap reflects inclusion of independent variables for sex, age, marital status, education (for the regressions by subsector only), urban-rural, district, industry (for the regressions by education only) and occupation. Table 1. Estimated gender differential in pay and ho urs of work by education and subsector, Bangladesh
Average hours worked
Raw pay gap
Adjusted pay gap
R2 (adjusted pay gap specifica- tion)
Obs. (weighted) Male Female
Less than primary education -0.20 -0.22 0.78 176 220 49.0 45.5
Completed primary education -0.14 -0.14 0.32 1 226 056 54.6 50.0
Completed lower secondary education -0.15 -0.18 0.30 2 107 110 54.3 49.2
Completed upper secondary education -0.12 -0.21 0.41 591 053 54.5 48.2
Some tertiary education or higher 0.13 0.07 0.61 212 345 56.0 51.3
Textiles -0.05 -0.11 0.36 1 445 169 53.6 50.5
Garments -0.13 -0.14 0.31 2 822 464 54.9 48.6
Luggage, handbags, footwear, etc. 0.01 -0.03 0.67 54 698 52.8 52.3 Note: Results of Mincer wage regressions by education and subsector based on the same specifications detailed in Annex table A2.1. Raw gap indicates the difference in estimated natural log of hourly earnings of employees (aged 15+) while controlling for only sex, and adjusted gap controls for all independent variables including sex, age, marital status, education, experience, sub-national area, economic sector and occupation. A negative (positive) gap value indicates lower (higher) earnings for men relative to women. Source: Author’s calculations based on Bangladesh Labour Force Survey (2013).
First, it is clear that men are reportedly working more hours on average than women regardless of the education level or subsector. By education, the largest difference in average working time (6.2 hours) is between male and female employees that have attained an upper secondary degree. Women with only a lower secondary education also reportedly work on average around five fewer hours per week than their male counterparts. By subsector, the largest gender-based difference in working hours (6.2 hours) occurs in the garment sector, which also accounts for more than three-fifths of all wage employment across the entire GTF industry in Bangladesh. By contrast, working time in the footwear and luggage sub sector is considerably more balanced with women working only about half an hour fewer than men on average per week. These sizeable differences between men and women in the sample in regard to the reported weekly hours of work are even more striking when examining the proportion engaged in excessive hours of work. Using the international standard criteria of working more than 48 hours per week to define excessive working time, figure 2 reveals alarming trends taking place in the Bangladesh GTF industry.6
6 For further discussion on measuring excessive hours of work, please see: ILO, 2012.

Regional Office for Asia and the Pacific 11
Across the full weighted sample, 73.7 per cent of men and 47.4 per cent of women work more than 48 hours per week. By education and subsector, the share for men at every disaggregation exceeds 70 per cent except for male wage earners with less than a primary degree. At every education level and subsector, the proportion for women is concerning but lower than that for men aside from the luggage and footwear sector. The prevalence of long working hours in the GTF industry is indicative of the need for employees to work more to compensate for low base earnings. However, long hours and excessive overtime can both compromise workplace safety and health and productivity over the long term. Figure 2. Excessive hours of work by education, subs ector and sex, Bangladesh (per cent)
Note: Share of wage earners in the full weighted sample that work more than 48 hours per week. Source: Author’s calculations based on Bangladesh Labour Force Survey (2013).
The wage regressions given in table 1 by education and subsector draw attention to additional nuances that help to better illustrate the wage dynamics in the Bangladesh GTF industry. Gender pay gaps to the advantage of women are observed across four of the five education levels. Notably, the estimates for those that have some or have completed their tertiary education counter the patterns seen at all other levels. Among those with a higher education, there is a sizeable raw pay gap with men earning 13 per cent more than women. When controlling for all the other explanatory variables including occupation, this falls to 7 per cent, likely reflecting the disproportionate share of tertiary-educated men in higher-paid occupations overall. By contrast, the other four education levels produce a gender wage disparity in favour of women. For those that have not yet completed their primary education, women would expect to earn 20 per cent more than men. This pay gap increases to 22 per cent when accounting for all control variables. For those with a primary degree or a lower secondary degree the estimated wage differential (both raw and adjusted) is around 14–18 per cent to the disadvantage of men. For women who have completed their upper secondary studies, the expected hourly pay vis-à-vis men with the same education credentials is slightly higher at 21 per cent when adjusting for all explanatory variables. Likewise, the results by subsector also exhibit an hourly pay disadvantage for men. Women in the garment sector earn an estimated 14 per cent more than men, even after controlling for age, marital status, locality, education and occupation. In the textile and footwear subsectors, the gap is lower but still to the benefit of women. The raw gap in the textile industry is 5 per cent, but introducing all
0 10 20 30 40 50 60 70 80 90
Some tertiary or higher
Completed upper secondary
Completed lower secondary
Completed primary
Less than primary
Luggage and footwear, etc.
Garments
Textiles
Full sample
Female Male

12 Regional Office for Asia and the Pacific
independent variables generates an adjusted pay differential that is 11 per cent higher for women than men. In other words, by adding all controls we are able to adjust for the relatively higher education profile of men and their disproportionate employment in occupations that exhibit higher overall earnings. Taken together, these disaggregated findings point to a sizeable hourly wage disadvantage for men in Bangladesh’s GTF industry with the exception of those who are tertiary-educated, which represents merely 8 per cent of the entire male sample. While their total monthly earnings exceed those of women, men overall may not be adequately compensated for their longer hours of work.7 4.3 Wage determinants
Annex table A2 provides not only the raw and adjusted gender pay gap, but also the returns to wages due to age, experience and education as well as the expected earnings premium (or penalties) for being married or being based in a rural area. Figure 3 presents the last wage regression as specified in Annex table A2 for each of the country samples, with the inclusion of all independent variables. Panel A shows the expected differential in wages for being married. In Cambodia and the Lao People’s Democratic Republic, a sizeable barrier to the industry exists for being married. Workers in these two samples could expect to earn around 6 per cent less when having a spouse. By contrast, being married provides a wage premium of nearly 12 per cent in India and 8 per cent in Indonesia and Bangladesh. In Pakistan and Viet Nam, the benefit of being married equates to almost 4 per cent in higher hourly earnings. Being married in Thailand and the Philippines, however, tends to be less consequential in influencing hourly wages. Panel B presents the earnings premium (or penalty) for being in a rural location when controlling for all other explanatory variables. In Cambodia, with all other factors being equal, a rural wage earner can expect to earn around 31 per cent less than her urban counterpart. This urban-rural differential is the largest among the nine samples, and signifies the highly urban concentration of higher paid jobs in the GTF industry in Cambodia. The rural wage penalty is also sizeable in India at nearly 13 per cent. By comparison, in Pakistan, the Philippines and Viet Nam, rural employees face a lower wage penalty vis-à-vis urban employees, ranging from 2 per cent to 6 per cent.8 On the other hand, in Indonesia rural wage employment in the industry tends to be more lucrative than urban ones (when adjusting for all independent variables) by almost 12 per cent. A rural wage premium of approximately 4 per cent is also evident in Bangladesh, but in the Lao People’s Democratic Republic there is urban-rural parity in terms of expected hourly wages.
7 An alternative hypothesis could be that men are overreporting their hours of work, which would have the consequence of deflating their estimated hourly earnings. This notion is supported by evidence of men more likely than women to be employed in garment workplaces in which living quarters are combined with manufacturing production. This type of combined workplace-housing arrangement may bias survey responses to questions regarding actual hours of work given the potentially unclear demarcations of the working day. 8 The marginal rural wage penalty in Viet Nam is consistent with findings from Fontana and Silberman, 2013.

Regional Office for Asia and the Pacific 13
Figure 3. Estimated wage premiums (per cent)
Panel A: Married status
Panel B: Rural residency
Panel C: Job experience
Panel D: Education
Note: Results of final wage regressions as specified in Annex table A2, with the inclusion of all independent variables, which indicate the wage premium (or penalty) relative to the base scenarios of being unmarried (panel A), based in an urban area (panel B), having less than one year of experience (panel C) and having no education or less than a primary degree (panel D). Source: Annex table A2.
Understanding the returns on experience is useful for investigating compensation patterns within the industry, particularly for recruiting and retaining workers in a growth industry where high turnover may be prevalent. As discussed above, only three survey samples, specifically Cambodia, Indonesia and Viet Nam, include a variable to capture the level of experience the employee had in that job for that employer. With having less than one year of experience being the base case, panel C shows the expected returns to each level of experience above the baseline when controlling for all explanatory variables. For both Indonesia and Viet Nam, the results show a pattern that can be highly expected. That is, employees are well compensated for their increasing levels of job experience and tenure. In Indonesia, the expected returns are the highest. An employee with between one year and less than five years of experience receives a 25 per cent wage premium over her counterpart with less than one year of experience. For more than ten years of experience, the return to hourly wages is a sizeable 43 per cent. Similarly, Vietnamese employees are paid incrementally more given their job experience, ranging from 18 per cent (one year to less than five years) to 32 per cent (ten years or more). By contrast, the results for Cambodia display a vastly different trend. With all control variables in place, having between one year and less than five years of experience boosts the expected hourly pay by around 6 per cent, compared to a newer employee with less than one year of experience. Having between five years and less than ten years of experience has about the same effect on increased wages. Interestingly, workers with ten or more years of experience tend to be penalized for their experience with that employer, earning approximately 5 per cent less than recruits with less than one year of
-8%
-6%
-4%
-2%
0%
2%
4%
6%
8%
10%
12%
-35%
-30%
-25%
-20%
-15%
-10%
-5%
0%
5%
10%
15%
-10%
0%
10%
20%
30%
40%
50%
Cambodia Indonesia Viet Nam
Between 1 yr and less than 5 yrs
Between 5 yrs and less than 10 yrs
10+ yrs
-50%
0%
50%
100%
150%
200%
Completed primary Completed lower secondary
Completed upper secondary Some tertiary or higher

14 Regional Office for Asia and the Pacific
experience when other factors such as sex, age, marital status, geographic location, education, industry and occupation are accounted for. These results could reflect the high attrition rates in the industry as more experienced workers find little financial incentive to stay with the same employer while new recruits are joining firms at more competitive wages. However, skilled labour shortages have been well documented in Cambodia, particularly at the management, supervisory, technical and design levels (Savchenko, 2012). In this context, better compensation schemes and options for career progression that account for job tenure and experience could be an effective countermeasure. With regard to education, panel D exhibits the wage premium at each level of education, controlling for all explanatory variables, above that for a wage earner with less than a primary degree (or the base case). Across the region as a whole, employees in the GTF industry are justifiably rewarded for their educational credentials, with a few exceptions.9 The return on higher education overall is lowest in Viet Nam where the wage premium increases from 5 per cent for a primary diploma to l9 per cent for having some tertiary studies. By contrast, the wage premium for increased education is highest in the Lao People’s Democratic Republic, where completing a primary degree can expect to boost hourly wages by 47 per cent, holding a secondary degree raises it by around 55 per cent and having some tertiary education increases it by more than 150 per cent. Given the generally low value nature of the industry in Asia, it is unsurprising that the wage differential for employees with a primary degree vis-à-vis those with less than a completed primary education is merely around 5 per cent or less in six of the nine countries. In Bangladesh and Cambodia, in fact, the wage premium exceeds 5 per cent only when having completed an upper secondary education. At the other end, however, the sizeable reward for tertiary education exceeds 40 per cent in six of the nine country samples and could signal the high demand for qualified workers to fill managerial and technical positions that are better paid. It is worth noting that education attainment itself can reflect other variables not controlled for explicitly in the model such as household wealth or education attainment of the employee’s parents, which would likely show a positive association with hourly earnings. As such, the wage premiums given in panel D may be biased upwards to some extent. Nonetheless, the results are statistically significant. Overall, they provide empirical evidence that the GTF sector has generally required workers with minimal education in its low-value production process. As such, it offers limited career prospects for better paid jobs without completing upper secondary or tertiary schooling.
4.4 Decomposition of the gender pay gap
Having examined the gender wage disparity in the GTF industry for each of the nine country samples, this section investigates further the factors that drive the observed earnings gap through the standard Blinder-Oaxaca decomposition method. It presents the portion that can be explained by differences in relative endowments vis-à-vis those that are unexplained due to factors that are not fully captured in the model and could be partly a result of gender discrimination.
9 While the results show a positive and statistically significant correlation between education and earnings overall, a few counterintuitive cases include the lower than expected wage premiums for a primary degree in Cambodia, an upper secondary education in the Lao People’s Democratic Republic and Thailand, and tertiary studies in the Philippines.

Regional Office for Asia and the Pacific 15
Figure 4. Blinder-Oaxaca decomposition of gender pa y gap (per cent)
Source: Annex table A3.
Figure 4 presents the decomposition of the gender pay gap for each of the nine country samples. Looking first at the portion of the gender pay gap that can be explained as a result of relative endowments alone, men would theoretically earn more than women in each case except in India. In Bangladesh and Cambodia, where relative endowments are more even, men would expect to earn respectively around 4 per cent and 2 per cent more than women if relative returns are ignored. By comparison, in Indonesia, the Lao People’s Democratic Republic, the Philippines and Viet Nam, the expected earnings differential due to factors that can be explained ranges from 7 per cent to 11 per cent. Male-female gaps in terms of endowments are the largest in Pakistan and Thailand and would result in a wage gap of more than 16 per cent in both samples. These results across each country sample are a reflection of the overall advantage male employees in the GTF industry have in terms of the composite factors discussed above. The lone exception is India where relative endowments would tend to favour women. In regard to the portion that is unexplained (and could partly reflect discrimination), the share is around 39 per cent in India and 48 per cent in Pakistan, representing the largest absolute gaps due to relative returns. As a percentage of the total raw pay gap, these unexplained factors account for 113 per cent in India and 75 per cent in Pakistan. Likewise, in Cambodia, around 75 per cent of the pay gap is unexplained although the raw pay gap is significantly lower. By comparison, the relative portion of the raw wage gap that is unexplained in the Philippines and Viet Nam is nearly 60 per cent but less than 28 per cent in Thailand. In five of these six countries (exclusive of India) the results indicate that differences in relative endowments would tend to favour men over women to varying degrees, but the additional gap due to relative returns increases the pay gap substantially to the further disadvantage of women. In addition to possible discrimination, the unexplained part of the gap can include reasons that have a negative correlation with women’s earnings but cannot be explicitly controlled for in the model. This could include, for instance, time outside the labour market due to family and domestic responsibilities.
-20%
-10%
0%
10%
20%
30%
40%
50%
60%
70%
Bangladesh Lao PDR Indonesia Cambodia Viet Nam Philippines Thailand India Pakistan
Explained Unexplained Male-female pay gap

16 Regional Office for Asia and the Pacific
In Bangladesh, Indonesia and the Lao People’s Democratic Republic, differences in relative endowments (or the part that can be explained) would tend to favour men over women. However, the disparity in relative returns (or the part that is unexplained) would tend to advantage women over men. As a result, in Indonesia and the Lao People’s Democratic Republic, the unexplained portion (around 1 per cent and 7 per cent, respectively) decreases the pay gap between men and women that would theoretically exist as a result of differences in relative endowments alone. In Bangladesh, the unexplained component (approximately 14 per cent to the advantage of women) outweighs the part due to relative endowments that favours men and thus produces a raw gap that benefits women over men. It is worth noting again that the pay gap due to relative returns can result from variables which cannot be captured in the model. In these cases where the unexplained gap disadvantages men relative to women, factors not controlled for in the model such as cognitive and non-cognitive skills, attrition rates, firm size, union membership and collective bargaining could have a significant impact on earnings. Future surveys that include such data would allow for further analysis and understanding of these dynamics. Annex table A3 presents further details of the wage gap decomposition by the effects of specific factors. Factors that indicate a positive effect tend to increase in the male-female wage differential. By contrast, the gap between male and female earnings is reduced by those factors that are presented with a negative effect. As an illustration, in Pakistan, education, locality and occupation all tend to worsen the gender gap at the expense of women while age, marital status and industry have the opposite effect of lessening the pay differential. Moreover, the largest effect in the Pakistan sample is driven overall by occupation, followed by education. Examining the impact of different variables on the overall pay gap, a few important observations can be highlighted. First, occupation is a key determinant in the majority of the samples. Occupational segregation accounts for 5–11 percentage points of the explained portion of the wage gap in Indonesia, the Lao People’s Democratic Republic, Pakistan, Thailand and Viet Nam as women tend to work in lower paid occupations. Moreover, the lower relative returns that women receive within occupations significantly boost the pay gap further in seven of the nine cases. On the other hand, in India and Indonesia, the relative returns for women are higher within occupations and this helps to mitigate the pay differential overall. Clearly, there is a large effect on the pay gap due to the unexplained portion related to occupation, which could point to forms of discrimination along gender lines. By comparison, segregation by industry is generally less prominent than by occupation (aside from Bangladesh, India and the Lao People’s Democratic Republic) but sizeable in some cases nonetheless. In the Philippines, for instance, industry-level segregation contributes 4 percentage points to the explained portion of the wage gap plus an additional 15 percentage points due to the relatively higher returns that men receive within industries. In other words, Filipino women tend to be segregated into industries where the average wages are lower, but within industries they also receive lower pay than men. By contrast, in the Lao People’s Democratic Republic and Pakistan the industry variable has the opposite effect and instead reduces the male-female differential in wages. In both cases, women tend to be concentrated in industries with slightly higher average wages, and also receive higher pay than men within industries.

Regional Office for Asia and the Pacific 17
Differences in education endowments increase the gender pay gap in all nine samples – ranging from just 1 percentage point in Cambodia, India, the Philippines and Viet Nam to 16 percentage points in the Lao People’s Democratic Republic – indicating the comparably higher education levels of men. However, in a slight majority of the cases (namely Bangladesh, Cambodia, India, the Lao’s People Democratic Republic and Thailand), relative returns to women tend to be higher than men for a given education level, and the resulting effect is a lessening of the male-female pay disparity. This is an important finding which highlights the potential of increased education for reducing the gender pay gap in the GTF industry. Similarly, the effect of experience on the gender earnings disparity is significant. In Cambodia, Indonesia and Viet Nam, very little difference exists between men and women in terms of average levels of experience, and this is consequently reflected in no or little contribution to the explained portion of the wage gap. However, the relative returns for a given experience level are substantially higher for women than men in Cambodia and Indonesia, where they help to reduce the unexplained portion of the male-female wage differential by 19 percentage points and 11 percentage points, respectively. In Viet Nam, by contrast, the higher relative returns for men (31 percentage points of the unexplained portion) have a considerable effect on raising the overall pay gap. Given the availability of results on the effect of experience for only three country cases, however, drawing any broad conclusions should be done cautiously. In addition, age undoubtedly is a key factor in determining wages in the vast majority of the country samples, but the effects are primarily due to the unexplained contribution to the pay gap as result of the relative returns between women and men. Moreover, the direction of the relative returns are not consistent for all nine cases, with six exhibiting higher returns for men and resulting in an increase in the gender pay gap in Cambodia, India, Indonesia, the Lao People’s Democratic Republic, the Philippines and Viet Nam. In these cases, the results could reflect the possibility of workplace discrimination such as the faster promotion of men over women into positions of higher rank and pay, but other dynamics may also be playing a role. Clearly, further examination of the relationship between age and the male-female wage gap is warranted.
4.5 Gender differences in low pay rates
As outlined earlier, the garment industry in developing Asia is characterized by long hours and low wages. This section investigates the low-wage dynamics in the industry and the extent that gender differences shape the chances of being a low-paid wage earner. Applying the international definition of low pay, or a threshold of 2/3 of median hourly earnings, figure 5 (panel A) presents low pay rates by sex for the GTF industry in the nine developing economies under analysis.10 The share of workers earning low pay ranges considerably. On the low end, it is approximately 11–13 per cent in four of the nine countries – Bangladesh, Cambodia, the Lao People’s Democratic Republic and Viet Nam. In comparison, the low pay rate is about 20 per cent in Pakistan and Thailand and clusters around 25 per cent in India, Indonesia and the Philippines.
10 Due to survey data limitations, a low pay definition of 2/3 of median daily earnings is applied to the India dataset. For further discussion on measuring the low pay rate, please see: ILO, 2012.

18 Regional Office for Asia and the Pacific
Figure 5. Low pay rate (less than 2/3 of median hou rly earnings) Panel A. Share of employees earning low pay by sex (p er cent)
Panel B. Probability of being a low-paid employee for women relative to men
Note: Low pay defined as less than 2/3 of median hourly earnings, except India (median daily earnings). The raw probability indicates the relative odds between women and men of being a low-paid employee while controlling for only sex, and the adjusted probability controls for all independent variables including sex, age, marital status, education, experience, sub-national area, economic sector and occupation. A value of 1 indicates an equal likelihood of being a low-paid employee. Source: Same as Annex table A4.
When looking at the gender dimension of low pay in the industry, a few notable findings are evident. In only a few countries does the low pay rate for men exceed that for women, with the difference ranging from only 1.8 percentage points in Cambodia to 4.8 percentage points in Bangladesh and 7.9 percentage points in the Lao People’s Democratic Republic. By contrast, in a majority of the cases (or six of nine countries), the low pay rate for women is greater than that for men. Notably, the share for women is higher by 46.5 percentage points in Pakistan and 19.7 percentage points in India. In both the Philippines and Thailand, the gender gap is around 13–14 percentage points higher for women. Overall, the low
0%
10%
20%
30%
40%
50%
60%
Bangladesh Cambodia India Indonesia Lao PDR Pakistan Philippines Thailand Viet Nam
Male Female Total
0
1
2
3
4
5
6
7
8
9
10
11
Bangladesh Lao PDR Cambodia Indonesia Thailand Philippines Viet Nam Pakistan India
Raw Adjusted

Regional Office for Asia and the Pacific 19
pay rate for women is the highest in Pakistan (57.6 per cent) and India (39.9 per cent) and exceeds one-quarter in both Indonesia and the Philippines. Figure 5 (panel B) helps illustrate the comparative disadvantage that women face in the GTF industry in regard to being a low-paid employee. Utilizing standard logistic regressions, it reveals the probability for a female wage earner to receive low pay relative to her male counterpart.11 The raw probability ratio controls for only differences in sex, while the adjusted ratio factors in all the predictor variables including sex, age, marital status, experience, education, geographic locality, subsector and occupation. Based on the adjusted odds ratio, women are more likely than men to earn low wages in five of the nine countries. Notably, Indian women employees are nearly nine times as likely to be low-paid in the sector, and the comparable ratio is more than eight times in Pakistan. In both the Philippines and Viet Nam, women wage earners in the garment sector have more than double the odds of earning low pay than men.
11 See Annex table A4 for full logistic regression results.

20 Regional Office for Asia and the Pacific
5. Conclusion
The analysis presented in this study provides new insights into the GTF industry in nine different countries in Asia, with the aim of providing empirical evidence for promoting greater gender equality in terms of pay and working conditions. The industry in the developing economies of South Asia and South-East Asia remains primarily a high-volume, low-cost production base where long working hours and low pay are the norm. In the majority of the studied cases, average weekly hours of work exceed 48 hours, the international standard for defining excessive working time. Overall, average wages are less than US$1 an hour for both men and women in the vast majority of the countries examined.12 With the exception of non-tertiary educated employees in Bangladesh, hourly pay for women is consistently less than that for men although the magnitude of the disparity varies widely. For example, in Pakistan and India, where the gender wage differential is by far the largest across the nine country cases, the women in the samples earn 65 per cent and 35 per cent less than men, respectively. Controlling for variables such as age, marital status, education, geographic location, industry and occupation yields an adjusted pay gap of 39 per cent in India and 48 per cent in Pakistan. In Cambodia, the Philippines, Thailand and Viet Nam, the adjusted pay differential is significantly lower, ranging from 7 per cent to 11 per cent. By contrast, women in the Bangladesh sample earn more than men on an hourly basis, resulting from the high number of male observations working long hours for little pay or possibly due to overreporting of working hours by male survey respondents. Furthermore, compared to the economy as a whole, the adjusted male-female earnings gap is lower in the garment industry except in only Cambodia, India and Pakistan. This could indicate an encouraging trend in which wage setting mechanisms and anti-discrimination measures may be stronger in the garment sector relative to the broader economy. The determinants of wages are examined and show mixed results in regard to the returns on job experience. For two of the three samples for which an experience variable is captured in the survey data, namely Indonesia and Viet Nam, experience is positively correlated with hourly pay. In Indonesia, an employee with between one year and less than five years of job experience could expect to earn 25 per cent more than her counterpart with less one year of experience. For five years to less than ten years of experience, the wage premium is 28 per cent and reaches 43 per cent for ten or more years of experience. Likewise, the returns on job experience in Viet Nam reveal a similar pattern although the wage premium at each level is somewhat lower. By contrast, in Cambodia, workers with between one year and less than ten years of experience with that particular employer enjoy a wage premium of around only 6 per cent. Moreover, a wage earner with ten or more years of experience in Cambodia can expect a wage penalty of around 5 per cent compared to a new recruit with less than one year of job tenure (while controlling for all other independent variables). This is a significant finding with implications for improved compensation schemes in the industry, especially where attrition rates may be high and labour shortages are reportedly widespread at the high-skilled managerial and technical levels. The results also point to the value of
12 Based on applying nominal exchange rates from World Bank, 2015.

Regional Office for Asia and the Pacific 21
better understanding the relationship between experience and wages and importance of including data on work experience in surveys where they are not collected. In addition, education is observed to be an important determinant of wages in all nine country samples. Examining the returns on education at different levels reveals significant benefits to having higher educational credentials. However, in six of the nine samples, the wage premium for those with a primary degree vis-à-vis employees with no education or incomplete primary studies is around 5 per cent or less. This may signify the overall low-skilled nature of garment production in the region, and the limits that the knowledge and skills acquired at the primary education level are recognized and rewarded in the industry. It may also reflect the extensive availability of surplus labour with relatively low education levels. By contrast, sizeable wage premiums are observed for tertiary-educated employees in all nine samples, ranging from 19 per cent in Viet Nam to 152 per cent in the Lao People’s Democratic Republic. These better wages clearly reflect a strong demand for workers with the skills and competencies acquired through higher education, and provides evidence for promoting higher education among workers and jobseekers in the industry. In a few of the countries investigated, in particular Cambodia, the Lao People’s Democratic Republic and Thailand, industry barriers still exist for being married. In the latter two cases separate regressions by sex indicate a marriage wage penalty for women employees only. Likewise, in Pakistan, a marriage wage penalty of 3 per cent is found for women, while married men receive a wage premium of 4 per cent. Where labour shortages in a female-dominated industry may be prevalent, attractive human resource policies are key in addition to eliminating gender wage discrimination. In this regard, policies that promote a stronger work-life balance in the industry are critical. This would encourage a mostly female workforce to contribute to the growth of the industry while still meeting family commitments such as care work. To this end, reducing excessive working hours, providing paid and adequate maternity and family leave and allowing part-time work arrangements, among other measures, could be effective. Furthermore, a decomposition of the wage gap is presented utilizing the standard Blinder-Oaxaca method. The results provide the portion of the gap that can be explained due to relative endowments and the other part that is due to relative returns (and cannot be explained). As regards to education, in five of the nine samples – namely Bangladesh, Cambodia, India, the Lao’s People Democratic Republic and Thailand – relative returns to women tend to be significantly higher than men for a given education level. Consequently, this has the resulting effect of mitigating the overall male-female pay disparity. This is an important finding as it underscores the potential in some cases where better education for women can help reduce the gender pay gap in the industry overall. The pay gap decomposition also shows that the concentration of women and men across occupations has a significant effect on the overall gender pay gap. Occupational segregation within the industry tends to advantage men over women in all nine samples, with men generally more concentrated in higher paid occupations. This result points to the need for industry-wide policies that would help foster opportunities for women in occupations that are typically male-dominated in order to lessen the male-female wage disparity. In addition, the occupational effects on the gender pay gap in terms of relative returns varies across the nine samples, but generally the results are substantial. In every case aside from Indonesia and India, the higher wages for men compared to women within a given occupation (while controlling for all other independent variables) contributes considerably to exacerbating the gender pay

22 Regional Office for Asia and the Pacific
gap. Deeper examination of these unexplained occupational effects on the wage gap would be instructive to better assess the extent that discrimination within occupations may be prevalent. The pay gap decomposition exercise also reveals the importance of age in influencing wage levels and the overall wage gap. Given the relatively similar average age between women and men in each of the nine samples, the bulk of the effect of age on the wage gap is due to relative returns and this tends to worsen the gender wage disparity at the expense of women in six of the nine samples. In these six cases, this could be a sign of discrimination that disadvantages women in favour of men for job promotions, but could also reflect differences in actual years of work experience and time away from work (for example, due to child bearing and other domestic priorities). In this regard, the results in Cambodia, Indonesia and Viet Nam are insightful given that a variable on job experience is included in the model. Although these three surveys capture only the years of experience in that particular job for that employer (as opposed to the years of experience during the employee’s entire career), the results show that when including controls for job experience, the unexplained effect of age on exacerbating the pay gap remains extensive, ranging from 14 percentage points in Viet Nam to approximately 70 percentage points in Cambodia and Indonesia. While this study highlights a number of empirical findings that can support policies that help to promote gender equality in Asia’s GTF industry, it also reveals areas for further analysis. First, a sizeable part of the pay gap can be attributed to unknown variables that have not been fully controlled for in the model (as partly exhibited by the “Other” category in Annex table A3), given limitations of the survey data that are employed for the exercise. Other variables of interest – such as work experience (for the samples where it is omitted), time out of work (for child rearing for example), recent on-the-job training, cognitive and non-cognitive skills, unionization, collective bargaining, firm size, migration status and other factors – can help to provide a more robust basis for assessing gender-based pay dynamics in the industry. In addition, for the majority of the countries studied, the GTF industry remains a vibrant contributor to the economy and accounts for a sizeable workforce. Given constant changes within the industry, it is critical to conduct this type of analysis on a recurring basis to monitor progress made towards greater gender equality. To this end, the regular production and timely availability of robust labour force survey data is fundamental particularly in countries where such surveys are conducted only irregularly.

Regional Office for Asia and the Pacific 23
References
Abras, A.L.G. 2012. “Success and upgrading after the end of the MFA”, in G. Lopez-Acevedo and R. Robertson (eds): Sewing success? Employment, wages, and poverty following the end of the Multi-fibre Arrangement (Washington, DC, World Bank), pp. 87–135. Absar, S. 2001. “Problems surrounding wages: The ready made garments sector in Bangladesh” in Labour and Management in Development Journal, Vol. 2, No. 7, pp. 2-17. Akram, S.; Kashmir, K.A. 2015. “Gender dimensions in textiles and clothing sector of Pakistan”, in Basic Research Journal of Business Management and Accounts, Vol. 4, No. 1, pp. 25-30. Asuyama, Y. et al. 2010. Firm dynamics in the Cambodian garment industry: Firm turnover,
productivity growth, and wage profile under trade liberalization, IDE Discussion Paper No. 268 (Chiba, Institute of Developing Economies). Better Work. 2012. Indonesia: Baseline report: Worker perspective from the factory and beyond
(Geneva, ILO). Chaudhary, R.; Verick, S. 2014. Female labour force participation in India and beyond, ILO Asia-Pacific Working Paper Series (New Delhi, ILO). China National Bureau of Statistics and Ministry of Human Resources and Social Security. 2014. China Labour Statistical Yearbook (Beijing). El-Haddad, A. 2011. Female wages in the Egyptian textiles and clothing industry: Low pay or discrimination, Working Paper Series No. 633 (Cairo, The Economic Research Forum). Elvira, M.; Saporta, I. 2001. “How does collective bargaining affect the gender pay gap”, in Work and
Occupations, Vol. 28, No. 4, pp. 469–490. Fontana, M.; Silberman, A. 2013. Analysing better work data from a gender perspective: A preliminary exploration of worker surveys with a focus on Vietnam, Better Work Discussion Paper Series No. 13 (Geneva, ILO). Fukunishi, T.; Yamagata, T. 2013. Employment and wages in export-oriented garment industry: Recent trends in low-income countries under trade liberalization (Chiba, Institute of Developing Economies). Huynh, P. 2015. Working conditions in Asia’s garment sector: Finding new drivers of competitiveness, ILO Asia-Pacific Working Paper Series (Bangkok, ILO). ILO. 2015. Strong export and job growth in Asia’s garment and footwear sector, Asia-Pacific Garment and Footwear Sector Research Note, Issue 1 (Bangkok). ILO. 2014. Wages in Asia and the Pacific: Dynamic but uneven progress (Bangkok).

24 Regional Office for Asia and the Pacific
—. 2012. Decent Work Indicators: Concepts and definitions (Geneva, ILO). Kapsos, S. 2008. The gender wage gap in Bangladesh, ILO Asia-Pacific Working Paper Series (Bangkok, ILO). Keane, J.; te Velde, D.W. 2008. The role of textile and clothing industries in growth and development strategies (London, Overseas Development Institute). Kunze, A. 2000. The determination of wages and the gender wage gap: A survey, IZA Discussion Paper No. 193 (Bonn, Institute for the Study of Labour). Mincer, J. 1974. Schooling, experience, and earnings (Cambridge, MA, National Bureau of Economic Research). Oaxaca, R. 1973. “Male-female wage differentials in urban labor markets”, in International Economic
Review, Vol. 14, pp. 693–709. Oaxaca, R.; Ranson, M. 1994. “On discrimination and the decomposition of wage differentials”, in Journal of Econometrics, Vol. 61, Issue 1, pp. 5-21. Paul-Majumder, P.; Begum, A. 2000. The gender imbalances in the export oriented garment industry
in Bangladesh, Policy Research Report on Gender and Development Working Paper Series No. 12 (Washington, DC, World Bank). Paul-Majumder, P.; Chaudhuri-Zohir, S. 1993. Employment and occupational mobility among women
in manufacturing industries of Dhaka City: Findings from a survey of employees (New Delhi, ILO). Record, R.; Kuttner, S.; Phouxay, K. 2012. Labour practices and productivity in the Lao garments sector: Perspectives from managers and workers, Better Work Discussion Paper Series No. 8 (Geneva, ILO and IFC). Robertson, R. 2011. Apparel wages before and after Better Factories Cambodia, Better Work Discussion Paper Series No. 3 (Geneva, ILO). Savchenko, Y. 2012. “The rise of small Asian economies in the apparel industry”, in G. Lopez-Acevedo and R. Robertson (eds.), pp. 163-196. Sundaram, J.K. 2009. “Export-oriented industrialisation, female employment and gender wage equality in East Asia”, in Economic and Political Weekly, Vol. 44, No. 1, pp. 41-49. United Nations. 2015. Transforming our world: The 2030 agenda for sustainable development (New York). World Bank. 2015. World Development Indicators (Washington, DC).

Regional Office for Asia and the Pacific 25
Annex
Table A1. Summary statistics, full weighted samples
Bangladesh (2013) Cambodia (2012) India (2011/12)
Males (N=2,018,507)
Females (N=2,336,365)
Males (N=122,973)
Females (N=517,191)
Males (N=4,022,315)
Females (N=935,269)
Mean Std. Dev. Mean
Std. Dev. Mean
Std. Dev. Mean
Std. Dev. Mean
Std. Dev. Mean
Std. Dev.
Hourly wage (LCU)
54.8
48.3
59.0
44.8
2,286
3,291
1,847
1,919
217.6
181.1
141.2
74.8
Age
30.3
11.0
26.6
9.5
24.8
6.5
24.5
7.4
32.4
10.7
28.5
9.9
Average weekly hours
54.3
8.5
49.2
8.1
52.9
10.0
52.9
8.9 n.a. n.a. n.a. n.a.
Urban
0.46
0.50
0.40
0.49
0.20
0.40
0.17
0.38
0.77
0.42
0.59
0.49
Rural
0.54
0.50
0.60
0.49
0.80
0.40
0.83
0.38
0.23
0.42
0.41
0.49
Not married
0.30
0.46
0.28
0.45
0.66
0.47
0.70
0.46
0.31
0.46
0.57
0.50
Married
0.70
0.46
0.72
0.45
0.34
0.47
0.30
0.46
0.69
0.46
0.43
0.50
Less than primary
0.04
0.19
0.04
0.20
0.23
0.42
0.42
0.49
0.23
0.42
0.21
0.41
Completed primary
0.29
0.45
0.28
0.45
0.40
0.49
0.39
0.49
0.40
0.49
0.46
0.50
Completed lower secondary
0.44
0.50
0.53
0.50
0.27
0.44
0.16
0.36
0.18
0.38
0.15
0.35
Completed upper secondary
0.16
0.36
0.12
0.32
0.09
0.29
0.04
0.19
0.10
0.30
0.13
0.34
Tertiary (first stage or completed)
0.08
0.27
0.03
0.16
0.00
0.07
0.00
0.02
0.09
0.28
0.05
0.22
Job experience: Less than 1 year n.a. n.a. n.a. n.a.
0.29
0.45
0.25
0.43 n.a. n.a. n.a. n.a.
Job experience: 1 year to less than 5 years n.a. n.a. n.a. n.a.
0.60
0.49
0.61
0.49 n.a. n.a. n.a. n.a.
Job experience: 5 years to less than 10 years n.a. n.a. n.a. n.a.
0.05
0.23
0.10
0.30 n.a. n.a. n.a. n.a.
Job experience: 10 years or more n.a. n.a. n.a. n.a.
0.06
0.23
0.04
0.20 n.a. n.a. n.a. n.a.
Industry: Textiles
0.38
0.49
0.29
0.46
0.05
0.23
0.04
0.20
0.50
0.50
0.41
0.49
Industry: Garments
0.60
0.49
0.70
0.46
0.82
0.38
0.88
0.33
0.36
0.48
0.45
0.50
Industry: Luggage, handbags, footwear, etc.
0.02
0.15
0.00
0.06
0.12
0.33
0.08
0.27
0.14
0.34
0.15
0.35
Indonesia (2014) Lao PDR (2010) Pakistan (2012/13)
Males (N=1,287,261)
Females (N=1,654,304)
Males (N=3,450)
Females (N=10,375)
Males (N=1,881,675)
Females (N=416,295)
Mean Std. Dev.
Mean Std. Dev.
Mean Std. Dev.
Mean Std. Dev.
Mean Std. Dev.
Mean Std. Dev.
Hourly wage (LCU)
8,018
8,894
7,189
6,237
4,762
5,902
3,738
2,062
67.2
479.6
30.4
42.4
Age
32.7
10.4
31.0
9.6
32.1
13.2
26.0
7.5
31.1
11.8
29.2
10.4
Average weekly hours
47.1
8.1
44.9
9.0
54.0
11.1
51.0
10.5
53.3
9.5
35.7
12.3
Urban
0.82
0.38
0.77
0.42
0.84
0.36
0.63
0.48
0.80
0.40
0.52
0.50
Rural
0.18
0.38
0.23
0.42
0.16
0.36
0.37
0.48
0.20
0.40
0.48
0.50
Not married
0.40
0.49
0.36
0.48
0.49
0.50
0.69
0.46
0.45
0.50
0.48
0.50
Married
0.60
0.49
0.64
0.48
0.51
0.50
0.31
0.46
0.55
0.50
0.52
0.50
Less than primary
0.03
0.18
0.05
0.21
0.02
0.16
-
-
0.29
0.46
0.54
0.50
Completed primary
0.19
0.39
0.21
0.40
0.17
0.37
0.31
0.46
0.38
0.48
0.33
0.47
Completed lower secondary
0.28
0.45
0.34
0.47
0.36
0.48
0.36
0.48
0.19
0.39
0.10
0.30
Completed upper secondary
0.47
0.50
0.38
0.49
0.31
0.46
0.30
0.46
0.07
0.26
0.02
0.13
Tertiary (first stage or completed)
0.04
0.19
0.03
0.16
0.14
0.35
0.02
0.13
0.06
0.24
0.01
0.09
Job experience: Less than 1 year
0.11
0.31
0.13
0.33 n.a. n.a. n.a. n.a. n.a. n.a. n.a. n.a.
Job experience: 1 year to less than 5 years
0.42
0.49
0.49
0.50 n.a. n.a. n.a. n.a. n.a. n.a. n.a. n.a.
Job experience: 5 years to less than 10 years
0.19
0.39
0.15
0.36 n.a. n.a. n.a. n.a. n.a. n.a. n.a. n.a.

26 Regional Office for Asia and the Pacific
Job experience: 10 years or more
0.28
0.45
0.24
0.42 n.a. n.a. n.a. n.a. n.a. n.a. n.a. n.a.
Industry: Textiles
0.43
0.50
0.31
0.46
0.05
0.22
0.06
0.25
0.53
0.50
0.28
0.45
Industry: Garments
0.35
0.48
0.50
0.50
0.81
0.39
0.92
0.26
0.40
0.49
0.69
0.46
Industry: Luggage, handbags, footwear, etc.
0.22
0.41
0.20
0.40
0.14
0.34
0.01
0.10
0.07
0.26
0.03
0.18
Philippines (2013) Thailand (2013) Viet Nam (2013)
Males (N=127,276)
Females (N=284,735)
Males (N=143,102)
Females (N=418,413)
Males (N=485,554)
Females (N=1,562,753)
Mean
Std. Dev. Mean
Std. Dev. Mean
Std. Dev. Mean
Std. Dev. Mean
Std. Dev. Mean
Std. Dev.
Hourly wage (LCU)
40.5
19.1
34.6
23.0
48.6
31.3
37.2
24.3
20,118
11,575
17,074
7,652
Age
34.0
12.1
37.7
11.4
35.1
10.0
37.3
10.6
30.6
9.8
30.4
8.9
Average weekly hours
48.8
13.0
45.9
13.9
50.9
7.2
49.8
8.5
51.0
8.3
50.5
8.7
Urban
0.82
0.38
0.79
0.41 n.a. n.a. n.a. n.a.
0.47
0.50
0.41
0.49
Rural
0.18
0.38
0.21
0.41 n.a. n.a. n.a. n.a.
0.53
0.50
0.59
0.49
Not married
0.34
0.47
0.40
0.49
0.28
0.45
0.30
0.46
0.43
0.50
0.32
0.47
Married
0.66
0.47
0.60
0.49
0.72
0.45
0.70
0.46
0.57
0.50
0.68
0.47
Less than primary
0.06
0.24
0.05
0.23
0.11
0.31
0.15
0.36
0.05
0.21
0.06
0.24
Completed primary
0.17
0.37
0.23
0.42
0.23
0.42
0.35
0.48
0.16
0.36
0.20
0.40
Completed lower secondary
0.03
0.16
0.05
0.21
0.28
0.45
0.26
0.44
0.39
0.49
0.45
0.50
Completed upper secondary
0.55
0.50
0.48
0.50
0.23
0.42
0.14
0.35
0.32
0.47
0.25
0.43
Tertiary (first stage or completed)
0.19
0.39
0.19
0.39
0.14
0.34
0.10
0.30
0.08
0.28
0.04
0.19
Job experience: Less than 1 year n.a. n.a. n.a. n.a. n.a. n.a. n.a. n.a.
0.14
0.35
0.14
0.34
Job experience: 1 year to less than 5 years n.a. n.a. n.a. n.a. n.a. n.a. n.a. n.a.
0.61
0.49
0.59
0.49
Job experience: 5 years to less than 10 years n.a. n.a. n.a. n.a. n.a. n.a. n.a. n.a.
0.17
0.37
0.19
0.40
Job experience: 10 years or more n.a. n.a. n.a. n.a. n.a. n.a. n.a. n.a.
0.09
0.28
0.08
0.27
Industry: Textiles
0.14
0.34
0.11
0.32
0.42
0.49
0.26
0.44
0.14
0.35
0.09
0.28
Industry: Garments
0.64
0.48
0.76
0.43
0.40
0.49
0.58
0.49
0.47
0.50
0.56
0.50
Industry: Luggage, handbags, footwear, etc.
0.22
0.41
0.12
0.33
0.18
0.39
0.16
0.36
0.39
0.49
0.35
0.48
Note: “n.a.” indicates variable is not included in the dataset. India wage data represent estimated daily earnings. Source: Author’s calculations based on Bangladesh Labour Force Survey (2013), Cambodia Labour Force Survey (2012), India National Sample Survey (2011/12), Indonesia Labour Force Survey (Aug. 2014), Lao People’s Democratic Republic Labour Force Survey (2010), Pakistan Labour Force Survey (2012/13), Philippines Labour Force Survey (Oct. 2013), Thailand Labour Force Survey (Quarter 3, 2013), Viet Nam Labour Force Survey (2013).

Regional Office for Asia and the Pacific 27
Table A2. Mincer regression results with earnings a s dependent variable, full weighted samples 1. Bangladesh
(1) (2) Eq.1+
age
(3) Eq.2+
marital status
(4) Eq.3+
education
(5) Eq.4+
urban-rural
(6) Eq.5+
district
(7) Eq.6+
industry
(8) Eq.7+
occupa-tion
Female dummy 0.104 0.131 0.123 0.146 0.146 0.140 0.146 0.144 (0.000)** (0.000)** (0.000)** (0.000)** (0.000)** (0.000)** (0.000)** (0.000)** Age 0.019 0.013 0.009 0.009 0.009 0.010 0.008 (0.000)** (0.000)** (0.000)** (0.000)** (0.000)** (0.000)** (0.000)** Age2 -0.019 -0.012 -0.007 -0.007 -0.007 -0.008 -0.006 (0.000)** (0.000)** (0.000)** (0.000)** (0.000)** (0.000)** (0.000)** Married dummy 0.073 0.085 0.084 0.090 0.088 0.079 (0.000)** (0.000)** (0.000)** (0.000)** (0.000)** (0.000)** Primary education dummy -0.009 -0.004 -0.010 -0.020 0.004 (0.001)** (0.001)** (0.001)** (0.001)** (0.001)** Lower secondary dummy 0.010 0.015 0.011 0.006 0.024 (0.001)** (0.001)** (0.001)** (0.001)** (0.001)** Upper secondary dummy 0.117 0.122 0.108 0.098 0.116 (0.001)** (0.001)** (0.001)** (0.001)** (0.001)** Tertiary education dummy 0.470 0.480 0.472 0.462 0.434 (0.001)** (0.001)** (0.001)** (0.001)** (0.001)** Rural dummy 0.014 0.022 0.030 0.037 (0.000)** (0.000)** (0.000)** (0.000)** Constant 3.898 3.508 3.570 3.587 3.571 3.521 3.396 3.740 (0.000)** (0.001)** (0.001)** (0.002)** (0.002)** (0.004)** (0.005)** (0.006)** R2 0.02 0.05 0.06 0.14 0.14 0.18 0.19 0.30 N 4,322,332 4,322,332 4,322,332 4,322,332 4,322,332 4,322,332 4,322,332 4,322,332
2. Cambodia
(1) (2) Eq.1+ age
(3) Eq.2+
marital status
(4) Eq.3+
experi-ence
(5) Eq.4+
educa-tion
(6) Eq.5+
urban-rural
(7) Eq.6+ province
(8) Eq.7+ industry
(9) Eq.8+
occupa-tion
Female dummy -0.088 -0.072 -0.072 -0.077 -0.063 -0.064 -0.053 -0.059 -0.066 (0.002)** (0.002)** (0.002)** (0.002)** (0.002)** (0.002)** (0.002)** (0.002)** (0.002)** Age 0.058 0.063 0.059 0.056 0.051 0.051 0.039 0.037 (0.001)** (0.001)** (0.001)** (0.001)** (0.001)** (0.001)** (0.001)** (0.001)** Age2 -0.099 -0.105 -0.099 -0.093 -0.088 -0.086 -0.060 -0.058 (0.001)** (0.001)** (0.001)** (0.001)** (0.001)** (0.001)** (0.001)** (0.001)** Married dummy -0.051 -0.042 -0.038 -0.059 -0.060 -0.055 -0.063 (0.002)** (0.002)** (0.002)** (0.002)** (0.002)** (0.002)** (0.002)** 1-5 years exp. dummy 0.096 0.101 0.091 0.079 0.071 0.059 (0.002)** (0.002)** (0.002)** (0.002)** (0.002)** (0.002)** 5-10 years exp. dummy 0.082 0.085 0.102 0.090 0.085 0.062 (0.003)** (0.003)** (0.003)** (0.003)** (0.003)** (0.003)** 10+ years exp. dummy 0.008 0.007 0.021 0.010 0.009 -0.054 (0.004)* (0.004)* (0.004)** (0.004)** (0.004)* (0.004)** Primary dummy -0.027 -0.033 -0.009 -0.006 -0.025 (0.002)** (0.002)** (0.002)** (0.002)** (0.002)** Low. secondary dummy 0.020 0.008 0.035 0.039 0.040 (0.002)** (0.002)** (0.002)** (0.002)** (0.002)** Up. secondary dummy 0.168 0.107 0.153 0.157 0.055 (0.003)** (0.003)** (0.003)** (0.003)** (0.003)** Tertiary dummy 0.828 0.856 0.889 0.866 0.526 (0.020)** (0.020)** (0.020)** (0.019)** (0.025)** Rural dummy -0.248 -0.319 -0.332 -0.311 (0.002)** (0.003)** (0.003)** (0.003)** Constant 7.450 6.651 6.584 6.576 6.615 6.909 6.820 6.864 8.058 (0.002)** (0.008)** (0.008)** (0.008)** (0.008)** (0.009)** (0.011)** (0.015)** (0.019)** R2 0.00 0.02 0.02 0.03 0.04 0.06 0.08 0.12 0.19 N 640,163 640,163 640,163 640,163 640,163 640,163 640,163 640,163 640,163

28 Regional Office for Asia and the Pacific
3. India
(1) (2) Eq.1+
age
(3) Eq.2+
marital status
(4) Eq.3+
education
(5) Eq.4+
urban-rural
(6) Eq.5+
state
(7) Eq.6+
industry
(8) Eq.7+
occupa-tion
Female dummy -0.346 -0.278 -0.266 -0.250 -0.221 -0.361 -0.442 -0.391 (0.001)** (0.001)** (0.001)** (0.001)** (0.001)** (0.001)** (0.001)** (0.001)** Age 0.073 0.063 0.054 0.049 0.043 0.041 0.040 (0.000)** (0.000)** (0.000)** (0.000)** (0.000)** (0.000)** (0.000)** Age2 -0.085 -0.074 -0.064 -0.058 -0.049 -0.045 -0.044 (0.000)** (0.000)** (0.000)** (0.000)** (0.000)** (0.000)** (0.000)** Married dummy 0.089 0.115 0.115 0.109 0.130 0.115 (0.001)** (0.001)** (0.001)** (0.001)** (0.001)** (0.001)** Primary education dummy 0.150 0.153 0.051 0.019 0.030 (0.001)** (0.001)** (0.001)** (0.001)** (0.001)** Lower secondary dummy 0.335 0.320 0.188 0.132 0.128 (0.001)** (0.001)** (0.001)** (0.001)** (0.001)** Upper secondary dummy 0.376 0.422 0.254 0.193 0.173 (0.001)** (0.001)** (0.001)** (0.001)** (0.001)** Tertiary education dummy 0.738 0.731 0.652 0.642 0.411 (0.001)** (0.001)** (0.001)** (0.001)** (0.001)** Rural dummy -0.215 -0.150 -0.131 -0.127 (0.001)** (0.001)** (0.001)** (0.001)** Constant 5.193 3.826 3.962 3.875 4.032 4.127 4.261 4.044 (0.000)** (0.002)** (0.002)** (0.002)** (0.002)** (0.003)** (0.003)** (0.020)** R2 0.05 0.15 0.15 0.26 0.29 0.41 0.47 0.54 N 4,957,584 4,957,584 4,957,584 4,957,584 4,957,584 4,957,584 4,957,584 4,957,584
4. Indonesia
(1) (2) Eq.1+
age
(3) Eq.2+
marital status
(4) Eq.3+
experi-ence
(5) Eq.4+
educa-tion
(6) Eq.5+
urban-rural
(7) Eq.6+
province
(8) Eq.7+
industry
(9) Eq.8+
occupa-tion
Female dummy -0.084 -0.079 -0.087 -0.081 -0.039 -0.040 -0.020 -0.023 0.009 (0.001)** (0.001)** (0.001)** (0.001)** (0.001)** (0.001)** (0.001)** (0.001)** (0.001)** Age 0.067 0.057 0.047 0.039 0.040 0.030 0.030 0.030 (0.000)** (0.000)** (0.000)** (0.000)** (0.000)** (0.000)** (0.000)** (0.000)** Age2 -0.088 -0.076 -0.068 -0.051 -0.052 -0.039 -0.038 -0.039 (0.000)** (0.000)** (0.000)** (0.000)** (0.000)** (0.000)** (0.000)** (0.000)** Married dummy 0.100 0.085 0.103 0.098 0.088 0.091 0.078 (0.001)** (0.001)** (0.001)** (0.001)** (0.001)** (0.001)** (0.001)** 1-5 years exp. dummy 0.255 0.259 0.260 0.234 0.236 0.248 (0.001)** (0.001)** (0.001)** (0.001)** (0.001)** (0.001)** 5-10 years exp. dummy 0.266 0.264 0.265 0.266 0.273 0.280 (0.002)** (0.002)** (0.002)** (0.001)** (0.001)** (0.001)** 10+ years exp. dummy 0.354 0.374 0.374 0.416 0.426 0.430 (0.002)** (0.001)** (0.001)** (0.001)** (0.001)** (0.001)** Primary dummy 0.114 0.115 0.087 0.071 0.033 (0.002)** (0.002)** (0.002)** (0.002)** (0.002)** Low. secondary dummy 0.411 0.412 0.366 0.353 0.295 (0.002)** (0.002)** (0.002)** (0.002)** (0.002)** Up. secondary dummy 0.628 0.634 0.595 0.583 0.473 (0.002)** (0.002)** (0.002)** (0.002)** (0.002)** Tertiary dummy 1.165 1.172 1.092 1.076 0.771 (0.003)** (0.003)** (0.003)** (0.003)** (0.003)** Rural dummy 0.037 0.112 0.107 0.119 (0.001)** (0.001)** (0.001)** (0.001)** Constant 8.729 7.563 7.715 7.672 7.258 7.232 6.306 6.326 6.695 (0.001)** (0.004)** (0.004)** (0.004)** (0.004)** (0.004)** (0.023)** (0.023)** (0.026)** R2 0.00 0.04 0.04 0.06 0.17 0.17 0.30 0.30 0.34
N 2,941,56
5 2,941,56
5 2,941,56
5 2,941,56
5 2,941,56
5 2,941,56
5 2,941,56
5 2,941,56
5 2,941,56
5

Regional Office for Asia and the Pacific 29
5. Lao People’s Democratic Republic
(1) (2) Eq.1+
age
(3) Eq.2+
marital status
(4) Eq.3+
education
(5) Eq.4+
urban-rural
(6) Eq.5+
province
(7) Eq.6+
industry
(8) Eq.7+
occupa-tion
Female dummy -0.035 -0.035 -0.052 0.024 0.013 0.020 -0.012 0.071 (0.010)** (0.010)** (0.010)** (0.010)* (0.010) (0.010)* (0.010) (0.011)** Age 0.053 0.059 0.057 0.058 0.057 0.057 0.101 (0.002)** (0.002)** (0.002)** (0.002)** (0.002)** (0.002)** (0.003)** Age2 -0.069 -0.073 -0.073 -0.075 -0.072 -0.075 -0.151 (0.003)** (0.003)** (0.003)** (0.003)** (0.003)** (0.003)** (0.005)** Married dummy -0.171 -0.130 -0.120 -0.128 -0.128 -0.061 (0.009)** (0.009)** (0.009)** (0.009)** (0.009)** (0.008)** Primary education dummy -0.152 -0.167 -0.153 0.087 0.465 (0.057)** (0.057)** (0.057)** (0.071) (0.070)** Lower secondary dummy -0.110 -0.131 -0.111 0.140 0.555 (0.057) (0.057)* (0.057) (0.071)* (0.070)** Upper secondary dummy -0.107 -0.114 -0.106 0.110 0.547 (0.057) (0.057)* (0.057) (0.070) (0.069)** Tertiary education dummy 0.510 0.501 0.516 0.842 1.522 (0.058)** (0.058)** (0.058)** (0.072)** (0.075)** Rural dummy 0.071 0.049 0.032 -0.001 (0.009)** (0.009)** (0.009)** (0.008) Constant 8.157 7.276 7.218 7.302 7.270 7.287 7.388 6.065 (0.008)** (0.034)** (0.034)** (0.058)** (0.058)** (0.058)** (0.057)** (0.078)** R2 0.00 0.05 0.07 0.15 0.15 0.17 0.20 0.49 N 13,912 13,912 13,912 13,912 13,912 13,912 13,912 13,912
6. Pakistan
(1) (2) Eq.1+
age
(3) Eq.2+
marital status
(4) Eq.3+
education
(5) Eq.4+
urban-rural
(6) Eq.5+
industry
(7) Eq.6+
occupa-tion
Female dummy -0.645 -0.624 -0.624 -0.535 -0.519 -0.515 -0.483 (0.001)** (0.001)** (0.001)** (0.001)** (0.001)** (0.001)** (0.001)** Age 0.053 0.052 0.039 0.038 0.038 0.035 (0.000)** (0.000)** (0.000)** (0.000)** (0.000)** (0.000)** Age2 -0.055 -0.054 -0.038 -0.036 -0.036 -0.034 (0.000)** (0.000)** (0.000)** (0.000)** (0.000)** (0.000)** Married dummy 0.007 0.039 0.047 0.048 0.038 (0.001)** (0.001)** (0.001)** (0.001)** (0.001)** Primary education dummy 0.117 0.113 0.113 0.117 (0.001)** (0.001)** (0.001)** (0.001)** Lower secondary dummy 0.193 0.188 0.189 0.168 (0.001)** (0.001)** (0.001)** (0.001)** Upper secondary dummy 0.359 0.355 0.355 0.286 (0.002)** (0.002)** (0.002)** (0.002)** Tertiary education dummy 0.865 0.858 0.854 0.476 (0.002)** (0.002)** (0.002)** (0.003)** Rural dummy -0.062 -0.064 -0.060 (0.001)** (0.001)** (0.001)** Constant 3.723 2.678 2.688 2.743 2.783 2.795 2.525 (0.000)** (0.003)** (0.004)** (0.003)** (0.003)** (0.003)** (0.010)** R2 0.12 0.19 0.19 0.26 0.26 0.26 0.31 N 2,297,970 2,297,970 2,297,970 2,297,970 2,297,970 2,297,970 2,297,970
7. Philippines
(1) (2) Eq.1+
age
(3) Eq.2+
marital status
(4) Eq.3+
education
(5) Eq.4+
urban-rural
(6) Eq.5+
region
(7) Eq.6+
industry
(8) Eq.7+
occupa-tion
Female dummy -0.193 -0.194 -0.197 -0.187 -0.180 -0.167 -0.137 -0.108 (0.002)** (0.002)** (0.002)** (0.002)** (0.002)** (0.002)** (0.002)** (0.002)** Age 0.017 0.019 0.009 0.007 0.003 -0.001 -0.005 (0.000)** (0.000)** (0.000)** (0.000)** (0.000)** (0.000)** (0.000)** Age2 -0.025 -0.027 -0.010 -0.007 -0.002 0.003 0.010 (0.000)** (0.001)** (0.000)** (0.000)** (0.000)** (0.000)** (0.000)** Married dummy -0.026 -0.016 -0.010 -0.017 0.010 0.018 (0.002)** (0.002)** (0.002)** (0.002)** (0.002)** (0.001)** Primary education dummy 0.094 0.096 0.094 0.120 0.115 (0.004)** (0.004)** (0.004)** (0.003)** (0.003)** Lower secondary dummy 0.175 0.206 0.190 0.211 0.227 (0.005)** (0.005)** (0.005)** (0.005)** (0.004)** Upper secondary dummy 0.370 0.366 0.344 0.336 0.338 (0.004)** (0.003)** (0.003)** (0.003)** (0.003)** Tertiary education dummy 0.548 0.531 0.519 0.477 0.315 (0.004)** (0.004)** (0.004)** (0.004)** (0.003)** Rural dummy -0.234 -0.102 -0.086 -0.048 (0.002)** (0.002)** (0.002)** (0.002)** Constant 3.596 3.342 3.322 3.089 3.160 3.011 3.360 5.562 (0.001)** (0.007)** (0.007)** (0.008)** (0.008)** (0.009)** (0.010)** (0.019)** R2 0.03 0.04 0.04 0.13 0.16 0.23 0.32 0.44 N 412,011 412,011 412,011 412,011 412,011 412,011 412,011 412,011

30 Regional Office for Asia and the Pacific
8. Thailand
(1) (2) Eq.1+
age
(3) Eq.2+
marital status
(4) Eq.3+
education
(5) Eq.4+
provinces
(6) Eq.5+
industry
(7) Eq.6+
occupa-tion
Female dummy -0.251 -0.254 -0.255 -0.212 -0.115 -0.107 -0.070 (0.002)** (0.002)** (0.002)** (0.001)** (0.001)** (0.001)** (0.001)** Age 0.053 0.057 0.053 0.033 0.036 0.025 (0.000)** (0.000)** (0.000)** (0.000)** (0.000)** (0.000)** Age2 -0.067 -0.072 -0.059 -0.038 -0.041 -0.029 (0.000)** (0.000)** (0.000)** (0.000)** (0.000)** (0.000)** Married dummy -0.074 -0.043 -0.009 -0.024 -0.015 (0.002)** (0.001)** (0.001)** (0.001)** (0.001)** Primary education dummy 0.054 0.060 0.064 0.043 (0.002)** (0.002)** (0.002)** (0.002)** Lower secondary dummy 0.268 0.214 0.221 0.161 (0.002)** (0.002)** (0.002)** (0.002)** Upper secondary dummy 0.263 0.244 0.242 0.145 (0.003)** (0.002)** (0.002)** (0.002)** Tertiary education dummy 0.746 0.680 0.662 0.281 (0.003)** (0.003)** (0.003)** (0.003)** Constant 3.740 2.766 2.737 2.445 3.016 3.141 4.376 (0.001)** (0.007)** (0.007)** (0.007)** (0.006)** (0.008)** (0.038)** R2 0.04 0.08 0.08 0.22 0.43 0.45 0.55 N 561,514 561,514 561,514 561,514 561,514 561,514 561,514
9. Viet Nam
(1) (2) Eq.1+
age
(3) Eq.2+
marital status
(4) Eq.3+
experi-ence
(5) Eq.4+
educa-tion
(6) Eq.5+
urban-rural
(7) Eq.6+
province
(8) Eq.7+
industry
(9) Eq.8+
occupa-tion
Female dummy -0.166 -0.175 -0.177 -0.178 -0.157 -0.148 -0.117 -0.114 -0.095 (0.001)** (0.001)** (0.001)** (0.001)** (0.001)** (0.001)** (0.001)** (0.001)** (0.001)** Age 0.046 0.044 0.035 0.033 0.029 0.024 0.022 0.018 (0.000)** (0.000)** (0.000)** (0.000)** (0.000)** (0.000)** (0.000)** (0.000)** Age2 -0.065 -0.063 -0.055 -0.052 -0.047 -0.038 -0.034 -0.029 (0.000)** (0.000)** (0.000)** (0.000)** (0.000)** (0.000)** (0.000)** (0.000)** Married dummy 0.017 0.004 0.013 0.025 0.039 0.043 0.038 (0.001)** (0.001)** (0.001)** (0.001)** (0.001)** (0.001)** (0.001)** 1-5 years exp. dummy 0.211 0.215 0.205 0.183 0.182 0.177 (0.001)** (0.001)** (0.001)** (0.001)** (0.001)** (0.001)** 5-10 years exp. dummy 0.320 0.318 0.295 0.264 0.268 0.254 (0.001)** (0.001)** (0.001)** (0.001)** (0.001)** (0.001)** 10+ years exp. dummy 0.377 0.357 0.303 0.308 0.330 0.317 (0.001)** (0.001)** (0.001)** (0.001)** (0.001)** (0.001)** Primary dummy 0.095 0.093 0.079 0.071 0.048 (0.001)** (0.001)** (0.001)** (0.001)** (0.001)** Low. secondary dummy 0.159 0.155 0.173 0.156 0.105 (0.001)** (0.001)** (0.001)** (0.001)** (0.001)** Up. secondary dummy 0.182 0.171 0.220 0.203 0.133 (0.001)** (0.001)** (0.001)** (0.001)** (0.001)** Tertiary dummy 0.460 0.431 0.492 0.477 0.192 (0.002)** (0.002)** (0.002)** (0.002)** (0.002)** Rural dummy -0.189 -0.046 -0.035 -0.020 (0.001)** (0.001)** (0.001)** (0.001)** Constant 2.917 2.189 2.208 2.208 2.033 2.227 2.091 2.227 2.655 (0.001)** (0.003)** (0.003)** (0.003)** (0.003)** (0.003)** (0.003)** (0.003)** (0.042)** R2 0.03 0.07 0.07 0.12 0.15 0.20 0.34 0.38 0.46
N 2,048,30
6 2,048,30
6 2,048,30
6 2,048,30
6 2,048,30
6 2,048,30
6 2,048,30
6 2,048,30
6 2,048,30
6
Note: Standard errors in parentheses; * significant at 5 per cent; ** significant at 1 per cent. Results of Mincer wage regressions on the natural log of hourly earnings, except India (natural log of daily earnings) for the garment, textile and footwear industry. Base cases for dummy variables include: (1) Sex: male; (2) Marital status: unmarried; (3) Experience: less than 1 year of job experience; (4) Education: none or less than a completed primary education; and (5) Residency: urban residence. For brevity, the regression coefficients for sub-national area, industry and occupation dummy variables are not presented. Source: Same as Annex Table A1.

Regional Office for Asia and the Pacific 31
Table A3. Blinder-Oaxaca decomposition of gender pa y gap, full weighted samples
Bangladesh (2013) Cambodia (2012) India (2011/12)
Explained Unexplain-ed
Total pay gap
Explained Unexplain-ed
Total pay gap
Explained Unexplain-ed
Total pay gap
Age 0.02 -0.12 -0.11 0.01 0.68 0.69 0.04 0.43 0.47
Marital status 0.00 0.04 0.04 0.00 -0.07 -0.07 0.03 -0.10 -0.07
Experience n.a. n.a. n.a. 0.00 -0.19 -0.20 n.a. n.a. n.a.
Education 0.02 -0.35 -0.32 0.01 -0.76 -0.75 0.01 -0.31 -0.30
Urban-rural 0.00 0.05 0.04 0.01 0.30 0.31 0.02 0.00 0.02
Sub-national area 0.00 -0.30 -0.30 0.00 0.25 0.25 -0.15 -3.61 -3.76
Industry 0.00 -0.26 -0.26 0.00 0.09 0.09 -0.05 2.53 2.48
Occupation 0.01 0.08 0.08 0.00 0.40 0.40 0.05 -0.35 -0.30
Other - 0.73 0.73 - -0.64 -0.64 - 1.80 1.80
Total 0.04 -0.14 -0.11 0.02 0.07 0.09 -0.05 0.39 0.35
Share of total gap (%) -37.1 137.1 100.0 24.1 75.9 100.0 -13.0 113.0 100.0
Indonesia (2014) Lao People's Democratic Republic (2010) Pakistan (2012/13)
Explained Unexplain-ed
Total pay gap
Explained Unexplain-ed
Total pay gap
Explained Unexplain-ed
Total pay gap
Age 0.00 0.71 0.72 -0.09 1.23 1.13 0.02 -0.11 -0.09
Marital status 0.00 0.03 0.02 -0.01 -0.17 -0.19 0.00 -0.03 -0.03
Experience 0.02 -0.11 -0.09 n.a. n.a. n.a. n.a. n.a. n.a.
Education 0.03 0.61 0.64 0.16 -1.41 -1.25 0.06 0.37 0.43
Urban-rural -0.01 -0.14 -0.15 0.00 0.06 0.06 0.02 0.01 0.03
Sub-national area 0.02 1.76 1.77 -0.02 0.73 0.71 n.a. n.a. n.a.
Industry -0.01 0.37 0.36 -0.03 -2.80 -2.83 -0.01 -0.18 -0.19
Occupation 0.05 -1.50 -1.45 0.11 1.75 1.86 0.07 0.84 0.91
Other - -1.73 -1.73 - 0.54 0.54 - -0.41 -0.41
Total 0.09 -0.01 0.08 0.11 -0.07 0.04 0.16 0.48 0.64
Share of total gap (%) 110.8 -10.8 100.0 302.9 -202.9 100.0 25.0 75.0 100.0
The Philippines (2013) Thailand (2013) Viet Nam (2013)
Explained Unexplain-ed
Total pay gap
Explained Unexplain-ed
Total pay gap
Explained Unexplain-ed
Total pay gap
Age 0.00 0.80 0.80 0.00 -0.50 -0.50 -0.01 0.14 0.14
Marital status 0.00 0.03 0.03 0.00 -0.03 -0.03 0.00 0.06 0.05
Experience n.a. n.a. n.a. n.a. n.a. n.a. 0.00 0.31 0.31
Education 0.01 0.20 0.21 0.02 -0.29 -0.26 0.01 0.01 0.02
Urban-rural 0.00 0.02 0.03 n.a. n.a. n.a. 0.00 0.00 0.00
Sub-national area 0.01 0.45 0.46 0.08 -1.91 -1.83 0.02 -0.06 -0.03
Industry 0.04 0.15 0.19 0.02 -0.28 -0.26 0.00 -0.06 -0.06
Occupation 0.03 1.20 1.22 0.06 2.58 2.64 0.05 1.21 1.25
Other - -2.74 -2.74 - 0.50 0.50 - -1.51 -1.51
Total 0.09 0.11 0.19 0.18 0.07 0.25 0.07 0.10 0.17
Share of total gap (%) 44.0 56.0 100.0 72.1 27.9 100.0 42.8 57.2 100.0
Note: Results of Blinder-Oaxaca decomposition by sex on the natural log of hourly earnings, except India (natural log of daily earnings) for the garment, textile and footwear industry. “n.a.” indicates variable is not included in the dataset. Source: Same as Annex Table A1.

32 Regional Office for Asia and the Pacific
Table A4. Logistic regression results with low pay as dependent variable, full weighted samples
(1a)
Bangladesh,
sex only
(1b) Bangladesh, all controls
(2a) Cambodia, sex only
(2b) Cambodia, all controls
(3a) India, sex only
(3b) India, all controls
Female dummy 0.610 0.412 0.845 0.780 2.618 8.753 (0.002)** (0.002)** (0.008)** (0.010)** (0.006)** (0.044)** Age 0.829 0.817 0.847 (0.001)** (0.003)** (0.001)** Age2 1.254 1.365 1.239 (0.002)** (0.009)** (0.002)** Married dummy 0.660 1.511 0.464 (0.003)** (0.018)** (0.002)** 1-5 years of experience dummy 0.666 (0.007)** 5-10 years of experience dummy 0.583 (0.012)** 10+ years of experience dummy 1.394 (0.033)** Primary education dummy 4.482 0.844 1.408 (0.096)** (0.009)** (0.006)** Lower secondary dummy 5.077 0.885 0.523 (0.108)** (0.012)** (0.003)** Upper secondary dummy 3.392 0.313 0.737 (0.074)** (0.010)** (0.005)** Tertiary education dummy 1.815 0.866 (0.044)** (0.008)** Rural dummy 1.260 2.933 1.815 (0.005)** (0.072)** (0.007)** N 3,744 3,302 2,133 1,847 1,557 1,238
(4a) Indonesia, sex
only
(4b) Indonesia, all
controls
(5a) Lao PDR, sex only
(5b) Lao PDR, all controls
(6a) Pakistan, sex only
(6b) Pakistan, all controls
Female dummy 1.125 0.841 0.489 0.528 10.866 8.136 (0.003)** (0.003)** (0.028)** (0.073)** (0.042)** (0.037)** Age 0.889 0.686 0.861 (0.001)** (0.023)** (0.001)** Age2 1.173 1.631 1.175 (0.002)** (0.096)** (0.001)** Married dummy 0.622 1.897 0.962 (0.002)** (0.195)** (0.005)** 1-5 years of experience dummy 0.564 (0.003)** 5-10 years of experience dummy 0.564 (0.003)** 10+ years of experience dummy 0.336 (0.002)** Primary education dummy 0.986 0.755 0.709 (0.007) (0.222) (0.003)** Lower secondary dummy 0.429 0.386 0.564 (0.003)** (0.113)** (0.003)** Upper secondary dummy 0.215 0.135 0.385 (0.002)** (0.041)** (0.005)** Tertiary education dummy 0.127 0.215 (0.002)** (0.005)** Rural dummy 0.734 7.210 1.365 (0.003)** (0.762)** (0.006)** N 4,061 4,061 142 89 2,333 2,210

Regional Office for Asia and the Pacific 33
(7a)
Philippines,
sex only
(7b) Philippines, all controls
(8a) Thailand, sex only
(8b) Thailand, all controls
(9a) Viet Nam, sex only
(3b) Viet Nam, all controls
Female dummy 2.284 2.070 2.922 1.510 2.353 2.316 (0.021)** (0.025)** (0.028)** (0.026)** (0.014)** (0.019)** Age 1.033 0.919 0.863 (0.002)** (0.003)** (0.001)** Age2 0.959 1.154 1.263 (0.003)** (0.004)** (0.003)** Married dummy 1.068 0.843 0.805 (0.011)** (0.011)** (0.005)** 1-5 years of experience dummy 0.264 (0.002)** 5-10 years of experience dummy 0.162 (0.002)** 10+ years of experience dummy 0.161 (0.002)** Primary education dummy 0.945 1.651 0.883 (0.018)** (0.030)** (0.010)** Lower secondary dummy 0.511 0.674 0.599 (0.014)** (0.014)** (0.007)** Upper secondary dummy 0.245 1.263 0.547 (0.005)** (0.029)** (0.007)** Tertiary education dummy 0.303 0.301 0.505 (0.007)** (0.013)** (0.010)** Rural dummy 0.880 0.985 (0.011)** (0.007)* N 708 618 1,526 1,049 11,620 10,988
Note: Standard errors in parentheses; * significant at 5 per cent; ** significant at 1 per cent; N = number of unweighted observations. Results of logistic regressions which exhibit the probability ratios of being low paid (less than 2/3 of median earnings) in the garment, textile and footwear industry. Base cases for dummy variables include: (1) Sex: male; (2) Marital status: unmarried; (3) Experience: less than 1 year of job experience; (4) Education: none or less than a completed primary education; and (5) Residency: urban residence. For brevity, the regression coefficients for sub-national area, industry and occupation dummy variables are not presented. A variable for job experience is included in only the Cambodia, Indonesia and Viet Nam datasets. Survey sampling weights applied. Source: Same as Annex Table A1.

Regional Office for Asia and the Pacific 1
ILO Regional Office for Asia and the Pacific
United Nations Building, 11th Floor
Rajdamnern Nok Avenue,
Bangkok 10200, Thailand
Tel.: +66 2288 1234, Fax.: +66 2280 1735
Email: [email protected]
www.ilo.org/asia
ISSN: 2227-4405 (web pdf)
Assessing the gender pay gap in Asia’s garment sector
This paper presents the gender pay gap in the garment, textile and footwear industry in nine
developing Asian economies – Bangladesh, Cambodia, India, Indonesia, the Lao People’s
Democratic Republic, Pakistan, the Philippines, Thailand and Viet Nam. It finds that women earn
less than men in eight of the nine countries, with the imbalance particularly sizeable in India and
Pakistan. Some of the pay gap can be attributed to differences in factors such as age and education,
but discrimination also appears to be a contributing determinant. Women are also more likely to be
at the lower end of the wage ladder. Applying standard Mincerian wage regressions and the Blinder-
Oaxaca decomposition method, the paper presents empirical evidence on gender wage gaps and
wage premiums in the industry, and discusses measures that can help reduce gender disparities and
discrimination in the sector.