Assessing the economic costs of unhealthy diets and low ... · ASSESSING THE ECONOMIC COSTS OF...
114
Health Policy Series 47 Assessing the economic costs of unhealthy diets and low physical activity Christine Joy Candari Jonathan Cylus Ellen Nolte An evidence review and proposed framework
-
Upload
trinhkhuong -
Category
Documents
-
view
215 -
download
0
Transcript of Assessing the economic costs of unhealthy diets and low ... · ASSESSING THE ECONOMIC COSTS OF...
ISB
N 9289050425
97
89
28
90
50
42
5
Health Policy Series No. 47www.healthobservatory.eu
Hea
lth
Polic
yS
erie
s
47
AN
EVID
EN
CE
RE
VIEW
AN
D P
RO
PO
SE
D FR
AM
EW
OR
K
47
Assessing the economic costs ofunhealthy diets andlow physical activity
Christine Joy Candari
Jonathan Cylus
Ellen Nolte
An evidence review and proposed framework
Unhealthy diets and low physical activity contribute to many chronic diseases and disability; they are responsible for some 2 in 5 deaths worldwide and for about 30% ofthe global disease burden. Yet surprisingly little is known about the economic costs thatthese risk factors cause, both for health care and society more widely.
This study pulls together the evidence about the economic burden that can be linked tounhealthy diets and low physical activity and explores
• How definitions vary and why this matters
• The complexity of estimating the economic burden and
• How we can arrive at a better way to estimate the costs of an unhealthy diet and lowphysical activity, using diabetes as an example
The review finds that unhealthy diets and low physical activity predict higher health careexpenditure, but estimates vary greatly. Existing studies underestimate the true economicburden because most only look at the costs to the health system. Indirect costs causedby lost productivity may be about twice as high as direct health care costs, together accounting for about 0.5% of national income.
The study also tests the feasibility of using a disease-based approach to estimate thecosts of unhealthy diets and low physical activity in Europe, projecting the total economicburden associated with these two risk factors as manifested in new type 2 diabetes casesat €883 million in 2020 for France, Germany, Italy, Spain and the United Kingdom alone.The ‘true’ costs will be higher, as unhealthy diets and low physical activity are linked tomany more diseases.
The study’s findings are a step towards a better understanding of the economic burdenthat can be associated with two key risk factors for ill health and they will help policy-makers in setting priorities and to more effectively promoting healthy diets and physicalactivity.
The editors
Christine Joy Candari was an independent consultant at the time of writing this report.She is currently Chief Consultant for Health Research, U Consult Us Inc, Manila, ThePhilippines
Jonathan Cylus is Research Fellow, European Observatory on Health Systems and Policies, London School of Economics and Political Science
Ellen Nolte is Head of London Hubs, European Observatory on Health Systems and PoliciesA
SS
ES
SIN
G TH
E E
CO
NO
MIC
CO
STS
OF U
NH
EA
LTHY
DIE
TS A
ND
LOW
PH
YSIC
AL A
CTIVITYC
hris
tine
Jo
y C
an
da
ri, Jo
na
tha
n C
ylu
s, E
llen
No
lte
Cover_WHO_nr47_Mise en page 1 7/06/17 14:31 Page 1

Assessing the economic costs of unhealthy diets and low physical activity
An evidence review and proposed framework
The European Observatory on Health Systems and Policies supports and promotes evidence-based health policy-making through comprehensive and rigorous analysis of health systems in Europe. It brings together a wide range of policy-makers, academics and practitioners to analyse trends in health reform, drawing on experience from across Europe to illuminate policy issues.
The Observatory is a partnership hosted by the WHO Regional Office for Europe, which includes the governments of Austria, Belgium, Finland, Ireland, Norway, Slovenia, Sweden, Switzerland, the United Kingdom, and the Veneto Region of Italy; the European Commission; the World Bank; UNCAM (French National Union of Health Insurance Funds); the London School of Economics and Political Science; and the London School of Hygiene & Tropical Medicine. The Observatory has a secretariat in Brussels and it has hubs in London (at LSE and LSHTM) and at the Technical University of Berlin.
Assessing the economic costs of unhealthy diets and low physical activity
Christine Joy Candari, Jonathan Cylus, Ellen Nolte
Keywords:
DIET – ECONOMICSSEDENTARY LIFESTYLE CHRONIC DISEASE – ECONOMICSCHRONIC DISEASE – PREVENTION AND CONTROLHEALTH CARE EVALUATION MECHANISMSDELIVERY OF HEALTH CARE
© World Health Organization 2017 (acting as the host organization for, and secretariat of, the European Observatory on Health Systems and Policies)
All rights reserved. The European Observatory on Health Systems and Policies welcomes requests for permission to reproduce or translate its publications, in part or in full.
The designations employed and the presentation of the material in this publication do not imply the expression of any opinion whatsoever on the part of the European Observatory on Health Systems and Policies concerning the legal status of any country, territory, city or area or of its authorities, or concerning the delimitation of its frontiers or boundaries. Dotted lines on maps represent approximate border lines for which there may not yet be full agreement.
The mention of specific companies or of certain manufacturers’ products does not imply that they are endorsed or recommended by the European Observatory on Health Systems and Policies in preference to others of a similar nature that are not mentioned. Errors and omissions excepted, the names of proprietary products are distinguished by initial capital letters.
All reasonable precautions have been taken by the European Observatory on Health Systems and Policies to verify the information contained in this publication. However, the published material is being distributed without warranty of any kind, either express or implied. The responsibility for the interpretation and use of the material lies with the reader. In no event shall the European Observatory on Health Systems and Policies be liable for damages arising from its use. The views expressed by authors, editors, or expert groups do not necessarily represent the decisions or the stated policy of the European Observatory on Health Systems and Policies or any of its partners.
ISBN 978 92 890 5042 5
Printed in the United Kingdom
Typeset by Tetragon, London
Cover design by M2M
Address requests about publications to: Publications, WHO Regional Office for Europe, UN City, Marmorvej 51, DK-2100 Copenhagen Ø, Denmark.
Alternatively, complete an online request form for documentation, health information, or for permission to quote or translate, on the Regional Office web site (http://www.euro.who.int/pubrequest).
Table of contents
Acknowledgements viiForeword viiiList of tables, boxes and figures ixSummary xi
Chapter 1 Introduction 1
Chapter 2 The economic costs of unhealthy diets and low physical activity: what does the published literature tell us? 3
2.1 Characteristics of reviewed studies 32.2 What the evidence tells us: the economic costs of unhealthy diets 52.3 What the evidence tells us: the economic costs of low physical activity 72.4 Review of the evidence: a summary 10
Chapter 3 Estimating the economic costs of unhealthy diets and low physical activity is complex 13
3.1 Defining the concepts: how can we understand ‘unhealthy diet’ and ‘low physical activity’? 13
3.2 Costing studies differ in key assumptions, influencing estimates for the economic burden of unhealthy diets and low physical activity 16
3.3 The nature and range of costs considered is likely to underestimate the ‘true’ economic burden of unhealthy diets and physical activity 18
3.4 Conceptual and methodological challenges of estimating the economic costs of unhealthy diets and low physical activity: a summary 19
Chapter 4 Taking available approaches to determining the economic costs of unhealthy diets and low physical activity further: a proof-of-concept approach applied to five European countries 21
4.1 Diabetes as an outcome of unhealthy diets and low physical activity 234.2 The principal approach used in this study to estimate the economic costs
that can be associated with unhealthy diets and low physical activity 254.3 The estimated total economic costs of unhealthy diets and low physical
activity related to diabetes and its complications 40

Assessing the economic costs of unhealthy diets and low physical activityvi
Chapter 5 Discussion and conclusions 43
5.1 Limitations of the costing framework 455.2 Implications for future studies 47
References 49Appendices 55

Acknowledgements
This study forms part of a wider programme of work that seeks to explore in further depth the available evidence on the economic costs that can be associ-ated with unhealthy diet and lack of physical activity in Europe, or high‐income countries more broadly, and their effects on health. A better understanding of the economic burden associated with these critical risk factors can provide important pointers to inform evidence‐based decision‐making within the European region as to the most appropriate policies to improve the health, well‐being and quality of life of the population.
We gratefully acknowledge the very helpful and insightful comments provided by Nick Cavill on an earlier draft of this work. We would also like to acknowledge the very useful comments and suggestions provided by the European Commission, which further helped inform the discussions presented here. We are indebted to Charles Normand and Josep Figueras for their constructive comments and guidance that helped shape the final version of this book.
We would like to thank Sarah Cook for copy-editing and Jonathan North and Caroline White for the production of this book.
The authors are fully responsible for any errors.
Foreword
Lifestyle related health problems are now a challenge of global proportions. For example, levels of obesity have doubled since 1980, and it costs a staggering 2.8% of the world’s GDP. Europe is not an exception: half of EU adults today are either overweight or obese, and rates for children are even more worrisome: one in three. Unless we act, we will condemn a whole generation to a lifetime of poor health.
With governments across Europe struggling to curb these ever-rising rates, it is more important than ever to make the economic case for investing in strategies that promote health and prevent diseases. Unhealthy diets and lack of physical activity are risk factors for developing a range of chronic diseases such as diabe-tes, cancer and cardiovascular disease. They not only reduce people’s quality of life and life expectancy, but also place a burden on our health systems and our economies, and on society as a whole.
There is growing evidence that many prevention interventions are cost-effective. It is therefore surprising that OECD countries still spend an average of only 3% of their health care budgets on disease prevention programmes. In contrast, already some 7% of EU health budgets are spent on treating chronic diseases linked to obesity.
This clearly points to a need to change mindsets. If we wish to keep our population healthy, active and productive, and our health systems strong and resilient in the long term, and reduce the increasing pressure on national health care budgets, we need to reset our thinking. We need to focus more on disease prevention and health promotion to save future expenditure on treatment and cure. This sounds self-evident – yet it is a surprisingly difficult message to get across.
Underpinning policies with sound evidence is essential. I therefore welcome this report, which provides a useful contribution to the debate on the increasing importance of promotion and prevention, and I invite you to read the assessment of the evidence contained within these pages of the costs of unhealthy diets and low physical activity.
Xavier Prats Monné Director General of the Directorate-General for Health and Food Safety
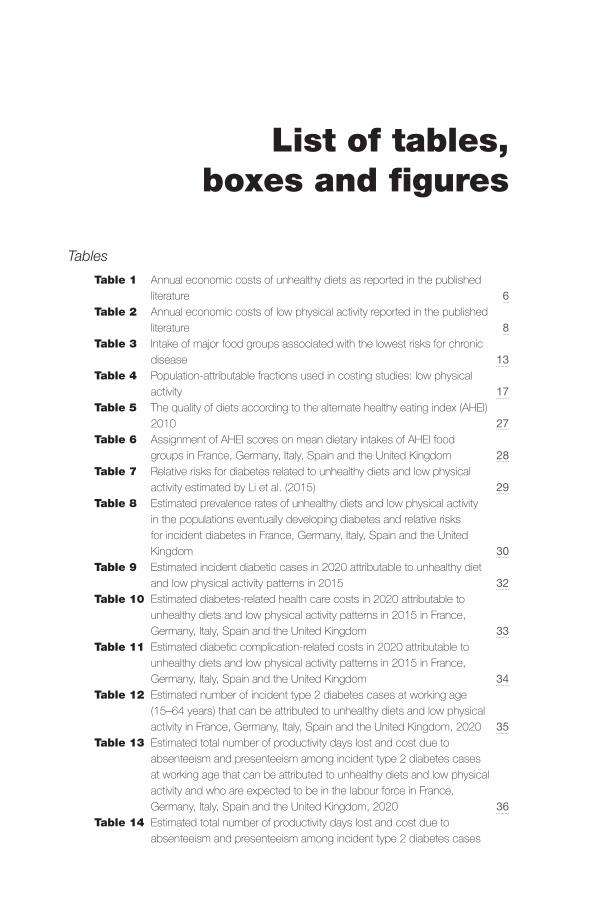
List of tables, boxes and figures
Tables
Table 1 Annual economic costs of unhealthy diets as reported in the published literature 6
Table 2 Annual economic costs of low physical activity reported in the published literature 8
Table 3 Intake of major food groups associated with the lowest risks for chronic disease 13
Table 4 Population-attributable fractions used in costing studies: low physical activity 17
Table 5 The quality of diets according to the alternate healthy eating index (AHEI) 2010 27
Table 6 Assignment of AHEI scores on mean dietary intakes of AHEI food groups in France, Germany, Italy, Spain and the United Kingdom 28
Table 7 Relative risks for diabetes related to unhealthy diets and low physical activity estimated by Li et al. (2015) 29
Table 8 Estimated prevalence rates of unhealthy diets and low physical activity in the populations eventually developing diabetes and relative risks for incident diabetes in France, Germany, Italy, Spain and the United Kingdom 30
Table 9 Estimated incident diabetic cases in 2020 attributable to unhealthy diet and low physical activity patterns in 2015 32
Table 10 Estimated diabetes-related health care costs in 2020 attributable to unhealthy diets and low physical activity patterns in 2015 in France, Germany, Italy, Spain and the United Kingdom 33
Table 11 Estimated diabetic complication-related costs in 2020 attributable to unhealthy diets and low physical activity patterns in 2015 in France, Germany, Italy, Spain and the United Kingdom 34
Table 12 Estimated number of incident type 2 diabetes cases at working age (15–64 years) that can be attributed to unhealthy diets and low physical activity in France, Germany, Italy, Spain and the United Kingdom, 2020 35
Table 13 Estimated total number of productivity days lost and cost due to absenteeism and presenteeism among incident type 2 diabetes cases at working age that can be attributed to unhealthy diets and low physical activity and who are expected to be in the labour force in France, Germany, Italy, Spain and the United Kingdom, 2020 36
Table 14 Estimated total number of productivity days lost and cost due to absenteeism and presenteeism among incident type 2 diabetes cases

Assessing the economic costs of unhealthy diets and low physical activityx
at working age that can be attributed to unhealthy diets and low physical activity and who are expected to be outside the formal labour force in France, Germany, Italy, Spain and the United Kingdom, 2020 38
Table 15 Estimated cost of working years lost due to work disability, early retirement and premature death among incident type 2 diabetes cases at working age that can be attributed to unhealthy diets and low physical activity and who are expected to be in the formal labour force in France, Germany, Italy, Spain and the United Kingdom, 2020 39
Table 16 Estimated economic cost that can be associated with unhealthy diets and low physical activity patterns in 2015 as manifested in incident diabetes and complication in France, Germany, Italy, Spain and the United Kingdom in 2020 41
Table 17 Estimated total and per capita economic cost that can be associated with unhealthy diets and low physical activity patterns in 2015 as manifested in incident diabetes and complications in France, Germany, Italy, Spain and the United Kingdom in 2020 41
Boxes
Box 1 Population-attributable fraction 5Box 2 Examples of moderate-intensity and vigorous-intensity physical activity 15Box 3 Conceptualizing economic costs 19Box 4 Health risks associated with unhealthy diets and low physical activity 22Box 5 Computing the fully-adjusted population-attributable fraction (PAF) 31
Figures
Figure 1 Relationship between unhealthy diets and low physical activity with type 2 diabetes and associated costs 24
Summary
Unhealthy diets and low levels of physical activity are among the main risk factors for major chronic diseases. While this is well documented, the economic burden associated with these two risk factors remains uncertain. A better understanding of the economic burden could help inform priority setting and motivate efforts to promote more effectively healthy diets and physical activity in Europe and worldwide. This volume seeks to help advance the debate through
• critically reviewing the literature that has sought to estimate the eco-nomic costs associated with unhealthy diets and low physical activity and presenting the range of estimates of economic burden;
• analysing the measurement, methodological and practical issues in assessing the economic burden from unhealthy diets and low physical activity; and
• developing a framework for assessing costs and testing the feasibility of this approach to provide better estimates of the economic burden.
The published evidence overwhelmingly shows that unhealthy diets and low physical activity are predictive of higher health care expenditure, but esti-mates vary greatly.
We used a rapid assessment of the evidence that has been published between January 2000 and February 2016, including a total of 30 studies for detailed review. Of these studies, six addressed diet, 21 looked at physical activity, and three considered both. Over half of the studies were set in North America, with only six set in Europe.
Most studies retrospectively assessed the economic burden of unhealthy diets and low physical activity. About half adopted a disease-based approach, often looking at cardiovascular disease, type 2 diabetes and selected cancers. In most cases this approach used the population-attributable fraction (PAF), which estimates the proportion of a disease that can be attributed to a particular risk factor.
We found that, overall, estimates presented in the reviewed studies varied widely. Not all included studies reported national or per capita costs that can be associ-ated with the two risk factors. Of those that did, the estimated health care costs for unhealthy diets ranged from €3.5 per capita in China to €63 in Australia and
Assessing the economic costs of unhealthy diets and low physical activityxii
€156 in the United Kingdom. For low physical activity, the estimated annual per capita health care costs ranged from €3 in the Czech Republic to €48 in Canada. In the United States of America alone, these ranged from less than €1 in two studies up to €185. Only four studies also considered indirect costs in their estimates for low physical activity, and these varied from €3.7 per capita in China to between €127 and €224 in Canada.
It is plausible that differences in socioeconomic conditions and health care and labour costs might lead to some of the differences between cost estimates. But much of the observed variation results from differences in approaches to meas-urement, such as what is meant by ‘unhealthy diets’ or ‘low physical activity’; large differences in the methodological approaches chosen (for example, the use of a retrospective, disease-based approach or of a prospective approach); differ-ences in the populations studied and underlying data that are being used; and the range and types of costs considered.
Defining what constitutes an ‘unhealthy diet’ and ‘low physical activity’ remains challenging and different conceptualisations make a comparative assessment of available evidence difficult.
Definitions of unhealthy diets often refer to those high in specific nutrients such as saturated fats, salts or sugars. Yet, growing evidence finds that intakes of specific foods rather than the actual nutrients are most relevant for the develop-ment of chronic disease, and studies increasingly look at recommended intakes of selected food groups, such as fruit, vegetables, nuts and seeds, whole grains, seafood and unprocessed red meats. This is based on studies that found intake levels for these food groups to be associated with coronary heart disease, stroke, type 2 diabetes and certain cancers. But even with this approach there remains the problem of how to score different intake levels.
These conceptual challenges are reflected in the reviewed studies of unhealthy diets, which often focused on single food items, such as intakes of fruit and vegetables, while others considered a range of nutrients and foodstuffs including saturated- and trans-fat, fruit, vegetables and whole grains. Again others examined diets that scored low on a measure of dietary diversity, or they analysed dietary patterns according to national dietary recommendations. A small number of studies did not define what was meant by unhealthy diet.
There is more consensus about what constitutes low physical activity. For measure-ment purposes, physical activities are classified into categories of intensity, from light to moderate to vigorous, depending on the amount of effort required to perform the activity. Guidelines by the WHO combine intensity with duration, for example recommending that adults should engage in at least 150 minutes of moderate-intensity aerobic physical activity throughout the week, in bouts of at least 10 minutes’ duration, to reduce the risk of chronic disease.
Summary xiii
Yet, as with unhealthy diet, reviewed studies that have assessed the costs of low physical activity used different definitions, ranging from those focusing on different thresholds of intensity of activities to those looking just at the dura-tion. Others only considered specific types of physical activity (or lack thereof ), such as leisure-time physical activity, walking, participation in an exercise programme or sedentary behaviour. Two studies did not define low physical activity.
These differences in definitions and conceptualisations undermine the comparative assessment of available cost estimates that can be associated with either risk factor.
Costing studies differ in analytical approaches and in the nature and scope of data used, influencing estimates for the economic burden of unhealthy diets and low physical activity.
Just under half of reviewed studies used population-attributable fractions (PAFs) to assess the contribution of unhealthy diets or low physical activity to a range of diseases (or death) and this then formed the basis to estimate the economic burden.
Studies analysed different numbers and combinations of diseases, most commonly coronary heart disease, stroke, type 2 diabetes and colorectal and breast cancer. They also varied in the population-attributable fractions used. They commonly applied the PAFs to contemporary prevalence of unhealthy diets or low physical activity and then estimated the related disease costs incurred in the same year. Such an approach overlooks the time lag between exposure to the risk factor and the development of disease.
There was equally great variation in the range of costs being considered by individual studies. The majority only looked at the direct health care costs, and this is likely to greatly underestimate the true economic burden that can be associated with unhealthy diets or low physical activity. For example, three Canadian studies that had analysed the costs associated with low physical activ-ity found indirect costs caused by lost productivity to be about twice as high as direct health care costs, together accounting for between 0.4% and 0.6% of gross domestic product (GDP).
We developed a framework for estimating the economic costs of unhealthy diets and low physical activity using a disease-based approach, and applied it to estimate the economic burden of type 2 diabetes associated with these two risk factors.
Building on the insights from the critical appraisal of the literature and the review of measurement and methodological challenges, we developed a framework for assessing the costs of unhealthy diets and low physical activity. We adopted a disease-based approach, which incorporates a time perspective to account for the
Assessing the economic costs of unhealthy diets and low physical activityxiv
natural progression of disease. We further estimated incidence rather than preva-lence, included costs related to the disease and its complications, and considered indirect costs of productivity losses as a consequence of absenteeism, presentee-ism, work disability, early retirement and premature mortality. The framework was tested by assessing the costs of type 2 diabetes. Diabetes has been associated with a high individual, social and economic burden and related expenditure was estimated to account for some 9% of total health care expenditure in the European region in 2015. There is the specific advantage of using diabetes as the disease for testing the framework in that there is a well-established causal pathway from these risk factors and disease.
We projected the total economic costs that can be associated with unhealthy diets and low physical activity in 2015 as manifested in incident type 2 diabetes cases in 2020 in five large European countries to be €883 million.
Using this approach, we projected the total economic cost of diabetes that can be associated with unhealthy diets and low physical activity. The approach takes the patterns of diet and activity levels in 2015 and projects incident diabetes cases for the year 2020. The estimated direct and indirect costs associated with these cases ranged from €82.4 million in Spain to €266.7 million in Germany. This equates to a per capita cost of €1.77 in Spain to €3.29 in Germany. Relating costs more specifically to the population projected to develop diabetes in 2020 as a consequence of unhealthy diets and low physical activity in 2015, the United Kingdom showed the highest amounts, at €18 953, closely followed by Germany and France, while Italy had the lowest cost, at just over €10 720.
The total cost in the five high-income countries studied (France, Germany, Italy, Spain and the United Kingdom) was projected to amount to about €883 million in 2020. The populations in the five countries studied account for almost two thirds of the total population in the European Union (EU-28). This would imply a total EU cost of around €1.3 billion, but care must be taken in any extrapolation given differences in population characteristics, costs of care and value of lost productivity. While these estimates of the economic costs are substantial, they represent only a small proportion of health care expenditure and a very small proportion of GDP. Even on the higher estimates in the sen-sitivity analysis it is likely that the burden of disease associated with unhealthy diets and low physical activity as measured by poor health and shortened life will be at least as important as the financial costs of additional health care and lost productivity.
It is difficult to compare the findings of the analyses presented here with estimates published elsewhere since only diabetes costs are estimated. The principal analyti-cal steps used in our analysis are similar to those in the recent Lancet Physical Activity 2016 Series for low physical activity. Where our model differs is that we
Summary xv
only considered the costs of new cases, which can be causally linked to the risk factor, and we take account of the expected time lag between exposure to the risk factor (unhealthy diets, low physical activity) and the development of the disease, and of complications that arise from diabetes. We also considered a wider range of indirect costs linked to lost productivity because of work absence, disability, early retirement and premature death among incident diabetes cases that can be attributed to unhealthy diets and low physical activity. While our estimates are restricted to diabetes, they provide a fuller picture of the likely future costs that can be attributed to contemporary dietary and physical activity patterns.
Where do we go from here?
This study has tested the feasibility of estimating the costs of unhealthy diets and low physical activity using a disease-based approach. While there are limitations, it has shown that it is broadly feasible to populate the model with data from a range of sources, and the results show a reasonable consistency across countries. While the disease burden from diabetes is not currently as large as that for, for example, ischaemic heart disease, it is a good exemplar because of the strong rela-tionship between these lifestyle factors and the risk of diabetes. In other chronic diseases there will be additional challenges in identifying the contribution of these lifestyle factors and disease risk. Given the very wide range of estimates of costs from the studies reviewed, this may be a more promising approach.

Chapter 1Introduction
Unhealthy diets and low physical activity are among the key risk factors for major chronic, non-communicable diseases such as cardiovascular diseases, cancers and diabetes. In 2015, diets that are low in fruit and vegetables or high in sugar, processed foods or sodium were estimated to directly account for 37% of all deaths and just over a quarter of the total disease burden (disability-adjusted life years, DALYs) (GBD 2015 Risk Factors Collaborators, 2016). Low levels of physical activity accounted for another 5% of all deaths and 3.4% of DALYs. Taken together, these two risk factors were thus responsible for some two in five deaths worldwide and about 30% of the global disease burden. It is against this background that several strategies have been launched at European and global levels since the early 2000s to promote healthy diets and physical activity and so reduce the related burden of ill-health (Commission of the European Communities, 2007; Council of the European Union, 2014; WHO Regional Office for Europe, 2001; WHO Regional Office for Europe, 2005; WHO Regional Office for Europe, 2015; WHO Regional Office for Europe, 2016; World Health Organization, 2004; World Health Assembly, 2013).
There is an expectation that effectively promoting healthy diets and physical activity can help reduce the economic burden associated with chronic diseases, which was estimated to account for 70–80% of health care budgets, or €700 bil-lion annually across the European Union alone (European Commission, 2014). However, while there is good evidence about the positive impacts of, for example, a healthy diet on outcomes such as major cardiovascular events (Estruch et al., 2013; Stefler et al., 2015; Tong et al., 2016; Liyanage et al., 2016) or about the association between physical activity and mortality (Samitz et al., 2011; Woodcock et al., 2011), only a small number of studies have provided robust estimates for the economic impacts on health care and the wider society that are directly related to either factor. This is in part because the relationships between unhealthy diets or low physical activity and health care costs is complex, and it is the consequences of these behaviours, for example obesity or specific lifestyle-related diseases, that lead to health care costs. However, there may be more direct effects of unhealthy diets and low physical activity on lost productivity.
Available studies provide widely varying estimates, reflecting the range of assump-tions and estimates that inform underlying models (Cecchini & Bull, 2015). For
Assessing the economic costs of unhealthy diets and low physical activity2
example, Scarborough et al. (2011) estimated the economic burden of ill health that could be attributed to unhealthy diet to the National Health Service in the United Kingdom in 2006–07 to be £5.8 billion (€8.5 billion) and £0.9 billion (€1.3 billion) for low physical activity. Maresova (2014) calculated the financial cost of low physical activity to public health insurance in the Czech Republic to be 0.4% of total health care cost in 2008. These figures do not take account of the wider societal costs that can be attributed to these risk factors. More recently, Ding et al. (2016) estimated that in 2013 health care costs associated with low physical activity accounted for an average of 0.6% of total health expenditure across EU Member States.
This volume seeks to help provide a clearer picture of the economic costs of unhealthy diets and low physical activity in Europe, to understand the meth-odological and practical difficulties in assessing costs, and to provide a test case to show how costs might better be assessed.
Chapter 2 provides a targeted review of the literature that has sought to estimate the economic costs associated with unhealthy diets and low physical activity. This provides estimates of the costs as reported in the different studies, and shows how the estimated costs vary with the different assumptions and methods used.
Chapter 3 reviews the methodological and practical challenges in estimating the economic costs of unhealthy diets and low physical activity. It looks in detail at issues of measurement of diet and physical activity, and at how there are strong interactions between diet and physical activity in terms of risks of disease (and indeed in different elements of diet), and shows how these challenges affect the estimates of costs.
Chapter 4 develops a bottom-up framework for assessing the costs of unhealthy diets and low physical activity using a disease-based approach. This is then tested out for a disease (type 2 diabetes) for which there is strong evidence that the disease is related to both diet and the level of physical activity. This provides a test of concept, and shows how evidence from a range of sources can potentially be combined to improve our understanding of the economic cost.
Chapter 5 briefly summarises the findings of the work and proposes avenues for further research.
Chapter 2The economic costs of unhealthy
diets and low physical activity: what does the published literature tell us?
This chapter reports the findings of a targeted review of the literature that has sought to estimate the economic costs associated with unhealthy diets and/or low physical activity. No previous review has covered costs associated with both of these, and existing reviews of costs of low physical activity (Kruk, 2014; Oldridge, 2008) did not provide information on the methodological approach or a critical evaluation of reviewed studies. The aim of this review is to present the current best estimates of the economic costs, and the strengths and weak-nesses of the available studies.
Drawing on the principles of a rapid evidence assessment (Khangura et al., 2012), we carried out a targeted search of PubMed, the National Library of Medicine’s Medline and pre-Medline database (NCBI, 2016). We identified studies using medical subject headings (MeSH) as follows (‘/’ indicating ‘or’): ‘sedentary lifestyle/leisure activities/motor activity’ or ‘diet/food’ in combination with ‘health care costs[statistics and numerical data]/costs and cost analysis/public health[economics]/cost of illness’. We limited our search to studies that were published between January 2000 and February 2016 and that were in the English language.
We included original studies estimating the costs that can be associated with unhealthy diets or low physical activity. We did not consider studies that focused on populations with established disease (e.g. people with osteoarthritis), interven-tion studies or those that compared different populations with different levels of physical activity or differing dietary behaviours, except where these were quantified further. Given the overall scarcity of studies, we adopted an inclusive approach and we did not formally assess the quality of included studies. We excluded editorials, commentaries or letters.
2.1 Characteristics of reviewed studies
This section briefly summarises the key characteristics of reviewed studies; a detailed overview is presented in Appendix 1.
Assessing the economic costs of unhealthy diets and low physical activity4
The PubMed searches identified a total of 3661 records (diet: 2347; physical activity: 1314) and, following screening of abstracts and titles, we considered 38 studies for full-text review. Of these, 30 studies were considered eligible for inclusion in the review. Six addressed diet, 21 examined physical activity, and three considered both.
Eleven of the included studies were set in the United States of America (Ackermann et al., 2003; Anderson et al., 2005; Bachmann et al., 2015; Bland et al., 2009; Carlson et al., 2015; Chevan & Roberts, 2014; Daviglus et al., 2005; Garrett et al., 2004; Martinson et al., 2003; Wang et al., 2005; Wang et al., 2004), five in Canada (Alter et al., 2012; Janssen, 2012; Katzmarzyk, 2011; Katzmarzyk et al., 2000; Krueger et al., 2015), three each in the United Kingdom (Allender et al., 2007; Rayner & Scarborough, 2005; Scarborough et al., 2011) and in Australia (Collins et al., 2011; Doidge et al., 2012; Peeters et al., 2014), two in China (Popkin et al., 2006; Zhang & Chaaban, 2012) and one each in Brazil (Codogno et al., 2015), Germany (Idler et al., 2015), Czech Republic (Maresova, 2014), Japan (Kuriyama et al., 2004) and Taiwan, China (Lo et al., 2013). One study assessed the economic costs of disease-related malnutrition in health care settings in Ireland (Rice & Normand, 2012).
The majority of studies provided a retrospective assessment of the economic burden that can be associated with either unhealthy diets or low physical activity or both, while nine studies adopted a prospective approach by following a cohort of people over a defined period of time (Alter et al., 2012; Bachmann et al., 2015; Bland et al., 2009; Chevan & Roberts, 2014; Collins et al., 2011; Kuriyama et al., 2004; Lo et al., 2013; Martinson et al., 2003; Peeters et al., 2014).
About half of the reviewed studies adopted a disease-based approach to estimate the economic burden that can be associated with unhealthy diets or low physical activity, most frequently cardiovascular diseases (coronary heart disease, stroke, hypertension), type 2 diabetes, and colon and female breast cancer (Allender et al., 2007; Daviglus et al., 2005; Doidge et al., 2012; Garrett et al., 2004; Janssen, 2012; Katzmarzyk, 2011; Katzmarzyk et al., 2000; Krueger et al., 2015; Maresova, 2014; Popkin et al., 2006; Rayner & Scarborough, 2005; Scarborough et al., 2011; Wang et al., 2004; Zhang & Chaaban, 2012). The disease-based approach typically, although not always (Daviglus et al., 2005; Wang et al., 2004), uses the population-attributable fraction (PAF) to quantify the contribution of the individual risk factor (unhealthy diet, low physical activity) to the burden of a given disease or death (Box 1).
The remaining studies used a generic, non-disease-based approach, where unhealthy diets or low physical activity data of each individual were linked to health care cost data, regardless of the type of disease or diagnosis. Such an approach is typically followed by regression techniques to identify possible
The economic costs of unhealthy diets and low physical activity 5
associations between the presence or absence of the risk factor and the mag-nitude of costs (Ackermann et al., 2003; Alter et al., 2012; Anderson et al., 2005; Bachmann et al., 2015; Bland et al., 2009; Carlson et al., 2015; Chevan & Roberts, 2014; Codogno et al., 2015; Collins et al., 2011; Idler et al., 2015; Kuriyama et al., 2004; Lo et al., 2013; Martinson et al., 2003; Peeters et al., 2014; Rice & Normand, 2012; Wang et al., 2005).
Studies using a disease-based approach based on population-attributable fractions reported costs that can be associated with unhealthy diets and/or low physical activity in aggregate terms, for example national costs. Conversely, studies that adopted a generic approach tended to report the costs as ‘additional costs’, that is, additional to the costs a non-exposed individual would otherwise incur, in per capita terms. Two studies reported risk estimates, in this case, odds ratio, illustrating the strength of the association between unhealthy diet or low physical activity and costs (Chevan & Roberts, 2014; Codogno et al., 2015).
2.2 What the evidence tells us: the economic costs of unhealthy diets
Drawing on those studies that have reported aggregate costs, the annual economic costs of unhealthy diets ranged from €1.4 billion in Australia (AU$ 2 billion) (Doidge et al., 2012) to €4.5 billion in China (US$ 4.2 billion) (Popkin et al., 2006) and €8.5–9.5 billion in the United Kingdom (£5.8–6 billion) (Rayner & Scarborough, 2005; Scarborough et al., 2011) (see Appendix 2 for conversion
Box 1 Population-attributable fraction
The population-attributable fraction (PAF) generally refers to the proportion of cases for a given
outcome of interest that can be attributed to a given risk factor among the entire population.
Specifically, the PAF is a function of the proportion of individuals in the population who are exposed
to the factor of interest (Pexp), for example, unhealthy diet, and the relative risk (RR) of a particular
outcome given that exposure, for example, the development of type 2 diabetes. If the exposure
variable is dichotomous (i.e. the risk factor is present or absent), the mathematical formula reads:
For example, if the relative risk for the effect of a given exposure on a disease outcome was
approximately 5, and we can infer from a population survey that about 20% of the population
was exposed to this risk factor, the proportion of all disease cases in the population that can be
attributed to the risk factor is calculated as: PAF = 0.05 x (20-1) / (0.05 x (20-1) + 1) = 0.95 /
1.95 = 49%.
PAF (%) = Pexp (RR−1)
[Pexp (RR−1)] + 1
Assessing the economic costs of unhealthy diets and low physical activity6
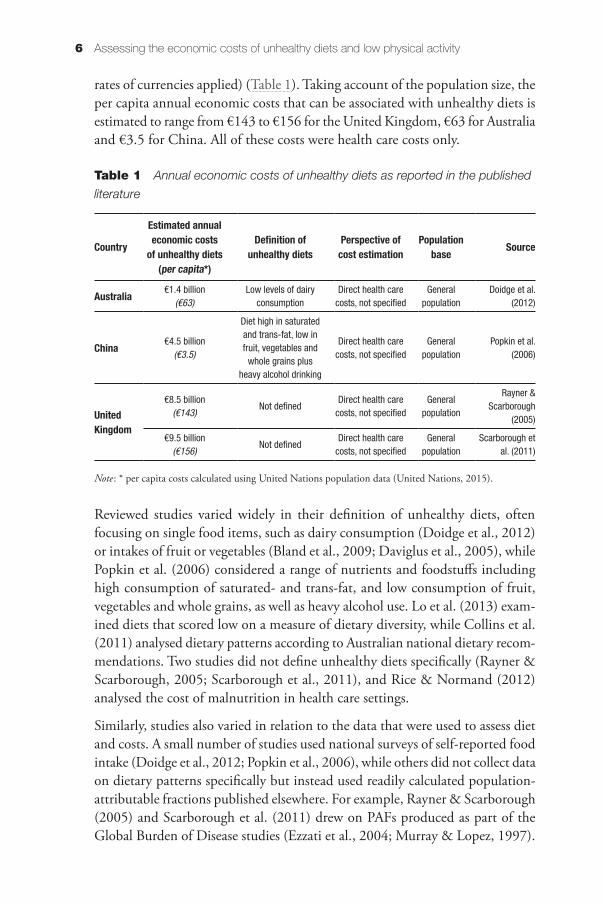
rates of currencies applied) (Table 1). Taking account of the population size, the per capita annual economic costs that can be associated with unhealthy diets is estimated to range from €143 to €156 for the United Kingdom, €63 for Australia and €3.5 for China. All of these costs were health care costs only.
Table 1 Annual economic costs of unhealthy diets as reported in the published
literature
Country
Estimated annual economic costs
of unhealthy diets (per capita*)
Definition of unhealthy diets
Perspective of cost estimation
Population base Source
Australia €1.4 billion(€63)
Low levels of dairy consumption
Direct health care costs, not specified
General population
Doidge et al. (2012)
China €4.5 billion(€3.5)
Diet high in saturated and trans-fat, low in fruit, vegetables and
whole grains plus heavy alcohol drinking
Direct health care costs, not specified
General population
Popkin et al. (2006)
United Kingdom
€8.5 billion(€143)
Not definedDirect health care
costs, not specifiedGeneral
population
Rayner & Scarborough
(2005)
€9.5 billion(€156)
Not definedDirect health care
costs, not specifiedGeneral
populationScarborough et
al. (2011)
Note: * per capita costs calculated using United Nations population data (United Nations, 2015).
Reviewed studies varied widely in their definition of unhealthy diets, often focusing on single food items, such as dairy consumption (Doidge et al., 2012) or intakes of fruit or vegetables (Bland et al., 2009; Daviglus et al., 2005), while Popkin et al. (2006) considered a range of nutrients and foodstuffs including high consumption of saturated- and trans-fat, and low consumption of fruit, vegetables and whole grains, as well as heavy alcohol use. Lo et al. (2013) exam-ined diets that scored low on a measure of dietary diversity, while Collins et al. (2011) analysed dietary patterns according to Australian national dietary recom-mendations. Two studies did not define unhealthy diets specifically (Rayner & Scarborough, 2005; Scarborough et al., 2011), and Rice & Normand (2012) analysed the cost of malnutrition in health care settings.
Similarly, studies also varied in relation to the data that were used to assess diet and costs. A small number of studies used national surveys of self-reported food intake (Doidge et al., 2012; Popkin et al., 2006), while others did not collect data on dietary patterns specifically but instead used readily calculated population-attributable fractions published elsewhere. For example, Rayner & Scarborough (2005) and Scarborough et al. (2011) drew on PAFs produced as part of the Global Burden of Disease studies (Ezzati et al., 2004; Murray & Lopez, 1997).
The economic costs of unhealthy diets and low physical activity 7
All reviewed studies estimated disease-based direct health care expenditures and only Rice & Normand (2012) also included social care costs. All estimated costs applied to the general population; the only exception was the study by Bland et al. (2009), which estimated the costs for a sample of members of one health insurance plan in the United States (n = 7983 individuals).
2.3 What the evidence tells us: the economic costs of low physical activity
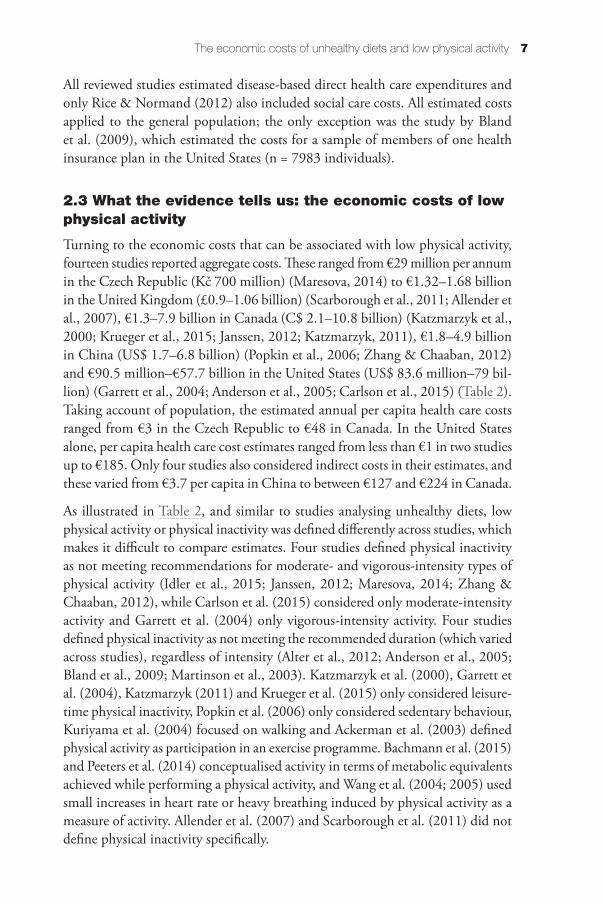
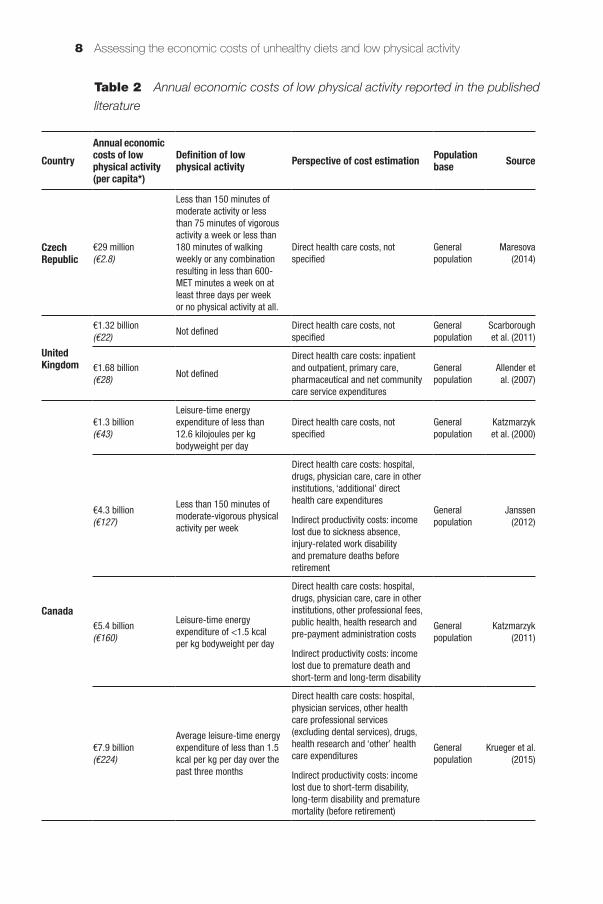
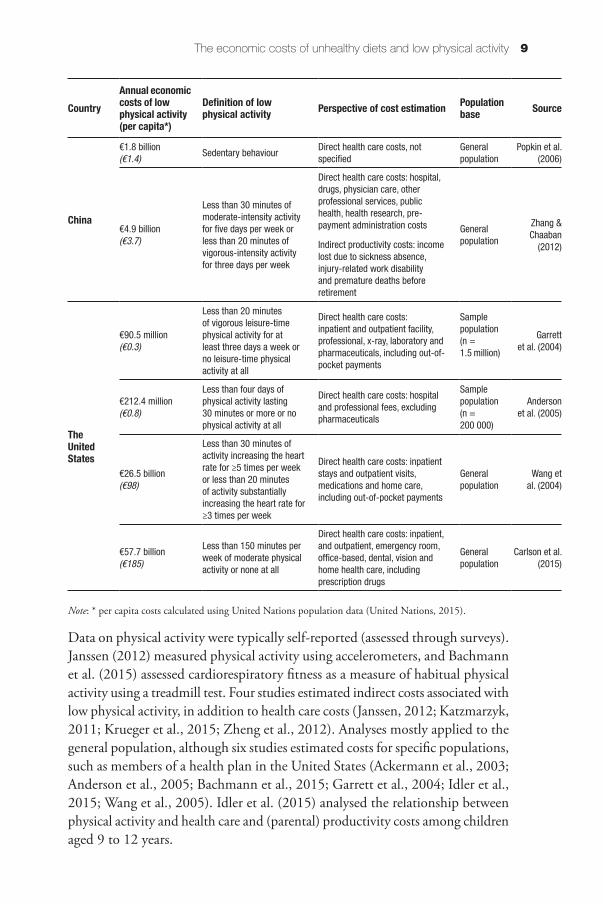
Turning to the economic costs that can be associated with low physical activity, fourteen studies reported aggregate costs. These ranged from €29 million per annum in the Czech Republic (Kč 700 million) (Maresova, 2014) to €1.32–1.68 billion in the United Kingdom (£0.9–1.06 billion) (Scarborough et al., 2011; Allender et al., 2007), €1.3–7.9 billion in Canada (C$ 2.1–10.8 billion) (Katzmarzyk et al., 2000; Krueger et al., 2015; Janssen, 2012; Katzmarzyk, 2011), €1.8–4.9 billion in China (US$ 1.7–6.8 billion) (Popkin et al., 2006; Zhang & Chaaban, 2012) and €90.5 million–€57.7 billion in the United States (US$ 83.6 million–79 bil-lion) (Garrett et al., 2004; Anderson et al., 2005; Carlson et al., 2015) (Table 2). Taking account of population, the estimated annual per capita health care costs ranged from €3 in the Czech Republic to €48 in Canada. In the United States alone, per capita health care cost estimates ranged from less than €1 in two studies up to €185. Only four studies also considered indirect costs in their estimates, and these varied from €3.7 per capita in China to between €127 and €224 in Canada.
As illustrated in Table 2, and similar to studies analysing unhealthy diets, low physical activity or physical inactivity was defined differently across studies, which makes it difficult to compare estimates. Four studies defined physical inactivity as not meeting recommendations for moderate- and vigorous-intensity types of physical activity (Idler et al., 2015; Janssen, 2012; Maresova, 2014; Zhang & Chaaban, 2012), while Carlson et al. (2015) considered only moderate-intensity activity and Garrett et al. (2004) only vigorous-intensity activity. Four studies defined physical inactivity as not meeting the recommended duration (which varied across studies), regardless of intensity (Alter et al., 2012; Anderson et al., 2005; Bland et al., 2009; Martinson et al., 2003). Katzmarzyk et al. (2000), Garrett et al. (2004), Katzmarzyk (2011) and Krueger et al. (2015) only considered leisure-time physical inactivity, Popkin et al. (2006) only considered sedentary behaviour, Kuriyama et al. (2004) focused on walking and Ackerman et al. (2003) defined physical activity as participation in an exercise programme. Bachmann et al. (2015) and Peeters et al. (2014) conceptualised activity in terms of metabolic equivalents achieved while performing a physical activity, and Wang et al. (2004; 2005) used small increases in heart rate or heavy breathing induced by physical activity as a measure of activity. Allender et al. (2007) and Scarborough et al. (2011) did not define physical inactivity specifically.
Assessing the economic costs of unhealthy diets and low physical activity8
CountryAnnual economic costs of low physical activity (per capita*)
Definition of low physical activity Perspective of cost estimation Population
base Source
Czech Republic
€29 million(€2.8)
Less than 150 minutes of moderate activity or less than 75 minutes of vigorous activity a week or less than 180 minutes of walking weekly or any combination resulting in less than 600-MET minutes a week on at least three days per week or no physical activity at all.
Direct health care costs, not specified
General population
Maresova (2014)
United Kingdom
€1.32 billion(€22) Not defined
Direct health care costs, not specified
General population
Scarborough et al. (2011)
€1.68 billion(€28) Not defined
Direct health care costs: inpatient and outpatient, primary care, pharmaceutical and net community care service expenditures
General population
Allender et al. (2007)
Canada
€1.3 billion(€43)
Leisure-time energy expenditure of less than 12.6 kilojoules per kg bodyweight per day
Direct health care costs, not specified
General population
Katzmarzyk et al. (2000)
€4.3 billion(€127)
Less than 150 minutes of moderate-vigorous physical activity per week
Direct health care costs: hospital, drugs, physician care, care in other institutions, ‘additional’ direct health care expenditures
Indirect productivity costs: income lost due to sickness absence, injury-related work disability and premature deaths before retirement
General population
Janssen (2012)
€5.4 billion(€160)
Leisure-time energy expenditure of <1.5 kcal per kg bodyweight per day
Direct health care costs: hospital, drugs, physician care, care in other institutions, other professional fees, public health, health research and pre-payment administration costs
Indirect productivity costs: income lost due to premature death and short-term and long-term disability
General population
Katzmarzyk (2011)
€7.9 billion(€224)
Average leisure-time energy expenditure of less than 1.5 kcal per kg per day over the past three months
Direct health care costs: hospital, physician services, other health care professional services (excluding dental services), drugs, health research and ‘other’ health care expenditures
Indirect productivity costs: income lost due to short-term disability, long-term disability and premature mortality (before retirement)
General population
Krueger et al. (2015)
Table 2 Annual economic costs of low physical activity reported in the published
literature
The economic costs of unhealthy diets and low physical activity 9
Data on physical activity were typically self-reported (assessed through surveys). Janssen (2012) measured physical activity using accelerometers, and Bachmann et al. (2015) assessed cardiorespiratory fitness as a measure of habitual physical activity using a treadmill test. Four studies estimated indirect costs associated with low physical activity, in addition to health care costs (Janssen, 2012; Katzmarzyk, 2011; Krueger et al., 2015; Zheng et al., 2012). Analyses mostly applied to the general population, although six studies estimated costs for specific populations, such as members of a health plan in the United States (Ackermann et al., 2003; Anderson et al., 2005; Bachmann et al., 2015; Garrett et al., 2004; Idler et al., 2015; Wang et al., 2005). Idler et al. (2015) analysed the relationship between physical activity and health care and (parental) productivity costs among children aged 9 to 12 years.
CountryAnnual economic costs of low physical activity (per capita*)
Definition of low physical activity Perspective of cost estimation Population
base Source
China
€1.8 billion(€1.4) Sedentary behaviour
Direct health care costs, not specified
General population
Popkin et al. (2006)
€4.9 billion(€3.7)
Less than 30 minutes of moderate-intensity activity for five days per week or less than 20 minutes of vigorous-intensity activity for three days per week
Direct health care costs: hospital, drugs, physician care, other professional services, public health, health research, pre-payment administration costs
Indirect productivity costs: income lost due to sickness absence, injury-related work disability and premature deaths before retirement
General population
Zhang & Chaaban
(2012)
The United States
€90.5 million(€0.3)
Less than 20 minutes of vigorous leisure-time physical activity for at least three days a week or no leisure-time physical activity at all
Direct health care costs: inpatient and outpatient facility, professional, x-ray, laboratory and pharmaceuticals, including out-of-pocket payments
Sample population(n = 1.5 million)
Garrett et al. (2004)
€212.4 million(€0.8)
Less than four days of physical activity lasting 30 minutes or more or no physical activity at all
Direct health care costs: hospital and professional fees, excluding pharmaceuticals
Sample population(n = 200 000)
Anderson et al. (2005)
€26.5 billion(€98)
Less than 30 minutes of activity increasing the heart rate for ≥5 times per week or less than 20 minutes of activity substantially increasing the heart rate for ≥3 times per week
Direct health care costs: inpatient stays and outpatient visits, medications and home care, including out-of-pocket payments
General population
Wang et al. (2004)
€57.7 billion(€185)
Less than 150 minutes per week of moderate physical activity or none at all
Direct health care costs: inpatient, and outpatient, emergency room, office-based, dental, vision and home health care, including prescription drugs
General population
Carlson et al. (2015)
Note: * per capita costs calculated using United Nations population data (United Nations, 2015).
Assessing the economic costs of unhealthy diets and low physical activity10
Two studies reported the costs of low physical activity in combination with other risk factors. Alter et al. (2012) estimated the incremental health care costs that can be associated with obesity and additional risk factors, including low physical activity (described as sedentary) (data not shown in Table 2 as authors reported per capita costs only). They found that the cumulative additional costs attributable to overweight and obesity alone were small when compared with matched normal-weight adults. However, costs increased significantly with other risk factors. Thus, for obese individuals who were also physically inactive, health care costs exceeded those of normal-weight, healthy individuals over an 11.5-year period by around €3700 (C$ 4080; p = 0.003). Kuriyama et al. (2004) estimated that low physical activity increased monthly per capita health care costs among adults in Japan by 8%, from €172 for adults without lifestyle risk to €185, with further increases where low physical activity was combined with obesity (by 16.4%) (1995–2001). Idler et al. (2015) focused on children aged 9 to 12 years and found that low physical activity increased health care costs by €6 per child annually, but decreased the productivity costs (i.e. earnings lost due to parental absence from work) by €11 per physically inactive child. However, the relationship between physical activity and costs in this age group was not statistically significant. Similarly, Ackermann et al. (2003) found no significant difference in costs between physically active and inactive members of a health plan in the United States.
Three studies analysed the comparative impact of unhealthy diets and low physical activity on cost. Popkin et al. (2006) and Scarborough et al. (2011) estimated that the cost associated with unhealthy diets exceeded that associated with low physical activity by a factor of 1.5 to 5. Bland et al. (2009) found that low physical activity but not unhealthy diet (as measured by low fruit and vegetable consump-tion) was significantly associated with higher short-term medical costs. The latter study collected primary data on diet and physical activity among members of a health plan in the United States to estimate medical costs, whereas both Popkin et al. (2006) and Scarborough et al. (2011) based their analyses on published data on population-attributable fractions and studies are not easily comparable.
2.4 Review of the evidence: a summary
In summary, of the 30 studies reviewed, 27 found a significant association between diet and/or physical activity and costs, with unhealthy diets and low physical activity predictive of higher health care expenditure. The only excep-tion was the study by Collins et al. (2011), which reported a healthy diet to be predictive of higher health care costs; the authors noted, however, that the findings of their study of women were likely confounded by charges incurred for routine screening services (e.g. cervical and breast cancer screening), with those
The economic costs of unhealthy diets and low physical activity 11
with higher dietary index scores more likely to use these services than those with poorer scores. Three studies did not find a significant association between diet or physical activity and costs.
Studies that did report costs associated with the two risk factors found the annual cost of unhealthy diets to range from €3 to €148 per capita and for low physical activity from €3 to €181 per capita. The highest health care cost estimates are equivalent to between 2% and 6% of health spending in the countries. The review shows that there is a very wide range of estimates, and these are very sensitive to the measures of diet and activity and the ways in which the studies were carried out. The next section reviews these methodological and measurement challenges in assessing the costs of unhealthy diets and low physical activity.

Chapter 3Estimating the economic costs
of unhealthy diets and low physical activity is complex
We have shown in the review of published studies that the estimated eco-nomic burden associated with unhealthy diets or low physical activity varies widely. Reasons for this variation include differences in the definition of what constitutes unhealthy diets or low physical activity; the methodological approach chosen (such as the method to calculate population-attributable fractions); and the range and types of costs considered. We discuss each aspect in turn.
3.1 Defining the concepts: how can we understand ‘unhealthy diet’ and ‘low physical activity’?
Our evidence review illustrates that ‘unhealthy diets’ and ‘low physical activity’ have been conceptualised and interpreted differently, making a comparative assessment of available studies difficult. For example, definitions of unhealthy diets often refer to those high in specific nutrients such as saturated fats, salts or sugars, but growing evidence suggests that intakes of specific foods rather than macro- or micro-nutrients are most relevant for the development of chronic disease (Morgan, 2012; Mozaffarian et al., 2011).
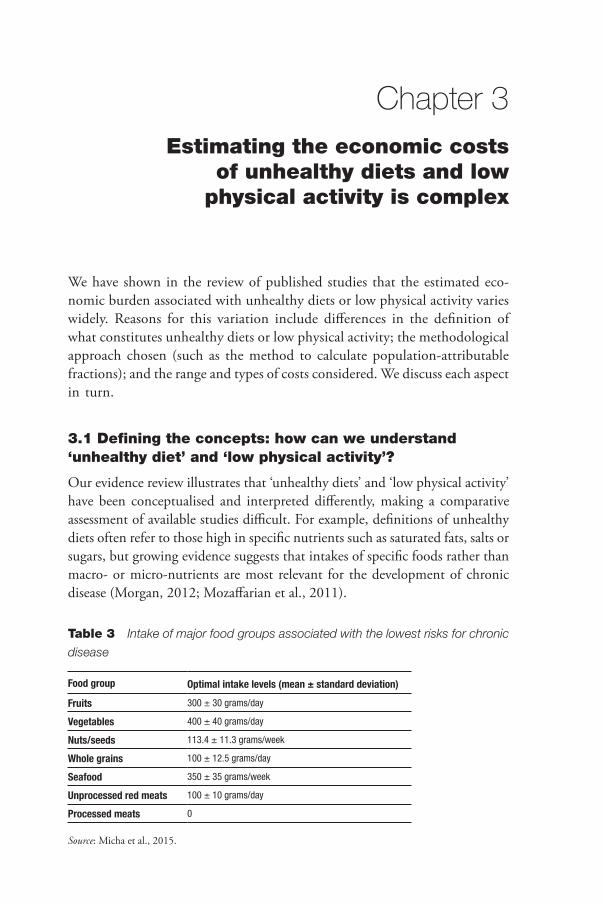
Table 3 Intake of major food groups associated with the lowest risks for chronic
disease
Food group Optimal intake levels (mean ± standard deviation)
Fruits 300 ± 30 grams/day
Vegetables 400 ± 40 grams/day
Nuts/seeds 113.4 ± 11.3 grams/week
Whole grains 100 ± 12.5 grams/day
Seafood 350 ± 35 grams/week
Unprocessed red meats 100 ± 10 grams/day
Processed meats 0
Source: Micha et al., 2015.
Assessing the economic costs of unhealthy diets and low physical activity14
It is against this background that researchers have moved towards identifying and defining healthy diets based on recommended intakes of selected food groups. For example, Micha et al. (2015) described optimal consumption levels of selected food groups, based on probable or convincing evidence about the association of intake levels and the risk for coronary heart disease, stroke, type 2 diabetes and certain cancers. An unhealthy diet can be defined as one that does not meet the recommended intake levels of selected food groups shown in Table 3. Even with this approach there remains the problem of how to score different levels of deviation from optimal intake.
Intakes of beneficial dietary factors tend to be positively correlated with each other and inversely correlated with those considered unhealthy. This correla-tion could lead to overestimates of the relative risk of each dietary factor and the total effect of dietary risks at the population level (GBD 2015 Risk Factors Collaborators, 2016). Instead of individually assessing the risks associated with selected food groups, an alternative approach is to examine dietary patterns. Such an approach considers the balance among all food groups, including those that are recommended for frequent consumption and those that are not. It also accommodates different eating patterns, so allowing for variation depending on cultural, ethnic or personal preferences, or the costs and availability of certain foods. Examples include the Healthy Eating Index (HEI), which measures adherence to the 2005 dietary guidelines in place in the United States, and the Alternate Healthy Eating Index (AHEI), which is based on foods and nutrients predictive of chronic disease risk (Chiuve et al., 2012). Diets which score highly on either the HEI or the AHEI were shown to be associated with a significant reduction in the risk of all-cause mortality, cardiovascular disease, cancer and type 2 diabetes by around 20%, highlighting their relevance for population health (Schwingshackl & Hoffmann, 2015). The AHEI is discussed further in the context of our proposed costing framework below.
In contrast to diet, there is more consensus about what constitutes low physical activity. The World Health Organization (2010) has defined physical inactivity as the “absence of physical activity or exercise” (p. 53), and it recommends that adults meet the guidelines of at least 150 minutes of moderate-intensity or at least 75 minutes of vigorous-intensity aerobic physical activity throughout the week, in bouts of at least 10 minutes’ duration, in order to improve cardiorespiratory and muscular fitness and bone health, and to reduce the risk of chronic disease and depression (World Health Organization, 2010). Physical activity includes activities undertaken while working, playing, carrying out household chores, travelling, and leisure-time activities but is distinct from exercise.
For measurement purposes, physical activities are classified into different cat-egories, ranging from light to moderate to vigorous intensity, depending on the
Estimating the economic costs of unhealthy diets and low physical activity is complex 15
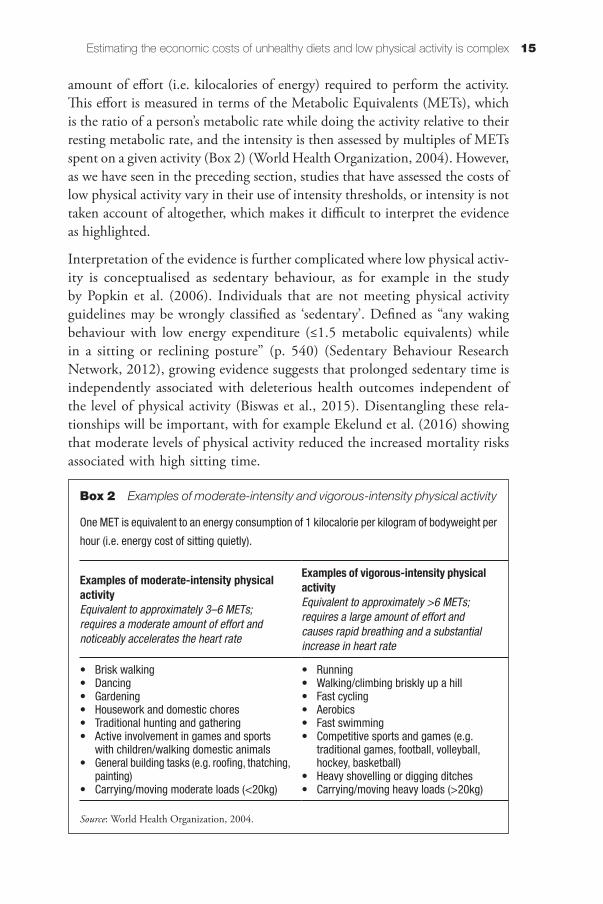
amount of effort (i.e. kilocalories of energy) required to perform the activity. This effort is measured in terms of the Metabolic Equivalents (METs), which is the ratio of a person’s metabolic rate while doing the activity relative to their resting metabolic rate, and the intensity is then assessed by multiples of METs spent on a given activity (Box 2) (World Health Organization, 2004). However, as we have seen in the preceding section, studies that have assessed the costs of low physical activity vary in their use of intensity thresholds, or intensity is not taken account of altogether, which makes it difficult to interpret the evidence as highlighted.
Interpretation of the evidence is further complicated where low physical activ-ity is conceptualised as sedentary behaviour, as for example in the study by Popkin et al. (2006). Individuals that are not meeting physical activity guidelines may be wrongly classified as ‘sedentary’. Defined as “any waking behaviour with low energy expenditure (≤1.5 metabolic equivalents) while in a sitting or reclining posture” (p. 540) (Sedentary Behaviour Research Network, 2012), growing evidence suggests that prolonged sedentary time is independently associated with deleterious health outcomes independent of the level of physical activity (Biswas et al., 2015). Disentangling these rela-tionships will be important, with for example Ekelund et al. (2016) showing that moderate levels of physical activity reduced the increased mortality risks associated with high sitting time.
Box 2 Examples of moderate-intensity and vigorous-intensity physical activity
One MET is equivalent to an energy consumption of 1 kilocalorie per kilogram of bodyweight per
hour (i.e. energy cost of sitting quietly).
Examples of moderate-intensity physical activityEquivalent to approximately 3–6 METs; requires a moderate amount of effort and noticeably accelerates the heart rate
Examples of vigorous-intensity physical activityEquivalent to approximately >6 METs; requires a large amount of effort and causes rapid breathing and a substantial increase in heart rate
• Brisk walking• Dancing• Gardening• Housework and domestic chores• Traditional hunting and gathering• Active involvement in games and sports
with children/walking domestic animals• General building tasks (e.g. roofing, thatching,
painting)• Carrying/moving moderate loads (<20kg)
• Running• Walking/climbing briskly up a hill• Fast cycling• Aerobics• Fast swimming• Competitive sports and games (e.g.
traditional games, football, volleyball, hockey, basketball)
• Heavy shovelling or digging ditches• Carrying/moving heavy loads (>20kg)
Source: World Health Organization, 2004.
Assessing the economic costs of unhealthy diets and low physical activity16
3.2 Costing studies differ in key assumptions, influencing estimates for the economic burden of unhealthy diets and low physical activity
As noted earlier, reviewed studies considered different numbers of diseases to derive estimates of the economic burden that can be associated with unhealthy diets or low physical activity. The most common conditions considered include coronary heart disease, stroke, type 2 diabetes and colorectal and breast cancer, with Garrett et al. (2004) also adding mood and anxiety disorders as directly related to individual physical activity patterns in adults. The range and combi-nation of disease groups varied among studies, as did the main approaches to estimating costs, including the use of population-attributable fractions; consid-eration of lag times between exposure to a given risk factor, the development of disease and ensuing cost; and the conceptualisation of economic cost itself, which we briefly discuss here.
3.2.1 Use of population-attributable fractions
Fourteen reviewed studies used population-attributable fractions (PAFs) to assess the contribution of unhealthy diets or low physical activity to a range of diseases (or death) as a basis to estimate the economic burden that can be attributed to either risk factor.
As noted earlier, the PAF generally refers to the proportion of cases for a given outcome of interest that can be attributed to a given risk factor among the entire population. Calculation of PAFs commonly uses a relative risk that has been adjusted for potential confounders of the association between risk factors and outcomes, such as age or sex, and the prevalence of exposure in the population under investigation (the partially-adjusted method). However, where confound-ing or effect modification affects the relative risk, the estimate of the attribut-able fraction is potentially biased even if the relative risk has been adjusted for confounding (Benichou, 2001). This is likely to be the case for the unhealthy diet and low physical activity–disease relationships, with multiple factors, in addition to age and sex, such as family history or physiological risk factors such as weight found to confound the association (Laaksonen et al., 2009; Li et al., 2015; Montonen et al., 2005).
Baliunas (2011) compared the partially-adjusted method for estimating popu-lation-attributable fractions with the fully-adjusted approach, which stratifies the relative risk according to confounder or effect modifier. The comparison was applied to mortality from lung cancer, ischaemic heart disease, chronic obstruc-tive pulmonary disease and cerebrovascular disease related to smoking. It found that the partially-adjusted method overestimated the attributable fractions by

Estimating the economic costs of unhealthy diets and low physical activity is complex 17
10%. The majority of studies reviewed in this volume have used the partially-adjusted method, and cost estimates are therefore likely to be biased, although the direction of the bias is not clear. The use of a fully-adjusted method would reduce the risk of over- or under-estimating the ‘true’ association between risk factors and costs.
In addition, population-attributable fractions used in the reviewed studies varied widely. This is illustrated further in Table 4 for PAFs used for costing studies of low physical activity.
This variation reflects, to great extent, the source of PAFs and whether they were adjusted for the population under investigation. For example, Allender et al. (2007) and Scarborough et al. (2011), in their analyses of the economic burden of ill health that can be attributed to low physical activity in the United Kingdom in the mid-2000s, used PAFs that were produced in the context of the first Global Burden of Disease study for the western European population (Murray & Lopez, 1997). There is uncertainty about the degree to which these PAFs are applicable to the country they were used for (in this case the United Kingdom) as PAFs should take account of the underlying prevalence of a risk factor in the population under study. Although a sensitivity analysis by Scarborough et al. (2011) revealed little impact of the choice of PAFs on the cost estimates for low physical activity, population-specific PAFs remain preferable to increase the accuracy of estimates.
3.2.2 Consideration of time lags between risk factor exposure, disease development and associated costs
Reviewed studies tended to apply population-attributable fractions using the prevalence of a given risk factor (unhealthy diets, low physical activity) in a given
Table 4 Population-attributable fractions used in costing studies: low physical
activity
Ischaemic heart disease (%)
Stroke (%)
Diabetes type 2 (%)
Breast cancer (%)
Colon cancer (%)
Katzmarzyk et al. (2000) 36 20 20 11 20
Garett et al. (2004) 31 31 18 19 31
Allender et al. (2007) 23 – 15 11 16
Katzmarzyk (2011) 18 23 20 13 17
Scarborough et al. (2011) 23 12 15 11 –
Janssen (2012) 26 (m)* 27 (f)
25 (m)* 26(f)
38 (m)*29 (f)
15 (f)* 24 (m, f)*
Zhang & Chaaban (2012) 12 16 14 – –
Maresova (2014) 7 3 4 3 4
Note: * m – males; f – females
Assessing the economic costs of unhealthy diets and low physical activity18
year and estimating the related disease costs incurred in the same year (Allender et al., 2007; Garrett et al., 2004; Janssen, 2012; Katzmarzyk, 2011; Katzmarzyk et al., 2000; Maresova, 2014; Popkin et al., 2006; Scarborough et al., 2011; Zhang & Chaaban, 2012). Such an approach ignores the time lag between exposure to the given risk factor and the development of disease. For example, Weyer et al. (1999) found that it takes approximately five years between the initial normal glucose-tolerant stages and the development of clinically verified type 2 diabetes. Where the development of diabetes can be linked to unhealthy diet or low physical activity at the outset, associated economic costs would thus be expected to emerge only after five years at the earliest. Therefore, accurately estimating the cost that can be attributed to unhealthy diets or low physical activity would need to take account of the time it takes for the natural progression of exposure to disease.
3.3 The nature and range of costs considered is likely to underestimate the ‘true’ economic burden of unhealthy diets and physical activity
Reviewed studies tended only to consider costs that can be associated with primary disease outcomes, such as type 2 diabetes or coronary heart disease. Yet, a full costing would also need to take account of complications associated with the primary disease outcome. Considering, for example, type 2 diabetes: data from the UK National Diabetes Audit found that within a one-year follow-up period between 2011–12 and 2012–13, people with type 2 diabetes were significantly more likely than those without diabetes to be admitted to hospital for complications such as angina, at 135.1%, heart failure (121.1%), heart attack (87.6%) or stroke (59.1%) (Health and Social Care Information Centre, 2015). Disregarding the costs associated with the development of complications will inevitably underestimate the true economic burden that can be associated with a given risk factor, but this also assumes that it is possible to quantify the contribution of the risk factor under consideration to the observed complication.
Furthermore, the majority of reviewed studies considered only the direct health care costs, further underestimating the true economic burden that can be associ-ated with unhealthy diets or low physical activity (see also Box 3). For example, three Canadian studies that had analysed the costs associated with low physical activity found indirect costs caused by lost productivity to be about twice as high as direct health care costs, and together these accounted for between 0.4% and 0.6% of gross domestic product (GDP) (Janssen, 2012; Katzmarzyk, 2011; Krueger et al., 2015). It is difficult to generalise from these studies to other settings and it will be important to broaden existing costing estimates to also capture indirect costs in order to better understand the size of the burden that can be associated with the two risk factors.
Estimating the economic costs of unhealthy diets and low physical activity is complex 19
3.4 Conceptual and methodological challenges of estimating the economic costs of unhealthy diets and low physical activity: a summary
This section reviewed the measurement and methodological issues in assessing the economic burden of unhealthy diet and low levels of activity. We note that the measurement of what constitutes an ‘unhealthy’ diet is made more difficult by there being positive effects of some foods, negative effects of others and interactions between the effects of different foods. Calibrating the extent of deviation from optimal consumption and the effects of this deviation is difficult. It is also clear that the context should be taken into account in terms of other population characteristics.
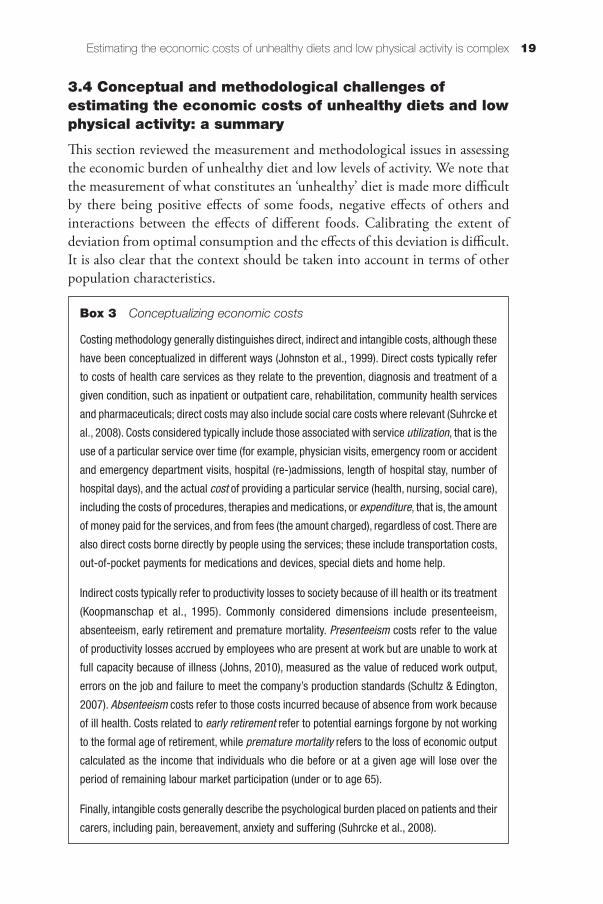
Box 3 Conceptualizing economic costs
Costing methodology generally distinguishes direct, indirect and intangible costs, although these
have been conceptualized in different ways (Johnston et al., 1999). Direct costs typically refer
to costs of health care services as they relate to the prevention, diagnosis and treatment of a
given condition, such as inpatient or outpatient care, rehabilitation, community health services
and pharmaceuticals; direct costs may also include social care costs where relevant (Suhrcke et
al., 2008). Costs considered typically include those associated with service utilization, that is the
use of a particular service over time (for example, physician visits, emergency room or accident
and emergency department visits, hospital (re-)admissions, length of hospital stay, number of
hospital days), and the actual cost of providing a particular service (health, nursing, social care),
including the costs of procedures, therapies and medications, or expenditure, that is, the amount
of money paid for the services, and from fees (the amount charged), regardless of cost. There are
also direct costs borne directly by people using the services; these include transportation costs,
out-of-pocket payments for medications and devices, special diets and home help.
Indirect costs typically refer to productivity losses to society because of ill health or its treatment
(Koopmanschap et al., 1995). Commonly considered dimensions include presenteeism,
absenteeism, early retirement and premature mortality. Presenteeism costs refer to the value
of productivity losses accrued by employees who are present at work but are unable to work at
full capacity because of illness (Johns, 2010), measured as the value of reduced work output,
errors on the job and failure to meet the company’s production standards (Schultz & Edington,
2007). Absenteeism costs refer to those costs incurred because of absence from work because
of ill health. Costs related to early retirement refer to potential earnings forgone by not working
to the formal age of retirement, while premature mortality refers to the loss of economic output
calculated as the income that individuals who die before or at a given age will lose over the
period of remaining labour market participation (under or to age 65).
Finally, intangible costs generally describe the psychological burden placed on patients and their
carers, including pain, bereavement, anxiety and suffering (Suhrcke et al., 2008).
Assessing the economic costs of unhealthy diets and low physical activity20
While there is more consensus about the measurement of physical activity, similar issues arise in terms of the independent effects of moderate and vigorous activity and sedentary behaviour, but also the interactions between these. Studies take broader and narrower perspectives in terms of what costs are included, with some limited to formal health care costs, and others aiming to take a more societal view. While current evidence makes it difficult to make accurate comparisons, it is likely that much of the economic burden comes from non-health care costs, especially from effects on productivity, absenteeism, presenteeism and other indirect costs.
Chapter 4Taking available approaches
to determining the economic costs of unhealthy diets and low physical activity further: a proof-
of-concept approach applied to five European countries
This chapter develops a bottom-up framework for assessing the costs of unhealthy diets and low physical activity using a disease-based approach. Building on the insights from the evidence review and critical appraisal of measurement and methodological issues in the preceding sections, this section builds a framework for assessing costs of unhealthy diets and low physical activity. It then applies this framework as a proof-of-concept to demonstrate the feasibility of undertaking a comprehensive, bottom-up cost assessment that addresses some of the identified limitations of existing costing studies.
The evidence review demonstrated that there are essentially two approaches to estimating the economic burden associated with unhealthy diets and low physical activity. One involves the use of a disease-based approach, based on the observation that the two risk factors have been identified to be causally related to major chronic diseases such as coronary heart disease, stroke, type 2 diabetes and selected cancers (Lee et al., 2012; Micha et al., 2015), which have been associated with considerable costs to health care systems and wider society through productivity losses (European Commission, 2014). About half of the reviewed studies adopted the disease-based approach, typically using the population-attributable fraction to quantify the contribution of the individual risk factor (unhealthy diet, low physical activity) to the burden of a given disease or death and the associated economic costs. An alternative method involves a generic, non-disease-based approach that uses individual data on unhealthy diets or low physical activity data and links these to (health care) cost data, regardless of the type of disease or diagnosis. This second approach requires availability of and access to individual-level data on dietary and physical activity patterns along with data on health care use and productivity. Such data are difficult to access even within individual country settings, let alone in multiple countries.
Assessing the economic costs of unhealthy diets and low physical activity22
We use a disease-based approach to estimate the costs that can be associ-ated with unhealthy diets and low physical activity. Diseases associated with these lifestyle factors include coronary heart disease, stroke, type 2 diabetes and selected cancers (Box 4) (Lee et al., 2012; Micha et al., 2015). As a test of concept we apply the framework using type 2 diabetes. This was chosen because of the strong association of type 2 diabetes with either risk factor, as shown in the literature. Diabetes is already an important public health issue but perhaps more importantly, globally the number of people with diabetes has doubled during the past 20 years, making it a growing challenge for health systems (Zimmet et al., 2014). Estimates for the early 2000s place the costs for type 2 diabetes in the EU at some 7.4% of total health care expendi-ture, compared to 12% for cardiovascular diseases (Muka et al., 2015). More recently, expenditure on diabetes was estimated to account for some 9% of total health care expenditure in the European region in 2015 (International Diabetes Federation, 2015).
Taking a disease-based approach, we used population-attributable fractions to provide population-level quantitative estimates for the economic costs that
Box 4 Health risks associated with unhealthy diets and low physical activity
A wide range of studies have presented convincing or probable evidence for an association
between the intake of selected foods and food groups and major chronic conditions (Micha et
al., 2015). For example, coronary heart disease has been linked to intake of fruit and vegetables,
nuts and legumes, whole grains, fish, and red and processed meat (Afshin et al., 2014; Aune
et al., 2016; Boeing et al., 2012; Micha et al., 2010; Zheng et al., 2012); stroke to fruit and
vegetables, nuts and legumes, fish, and red and processed meat (Afshin et al., 2014; Boeing
et al., 2012; Chowdhury et al., 2012, Micha et al., 2010; Zheng et al., 2012), type 2 diabetes
to nuts and legumes, whole grains, red and processed meats (Afshin et al., 2014; Aune et al.,
2016; Micha et al., 2010; Zheng et al., 2012) and selected cancers to fruit and vegetables, nuts
and legumes, whole grains, fish, and red and processed meats (Aune et al., 2016; Boeing et
al., 2012; Bouvard et al., 2015; World Cancer Research Fund and American Institute for Cancer
Research, 2007). Based on the available evidence, Micha et al. (2015) concluded that “even
modest dietary changes are associated with meaningful reductions in [cardiovascular disease]
morbidity and mortality, type 2 diabetes [and] specific cancer sites” (p. 2), along with major risk
factors, such as hypercholesterolaemia, hypertension and obesity.
These conditions have also been linked to physical activity, with Warburton et al. (2010)
demonstrating that low physical activity was associated with an increased risk for cardiovascular
disease, stroke, hypertension, colon and breast cancer and type 2 diabetes. The authors further
demonstrated that higher levels of physical activity reduced the risk for premature all-cause
mortality.
23A proof-of-concept approach
can be associated with unhealthy diets and low physical activity. In the light of the reviewed evidence, we adapted the PAF methodology by (i) using a full-adjustment formula that takes account of confounding between unhealthy diets and low physical activity and associated diseases; (ii) incorporating a time per-spective that takes account of the natural progression from risk factor exposure to the development of disease; (iii) applying the PAFs to costs based on data on incidence rather than prevalence; (iv) estimating the direct costs that can be associated with the primary outcome and those associated with complications using the annual incidence rates for complications; and (v) considering indirect costs of productivity losses as a consequence of absenteeism, presenteeism, work disability, early retirement and premature mortality.
The following sections provide a sample computation of the economic costs of unhealthy diets and low physical activity in five European countries: France, Germany, Italy, Spain and the United Kingdom, using type 2 diabetes and its complications as the primary outcome.
4.1 Diabetes as an outcome of unhealthy diets and low physical activity
As noted above, we chose type 2 diabetes as the primary outcome because of the convincingly strong evidence of its association with unhealthy diets and low physical activity (Afshin et al., 2014; Micha et al., 2010; Warburton et al., 2010; Zheng et al., 2012). Diabetes mellitus, commonly referred to as diabetes, is a group of metabolic diseases characterized by high levels of sugar in the blood for a prolonged period of time.
The most common form of diabetes is type 2, which typically occurs in adults, although it is increasingly seen in young people, including children (Zimmet et al., 2014). It results primarily from insulin resistance, and at later stages the pancreas may also fail to produce sufficient levels of insulin. Insulin resistance in type 2 diabetes is associated mainly with high bodyweight and low physical activity. The role of genetic factors in the development of type 2 diabetes tends to be small compared to lifestyle and clinical factors such as increased body-weight, elevated liver enzymes, current smoking status and reduced measures of insulin secretion and action (Lyssenko et al., 2008). Factors that increase the likelihood of developing diabetes include high consumption of sugar-sweetened drinks (Malik et al., 2010a; Malik et al., 2010b), of saturated and trans-fatty acids (Risérus et al., 2009) and of refined grains such as white rice (de Bakker et al., 2012), which, when metabolised to glucose, increase blood sugar levels. Low physical activity has also been linked to type 2 diabetes through causing insulin resistance (Warburton et al., 2010) (Figure 1).
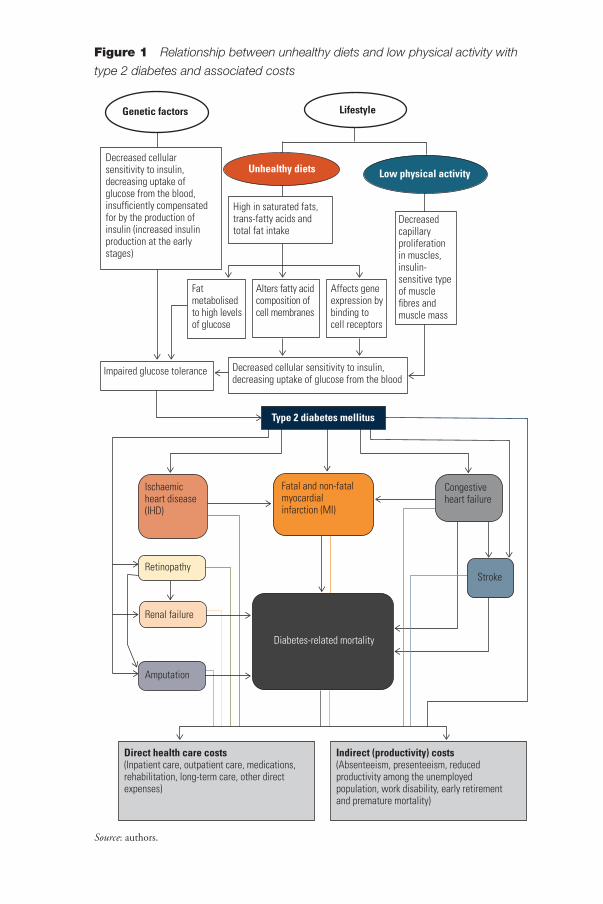
Figure 1 Relationship between unhealthy diets and low physical activity with
type 2 diabetes and associated costs
Source: authors.
Decreased cellular sensitivity to insulin, decreasing uptake of glucose from the blood, insufficiently compensated for by the production of insulin (increased insulin production at the early stages)
Genetic factors Lifestyle
High in saturated fats, trans-fatty acids and total fat intake
Fat metabolised to high levels of glucose
Alters fatty acid composition of cell membranes
Affects gene expression by binding to cell receptors
Low physical activity Unhealthy diets
Impaired glucose tolerance Decreased cellular sensitivity to insulin, decreasing uptake of glucose from the blood
Decreased capillary proliferation in muscles, insulin-sensitive type of muscle fibres and muscle mass
Ischaemic heart disease (IHD)
Retinopathy
Renal failure
Amputation
Type 2 diabetes mellitus
Fatal and non-fatal myocardial infarction (MI)
Diabetes-related mortality
Congestive heart failure
Stroke
Direct health care costs(Inpatient care, outpatient care, medications, rehabilitation, long-term care, other direct expenses)
Indirect (productivity) costs (Absenteeism, presenteeism, reduced productivity among the unemployed population, work disability, early retirement and premature mortality)
25A proof-of-concept approach
4.2 The principal approach used in this study to estimate the economic costs that can be associated with unhealthy diets and low physical activity
The identification of the economic costs that can be associated with unhealthy diets and low physical activity as conceptualised in this study involves five principal steps:
1. determining the prevalence of unhealthy diets and low physical activ-ity among the general population and estimating the prevalence in populations eventually developing the disease using adjustment factors;
2. determining the population-attributable fraction, or the proportion of cases attributable to unhealthy diets and low physical activity;
3. estimating the proportion of incident diabetes cases in future year X that can be attributed to present unhealthy diets and low physical activity patterns;
4. estimating the average annual per patient health care costs that can be associated with diabetes and with diabetic complications to yield diabetes-related direct costs; and
5. estimating the indirect costs that can be associated with diabetes attributable to unhealthy diets and low physical activity.
We discuss these steps in turn.
4.2.1 Determining the prevalence of unhealthy diets and low physical activity
Our proposed approach requires knowledge of the prevalence of the risk factor (here: unhealthy diets, low physical activity) among populations that eventu-ally develop the outcome (here: type 2 diabetes), rather than among the general population, in order to enhance the accuracy of the estimation of costs that can be associated with the given risk factor. For low physical activity, we drew on work by Lee et al. (2012) who calculated adjustment factors for different out-comes (coronary heart disease, type 2 diabetes, breast and colon cancer, and those who died) to identify the added extent to which low physical activity occurred in people who eventually developed the outcome in question compared to the general population. Lee et al. (2012) illustrate this with an example from the Shanghai Women’s Health Study, where the prevalence of low physical activity in all women at baseline was 45.4% compared to 51.6% among women who eventually died, yielding an adjustment factor of 1.14 (51.6/45.4 = 1.14). They then calculated such an adjustment factor for a large number of original studies, and, for type 2 diabetes, derived a factor of 1.23 after averaging estimates across studies (for comparison, adjustment factors for coronary heart disease or colon
Assessing the economic costs of unhealthy diets and low physical activity26
cancer were 1.20 and 1.22, respectively, and for breast cancer, it was 1.05). We used the adjustment factor of 1.23 to estimate the prevalence of low physical activity among people who will eventually develop diabetes in France, Germany, Italy, Spain and the United Kingdom.
Data on prevalence for low physical activity in the five countries were derived from the WHO Global Health Observatory database (World Health Organization, 2016). According to this source, the proportion of the general population who were not active, or who did not meet the recommendations of at least 150 minutes per week of moderate-intensity physical activity or at least 75 minutes per week of vigorous-intensity physical activity in 2010 were: 23.8% in France, 21.1% in Germany, 33.2% in Italy, 30.5% in Spain and 37.3% in the United Kingdom. Applying the adjustment factor of 1.23 to these rates yielded esti-mated prevalence rates of 29.3% in France, 26% in Germany, 40.8% in Italy, 37.5% in Spain and 45.9% in the United Kingdom among populations who will eventually develop diabetes.
In contrast to low physical activity, determining the prevalence rate for unhealthy diets is more complex given the limited availability of appropriate data. We drew on the alternate healthy eating index (AHEI) 2010 developed by Chiuve et al. (2012). The AHEI assesses components of the diet by assigning scores ranging from 0 (worst) to 10 (best) (Table 5); scores between 67 and 110 are rated as adherence to what has been described as a healthy diet that emphasises high intakes of whole grains, polyunsaturated fatty acids, nuts and fish, and reduc-tions in red and processed meats, refined grains and sugar-sweetened beverages. As noted above, studies found that diets that scored highly on the AHEI were shown to be associated with a significant reduction in the risk of all-cause mortality, cardiovascular disease, cancer and type 2 diabetes by around 20% (Schwingshackl & Hoffmann, 2015).
We used the European Food Safety Authority (EFSA) Database to estimate the prevalence of unhealthy diets in the five countries under study. The EFSA contains information on the mean consumption of over 1500 food items in European countries, based on data from national dietary surveys (European Food and Safety Authority, 2015). Based on these data, we derived the mean intake of AHEI food groups for each country (Appendix 3) and allocated AHEI scores as shown in Table 6. Assuming that the figures shown in Appendix 3 and Table 6 are representative of the five countries as a whole, we estimate the proportions of those following an unhealthy diet to be 44% of the general population in France, 25% in Germany, 33.9% in Italy, 34.6% in Spain and 26.5% in the United Kingdom, as assessed by scores of 43% (France), 34% (Germany), 58% (Italy), 48% (Spain) and 37% (the United Kingdom) according to the 2010 alternate healthy eating index.
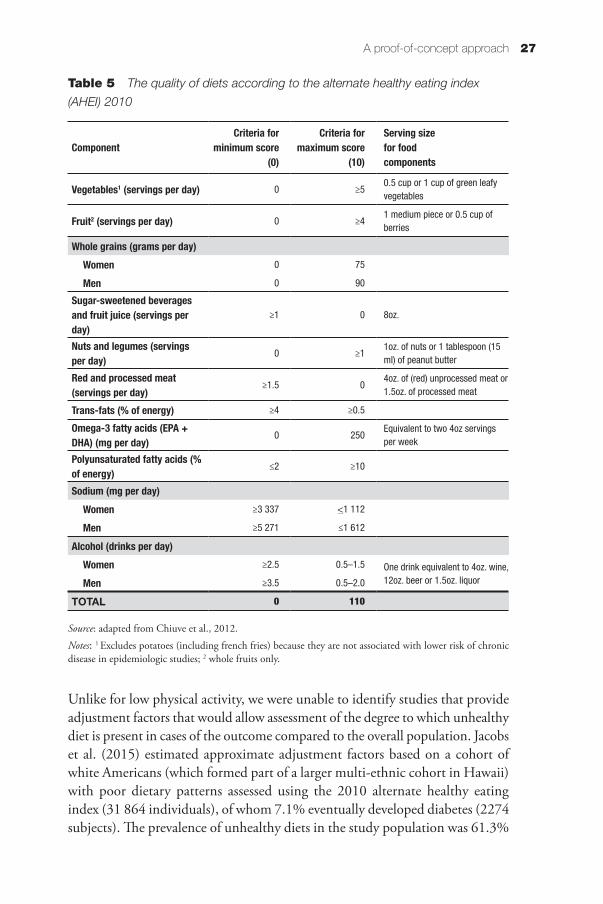
27A proof-of-concept approach
Unlike for low physical activity, we were unable to identify studies that provide adjustment factors that would allow assessment of the degree to which unhealthy diet is present in cases of the outcome compared to the overall population. Jacobs et al. (2015) estimated approximate adjustment factors based on a cohort of white Americans (which formed part of a larger multi-ethnic cohort in Hawaii) with poor dietary patterns assessed using the 2010 alternate healthy eating index (31 864 individuals), of whom 7.1% eventually developed diabetes (2274 subjects). The prevalence of unhealthy diets in the study population was 61.3%
Table 5 The quality of diets according to the alternate healthy eating index
(AHEI) 2010
ComponentCriteria for
minimum score (0)
Criteria for maximum score
(10)
Serving size for food components
Vegetables1 (servings per day) 0 ≥50.5 cup or 1 cup of green leafy vegetables
Fruit2 (servings per day) 0 ≥41 medium piece or 0.5 cup of berries
Whole grains (grams per day)Women 0 75
Men 0 90
Sugar-sweetened beverages and fruit juice (servings per day)
≥1 0 8oz.
Nuts and legumes (servings per day)
0 ≥11oz. of nuts or 1 tablespoon (15 ml) of peanut butter
Red and processed meat (servings per day)
≥1.5 04oz. of (red) unprocessed meat or 1.5oz. of processed meat
Trans-fats (% of energy) ≥4 ≥0.5
Omega-3 fatty acids (EPA + DHA) (mg per day)
0 250Equivalent to two 4oz servings per week
Polyunsaturated fatty acids (% of energy)
≤2 ≥10
Sodium (mg per day)Women ≥3 337 <1 112
Men ≥5 271 ≤1 612
Alcohol (drinks per day)Women ≥2.5 0.5–1.5 One drink equivalent to 4oz. wine,
12oz. beer or 1.5oz. liquorMen ≥3.5 0.5–2.0
TOTAL 0 110
Source: adapted from Chiuve et al., 2012.
Notes: 1 Excludes potatoes (including french fries) because they are not associated with lower risk of chronic disease in epidemiologic studies; 2 whole fruits only.
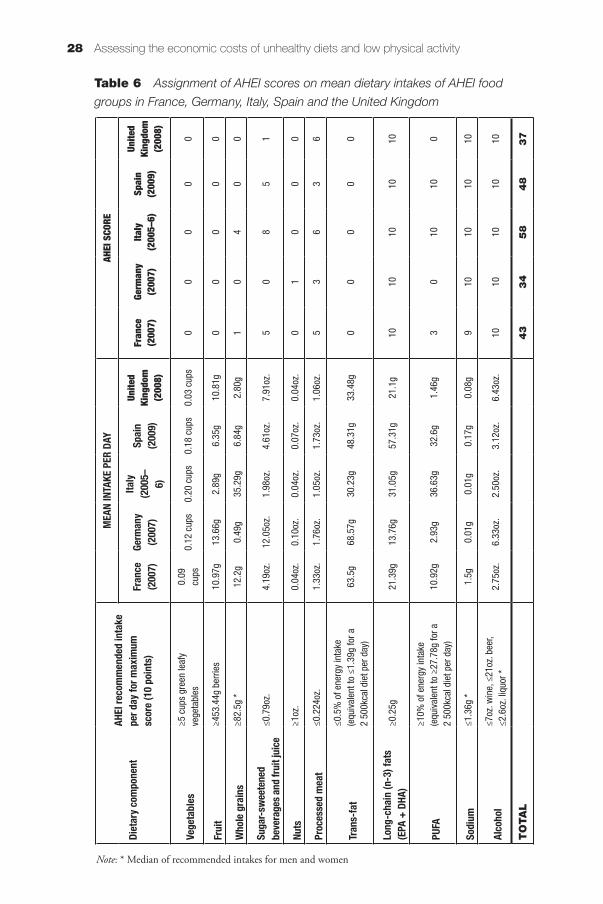
Assessing the economic costs of unhealthy diets and low physical activity28
Diet
ary c
ompo
nent
AHEI
reco
mm
ende
d in
take
pe
r day
for m
axim
um
scor
e (10
poi
nts)
MEA
N IN
TAKE
PER
DAY
AHEI
SCO
RE
Fran
ce
(200
7)Ge
rman
y (2
007)
Italy
(200
5–6)
Spai
n (2
009)
Unite
d Ki
ngdo
m
(200
8)
Fran
ce
(200
7)Ge
rman
y (2
007)
Italy
(2
005–
6)Sp
ain
(200
9)
Unite
d Ki
ngdo
m
(200
8)
Vege
tabl
es≥5
cup
s gr
een
leaf
y ve
geta
bles
0.09
cu
ps0.
12 c
ups
0.20
cup
s0.
18 c
ups
0.03
cup
s0
00
00
Frui
t≥4
53.4
4g b
errie
s10
.97g
13.6
6g2.
89g
6.35
g10
.81g
00
00
0
Who
le gr
ains
≥82.
5g *
12.2
g0.
49g
35.2
9g6.
84g
2.80
g1
04
00
Suga
r-swe
eten
ed
beve
rage
s and
frui
t jui
ce≤0
.79o
z.4.
19oz
.12
.05o
z.1.
98oz
.4.
61oz
.7.
91oz
.5
08
51
Nuts
≥1oz
.0.
04oz
.0.
10oz
.0.
04oz
.0.
07oz
.0.
04oz
.0
10
00
Proc
esse
d m
eat
≤0.2
24oz
.1.
33oz
.1.
76oz
.1.
05oz
.1.
73oz
.1.
06oz
.5
36
36
Tran
s-fa
t≤0
.5%
of e
nerg
y in
take
(e
quiv
alen
t to
≤1.3
9g fo
r a
2 50
0kca
l die
t per
day
)63
.5g
68.5
7g30
.23g
48.3
1g33
.48g
00
00
0
Long
-cha
in (n
-3) f
ats
(EPA
+ D
HA)
≥0.2
5g21
.39g
13.7
6g31
.05g
57.3
1g21
.1g
1010
1010
10
PUFA
≥10%
of e
nerg
y in
take
(e
quiv
alen
t to
≥27.
78g
for a
2
500k
cal d
iet p
er d
ay)
10.9
2g2.
93g
36.6
3g32
.6g
1.46
g3
010
100
Sodi
um≤1
.36g
*1.
5g0.
01g
0.01
g0.
17g
0.08
g9
1010
1010
Alco
hol
≤7oz
. win
e, ≤
21oz
. bee
r, ≤2
.6oz
. liq
uor *
2.75
oz.
6.33
oz.
2.50
oz.
3.12
oz.
6.43
oz.
1010
1010
10
TO
TA
L4
33
45
84
83
7
Table 6 Assignment of AHEI scores on mean dietary intakes of AHEI food
groups in France, Germany, Italy, Spain and the United Kingdom
Note: * Median of recommended intakes for men and women
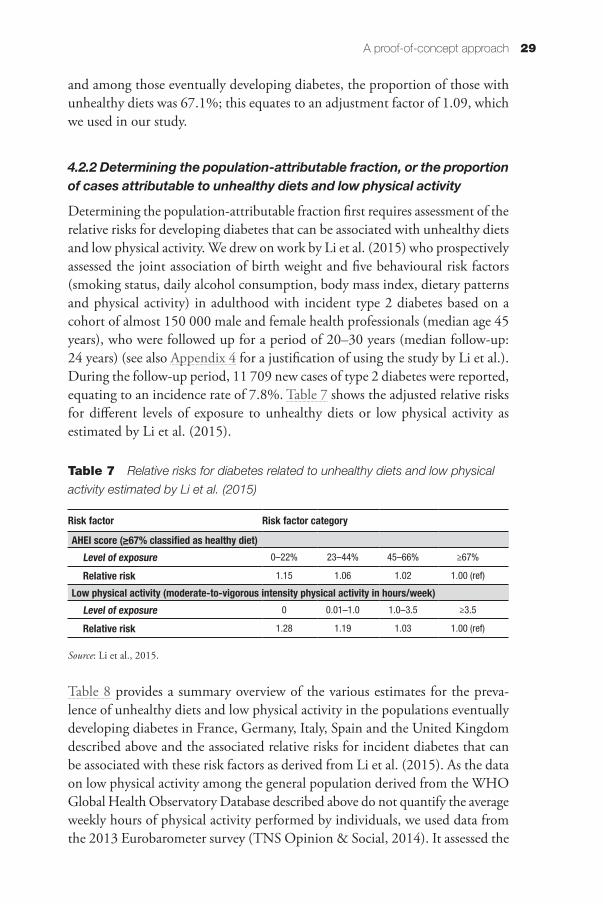
29A proof-of-concept approach
and among those eventually developing diabetes, the proportion of those with unhealthy diets was 67.1%; this equates to an adjustment factor of 1.09, which we used in our study.
4.2.2 Determining the population-attributable fraction, or the proportion of cases attributable to unhealthy diets and low physical activity
Determining the population-attributable fraction first requires assessment of the relative risks for developing diabetes that can be associated with unhealthy diets and low physical activity. We drew on work by Li et al. (2015) who prospectively assessed the joint association of birth weight and five behavioural risk factors (smoking status, daily alcohol consumption, body mass index, dietary patterns and physical activity) in adulthood with incident type 2 diabetes based on a cohort of almost 150 000 male and female health professionals (median age 45 years), who were followed up for a period of 20–30 years (median follow-up: 24 years) (see also Appendix 4 for a justification of using the study by Li et al.). During the follow-up period, 11 709 new cases of type 2 diabetes were reported, equating to an incidence rate of 7.8%. Table 7 shows the adjusted relative risks for different levels of exposure to unhealthy diets or low physical activity as estimated by Li et al. (2015).
Table 7 Relative risks for diabetes related to unhealthy diets and low physical
activity estimated by Li et al. (2015)
Risk factor Risk factor category
AHEI score (≥67% classified as healthy diet)Level of exposure 0–22% 23–44% 45–66% ≥67%
Relative risk 1.15 1.06 1.02 1.00 (ref)
Low physical activity (moderate-to-vigorous intensity physical activity in hours/week)Level of exposure 0 0.01–1.0 1.0–3.5 ≥3.5
Relative risk 1.28 1.19 1.03 1.00 (ref)
Source: Li et al., 2015.
Table 8 provides a summary overview of the various estimates for the preva-lence of unhealthy diets and low physical activity in the populations eventually developing diabetes in France, Germany, Italy, Spain and the United Kingdom described above and the associated relative risks for incident diabetes that can be associated with these risk factors as derived from Li et al. (2015). As the data on low physical activity among the general population derived from the WHO Global Health Observatory Database described above do not quantify the average weekly hours of physical activity performed by individuals, we used data from the 2013 Eurobarometer survey (TNS Opinion & Social, 2014). It assessed the
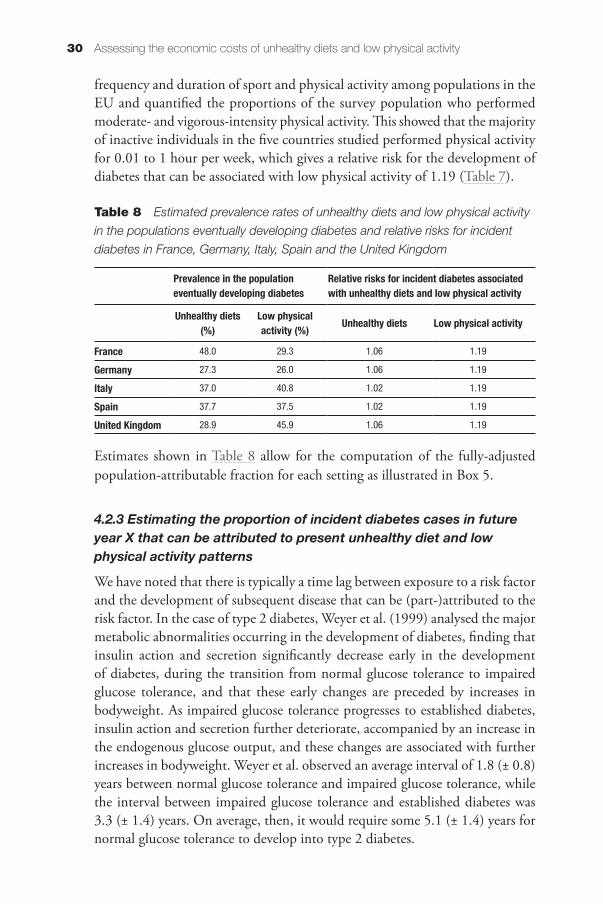
Assessing the economic costs of unhealthy diets and low physical activity30
frequency and duration of sport and physical activity among populations in the EU and quantified the proportions of the survey population who performed moderate- and vigorous-intensity physical activity. This showed that the majority of inactive individuals in the five countries studied performed physical activity for 0.01 to 1 hour per week, which gives a relative risk for the development of diabetes that can be associated with low physical activity of 1.19 (Table 7).
Table 8 Estimated prevalence rates of unhealthy diets and low physical activity
in the populations eventually developing diabetes and relative risks for incident
diabetes in France, Germany, Italy, Spain and the United Kingdom
Prevalence in the population eventually developing diabetes
Relative risks for incident diabetes associated with unhealthy diets and low physical activity
Unhealthy diets (%)
Low physical activity (%) Unhealthy diets Low physical activity
France 48.0 29.3 1.06 1.19
Germany 27.3 26.0 1.06 1.19
Italy 37.0 40.8 1.02 1.19
Spain 37.7 37.5 1.02 1.19
United Kingdom 28.9 45.9 1.06 1.19
Estimates shown in Table 8 allow for the computation of the fully-adjusted population-attributable fraction for each setting as illustrated in Box 5.
4.2.3 Estimating the proportion of incident diabetes cases in future year X that can be attributed to present unhealthy diet and low physical activity patterns
We have noted that there is typically a time lag between exposure to a risk factor and the development of subsequent disease that can be (part-)attributed to the risk factor. In the case of type 2 diabetes, Weyer et al. (1999) analysed the major metabolic abnormalities occurring in the development of diabetes, finding that insulin action and secretion significantly decrease early in the development of diabetes, during the transition from normal glucose tolerance to impaired glucose tolerance, and that these early changes are preceded by increases in bodyweight. As impaired glucose tolerance progresses to established diabetes, insulin action and secretion further deteriorate, accompanied by an increase in the endogenous glucose output, and these changes are associated with further increases in bodyweight. Weyer et al. observed an average interval of 1.8 (± 0.8) years between normal glucose tolerance and impaired glucose tolerance, while the interval between impaired glucose tolerance and established diabetes was 3.3 (± 1.4) years. On average, then, it would require some 5.1 (± 1.4) years for normal glucose tolerance to develop into type 2 diabetes.
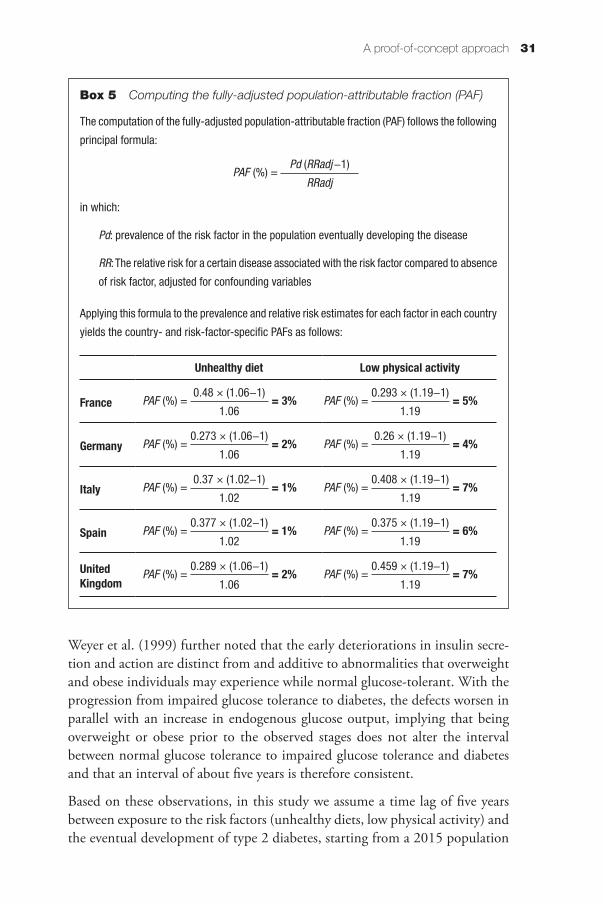
31A proof-of-concept approach
Weyer et al. (1999) further noted that the early deteriorations in insulin secre-tion and action are distinct from and additive to abnormalities that overweight and obese individuals may experience while normal glucose-tolerant. With the progression from impaired glucose tolerance to diabetes, the defects worsen in parallel with an increase in endogenous glucose output, implying that being overweight or obese prior to the observed stages does not alter the interval between normal glucose tolerance to impaired glucose tolerance and diabetes and that an interval of about five years is therefore consistent.
Based on these observations, in this study we assume a time lag of five years between exposure to the risk factors (unhealthy diets, low physical activity) and the eventual development of type 2 diabetes, starting from a 2015 population
Box 5 Computing the fully-adjusted population-attributable fraction (PAF)
The computation of the fully-adjusted population-attributable fraction (PAF) follows the following
principal formula:
in which:
Pd: prevalence of the risk factor in the population eventually developing the disease
RR: The relative risk for a certain disease associated with the risk factor compared to absence
of risk factor, adjusted for confounding variables
Applying this formula to the prevalence and relative risk estimates for each factor in each country
yields the country- and risk-factor-specific PAFs as follows:
Unhealthy diet Low physical activity
France = 3%0.48 × (1.06−1)
1.06PAF (%) = = 5%
0.293 × (1.19−1)
1.19PAF (%) =
Germany = 2%0.273 × (1.06−1)
1.06PAF (%) = = 4%
0.26 × (1.19−1)
1.19PAF (%) =
Italy = 1%0.37 × (1.02−1)
1.02PAF (%) = = 7%
0.408 × (1.19−1)
1.19PAF (%) =
Spain = 1%0.377 × (1.02−1)
1.02PAF (%) = = 6%
0.375 × (1.19−1)
1.19PAF (%) =
United Kingdom
= 2%0.289 × (1.06−1)
1.06PAF (%) = = 7%
0.459 × (1.19−1)
1.19PAF (%) =
Pd (RRadj−1)
RRadjPAF (%) =
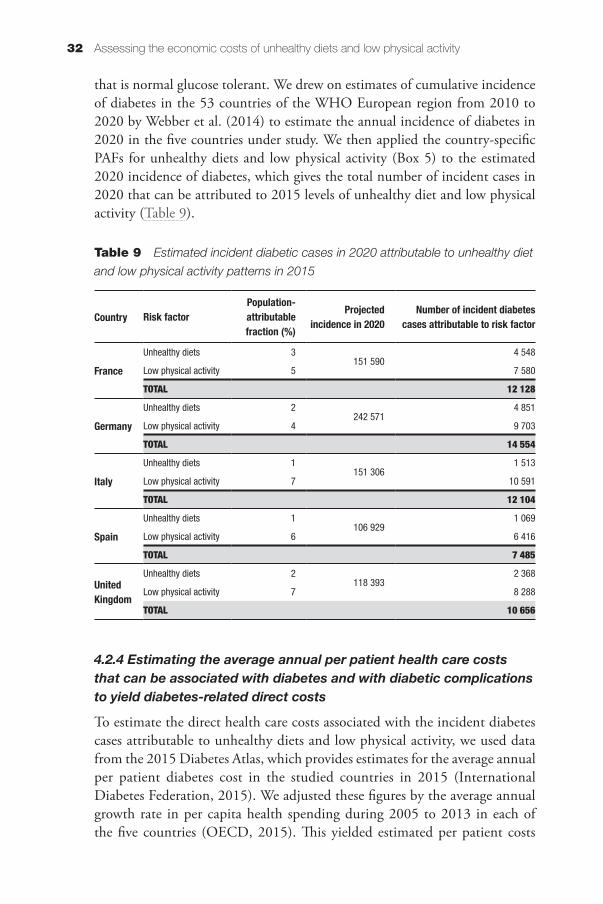
Assessing the economic costs of unhealthy diets and low physical activity32
that is normal glucose tolerant. We drew on estimates of cumulative incidence of diabetes in the 53 countries of the WHO European region from 2010 to 2020 by Webber et al. (2014) to estimate the annual incidence of diabetes in 2020 in the five countries under study. We then applied the country-specific PAFs for unhealthy diets and low physical activity (Box 5) to the estimated 2020 incidence of diabetes, which gives the total number of incident cases in 2020 that can be attributed to 2015 levels of unhealthy diet and low physical activity (Table 9).
Table 9 Estimated incident diabetic cases in 2020 attributable to unhealthy diet
and low physical activity patterns in 2015
Country Risk factorPopulation-attributable fraction (%)
Projected incidence in 2020
Number of incident diabetes cases attributable to risk factor
France
Unhealthy diets 3151 590
4 548
Low physical activity 5 7 580
TOTAL 12 128
Germany
Unhealthy diets 2242 571
4 851
Low physical activity 4 9 703
TOTAL 14 554
Italy
Unhealthy diets 1151 306
1 513
Low physical activity 7 10 591
TOTAL 12 104
Spain
Unhealthy diets 1106 929
1 069
Low physical activity 6 6 416
TOTAL 7 485
United Kingdom
Unhealthy diets 2118 393
2 368
Low physical activity 7 8 288
TOTAL 10 656
4.2.4 Estimating the average annual per patient health care costs that can be associated with diabetes and with diabetic complications to yield diabetes-related direct costs
To estimate the direct health care costs associated with the incident diabetes cases attributable to unhealthy diets and low physical activity, we used data from the 2015 Diabetes Atlas, which provides estimates for the average annual per patient diabetes cost in the studied countries in 2015 (International Diabetes Federation, 2015). We adjusted these figures by the average annual growth rate in per capita health spending during 2005 to 2013 in each of the five countries (OECD, 2015). This yielded estimated per patient costs
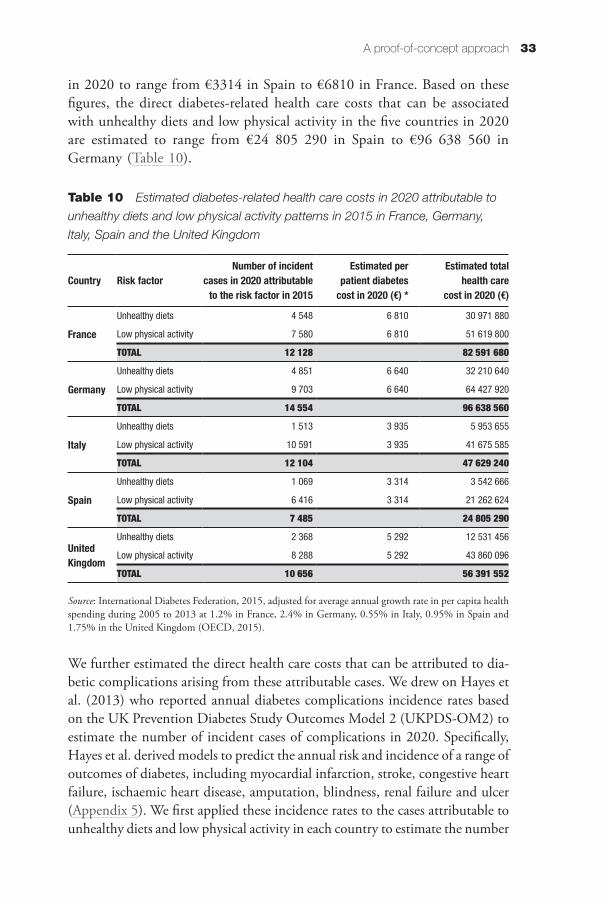
33A proof-of-concept approach
in 2020 to range from €3314 in Spain to €6810 in France. Based on these figures, the direct diabetes-related health care costs that can be associated with unhealthy diets and low physical activity in the five countries in 2020 are estimated to range from €24 805 290 in Spain to €96 638 560 in Germany (Table 10).
Table 10 Estimated diabetes-related health care costs in 2020 attributable to
unhealthy diets and low physical activity patterns in 2015 in France, Germany,
Italy, Spain and the United Kingdom
Country Risk factorNumber of incident
cases in 2020 attributable to the risk factor in 2015
Estimated per patient diabetes
cost in 2020 (€) *
Estimated total health care
cost in 2020 (€)
France
Unhealthy diets 4 548 6 810 30 971 880
Low physical activity 7 580 6 810 51 619 800
TOTAL 12 128 82 591 680
Germany
Unhealthy diets 4 851 6 640 32 210 640
Low physical activity 9 703 6 640 64 427 920
TOTAL 14 554 96 638 560
Italy
Unhealthy diets 1 513 3 935 5 953 655
Low physical activity 10 591 3 935 41 675 585
TOTAL 12 104 47 629 240
Spain
Unhealthy diets 1 069 3 314 3 542 666
Low physical activity 6 416 3 314 21 262 624
TOTAL 7 485 24 805 290
United Kingdom
Unhealthy diets 2 368 5 292 12 531 456
Low physical activity 8 288 5 292 43 860 096
TOTAL 10 656 56 391 552
Source: International Diabetes Federation, 2015, adjusted for average annual growth rate in per capita health spending during 2005 to 2013 at 1.2% in France, 2.4% in Germany, 0.55% in Italy, 0.95% in Spain and 1.75% in the United Kingdom (OECD, 2015).
We further estimated the direct health care costs that can be attributed to dia-betic complications arising from these attributable cases. We drew on Hayes et al. (2013) who reported annual diabetes complications incidence rates based on the UK Prevention Diabetes Study Outcomes Model 2 (UKPDS-OM2) to estimate the number of incident cases of complications in 2020. Specifically, Hayes et al. derived models to predict the annual risk and incidence of a range of outcomes of diabetes, including myocardial infarction, stroke, congestive heart failure, ischaemic heart disease, amputation, blindness, renal failure and ulcer (Appendix 5). We first applied these incidence rates to the cases attributable to unhealthy diets and low physical activity in each country to estimate the number
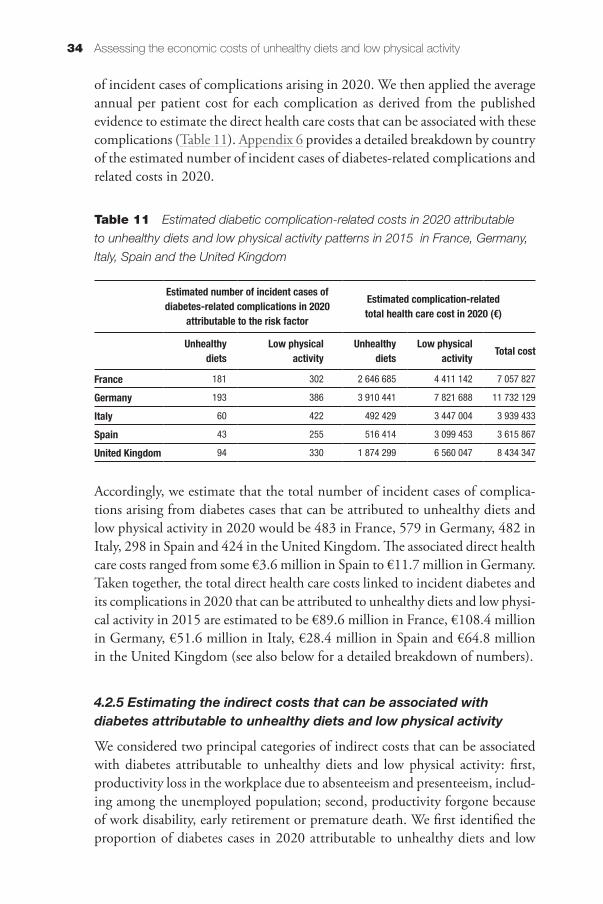
Assessing the economic costs of unhealthy diets and low physical activity34
of incident cases of complications arising in 2020. We then applied the average annual per patient cost for each complication as derived from the published evidence to estimate the direct health care costs that can be associated with these complications (Table 11). Appendix 6 provides a detailed breakdown by country of the estimated number of incident cases of diabetes-related complications and related costs in 2020.
Table 11 Estimated diabetic complication-related costs in 2020 attributable
to unhealthy diets and low physical activity patterns in 2015 in France, Germany,
Italy, Spain and the United Kingdom
Estimated number of incident cases of diabetes-related complications in 2020
attributable to the risk factor
Estimated complication-related total health care cost in 2020 (€)
Unhealthy diets
Low physical activity
Unhealthy diets
Low physical activity Total cost
France 181 302 2 646 685 4 411 142 7 057 827
Germany 193 386 3 910 441 7 821 688 11 732 129
Italy 60 422 492 429 3 447 004 3 939 433
Spain 43 255 516 414 3 099 453 3 615 867
United Kingdom 94 330 1 874 299 6 560 047 8 434 347
Accordingly, we estimate that the total number of incident cases of complica-tions arising from diabetes cases that can be attributed to unhealthy diets and low physical activity in 2020 would be 483 in France, 579 in Germany, 482 in Italy, 298 in Spain and 424 in the United Kingdom. The associated direct health care costs ranged from some €3.6 million in Spain to €11.7 million in Germany. Taken together, the total direct health care costs linked to incident diabetes and its complications in 2020 that can be attributed to unhealthy diets and low physi-cal activity in 2015 are estimated to be €89.6 million in France, €108.4 million in Germany, €51.6 million in Italy, €28.4 million in Spain and €64.8 million in the United Kingdom (see also below for a detailed breakdown of numbers).
4.2.5 Estimating the indirect costs that can be associated with diabetes attributable to unhealthy diets and low physical activity
We considered two principal categories of indirect costs that can be associated with diabetes attributable to unhealthy diets and low physical activity: first, productivity loss in the workplace due to absenteeism and presenteeism, includ-ing among the unemployed population; second, productivity forgone because of work disability, early retirement or premature death. We first identified the proportion of diabetes cases in 2020 attributable to unhealthy diets and low
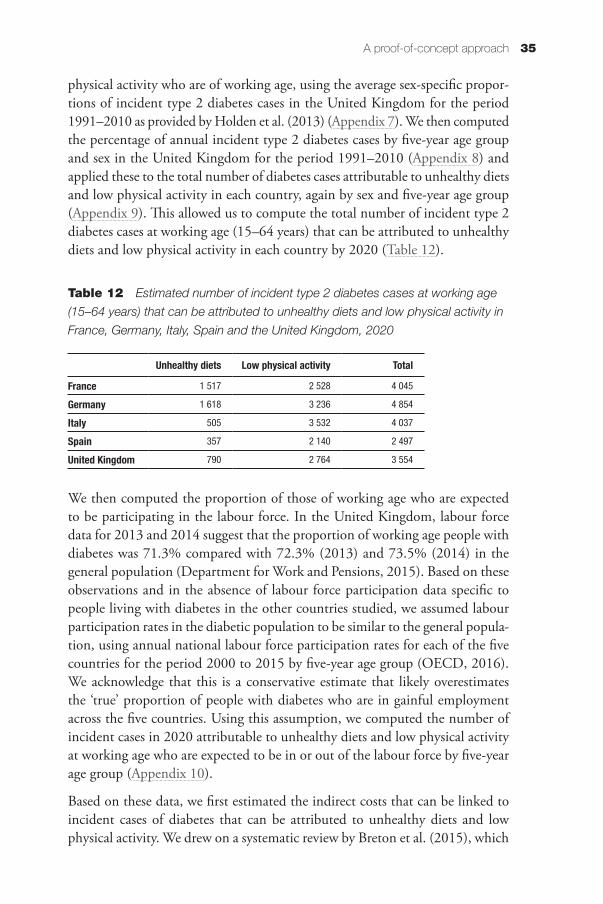
35A proof-of-concept approach
physical activity who are of working age, using the average sex-specific propor-tions of incident type 2 diabetes cases in the United Kingdom for the period 1991–2010 as provided by Holden et al. (2013) (Appendix 7). We then computed the percentage of annual incident type 2 diabetes cases by five-year age group and sex in the United Kingdom for the period 1991–2010 (Appendix 8) and applied these to the total number of diabetes cases attributable to unhealthy diets and low physical activity in each country, again by sex and five-year age group (Appendix 9). This allowed us to compute the total number of incident type 2 diabetes cases at working age (15–64 years) that can be attributed to unhealthy diets and low physical activity in each country by 2020 (Table 12).
Table 12 Estimated number of incident type 2 diabetes cases at working age
(15–64 years) that can be attributed to unhealthy diets and low physical activity in
France, Germany, Italy, Spain and the United Kingdom, 2020
Unhealthy diets Low physical activity Total
France 1 517 2 528 4 045
Germany 1 618 3 236 4 854
Italy 505 3 532 4 037
Spain 357 2 140 2 497
United Kingdom 790 2 764 3 554
We then computed the proportion of those of working age who are expected to be participating in the labour force. In the United Kingdom, labour force data for 2013 and 2014 suggest that the proportion of working age people with diabetes was 71.3% compared with 72.3% (2013) and 73.5% (2014) in the general population (Department for Work and Pensions, 2015). Based on these observations and in the absence of labour force participation data specific to people living with diabetes in the other countries studied, we assumed labour participation rates in the diabetic population to be similar to the general popula-tion, using annual national labour force participation rates for each of the five countries for the period 2000 to 2015 by five-year age group (OECD, 2016). We acknowledge that this is a conservative estimate that likely overestimates the ‘true’ proportion of people with diabetes who are in gainful employment across the five countries. Using this assumption, we computed the number of incident cases in 2020 attributable to unhealthy diets and low physical activity at working age who are expected to be in or out of the labour force by five-year age group (Appendix 10).
Based on these data, we first estimated the indirect costs that can be linked to incident cases of diabetes that can be attributed to unhealthy diets and low physical activity. We drew on a systematic review by Breton et al. (2015), which
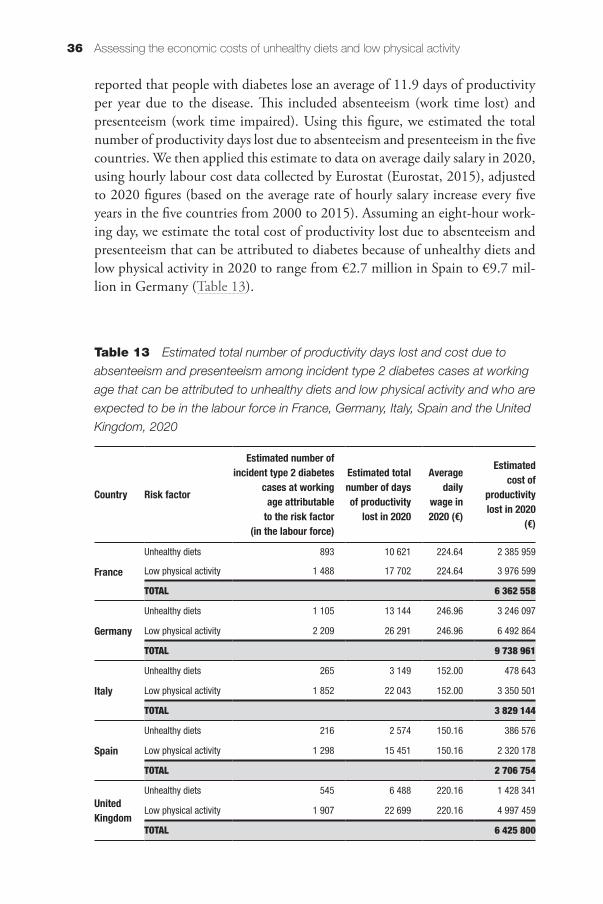
Assessing the economic costs of unhealthy diets and low physical activity36
reported that people with diabetes lose an average of 11.9 days of productivity per year due to the disease. This included absenteeism (work time lost) and presenteeism (work time impaired). Using this figure, we estimated the total number of productivity days lost due to absenteeism and presenteeism in the five countries. We then applied this estimate to data on average daily salary in 2020, using hourly labour cost data collected by Eurostat (Eurostat, 2015), adjusted to 2020 figures (based on the average rate of hourly salary increase every five years in the five countries from 2000 to 2015). Assuming an eight-hour work-ing day, we estimate the total cost of productivity lost due to absenteeism and presenteeism that can be attributed to diabetes because of unhealthy diets and low physical activity in 2020 to range from €2.7 million in Spain to €9.7 mil-lion in Germany (Table 13).
Table 13 Estimated total number of productivity days lost and cost due to
absenteeism and presenteeism among incident type 2 diabetes cases at working
age that can be attributed to unhealthy diets and low physical activity and who are
expected to be in the labour force in France, Germany, Italy, Spain and the United
Kingdom, 2020
Country Risk factor
Estimated number of incident type 2 diabetes
cases at working age attributable
to the risk factor (in the labour force)
Estimated total number of days of productivity
lost in 2020
Average daily
wage in 2020 (€)
Estimated cost of
productivity lost in 2020
(€)
France
Unhealthy diets 893 10 621 224.64 2 385 959
Low physical activity 1 488 17 702 224.64 3 976 599
TOTAL 6 362 558
Germany
Unhealthy diets 1 105 13 144 246.96 3 246 097
Low physical activity 2 209 26 291 246.96 6 492 864
TOTAL 9 738 961
Italy
Unhealthy diets 265 3 149 152.00 478 643
Low physical activity 1 852 22 043 152.00 3 350 501
TOTAL 3 829 144
Spain
Unhealthy diets 216 2 574 150.16 386 576
Low physical activity 1 298 15 451 150.16 2 320 178
TOTAL 2 706 754
United Kingdom
Unhealthy diets 545 6 488 220.16 1 428 341
Low physical activity 1 907 22 699 220.16 4 997 459
TOTAL 6 425 800
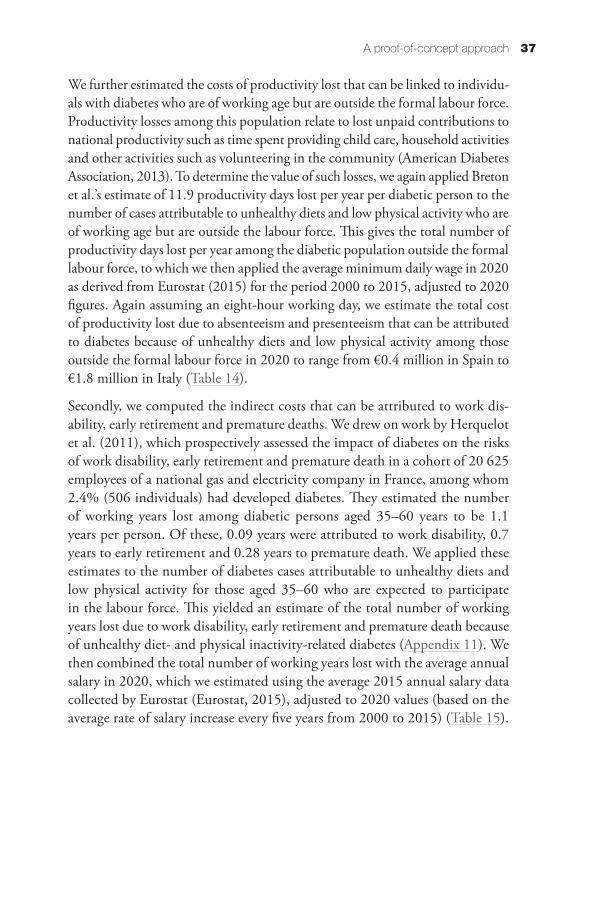
37A proof-of-concept approach
We further estimated the costs of productivity lost that can be linked to individu-als with diabetes who are of working age but are outside the formal labour force. Productivity losses among this population relate to lost unpaid contributions to national productivity such as time spent providing child care, household activities and other activities such as volunteering in the community (American Diabetes Association, 2013). To determine the value of such losses, we again applied Breton et al.’s estimate of 11.9 productivity days lost per year per diabetic person to the number of cases attributable to unhealthy diets and low physical activity who are of working age but are outside the labour force. This gives the total number of productivity days lost per year among the diabetic population outside the formal labour force, to which we then applied the average minimum daily wage in 2020 as derived from Eurostat (2015) for the period 2000 to 2015, adjusted to 2020 figures. Again assuming an eight-hour working day, we estimate the total cost of productivity lost due to absenteeism and presenteeism that can be attributed to diabetes because of unhealthy diets and low physical activity among those outside the formal labour force in 2020 to range from €0.4 million in Spain to €1.8 million in Italy (Table 14).
Secondly, we computed the indirect costs that can be attributed to work dis-ability, early retirement and premature deaths. We drew on work by Herquelot et al. (2011), which prospectively assessed the impact of diabetes on the risks of work disability, early retirement and premature death in a cohort of 20 625 employees of a national gas and electricity company in France, among whom 2.4% (506 individuals) had developed diabetes. They estimated the number of working years lost among diabetic persons aged 35–60 years to be 1.1 years per person. Of these, 0.09 years were attributed to work disability, 0.7 years to early retirement and 0.28 years to premature death. We applied these estimates to the number of diabetes cases attributable to unhealthy diets and low physical activity for those aged 35–60 who are expected to participate in the labour force. This yielded an estimate of the total number of working years lost due to work disability, early retirement and premature death because of unhealthy diet- and physical inactivity-related diabetes (Appendix 11). We then combined the total number of working years lost with the average annual salary in 2020, which we estimated using the average 2015 annual salary data collected by Eurostat (Eurostat, 2015), adjusted to 2020 values (based on the average rate of salary increase every five years from 2000 to 2015) (Table 15).
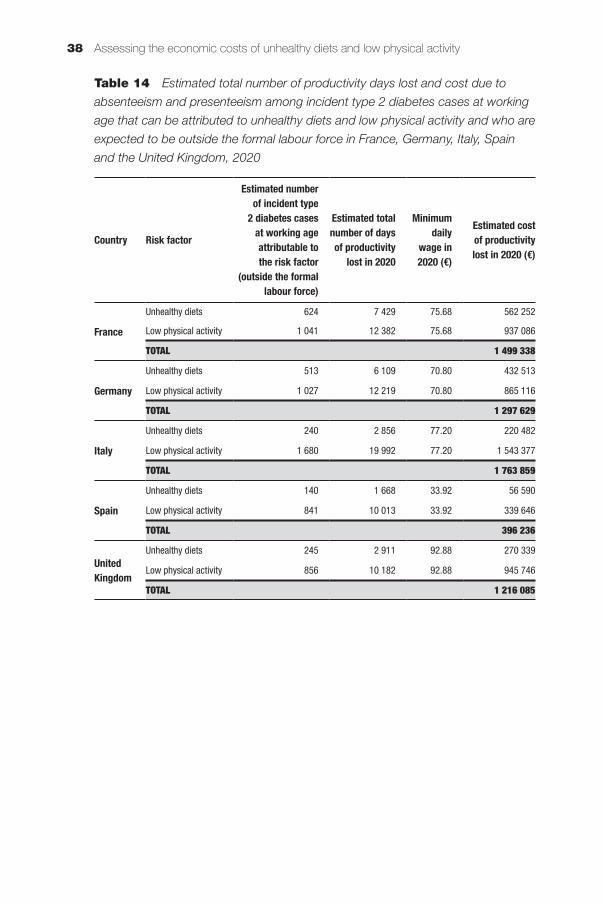
Assessing the economic costs of unhealthy diets and low physical activity38
Table 14 Estimated total number of productivity days lost and cost due to
absenteeism and presenteeism among incident type 2 diabetes cases at working
age that can be attributed to unhealthy diets and low physical activity and who are
expected to be outside the formal labour force in France, Germany, Italy, Spain
and the United Kingdom, 2020
Country Risk factor
Estimated number of incident type
2 diabetes cases at working age attributable to the risk factor
(outside the formal labour force)
Estimated total number of days of productivity
lost in 2020
Minimum daily
wage in 2020 (€)
Estimated cost of productivity lost in 2020 (€)
France
Unhealthy diets 624 7 429 75.68 562 252
Low physical activity 1 041 12 382 75.68 937 086
TOTAL 1 499 338
Germany
Unhealthy diets 513 6 109 70.80 432 513
Low physical activity 1 027 12 219 70.80 865 116
TOTAL 1 297 629
Italy
Unhealthy diets 240 2 856 77.20 220 482
Low physical activity 1 680 19 992 77.20 1 543 377
TOTAL 1 763 859
Spain
Unhealthy diets 140 1 668 33.92 56 590
Low physical activity 841 10 013 33.92 339 646
TOTAL 396 236
United Kingdom
Unhealthy diets 245 2 911 92.88 270 339
Low physical activity 856 10 182 92.88 945 746
TOTAL 1 216 085
39A proof-of-concept approach
Table 15 Estimated cost of working years lost due to work disability, early
retirement and premature death among incident type 2 diabetes cases at working
age that can be attributed to unhealthy diets and low physical activity and who are
expected to be in the formal labour force in France, Germany, Italy, Spain and the
United Kingdom, 2020
CountryRisk factor to which cases are attributable
Average annual salary in 2020 (in €)*
Estimated costs of
disability in 2020 (in €)
Estimated costs of early retirement in
2020 (€)
Estimated costs of premature death in 2020
(€)
France
Unhealthy diets 41 131.99 3 304 085 25 698 440 10 279 376
Low physical activity 41 131.99 5 506 808 42 830 733 17 132 293
TOTAL 8 810 894 68 529 172 27 411 669
Germany
Unhealthy diets 41 523.63 4 127 868 32 105 639 12 842 256
Low physical activity 41 523.63 8 256 587 64 217 897 25 687 159
TOTAL 12 384 455 96 323 537 38 529 415
Italy
Unhealthy diets 32 021.69 762 619 5 931 485 2 372 594
Low physical activity 32 021.69 5 338 336 41 520 393 16 608 157
TOTAL 6 100 956 47 451 878 18 980 751
Spain
Unhealthy diets 31 377.75 610 939 4 751 747 1 900 699
Low physical activity 31 377.75 3 666 776 28 519 369 11 407 748
TOTAL 4 277 715 33 271 116 13 308 446
United Kingdom
Unhealthy diets 49 359.15 2 421 903 18 837 024 7 534 810
Low physical activity 49 359.15 8 473 719 65 906 700 26 362 680
TOTAL 10 895 622 84 743 725 33 897 490
Note: * estimated from 2015 average annual salary adjusted using the average percentage of increase in salary every five years from 2000 to 2015 as derived from OECD (2016).
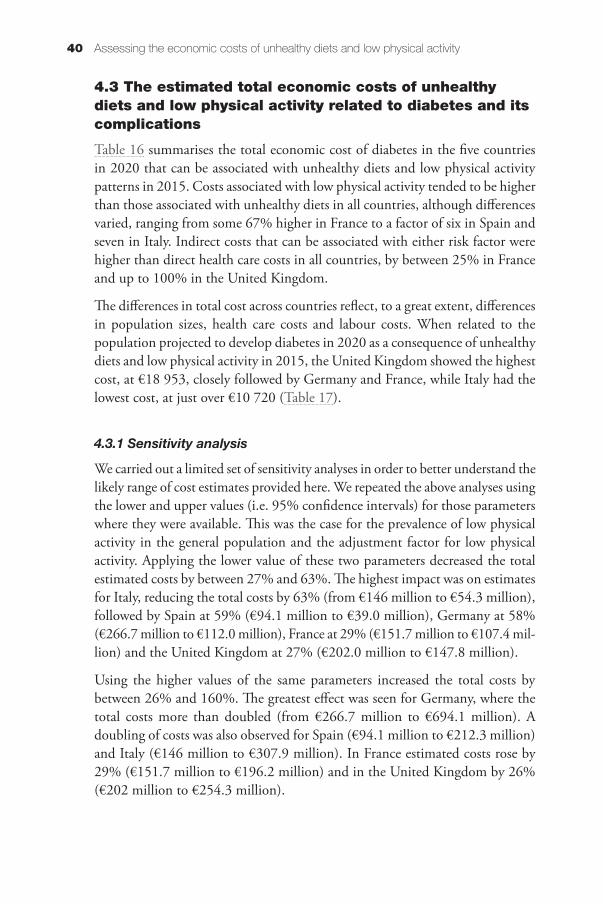
Assessing the economic costs of unhealthy diets and low physical activity40
4.3 The estimated total economic costs of unhealthy diets and low physical activity related to diabetes and its complications
Table 16 summarises the total economic cost of diabetes in the five countries in 2020 that can be associated with unhealthy diets and low physical activity patterns in 2015. Costs associated with low physical activity tended to be higher than those associated with unhealthy diets in all countries, although differences varied, ranging from some 67% higher in France to a factor of six in Spain and seven in Italy. Indirect costs that can be associated with either risk factor were higher than direct health care costs in all countries, by between 25% in France and up to 100% in the United Kingdom.
The differences in total cost across countries reflect, to a great extent, differences in population sizes, health care costs and labour costs. When related to the population projected to develop diabetes in 2020 as a consequence of unhealthy diets and low physical activity in 2015, the United Kingdom showed the highest cost, at €18 953, closely followed by Germany and France, while Italy had the lowest cost, at just over €10 720 (Table 17).
4.3.1 Sensitivity analysis
We carried out a limited set of sensitivity analyses in order to better understand the likely range of cost estimates provided here. We repeated the above analyses using the lower and upper values (i.e. 95% confidence intervals) for those parameters where they were available. This was the case for the prevalence of low physical activity in the general population and the adjustment factor for low physical activity. Applying the lower value of these two parameters decreased the total estimated costs by between 27% and 63%. The highest impact was on estimates for Italy, reducing the total costs by 63% (from €146 million to €54.3 million), followed by Spain at 59% (€94.1 million to €39.0 million), Germany at 58% (€266.7 million to €112.0 million), France at 29% (€151.7 million to €107.4 mil-lion) and the United Kingdom at 27% (€202.0 million to €147.8 million).
Using the higher values of the same parameters increased the total costs by between 26% and 160%. The greatest effect was seen for Germany, where the total costs more than doubled (from €266.7 million to €694.1 million). A doubling of costs was also observed for Spain (€94.1 million to €212.3 million) and Italy (€146 million to €307.9 million). In France estimated costs rose by 29% (€151.7 million to €196.2 million) and in the United Kingdom by 26% (€202 million to €254.3 million).
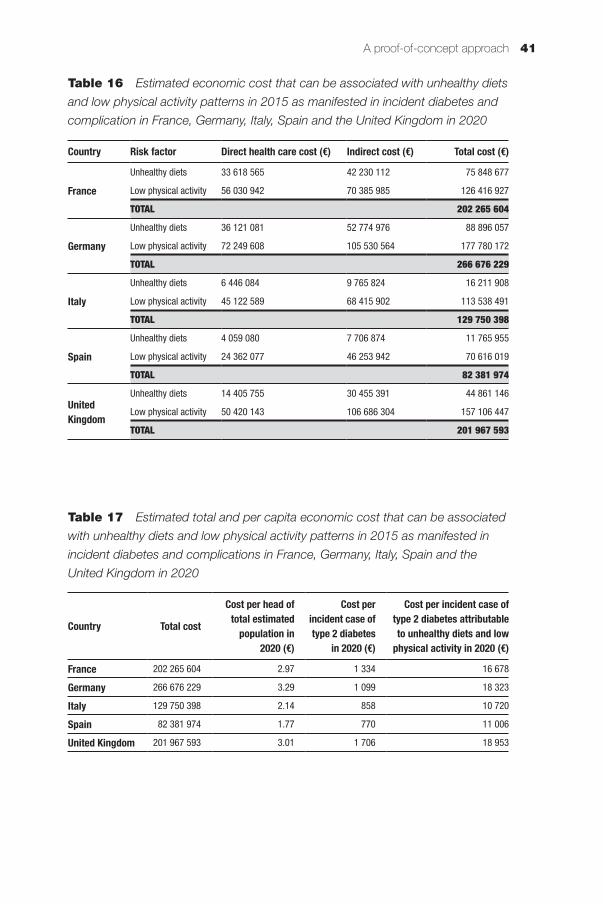
41A proof-of-concept approach
Table 16 Estimated economic cost that can be associated with unhealthy diets
and low physical activity patterns in 2015 as manifested in incident diabetes and
complication in France, Germany, Italy, Spain and the United Kingdom in 2020
Country Risk factor Direct health care cost (€) Indirect cost (€) Total cost (€)
France
Unhealthy diets 33 618 565 42 230 112 75 848 677
Low physical activity 56 030 942 70 385 985 126 416 927
TOTAL 202 265 604
Germany
Unhealthy diets 36 121 081 52 774 976 88 896 057
Low physical activity 72 249 608 105 530 564 177 780 172
TOTAL 266 676 229
Italy
Unhealthy diets 6 446 084 9 765 824 16 211 908
Low physical activity 45 122 589 68 415 902 113 538 491
TOTAL 129 750 398
Spain
Unhealthy diets 4 059 080 7 706 874 11 765 955
Low physical activity 24 362 077 46 253 942 70 616 019
TOTAL 82 381 974
United Kingdom
Unhealthy diets 14 405 755 30 455 391 44 861 146
Low physical activity 50 420 143 106 686 304 157 106 447
TOTAL 201 967 593
Table 17 Estimated total and per capita economic cost that can be associated
with unhealthy diets and low physical activity patterns in 2015 as manifested in
incident diabetes and complications in France, Germany, Italy, Spain and the
United Kingdom in 2020
Country Total cost
Cost per head of total estimated
population in 2020 (€)
Cost per incident case of type 2 diabetes
in 2020 (€)
Cost per incident case of type 2 diabetes attributable to unhealthy diets and low
physical activity in 2020 (€)
France 202 265 604 2.97 1 334 16 678
Germany 266 676 229 3.29 1 099 18 323
Italy 129 750 398 2.14 858 10 720
Spain 82 381 974 1.77 770 11 006
United Kingdom 201 967 593 3.01 1 706 18 953

Chapter 5Discussion and conclusions
This study sought to contribute to a better understanding of the economic burden that can be associated with unhealthy diets and low levels of physical activity in order to help inform priority setting and motivate efforts to promote more effectively healthy diets and physical activity in Europe and worldwide. We did so through critically reviewing the available evidence on the economic costs associated with unhealthy diets and low physical activity; discussing the measurement, methodological and practical issues for estimating the economic burden from unhealthy diets and low physical activity; and developing a frame-work for assessing costs and testing the feasibility of this approach to provide better estimates of the economic burden.
We showed that the majority of reviewed studies found a significant associa-tion between diet and/or physical activity and costs, with unhealthy diets and low physical activity predictive of higher health care expenditure. Studies that did report costs that can be associated with the two risk factors estimated the annual cost of unhealthy diets to range from €3 to €148 per capita and for low physical activity from €3 to €181 per capita. The highest health care cost estimates were equivalent to between 2% and 6% of health spending in the countries. We noted that there is a very wide range of estimates, and these are very sensitive to the measures of diet and activity and the ways in which the studies were carried out.
Costing studies differ widely in their analytical approaches and in the nature and scope of data used, influencing estimates for the economic burden of unhealthy diets and low physical activity. Particular challenges arise from measuring unhealthy diets given the different effects of foods and the interactions between these effects. Calibrating the extent of deviation from optimal consumption and the effects of this deviation is difficult. It is also clear that the context should be taken into account in terms of other population characteristics. While there is more consensus about the measurement of physical activity, similar issues arise in terms of the independent effects of moderate and vigorous activity and sedentary behaviour, but also the interactions between these. Further, studies take broader and narrower perspectives in terms of what costs are included, with some lim-ited to formal health care costs, and others aiming to take a more societal view. While current evidence makes it difficult to make accurate comparisons, much
Assessing the economic costs of unhealthy diets and low physical activity44
of the economic burden is likely to come from non-health care costs, especially from effects on productivity, absenteeism, presenteeism and other indirect costs.
Based on a critical appraisal of existing approaches, we developed a framework for estimating the economic costs of unhealthy diets and low physical activity using a disease-based approach, with type 2 diabetes mellitus chosen as a disease for which both are risk factors. The aim was to demonstrate the feasibility of undertaking a comprehensive, disease-based, bottom-up cost assessment draw-ing on the best available data as identified from a rapid review of the published evidence that addresses some of the limitations of existing costing studies. Our choice of type 2 diabetes as the exemplar outcome was motivated by its consist-ently strong association with either risk factor as shown in the literature.
Using this approach, we projected the total economic costs that can be associ-ated with unhealthy diets and low physical activity patterns in 2015 as mani-fested in incident diabetes cases in 2020 to range from €82.4 million in Spain to €266.7 million in Germany. This equates to a per capita cost of €1.77 in Spain to €3.29 in Germany. Relating costs more specifically to the population projected to develop diabetes in 2020 as a consequence of unhealthy diets and low physical activity in 2015, the United Kingdom showed the highest cost, at €18 953, closely followed by Germany and France, while Italy had the lowest cost, at just over €10 720.
The total cost in the five high-income countries studied (France, Germany, Italy, Spain and the United Kingdom) was estimated to amount to about €883 mil-lion. The populations in the five countries studied account for almost two thirds of the total population in the European Union (EU-28), which would imply a total EU cost of around €1.3 billion, but care must be taken in any extrapola-tion given differences in population characteristics, costs of care and value of lost productivity. While these estimates of the economic costs are substantial, they represent only a small proportion of health care expenditure and a very small proportion of GDP. Even on the higher estimates in the sensitivity analysis it is likely that the burden of disease associated with unhealthy diets and low physical activity as measured by poor health and shortened life will be at least as important as the financial costs of additional health care and lost productivity.
It is difficult to compare the findings of the analyses presented here with estimates published elsewhere since only diabetes costs are estimated. Scarborough et al. (2011) calculated the cost of unhealthy diets and low physical activity in the United Kingdom in 2006–07 to be €9.8 billion (€8.5 billion and €1.3 billion for unhealthy diets and low physical activity, respectively). Ding et al. (2016), in their recent assessment of the global economic costs that can be associated with low physical activity, provided estimates of direct and indirect costs ranging from $(Int) 1.4 billion in Italy to $(Int) 2.6 billion in Germany. Again, data
Discussion and conclusions 45
are difficult to compare as analyses by Ding et al. considered a wider range of disease outcomes (coronary heart disease, stroke, type 2 diabetes, breast cancer, colorectal cancer), and the cost estimates are not easily transferable.
The principal analytical steps employed in the present analysis are similar to those used by Ding et al. (2016) for low physical activity in that we calculated country-specific adjusted population-attributable fractions based on available prevalence data and relative disease risks causally linked to either risk factor in order to estimate the total number of cases for the outcome (here: diabetes) in each country. Ding et al. used the same definition of low physical activity that we used, and drew on the same data sources for prevalence of low physical activity and estimated the same relative risk-adjusted population-attributable fractions that we calculated for our analysis. We also estimated health care costs as well as indirect costs that can be associated with disease developed as a consequence of the risk factor and similar to Ding et al. we drew on the latest estimates of diabetes-related health care costs provided by the International Diabetes Federation (International Diabetes Federation, 2015). Where our model differs is that we only considered the costs of incident cases, that is, new cases, which can be causally linked to the risk factor, whereas Ding et al. calcu-lated costs on the basis of prevalence data. Also, our approach takes account of the expected time lag between exposure to the risk factor (unhealthy diets, low physical activity) and development of the disease and complications. Further, we considered a wider range of indirect costs linked to lost productivity because of work absence, disability, early retirement and premature death among incident diabetes cases that can be attributed to unhealthy diets and low physical activity. Conversely, Ding et al. only considered lost productivity that can be associated with premature death. We therefore believe that our estimates provide a fuller picture of the likely future costs that can be attributed to contemporary dietary and physical activity patterns.
5.1 Limitations of the costing framework
As noted, the costing model as proposed here presents a ‘proof of concept’ approach, drawing on the best available data as identified from a rapid review of the published evidence and providing point estimates only (although we present data from a limited sensitivity analysis). Clearly, there is uncertainty associated with each input parameter, namely prevalence rates of unhealthy diets and low physical activity in the general population, adjustment factors, relative risks and average per patient disease and productivity costs, which will all impact on the estimated effect size of predicted incident diabetes cases and cost estimates. A fully costed model would consider ranges as input parameters as a reflection of variation at baseline, using for example probabilistic modelling such as Monte
Assessing the economic costs of unhealthy diets and low physical activity46
Carlo simulation, and also employ sensitivity analyses in order to better under-stand the influence of the various input parameters on cost estimates.
A major challenge presents the availability of suitable data on the prevalence of unhealthy diets and low physical activity that are comparable across countries and over time. For example, the prevalence data for low physical activity used for the five countries were obtained from the WHO Global Health Observatory Database, with 2010 prevalence rates as the latest available data. The level of exposure among physically inactive individuals was not specified so data from a more recent Eurobarometer survey conducted in 2013 was used to assess the level of exposure. In order to arrive at comparable estimates there is therefore a need for more detailed national prevalence data on physical activity in each country, specifying the type, duration, frequency and intensity to identify the extent of low physical activity and levels of exposure to risk.
We defined a given dietary pattern as unhealthy, based on a score of <67% on the 2010 alternate healthy eating index (AHEI) and we used dietary data com-piled by the European Food Safety Authority, which draws on national surveys that are not directly comparable in relation to assessment methods and data collection instruments. The EFSA database also only provides aggregate-level data of mean consumption of certain food groups (European Food and Safety Authority, 2015). In the absence of more detailed data sets, we assumed that mean intakes as presented in the EFSA database are nationally representative of a relatively homogenous dietary pattern in each of the five countries. But this is not necessarily the case and in order to arrive at more precise estimates more recent, individual-level data on mean intake of the different AHEI food-groups in different countries in Europe would be needed.
We considered a window period of five years from the occurrence of unhealthy diets and low physical activity to the development of diabetes and associated costs incurred. The five-year lag reflects the average latency period and it will vary according to individual risk profile, with those with other high-risk char-acteristics, such as genetic predisposition, likely to develop the condition more quickly. If the costing model was applied more widely this would require a systematic assessment of the evidence of the range of the latency period, and its incorporation in the form of a sensitivity analysis.
Likewise, we used average annual per patient costs for diabetes and its complica-tions in previous years, which we adjusted to reflect more closely 2020 prices. However, average costs are not sensitive to variations in individual patterns of health care utilisation and a fully costed model would ideally derive a unique set of average per patient costs for each country that take account of patient char-acteristics such as age, sex, ethnicity, socioeconomic status and disease severity, which may influence patterns of use. A particular challenge relates to estimating
Discussion and conclusions 47
the indirect costs that can be associated with diabetes as a manifestation of unhealthy diets and low physical activity, and within the scope of this study we applied very crude assumptions, which would need to be revisited for a fully costed model. Any future modelling exercise would also need to take account of the long-term care costs associated with diabetes which are estimated to be substantial, but which we have been unable to address in this work.
Finally, the costing framework as presented here uses only one outcome, namely type 2 diabetes, as a manifestation of exposure to unhealthy diets and low physical activity. Yet, unhealthy diets and low physical activity are associated with a range of other conditions of ill health as highlighted in earlier parts of this volume and a fully costed model would incorporate these also, along with their sequelae, guided by the strength of evidence of the association. Ding et al. (2016), in their analysis of the global economic cost of low physical activity, disaggregated cost figures by disease category, and diabetes cases that can be attributed to low physical activity accounted for a large majority of the estimated total health care costs. Specifically, according to Ding et al., for the five countries considered in the present study, diabetes cases accounted for approximately half (Italy) up to 85% (Spain) of the estimated total health care costs. This would mean that estimates for health care costs provided in the present study are likely to underestimate the ‘true’ health care costs that can be associated with low physical activity-related diabetes cases by at least one third. However, since Ding et al. (2016) calculated costs for prevalent cases it is very difficult to generalise from their estimates.
5.2 Implications for future studies
This study has tested the feasibility of estimating the costs of unhealthy diets and low physical activity using a disease-based approach. While there are limitations, it has shown that it is broadly feasible to populate the model with data from a range of sources, and the results show a reasonable consistency across countries. While the disease burden from diabetes is not currently as large as that for, for example, ischaemic heart disease, it is a good exemplar because of the strong rela-tionship between these lifestyle factors and the risk of diabetes. In other chronic diseases there will be additional challenges in identifying the contribution of these lifestyle factors and disease risk. Given the very wide range of estimates of costs from the studies reviewed, this may be a more promising approach.

References
Ackermann R, Cheadle A & Sandhu N (2003). Community exercise program use and changes in healthcare costs for older adults. Am J Prev Med, 25:232–7.
Afshin A, Micha R, Khatibzadeh S & Mozaffarian D (2014). Consumption of nuts and legumes and risk of incident ischemic heart disease, stroke, and diabetes: a systematic review and meta-analysis. Am J Clin Nutr, 100:278–88.
Al Tunaji H, Davis J, Dawn M & Khan K (2014). Population-attributable fraction of type 2 diabetes due to physical inactivity in adults: a systematic review. BMC Public Health, 14:469.
Allender S, Foster C, Scarborough P & Rayner M (2007). The burden of physical activity-related ill health in the UK. J Epidemiol Community Health, 61:344–48.
Alter D, Wijeysundera H & Franklin B (2012). Obesity, lifestyle risk-factors and health service outcomes among healthy middle-aged adults in Canada. BMC Health Serv Res, 12:238.
American Diabetes Association (2013). Economic costs of diabetes in the U.S. in 2012. Diabetes Care, 36:1033–46.
Anderson L, Martinson B, Crain A, Pronk N, Whitebird R, O’Connor P & Fine L (2005). Health care charges associated with physical inactivity, overweight and obesity. Prev Chronic Dis, 2:A09.
Aune D, Keum N, Giovannucci E, Fadnes L, Boffetta P, Greenwood D, Tonstad S, Vatten L, Riboli E & Norat T (2016). Whole grain consumption and risk of cardiovascular disease, cancer, and all cause and cause specific mortality: systematic review and dose-response meta-analysis of prospective studies. BMJ, 353:i2716.
Bachmann J, Defina L, Franzini L, Gao A, Leonard D, Cooper K, Berry J & Willis B (2015). Cardiorespiratory fitness in middle age and health care costs in later life. J Am Coll Cardiol, 66:1876–85.
Baliunas D (2011). A comparison of two methods of adjusted attributable fraction estimation as applied to the four major smoking related causes of death in Canada in 2005. Ph.D. University of Toronto. URL: https://tspace.library.utoronto.ca/bitstream/1807/32061/1/Baliunas_Dalia_O_201111_PhD_thesis.pdf (accessed 23 October 2016).
Benichou J (2001). A review of adjusted estimators of attributable risk. Stat Methods Med Res, 10:195–216.
Biswas A, Oh P, Faulkner G, Bajaj R, Silver M, Mitchell M, et al. (2015). Sedentary time and its association with risk for disease incidence, mortality, and hospitalization in adults: a systematic review and meta-analysis. Ann Intern Med, 162:123–32.
Bland P, An L, Foldes S, Garrett N & Alesci N (2009). Modifiable health behaviours and short-term medical costs among health plan members. Am J Health Promot, 23:265–73.
Boeing H, Bechthold A, Bub A, Ellinger S, Haller D, Kroke A, Leschik-Bonnet E, Müller M, Oberritter H, Schulze M, Stehle P & Watzl B (2012). Critical review: vegetables and fruit in the prevention of chronic diseases. Eur J Nutr, 51:637–63.
Bouvard V, Loomis D, Guyton K, Grosse Y, Ghissassi F, Benbrahim-Tallaa L, Guha N, Mattock H, Straif K & International Agency For Research On Cancer Monograph Working Group (2015). Carcinogenicity of consumption of red and processed meat. Lancet Oncol, 16:1599–600.
Breton M, Guénette L, Amiche M, Kayibanda J, Grégoire J & Moisan J (2015). Burden of diabetes on the ability to work: A systematic review. Diabetes Care, 36:740–9.
Assessing the economic costs of unhealthy diets and low physical activity50
Carlson S, Fulton J, Pratt M, Yang Z & Adams E (2015). Inadequate physical activity and health care expenditures in the United States. Prog Cardiovasc Dis, 57:315–23.
Cecchini M & Bull F (2015). Promoting physical activity. In: McDaid D, Sassi F & Merkur S (eds). Promoting health, preventing disease. The economic case. Maidenhead: Open University Press.
Chevan J & Roberts D (2014). No short-term savings in health care expenditures for physically active adults. Prev Med, 63:1–5.
Chiuve S, Fung T, Rimm E, Hu F, Mccullough M, Wang M, Stampfer M & Willett W (2012). Alternative dietary indices both strongly predict risk of chronic disease. J Nutr, 142:1009–18.
Chowdhury R, Stevens S, Gorman D, Pan A, Warnakula S, Chowdhury S, Ward H, Johnson L, Crowe F, Hu F & Franco O (2012). Association between fish consumption, long chain omega 3 fatty acids, and risk of cerebrovascular disease: systematic review and meta-analysis. BMJ, 345:e6698.
Codogno J, Turi B, Kemper H, Fernandes R, Christofaro D & Monteiro H (2015). Physical inactivity of adults and 1-year health care expenditures in Brazil. Int J Public Health, 60:309–16.
Collins C, Patterson A & Fitzgerald D (2011). Higher diet quality does not predict lower Medicare costs but does predict number of claims in mid-aged Australian women. Nutrients, 3:40–8.
Commission of the European Communities (2007). White Paper on A Strategy for Europe on Nutrition, Overweight and Obesity related health issues. Brussels: European Commission.
Council of the European Union (2014). Council conclusions on nutrition and physical activity. URL: http://eur-lex.europa.eu/legal-content/EN/TXT/PDF/?uri=CELEX:52014XG0708(01)&from=EN (accessed 23 October 2016).
Daviglus M, Liu K, Pirzada A, Yan L, Garside D, Wang R, Van Horn L, Manning W, Manheim L, Dyer A, Greenland P & Stamler J (2005). Relationship of fruit and vegetable consumption in middle-aged men to medicare expenditures in older age: the Chicago Western Electric Study. J Am Diet Assoc., 105:1735–44.
De Bakker D, Struijs J, Baan C, Raams J, De Wildt J, Vrijhoef H & Schut F (2012). Early results from adoption of bundled payment for diabetes care in the Netherlands show improvement in care coordination. Health Aff (Millwood), 31:426–33.
Department for Work and Pensions (2015). Labour Force Survey analysis of disabled people by region and main health problem. URL: https://www.gov.uk/government/uploads/system/uploads/attachment_data/file/406369/labour-force-survey-disabled-people.pdf (accessed 15 June 2016).
Ding D, Lawson K, Kolbe-Alexander T, Finkelstein E, Katzmarzyk P, Van Mechelen W, Pratt M & Lancet Physical Activity Series 2 Executive Committee (2016). The economic burden of physical inactivity: a global analysis of major non-communicable diseases. Lancet, 388:1311–24.
Doidge J, Segal L & Gospodarevskaya E (2012). Attributable risk analysis reveals potential healthcare savings from increased consumption of dairy products. J Nutr, 142:1772–80.
Ekelund U, Steene-Johannessen J, Brown W, Fagerland M, Owen N, Powell K, Bauman A, Lee I, Lancet Physical Activity Series 2 Executive Committee & Lancet Sedentary Behaviour Working Group (2016). Does physical activity attenuate, or even eliminate, the detrimental association of sitting time with mortality? A harmonised meta-analysis of data from more than 1 million men and women. Lancet, 388:1302–10.
Estruch R, Ros E, Salas-Salvadó J, Covas M, Corella D, Arós F, Gómez-Gracia E, et al. (2013). Primary prevention of cardiovascular disease with a Mediterranean diet. N Engl J Med, 368:1279–90.
European Commission (2014). The 2014 EU Summit on Chronic Diseases. Brussels, 3 and 4 April 2014, Conference Conclusions. URL: http://ec.europa.eu/health/major_chronic_diseases/docs/ev_20140403_mi_en.pdf (accessed 23 October 2016).
European Food and Safety Authority (2015). The EFSA Comprehensive European Food Consumption Database. URL: https://www.efsa.europa.eu/en/food-consumption/comprehensive-database (accessed 15 June 2016).
https://www.gov.uk/government/uploads/system/uploads/attachment_data/file/406369/labour-force-survey
References 51
Eurostat (2015). Hourly labour costs. URL: http://ec.europa.eu/eurostat/statistics-explained/index.php/Hourly_labour_costs (accessed 16 May 2016).
Ezzati M, Lopez A, Rodgers A, et al. (2004). Comparative quantification of health risks. Geneva: World Health Organization.
Garrett N, Brasure M, Schmitz K, Schultz M & Huber M (2004). Physical inactivity: direct cost to a health plan. Am J Prev Med, 27:304–9.
GBD 2015 Risk Factors Collaborators (2016). Global, regional, and national comparative risk assessment of 79 behavioural, environmental and occupational, and metabolic risks or clusters of risks, 1990–2015: a systematic analysis for the Global Burden of Disease Study 2015. Lancet, 388:1659–1724.
Hayes A, Leal J, Gray A, Holman R & Clarke P (2013). UKPDS outcomes model 2: a new version of a model to simulate lifetime health outcomes of patients with type 2 diabetes mellitus using data from the 30 year United Kingdom Prospective Diabetes Study: UKPDS 82. Diabetologia, 56:1925–33.
Health and Social Care Information Centre (2015). National Diabetes Audit 2012–2013. Report 2: Complications and mortality. URL: http://content.digital.nhs.uk/catalogue/PUB16496/nati-diab-audi-12-13-rep2.pdf (accessed 25 October 2016).
Herquelot E, Gueguen A, Bonenfant S & Dray-Spira R (2011). Impact of diabetes on work cessation: data from the GAZEL cohort study. Diabetes Care, 34:1344–9.
Holden S, Barnett A, Peters J, Jenkins-Jones S, Poole C, Morgan C & Currie C (2013). The incidence of type 2 diabetes in the United Kingdom from 1991 to 2010. Diabetes Obes Metab, 15:844–52.
Idler N, Teuner C, Hunger M, Holle R, Ortlieb S, Schulz H, et al. (2015). The association between physical activity and health care costs in children – results from the GINIplus and LISAplus cohort studies. BMC Public Health, 15:437.
International Diabetes Federation (2015). IDF Diabetes Atlas, Seventh edition. Brussels: International Diabetes Federation.
Jacobs S, Harmon B, Boushey C, Morimoto Y, Wilkens L, Le Marchand L, Kröger J, Schulze M, Kolonel L & Maskarinec G (2015). A priori-defined diet quality indexes and risk of type 2 diabetes: the Multiethnic Cohort. Diabetologia, 58:98–112.
Janssen I (2012). Health care costs of physical inactivity in Canadian adults. Appl Physiol Nutr Metab, 37:803–6.
Johns G (2010). Presenteeism in the workplace: a review and research agenda. J Org Behav, 32:519–42.
Johnston K, Buxton M, Jones D & Fitzpatrick R (1999). Assessing the costs of healthcare technologies in clinical trials. Health Technol Assess, 3:1–76.
Katzmarzyk P (2011). The Economic Costs Associated with Physical Inactivity and Obesity in Ontario. Health and Fitness Journal of Canada, 4:31–40.
Katzmarzyk P, Gledhill N & Shephard R (2000). The economic burden of physical inactivity in Canada. CMAJ, 163:1435–40.
Khangura S, Konnyu K, Cushman R, Grimshaw J & Moher D (2012). Evidence summaries: the evolution of a rapid review approach. Syst Rev, 1:10.
Koopmanschap M, Rutten F, Van Ineveld B & Van Roijen L (1995). The friction cost method for measuring indirect costs of disease. J Health Econ, 14:171–89.
Krueger H, Krueger J & Koot J (2015). Variation across Canada in the economic burden attributable to excess weight, tobacco smoking and physical inactivity. Can J Public Health, 106:e171–7.
Kruk J (2014). Health and economic costs of physical inactivity. Asian Pac J Cancer Prev, 15:7499–503.
Kuriyama S, Hozawa A & Ohmori K (2004). Joint impact of health risks on health care charges: 7-year follow-up of National Health Insurance beneficiaries in Japan (the Ohsaki Study). Prev Med, 39:1194–9.
Assessing the economic costs of unhealthy diets and low physical activity52
Laaksonen M, Knekt P & Rissanen H (2009). The relative importance of modifiable potential risk factors of type 2 diabetes: a meta-analysis of two cohorts. Eur J Epidemiol, 25:115–24.
Lee I, Shiroma E, Lobelo F, Puska P, Blair S & Katzmarzyk P (2012). Effect of physical inactivity on major non-communicable diseases worldwide: an analysis of burden of disease and life expectancy. Lancet, 280:219–29.
Li Y, Ley S, Tobias D, Chiuve S, Vanderweele T, Rich-Edwards J, Curhan G, Willett W, Manson J, Hu F & Qi L (2015). Birth weight and later life adherence to unhealthy lifestyles in predicting type 2 diabetes: prospective cohort study. BMJ, 351:h3672.
Liyanage T, Ninomiya T, Wang A, Neal B, Jun M, Wong M, Jardine M, Hillis G & Perkovic V (2016). Effects of the Mediterranean diet on cardiovascular outcomes – A systematic review and meta-analysis. PLoS One, 11:e0159252.
Lo Y, Wahlqvist M, Chang Y, Kao S & Lee M (2013). Dietary diversity predicts type of medical expenditure in elders. Am J Manag Care, 19:e415–23.
Lyssenko V, Jonsson A, Almgren P, Pulizzi N, Isomaa B, Tuomi T, Berglund G, Altshuler D, Nilsson P & Groop L (2008). Clinical risk factors, DNA variants, and the development of type 2 diabetes. N Engl J Med, 359:2220–32.
Malik V, Popkin B, Bray G, Després J & Hu F (2010a). Sugar sweetened beverages, obesity, type 2 diabetes and cardiovascular disease risk. Circulation, 121:1356–64.
Malik V, Popkin B, Bray G, Després J, Willett W & Hu F (2010b). Sugar-sweetened beverages and risk of metabolic syndrome and type 2 diabetes: A meta-analysis. Diabetes Care, 33:2477–83.
Maresova K (2014). The costs of physical inactivity in the Czech Republic in 2008. J Phys Act Health, 11:489–94.
Martinson B, Crain A & Pronk N (2003). Changes in physical activity and short-term changes in health care charges: a prospective cohort study of older adults. Prev Med, 37:319–26.
Micha R, Wallace S & Mozaffarian D (2010). Red and processed meat consumption and risk of incident coronary heart disease, stroke, and diabetes mellitus: a systematic review and meta-analysis. Circulation, 121:2271–83.
Micha R, Khatibzadeh S, Shi P, Andrews K, Engell R, Mozaffarian D & Global Burden of Diseases Nutrition and Chronic Diseases Expert Group (Nutricode) (2015). Global, regional and national consumption of major food groups in 1990 and 2010: a systematic analysis including 266 country-specific nutrition surveys worldwide. BMJ Open, 5:e008705.
Montonen J, Knekt P, Härkänen T, Järvinen R, Heliövaara M, Aromaa A & Reunanen A (2005). Dietary patterns and the incidence of type 2 diabetes. Am J Epidemiol, 161:219–27.
Morgan P (2012). Back to the future: the changing frontiers of nutrition research and its relationship to policy. Proc Nutr Soc, 71:190–7.
Mozaffarian D, Appel L & Van Horn L (2011). Components of a cardioprotective diet: new insights. Circulation, 12:2870–91.
Muka T, Imo D, Jaspers L, Colpani V, Chaker L, Van Der Lee S, Mendis S, Chowdhury R, Bramer W, Falla A, Pazoki R & Franco O (2015). The global impact of non-communicable diseases on healthcare spending and national income: a systematic review. Eur J Epidemiol, 30:251–77.
Murray C & Lopez A (1997). Global mortality, disability and the contribution of risk factors: global burden of disease study. Lancet, 349:1436–42.
NCBI (2016). Pubmed. URL: http://www.ncbi.nlm.nih.gov/pubmed.OECD (2015). Focus on Health Spending: OECD Health Statistics 2015. URL: http://www.
oecd.org/health/health-systems/Focus-Health-Spending-2015.pdf (accessed 16 May 2016).OECD (2016). Labour force participation rate. URL: https://data.oecd.org/emp/labour-force-
participation-rate.htm (accessed 15 June 2016).Oldridge N (2008). Economic burden of physical inactivity: healthcare costs associated with
cardiovascular disease. Eur J Cardiovasc Prev Rehabil, 15:130–9.Peeters G, Mishra G, Dobson A & Brown W (2014). Health care costs associated with prolonged
sitting and inactivity. Am J Prev Med, 46:265–72.
References 53
Popkin B, Kim S, Rusev E, Du S & Zizza C (2006). Measuring the full-economic costs of diet, physical activity and obesity-related chronic diseases. Obes Rev, 7:271–93.
Rayner M & Scarborough P (2005). The burden of food-related ill health in the UK. J Epidemiol Community Health, 59:1054–7.
Rice N & Normand C (2012). The cost associated with disease-related malnutrition in Ireland. Public Health Nutr, 15:1966–72.
Risérus U, Willett W & Hu F (2009). Dietary fats and prevention of type 2 diabetes. Prog Lipid Res, 48:44–51.
Samitz G, Egger M & Zwahlen M (2011). Domains of physical activity and all-cause mortality: systematic review and dose-response meta-analysis of cohort studies. Int J Epidemiol, 40:1382–400.
Scarborough P, Bhatnagar P, Wickramasinghe KK, Allender S, Foster C & Rayner M (2011). The economic burden of ill health due to diet, physical inactivity, smoking, alcohol and obesity in the UK: an update to 2006–07 NHS costs. J Public Health (Oxf ), 33:527–35.
Schultz A & Edington D (2007). Employee health and presenteeism: a systematic review. J Occup Rehabil, 17:547–79.
Schwingshackl L & Hoffmann G (2015). Diet quality as assessed by the Healthy Eating Index, the Alternate Healthy Eating Index, the Dietary Approaches to Stop Hypertension score, and health outcomes: a systematic review and meta-analysis of cohort studies. J Acad Nutr Diet, 115:780–800.
Sedentary Behaviour Research Network (2012). Letter to the editor: standardized use of the terms “sedentary” and “sedentary behaviours”. Appl Physiol Nutr Metab, 37:540–2.
Stefler D, Malyutina S, Kubinova R, Pajak A, Peasey A, Pikhart H, Brunner E & Bobak M (2015). Mediterranean diet score and total and cardiovascular mortality in Eastern Europe: the HAPIEE study. Eur J Nutr, [Epub ahead of print].
Suhrcke M, Fahey D & Mckee M (2008). Economic aspects of chronic disease and chronic disease management. In: Nolte E & McKee M (eds) Caring for people with chronic conditions: A health system perspective. Maidenhead: Open University Press.
TNS Opinion & Social (2014). Special Eurobarometer 412. Sport and physical activity. Brussels: European Commission.
Tong T, Wareham N, Khaw K, Imamura F & Forouhi N (2016). Prospective association of the Mediterranean diet with cardiovascular disease incidence and mortality and its population impact in a non-Mediterranean population: the EPIC-Norfolk study. BMC Med, 14:135–46.
United Nations (2015). World population prospects, the 2015 revision. URL: https://esa.un.org/unpd/wpp/Download/Standard/Population/ (accessed 30 November 2016).
Wang F, Mcdonald T, Reffitt B & Edington D (2005). BMI, physical activity, and health care utilization/costs among Medicare retirees. Obes Res, 13:1450–7.
Wang G, Pratt M & Macera C (2004). Physical activity, cardiovascular disease, and medical expenditures in U.S. adults. Ann Behav Med, 28:88–94.
Warburton D, Charlesworth S, Ivey A, Nettlefold L & Bredin S (2010). A systematic review of the evidence for Canada’s Physical Activity Guidelines for Adults. Int J Behav Nutr Phys Act, 7:39.
Webber L, Divajeva D, Marsh T, Mcpherson K, Brown M, Galea G & Breda J (2014). The future burden of obesity-related diseases in the 53 WHO European-Region countries and the impact of effective interventions: a modelling study. BMJ Open, 4:e004787.
Weyer C, Bogardus C, Mott D & Pratley R (1999). The natural history of insulin secretory dysfunction and insulin resistance in the pathogenesis of type 2 diabetes mellitus. J Clin Invest, 104:787–94.
WHO Regional Office for Europe (2001). The First Action Plan for Food and Nutrition Policy WHO European Region 2000–2005. Copenhagen: World Health Organization.
WHO Regional Office for Europe (2005). Steps to health. A European framework to promote physical activity for health. Copenhagen: World Health Organization.
Assessing the economic costs of unhealthy diets and low physical activity54
WHO Regional Office for Europe (2015). European Food and Nutrition Action Plan 2015–2020. Copenhagen: World Health Organization.
WHO Regional Office for Europe (2016). Physical activity strategy for the WHO European Region 2016–2025. Copenhagen: World Health Organization.
Woodcock J, Franco O, Orsini N & Roberts I (2011). Non-vigorous physical activity and all-cause mortality: systematic review and meta-analysis of cohort studies. Int J Epidemiol, 40:121–38.
World Cancer Research Fund & American Institute for Cancer Research (2007). Food, nutrition, physical activity, and the prevention of cancer: a global perspective. Washington DC: American Institute for Cancer Research.
World Health Assembly (2013). Follow-up to the Political Declaration of the High-level Meeting of the General Assembly on the Prevention and Control of Non-communicable Diseases. WHA66.10. URL: http://apps.who.int/gb/ebwha/pdf_files/WHA66/A66_R10-en.pdf (accessed 23 October 2016).
World Health Organization (2004). Global Strategy on Diet, Physical Activity and Health. Geneva: World Health Organization.
World Health Organization (2010). Global recommendations on physical activity for health. Geneva: World Health Organization.
World Health Organization (2016). Global Health Observatory (GHO) data. URL: http://www.who.int/gho/en/ (accessed 15 June 2016).
Zhang J & Chaaban J (2012). The economic cost of physical inactivity in China. Prev Med, 56:75–8.Zheng J, Huang T, Yu Y, Hu X, Yang B & Li D (2012). Fish consumption and CHD mortality:
an updated meta-analysis of seventeen cohort studies. Public Health Nutr, 15:725–37.Zimmet P, Magliano D, Herman W & Shaw J (2014). Diabetes: a 21st century challenge. Lancet
Diabetes Endocrinol, 2:56–64.

Appendices

Appendix 1Summary overview of key
characteristics of included studies
Auth
or/s
Stud
y ob
jectiv
eCo
untry
Prin
cipal
ap
proa
chM
etho
dolo
gyDa
taTy
pe o
f co
sts
Base
-yea
rPr
incip
al fi
ndin
gs
DIETDavi
glus
et a
l. (2
005)
To e
xam
ine
whe
ther
frui
t an
d ve
geta
ble
inta
ke in
mid
dle
age
is re
late
d to
hea
lth c
are
cost
s (to
tal
and
dise
ase-
spec
ific)
in o
ld
age.
The
Unite
d St
ates
Base
d on
di
seas
e-sp
ecifi
c co
sts
(car
diov
ascu
lar
dise
ase
and
canc
er) a
nd
over
all n
atio
nal
heal
th in
sura
nce
cost
s.
Inta
ke o
f fru
it an
d ve
geta
bles
wer
e de
term
ined
fro
m p
revi
ous
diet
ary
hist
orie
s an
d cl
assi
fied
into
one
of t
hree
gro
ups:
<14
cup
s pe
r mon
th,
14–4
2 cu
ps p
er m
onth
and
>42
cup
s pe
r m
onth
. Com
bine
d fru
it an
d ve
geta
ble
inta
ke
was
cla
ssifi
ed a
s ei
ther
low
, med
ium
or
high
. Usi
ng M
edic
are
clai
ms
data
, ind
ivid
ual
mea
n an
nual
hea
lth c
are
cost
s in
old
age
and
te
n-ye
ar c
umul
ativ
e co
sts
prio
r to
deat
h w
ere
estim
ated
. The
cos
ts w
ere
linke
d to
pre
viou
s fru
it an
d ve
geta
ble
inta
ke a
nd e
xam
ined
acr
oss
thre
e in
take
gro
ups
to d
eter
min
e po
ssib
le
asso
ciat
ions
.
Frui
t and
veg
etab
le in
take
: Di
etar
y in
terv
iew
(usi
ng
Burk
e’s
com
preh
ensi
ve
diet
ary
hist
ory
met
hod)
Heal
th c
are
cost
s:
estim
ated
from
nat
iona
l he
alth
insu
ranc
e cl
aim
s
Dire
ct
heal
th
care
cos
ts
(USD
)
1984
–200
0Al
thou
gh m
ost r
elat
ions
hips
wer
e no
t st
atis
tical
ly s
igni
fican
t, hi
gher
frui
t an
d ve
geta
ble
inta
kes
wer
e ge
nera
lly
asso
ciat
ed w
ith lo
wer
mea
n an
nual
he
alth
car
e co
sts.
Mea
n an
nual
cos
ts
for c
ardi
ovas
cula
r dis
ease
for h
igh
vs lo
w in
take
wer
e US
$ 3
128
vs
US$
4 22
3; fo
r can
cer:
US$
1 35
2 vs
US$
1 6
40 a
nd fo
r tot
al c
osts
: US
$ 10
024
vs
US$
12 2
11. T
rend
s w
ere
gene
rally
sim
ilar f
or fr
uit o
r ve
geta
ble
inta
ke a
lone
. Thi
s tre
nd
also
app
lied
to fr
uit a
nd v
eget
able
in
take
and
ten-
year
cum
ulat
ive
cost
s be
fore
dea
th (U
S$ 9
2 75
7 to
tal
cum
ulat
ive
cost
s fo
r hig
h in
take
vs
US$
132
713
for l
ow in
take
).
Rayn
er &
Sc
arbo
roug
h (2
005)
To q
uant
ify th
e di
seas
e an
d fin
anci
al b
urde
n of
ill h
ealth
re
late
d to
food
.
Unite
d Ki
ngdo
mDi
seas
e-ba
sed:
ca
rdio
vasc
ular
di
seas
e, ty
pe 2
di
abet
es, o
ther
ho
rmon
al a
nd
imm
une
syst
em
dise
ases
, ca
ncer
, den
tal
carie
s an
d di
gest
ive
syst
em
dise
ases
.
PAFs
for d
isea
ses
due
to ri
sk fa
ctor
s pu
blis
hed
by th
e W
HO (2
004)
wer
e ap
plie
d to
dis
ease
DA
LYs
to e
stim
ate
the
prop
ortio
n of
dis
ease
bu
rden
s at
tribu
tabl
e to
unh
ealth
y di
ets.
The
sa
me
PAFs
wer
e ap
plie
d to
NHS
dis
ease
cos
ts.
PAFs
: Glo
bal B
urde
n of
Di
seas
e (G
BD) s
tudy
(1
997)
, WHO
Com
para
tive
Quan
tifica
tion
of H
ealth
Ri
sks
(200
4)
Dise
ase
DALY
S: W
HO
Repo
rt on
Die
t, Nu
tritio
n an
d th
e Pr
even
tion
of
Chro
nic
Dise
ases
(200
3)
NHS
cost
dat
a: e
xtra
pola
ted
from
est
imat
es fr
om a
n ea
rlier
stu
dy fo
r 199
2/93
Dire
ct
heal
th
care
cos
ts
(GBP
)
2002
Food
-rel
ated
dis
ease
acc
ount
ed fo
r ab
out 1
0% o
f mor
bidi
ty a
nd m
orta
lity
in th
e Un
ited
King
dom
(as
mea
sure
d by
DAL
Ys).
Food
-rel
ated
dis
ease
was
ass
ocia
ted
with
an
annu
al h
ealth
car
e co
st o
f £6
billi
on, o
r abo
ut o
ne th
ird o
f the
tota
l NH
S co
sts.
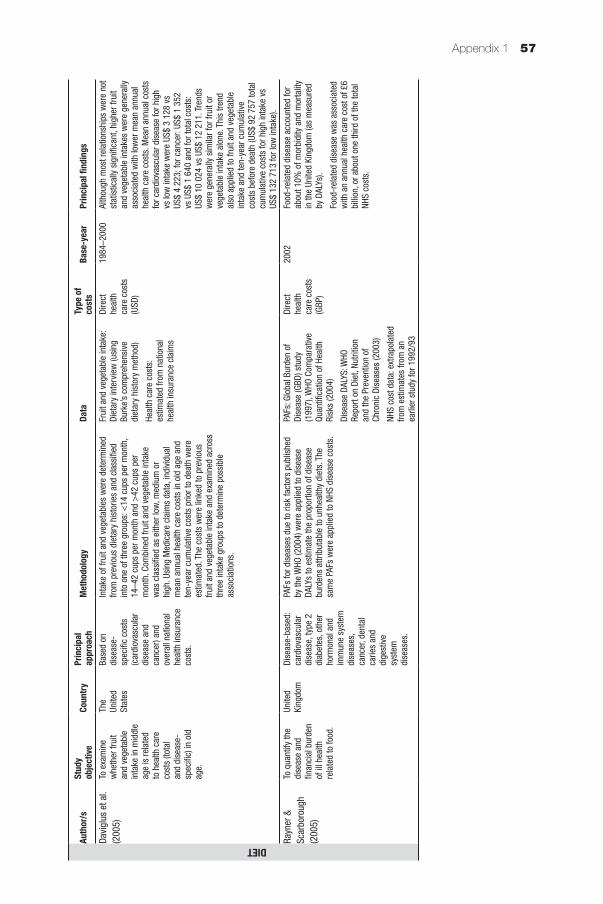
Appendix 1 57
Auth
or/s
Stud
y ob
jectiv
eCo
untry
Prin
cipal
ap
proa
chM
etho
dolo
gyDa
taTy
pe o
f co
sts
Base
-yea
rPr
incip
al fi
ndin
gs
DIETDavi
glus
et a
l. (2
005)
To e
xam
ine
whe
ther
frui
t an
d ve
geta
ble
inta
ke in
mid
dle
age
is re
late
d to
hea
lth c
are
cost
s (to
tal
and
dise
ase-
spec
ific)
in o
ld
age.
The
Unite
d St
ates
Base
d on
di
seas
e-sp
ecifi
c co
sts
(car
diov
ascu
lar
dise
ase
and
canc
er) a
nd
over
all n
atio
nal
heal
th in
sura
nce
cost
s.
Inta
ke o
f fru
it an
d ve
geta
bles
wer
e de
term
ined
fro
m p
revi
ous
diet
ary
hist
orie
s an
d cl
assi
fied
into
one
of t
hree
gro
ups:
<14
cup
s pe
r mon
th,
14–4
2 cu
ps p
er m
onth
and
>42
cup
s pe
r m
onth
. Com
bine
d fru
it an
d ve
geta
ble
inta
ke
was
cla
ssifi
ed a
s ei
ther
low
, med
ium
or
high
. Usi
ng M
edic
are
clai
ms
data
, ind
ivid
ual
mea
n an
nual
hea
lth c
are
cost
s in
old
age
and
te
n-ye
ar c
umul
ativ
e co
sts
prio
r to
deat
h w
ere
estim
ated
. The
cos
ts w
ere
linke
d to
pre
viou
s fru
it an
d ve
geta
ble
inta
ke a
nd e
xam
ined
acr
oss
thre
e in
take
gro
ups
to d
eter
min
e po
ssib
le
asso
ciat
ions
.
Frui
t and
veg
etab
le in
take
: Di
etar
y in
terv
iew
(usi
ng
Burk
e’s
com
preh
ensi
ve
diet
ary
hist
ory
met
hod)
Heal
th c
are
cost
s:
estim
ated
from
nat
iona
l he
alth
insu
ranc
e cl
aim
s
Dire
ct
heal
th
care
cos
ts
(USD
)
1984
–200
0Al
thou
gh m
ost r
elat
ions
hips
wer
e no
t st
atis
tical
ly s
igni
fican
t, hi
gher
frui
t an
d ve
geta
ble
inta
kes
wer
e ge
nera
lly
asso
ciat
ed w
ith lo
wer
mea
n an
nual
he
alth
car
e co
sts.
Mea
n an
nual
cos
ts
for c
ardi
ovas
cula
r dis
ease
for h
igh
vs lo
w in
take
wer
e US
$ 3
128
vs
US$
4 22
3; fo
r can
cer:
US$
1 35
2 vs
US$
1 6
40 a
nd fo
r tot
al c
osts
: US
$ 10
024
vs
US$
12 2
11. T
rend
s w
ere
gene
rally
sim
ilar f
or fr
uit o
r ve
geta
ble
inta
ke a
lone
. Thi
s tre
nd
also
app
lied
to fr
uit a
nd v
eget
able
in
take
and
ten-
year
cum
ulat
ive
cost
s be
fore
dea
th (U
S$ 9
2 75
7 to
tal
cum
ulat
ive
cost
s fo
r hig
h in
take
vs
US$
132
713
for l
ow in
take
).
Rayn
er &
Sc
arbo
roug
h (2
005)
To q
uant
ify th
e di
seas
e an
d fin
anci
al b
urde
n of
ill h
ealth
re
late
d to
food
.
Unite
d Ki
ngdo
mDi
seas
e-ba
sed:
ca
rdio
vasc
ular
di
seas
e, ty
pe 2
di
abet
es, o
ther
ho
rmon
al a
nd
imm
une
syst
em
dise
ases
, ca
ncer
, den
tal
carie
s an
d di
gest
ive
syst
em
dise
ases
.
PAFs
for d
isea
ses
due
to ri
sk fa
ctor
s pu
blis
hed
by th
e W
HO (2
004)
wer
e ap
plie
d to
dis
ease
DA
LYs
to e
stim
ate
the
prop
ortio
n of
dis
ease
bu
rden
s at
tribu
tabl
e to
unh
ealth
y di
ets.
The
sa
me
PAFs
wer
e ap
plie
d to
NHS
dis
ease
cos
ts.
PAFs
: Glo
bal B
urde
n of
Di
seas
e (G
BD) s
tudy
(1
997)
, WHO
Com
para
tive
Quan
tifica
tion
of H
ealth
Ri
sks
(200
4)
Dise
ase
DALY
S: W
HO
Repo
rt on
Die
t, Nu
tritio
n an
d th
e Pr
even
tion
of
Chro
nic
Dise
ases
(200
3)
NHS
cost
dat
a: e
xtra
pola
ted
from
est
imat
es fr
om a
n ea
rlier
stu
dy fo
r 199
2/93
Dire
ct
heal
th
care
cos
ts
(GBP
)
2002
Food
-rel
ated
dis
ease
acc
ount
ed fo
r ab
out 1
0% o
f mor
bidi
ty a
nd m
orta
lity
in th
e Un
ited
King
dom
(as
mea
sure
d by
DAL
Ys).
Food
-rel
ated
dis
ease
was
ass
ocia
ted
with
an
annu
al h
ealth
car
e co
st o
f £6
billi
on, o
r abo
ut o
ne th
ird o
f the
tota
l NH
S co
sts.
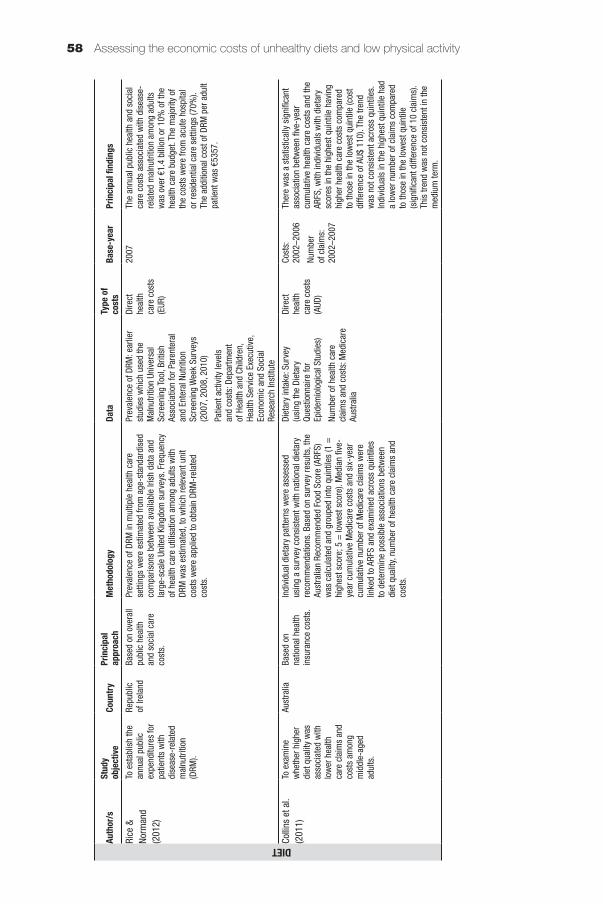
Assessing the economic costs of unhealthy diets and low physical activity58
Auth
or/s
Stud
y ob
jectiv
eCo
untry
Prin
cipal
ap
proa
chM
etho
dolo
gyDa
taTy
pe o
f co
sts
Base
-yea
rPr
incip
al fi
ndin
gs
DIETRice
&
Norm
and
(201
2)
To e
stab
lish
the
annu
al p
ublic
ex
pend
iture
s fo
r pa
tient
s w
ith
dise
ase-
rela
ted
mal
nutri
tion
(DRM
).
Repu
blic
of
Irel
and
Base
d on
ove
rall
publ
ic h
ealth
an
d so
cial
car
e co
sts.
Prev
alen
ce o
f DRM
in m
ultip
le h
ealth
car
e se
tting
s w
ere
estim
ated
from
age
-sta
ndar
dise
d co
mpa
rison
s be
twee
n av
aila
ble
Irish
dat
a an
d la
rge-
scal
e Un
ited
King
dom
sur
veys
. Fre
quen
cy
of h
ealth
car
e ut
ilisa
tion
amon
g ad
ults
with
DR
M w
as e
stim
ated
, to
whi
ch re
leva
nt u
nit
cost
s w
ere
appl
ied
to o
btai
n DR
M-r
elat
ed
cost
s.
Prev
alen
ce o
f DRM
: ear
lier
stud
ies
whi
ch u
sed
the
Mal
nutri
tion
Univ
ersa
l Sc
reen
ing
Tool
, Brit
ish
Asso
ciat
ion
for P
aren
tera
l an
d En
tera
l Nut
ritio
n Sc
reen
ing
Wee
k Su
rvey
s (2
007,
200
8, 2
010)
Patie
nt a
ctiv
ity le
vels
an
d co
sts:
Dep
artm
ent
of H
ealth
and
Chi
ldre
n,
Heal
th S
ervi
ce E
xecu
tive,
Ec
onom
ic a
nd S
ocia
l Re
sear
ch In
stitu
te
Dire
ct
heal
th
care
cos
ts
(EUR
)
2007
The
annu
al p
ublic
hea
lth a
nd s
ocia
l ca
re c
osts
ass
ocia
ted
with
dis
ease
-re
late
d m
alnu
tritio
n am
ong
adul
ts
was
ove
r €1.
4 bi
llion
or 1
0% o
f the
he
alth
car
e bu
dget
. The
maj
ority
of
the
cost
s w
ere
from
acu
te h
ospi
tal
or re
side
ntia
l car
e se
tting
s (7
0%).
The
addi
tiona
l cos
t of D
RM p
er a
dult
patie
nt w
as €
5357
.
Colli
ns e
t al.
(201
1)To
exa
min
e w
heth
er h
ighe
r di
et q
ualit
y w
as
asso
ciat
ed w
ith
low
er h
ealth
ca
re c
laim
s an
d co
sts
amon
g m
iddl
e-ag
ed
adul
ts.
Aust
ralia
Base
d on
na
tiona
l hea
lth
insu
ranc
e co
sts.
Indi
vidu
al d
ieta
ry p
atte
rns
wer
e as
sess
ed
usin
g a
surv
ey c
onsi
sten
t with
nat
iona
l die
tary
re
com
men
datio
ns. B
ased
on
surv
ey re
sults
, the
Au
stra
lian
Reco
mm
ende
d Fo
od S
core
(ARF
S)
was
cal
cula
ted
and
grou
ped
into
qui
ntile
s (1
=
high
est s
core
; 5 =
low
est s
core
). M
edia
n fiv
e-ye
ar c
umul
ativ
e M
edic
are
cost
s an
d si
x-ye
ar
cum
ulat
ive
num
ber o
f Med
icar
e cl
aim
s w
ere
linke
d to
ARF
S an
d ex
amin
ed a
cros
s qu
intil
es
to d
eter
min
e po
ssib
le a
ssoc
iatio
ns b
etw
een
diet
qua
lity,
num
ber o
f hea
lth c
are
clai
ms
and
cost
s.
Diet
ary
inta
ke: S
urve
y (u
sing
the
Diet
ary
Ques
tionn
aire
for
Epid
emio
logi
cal S
tudi
es)
Num
ber o
f hea
lth c
are
clai
ms
and
cost
s: M
edic
are
Aust
ralia
Dire
ct
heal
th
care
cos
ts
(AUD
)
Cost
s:
2002
–200
6
Num
ber
of c
laim
s:
2002
–200
7
Ther
e w
as a
sta
tistic
ally
sig
nific
ant
asso
ciat
ion
betw
een
five-
year
cu
mul
ativ
e he
alth
car
e co
sts
and
the
ARFS
, with
indi
vidu
als
with
die
tary
sc
ores
in th
e hi
ghes
t qui
ntile
hav
ing
high
er h
ealth
car
e co
sts
com
pare
d to
thos
e in
the
low
est q
uint
ile (c
ost
diffe
renc
e of
AU$
110
). Th
e tre
nd
was
not
con
sist
ent a
cros
s qu
intil
es.
Indi
vidu
als
in th
e hi
ghes
t qui
ntile
had
a
low
er n
umbe
r of c
laim
s co
mpa
red
to th
ose
in th
e lo
wes
t qui
ntile
(s
igni
fican
t diff
eren
ce o
f 10
clai
ms)
. Th
is tr
end
was
not
con
sist
ent i
n th
e m
ediu
m te
rm.
Auth
or/s
Stud
y ob
jectiv
eCo
untry
Prin
cipal
ap
proa
chM
etho
dolo
gyDa
taTy
pe o
f co
sts
Base
-yea
rPr
incip
al fi
ndin
gs
DIETDoid
ge e
t al.
(201
2)To
qua
ntify
the
pote
ntia
l effe
cts
of in
crea
sing
da
iry p
rodu
ct
cons
umpt
ion
to
reco
mm
ende
d le
vels
in te
rms
of p
opul
atio
n he
alth
impa
ct
and
dire
ct
heal
th c
are
cost
s.
Aust
ralia
Dise
ase-
base
d:
type
2 d
iabe
tes,
is
chae
mic
hea
rt di
seas
e, s
troke
, os
teop
oros
is,
obes
ity,
hype
rtens
ion.
PAFs
for d
isea
ses
rela
ted
to lo
w d
airy
co
nsum
ptio
n w
ere
iden
tified
bas
ed o
n fin
e le
vels
of d
airy
con
sum
ptio
n (i.
e. in
crem
ents
of
0.1
stan
dard
ser
ving
per
day
), an
d di
strib
utio
n am
ong
the
popu
latio
n an
d co
rres
pond
ing
RRs.
Tw
o va
riant
-for
mul
as w
ere
used
to c
alcu
late
th
e PA
Fs, d
epen
ding
on
data
ava
ilabi
lity.
Resu
lting
PAF
s w
ere
appl
ied
to d
isea
se D
ALYs
an
d he
alth
car
e co
sts
to d
eter
min
e pr
opor
tions
po
tent
ially
avo
ided
by
incr
easi
ng d
airy
co
nsum
ptio
n.
Dairy
con
sum
ptio
n le
vels
an
d po
pula
tion
dist
ribut
ion:
Au
stra
lian
Natio
nal N
utrit
ion
Surv
ey (1
995)
RRs:
Ear
lier s
tudi
es
repr
esen
ting
the
“hig
hest
le
vel o
f evi
denc
e” (a
s pe
r cr
iteria
by
Phill
ips
et a
l. (2
009)
)
Dise
ase
DALY
s an
d co
sts:
Au
stra
lian
Inst
itute
of
Heal
th a
nd W
elfa
re, e
arlie
r st
udie
s, g
over
nmen
t re
ports
, prim
ary
anal
ysis
of
publ
icly
ava
ilabl
e da
taba
ses
and
gove
rnm
ent r
epor
ts
Dire
ct
heal
th
care
cos
ts
(AUD
)
2010
–201
1In
crea
sing
dai
ry c
onsu
mpt
ion
to
reco
mm
ende
d le
vels
can
pot
entia
lly
prev
ent 1
8.4%
of t
he in
cide
nt
case
s of
obe
sity
, 10.
2% o
f typ
e 2
diab
etes
, 5%
of i
scha
emic
hea
rt di
seas
e, 1
6.2%
of s
troke
and
8.3
%
of h
yper
tens
ion.
Incr
easi
ng d
airy
con
sum
ptio
n ca
n po
tent
ially
sav
e AU
$ 2.
0 bi
llion
in
dire
ct h
ealth
car
e co
sts,
whi
le a
lso
savi
ng a
n ad
ditio
nal 7
5 01
2 DA
LYs.
Th
e am
ount
com
pris
es 1
.7%
of t
otal
di
rect
hea
lth c
are
expe
nditu
res
and
is c
ompa
rabl
e w
ith to
tal s
pend
ing
on p
ublic
hea
lth (A
U$ 2
.0 b
illio
n in
20
09–2
010)
.
Lo e
t al.
(201
3)To
ass
ess
the
rela
tions
hip
betw
een
diet
ary
qual
ity a
nd
med
ical
car
e ut
ilisa
tion
and
expe
nditu
res
amon
g po
pula
tions
ag
ed ≥
65 y
ears
.
Chin
a (T
aiw
an)
Base
d on
na
tiona
l hea
lth
insu
ranc
e co
sts.
Indi
vidu
al d
ieta
ry in
take
s w
ere
asse
ssed
th
roug
h a
24-h
our d
ieta
ry re
call.
Die
tary
qua
lity
was
sco
red
from
0 p
oint
s (lo
wes
t) to
6 p
oint
s (h
ighe
st) t
hrou
gh th
e Di
etar
y Di
vers
ity S
core
(D
DS) m
etho
d. N
atio
nal h
ealth
insu
ranc
e cl
aim
s in
the
succ
eedi
ng e
ight
yea
rs w
ere
linke
d to
DD
S sc
ores
and
exa
min
ed a
cros
s qu
artil
es
(DDS
sco
res
of ≤
3, 4
, 5, 6
) to
iden
tify
poss
ible
as
soci
atio
ns b
etw
een
diet
qua
lity
and
leve
l of
med
ical
util
isat
ion
and
cost
s.
Diet
ary
inta
ke: N
atio
nal
Elde
rly N
utrit
ion
and
Heal
th
Surv
ey (1
999–
2000
)
Med
ical
car
e ut
ilisa
tion
and
cost
s: N
atio
nal h
ealth
in
sura
nce
(cov
erin
g >
99%
of
the
popu
latio
n)
Dire
ct
heal
th
care
cos
ts
(TW
D)
1999
–200
6Pa
rtici
pant
s w
ith b
ette
r die
t qua
lity
(as
indi
cate
d by
hig
her D
DS) h
ad
low
er u
tilis
atio
n of
and
cos
ts fo
r em
erge
ncy
and
hosp
italis
atio
n se
rvic
es. A
vera
ge a
nnua
l em
erge
ncy
cost
s w
ere
NT$
2 33
0 vs
NT$
1 5
60 fo
r DDS
of ≤
3 vs
DDS
of
6. H
ospi
talis
atio
n co
sts
wer
e NT
$ 47
600
vs
NT$
35 1
00. F
or
prev
entiv
e an
d de
ntal
ser
vice
s,
how
ever
, hig
her D
DS p
redi
cted
gr
eate
r util
isat
ion
(0.2
5 an
d 0.
5 tim
es) a
nd c
osts
(+NT
$ 27
0 an
d +
NT$
420)
com
pare
d to
the
low
est
DDS.
Ove
rall
expe
nditu
res
wer
e st
ill lo
wer
for t
hose
with
hig
her
DDS
at N
T$ 6
4 20
0 (D
DS o
f 6) v
s NT
$ 68
300
(DDS
≤3)
.
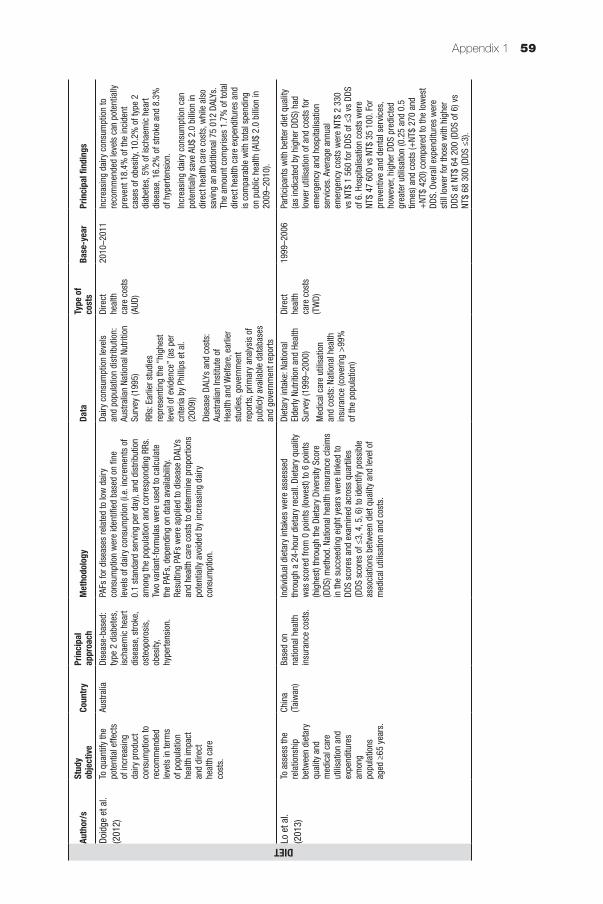
Appendix 1 59
Auth
or/s
Stud
y ob
jectiv
eCo
untry
Prin
cipal
ap
proa
chM
etho
dolo
gyDa
taTy
pe o
f co
sts
Base
-yea
rPr
incip
al fi
ndin
gs
DIETDoid
ge e
t al.
(201
2)To
qua
ntify
the
pote
ntia
l effe
cts
of in
crea
sing
da
iry p
rodu
ct
cons
umpt
ion
to
reco
mm
ende
d le
vels
in te
rms
of p
opul
atio
n he
alth
impa
ct
and
dire
ct
heal
th c
are
cost
s.
Aust
ralia
Dise
ase-
base
d:
type
2 d
iabe
tes,
is
chae
mic
hea
rt di
seas
e, s
troke
, os
teop
oros
is,
obes
ity,
hype
rtens
ion.
PAFs
for d
isea
ses
rela
ted
to lo
w d
airy
co
nsum
ptio
n w
ere
iden
tified
bas
ed o
n fin
e le
vels
of d
airy
con
sum
ptio
n (i.
e. in
crem
ents
of
0.1
stan
dard
ser
ving
per
day
), an
d di
strib
utio
n am
ong
the
popu
latio
n an
d co
rres
pond
ing
RRs.
Tw
o va
riant
-for
mul
as w
ere
used
to c
alcu
late
th
e PA
Fs, d
epen
ding
on
data
ava
ilabi
lity.
Resu
lting
PAF
s w
ere
appl
ied
to d
isea
se D
ALYs
an
d he
alth
car
e co
sts
to d
eter
min
e pr
opor
tions
po
tent
ially
avo
ided
by
incr
easi
ng d
airy
co
nsum
ptio
n.
Dairy
con
sum
ptio
n le
vels
an
d po
pula
tion
dist
ribut
ion:
Au
stra
lian
Natio
nal N
utrit
ion
Surv
ey (1
995)
RRs:
Ear
lier s
tudi
es
repr
esen
ting
the
“hig
hest
le
vel o
f evi
denc
e” (a
s pe
r cr
iteria
by
Phill
ips
et a
l. (2
009)
)
Dise
ase
DALY
s an
d co
sts:
Au
stra
lian
Inst
itute
of
Heal
th a
nd W
elfa
re, e
arlie
r st
udie
s, g
over
nmen
t re
ports
, prim
ary
anal
ysis
of
publ
icly
ava
ilabl
e da
taba
ses
and
gove
rnm
ent r
epor
ts
Dire
ct
heal
th
care
cos
ts
(AUD
)
2010
–201
1In
crea
sing
dai
ry c
onsu
mpt
ion
to
reco
mm
ende
d le
vels
can
pot
entia
lly
prev
ent 1
8.4%
of t
he in
cide
nt
case
s of
obe
sity
, 10.
2% o
f typ
e 2
diab
etes
, 5%
of i
scha
emic
hea
rt di
seas
e, 1
6.2%
of s
troke
and
8.3
%
of h
yper
tens
ion.
Incr
easi
ng d
airy
con
sum
ptio
n ca
n po
tent
ially
sav
e AU
$ 2.
0 bi
llion
in
dire
ct h
ealth
car
e co
sts,
whi
le a
lso
savi
ng a
n ad
ditio
nal 7
5 01
2 DA
LYs.
Th
e am
ount
com
pris
es 1
.7%
of t
otal
di
rect
hea
lth c
are
expe
nditu
res
and
is c
ompa
rabl
e w
ith to
tal s
pend
ing
on p
ublic
hea
lth (A
U$ 2
.0 b
illio
n in
20
09–2
010)
.
Lo e
t al.
(201
3)To
ass
ess
the
rela
tions
hip
betw
een
diet
ary
qual
ity a
nd
med
ical
car
e ut
ilisa
tion
and
expe
nditu
res
amon
g po
pula
tions
ag
ed ≥
65 y
ears
.
Chin
a (T
aiw
an)
Base
d on
na
tiona
l hea
lth
insu
ranc
e co
sts.
Indi
vidu
al d
ieta
ry in
take
s w
ere
asse
ssed
th
roug
h a
24-h
our d
ieta
ry re
call.
Die
tary
qua
lity
was
sco
red
from
0 p
oint
s (lo
wes
t) to
6 p
oint
s (h
ighe
st) t
hrou
gh th
e Di
etar
y Di
vers
ity S
core
(D
DS) m
etho
d. N
atio
nal h
ealth
insu
ranc
e cl
aim
s in
the
succ
eedi
ng e
ight
yea
rs w
ere
linke
d to
DD
S sc
ores
and
exa
min
ed a
cros
s qu
artil
es
(DDS
sco
res
of ≤
3, 4
, 5, 6
) to
iden
tify
poss
ible
as
soci
atio
ns b
etw
een
diet
qua
lity
and
leve
l of
med
ical
util
isat
ion
and
cost
s.
Diet
ary
inta
ke: N
atio
nal
Elde
rly N
utrit
ion
and
Heal
th
Surv
ey (1
999–
2000
)
Med
ical
car
e ut
ilisa
tion
and
cost
s: N
atio
nal h
ealth
in
sura
nce
(cov
erin
g >
99%
of
the
popu
latio
n)
Dire
ct
heal
th
care
cos
ts
(TW
D)
1999
–200
6Pa
rtici
pant
s w
ith b
ette
r die
t qua
lity
(as
indi
cate
d by
hig
her D
DS) h
ad
low
er u
tilis
atio
n of
and
cos
ts fo
r em
erge
ncy
and
hosp
italis
atio
n se
rvic
es. A
vera
ge a
nnua
l em
erge
ncy
cost
s w
ere
NT$
2 33
0 vs
NT$
1 5
60 fo
r DDS
of ≤
3 vs
DDS
of
6. H
ospi
talis
atio
n co
sts
wer
e NT
$ 47
600
vs
NT$
35 1
00. F
or
prev
entiv
e an
d de
ntal
ser
vice
s,
how
ever
, hig
her D
DS p
redi
cted
gr
eate
r util
isat
ion
(0.2
5 an
d 0.
5 tim
es) a
nd c
osts
(+NT
$ 27
0 an
d +
NT$
420)
com
pare
d to
the
low
est
DDS.
Ove
rall
expe
nditu
res
wer
e st
ill lo
wer
for t
hose
with
hig
her
DDS
at N
T$ 6
4 20
0 (D
DS o
f 6) v
s NT
$ 68
300
(DDS
≤3)
.
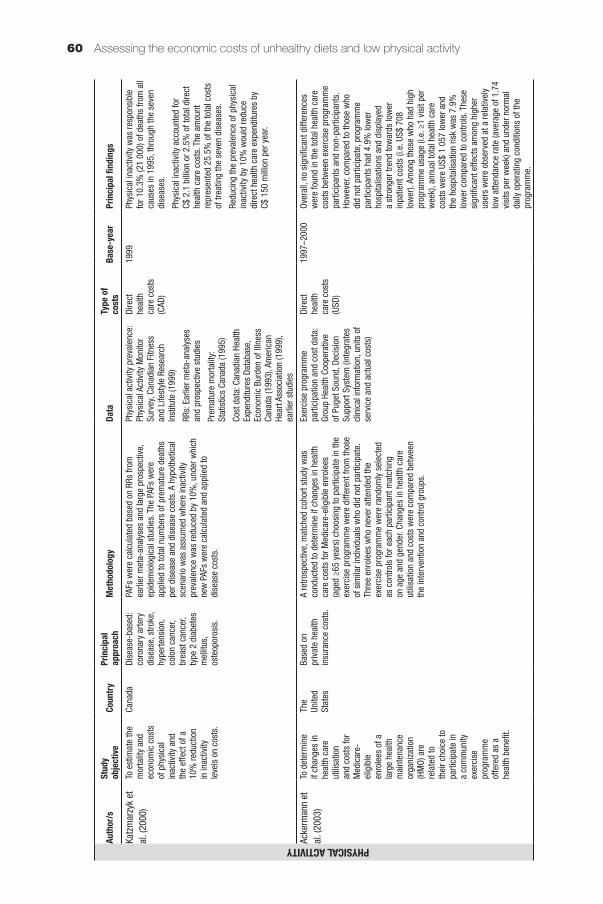
Assessing the economic costs of unhealthy diets and low physical activity60
Auth
or/s
Stud
y ob
jectiv
eCo
untry
Prin
cipal
ap
proa
chM
etho
dolo
gyDa
taTy
pe o
f co
sts
Base
-yea
rPr
incip
al fi
ndin
gs
PHYSICAL ACTIVITYKatz
mar
zyk
et
al. (
2000
)To
est
imat
e th
e m
orta
lity
and
econ
omic
cos
ts
of p
hysi
cal
inac
tivity
and
th
e ef
fect
of a
10
% re
duct
ion
in in
activ
ity
leve
ls o
n co
sts.
Cana
daDi
seas
e-ba
sed:
co
rona
ry a
rtery
di
seas
e, s
troke
, hy
perte
nsio
n,
colo
n ca
ncer
, br
east
can
cer,
type
2 d
iabe
tes
mel
litus
, os
teop
oros
is.
PAFs
wer
e ca
lcul
ated
bas
ed o
n RR
s fro
m
earli
er m
eta-
anal
yses
and
larg
e pr
ospe
ctiv
e,
epid
emio
logi
cal s
tudi
es. T
he P
AFs
wer
e ap
plie
d to
tota
l num
bers
of p
rem
atur
e de
aths
pe
r dis
ease
and
dis
ease
cos
ts. A
hyp
othe
tical
sc
enar
io w
as a
ssum
ed w
here
inac
tivity
pr
eval
ence
was
redu
ced
by 1
0%, u
nder
whi
ch
new
PAF
s w
ere
calc
ulat
ed a
nd a
pplie
d to
di
seas
e co
sts.
Phys
ical
act
ivity
pre
vale
nce:
Ph
ysic
al A
ctiv
ity M
onito
r Su
rvey
, Can
adia
n Fi
tnes
s an
d Li
fest
yle
Rese
arch
In
stitu
te (1
999)
RRs:
Ear
lier m
eta-
anal
yses
an
d pr
ospe
ctiv
e st
udie
s
Prem
atur
e m
orta
lity:
St
atis
tics
Cana
da (1
995)
Cost
dat
a: C
anad
ian
Heal
th
Expe
nditu
res
Data
base
, Ec
onom
ic B
urde
n of
Illn
ess
Cana
da (1
993)
, Am
eric
an
Hear
t Ass
ocia
tion
(199
9),
earli
er s
tudi
es
Dire
ct
heal
th
care
cos
ts
(CAD
)
1999
Phys
ical
inac
tivity
was
resp
onsi
ble
for 1
0.3%
(21
000)
of d
eath
s fro
m a
ll ca
uses
in 1
995,
thro
ugh
the
seve
n di
seas
es.
Phys
ical
inac
tivity
acc
ount
ed fo
r C$
2.1
bill
ion
or 2
.5%
of t
otal
dire
ct
heal
th c
are
cost
s. T
he a
mou
nt
repr
esen
ted
25.5
% o
f the
tota
l cos
ts
of tr
eatin
g th
e se
ven
dise
ases
.
Redu
cing
the
prev
alen
ce o
f phy
sica
l in
activ
ity b
y 10
% w
ould
redu
ce
dire
ct h
ealth
car
e ex
pend
iture
s by
C$
150
mill
ion
per y
ear.
Acke
rman
n et
al
. (20
03)
To d
eter
min
e if
chan
ges
in
heal
th c
are
utili
satio
n an
d co
sts
for
Med
icar
e-el
igib
le
enro
lees
of a
la
rge
heal
th
mai
nten
ance
or
gani
zatio
n (H
MO)
are
re
late
d to
th
eir c
hoic
e to
pa
rtici
pate
in
a co
mm
unity
ex
erci
se
prog
ram
me
offe
red
as a
he
alth
ben
efit.
The
Unite
d St
ates
Base
d on
pr
ivat
e he
alth
in
sura
nce
cost
s.
A re
trosp
ectiv
e, m
atch
ed c
ohor
t stu
dy w
as
cond
ucte
d to
det
erm
ine
if ch
ange
s in
hea
lth
care
cos
ts fo
r Med
icar
e-el
igib
le e
nrol
ees
(age
d ≥6
5 ye
ars)
cho
osin
g to
par
ticip
ate
in th
e ex
erci
se p
rogr
amm
e w
ere
diffe
rent
from
thos
e of
sim
ilar i
ndiv
idua
ls w
ho d
id n
ot p
artic
ipat
e.
Thre
e en
role
es w
ho n
ever
atte
nded
the
exer
cise
pro
gram
me
wer
e ra
ndom
ly s
elec
ted
as c
ontro
ls fo
r eac
h pa
rtici
pant
mat
chin
g on
age
and
gen
der.
Chan
ges
in h
ealth
car
e ut
ilisa
tion
and
cost
s w
ere
com
pare
d be
twee
n th
e in
terv
entio
n an
d co
ntro
l gro
ups.
Exer
cise
pro
gram
me
parti
cipa
tion
and
cost
dat
a:
Grou
p He
alth
Coo
pera
tive
of P
uget
Sou
nd, D
ecis
ion
Supp
ort S
yste
m (i
nteg
rate
s cl
inic
al in
form
atio
n, u
nits
of
serv
ice
and
actu
al c
osts
)
Dire
ct
heal
th
care
cos
ts
(USD
)
1997
–200
0Ov
eral
l, no
sig
nific
ant d
iffer
ence
s w
ere
foun
d in
the
tota
l hea
lth c
are
cost
s be
twee
n ex
erci
se p
rogr
amm
e pa
rtici
pant
s an
d no
n-pa
rtici
pant
s.
How
ever
, com
pare
d to
thos
e w
ho
did
not p
artic
ipat
e, p
rogr
amm
e pa
rtici
pant
s ha
d 4.
9% lo
wer
ho
spita
lisat
ions
and
dis
play
ed
a st
rong
er tr
end
tow
ards
low
er
inpa
tient
cos
ts (i
.e. U
S$ 7
08
low
er).
Amon
g th
ose
who
had
hig
h pr
ogra
mm
e us
age
(i.e.
≥1
visi
t per
w
eek)
, ann
ual t
otal
hea
lth c
are
cost
s w
ere
US$
1 05
7 lo
wer
and
th
e ho
spita
lisat
ion
risk
was
7.9
%
low
er c
ompa
red
to c
ontro
ls. T
hese
si
gnifi
cant
effe
cts
amon
g hi
gher
us
ers
wer
e ob
serv
ed a
t a re
lativ
ely
low
atte
ndan
ce ra
te (a
vera
ge o
f 1.7
4 vi
sits
per
wee
k) a
nd u
nder
nor
mal
da
ily o
pera
ting
cond
ition
s of
the
prog
ram
me.
Auth
or/s
Stud
y ob
jectiv
eCo
untry
Prin
cipal
ap
proa
chM
etho
dolo
gyDa
taTy
pe o
f co
sts
Base
-yea
rPr
incip
al fi
ndin
gs
PHYSICAL ACTIVITYMar
tinso
n et
al
. (20
03)
To e
xam
ine
the
impa
ct o
f ch
ange
s in
ph
ysic
al a
ctiv
ity
over
the
cour
se
of a
sin
gle
year
on
sho
rt-te
rm
chan
ges
in
heal
th c
are
char
ges
amon
g m
embe
rs o
f a
heal
th p
lan
aged
50
and
abov
e.
The
Unite
d St
ates
Base
d on
co
mm
erci
al
heal
th in
sura
nce
cost
s.
Heal
th p
lan
mem
bers
wer
e su
rvey
ed tw
ice
for
phys
ical
act
ivity
leve
ls (i
n Au
gust
199
5 an
d Se
ptem
ber 1
996)
. Ind
ivid
uals
wer
e cl
assi
fied
as a
ctiv
e or
inac
tive
at e
ach
of th
e tw
o tim
e po
ints
. To
acco
unt f
or a
ltern
ativ
e de
finiti
ons
of
phys
ical
act
ivity
, five
defi
nitio
ns o
f ina
ctiv
ity
and
activ
ity w
ere
used
:A:
Inac
tive
= 0
day
s, a
ctiv
e =
1+
day
sB:
Inac
tive
= 0
day
s, a
ctiv
e =
2+
day
sC:
Inac
tive
= 0
–1 d
ays,
act
ive
= 2
+ d
ays
D: In
activ
e =
0–1
day
s, a
ctiv
e =
3+
day
sE:
Inac
tive
= 0
–1 d
ays,
act
ive
= 4
+ d
ays
A sp
ecifi
c de
finiti
on w
as u
sed
in c
ateg
oris
ing
an in
divi
dual
’s p
hysi
cal a
ctiv
ity c
hang
es
betw
een
Augu
st 1
995
and
Sept
embe
r 199
6 in
to o
ne o
f five
mut
ually
exc
lusi
ve g
roup
s: (1
) in
activ
e to
inac
tive,
(2) a
ctiv
e to
act
ive,
(3)
activ
e to
inac
tive,
(4) i
nact
ive
to a
ctiv
e an
d (5
) un
clas
sifie
d (fa
lling
with
in th
e “g
ap””
bet
wee
n th
e in
activ
e an
d ac
tive
cate
gorie
s un
der B
, D
and
E). C
hang
es in
hea
lth c
are
char
ges
betw
een
Sept
embe
r 199
4 to
Aug
ust 1
995
and
Sept
embe
r 199
6 to
Aug
ust 1
997
wer
e ex
amin
ed a
cros
s 25
phy
sica
l act
ivity
cha
nge
grou
ps to
det
erm
ine
poss
ible
ass
ocia
tions
.
Phys
ical
act
ivity
leve
ls:
Heal
thPa
rtner
s M
inne
sota
he
alth
pla
n m
embe
rs’
surv
ey
Heal
th c
are
char
ges:
co
mm
erci
al h
ealth
in
sura
nce
Dire
ct
heal
th
care
cos
ts
(USD
)
1994
–199
5 an
d 19
96–1
997
For p
hysi
cal i
nact
ivity
/act
ivity
de
finiti
ons
A an
d B,
phy
sica
lly
activ
e gr
oups
had
larg
er d
ecre
ases
in
hea
lth c
are
char
ges
rela
tive
to
indi
vidu
als
who
wer
e ph
ysic
ally
in
activ
e in
bot
h su
rvey
s. T
hese
de
clin
es ra
nged
from
US$
1 2
00 to
US
$ 1
900.
For
defi
nitio
ns C
, D a
nd
E, d
eclin
es in
tota
l cha
rges
wer
e ob
serv
ed p
rimar
ily a
mon
g in
divi
dual
s w
ho m
oved
from
inac
tivity
to a
ctiv
ity.
In p
artic
ular
for d
efini
tion
D, th
e de
clin
e in
cha
rges
was
sig
nific
antly
la
rger
(in
the
inac
tive
to a
ctiv
e gr
oup)
at
US$
2 2
00. S
imila
r tre
nds
are
seen
in
mod
els
usin
g de
finiti
ons
C an
d E
but t
he re
sults
are
not
sig
nific
ant.
Garr
ett e
t al.
(200
4)To
est
imat
e th
e co
sts
of p
hysi
cal
inac
tivity
am
ong
mem
bers
of
the
Blue
Cro
ss
Blue
Shi
eld
heal
th p
lan
in
Min
neso
ta.
The
Unite
d St
ates
Dise
ase-
base
d: h
eart
dise
ase,
stro
ke,
hype
rtens
ion,
ty
pe 2
dia
bete
s,
colo
n ca
ncer
, br
east
can
cer,
oste
opor
osis
, de
pres
sion
, an
xiet
y.
PAFs
wer
e ca
lcul
ated
bas
ed o
n RR
s fro
m
earli
er m
eta-
anal
yses
of p
ublis
hed
stud
ies,
st
ratifi
ed b
y le
vel o
f exp
osur
e: in
activ
e an
d irr
egul
arly
act
ive.
The
PAF
s w
ere
appl
ied
to
dise
ase
cost
s.
Phys
ical
act
ivity
pr
eval
ence
: Beh
avio
ural
Ri
sk F
acto
rs S
urve
illan
ce
Syst
em (2
000)
RRs:
Ear
lier m
eta-
anal
yses
of
pub
lishe
d st
udie
sCo
st d
ata:
Blu
e Cr
oss
and
Blue
Shi
eld
heal
th p
lan
Dire
ct
heal
th
care
cos
ts
(USD
)
2000
Phys
ical
inac
tivity
was
est
imat
ed
to a
ccou
nt fo
r US$
83.
6 m
illio
n of
to
tal m
edic
al e
xpen
ditu
res
amon
g a
heal
th p
lan
popu
latio
n of
1.5
mill
ion
mem
bers
. The
cos
t per
mem
ber w
as
US$
56.
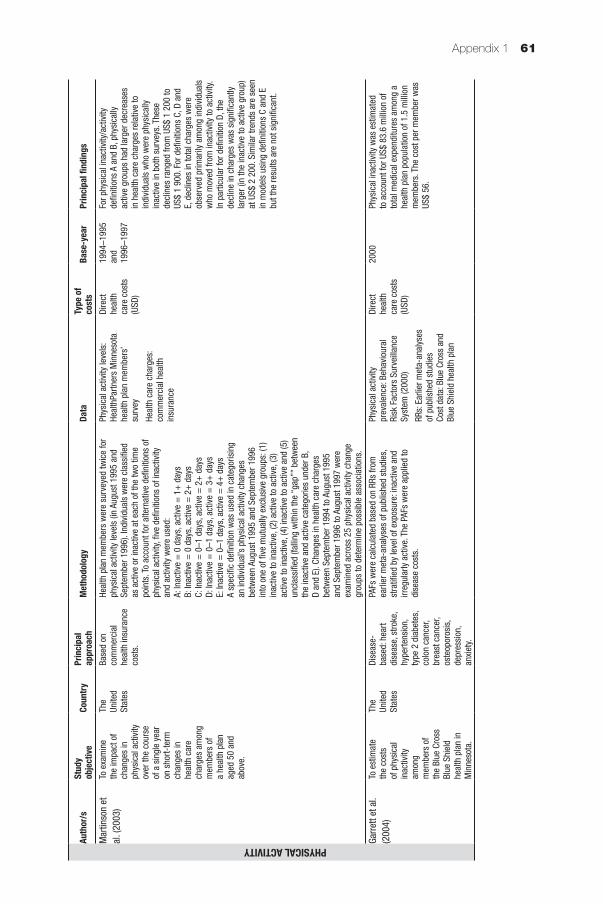
Appendix 1 61
Auth
or/s
Stud
y ob
jectiv
eCo
untry
Prin
cipal
ap
proa
chM
etho
dolo
gyDa
taTy
pe o
f co
sts
Base
-yea
rPr
incip
al fi
ndin
gs
PHYSICAL ACTIVITYMar
tinso
n et
al
. (20
03)
To e
xam
ine
the
impa
ct o
f ch
ange
s in
ph
ysic
al a
ctiv
ity
over
the
cour
se
of a
sin
gle
year
on
sho
rt-te
rm
chan
ges
in
heal
th c
are
char
ges
amon
g m
embe
rs o
f a
heal
th p
lan
aged
50
and
abov
e.
The
Unite
d St
ates
Base
d on
co
mm
erci
al
heal
th in
sura
nce
cost
s.
Heal
th p
lan
mem
bers
wer
e su
rvey
ed tw
ice
for
phys
ical
act
ivity
leve
ls (i
n Au
gust
199
5 an
d Se
ptem
ber 1
996)
. Ind
ivid
uals
wer
e cl
assi
fied
as a
ctiv
e or
inac
tive
at e
ach
of th
e tw
o tim
e po
ints
. To
acco
unt f
or a
ltern
ativ
e de
finiti
ons
of
phys
ical
act
ivity
, five
defi
nitio
ns o
f ina
ctiv
ity
and
activ
ity w
ere
used
:A:
Inac
tive
= 0
day
s, a
ctiv
e =
1+
day
sB:
Inac
tive
= 0
day
s, a
ctiv
e =
2+
day
sC:
Inac
tive
= 0
–1 d
ays,
act
ive
= 2
+ d
ays
D: In
activ
e =
0–1
day
s, a
ctiv
e =
3+
day
sE:
Inac
tive
= 0
–1 d
ays,
act
ive
= 4
+ d
ays
A sp
ecifi
c de
finiti
on w
as u
sed
in c
ateg
oris
ing
an in
divi
dual
’s p
hysi
cal a
ctiv
ity c
hang
es
betw
een
Augu
st 1
995
and
Sept
embe
r 199
6 in
to o
ne o
f five
mut
ually
exc
lusi
ve g
roup
s: (1
) in
activ
e to
inac
tive,
(2) a
ctiv
e to
act
ive,
(3)
activ
e to
inac
tive,
(4) i
nact
ive
to a
ctiv
e an
d (5
) un
clas
sifie
d (fa
lling
with
in th
e “g
ap””
bet
wee
n th
e in
activ
e an
d ac
tive
cate
gorie
s un
der B
, D
and
E). C
hang
es in
hea
lth c
are
char
ges
betw
een
Sept
embe
r 199
4 to
Aug
ust 1
995
and
Sept
embe
r 199
6 to
Aug
ust 1
997
wer
e ex
amin
ed a
cros
s 25
phy
sica
l act
ivity
cha
nge
grou
ps to
det
erm
ine
poss
ible
ass
ocia
tions
.
Phys
ical
act
ivity
leve
ls:
Heal
thPa
rtner
s M
inne
sota
he
alth
pla
n m
embe
rs’
surv
ey
Heal
th c
are
char
ges:
co
mm
erci
al h
ealth
in
sura
nce
Dire
ct
heal
th
care
cos
ts
(USD
)
1994
–199
5 an
d 19
96–1
997
For p
hysi
cal i
nact
ivity
/act
ivity
de
finiti
ons
A an
d B,
phy
sica
lly
activ
e gr
oups
had
larg
er d
ecre
ases
in
hea
lth c
are
char
ges
rela
tive
to
indi
vidu
als
who
wer
e ph
ysic
ally
in
activ
e in
bot
h su
rvey
s. T
hese
de
clin
es ra
nged
from
US$
1 2
00 to
US
$ 1
900.
For
defi
nitio
ns C
, D a
nd
E, d
eclin
es in
tota
l cha
rges
wer
e ob
serv
ed p
rimar
ily a
mon
g in
divi
dual
s w
ho m
oved
from
inac
tivity
to a
ctiv
ity.
In p
artic
ular
for d
efini
tion
D, th
e de
clin
e in
cha
rges
was
sig
nific
antly
la
rger
(in
the
inac
tive
to a
ctiv
e gr
oup)
at
US$
2 2
00. S
imila
r tre
nds
are
seen
in
mod
els
usin
g de
finiti
ons
C an
d E
but t
he re
sults
are
not
sig
nific
ant.
Garr
ett e
t al.
(200
4)To
est
imat
e th
e co
sts
of p
hysi
cal
inac
tivity
am
ong
mem
bers
of
the
Blue
Cro
ss
Blue
Shi
eld
heal
th p
lan
in
Min
neso
ta.
The
Unite
d St
ates
Dise
ase-
base
d: h
eart
dise
ase,
stro
ke,
hype
rtens
ion,
ty
pe 2
dia
bete
s,
colo
n ca
ncer
, br
east
can
cer,
oste
opor
osis
, de
pres
sion
, an
xiet
y.
PAFs
wer
e ca
lcul
ated
bas
ed o
n RR
s fro
m
earli
er m
eta-
anal
yses
of p
ublis
hed
stud
ies,
st
ratifi
ed b
y le
vel o
f exp
osur
e: in
activ
e an
d irr
egul
arly
act
ive.
The
PAF
s w
ere
appl
ied
to
dise
ase
cost
s.
Phys
ical
act
ivity
pr
eval
ence
: Beh
avio
ural
Ri
sk F
acto
rs S
urve
illan
ce
Syst
em (2
000)
RRs:
Ear
lier m
eta-
anal
yses
of
pub
lishe
d st
udie
sCo
st d
ata:
Blu
e Cr
oss
and
Blue
Shi
eld
heal
th p
lan
Dire
ct
heal
th
care
cos
ts
(USD
)
2000
Phys
ical
inac
tivity
was
est
imat
ed
to a
ccou
nt fo
r US$
83.
6 m
illio
n of
to
tal m
edic
al e
xpen
ditu
res
amon
g a
heal
th p
lan
popu
latio
n of
1.5
mill
ion
mem
bers
. The
cos
t per
mem
ber w
as
US$
56.
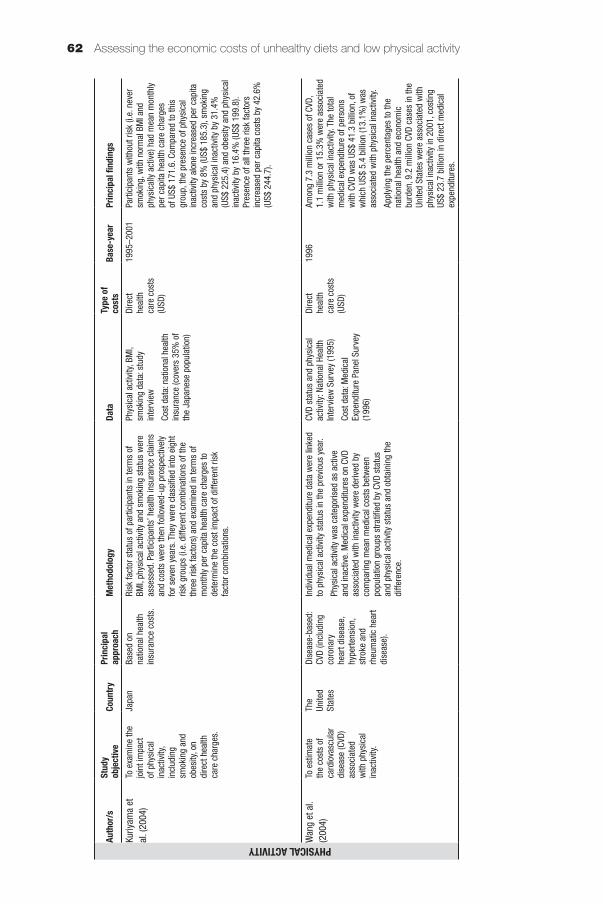
Assessing the economic costs of unhealthy diets and low physical activity62
Auth
or/s
Stud
y ob
jectiv
eCo
untry
Prin
cipal
ap
proa
chM
etho
dolo
gyDa
taTy
pe o
f co
sts
Base
-yea
rPr
incip
al fi
ndin
gs
PHYSICAL ACTIVITYKuriy
ama
et
al. (
2004
)To
exa
min
e th
e jo
int i
mpa
ct
of p
hysi
cal
inac
tivity
, in
clud
ing
smok
ing
and
obes
ity, o
n di
rect
hea
lth
care
cha
rges
.
Japa
nBa
sed
on
natio
nal h
ealth
in
sura
nce
cost
s.
Risk
fact
or s
tatu
s of
par
ticip
ants
in te
rms
of
BMI,
phys
ical
act
ivity
and
sm
okin
g st
atus
wer
e as
sess
ed. P
artic
ipan
ts’ h
ealth
insu
ranc
e cl
aim
s an
d co
sts
wer
e th
en fo
llow
ed-u
p pr
ospe
ctiv
ely
for s
even
yea
rs. T
hey
wer
e cl
assi
fied
into
eig
ht
risk
grou
ps (i
.e. d
iffer
ent c
ombi
natio
ns o
f the
th
ree
risk
fact
ors)
and
exa
min
ed in
term
s of
m
onth
ly p
er c
apita
hea
lth c
are
char
ges
to
dete
rmin
e th
e co
st im
pact
of d
iffer
ent r
isk
fact
or c
ombi
natio
ns.
Phys
ical
act
ivity
, BM
I, sm
okin
g da
ta: s
tudy
in
terv
iew
Cost
dat
a: n
atio
nal h
ealth
in
sura
nce
(cov
ers
35%
of
the
Japa
nese
pop
ulat
ion)
Dire
ct
heal
th
care
cos
ts
(USD
)
1995
–200
1Pa
rtici
pant
s w
ithou
t ris
k (i.
e. n
ever
sm
okin
g, w
ith n
orm
al B
MI a
nd
phys
ical
ly a
ctiv
e) h
ad m
ean
mon
thly
pe
r cap
ita h
ealth
car
e ch
arge
s of
US$
171
.6. C
ompa
red
to th
is
grou
p, th
e pr
esen
ce o
f phy
sica
l in
activ
ity a
lone
incr
ease
d pe
r cap
ita
cost
s by
8%
(US$
185
.3),
smok
ing
and
phys
ical
inac
tivity
by
31.4
%
(US$
225
.4) a
nd o
besi
ty a
nd p
hysi
cal
inac
tivity
by
16.4
% (U
S$ 1
99.8
). Pr
esen
ce o
f all
thre
e ris
k fa
ctor
s in
crea
sed
per c
apita
cos
ts b
y 42
.6%
(U
S$ 2
44.7
).
Wan
g et
al.
(200
4)To
est
imat
e th
e co
sts
of
card
iova
scul
ar
dise
ase
(CVD
) as
soci
ated
w
ith p
hysi
cal
inac
tivity
.
The
Unite
d St
ates
Dise
ase-
base
d:
CVD
(incl
udin
g co
rona
ry
hear
t dis
ease
, hy
perte
nsio
n,
stro
ke a
nd
rheu
mat
ic h
eart
dise
ase)
.
Indi
vidu
al m
edic
al e
xpen
ditu
re d
ata
wer
e lin
ked
to p
hysi
cal a
ctiv
ity s
tatu
s in
the
prev
ious
yea
r.
Phys
ical
act
ivity
was
cat
egor
ised
as
activ
e an
d in
activ
e. M
edic
al e
xpen
ditu
res
on C
VD
asso
ciat
ed w
ith in
activ
ity w
ere
deriv
ed b
y co
mpa
ring
mea
n m
edic
al c
osts
bet
wee
n po
pula
tion
grou
ps s
tratifi
ed b
y CV
D st
atus
an
d ph
ysic
al a
ctiv
ity s
tatu
s an
d ob
tain
ing
the
diffe
renc
e.
CVD
stat
us a
nd p
hysi
cal
activ
ity: N
atio
nal H
ealth
In
terv
iew
Sur
vey
(199
5)
Cost
dat
a: M
edic
al
Expe
nditu
re P
anel
Sur
vey
(199
6)
Dire
ct
heal
th
care
cos
ts
(USD
)
1996
Amon
g 7.
3 m
illio
n ca
ses
of C
VD,
1.1
mill
ion
or 1
5.3%
wer
e as
soci
ated
w
ith p
hysi
cal i
nact
ivity
. The
tota
l m
edic
al e
xpen
ditu
re o
f per
sons
w
ith C
VD w
as U
S$ 4
1.3
billi
on, o
f w
hich
US$
5.4
bill
ion
(13.
1%) w
as
asso
ciat
ed w
ith p
hysi
cal i
nact
ivity
.
Appl
ying
the
perc
enta
ges
to th
e na
tiona
l hea
lth a
nd e
cono
mic
bu
rden
, 9.2
mill
ion
CVD
case
s in
the
Unite
d St
ates
wer
e as
soci
ated
with
ph
ysic
al in
activ
ity in
200
1, c
ostin
g US
$ 23
.7 b
illio
n in
dire
ct m
edic
al
expe
nditu
res.
Auth
or/s
Stud
y ob
jectiv
eCo
untry
Prin
cipal
ap
proa
chM
etho
dolo
gyDa
taTy
pe o
f co
sts
Base
-yea
rPr
incip
al fi
ndin
gs
PHYSICAL ACTIVITYAnde
rson
et
al. (
2005
)To
est
imat
e th
e pr
opor
tion
of to
tal h
ealth
ca
re c
harg
es
asso
ciat
ed
with
phy
sica
l in
activ
ity,
over
wei
ght a
nd
obes
ity a
mon
g po
pula
tions
ag
ed 4
0 an
d ol
der.
The
Unite
d St
ates
Base
d on
co
mm
erci
al
heal
th in
sura
nce
cost
s.
A pr
edic
tive
mod
el o
f hea
lth c
are
char
ges
was
dev
elop
ed th
roug
h pr
elim
inar
y an
alys
is
of d
ata
from
8 0
00 h
ealth
pla
n m
embe
rs. F
ive
varia
bles
wer
e as
sess
ed in
ass
ocia
tion
with
he
alth
car
e ch
arge
s: p
hysi
cal a
ctiv
ity, B
MI,
chro
nic
dise
ase
stat
us (i
.e. w
ith d
iabe
tes
and/
or h
yper
tens
ion
or n
one)
and
sm
okin
g st
atus
. Co
unte
rfact
ual h
ealth
car
e ch
arge
s w
ere
also
es
timat
ed b
y re
clas
sify
ing
all i
ndiv
idua
ls a
s no
rmal
wei
ght a
nd p
hysi
cally
act
ive,
leav
ing
othe
r cha
ract
eris
tics
unch
ange
d. M
odel
cel
ls
for h
ypot
hetic
al 2
00 0
00 h
ealth
pla
n m
embe
rs
wer
e th
en d
evel
oped
and
defi
ned
by s
tatu
s of
BM
I, ph
ysic
al a
ctiv
ity a
nd o
ther
co-
varia
tes.
To
tal h
ealth
car
e ch
arge
s w
ere
estim
ated
by
mul
tiply
ing
the
perc
enta
ge o
f the
hea
lth p
lan
popu
latio
n in
eac
h ce
ll w
ith th
e pr
edic
ted
char
ges
per c
ell a
nd s
umm
ing
all c
ells
. Co
unte
rfact
ual e
stim
ates
wer
e co
mpu
ted
by
usin
g co
unte
rfact
ual c
harg
es. T
he d
iffer
ence
be
twee
n cu
rren
t ris
k pr
ofile
tota
l cha
rges
and
co
unte
rfact
ual t
otal
cha
rges
wer
e co
mpu
ted
as c
harg
es a
ssoc
iate
d w
ith p
hysi
cal i
nact
ivity
, ov
erw
eigh
t and
obe
sity
. The
sam
e ca
lcul
atio
n w
as p
erfo
rmed
but
usi
ng n
atio
nal p
opul
atio
n pe
rcen
tage
s to
iden
tify
natio
nal c
ost e
stim
ates
.
BMI,
phys
ical
act
ivity
an
d ot
her v
aria
ble
data
: He
alth
Partn
ers
Min
neso
ta
heal
th p
lan
surv
ey (1
995)
Heal
th c
are
char
ges:
co
mm
erci
al h
ealth
in
sura
nce
Natio
nal p
opul
atio
n pe
rcen
tage
s: N
atio
nal
Heal
th In
terv
iew
Sur
vey
(200
1)
Dire
ct
heal
th
care
cos
ts
(USD
)
1996
–199
9Fo
r a h
ealth
pla
n w
ith 2
00 0
00 w
hite
m
embe
rs a
ged
40 a
nd a
bove
, tot
al
annu
alis
ed h
ealth
car
e ch
arge
s of
US
$ 1.
12 b
illio
n w
as e
stim
ated
, 23
% o
f whi
ch (U
S$ 2
36 m
illio
n) w
as
asso
ciat
ed w
ith p
hysi
cal i
nact
ivity
an
d ov
erw
eigh
t or o
besi
ty. T
he th
ree
sub-
popu
latio
ns w
ith th
e la
rges
t ch
arge
s as
soci
ated
with
phy
sica
l in
activ
ity, o
verw
eigh
t and
obe
sity
w
ere:
1) m
en a
ged
50–6
4 w
ithou
t chr
onic
di
seas
e (U
S$ 4
4.7
mill
ion)
2) m
en a
ged
65 a
nd o
lder
with
ch
roni
c di
seas
e (U
S$ 4
3.7
mill
ion)
3) m
en a
ged
40–4
9 w
ith n
o ch
roni
c di
seas
e (U
S$ 4
1.7
mill
ion)
.At
the
natio
nal l
evel
, the
per
cent
age
of n
atio
nal h
ealth
car
e ch
arge
s as
soci
ated
with
phy
sica
l ina
ctiv
ity,
over
wei
ght a
nd o
besi
ty w
as
estim
ated
to b
e 27
%.

Appendix 1 63
Auth
or/s
Stud
y ob
jectiv
eCo
untry
Prin
cipal
ap
proa
chM
etho
dolo
gyDa
taTy
pe o
f co
sts
Base
-yea
rPr
incip
al fi
ndin
gs
PHYSICAL ACTIVITYAnde
rson
et
al. (
2005
)To
est
imat
e th
e pr
opor
tion
of to
tal h
ealth
ca
re c
harg
es
asso
ciat
ed
with
phy
sica
l in
activ
ity,
over
wei
ght a
nd
obes
ity a
mon
g po
pula
tions
ag
ed 4
0 an
d ol
der.
The
Unite
d St
ates
Base
d on
co
mm
erci
al
heal
th in
sura
nce
cost
s.
A pr
edic
tive
mod
el o
f hea
lth c
are
char
ges
was
dev
elop
ed th
roug
h pr
elim
inar
y an
alys
is
of d
ata
from
8 0
00 h
ealth
pla
n m
embe
rs. F
ive
varia
bles
wer
e as
sess
ed in
ass
ocia
tion
with
he
alth
car
e ch
arge
s: p
hysi
cal a
ctiv
ity, B
MI,
chro
nic
dise
ase
stat
us (i
.e. w
ith d
iabe
tes
and/
or h
yper
tens
ion
or n
one)
and
sm
okin
g st
atus
. Co
unte
rfact
ual h
ealth
car
e ch
arge
s w
ere
also
es
timat
ed b
y re
clas
sify
ing
all i
ndiv
idua
ls a
s no
rmal
wei
ght a
nd p
hysi
cally
act
ive,
leav
ing
othe
r cha
ract
eris
tics
unch
ange
d. M
odel
cel
ls
for h
ypot
hetic
al 2
00 0
00 h
ealth
pla
n m
embe
rs
wer
e th
en d
evel
oped
and
defi
ned
by s
tatu
s of
BM
I, ph
ysic
al a
ctiv
ity a
nd o
ther
co-
varia
tes.
To
tal h
ealth
car
e ch
arge
s w
ere
estim
ated
by
mul
tiply
ing
the
perc
enta
ge o
f the
hea
lth p
lan
popu
latio
n in
eac
h ce
ll w
ith th
e pr
edic
ted
char
ges
per c
ell a
nd s
umm
ing
all c
ells
. Co
unte
rfact
ual e
stim
ates
wer
e co
mpu
ted
by
usin
g co
unte
rfact
ual c
harg
es. T
he d
iffer
ence
be
twee
n cu
rren
t ris
k pr
ofile
tota
l cha
rges
and
co
unte
rfact
ual t
otal
cha
rges
wer
e co
mpu
ted
as c
harg
es a
ssoc
iate
d w
ith p
hysi
cal i
nact
ivity
, ov
erw
eigh
t and
obe
sity
. The
sam
e ca
lcul
atio
n w
as p
erfo
rmed
but
usi
ng n
atio
nal p
opul
atio
n pe
rcen
tage
s to
iden
tify
natio
nal c
ost e
stim
ates
.
BMI,
phys
ical
act
ivity
an
d ot
her v
aria
ble
data
: He
alth
Partn
ers
Min
neso
ta
heal
th p
lan
surv
ey (1
995)
Heal
th c
are
char
ges:
co
mm
erci
al h
ealth
in
sura
nce
Natio
nal p
opul
atio
n pe
rcen
tage
s: N
atio
nal
Heal
th In
terv
iew
Sur
vey
(200
1)
Dire
ct
heal
th
care
cos
ts
(USD
)
1996
–199
9Fo
r a h
ealth
pla
n w
ith 2
00 0
00 w
hite
m
embe
rs a
ged
40 a
nd a
bove
, tot
al
annu
alis
ed h
ealth
car
e ch
arge
s of
US
$ 1.
12 b
illio
n w
as e
stim
ated
, 23
% o
f whi
ch (U
S$ 2
36 m
illio
n) w
as
asso
ciat
ed w
ith p
hysi
cal i
nact
ivity
an
d ov
erw
eigh
t or o
besi
ty. T
he th
ree
sub-
popu
latio
ns w
ith th
e la
rges
t ch
arge
s as
soci
ated
with
phy
sica
l in
activ
ity, o
verw
eigh
t and
obe
sity
w
ere:
1) m
en a
ged
50–6
4 w
ithou
t chr
onic
di
seas
e (U
S$ 4
4.7
mill
ion)
2) m
en a
ged
65 a
nd o
lder
with
ch
roni
c di
seas
e (U
S$ 4
3.7
mill
ion)
3) m
en a
ged
40–4
9 w
ith n
o ch
roni
c di
seas
e (U
S$ 4
1.7
mill
ion)
.At
the
natio
nal l
evel
, the
per
cent
age
of n
atio
nal h
ealth
car
e ch
arge
s as
soci
ated
with
phy
sica
l ina
ctiv
ity,
over
wei
ght a
nd o
besi
ty w
as
estim
ated
to b
e 27
%.
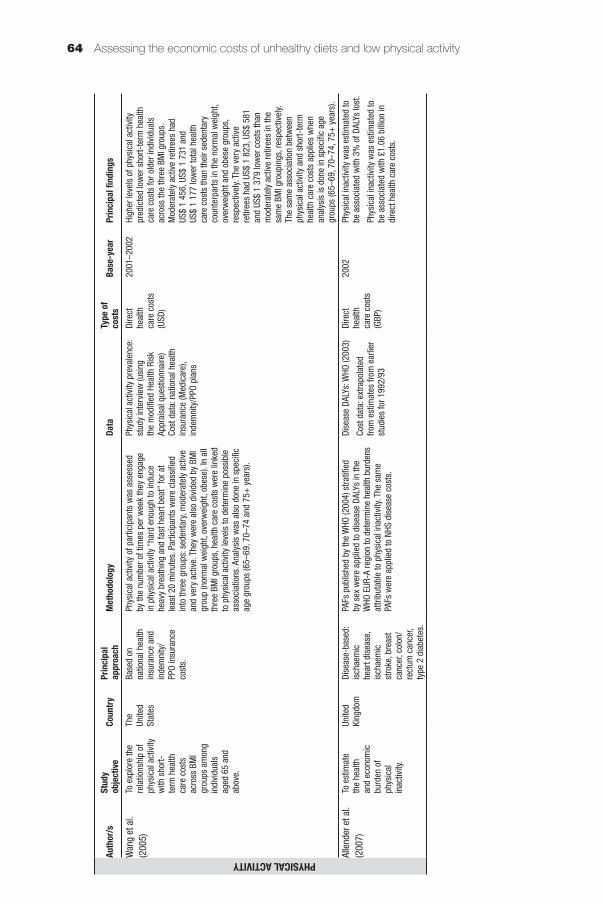
Assessing the economic costs of unhealthy diets and low physical activity64
Auth
or/s
Stud
y ob
jectiv
eCo
untry
Prin
cipal
ap
proa
chM
etho
dolo
gyDa
taTy
pe o
f co
sts
Base
-yea
rPr
incip
al fi
ndin
gs
PHYSICAL ACTIVITYWan
g et
al.
(200
5)To
exp
lore
the
rela
tions
hip
of
phys
ical
act
ivity
w
ith s
hort-
term
hea
lth
care
cos
ts
acro
ss B
MI
grou
ps a
mon
g in
divi
dual
s ag
ed 6
5 an
d ab
ove.
The
Unite
d St
ates
Base
d on
na
tiona
l hea
lth
insu
ranc
e an
d in
dem
nity
/PP
O in
sura
nce
cost
s.
Phys
ical
act
ivity
of p
artic
ipan
ts w
as a
sses
sed
by th
e nu
mbe
r of t
imes
per
wee
k th
ey e
ngag
e in
phy
sica
l act
ivity
“ha
rd e
noug
h to
indu
ce
heav
y br
eath
ing
and
fast
hea
rt be
at”
for a
t le
ast 2
0 m
inut
es. P
artic
ipan
ts w
ere
clas
sifie
d in
to th
ree
grou
ps: s
eden
tary
, mod
erat
ely
activ
e an
d ve
ry a
ctiv
e. T
hey
wer
e al
so d
ivid
ed b
y BM
I gr
oup
(nor
mal
wei
ght,
over
wei
ght,
obes
e). I
n al
l th
ree
BMI g
roup
s, h
ealth
car
e co
sts
wer
e lin
ked
to p
hysi
cal a
ctiv
ity le
vels
to d
eter
min
e po
ssib
le
asso
ciat
ions
. Ana
lysi
s w
as a
lso
done
in s
peci
fic
age
grou
ps (6
5–69
, 70–
74 a
nd 7
5+ y
ears
).
Phys
ical
act
ivity
pre
vale
nce:
st
udy
inte
rvie
w (u
sing
th
e m
odifi
ed H
ealth
Ris
k Ap
prai
sal q
uest
ionn
aire
)Co
st d
ata:
nat
iona
l hea
lth
insu
ranc
e (M
edic
are)
, in
dem
nity
/PPO
pla
ns
Dire
ct
heal
th
care
cos
ts
(USD
)
2001
–200
2Hi
gher
leve
ls o
f phy
sica
l act
ivity
pr
edic
ted
low
er s
hort-
term
hea
lth
care
cos
ts fo
r old
er in
divi
dual
s ac
ross
the
thre
e BM
I gro
ups.
M
oder
atel
y ac
tive
retir
ees
had
US$
1 45
6, U
S$ 1
731
and
US
$ 1
177
low
er to
tal h
ealth
ca
re c
osts
than
thei
r sed
enta
ry
coun
terp
arts
in th
e no
rmal
wei
ght,
over
wei
ght a
nd o
bese
gro
ups,
re
spec
tivel
y. Th
e ve
ry a
ctiv
e re
tiree
s ha
d US
$ 1
823,
US$
581
an
d US
$ 1
379
low
er c
osts
than
m
oder
atel
y ac
tive
retir
ees
in th
e sa
me
BMI g
roup
ings
, res
pect
ivel
y. Th
e sa
me
asso
ciat
ion
betw
een
phys
ical
act
ivity
and
sho
rt-te
rm
heal
th c
are
cost
s ap
plie
s w
hen
anal
ysis
is d
one
in s
peci
fic a
ge
grou
ps (6
5–69
, 70–
74, 7
5+ y
ears
).
Alle
nder
et a
l. (2
007)
To e
stim
ate
the
heal
th
and
econ
omic
bu
rden
of
phys
ical
in
activ
ity.
Unite
d Ki
ngdo
mDi
seas
e-ba
sed:
is
chae
mic
he
art d
isea
se,
isch
aem
ic
stro
ke, b
reas
t ca
ncer
, col
on/
rect
um c
ance
r, ty
pe 2
dia
bete
s.
PAFs
pub
lishe
d by
the
WHO
(200
4) s
tratifi
ed
by s
ex w
ere
appl
ied
to d
isea
se D
ALYs
in th
e W
HO E
UR-A
regi
on to
det
erm
ine
heal
th b
urde
ns
attri
buta
ble
to p
hysi
cal i
nact
ivity
. The
sam
e PA
Fs w
ere
appl
ied
to N
HS d
isea
se c
osts
.
Dise
ase
DALY
s: W
HO (2
003)
Cost
dat
a: e
xtra
pola
ted
from
est
imat
es fr
om e
arlie
r st
udie
s fo
r 199
2/93
Dire
ct
heal
th
care
cos
ts
(GBP
)
2002
Phys
ical
inac
tivity
was
est
imat
ed to
be
ass
ocia
ted
with
3%
of D
ALYs
lost
.
Phys
ical
inac
tivity
was
est
imat
ed to
be
ass
ocia
ted
with
£1.
06 b
illio
n in
di
rect
hea
lth c
are
cost
s.
Auth
or/s
Stud
y ob
jectiv
eCo
untry
Prin
cipal
ap
proa
chM
etho
dolo
gyDa
taTy
pe o
f co
sts
Base
-yea
rPr
incip
al fi
ndin
gs
PHYSICAL ACTIVITYKatz
mar
zyk
(201
1)To
est
imat
e th
e ec
onom
ic
burd
en o
f ph
ysic
al
inac
tivity
.
Cana
daDi
seas
e-ba
sed:
co
rona
ry h
eart
dise
ase,
stro
ke,
hype
rtens
ion,
co
lon
canc
er,
brea
st c
ance
r, ty
pe 2
dia
bete
s,
oste
opor
osis
.
PAFs
wer
e ca
lcul
ated
bas
ed o
n su
mm
ary
RRs
deriv
ed in
a p
revi
ous
met
a-an
alys
is o
f pr
ospe
ctiv
e lo
ngitu
dina
l stu
dies
. The
PAF
s w
ere
appl
ied
to d
isea
se h
ealth
car
e an
d pr
oduc
tivity
co
sts.
Phys
ical
act
ivity
pre
vale
nce:
Ca
nadi
an C
omm
unity
He
alth
Sur
vey
(200
9)
RRs:
ear
lier m
eta-
anal
ysis
of
stu
dies
Cost
dat
a: E
cono
mic
Bu
rden
of I
llnes
s in
Can
ada
(199
3, 1
998)
, Hea
lth
Cana
da (2
002)
, Nat
iona
l Ca
ncer
Inst
itute
of C
anad
a (2
002)
, Can
adia
n In
stitu
te
for H
ealth
Info
rmat
ion
(201
0), A
mer
ican
Hea
rt As
soci
atio
n (2
002)
, US
Cent
ers
for D
isea
se
Prev
entio
n an
d Co
ntro
l, ea
rlier
stu
dies
Dire
ct
heal
th
care
and
in
dire
ct
prod
uctiv
ity
cost
s (C
AD)
2009
Phys
ical
inac
tivity
in O
ntar
io
was
ass
ocia
ted
with
a c
ost o
f C$
3.4
bill
ion
(C$
1.02
bill
ion
in
dire
ct c
osts
and
C$
2.34
bill
ion
in
indi
rect
cos
ts).
Afte
r ext
rapo
latio
n to
the
natio
nal s
ituat
ion,
est
imat
ed
cost
s re
ach
C$ 8
.6 b
illio
n (C
$ 2.
6 bi
llion
dire
ct, C
$ 5.
95 b
illio
n in
dire
ct).
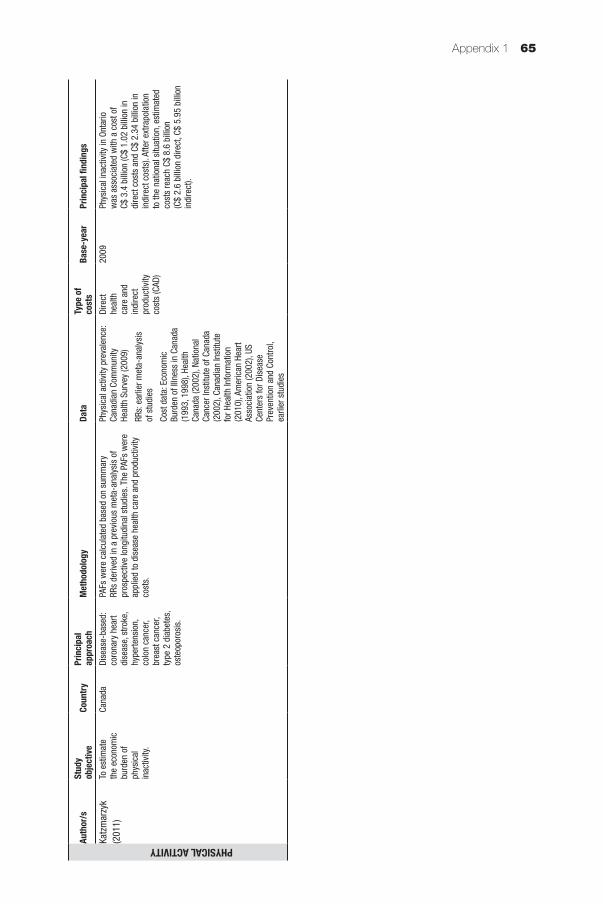
Appendix 1 65
Auth
or/s
Stud
y ob
jectiv
eCo
untry
Prin
cipal
ap
proa
chM
etho
dolo
gyDa
taTy
pe o
f co
sts
Base
-yea
rPr
incip
al fi
ndin
gs
PHYSICAL ACTIVITYKatz
mar
zyk
(201
1)To
est
imat
e th
e ec
onom
ic
burd
en o
f ph
ysic
al
inac
tivity
.
Cana
daDi
seas
e-ba
sed:
co
rona
ry h
eart
dise
ase,
stro
ke,
hype
rtens
ion,
co
lon
canc
er,
brea
st c
ance
r, ty
pe 2
dia
bete
s,
oste
opor
osis
.
PAFs
wer
e ca
lcul
ated
bas
ed o
n su
mm
ary
RRs
deriv
ed in
a p
revi
ous
met
a-an
alys
is o
f pr
ospe
ctiv
e lo
ngitu
dina
l stu
dies
. The
PAF
s w
ere
appl
ied
to d
isea
se h
ealth
car
e an
d pr
oduc
tivity
co
sts.
Phys
ical
act
ivity
pre
vale
nce:
Ca
nadi
an C
omm
unity
He
alth
Sur
vey
(200
9)
RRs:
ear
lier m
eta-
anal
ysis
of
stu
dies
Cost
dat
a: E
cono
mic
Bu
rden
of I
llnes
s in
Can
ada
(199
3, 1
998)
, Hea
lth
Cana
da (2
002)
, Nat
iona
l Ca
ncer
Inst
itute
of C
anad
a (2
002)
, Can
adia
n In
stitu
te
for H
ealth
Info
rmat
ion
(201
0), A
mer
ican
Hea
rt As
soci
atio
n (2
002)
, US
Cent
ers
for D
isea
se
Prev
entio
n an
d Co
ntro
l, ea
rlier
stu
dies
Dire
ct
heal
th
care
and
in
dire
ct
prod
uctiv
ity
cost
s (C
AD)
2009
Phys
ical
inac
tivity
in O
ntar
io
was
ass
ocia
ted
with
a c
ost o
f C$
3.4
bill
ion
(C$
1.02
bill
ion
in
dire
ct c
osts
and
C$
2.34
bill
ion
in
indi
rect
cos
ts).
Afte
r ext
rapo
latio
n to
the
natio
nal s
ituat
ion,
est
imat
ed
cost
s re
ach
C$ 8
.6 b
illio
n (C
$ 2.
6 bi
llion
dire
ct, C
$ 5.
95 b
illio
n in
dire
ct).
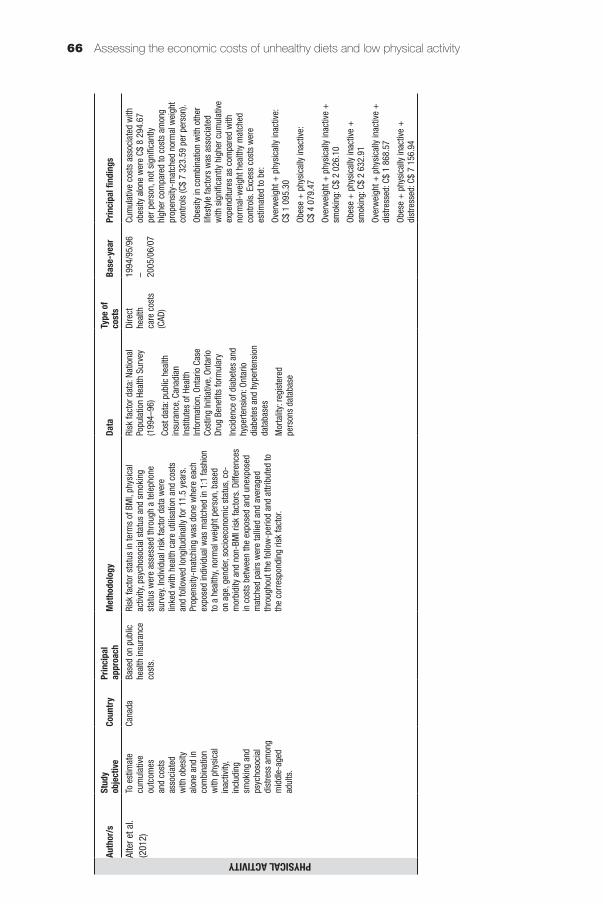
Assessing the economic costs of unhealthy diets and low physical activity66
Auth
or/s
Stud
y ob
jectiv
eCo
untry
Prin
cipal
ap
proa
chM
etho
dolo
gyDa
taTy
pe o
f co
sts
Base
-yea
rPr
incip
al fi
ndin
gs
PHYSICAL ACTIVITYAlte
r et a
l. (2
012)
To e
stim
ate
cum
ulat
ive
outc
omes
an
d co
sts
asso
ciat
ed
with
obe
sity
al
one
and
in
com
bina
tion
with
phy
sica
l in
activ
ity,
incl
udin
g sm
okin
g an
d ps
ycho
soci
al
dist
ress
am
ong
mid
dle-
aged
adul
ts.
Cana
daBa
sed
on p
ublic
he
alth
insu
ranc
e co
sts.
Risk
fact
or s
tatu
s in
term
s of
BM
I, ph
ysic
al
activ
ity, p
sych
osoc
ial s
tatu
s an
d sm
okin
g st
atus
wer
e as
sess
ed th
roug
h a
tele
phon
e su
rvey
. Ind
ivid
ual r
isk
fact
or d
ata
wer
e lin
ked
with
hea
lth c
are
utili
satio
n an
d co
sts
and
follo
wed
long
itudi
nally
for 1
1.5
year
s.
Prop
ensi
ty-m
atch
ing
was
don
e w
here
eac
h ex
pose
d in
divi
dual
was
mat
ched
in 1
:1 fa
shio
n to
a h
ealth
y, no
rmal
wei
ght p
erso
n, b
ased
on
age
, gen
der,
soci
oeco
nom
ic s
tatu
s, c
o-m
orbi
dity
and
non
-BM
I ris
k fa
ctor
s. D
iffer
ence
s in
cos
ts b
etw
een
the
expo
sed
and
unex
pose
d m
atch
ed p
airs
wer
e ta
llied
and
ave
rage
d th
roug
hout
the
follo
w-p
erio
d an
d at
tribu
ted
to
the
corr
espo
ndin
g ris
k fa
ctor
.
Risk
fact
or d
ata:
Nat
iona
l Po
pula
tion
Heal
th S
urve
y (1
994–
96)
Cost
dat
a: p
ublic
hea
lth
insu
ranc
e, C
anad
ian
Inst
itute
s of
Hea
lth
Info
rmat
ion,
Ont
ario
Cas
e Co
stin
g In
itiat
ive,
Ont
ario
Dr
ug B
enefi
ts fo
rmul
ary
Inci
denc
e of
dia
bete
s an
d hy
perte
nsio
n: O
ntar
io
diab
etes
and
hyp
erte
nsio
n da
taba
ses
Mor
talit
y: re
gist
ered
pe
rson
s da
taba
se
Dire
ct
heal
th
care
cos
ts
(CAD
)
1994
/95/
96
– 2005
/06/
07
Cum
ulat
ive
cost
s as
soci
ated
with
ob
esity
alo
ne w
ere
C$ 8
294
.67
per p
erso
n, n
ot s
igni
fican
tly
high
er c
ompa
red
to c
osts
am
ong
prop
ensi
ty-m
atch
ed n
orm
al w
eigh
t co
ntro
ls (C
$ 7
323.
59 p
er p
erso
n).
Obes
ity in
com
bina
tion
with
oth
er
lifes
tyle
fact
ors
was
ass
ocia
ted
with
sig
nific
antly
hig
her c
umul
ativ
e ex
pend
iture
s as
com
pare
d w
ith
norm
al-w
eigh
t hea
lthy
mat
ched
co
ntro
ls. E
xces
s co
sts
wer
e es
timat
ed to
be:
Over
wei
ght +
phy
sica
lly in
activ
e:
C$ 1
095
.30
Obes
e +
phy
sica
lly in
activ
e:
C$ 4
079
.47
Over
wei
ght +
phy
sica
lly in
activ
e +
sm
okin
g: C
$ 2
026.
10
Obes
e +
phy
sica
lly in
activ
e +
sm
okin
g: C
$ 2
632.
91
Over
wei
ght +
phy
sica
lly in
activ
e +
di
stre
ssed
: C$
1 86
8.57
Obes
e +
phy
sica
lly in
activ
e +
di
stre
ssed
: C$
7 15
6.94
Auth
or/s
Stud
y ob
jectiv
eCo
untry
Prin
cipal
ap
proa
chM
etho
dolo
gyDa
taTy
pe o
f co
sts
Base
-yea
rPr
incip
al fi
ndin
gs
PHYSICAL ACTIVITYJans
sen
(201
2)To
est
imat
e th
e ec
onom
ic
burd
en o
f ph
ysic
al
inac
tivity
.
Cana
daDi
seas
e-ba
sed:
co
rona
ry a
rtery
di
seas
e, s
troke
, hy
perte
nsio
n,
colo
n ca
ncer
, fe
mal
e br
east
ca
ncer
, typ
e 2
diab
etes
, os
teop
oros
is.
PAFs
wer
e ca
lcul
ated
bas
ed o
n su
mm
ary
RRs
deriv
ed in
ear
lier m
eta-
anal
yses
of R
Rs
in p
rosp
ectiv
e co
hort
stud
ies,
stra
tified
by
sex.
PAF
s w
ere
appl
ied
to d
isea
se d
irect
and
in
dire
ct c
osts
.
Phys
ical
act
ivity
pre
vale
nce:
Ca
nadi
an H
ealth
Mea
sure
s Su
rvey
(200
7–20
09)
RRs:
ear
lier m
eta-
anal
yses
of
stu
dies
Cost
dat
a: E
cono
mic
Bu
rden
of I
llnes
s in
Can
ada
(200
0) e
xtra
pola
ted
to
2009
val
ues
Dire
ct
heal
th
care
and
in
dire
ct
prod
uctiv
ity
cost
s (C
AD)
2009
Phys
ical
inac
tivity
cos
ts C
$ 6.
8 bi
llion
(C
$ 2.
4 bi
llion
in d
irect
cos
ts a
nd
C$ 4
.3 b
illio
n in
indi
rect
cos
ts).
Dire
ct
cost
s re
pres
ent 3
.8%
of t
he o
vera
ll he
alth
car
e co
sts.
Zhan
g an
d Ch
aaba
n (2
012)
To e
stim
ate
the
econ
omic
bu
rden
of
phys
ical
in
activ
ity.
Chin
aDi
seas
e-ba
sed:
co
rona
ry h
eart
dise
ase,
stro
ke,
hype
rtens
ion,
ca
ncer
, typ
e 2
diab
etes
.
Impa
cts
of p
hysi
cal i
nact
ivity
wer
e as
sess
ed
thro
ugh
dire
ct m
echa
nism
s (in
activ
ity to
NC
Ds) a
nd in
dire
ct m
echa
nism
s (in
activ
ity
to o
verw
eigh
t/obe
sity
to N
CDs)
. PAF
s w
ere
calc
ulat
ed fo
r eac
h di
seas
e re
late
d to
phy
sica
l in
activ
ity, o
verw
eigh
t and
obe
sity
, bas
ed o
n RR
s fro
m e
arlie
r met
a-an
alys
es o
f pro
spec
tive
stud
ies
and
sing
le c
ohor
t stu
dies
. PAF
s re
late
d to
ove
rwei
ght a
nd o
besi
ty w
ere
mul
tiplie
d by
12
% (i
.e. t
he p
ropo
rtion
of o
verw
eigh
t and
ob
esity
attr
ibut
able
to p
hysi
cal i
nact
ivity
). Al
l th
ree
sets
of P
AFs
wer
e su
mm
ed a
nd th
e to
tals
ap
plie
d to
dis
ease
dire
ct a
nd in
dire
ct c
osts
.
Phys
ical
act
ivity
, ov
erw
eigh
t, ob
esity
pr
eval
ence
: Chi
nese
Be
havi
oura
l Ris
k Fa
ctor
s Su
rvei
llanc
e Su
rvey
(200
7)
RRs:
Ear
lier m
eta-
anal
yses
an
d si
ngle
coh
ort s
tudi
es
Cost
dat
a: N
atio
nal H
ealth
Se
rvic
e Su
rvey
(200
3)
extra
pola
ted
to 2
007
Dire
ct
heal
th
care
and
in
dire
ct
prod
uctiv
ity
cost
s (U
SD)
2007
Econ
omic
cos
ts a
ssoc
iate
d w
ith p
hysi
cal i
nact
ivity
wer
e US
$ 6.
7 bi
llion
(US$
3.5
bill
ion
for
dire
ct c
osts
and
US$
3.3
bill
ion
for
indi
rect
cos
ts).
This
was
equ
ival
ent
to 1
5.2%
of t
he to
tal c
osts
of t
he
five
dise
ases
, 5.3
% o
f tot
al N
CD
cost
s an
d 3.
8% o
f tot
al c
osts
for a
ll di
seas
es.
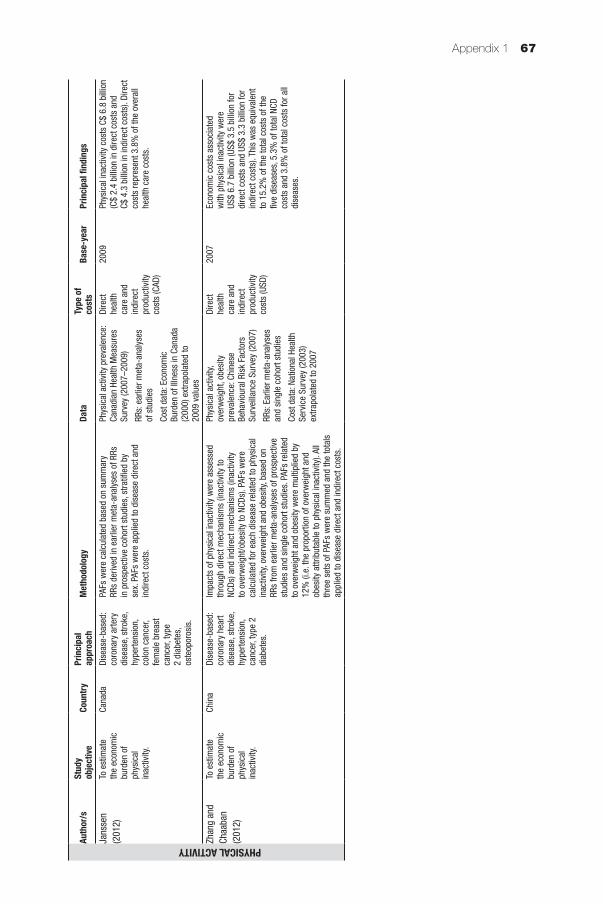
Appendix 1 67
Auth
or/s
Stud
y ob
jectiv
eCo
untry
Prin
cipal
ap
proa
chM
etho
dolo
gyDa
taTy
pe o
f co
sts
Base
-yea
rPr
incip
al fi
ndin
gs
PHYSICAL ACTIVITYJans
sen
(201
2)To
est
imat
e th
e ec
onom
ic
burd
en o
f ph
ysic
al
inac
tivity
.
Cana
daDi
seas
e-ba
sed:
co
rona
ry a
rtery
di
seas
e, s
troke
, hy
perte
nsio
n,
colo
n ca
ncer
, fe
mal
e br
east
ca
ncer
, typ
e 2
diab
etes
, os
teop
oros
is.
PAFs
wer
e ca
lcul
ated
bas
ed o
n su
mm
ary
RRs
deriv
ed in
ear
lier m
eta-
anal
yses
of R
Rs
in p
rosp
ectiv
e co
hort
stud
ies,
stra
tified
by
sex.
PAF
s w
ere
appl
ied
to d
isea
se d
irect
and
in
dire
ct c
osts
.
Phys
ical
act
ivity
pre
vale
nce:
Ca
nadi
an H
ealth
Mea
sure
s Su
rvey
(200
7–20
09)
RRs:
ear
lier m
eta-
anal
yses
of
stu
dies
Cost
dat
a: E
cono
mic
Bu
rden
of I
llnes
s in
Can
ada
(200
0) e
xtra
pola
ted
to
2009
val
ues
Dire
ct
heal
th
care
and
in
dire
ct
prod
uctiv
ity
cost
s (C
AD)
2009
Phys
ical
inac
tivity
cos
ts C
$ 6.
8 bi
llion
(C
$ 2.
4 bi
llion
in d
irect
cos
ts a
nd
C$ 4
.3 b
illio
n in
indi
rect
cos
ts).
Dire
ct
cost
s re
pres
ent 3
.8%
of t
he o
vera
ll he
alth
car
e co
sts.
Zhan
g an
d Ch
aaba
n (2
012)
To e
stim
ate
the
econ
omic
bu
rden
of
phys
ical
in
activ
ity.
Chin
aDi
seas
e-ba
sed:
co
rona
ry h
eart
dise
ase,
stro
ke,
hype
rtens
ion,
ca
ncer
, typ
e 2
diab
etes
.
Impa
cts
of p
hysi
cal i
nact
ivity
wer
e as
sess
ed
thro
ugh
dire
ct m
echa
nism
s (in
activ
ity to
NC
Ds) a
nd in
dire
ct m
echa
nism
s (in
activ
ity
to o
verw
eigh
t/obe
sity
to N
CDs)
. PAF
s w
ere
calc
ulat
ed fo
r eac
h di
seas
e re
late
d to
phy
sica
l in
activ
ity, o
verw
eigh
t and
obe
sity
, bas
ed o
n RR
s fro
m e
arlie
r met
a-an
alys
es o
f pro
spec
tive
stud
ies
and
sing
le c
ohor
t stu
dies
. PAF
s re
late
d to
ove
rwei
ght a
nd o
besi
ty w
ere
mul
tiplie
d by
12
% (i
.e. t
he p
ropo
rtion
of o
verw
eigh
t and
ob
esity
attr
ibut
able
to p
hysi
cal i
nact
ivity
). Al
l th
ree
sets
of P
AFs
wer
e su
mm
ed a
nd th
e to
tals
ap
plie
d to
dis
ease
dire
ct a
nd in
dire
ct c
osts
.
Phys
ical
act
ivity
, ov
erw
eigh
t, ob
esity
pr
eval
ence
: Chi
nese
Be
havi
oura
l Ris
k Fa
ctor
s Su
rvei
llanc
e Su
rvey
(200
7)
RRs:
Ear
lier m
eta-
anal
yses
an
d si
ngle
coh
ort s
tudi
es
Cost
dat
a: N
atio
nal H
ealth
Se
rvic
e Su
rvey
(200
3)
extra
pola
ted
to 2
007
Dire
ct
heal
th
care
and
in
dire
ct
prod
uctiv
ity
cost
s (U
SD)
2007
Econ
omic
cos
ts a
ssoc
iate
d w
ith p
hysi
cal i
nact
ivity
wer
e US
$ 6.
7 bi
llion
(US$
3.5
bill
ion
for
dire
ct c
osts
and
US$
3.3
bill
ion
for
indi
rect
cos
ts).
This
was
equ
ival
ent
to 1
5.2%
of t
he to
tal c
osts
of t
he
five
dise
ases
, 5.3
% o
f tot
al N
CD
cost
s an
d 3.
8% o
f tot
al c
osts
for a
ll di
seas
es.
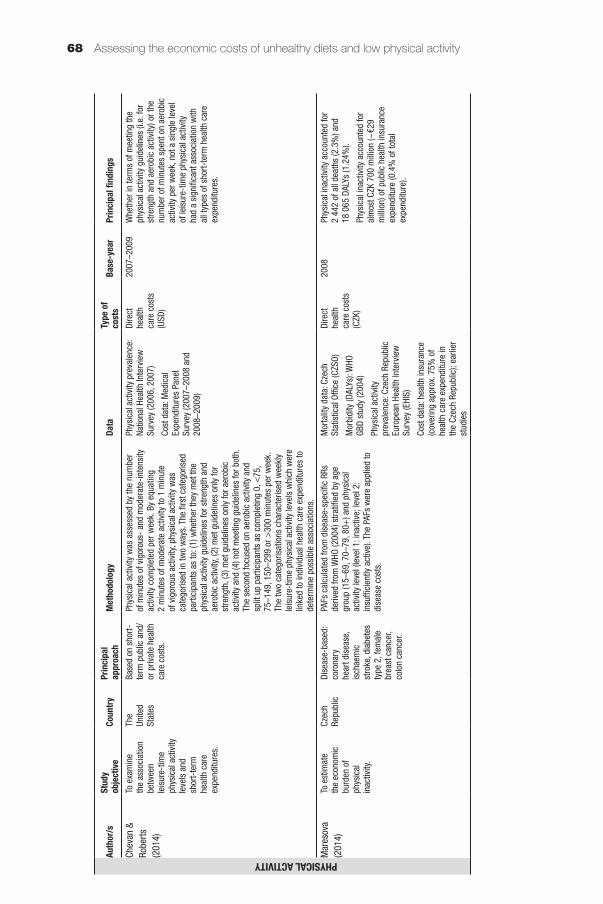
Assessing the economic costs of unhealthy diets and low physical activity68
Auth
or/s
Stud
y ob
jectiv
eCo
untry
Prin
cipal
ap
proa
chM
etho
dolo
gyDa
taTy
pe o
f co
sts
Base
-yea
rPr
incip
al fi
ndin
gs
PHYSICAL ACTIVITYChev
an &
Ro
berts
(2
014)
To e
xam
ine
the
asso
ciat
ion
betw
een
leis
ure-
time
phys
ical
act
ivity
le
vels
and
sh
ort-
term
he
alth
car
e ex
pend
iture
s.
The
Unite
d St
ates
Base
d on
sho
rt-te
rm p
ublic
and
/or
priv
ate
heal
th
care
cos
ts.
Phys
ical
act
ivity
was
ass
esse
d by
the
num
ber
of m
inut
es o
f vig
orou
s- a
nd m
oder
ate-
inte
nsity
ac
tivity
com
plet
ed p
er w
eek.
By
equa
ting
2 m
inut
es o
f mod
erat
e ac
tivity
to 1
min
ute
of v
igor
ous
activ
ity, p
hysi
cal a
ctiv
ity w
as
cate
goris
ed in
two
way
s. T
he fi
rst c
ateg
oris
ed
parti
cipa
nts
as to
: (1)
whe
ther
they
met
the
phys
ical
act
ivity
gui
delin
es fo
r stre
ngth
and
ae
robi
c ac
tivity
, (2)
met
gui
delin
es o
nly
for
stre
ngth
, (3)
met
gui
delin
es o
nly
for a
erob
ic
activ
ity a
nd (4
) not
mee
ting
guid
elin
es fo
r bot
h.
The
seco
nd fo
cuse
d on
aer
obic
act
ivity
and
sp
lit u
p pa
rtici
pant
s as
com
plet
ing
0, <
75,
75–1
49, 1
50–2
99 o
r >30
0 m
inut
es p
er w
eek.
Th
e tw
o ca
tego
risat
ions
cha
ract
eris
ed w
eekl
y le
isur
e-tim
e ph
ysic
al a
ctiv
ity le
vels
whi
ch w
ere
linke
d to
indi
vidu
al h
ealth
car
e ex
pend
iture
s to
de
term
ine
poss
ible
ass
ocia
tions
.
Phys
ical
act
ivity
pre
vale
nce:
Na
tiona
l Hea
lth In
terv
iew
Su
rvey
(200
6, 2
007)
Cost
dat
a: M
edic
al
Expe
nditu
res
Pane
l Su
rvey
(200
7–20
08 a
nd
2008
–200
9)
Dire
ct
heal
th
care
cos
ts
(USD
)
2007
–200
9W
heth
er in
term
s of
mee
ting
the
phys
ical
act
ivity
gui
delin
es (i
.e. f
or
stre
ngth
and
aer
obic
act
ivity
) or t
he
num
ber o
f min
utes
spe
nt o
n ae
robi
c ac
tivity
per
wee
k, n
ot a
sin
gle
leve
l of
leis
ure-
time
phys
ical
act
ivity
ha
d a
sign
ifica
nt a
ssoc
iatio
n w
ith
all t
ypes
of s
hort-
term
hea
lth c
are
expe
nditu
res.
Mar
esov
a (2
014)
To e
stim
ate
the
econ
omic
bu
rden
of
phys
ical
in
activ
ity.
Czec
h Re
publ
icDi
seas
e-ba
sed:
co
rona
ry
hear
t dis
ease
, is
chae
mic
st
roke
, dia
bete
s ty
pe 2
, fem
ale
brea
st c
ance
r, co
lon
canc
er.
PAFs
cal
cula
ted
from
dis
ease
-spe
cific
RRs
de
rived
from
WHO
(200
4) s
tratifi
ed b
y ag
e gr
oup
(15–
69, 7
0–79
, 80+
) and
phy
sica
l ac
tivity
leve
l (le
vel 1
: ina
ctiv
e; le
vel 2
: in
suffi
cien
tly a
ctiv
e). T
he P
AFs
wer
e ap
plie
d to
di
seas
e co
sts.
Mor
talit
y da
ta: C
zech
St
atis
tical
Offi
ce (C
ZSO)
Mor
bidi
ty (D
ALYs
): W
HO
GBD
stud
y (2
004)
Phys
ical
act
ivity
pr
eval
ence
: Cze
ch R
epub
lic
Euro
pean
Hea
lth In
terv
iew
Su
rvey
(EHI
S)
Cost
dat
a: h
ealth
insu
ranc
e (c
over
ing
appr
ox. 7
5% o
f he
alth
car
e ex
pend
iture
in
the
Czec
h Re
publ
ic);
earli
er
stud
ies
Dire
ct
heal
th
care
cos
ts
(CZK
)
2008
Phys
ical
inac
tivity
acc
ount
ed fo
r 2
442
of a
ll de
aths
(2.3
%) a
nd
18 0
65 D
ALYs
(1.2
4%).
Phys
ical
inac
tivity
acc
ount
ed fo
r al
mos
t CZK
700
mill
ion
(~€2
9 m
illio
n) o
f pub
lic h
ealth
insu
ranc
e ex
pend
iture
(0.4
% o
f tot
al
expe
nditu
re).
Auth
or/s
Stud
y ob
jectiv
eCo
untry
Prin
cipal
ap
proa
chM
etho
dolo
gyDa
taTy
pe o
f co
sts
Base
-yea
rPr
incip
al fi
ndin
gs
PHYSICAL ACTIVITYPeet
ers
et a
l. (2
014)
To e
stim
ate
the
cost
s as
soci
ated
w
ith p
rolo
nged
si
tting
and
ph
ysic
al
inac
tivity
am
ong
mid
dle-
aged
wom
en.
Aust
ralia
Base
d on
na
tiona
l hea
lth
insu
ranc
e co
sts.
Parti
cipa
nts
wer
e su
rvey
ed in
term
s of
tim
e sp
ent s
ittin
g, w
alki
ng a
nd in
mod
erat
e an
d vi
goro
us le
isur
e-tim
e ac
tiviti
es. S
ittin
g tim
e w
as c
ateg
oris
ed a
s lo
w, m
oder
ate
and
high
. Ph
ysic
al a
ctiv
ity w
as c
ateg
oris
ed a
s in
activ
e,
low
, mod
erat
e an
d hi
gh. C
ombi
ned
sitti
ng
time
and
phys
ical
act
ivity
or “
activ
ity p
atte
rns”
w
ere
cate
goris
ed in
to a
ctiv
e +
low
sitt
ing
time,
ac
tive
+ h
igh
sitti
ng ti
me,
inac
tive
+ lo
w s
ittin
g tim
e an
d in
activ
e +
hig
h si
tting
tim
e. M
edic
are
cost
s av
erag
ed o
ver t
he s
urve
y ye
ar ±
1 ye
ar
wer
e us
ed to
cal
cula
te th
e an
nual
cos
ts.
Annu
al m
edia
n co
sts
wer
e lin
ked
to s
ittin
g tim
e, p
hysi
cal a
ctiv
ity a
nd a
ctiv
ity p
atte
rns
and
exam
ined
acr
oss
grou
ps to
det
erm
ine
poss
ible
ass
ocia
tions
. Ana
lysi
s w
as a
lso
done
by
BM
I stra
ta to
exa
min
e fo
r pot
entia
l effe
ct
mod
ifica
tions
of B
MI.
Sitti
ng ti
me
and
phys
ical
ac
tivity
: Aus
tralia
n Lo
ngitu
dina
l Stu
dy o
n W
omen
’s H
ealth
(200
1,
2005
, 200
7, 2
010)
Cost
dat
a: N
atio
nal h
ealth
in
sura
nce
Dire
ct
heal
th
care
cos
ts
(AUD
)
2010
The
annu
al m
edia
n co
sts
for
high
ly a
ctiv
e vs
inac
tive
indi
vidu
als
wer
e AU
$ 68
9 vs
AU$
741
, with
a
sign
ifica
nt d
iffer
ence
of A
U$ 9
4. In
te
rms
of s
ittin
g tim
e, a
nnua
l med
ian
cost
s fo
r peo
ple
with
low
sitt
ing
time
vs h
igh
sitti
ng ti
me
wer
e AU
$ 67
1 vs
AU$
709
, with
a d
iffer
ence
of
AU$
16. N
o st
atis
tical
ly s
igni
fican
t as
soci
atio
ns w
ere
foun
d be
twee
n si
tting
tim
e an
d co
sts.
A h
igh
sitti
ng
time
did
not a
dd to
inac
tivity
-as
soci
ated
cos
ts (A
U$ 1
10 h
ighe
r fo
r ina
ctiv
e pe
ople
with
hig
h si
tting
tim
e vs
act
ive
peop
le w
ith lo
w s
ittin
g tim
e). A
lthou
gh c
osts
are
hig
her
for o
verw
eigh
t and
obe
se g
roup
s co
mpa
red
to n
orm
al w
eigh
t, th
e ef
fect
s of
phy
sica
l act
ivity
on
cost
s w
ere
sim
ilar a
cros
s BM
I ran
ges,
su
gges
ting
no B
MI i
nter
actio
n ef
fect
s.
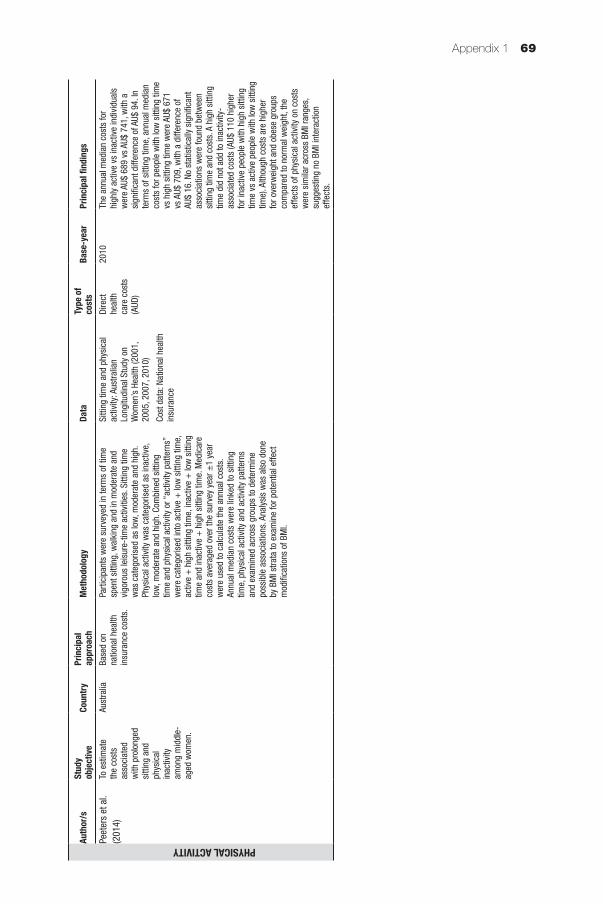
Appendix 1 69
Auth
or/s
Stud
y ob
jectiv
eCo
untry
Prin
cipal
ap
proa
chM
etho
dolo
gyDa
taTy
pe o
f co
sts
Base
-yea
rPr
incip
al fi
ndin
gs
PHYSICAL ACTIVITYPeet
ers
et a
l. (2
014)
To e
stim
ate
the
cost
s as
soci
ated
w
ith p
rolo
nged
si
tting
and
ph
ysic
al
inac
tivity
am
ong
mid
dle-
aged
wom
en.
Aust
ralia
Base
d on
na
tiona
l hea
lth
insu
ranc
e co
sts.
Parti
cipa
nts
wer
e su
rvey
ed in
term
s of
tim
e sp
ent s
ittin
g, w
alki
ng a
nd in
mod
erat
e an
d vi
goro
us le
isur
e-tim
e ac
tiviti
es. S
ittin
g tim
e w
as c
ateg
oris
ed a
s lo
w, m
oder
ate
and
high
. Ph
ysic
al a
ctiv
ity w
as c
ateg
oris
ed a
s in
activ
e,
low
, mod
erat
e an
d hi
gh. C
ombi
ned
sitti
ng
time
and
phys
ical
act
ivity
or “
activ
ity p
atte
rns”
w
ere
cate
goris
ed in
to a
ctiv
e +
low
sitt
ing
time,
ac
tive
+ h
igh
sitti
ng ti
me,
inac
tive
+ lo
w s
ittin
g tim
e an
d in
activ
e +
hig
h si
tting
tim
e. M
edic
are
cost
s av
erag
ed o
ver t
he s
urve
y ye
ar ±
1 ye
ar
wer
e us
ed to
cal
cula
te th
e an
nual
cos
ts.
Annu
al m
edia
n co
sts
wer
e lin
ked
to s
ittin
g tim
e, p
hysi
cal a
ctiv
ity a
nd a
ctiv
ity p
atte
rns
and
exam
ined
acr
oss
grou
ps to
det
erm
ine
poss
ible
ass
ocia
tions
. Ana
lysi
s w
as a
lso
done
by
BM
I stra
ta to
exa
min
e fo
r pot
entia
l effe
ct
mod
ifica
tions
of B
MI.
Sitti
ng ti
me
and
phys
ical
ac
tivity
: Aus
tralia
n Lo
ngitu
dina
l Stu
dy o
n W
omen
’s H
ealth
(200
1,
2005
, 200
7, 2
010)
Cost
dat
a: N
atio
nal h
ealth
in
sura
nce
Dire
ct
heal
th
care
cos
ts
(AUD
)
2010
The
annu
al m
edia
n co
sts
for
high
ly a
ctiv
e vs
inac
tive
indi
vidu
als
wer
e AU
$ 68
9 vs
AU$
741
, with
a
sign
ifica
nt d
iffer
ence
of A
U$ 9
4. In
te
rms
of s
ittin
g tim
e, a
nnua
l med
ian
cost
s fo
r peo
ple
with
low
sitt
ing
time
vs h
igh
sitti
ng ti
me
wer
e AU
$ 67
1 vs
AU$
709
, with
a d
iffer
ence
of
AU$
16. N
o st
atis
tical
ly s
igni
fican
t as
soci
atio
ns w
ere
foun
d be
twee
n si
tting
tim
e an
d co
sts.
A h
igh
sitti
ng
time
did
not a
dd to
inac
tivity
-as
soci
ated
cos
ts (A
U$ 1
10 h
ighe
r fo
r ina
ctiv
e pe
ople
with
hig
h si
tting
tim
e vs
act
ive
peop
le w
ith lo
w s
ittin
g tim
e). A
lthou
gh c
osts
are
hig
her
for o
verw
eigh
t and
obe
se g
roup
s co
mpa
red
to n
orm
al w
eigh
t, th
e ef
fect
s of
phy
sica
l act
ivity
on
cost
s w
ere
sim
ilar a
cros
s BM
I ran
ges,
su
gges
ting
no B
MI i
nter
actio
n ef
fect
s.
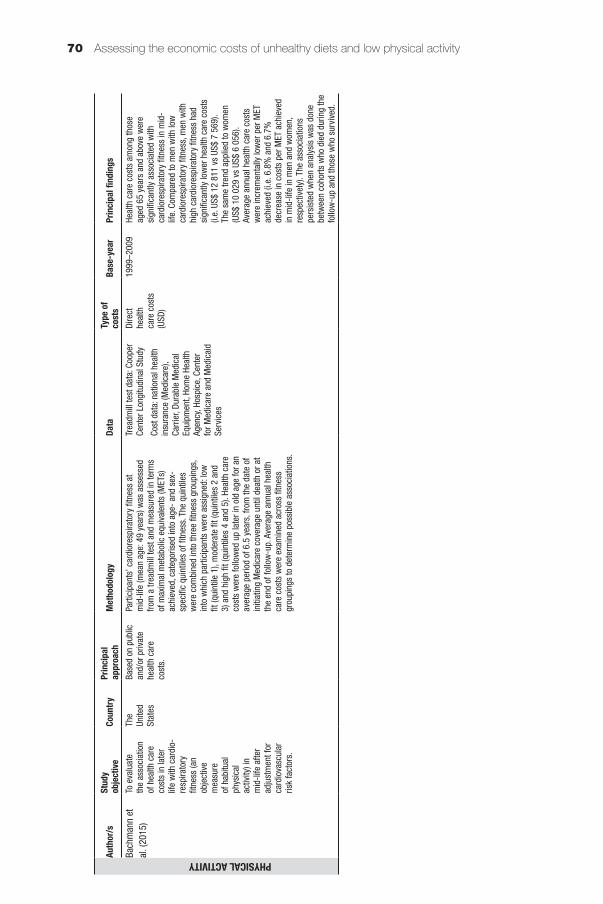
Assessing the economic costs of unhealthy diets and low physical activity70
Auth
or/s
Stud
y ob
jectiv
eCo
untry
Prin
cipal
ap
proa
chM
etho
dolo
gyDa
taTy
pe o
f co
sts
Base
-yea
rPr
incip
al fi
ndin
gs
PHYSICAL ACTIVITYBach
man
n et
al
. (20
15)
To e
valu
ate
the
asso
ciat
ion
of h
ealth
car
e co
sts
in la
ter
life
with
car
dio-
resp
irato
ry
fitne
ss (a
n ob
ject
ive
mea
sure
of
hab
itual
ph
ysic
al
activ
ity) i
n m
id-li
fe a
fter
adju
stm
ent f
or
card
iova
scul
ar
risk
fact
ors.
The
Unite
d St
ates
Base
d on
pub
lic
and/
or p
rivat
e he
alth
car
e co
sts.
Parti
cipa
nts’
car
dior
espi
rato
ry fi
tnes
s at
m
id-li
fe (m
ean
age:
49
year
s) w
as a
sses
sed
from
a tr
eadm
ill te
st a
nd m
easu
red
in te
rms
of m
axim
al m
etab
olic
equ
ival
ents
(MET
s)
achi
eved
, cat
egor
ised
into
age
- an
d se
x-sp
ecifi
c qu
intil
es o
f fitn
ess.
The
qui
ntile
s w
ere
com
bine
d in
to th
ree
fitne
ss g
roup
ings
, in
to w
hich
par
ticip
ants
wer
e as
sign
ed: l
ow
fit (q
uint
ile 1
), m
oder
ate
fit (q
uint
iles
2 an
d 3)
and
hig
h fit
(qui
ntile
s 4
and
5). H
ealth
car
e co
sts
wer
e fo
llow
ed u
p la
ter i
n ol
d ag
e fo
r an
aver
age
perio
d of
6.5
yea
rs, f
rom
the
date
of
initi
atin
g M
edic
are
cove
rage
unt
il de
ath
or a
t th
e en
d of
follo
w-u
p. A
vera
ge a
nnua
l hea
lth
care
cos
ts w
ere
exam
ined
acr
oss
fitne
ss
grou
ping
s to
det
erm
ine
poss
ible
ass
ocia
tions
.
Trea
dmill
test
dat
a: C
oope
r Ce
nter
Lon
gitu
dina
l Stu
dy
Cost
dat
a: n
atio
nal h
ealth
in
sura
nce
(Med
icar
e),
Carr
ier,
Dura
ble
Med
ical
Eq
uipm
ent,
Hom
e He
alth
Ag
ency
, Hos
pice
, Cen
ter
for M
edic
are
and
Med
icai
d Se
rvic
es
Dire
ct
heal
th
care
cos
ts
(USD
)
1999
–200
9He
alth
car
e co
sts
amon
g th
ose
aged
65
year
s an
d ab
ove
wer
e si
gnifi
cant
ly a
ssoc
iate
d w
ith
card
iore
spira
tory
fitn
ess
in m
id-
life.
Com
pare
d to
men
with
low
ca
rdio
resp
irato
ry fi
tnes
s, m
en w
ith
high
car
dior
espi
rato
ry fi
tnes
s ha
d si
gnifi
cant
ly lo
wer
hea
lth c
are
cost
s (i.
e. U
S$ 1
2 81
1 vs
US$
7 5
69).
The
sam
e tre
nd a
pplie
d to
wom
en
(US$
10
029
vs U
S$ 6
056
). Av
erag
e an
nual
hea
lth c
are
cost
s w
ere
incr
emen
tally
low
er p
er M
ET
achi
eved
(i.e
. 6.8
% a
nd 6
.7%
de
crea
se in
cos
ts p
er M
ET a
chie
ved
in m
id-li
fe in
men
and
wom
en,
resp
ectiv
ely)
. The
ass
ocia
tions
pe
rsis
ted
whe
n an
alys
is w
as d
one
betw
een
coho
rts w
ho d
ied
durin
g th
e fo
llow
-up
and
thos
e w
ho s
urvi
ved.
Auth
or/s
Stud
y ob
jectiv
eCo
untry
Prin
cipal
ap
proa
chM
etho
dolo
gyDa
taTy
pe o
f co
sts
Base
-yea
rPr
incip
al fi
ndin
gs
PHYSICAL ACTIVITYCarls
on e
t al.
(201
5)To
exa
min
e th
e as
soci
atio
n be
twee
n le
isur
e-tim
e ae
robi
c ph
ysic
al a
ctiv
ity
and
heal
th c
are
expe
nditu
res
with
and
w
ithou
t ad
just
ing
for
obes
ity s
tatu
s.
The
Unite
d St
ates
Base
d on
pub
lic
and/
or p
rivat
e he
alth
car
e co
sts.
Phys
ical
act
ivity
was
ass
esse
d th
roug
h th
e fre
quen
cy a
nd, i
f app
licab
le, t
he d
urat
ion
of le
isur
e-tim
e ac
tivity
par
ticip
ated
in fo
r at
leas
t 10
min
utes
at a
tim
e in
vig
orou
s- a
nd
light
- or
mod
erat
e-in
tens
ity a
ctiv
ities
. Min
utes
of
mod
erat
e-in
tens
ity e
quiv
alen
t act
ivity
wer
e ca
lcul
ated
by
coun
ting
1 m
inut
e of
vig
orou
s-in
tens
ity a
ctiv
ity a
s 2
min
utes
of l
ight
- or
m
oder
ate-
inte
nsity
act
ivity
. Par
ticip
ants
wer
e cl
assi
fied
into
thre
e ac
tivity
leve
ls: 1
) act
ive,
2)
insu
ffici
ently
act
ive
and
3) in
activ
e. P
hysi
cal
activ
ity le
vels
wer
e lin
ked
to in
divi
dual
hea
lth
care
cos
ts to
det
erm
ine
mea
n an
d pe
r cen
t di
ffere
nces
in e
xpen
ditu
res.
The
sum
of
the
diffe
renc
es in
cos
ts w
as d
ivid
ed b
y th
e to
tal p
redi
cted
exp
endi
ture
s fo
r all
grou
ps to
de
term
ine
the
perc
enta
ge o
f agg
rega
te c
osts
as
soci
ated
with
inad
equa
te le
vels
of p
hysi
cal
activ
ity. T
wo
mod
els
wer
e us
ed: w
ith a
nd
with
out a
djus
tmen
t for
BM
I.
Phys
ical
act
ivity
pre
vale
nce:
Na
tiona
l Hea
lth In
terv
iew
Su
rvey
(200
4–20
10)
Cost
dat
a: M
edic
al
Expe
nditu
re P
anel
Sur
vey
(200
6–20
11)
Dire
ct
heal
th
care
cos
ts
(USD
)
2006
–201
1Hi
gher
leve
ls o
f lei
sure
-tim
e ae
robi
c ph
ysic
al a
ctiv
ity w
ere
sign
ifica
ntly
as
soci
ated
with
low
er h
ealth
car
e co
sts.
The
re w
as a
mea
n di
ffere
nce
of 2
9.9%
in a
nnua
l per
cap
ita
cost
s be
twee
n ac
tive
and
inac
tive
grou
ps, a
s in
activ
e in
divi
dual
s pa
id
an a
dditi
onal
cos
t of U
S$ 1
437
. In
suffi
cien
tly a
ctiv
e in
divi
dual
s pa
id a
n ad
ditio
nal c
ost o
f US$
713
co
mpa
red
to a
ctiv
e in
divi
dual
s (m
ean
diffe
renc
e: 1
5.4%
). Af
ter
adju
stin
g fo
r BM
I, th
e m
eans
of
annu
al e
xpen
ditu
re a
nd p
er c
ent
diffe
renc
es d
ecre
ased
but
rem
aine
d si
gnifi
cant
(26.
6% o
r US$
1 3
13
betw
een
activ
e an
d in
activ
e gr
oups
an
d 12
.1%
or U
S$ 5
76 b
etw
een
insu
ffici
ently
act
ive
and
inac
tive
grou
ps).
Befo
re a
djus
tmen
t for
BM
I, th
e pe
rcen
tage
of a
ggre
gate
he
alth
car
e ex
pend
iture
s as
soci
ated
w
ith in
adeq
uate
leve
ls o
f phy
sica
l ac
tivity
was
12.
5% (U
S$ 1
31 b
illio
n)
and
rem
aine
d si
gnifi
cant
at 1
1.1%
(U
S$ 1
17 b
illio
n) a
fter a
djus
ting
for
BMI.
Whe
n ad
ults
with
any
repo
rted
diffi
culty
wal
king
due
to a
hea
lth
prob
lem
wer
e ex
clud
ed fr
om th
e an
alys
is, t
he p
erce
ntag
e w
as 8
.7%
(U
S$ 7
9 bi
llion
).
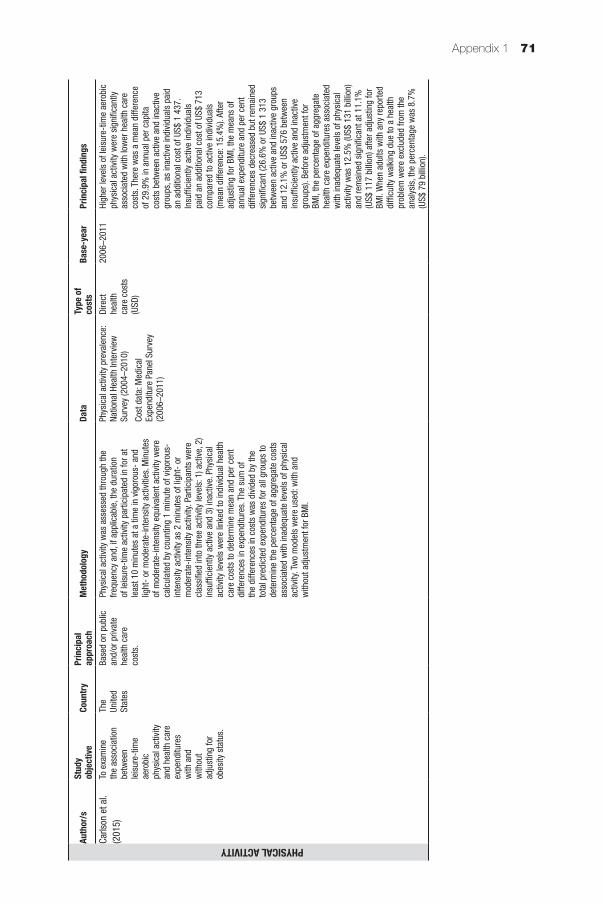
Appendix 1 71
Auth
or/s
Stud
y ob
jectiv
eCo
untry
Prin
cipal
ap
proa
chM
etho
dolo
gyDa
taTy
pe o
f co
sts
Base
-yea
rPr
incip
al fi
ndin
gs
PHYSICAL ACTIVITYCarls
on e
t al.
(201
5)To
exa
min
e th
e as
soci
atio
n be
twee
n le
isur
e-tim
e ae
robi
c ph
ysic
al a
ctiv
ity
and
heal
th c
are
expe
nditu
res
with
and
w
ithou
t ad
just
ing
for
obes
ity s
tatu
s.
The
Unite
d St
ates
Base
d on
pub
lic
and/
or p
rivat
e he
alth
car
e co
sts.
Phys
ical
act
ivity
was
ass
esse
d th
roug
h th
e fre
quen
cy a
nd, i
f app
licab
le, t
he d
urat
ion
of le
isur
e-tim
e ac
tivity
par
ticip
ated
in fo
r at
leas
t 10
min
utes
at a
tim
e in
vig
orou
s- a
nd
light
- or
mod
erat
e-in
tens
ity a
ctiv
ities
. Min
utes
of
mod
erat
e-in
tens
ity e
quiv
alen
t act
ivity
wer
e ca
lcul
ated
by
coun
ting
1 m
inut
e of
vig
orou
s-in
tens
ity a
ctiv
ity a
s 2
min
utes
of l
ight
- or
m
oder
ate-
inte
nsity
act
ivity
. Par
ticip
ants
wer
e cl
assi
fied
into
thre
e ac
tivity
leve
ls: 1
) act
ive,
2)
insu
ffici
ently
act
ive
and
3) in
activ
e. P
hysi
cal
activ
ity le
vels
wer
e lin
ked
to in
divi
dual
hea
lth
care
cos
ts to
det
erm
ine
mea
n an
d pe
r cen
t di
ffere
nces
in e
xpen
ditu
res.
The
sum
of
the
diffe
renc
es in
cos
ts w
as d
ivid
ed b
y th
e to
tal p
redi
cted
exp
endi
ture
s fo
r all
grou
ps to
de
term
ine
the
perc
enta
ge o
f agg
rega
te c
osts
as
soci
ated
with
inad
equa
te le
vels
of p
hysi
cal
activ
ity. T
wo
mod
els
wer
e us
ed: w
ith a
nd
with
out a
djus
tmen
t for
BM
I.
Phys
ical
act
ivity
pre
vale
nce:
Na
tiona
l Hea
lth In
terv
iew
Su
rvey
(200
4–20
10)
Cost
dat
a: M
edic
al
Expe
nditu
re P
anel
Sur
vey
(200
6–20
11)
Dire
ct
heal
th
care
cos
ts
(USD
)
2006
–201
1Hi
gher
leve
ls o
f lei
sure
-tim
e ae
robi
c ph
ysic
al a
ctiv
ity w
ere
sign
ifica
ntly
as
soci
ated
with
low
er h
ealth
car
e co
sts.
The
re w
as a
mea
n di
ffere
nce
of 2
9.9%
in a
nnua
l per
cap
ita
cost
s be
twee
n ac
tive
and
inac
tive
grou
ps, a
s in
activ
e in
divi
dual
s pa
id
an a
dditi
onal
cos
t of U
S$ 1
437
. In
suffi
cien
tly a
ctiv
e in
divi
dual
s pa
id a
n ad
ditio
nal c
ost o
f US$
713
co
mpa
red
to a
ctiv
e in
divi
dual
s (m
ean
diffe
renc
e: 1
5.4%
). Af
ter
adju
stin
g fo
r BM
I, th
e m
eans
of
annu
al e
xpen
ditu
re a
nd p
er c
ent
diffe
renc
es d
ecre
ased
but
rem
aine
d si
gnifi
cant
(26.
6% o
r US$
1 3
13
betw
een
activ
e an
d in
activ
e gr
oups
an
d 12
.1%
or U
S$ 5
76 b
etw
een
insu
ffici
ently
act
ive
and
inac
tive
grou
ps).
Befo
re a
djus
tmen
t for
BM
I, th
e pe
rcen
tage
of a
ggre
gate
he
alth
car
e ex
pend
iture
s as
soci
ated
w
ith in
adeq
uate
leve
ls o
f phy
sica
l ac
tivity
was
12.
5% (U
S$ 1
31 b
illio
n)
and
rem
aine
d si
gnifi
cant
at 1
1.1%
(U
S$ 1
17 b
illio
n) a
fter a
djus
ting
for
BMI.
Whe
n ad
ults
with
any
repo
rted
diffi
culty
wal
king
due
to a
hea
lth
prob
lem
wer
e ex
clud
ed fr
om th
e an
alys
is, t
he p
erce
ntag
e w
as 8
.7%
(U
S$ 7
9 bi
llion
).

Assessing the economic costs of unhealthy diets and low physical activity72
Auth
or/s
Stud
y ob
jectiv
eCo
untry
Prin
cipal
ap
proa
chM
etho
dolo
gyDa
taTy
pe o
f co
sts
Base
-yea
rPr
incip
al fi
ndin
gs
PHYSICAL ACTIVITYCodo
gno
et a
l. (2
015)
To a
naly
se th
e as
soci
atio
n be
twee
n ph
ysic
al
inac
tivity
in
diff
eren
t do
mai
ns a
nd
publ
ic h
ealth
ex
pend
iture
s an
d id
entif
y w
heth
er
clus
terin
g of
phy
sica
l in
activ
ity in
th
ese
dom
ains
co
ntrib
utes
to
incr
ease
d he
alth
car
e co
sts.
Braz
ilBa
sed
on p
ublic
pr
imar
y he
alth
ca
re c
osts
.
Parti
cipa
nts’
prim
ary
heal
th c
are
cost
s w
ere
estim
ated
in th
e la
st 1
2 m
onth
s pr
ior
to in
terv
iew
on
phys
ical
act
ivity
. Ind
ivid
ual
habi
tual
phy
sica
l act
ivity
was
ass
esse
d in
thre
e do
mai
ns (i
.e w
ork,
spo
rts a
nd le
isur
e-tim
e)
usin
g th
e Ba
ecke
Que
stio
nnai
re a
nd s
core
d.
Scor
es w
ere
cate
goris
ed in
to q
uarti
les:
the
botto
m q
uarti
le w
ith s
core
s ≤2
5, m
iddl
e qu
artil
es w
ith s
core
s ≥2
5 bu
t ≤75
and
the
high
qu
artil
e w
ith s
core
s ≥7
5. P
artic
ipan
ts w
ere
anal
ysed
acc
ordi
ng to
in h
ow m
any
dom
ains
of
phy
sica
l act
ivity
they
wer
e ca
tego
rised
in
the
botto
m q
uarti
le (i
.e. f
rom
0 to
3 ti
mes
). Th
is
frequ
ency
of b
eing
in th
e bo
ttom
qua
rtile
was
co
rrel
ated
with
ann
ual e
xpen
ditu
re d
ata.
Cost
dat
a: B
asic
Hea
lthca
re
Unit,
Sao
Pao
lo, B
razi
l
Phys
ical
act
ivity
: stu
dy
inte
rvie
w
Dire
ct
heal
th
care
cos
ts
(USD
)
2009
Low
er p
hysi
cal a
ctiv
ity (i
.e. s
core
s in
the
botto
m q
uarti
le) i
n tw
o or
all
of th
e do
mai
ns w
as a
ssoc
iate
d w
ith
high
er e
xpen
ditu
res
(odd
s ra
tio fo
r tw
o do
mai
ns: 1
.75
and
for t
hree
do
mai
ns: 2
.12)
. Tho
se in
the
botto
m
quar
tile
for a
ll th
ree
dom
ains
had
th
e hi
ghes
t ove
rall
expe
nditu
res
(OR:
2.2
8). F
or s
peci
fic d
omai
ns,
low
er p
hysi
cal a
ctiv
ity a
t wor
k an
d in
spo
rts is
ass
ocia
ted
with
hig
her
heal
th c
are
expe
nditu
res
rela
ted
to
med
icin
e di
scha
rge
(OR
for w
ork:
1.
58, O
R fo
r spo
rt: 1
.57)
. Low
er
phys
ical
act
ivity
in le
isur
e-tim
e w
as
still
ass
ocia
ted
with
hig
her o
vera
ll ex
pend
iture
s (O
R: 1
.53)
.
Auth
or/s
Stud
y ob
jectiv
eCo
untry
Prin
cipal
ap
proa
chM
etho
dolo
gyDa
taTy
pe o
f co
sts
Base
-yea
rPr
incip
al fi
ndin
gs
PHYSICAL ACTIVITYIdle
r et a
l. (2
015)
To a
naly
se th
e re
latio
nshi
p be
twee
n ph
ysic
al a
ctiv
ity
and
heal
th c
are
and
(par
enta
l) pr
oduc
tivity
co
sts
amon
g ch
ildre
n ag
ed 9
to
12
year
s.
Germ
any
Base
d on
pub
lic
and/
or p
rivat
e he
alth
car
e an
d pa
rent
al w
ork
abse
nce
cost
s.
Info
rmat
ion
on c
hild
ren’
s ph
ysic
al a
ctiv
ity a
nd
frequ
ency
of h
ealth
car
e ut
ilisa
tion
and
cost
s w
ere
prov
ided
by
pare
nts
in a
n in
terv
iew
(usi
ng
a se
lf-ad
min
iste
red
ques
tionn
aire
). Ch
ildre
n w
ere
grou
ped
into
two
cate
gorie
s ba
sed
on
wee
kly
hour
s sp
ent o
n m
oder
ate
and
vigo
rous
ph
ysic
al a
ctiv
ity: <
7 ho
urs
per w
eek
and
≥7
hour
s pe
r wee
k. D
irect
hea
lth c
are
and
indi
rect
pr
oduc
tivity
cos
ts (i
.e. f
rom
par
enta
l abs
ence
at
wor
k) w
ere
exam
ined
acr
oss
the
two
phys
ical
act
ivity
gro
ups
to d
eter
min
e po
ssib
le
asso
ciat
ions
.
Phys
ical
act
ivity
, fre
quen
cy
of h
ealth
car
e ut
ilisa
tion:
Th
e Ge
rman
Infa
nt S
tudy
on
the
Influ
ence
of
Nutri
tion
Inte
rven
tion
plus
Ai
r Pol
lutio
n an
d Ge
netic
s on
Alle
rgy
Deve
lopm
ent
(GIN
Iplu
s) s
tudy
and
the
Influ
ence
of L
ifest
yle
Fact
ors
on D
evel
opm
ent o
f th
e Im
mun
e Sy
stem
and
Al
lerg
ies
in E
ast a
nd W
est
Germ
any
plus
Air
Pollu
tion
and
Gene
tics
on A
llerg
y De
velo
pmen
t (LI
SApl
us)
stud
y
Dire
ct m
edic
al u
nit c
osts
, nu
mbe
r of d
ays
of p
aren
tal
abse
nce
from
wor
k an
d co
sts
per d
ay: W
orki
ng
Grou
p M
etho
ds in
Hea
lth
Econ
omic
Eva
luat
ion
(AG
MEG
) nat
iona
l cos
ting
guid
e, e
arlie
r stu
dies
Dire
ct
heal
th
care
and
in
dire
ct
prod
uctiv
ity
cost
s (E
UR)
2007
The
mea
n an
nual
cos
t for
a c
hild
with
a
high
er le
vel o
f phy
sica
l act
ivity
(i.e
. ≥7
hou
rs p
er w
eek)
vs
a ch
ild w
ith
low
er a
ctiv
ity le
vel (
i.e. <
7 ho
urs
per
wee
k) w
ere
€392
vs
€398
for d
irect
co
sts
and
€138
vs
€127
for i
ndire
ct
cost
s. H
owev
er, t
here
wer
e no
st
atis
tical
ly s
igni
fican
t ass
ocia
tions
no
ted
betw
een
phys
ical
act
ivity
and
he
alth
car
e ut
ilisa
tion
and
cost
s am
ong
child
ren
aged
9 to
12
year
s.
Diffe
rent
dire
ctio
ns o
f est
imat
es
wer
e no
ticea
ble
thro
ugho
ut th
e co
st
com
pone
nts.
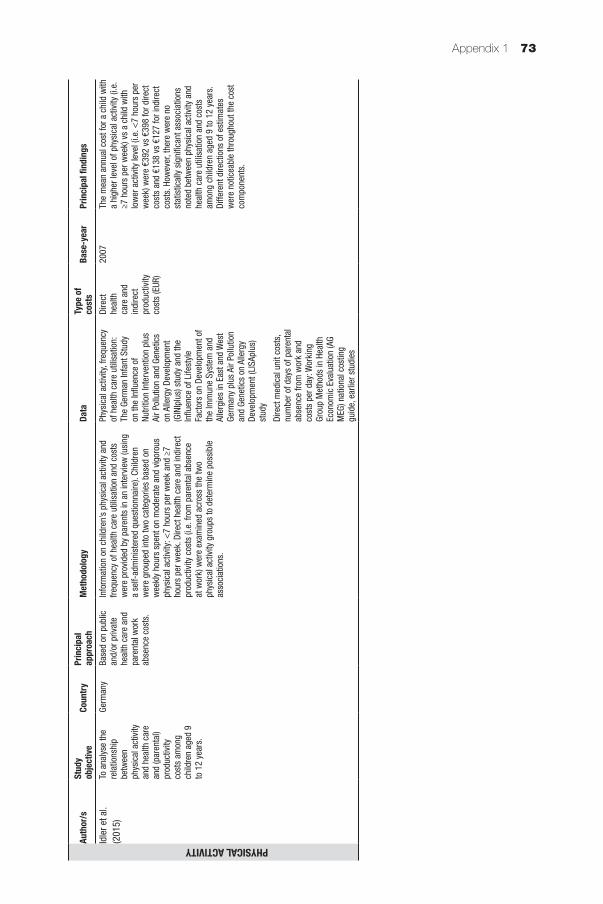
Appendix 1 73
Auth
or/s
Stud
y ob
jectiv
eCo
untry
Prin
cipal
ap
proa
chM
etho
dolo
gyDa
taTy
pe o
f co
sts
Base
-yea
rPr
incip
al fi
ndin
gs
PHYSICAL ACTIVITYIdle
r et a
l. (2
015)
To a
naly
se th
e re
latio
nshi
p be
twee
n ph
ysic
al a
ctiv
ity
and
heal
th c
are
and
(par
enta
l) pr
oduc
tivity
co
sts
amon
g ch
ildre
n ag
ed 9
to
12
year
s.
Germ
any
Base
d on
pub
lic
and/
or p
rivat
e he
alth
car
e an
d pa
rent
al w
ork
abse
nce
cost
s.
Info
rmat
ion
on c
hild
ren’
s ph
ysic
al a
ctiv
ity a
nd
frequ
ency
of h
ealth
car
e ut
ilisa
tion
and
cost
s w
ere
prov
ided
by
pare
nts
in a
n in
terv
iew
(usi
ng
a se
lf-ad
min
iste
red
ques
tionn
aire
). Ch
ildre
n w
ere
grou
ped
into
two
cate
gorie
s ba
sed
on
wee
kly
hour
s sp
ent o
n m
oder
ate
and
vigo
rous
ph
ysic
al a
ctiv
ity: <
7 ho
urs
per w
eek
and
≥7
hour
s pe
r wee
k. D
irect
hea
lth c
are
and
indi
rect
pr
oduc
tivity
cos
ts (i
.e. f
rom
par
enta
l abs
ence
at
wor
k) w
ere
exam
ined
acr
oss
the
two
phys
ical
act
ivity
gro
ups
to d
eter
min
e po
ssib
le
asso
ciat
ions
.
Phys
ical
act
ivity
, fre
quen
cy
of h
ealth
car
e ut
ilisa
tion:
Th
e Ge
rman
Infa
nt S
tudy
on
the
Influ
ence
of
Nutri
tion
Inte
rven
tion
plus
Ai
r Pol
lutio
n an
d Ge
netic
s on
Alle
rgy
Deve
lopm
ent
(GIN
Iplu
s) s
tudy
and
the
Influ
ence
of L
ifest
yle
Fact
ors
on D
evel
opm
ent o
f th
e Im
mun
e Sy
stem
and
Al
lerg
ies
in E
ast a
nd W
est
Germ
any
plus
Air
Pollu
tion
and
Gene
tics
on A
llerg
y De
velo
pmen
t (LI
SApl
us)
stud
y
Dire
ct m
edic
al u
nit c
osts
, nu
mbe
r of d
ays
of p
aren
tal
abse
nce
from
wor
k an
d co
sts
per d
ay: W
orki
ng
Grou
p M
etho
ds in
Hea
lth
Econ
omic
Eva
luat
ion
(AG
MEG
) nat
iona
l cos
ting
guid
e, e
arlie
r stu
dies
Dire
ct
heal
th
care
and
in
dire
ct
prod
uctiv
ity
cost
s (E
UR)
2007
The
mea
n an
nual
cos
t for
a c
hild
with
a
high
er le
vel o
f phy
sica
l act
ivity
(i.e
. ≥7
hou
rs p
er w
eek)
vs
a ch
ild w
ith
low
er a
ctiv
ity le
vel (
i.e. <
7 ho
urs
per
wee
k) w
ere
€392
vs
€398
for d
irect
co
sts
and
€138
vs
€127
for i
ndire
ct
cost
s. H
owev
er, t
here
wer
e no
st
atis
tical
ly s
igni
fican
t ass
ocia
tions
no
ted
betw
een
phys
ical
act
ivity
and
he
alth
car
e ut
ilisa
tion
and
cost
s am
ong
child
ren
aged
9 to
12
year
s.
Diffe
rent
dire
ctio
ns o
f est
imat
es
wer
e no
ticea
ble
thro
ugho
ut th
e co
st
com
pone
nts.
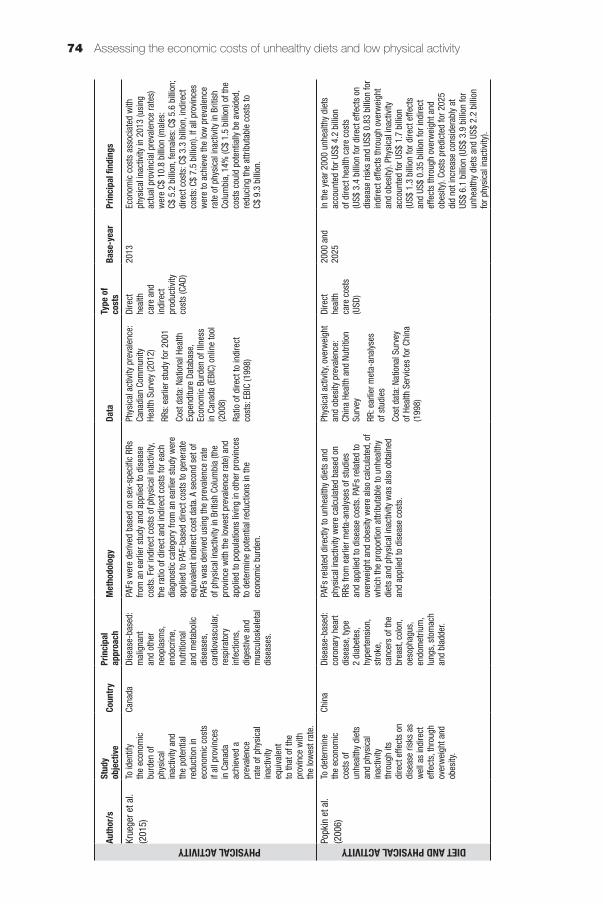
Assessing the economic costs of unhealthy diets and low physical activity74
Auth
or/s
Stud
y ob
jectiv
eCo
untry
Prin
cipal
ap
proa
chM
etho
dolo
gyDa
taTy
pe o
f co
sts
Base
-yea
rPr
incip
al fi
ndin
gs
PHYSICAL ACTIVITYKrue
ger e
t al.
(201
5)To
iden
tify
the
econ
omic
bu
rden
of
phys
ical
in
activ
ity a
nd
the
pote
ntia
l re
duct
ion
in
econ
omic
cos
ts
if al
l pro
vinc
es
in C
anad
a ac
hiev
ed a
pr
eval
ence
ra
te o
f phy
sica
l in
activ
ity
equi
vale
nt
to th
at o
f the
pr
ovin
ce w
ith
the
low
est r
ate.
Cana
daDi
seas
e-ba
sed:
m
alig
nant
an
d ot
her
neop
lasm
s,
endo
crin
e,
nutri
tiona
l an
d m
etab
olic
di
seas
es,
card
iova
scul
ar,
resp
irato
ry
infe
ctio
ns,
dige
stiv
e an
d m
uscu
losk
elet
al
dise
ases
.
PAFs
wer
e de
rived
bas
ed o
n se
x-sp
ecifi
c RR
s fro
m a
n ea
rlier
stu
dy a
nd a
pplie
d to
dis
ease
co
sts.
For
indi
rect
cos
ts o
f phy
sica
l ina
ctiv
ity,
the
ratio
of d
irect
and
indi
rect
cos
ts fo
r eac
h di
agno
stic
cat
egor
y fro
m a
n ea
rlier
stu
dy w
ere
appl
ied
to P
AF-b
ased
dire
ct c
osts
to g
ener
ate
equi
vale
nt in
dire
ct c
ost d
ata.
A s
econ
d se
t of
PAFs
was
der
ived
usi
ng th
e pr
eval
ence
rate
of
phy
sica
l ina
ctiv
ity in
Brit
ish
Colu
mbi
a (th
e pr
ovin
ce w
ith th
e lo
wes
t pre
vale
nce
rate
) and
ap
plie
d to
pop
ulat
ions
livi
ng in
oth
er p
rovi
nces
to
det
erm
ine
pote
ntia
l red
uctio
ns in
the
econ
omic
bur
den.
Phys
ical
act
ivity
pre
vale
nce:
Ca
nadi
an C
omm
unity
He
alth
Sur
vey
(201
2)
RRs:
ear
lier s
tudy
for 2
001
Cost
dat
a: N
atio
nal H
ealth
Ex
pend
iture
Dat
abas
e,
Econ
omic
Bur
den
of Il
lnes
s in
Can
ada
(EBI
C) o
nlin
e to
ol
(200
8)
Ratio
of d
irect
to in
dire
ct
cost
s: E
BIC
(199
8)
Dire
ct
heal
th
care
and
in
dire
ct
prod
uctiv
ity
cost
s (C
AD)
2013
Econ
omic
cos
ts a
ssoc
iate
d w
ith
phys
ical
inac
tivity
in 2
013
(usi
ng
actu
al p
rovi
ncia
l pre
vale
nce
rate
s)
wer
e C$
10.
8 bi
llion
(mal
es:
C$ 5
.2 b
illio
n, fe
mal
es: C
$ 5.
6 bi
llion
; di
rect
cos
ts: C
$ 3.
3 bi
llion
, ind
irect
co
sts:
C$
7.5
billi
on).
If al
l pro
vinc
es
wer
e to
ach
ieve
the
low
pre
vale
nce
rate
of p
hysi
cal i
nact
ivity
in B
ritis
h Co
lum
bia,
14%
(C$
1.5
billi
on) o
f the
co
sts
coul
d po
tent
ially
be
avoi
ded,
re
duci
ng th
e at
tribu
tabl
e co
sts
to
C$ 9
.3 b
illio
n.
DIET AND PHYSICAL ACTIVITYPopk
in e
t al.
(200
6)To
det
erm
ine
the
econ
omic
co
sts
of
unhe
alth
y di
ets
and
phys
ical
in
activ
ity
thro
ugh
its
dire
ct e
ffect
s on
di
seas
e ris
ks a
s w
ell a
s in
dire
ct
effe
cts,
thro
ugh
over
wei
ght a
nd
obes
ity.
Chin
aDi
seas
e-ba
sed:
co
rona
ry h
eart
dise
ase,
type
2
diab
etes
, hy
perte
nsio
n,
stro
ke,
canc
ers
of th
e br
east
, col
on,
oeso
phag
us,
endo
met
rium
, lu
ngs,
sto
mac
h an
d bl
adde
r.
PAFs
rela
ted
dire
ctly
to u
nhea
lthy
diet
s an
d ph
ysic
al in
activ
ity w
ere
calc
ulat
ed b
ased
on
RRs
from
ear
lier m
eta-
anal
yses
of s
tudi
es
and
appl
ied
to d
isea
se c
osts
. PAF
s re
late
d to
ov
erw
eigh
t and
obe
sity
wer
e al
so c
alcu
late
d, o
f w
hich
the
prop
ortio
n at
tribu
tabl
e to
unh
ealth
y di
ets
and
phys
ical
inac
tivity
was
als
o ob
tain
ed
and
appl
ied
to d
isea
se c
osts
.
Phys
ical
act
ivity
, ove
rwei
ght
and
obes
ity p
reva
lenc
e:
Chin
a He
alth
and
Nut
ritio
n Su
rvey
RR: e
arlie
r met
a-an
alys
es
of s
tudi
es
Cost
dat
a: N
atio
nal S
urve
y of
Hea
lth S
ervi
ces
for C
hina
(1
998)
Dire
ct
heal
th
care
cos
ts
(USD
)
2000
and
20
25In
the
year
200
0 un
heal
thy
diet
s ac
coun
ted
for U
S$ 4
.2 b
illio
n of
dire
ct h
ealth
car
e co
sts
(US$
3.4
bill
ion
for d
irect
effe
cts
on
dise
ase
risks
and
US$
0.8
3 bi
llion
for
indi
rect
effe
cts
thro
ugh
over
wei
ght
and
obes
ity).
Phys
ical
inac
tivity
ac
coun
ted
for U
S$ 1
.7 b
illio
n (U
S$ 1
.3 b
illio
n fo
r dire
ct e
ffect
s an
d US
$ 0.
35 b
illio
n fo
r ind
irect
ef
fect
s th
roug
h ov
erw
eigh
t and
ob
esity
). Co
sts
pred
icte
d fo
r 202
5 di
d no
t inc
reas
e co
nsid
erab
ly a
t US
$ 6.
1 bi
llion
(US$
3.9
bill
ion
for
unhe
alth
y di
ets
and
US$
2.2
billi
on
for p
hysi
cal i
nact
ivity
).
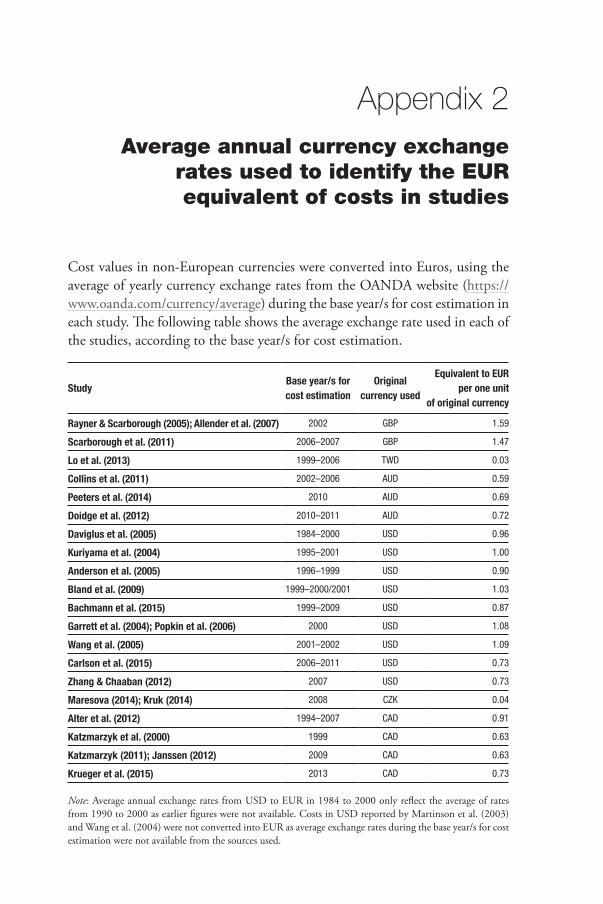
Appendix 2Average annual currency exchange
rates used to identify the EUR equivalent of costs in studies
Cost values in non-European currencies were converted into Euros, using the average of yearly currency exchange rates from the OANDA website (https://www.oanda.com/currency/average) during the base year/s for cost estimation in each study. The following table shows the average exchange rate used in each of the studies, according to the base year/s for cost estimation.
Study Base year/s for cost estimation
Original currency used
Equivalent to EUR per one unit
of original currency
Rayner & Scarborough (2005); Allender et al. (2007) 2002 GBP 1.59
Scarborough et al. (2011) 2006–2007 GBP 1.47
Lo et al. (2013) 1999–2006 TWD 0.03
Collins et al. (2011) 2002–2006 AUD 0.59
Peeters et al. (2014) 2010 AUD 0.69
Doidge et al. (2012) 2010–2011 AUD 0.72
Daviglus et al. (2005) 1984–2000 USD 0.96
Kuriyama et al. (2004) 1995–2001 USD 1.00
Anderson et al. (2005) 1996–1999 USD 0.90
Bland et al. (2009) 1999–2000/2001 USD 1.03
Bachmann et al. (2015) 1999–2009 USD 0.87
Garrett et al. (2004); Popkin et al. (2006) 2000 USD 1.08
Wang et al. (2005) 2001–2002 USD 1.09
Carlson et al. (2015) 2006–2011 USD 0.73
Zhang & Chaaban (2012) 2007 USD 0.73
Maresova (2014); Kruk (2014) 2008 CZK 0.04
Alter et al. (2012) 1994–2007 CAD 0.91
Katzmarzyk et al. (2000) 1999 CAD 0.63
Katzmarzyk (2011); Janssen (2012) 2009 CAD 0.63
Krueger et al. (2015) 2013 CAD 0.73
Note: Average annual exchange rates from USD to EUR in 1984 to 2000 only reflect the average of rates from 1990 to 2000 as earlier figures were not available. Costs in USD reported by Martinson et al. (2003) and Wang et al. (2004) were not converted into EUR as average exchange rates during the base year/s for cost estimation were not available from the sources used.
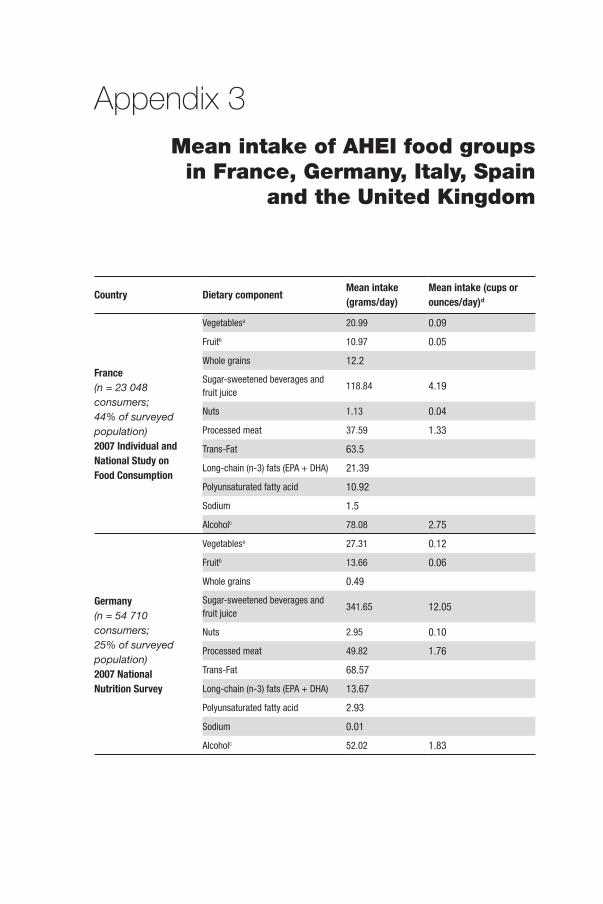
Appendix 3Mean intake of AHEI food groups
in France, Germany, Italy, Spain and the United Kingdom
Country Dietary component Mean intake (grams/day)
Mean intake (cups or ounces/day)d
France(n = 23 048 consumers; 44% of surveyed population)2007 Individual and National Study on Food Consumption
Vegetablesa 20.99 0.09
Fruitb 10.97 0.05
Whole grains 12.2
Sugar-sweetened beverages and fruit juice
118.84 4.19
Nuts 1.13 0.04
Processed meat 37.59 1.33
Trans-Fat 63.5
Long-chain (n-3) fats (EPA + DHA) 21.39
Polyunsaturated fatty acid 10.92
Sodium 1.5
Alcoholc 78.08 2.75
Germany(n = 54 710 consumers; 25% of surveyed population)2007 National Nutrition Survey
Vegetablesa 27.31 0.12
Fruitb 13.66 0.06
Whole grains 0.49
Sugar-sweetened beverages and fruit juice
341.65 12.05
Nuts 2.95 0.10
Processed meat 49.82 1.76
Trans-Fat 68.57
Long-chain (n-3) fats (EPA + DHA) 13.67
Polyunsaturated fatty acid 2.93
Sodium 0.01
Alcoholc 52.02 1.83
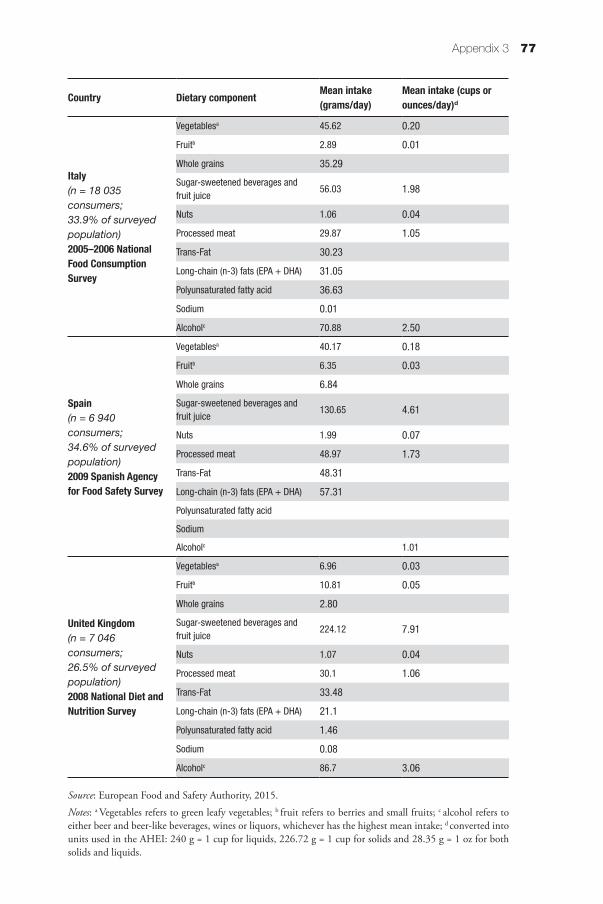
Appendix 3 77
Country Dietary component Mean intake (grams/day)
Mean intake (cups or ounces/day)d
Italy(n = 18 035 consumers; 33.9% of surveyed population)2005–2006 National Food Consumption Survey
Vegetablesa 45.62 0.20
Fruitb 2.89 0.01
Whole grains 35.29
Sugar-sweetened beverages and fruit juice
56.03 1.98
Nuts 1.06 0.04
Processed meat 29.87 1.05
Trans-Fat 30.23
Long-chain (n-3) fats (EPA + DHA) 31.05
Polyunsaturated fatty acid 36.63
Sodium 0.01
Alcoholc 70.88 2.50
Spain(n = 6 940 consumers; 34.6% of surveyed population)2009 Spanish Agency for Food Safety Survey
Vegetablesa 40.17 0.18
Fruitb 6.35 0.03
Whole grains 6.84
Sugar-sweetened beverages and fruit juice
130.65 4.61
Nuts 1.99 0.07
Processed meat 48.97 1.73
Trans-Fat 48.31
Long-chain (n-3) fats (EPA + DHA) 57.31
Polyunsaturated fatty acid
Sodium
Alcoholc 1.01
United Kingdom(n = 7 046 consumers; 26.5% of surveyed population)2008 National Diet and Nutrition Survey
Vegetablesa 6.96 0.03
Fruitb 10.81 0.05
Whole grains 2.80
Sugar-sweetened beverages and fruit juice
224.12 7.91
Nuts 1.07 0.04
Processed meat 30.1 1.06
Trans-Fat 33.48
Long-chain (n-3) fats (EPA + DHA) 21.1
Polyunsaturated fatty acid 1.46
Sodium 0.08
Alcoholc 86.7 3.06
Source: European Food and Safety Authority, 2015.
Notes: a Vegetables refers to green leafy vegetables; b fruit refers to berries and small fruits; c alcohol refers to either beer and beer-like beverages, wines or liquors, whichever has the highest mean intake; d converted into units used in the AHEI: 240 g = 1 cup for liquids, 226.72 g = 1 cup for solids and 28.35 g = 1 oz for both solids and liquids.
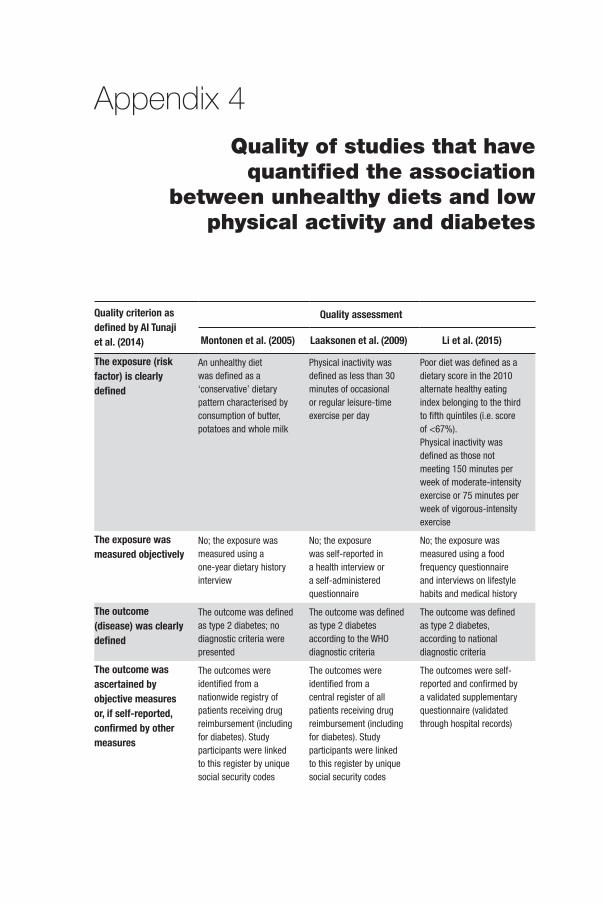
Appendix 4Quality of studies that have
quantified the association between unhealthy diets and low
physical activity and diabetes
Quality criterion as defined by Al Tunaji et al. (2014)
Quality assessment
Montonen et al. (2005) Laaksonen et al. (2009) Li et al. (2015)
The exposure (risk factor) is clearly defined
An unhealthy diet was defined as a ‘conservative’ dietary pattern characterised by consumption of butter, potatoes and whole milk
Physical inactivity was defined as less than 30 minutes of occasional or regular leisure-time exercise per day
Poor diet was defined as a dietary score in the 2010 alternate healthy eating index belonging to the third to fifth quintiles (i.e. score of <67%).Physical inactivity was defined as those not meeting 150 minutes per week of moderate-intensity exercise or 75 minutes per week of vigorous-intensity exercise
The exposure was measured objectively
No; the exposure was measured using a one-year dietary history interview
No; the exposure was self-reported in a health interview or a self-administered questionnaire
No; the exposure was measured using a food frequency questionnaire and interviews on lifestyle habits and medical history
The outcome (disease) was clearly defined
The outcome was defined as type 2 diabetes; no diagnostic criteria were presented
The outcome was defined as type 2 diabetes according to the WHO diagnostic criteria
The outcome was defined as type 2 diabetes, according to national diagnostic criteria
The outcome was ascertained by objective measures or, if self-reported, confirmed by other measures
The outcomes were identified from a nationwide registry of patients receiving drug reimbursement (including for diabetes). Study participants were linked to this register by unique social security codes
The outcomes were identified from a central register of all patients receiving drug reimbursement (including for diabetes). Study participants were linked to this register by unique social security codes
The outcomes were self-reported and confirmed by a validated supplementary questionnaire (validated through hospital records)
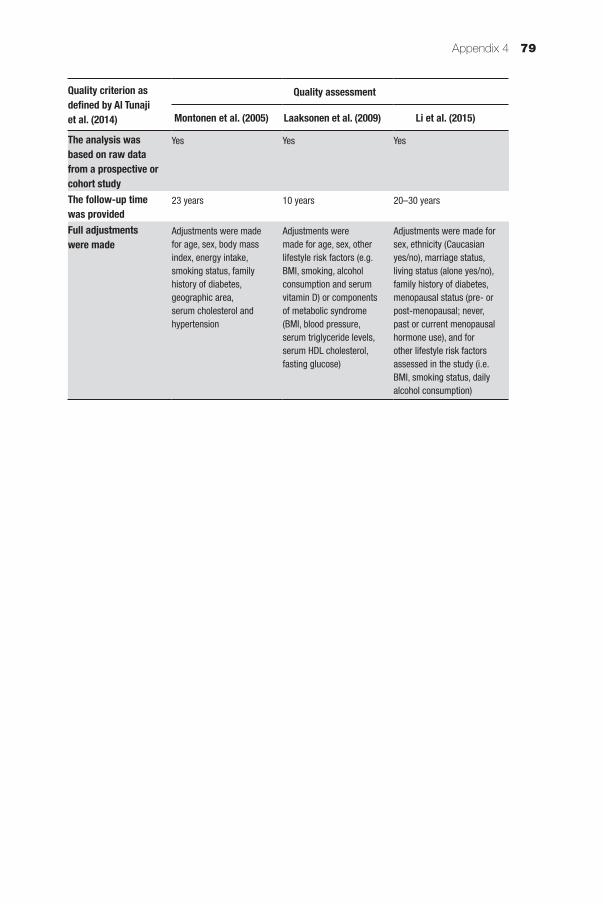
Appendix 4 79
Quality criterion as defined by Al Tunaji et al. (2014)
Quality assessment
Montonen et al. (2005) Laaksonen et al. (2009) Li et al. (2015)
The analysis was based on raw data from a prospective or cohort study
Yes Yes Yes
The follow-up time was provided
23 years 10 years 20–30 years
Full adjustments were made
Adjustments were made for age, sex, body mass index, energy intake, smoking status, family history of diabetes, geographic area, serum cholesterol and hypertension
Adjustments were made for age, sex, other lifestyle risk factors (e.g. BMI, smoking, alcohol consumption and serum vitamin D) or components of metabolic syndrome (BMI, blood pressure, serum triglyceride levels, serum HDL cholesterol, fasting glucose)
Adjustments were made for sex, ethnicity (Caucasian yes/no), marriage status, living status (alone yes/no), family history of diabetes, menopausal status (pre- or post-menopausal; never, past or current menopausal hormone use), and for other lifestyle risk factors assessed in the study (i.e. BMI, smoking status, daily alcohol consumption)
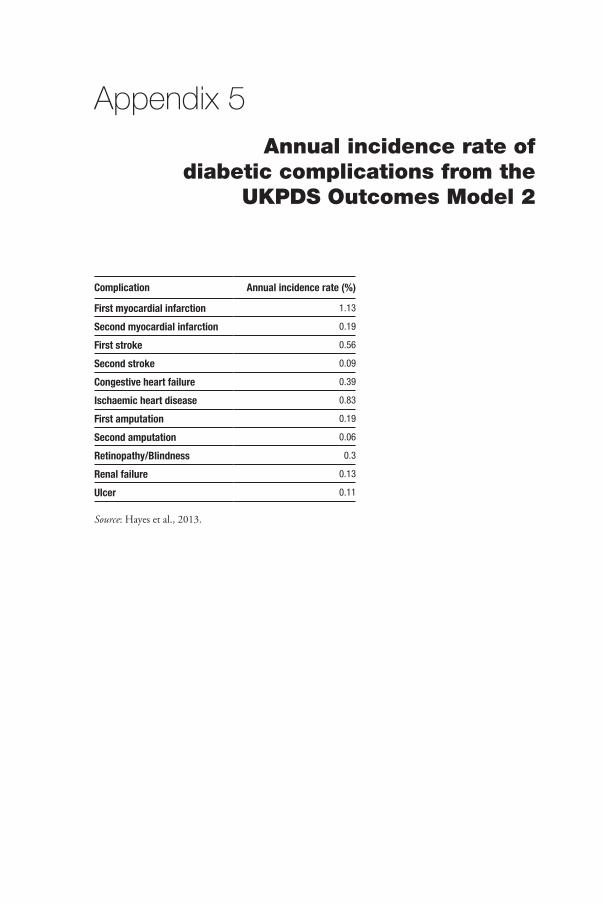
Appendix 5Annual incidence rate of
diabetic complications from the UKPDS Outcomes Model 2
Complication Annual incidence rate (%)
First myocardial infarction 1.13
Second myocardial infarction 0.19
First stroke 0.56
Second stroke 0.09
Congestive heart failure 0.39
Ischaemic heart disease 0.83
First amputation 0.19
Second amputation 0.06
Retinopathy/Blindness 0.3
Renal failure 0.13
Ulcer 0.11
Source: Hayes et al., 2013.
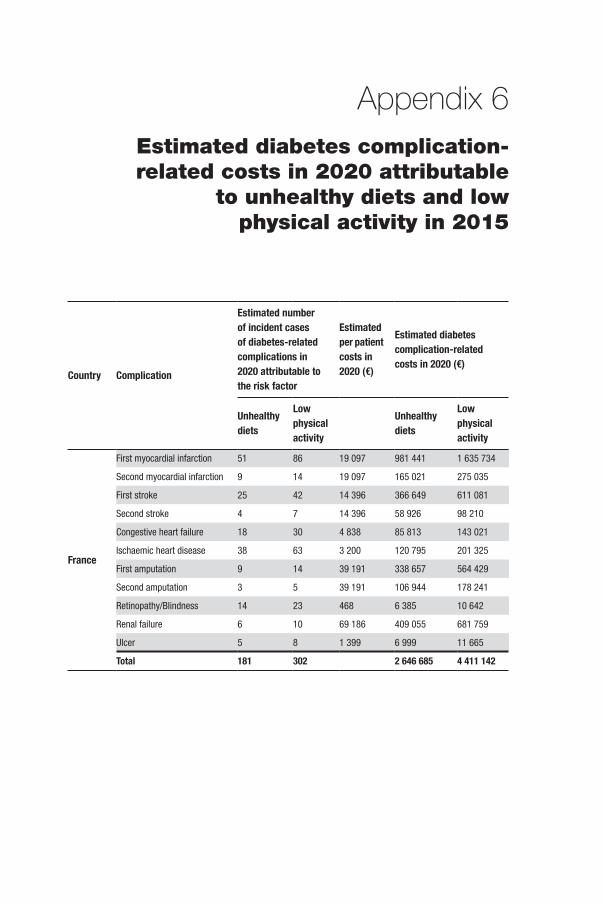
Appendix 6Estimated diabetes complication-related costs in 2020 attributable
to unhealthy diets and low physical activity in 2015
Country Complication
Estimated number of incident cases of diabetes-related complications in 2020 attributable to the risk factor
Estimated per patient costs in 2020 (€)
Estimated diabetes complication-related costs in 2020 (€)
Unhealthy diets
Low physical activity
Unhealthy diets
Low physical activity
France
First myocardial infarction 51 86 19 097 981 441 1 635 734
Second myocardial infarction 9 14 19 097 165 021 275 035
First stroke 25 42 14 396 366 649 611 081
Second stroke 4 7 14 396 58 926 98 210
Congestive heart failure 18 30 4 838 85 813 143 021
Ischaemic heart disease 38 63 3 200 120 795 201 325
First amputation 9 14 39 191 338 657 564 429
Second amputation 3 5 39 191 106 944 178 241
Retinopathy/Blindness 14 23 468 6 385 10 642
Renal failure 6 10 69 186 409 055 681 759
Ulcer 5 8 1 399 6 999 11 665
Total 181 302 2 646 685 4 411 142
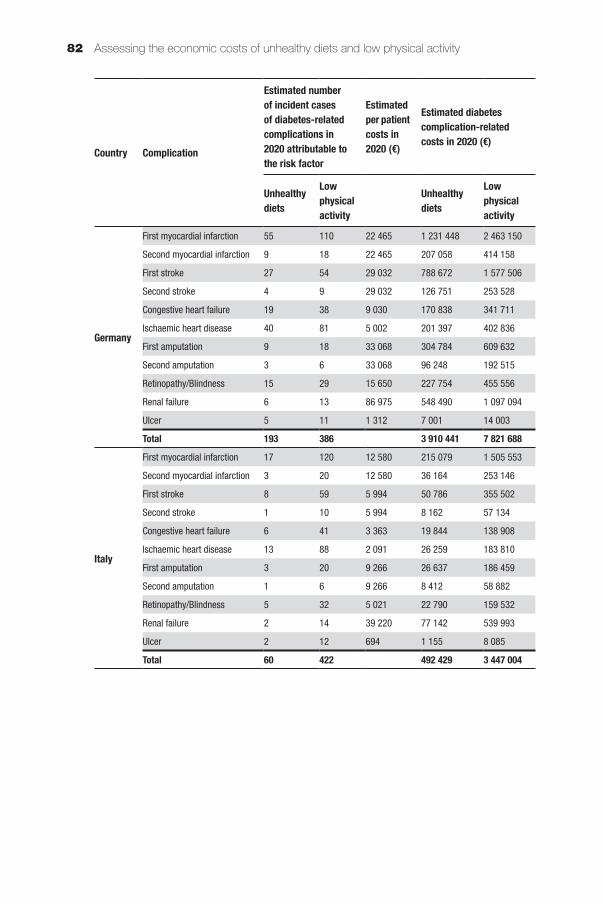
Assessing the economic costs of unhealthy diets and low physical activity82
Country Complication
Estimated number of incident cases of diabetes-related complications in 2020 attributable to the risk factor
Estimated per patient costs in 2020 (€)
Estimated diabetes complication-related costs in 2020 (€)
Unhealthy diets
Low physical activity
Unhealthy diets
Low physical activity
Germany
First myocardial infarction 55 110 22 465 1 231 448 2 463 150
Second myocardial infarction 9 18 22 465 207 058 414 158
First stroke 27 54 29 032 788 672 1 577 506
Second stroke 4 9 29 032 126 751 253 528
Congestive heart failure 19 38 9 030 170 838 341 711
Ischaemic heart disease 40 81 5 002 201 397 402 836
First amputation 9 18 33 068 304 784 609 632
Second amputation 3 6 33 068 96 248 192 515
Retinopathy/Blindness 15 29 15 650 227 754 455 556
Renal failure 6 13 86 975 548 490 1 097 094
Ulcer 5 11 1 312 7 001 14 003
Total 193 386 3 910 441 7 821 688
Italy
First myocardial infarction 17 120 12 580 215 079 1 505 553
Second myocardial infarction 3 20 12 580 36 164 253 146
First stroke 8 59 5 994 50 786 355 502
Second stroke 1 10 5 994 8 162 57 134
Congestive heart failure 6 41 3 363 19 844 138 908
Ischaemic heart disease 13 88 2 091 26 259 183 810
First amputation 3 20 9 266 26 637 186 459
Second amputation 1 6 9 266 8 412 58 882
Retinopathy/Blindness 5 32 5 021 22 790 159 532
Renal failure 2 14 39 220 77 142 539 993
Ulcer 2 12 694 1 155 8 085
Total 60 422 492 429 3 447 004
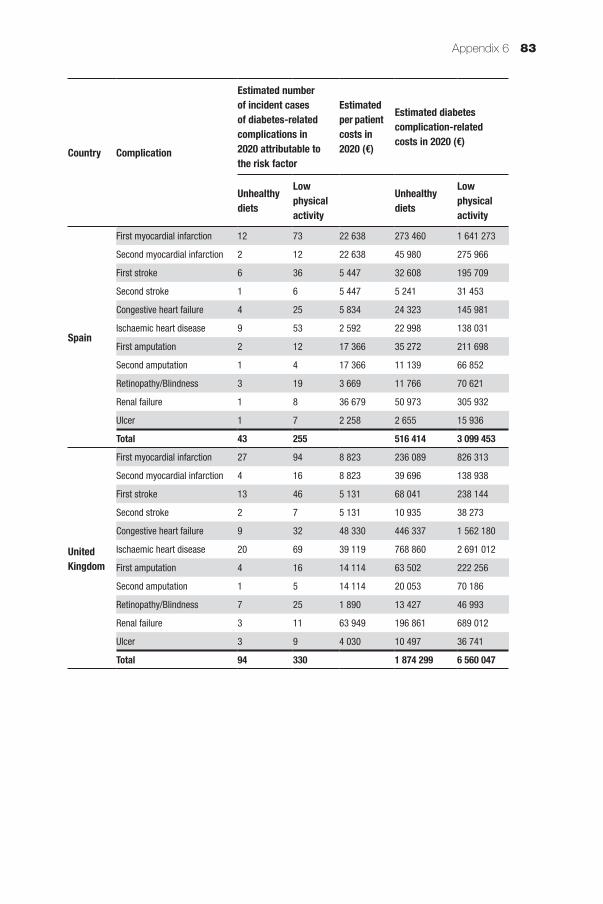
Appendix 6 83
Country Complication
Estimated number of incident cases of diabetes-related complications in 2020 attributable to the risk factor
Estimated per patient costs in 2020 (€)
Estimated diabetes complication-related costs in 2020 (€)
Unhealthy diets
Low physical activity
Unhealthy diets
Low physical activity
Spain
First myocardial infarction 12 73 22 638 273 460 1 641 273
Second myocardial infarction 2 12 22 638 45 980 275 966
First stroke 6 36 5 447 32 608 195 709
Second stroke 1 6 5 447 5 241 31 453
Congestive heart failure 4 25 5 834 24 323 145 981
Ischaemic heart disease 9 53 2 592 22 998 138 031
First amputation 2 12 17 366 35 272 211 698
Second amputation 1 4 17 366 11 139 66 852
Retinopathy/Blindness 3 19 3 669 11 766 70 621
Renal failure 1 8 36 679 50 973 305 932
Ulcer 1 7 2 258 2 655 15 936
Total 43 255 516 414 3 099 453
United Kingdom
First myocardial infarction 27 94 8 823 236 089 826 313
Second myocardial infarction 4 16 8 823 39 696 138 938
First stroke 13 46 5 131 68 041 238 144
Second stroke 2 7 5 131 10 935 38 273
Congestive heart failure 9 32 48 330 446 337 1 562 180
Ischaemic heart disease 20 69 39 119 768 860 2 691 012
First amputation 4 16 14 114 63 502 222 256
Second amputation 1 5 14 114 20 053 70 186
Retinopathy/Blindness 7 25 1 890 13 427 46 993
Renal failure 3 11 63 949 196 861 689 012
Ulcer 3 9 4 030 10 497 36 741
Total 94 330 1 874 299 6 560 047
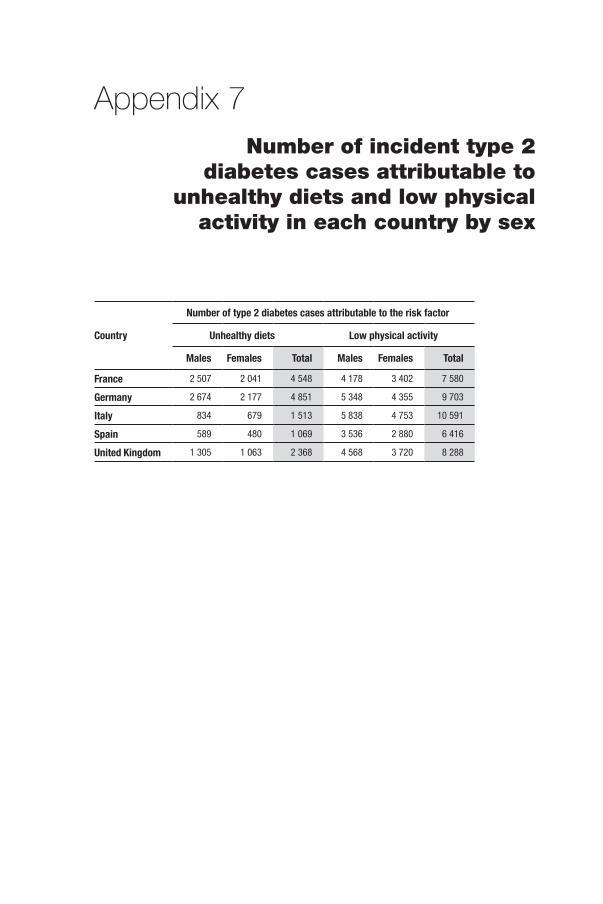
Appendix 7Number of incident type 2
diabetes cases attributable to unhealthy diets and low physical
activity in each country by sex
Country
Number of type 2 diabetes cases attributable to the risk factor
Unhealthy diets Low physical activity
Males Females Total Males Females Total
France 2 507 2 041 4 548 4 178 3 402 7 580
Germany 2 674 2 177 4 851 5 348 4 355 9 703
Italy 834 679 1 513 5 838 4 753 10 591
Spain 589 480 1 069 3 536 2 880 6 416
United Kingdom 1 305 1 063 2 368 4 568 3 720 8 288
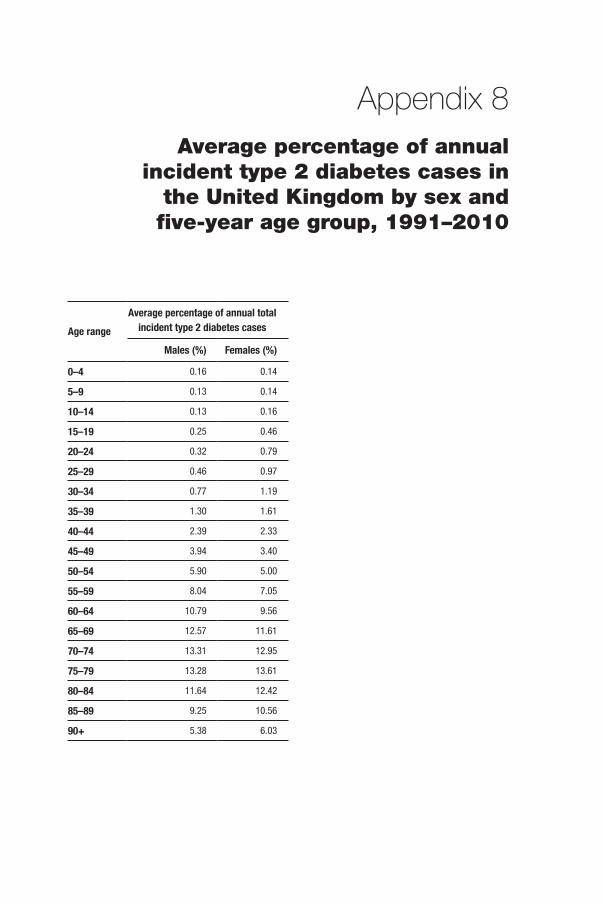
Appendix 8Average percentage of annual
incident type 2 diabetes cases in the United Kingdom by sex and five-year age group, 1991–2010
Age rangeAverage percentage of annual total
incident type 2 diabetes cases
Males (%) Females (%)
0–4 0.16 0.14
5–9 0.13 0.14
10–14 0.13 0.16
15–19 0.25 0.46
20–24 0.32 0.79
25–29 0.46 0.97
30–34 0.77 1.19
35–39 1.30 1.61
40–44 2.39 2.33
45–49 3.94 3.40
50–54 5.90 5.00
55–59 8.04 7.05
60–64 10.79 9.56
65–69 12.57 11.61
70–74 13.31 12.95
75–79 13.28 13.61
80–84 11.64 12.42
85–89 9.25 10.56
90+ 5.38 6.03
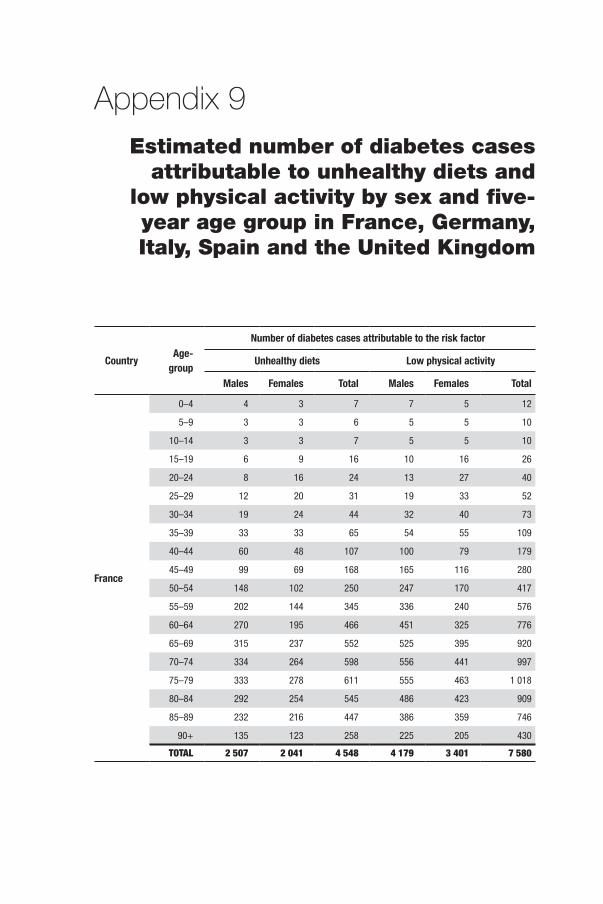
Appendix 9Estimated number of diabetes cases
attributable to unhealthy diets and low physical activity by sex and five-year age group in France, Germany, Italy, Spain and the United Kingdom
Country Age-group
Number of diabetes cases attributable to the risk factor
Unhealthy diets Low physical activity
Males Females Total Males Females Total
France
0–4 4 3 7 7 5 12
5–9 3 3 6 5 5 10
10–14 3 3 7 5 5 10
15–19 6 9 16 10 16 26
20–24 8 16 24 13 27 40
25–29 12 20 31 19 33 52
30–34 19 24 44 32 40 73
35–39 33 33 65 54 55 109
40–44 60 48 107 100 79 179
45–49 99 69 168 165 116 280
50–54 148 102 250 247 170 417
55–59 202 144 345 336 240 576
60–64 270 195 466 451 325 776
65–69 315 237 552 525 395 920
70–74 334 264 598 556 441 997
75–79 333 278 611 555 463 1 018
80–84 292 254 545 486 423 909
85–89 232 216 447 386 359 746
90+ 135 123 258 225 205 430
TOTAL 2 507 2 041 4 548 4 179 3 401 7 580

Appendix 9 87
Country Age-group
Number of diabetes cases attributable to the risk factor
Unhealthy diets Low physical activity
Males Females Total Males Females Total
Germany
0–4 4 3 7 9 6 15
5–9 3 3 7 7 6 13
10–14 3 3 7 7 7 14
15–19 7 10 17 13 20 33
20–24 9 17 26 17 34 52
25–29 12 21 33 25 42 67
30–34 21 26 46 41 52 93
35–39 35 35 70 70 70 140
40–44 64 51 115 128 101 229
45–49 105 74 179 211 148 359
50–54 158 109 267 316 218 533
55–59 215 153 368 430 307 737
60–64 289 208 497 577 416 993
65–69 336 253 589 672 506 1 178
70–74 356 282 638 712 564 1 276
75–79 355 296 651 710 593 1 303
80–84 311 270 582 623 541 1 163
85–89 247 230 477 495 460 955
90+ 144 131 275 288 263 550
TOTAL 2 674 2 177 4 851 5 349 4 354 9 703
Italy
0–4 1 1 2 9 7 16
5–9 1 1 2 8 7 14
10–14 1 1 2 8 8 15
15–19 2 3 5 15 22 36
20–24 3 5 8 19 38 56
25–29 4 7 10 27 46 73
30–34 6 8 15 45 57 102
35–39 11 11 22 76 77 152
40–44 20 16 36 140 111 250
45–49 33 23 56 230 162 392
50–54 49 34 83 344 238 582
55–59 67 48 115 469 335 804
60–64 90 65 155 630 454 1 084
65–69 105 79 184 734 552 1 286
70–74 111 88 199 777 616 1 393
75–79 111 92 203 775 647 1 422
80–84 97 84 181 680 590 1 270
85–89 77 72 149 540 502 1 042
90+ 45 41 86 314 287 601
TOTAL 834 679 1 513 5 838 4 752 10 591
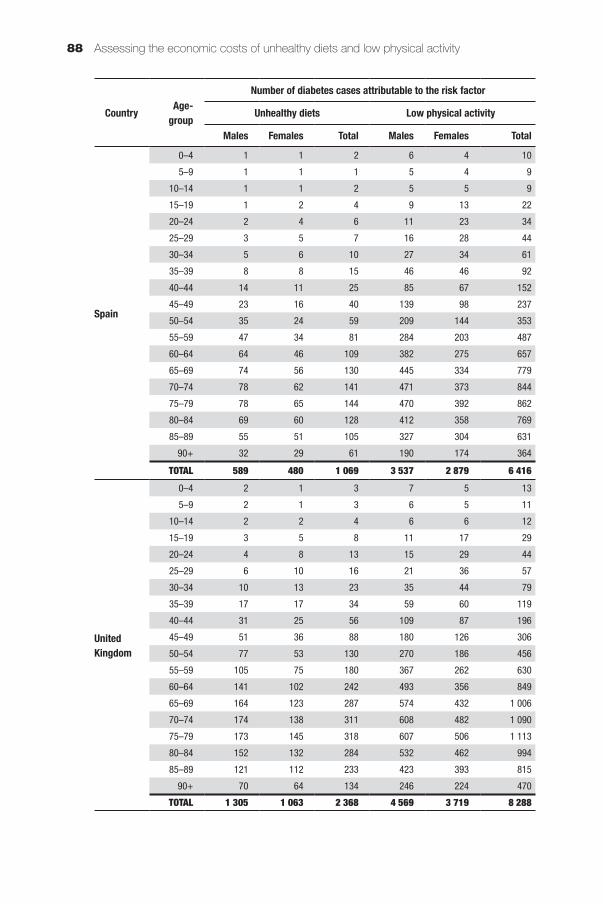
Assessing the economic costs of unhealthy diets and low physical activity88
Country Age-group
Number of diabetes cases attributable to the risk factor
Unhealthy diets Low physical activity
Males Females Total Males Females Total
Spain
0–4 1 1 2 6 4 10
5–9 1 1 1 5 4 9
10–14 1 1 2 5 5 9
15–19 1 2 4 9 13 22
20–24 2 4 6 11 23 34
25–29 3 5 7 16 28 44
30–34 5 6 10 27 34 61
35–39 8 8 15 46 46 92
40–44 14 11 25 85 67 152
45–49 23 16 40 139 98 237
50–54 35 24 59 209 144 353
55–59 47 34 81 284 203 487
60–64 64 46 109 382 275 657
65–69 74 56 130 445 334 779
70–74 78 62 141 471 373 844
75–79 78 65 144 470 392 862
80–84 69 60 128 412 358 769
85–89 55 51 105 327 304 631
90+ 32 29 61 190 174 364
TOTAL 589 480 1 069 3 537 2 879 6 416
United Kingdom
0–4 2 1 3 7 5 13
5–9 2 1 3 6 5 11
10–14 2 2 4 6 6 12
15–19 3 5 8 11 17 29
20–24 4 8 13 15 29 44
25–29 6 10 16 21 36 57
30–34 10 13 23 35 44 79
35–39 17 17 34 59 60 119
40–44 31 25 56 109 87 196
45–49 51 36 88 180 126 306
50–54 77 53 130 270 186 456
55–59 105 75 180 367 262 630
60–64 141 102 242 493 356 849
65–69 164 123 287 574 432 1 006
70–74 174 138 311 608 482 1 090
75–79 173 145 318 607 506 1 113
80–84 152 132 284 532 462 994
85–89 121 112 233 423 393 815
90+ 70 64 134 246 224 470
TOTAL 1 305 1 063 2 368 4 569 3 719 8 288
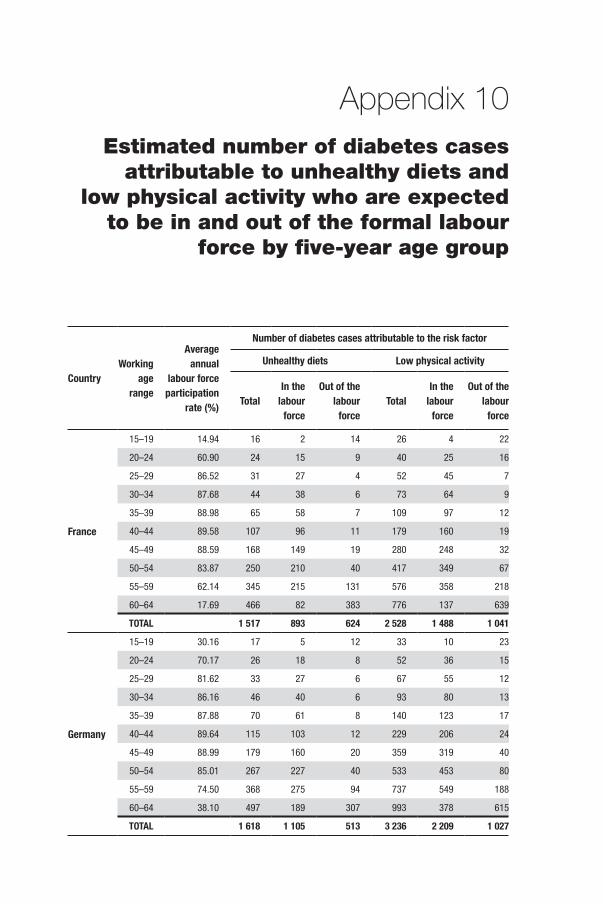
Appendix 10Estimated number of diabetes cases
attributable to unhealthy diets and low physical activity who are expected
to be in and out of the formal labour force by five-year age group
CountryWorking
age range
Average annual
labour force participation
rate (%)
Number of diabetes cases attributable to the risk factor
Unhealthy diets Low physical activity
TotalIn the
labour force
Out of the labour
forceTotal
In the labour
force
Out of the labour
force
France
15–19 14.94 16 2 14 26 4 22
20–24 60.90 24 15 9 40 25 16
25–29 86.52 31 27 4 52 45 7
30–34 87.68 44 38 6 73 64 9
35–39 88.98 65 58 7 109 97 12
40–44 89.58 107 96 11 179 160 19
45–49 88.59 168 149 19 280 248 32
50–54 83.87 250 210 40 417 349 67
55–59 62.14 345 215 131 576 358 218
60–64 17.69 466 82 383 776 137 639
TOTAL 1 517 893 624 2 528 1 488 1 041
Germany
15–19 30.16 17 5 12 33 10 23
20–24 70.17 26 18 8 52 36 15
25–29 81.62 33 27 6 67 55 12
30–34 86.16 46 40 6 93 80 13
35–39 87.88 70 61 8 140 123 17
40–44 89.64 115 103 12 229 206 24
45–49 88.99 179 160 20 359 319 40
50–54 85.01 267 227 40 533 453 80
55–59 74.50 368 275 94 737 549 188
60–64 38.10 497 189 307 993 378 615
TOTAL 1 618 1 105 513 3 236 2 209 1 027
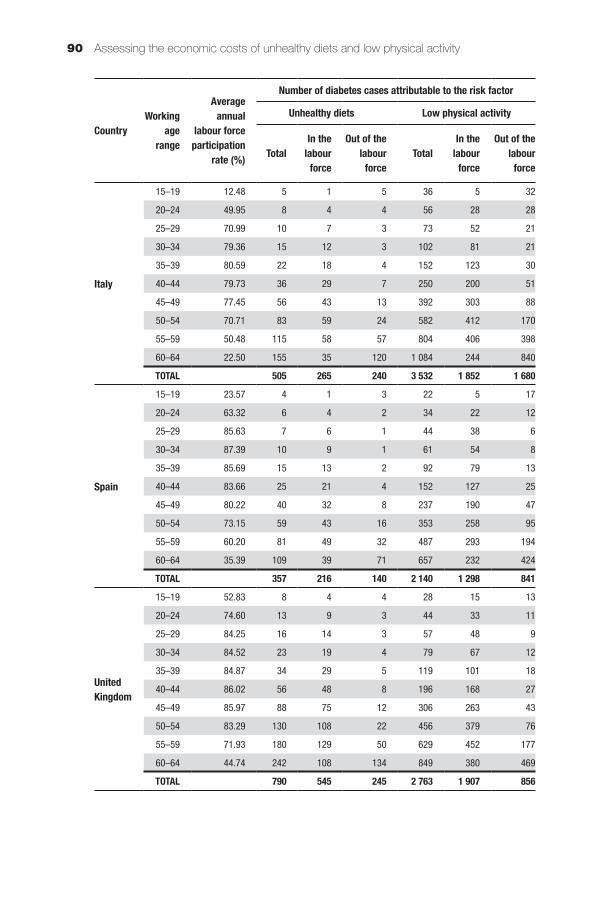
Assessing the economic costs of unhealthy diets and low physical activity90
CountryWorking
age range
Average annual
labour force participation
rate (%)
Number of diabetes cases attributable to the risk factor
Unhealthy diets Low physical activity
TotalIn the
labour force
Out of the labour
forceTotal
In the labour
force
Out of the labour
force
Italy
15–19 12.48 5 1 5 36 5 32
20–24 49.95 8 4 4 56 28 28
25–29 70.99 10 7 3 73 52 21
30–34 79.36 15 12 3 102 81 21
35–39 80.59 22 18 4 152 123 30
40–44 79.73 36 29 7 250 200 51
45–49 77.45 56 43 13 392 303 88
50–54 70.71 83 59 24 582 412 170
55–59 50.48 115 58 57 804 406 398
60–64 22.50 155 35 120 1 084 244 840
TOTAL 505 265 240 3 532 1 852 1 680
Spain
15–19 23.57 4 1 3 22 5 17
20–24 63.32 6 4 2 34 22 12
25–29 85.63 7 6 1 44 38 6
30–34 87.39 10 9 1 61 54 8
35–39 85.69 15 13 2 92 79 13
40–44 83.66 25 21 4 152 127 25
45–49 80.22 40 32 8 237 190 47
50–54 73.15 59 43 16 353 258 95
55–59 60.20 81 49 32 487 293 194
60–64 35.39 109 39 71 657 232 424
TOTAL 357 216 140 2 140 1 298 841
United Kingdom
15–19 52.83 8 4 4 28 15 13
20–24 74.60 13 9 3 44 33 11
25–29 84.25 16 14 3 57 48 9
30–34 84.52 23 19 4 79 67 12
35–39 84.87 34 29 5 119 101 18
40–44 86.02 56 48 8 196 168 27
45–49 85.97 88 75 12 306 263 43
50–54 83.29 130 108 22 456 379 76
55–59 71.93 180 129 50 629 452 177
60–64 44.74 242 108 134 849 380 469
TOTAL 790 545 245 2 763 1 907 856
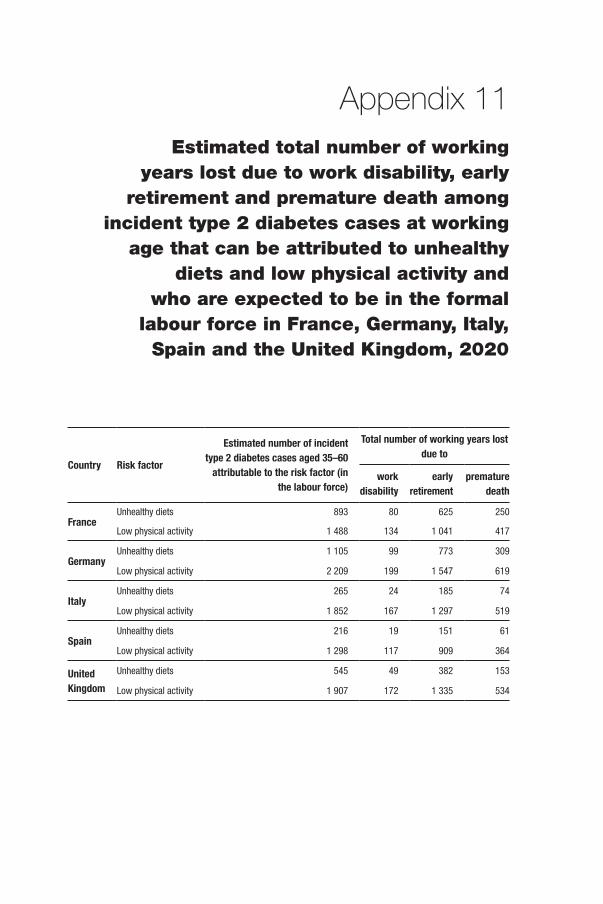
Appendix 11Estimated total number of working
years lost due to work disability, early retirement and premature death among
incident type 2 diabetes cases at working age that can be attributed to unhealthy
diets and low physical activity and who are expected to be in the formal
labour force in France, Germany, Italy, Spain and the United Kingdom, 2020
Country Risk factor
Estimated number of incident type 2 diabetes cases aged 35–60
attributable to the risk factor (in the labour force)
Total number of working years lost due to
work disability
early retirement
premature death
FranceUnhealthy diets 893 80 625 250
Low physical activity 1 488 134 1 041 417
GermanyUnhealthy diets 1 105 99 773 309
Low physical activity 2 209 199 1 547 619
ItalyUnhealthy diets 265 24 185 74
Low physical activity 1 852 167 1 297 519
SpainUnhealthy diets 216 19 151 61
Low physical activity 1 298 117 909 364
United Kingdom
Unhealthy diets 545 49 382 153
Low physical activity 1 907 172 1 335 534


ISB
N 9289050425
97
89
28
90
50
42
5
Health Policy Series No. 47www.healthobservatory.eu
Hea
lth
Polic
yS
erie
s
47
AN
EVID
EN
CE
RE
VIEW
AN
D P
RO
PO
SE
D FR
AM
EW
OR
K
47
Assessing the economic costs ofunhealthy diets andlow physical activity
Christine Joy Candari
Jonathan Cylus
Ellen Nolte
An evidence review and proposed framework
Unhealthy diets and low physical activity contribute to many chronic diseases and disability; they are responsible for some 2 in 5 deaths worldwide and for about 30% ofthe global disease burden. Yet surprisingly little is known about the economic costs thatthese risk factors cause, both for health care and society more widely.
This study pulls together the evidence about the economic burden that can be linked tounhealthy diets and low physical activity and explores
• How definitions vary and why this matters
• The complexity of estimating the economic burden and
• How we can arrive at a better way to estimate the costs of an unhealthy diet and lowphysical activity, using diabetes as an example
The review finds that unhealthy diets and low physical activity predict higher health careexpenditure, but estimates vary greatly. Existing studies underestimate the true economicburden because most only look at the costs to the health system. Indirect costs causedby lost productivity may be about twice as high as direct health care costs, together accounting for about 0.5% of national income.
The study also tests the feasibility of using a disease-based approach to estimate thecosts of unhealthy diets and low physical activity in Europe, projecting the total economicburden associated with these two risk factors as manifested in new type 2 diabetes casesat €883 million in 2020 for France, Germany, Italy, Spain and the United Kingdom alone.The ‘true’ costs will be higher, as unhealthy diets and low physical activity are linked tomany more diseases.
The study’s findings are a step towards a better understanding of the economic burdenthat can be associated with two key risk factors for ill health and they will help policy-makers in setting priorities and to more effectively promoting healthy diets and physicalactivity.
The authors
Christine Joy Candari was an independent consultant at the time of writing this report.She is currently Chief Consultant for Health Research, U Consult Us Inc, Manila, ThePhilippines
Jonathan Cylus is Research Fellow, European Observatory on Health Systems and Policies, London School of Economics and Political Science
Ellen Nolte is Head of London Hubs, European Observatory on Health Systems and Policies
AS
SE
SS
ING
THE
EC
ON
OM
IC C
OS
TS O
F UN
HE
ALTH
YD
IETS
AN
D LO
W P
HYS
ICA
L ACTIVITY
Ch
ristin
e J
oy
Ca
nd
ari, J
on
ath
an
Cy
lus
, Elle
n N
olte
Cover_WHO_nr47_Mise en page 1 13/06/17 13:21 Page 1