“Assessing pig damage in agricultural crops with remote ... · “Assessing pig damage in...
17
BUREAU OF RURAL SCIENCES AUSTRALIAN PEST ANIMAL MANAGEMENT PROGRAM FINAL REPORT “Assessing pig damage in agricultural crops with remote sensing” Matt Gentle 1 , Stuart Phinn 2 and James Speed 1 1 Robert Wicks Pest Animal Research Centre, Biosecurity Queensland, Department of Employment, Economic Development and Innovation, Queensland, Australia. 2 Centre for Spatial Environmental Research, School of Geography, Planning and Environmental Management, University of Queensland, Brisbane, Queensland, Australia. January 2011
Transcript of “Assessing pig damage in agricultural crops with remote ... · “Assessing pig damage in...

BUREAU OF RURAL SCIENCES
AUSTRALIAN PEST ANIMAL MANAGEMENT PROGRAM
FINAL REPORT
“Assessing pig damage in agricultural crops with remote sensing”
Matt Gentle1, Stuart Phinn2 and James Speed1
1Robert Wicks Pest Animal Research Centre, Biosecurity Queensland, Department of
Employment, Economic Development and Innovation, Queensland, Australia.
2Centre for Spatial Environmental Research, School of Geography, Planning and
Environmental Management, University of Queensland, Brisbane, Queensland, Australia.
January 2011
Robert Wicks Animal Research Centre, Biosecurity Queensland
2
TABLE OF CONTENTS
SUMMARY ............................................................................................................................................. 3 INTRODUCTION .................................................................................................................................. 4 OBJECTIVES ......................................................................................................................................... 5 METHODS .............................................................................................................................................. 5
FIELD ASSESSMENTS............................................................................................................................... 5 IMAGE CAPTURE .................................................................................................................................... 7 IMAGE ANALYSES.................................................................................................................................... 7
RESULTS ................................................................................................................................................ 8 IMAGE CAPTURE .................................................................................................................................... 8 IMAGE ANALYSES ................................................................................................................................... 9 PROGRESS TOWARD MILESTONES ............................................................................................................ 9
DISCUSSION ........................................................................................................................................ 10 RECOMMENDATIONS ..................................................................................................................... 11 REFERENCES ..................................................................................................................................... 12 APPENDIX 1 ........................................................................................................................................ 13

AMPMP Final Report – Remote sensing feral pig damage
3
SUMMARY
• This project aimed to determine whether areas of damage sustained to wheat crops by feral pigs could be identified using remote sensing.
• We have undertaken a number of field assessments of wheat crops (32 crops were assessed in the winter 2009 growing season) to identify damage by feral pigs. Although time limited the assessment of other crops in the study area, many other crops within the study area are either largely unaffected by feral pigs (e.g. cotton) or are typically planted at a low plant density/ or high row spacing (e.g. sorghum), making them largely unsuitable for assessment by remote sensing.
• Spatial data were collected from assessed paddocks, in addition to other data relating to damage (patch size and intensity of damage).
• We identified what imagery were most suitable for the required resolution - Quickbird with 0.7 m x 0.7 m pixel resolution, consisting of artificially enhanced multi-spectral imagery initially collected at 2.4 m x 2.4 m pixels.
• There were significant constraints in obtaining imagery at the appropriate time - given the narrow timeframe available for data capture as dictated by satellite coverage. Nevertheless, we were able to capture imagery for two field assessment areas.
• The field survey data and corresponding spatial data were supplied to the University of Queensland for analyses. Analyses undertaken in GIS (overlay of survey points on imagery) could not accurately detect, let alone identify and classify pig damage.
• We conclude that it was not feasible to identify pig damage in wheat in the study area. This is probably due to a combination of the lack of distinguishing features in damaged vs undamaged areas, the similarity of variations in crop structure produced by topography/drainage to pig damage, and was exacerbated by the lack of suitable technology/imagery at the time of the study.
• Further studies assessing pig damage in wheat should be considered only if new advancements in imagery (inclusion of middle-infrared bands) or analyses show potential of determining such damage. Current approaches may be applicable to other crops and/or landscapes not assessed in this project.

Robert Wicks Animal Research Centre, Biosecurity Queensland
4
Introduction
Feral pigs are known to cause in excess of $100 million in lost agricultural production in Australia per annum (McLeod 2004). The true cost is unknown and varies temporally and spatially. Nevertheless, this cost triggers control; the cost of which should be allocated relative to the benefit that accrues. Pigs can damage almost all crops from sowing to harvest, starting with uprooting seed and seedlings to feeding on or trampling mature crops (see Figure 1). They can cause severe damage to most seed and grain crops, especially wheat, barley and sorghum.
Figure 1: Typical feral pig damage to a ripening wheat crop.
There is a strong need for better estimates of feral pig damage to grain crops to determine:
• in general terms, the cost of feral pigs to the grain industry and so aid appropriate allocation of resources to pig control
• at a property level, whether damage is above threshold values for which control is justified
• relationships between damage, pig density and spatial and temporal aspects of the environment, and thus to refine the timing and location of management action
• the effectiveness of control campaigns, based not on reducing numbers (which is a typical frustration in pest management), but on reducing damage (which is the ultimate goal).
Current methods to determine levels of damage rely upon landholder surveys or intensive and costly scientific, direct field assessments. Surveys of landholders usually provide an indication of the level of damage perceived by landholders rather than actual measurements.

AMPMP Final Report – Remote sensing feral pig damage
5
The relationship between this subjective and usually qualitative measure and actual damage is unknown. However, damage can be considerable even when pig density is relatively low. Recent quantitative assessments in southern Queensland have recorded average production losses of $19 ha-1 in a sample of 32 sorghum crops from feral pigs (Gentle unpublished data). This required three months of ground surveys by a number of field personnel. Such methods are not practical for broad-scale assessments of damage.
An earlier study by Caley (1993) investigated feral pig damage to sorghum and maize crops in the Northern Territory using a combination of exclosures and visual assessments to determine damage. Although these techniques were suitable for assessing damage to grain crops, Caley (1993) recommended that future studies should use aerial photography to quantify pig damage in sorghum crops. The use of satellite imagery is a logical extension of this recommendation.
This project aims to assess the use of remote sensing and geographic information systems (GIS) to quantify the damage to grain crops from feral pigs. Satellite imagery offers the potential of determining the nature, extent and location of damage, and potentially, its relationship with likely aspects of the environment.
Objectives This project aims to assess the use of satellite imagery and GIS to measure feral pig damage. The key objectives of the project are to:
1. Undertake field assessments of crops to identify and spatially-map areas of pig damage;
2. Investigate methods for using satellite imagery and/or aerial photography to determine the extent of pig damage on grain crops;
3. Given the success of objective 2, construct and validate a model to define pig damage from all available field data sets;
4. Communicate progress and findings on the application of remote sensing to feral pig damage assessment to stakeholders and scientific audience.
Methods
Field assessments Crops were surveyed on the ground for feral pig damage. Paddocks targeted included those known to have historically suffered high levels of pig damage. The location (using a GPS), areal size and intensity of damage within this area (e.g. 80% loss) were recorded, along with species responsible for the damage. This data were used to establish all characteristics of feral pig damage in crops, including the location and size distribution of pig damage. Such information, in turn, is used to specify a minimum mapping unit and required image pixel size suitable for pig damage mapping. To determine the mapping approach, we formulated the following steps:
1. Assess the size distribution of pig damage from existing field survey data;
2. Use the results from the size distribution analysis to specify a suitable minimum mapping unit and required image pixel size (select suitable image data from available government archive SPOT, Ikonos, Quickbird, Geoeye);
3. Select suitable trial sites with access to suitable scale archival and current image data sets, and field survey data;

Robert Wicks Animal Research Centre, Biosecurity Queensland
6
4. Establish all characteristics of feral pig damage in crops, in addition to size distribution to set up a mapping approach for use with the image data selected for the project;
5. Develop a trial image mapping approach to identify feral pig damage;
6. Acquire and pre-process current and archival satellite image data to a level suited for pig damage mapping;
7. Apply trial mapping approach to sites with archival image and field survey data, to produce and validate a map, and then refine the approach;
8. Apply final approach to all data and over the entire time series;
9. Apply change detection techniques to identify areas of pig damage over time (PCA, NDVI difference, Post classification comparison, and multi-date classification);
10. Validate change detection;
11. Provide final assessment of suitable image data and processing approach;
After viewing data from historical field assessments, the relatively small size of damaged area became apparent (Figure 2). As a result, the Landsat and SPOT imagery would be largely unsuitable to identify the majority of damage patches (i.e. insufficient resolution to determine area damaged). The choice of imagery was, by default, narrowed to two choices, IKONOS and Quickbird. Both present high quality imagery, but Quickbird offered the highest resolution image (0.6m x 0.6m pixels vs 1m x 1m IKONOS both only in black and white panchromatic). Our presumption was the greater the spatial resolution, the higher the probability of detecting and identifying pig damage.
0
5
10
15
20
25
30
35
0-1
1.1
- 2
2.1
- 3
3.1
- 4
4.1
- 5
5.1
- 66.
1 - 1
010
.1-15
16 -
20
21 -
25
26 -
50
51-1
00
>100
Area damaged (m2)
Perc
enta
ge o
f are
as s
urve
yed
Figure 2: Frequency of various classes describing the area damaged by feral pigs across all assessed wheat paddocks in southern Qld, November 2008.
AMPMP Final Report – Remote sensing feral pig damage
7
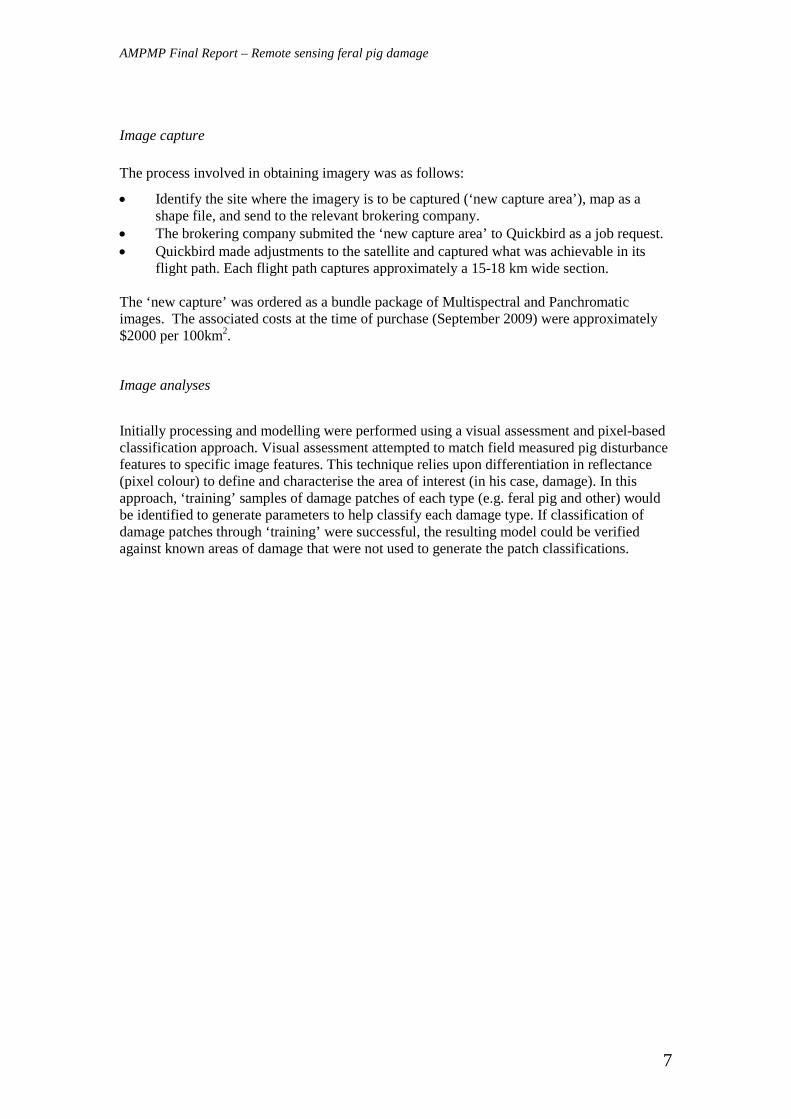
Image capture The process involved in obtaining imagery was as follows:
• Identify the site where the imagery is to be captured (‘new capture area’), map as a shape file, and send to the relevant brokering company.
• The brokering company submited the ‘new capture area’ to Quickbird as a job request. • Quickbird made adjustments to the satellite and captured what was achievable in its
flight path. Each flight path captures approximately a 15-18 km wide section. The ‘new capture’ was ordered as a bundle package of Multispectral and Panchromatic images. The associated costs at the time of purchase (September 2009) were approximately $2000 per 100km2.
Image analyses
Initially processing and modelling were performed using a visual assessment and pixel-based classification approach. Visual assessment attempted to match field measured pig disturbance features to specific image features. This technique relies upon differentiation in reflectance (pixel colour) to define and characterise the area of interest (in his case, damage). In this approach, ‘training’ samples of damage patches of each type (e.g. feral pig and other) would be identified to generate parameters to help classify each damage type. If classification of damage patches through ‘training’ were successful, the resulting model could be verified against known areas of damage that were not used to generate the patch classifications.

Robert Wicks Animal Research Centre, Biosecurity Queensland
8
Results Field assessments We completed a number of field assessments of wheat crops (32 crops were assessed in the winter 2009 growing season) to identify damage by feral pigs. The available field survey time limited the assessment to wheat crops in the study area. However, many other crops were unsuitable for this study due to: 1) they are reportedly largely unaffected by feral pig damage within the study area (e.g. cotton) or 2) they are typically planted at a low plant density/ or high row spacing (e.g. sorghum) reducing the potential for damage in patches. Without visible damage in patches it would be difficult with current technology to identify such damage to crops.
Figure 2: Typical feral pig damage to a wheat crop as seen pre-harvest.
Image capture While six field sites were available for image capture, a maximum of three sites and subsequent images could be ordered from the company at any given time. Images needed to be captured as close as possible prior to harvest but following field assessments. This also allowed as much potential damage to be caused by pigs as possible to the crop. Generally a 4 - 6 week period was required by the imagery supplier (brokerage company) to guarantee image capture (e.g. due to competing job requests, capture opportunities only every 4-5 days, cloud cover can reduce clarity of image). Assessments were completed to allow imagery to be recorded post- field damage assessments but prior to crop harvest. Due to the necessary pre-order time, only two of the three sites were successfully captured.
AMPMP Final Report – Remote sensing feral pig damage
9
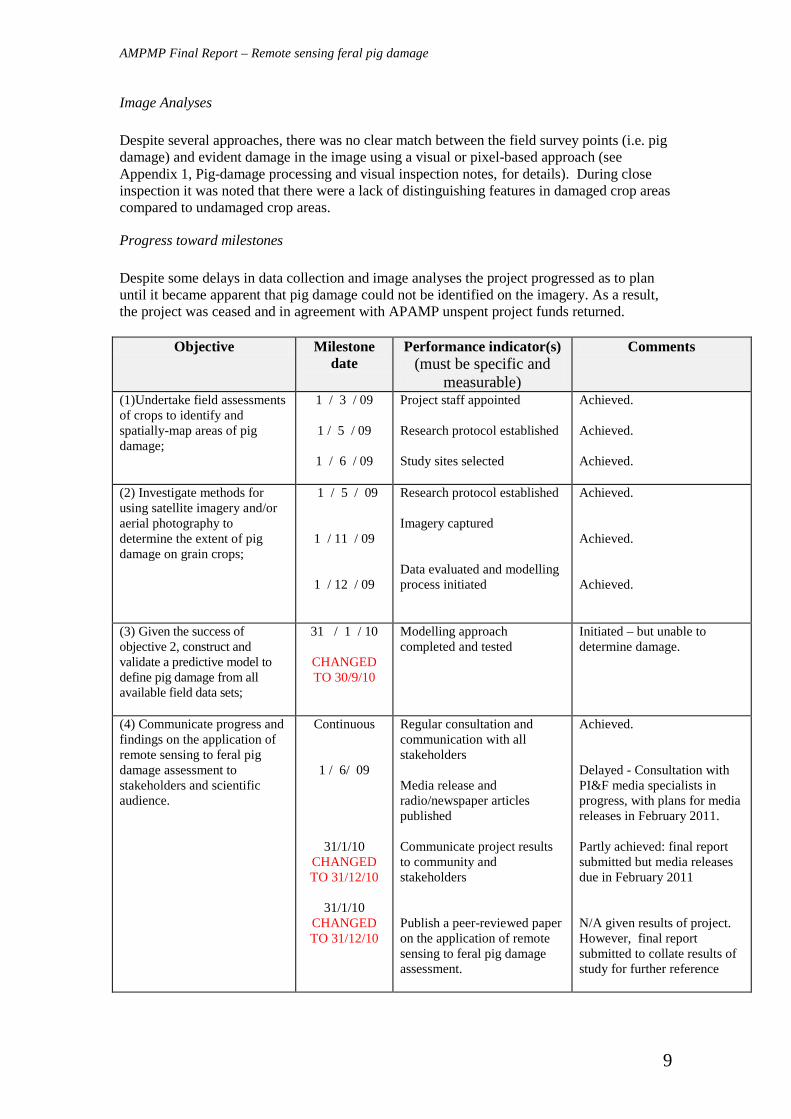
Image Analyses Despite several approaches, there was no clear match between the field survey points (i.e. pig damage) and evident damage in the image using a visual or pixel-based approach (see Appendix 1, Pig-damage processing and visual inspection notes, for details). During close inspection it was noted that there were a lack of distinguishing features in damaged crop areas compared to undamaged crop areas.
Progress toward milestones Despite some delays in data collection and image analyses the project progressed as to plan until it became apparent that pig damage could not be identified on the imagery. As a result, the project was ceased and in agreement with APAMP unspent project funds returned.
Objective Milestone date
Performance indicator(s) (must be specific and
measurable)
Comments
(1)Undertake field assessments of crops to identify and spatially-map areas of pig damage;
1 / 3 / 09
1 / 5 / 09
1 / 6 / 09
Project staff appointed Research protocol established Study sites selected
Achieved. Achieved. Achieved.
(2) Investigate methods for using satellite imagery and/or aerial photography to determine the extent of pig damage on grain crops;
1 / 5 / 09
1 / 11 / 09
1 / 12 / 09
Research protocol established Imagery captured Data evaluated and modelling process initiated
Achieved. Achieved. Achieved.
(3) Given the success of objective 2, construct and validate a predictive model to define pig damage from all available field data sets;
31 / 1 / 10
CHANGED TO 30/9/10
Modelling approach completed and tested
Initiated – but unable to determine damage.
(4) Communicate progress and findings on the application of remote sensing to feral pig damage assessment to stakeholders and scientific audience.
Continuous
1 / 6/ 09
31/1/10 CHANGED TO 31/12/10
31/1/10
CHANGED TO 31/12/10
Regular consultation and communication with all stakeholders Media release and radio/newspaper articles published Communicate project results to community and stakeholders Publish a peer-reviewed paper on the application of remote sensing to feral pig damage assessment.
Achieved. Delayed - Consultation with PI&F media specialists in progress, with plans for media releases in February 2011. Partly achieved: final report submitted but media releases due in February 2011 N/A given results of project. However, final report submitted to collate results of study for further reference
Robert Wicks Animal Research Centre, Biosecurity Queensland
10
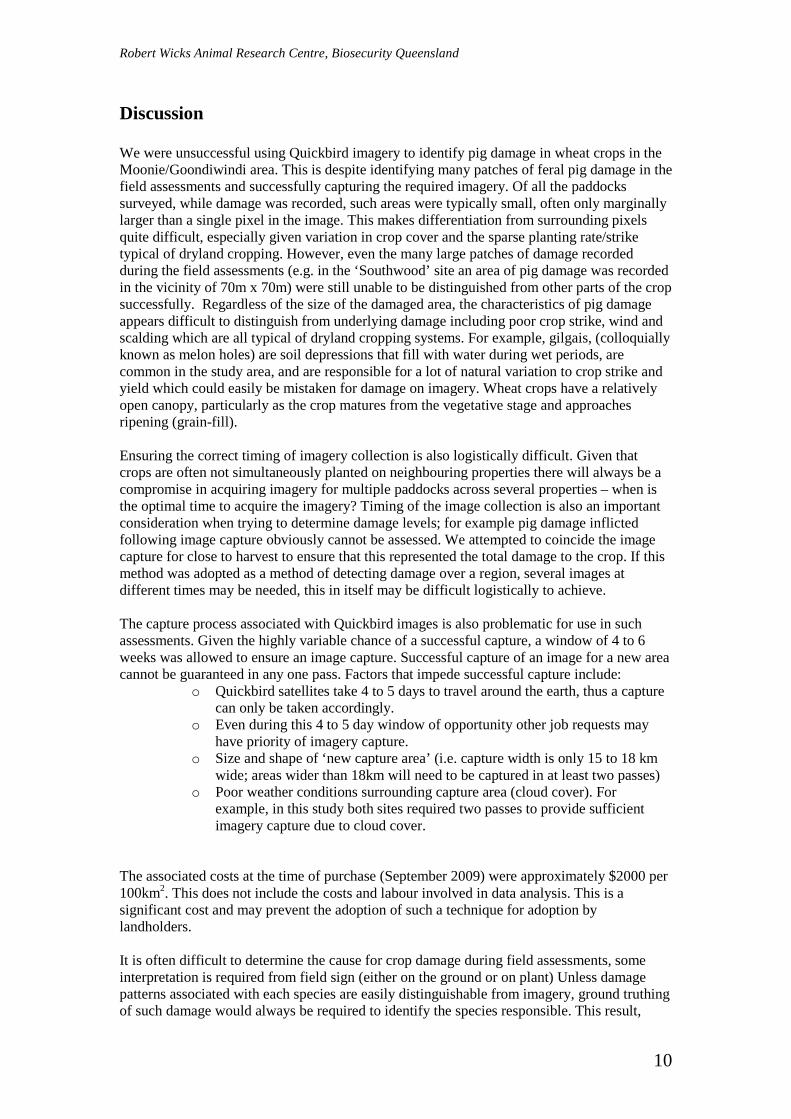
Discussion We were unsuccessful using Quickbird imagery to identify pig damage in wheat crops in the Moonie/Goondiwindi area. This is despite identifying many patches of feral pig damage in the field assessments and successfully capturing the required imagery. Of all the paddocks surveyed, while damage was recorded, such areas were typically small, often only marginally larger than a single pixel in the image. This makes differentiation from surrounding pixels quite difficult, especially given variation in crop cover and the sparse planting rate/strike typical of dryland cropping. However, even the many large patches of damage recorded during the field assessments (e.g. in the ‘Southwood’ site an area of pig damage was recorded in the vicinity of 70m x 70m) were still unable to be distinguished from other parts of the crop successfully. Regardless of the size of the damaged area, the characteristics of pig damage appears difficult to distinguish from underlying damage including poor crop strike, wind and scalding which are all typical of dryland cropping systems. For example, gilgais, (colloquially known as melon holes) are soil depressions that fill with water during wet periods, are common in the study area, and are responsible for a lot of natural variation to crop strike and yield which could easily be mistaken for damage on imagery. Wheat crops have a relatively open canopy, particularly as the crop matures from the vegetative stage and approaches ripening (grain-fill). Ensuring the correct timing of imagery collection is also logistically difficult. Given that crops are often not simultaneously planted on neighbouring properties there will always be a compromise in acquiring imagery for multiple paddocks across several properties – when is the optimal time to acquire the imagery? Timing of the image collection is also an important consideration when trying to determine damage levels; for example pig damage inflicted following image capture obviously cannot be assessed. We attempted to coincide the image capture for close to harvest to ensure that this represented the total damage to the crop. If this method was adopted as a method of detecting damage over a region, several images at different times may be needed, this in itself may be difficult logistically to achieve. The capture process associated with Quickbird images is also problematic for use in such assessments. Given the highly variable chance of a successful capture, a window of 4 to 6 weeks was allowed to ensure an image capture. Successful capture of an image for a new area cannot be guaranteed in any one pass. Factors that impede successful capture include:
o Quickbird satellites take 4 to 5 days to travel around the earth, thus a capture can only be taken accordingly.
o Even during this 4 to 5 day window of opportunity other job requests may have priority of imagery capture.
o Size and shape of ‘new capture area’ (i.e. capture width is only 15 to 18 km wide; areas wider than 18km will need to be captured in at least two passes)
o Poor weather conditions surrounding capture area (cloud cover). For example, in this study both sites required two passes to provide sufficient imagery capture due to cloud cover.
The associated costs at the time of purchase (September 2009) were approximately $2000 per 100km2. This does not include the costs and labour involved in data analysis. This is a significant cost and may prevent the adoption of such a technique for adoption by landholders. It is often difficult to determine the cause for crop damage during field assessments, some interpretation is required from field sign (either on the ground or on plant) Unless damage patterns associated with each species are easily distinguishable from imagery, ground truthing of such damage would always be required to identify the species responsible. This result,
AMPMP Final Report – Remote sensing feral pig damage
11
when combined with the cost, analyses difficulties, practicalities and logistical issues with data collection, indicates that using satellite imagery currently has serious deficiencies for assessing feral pig damage.
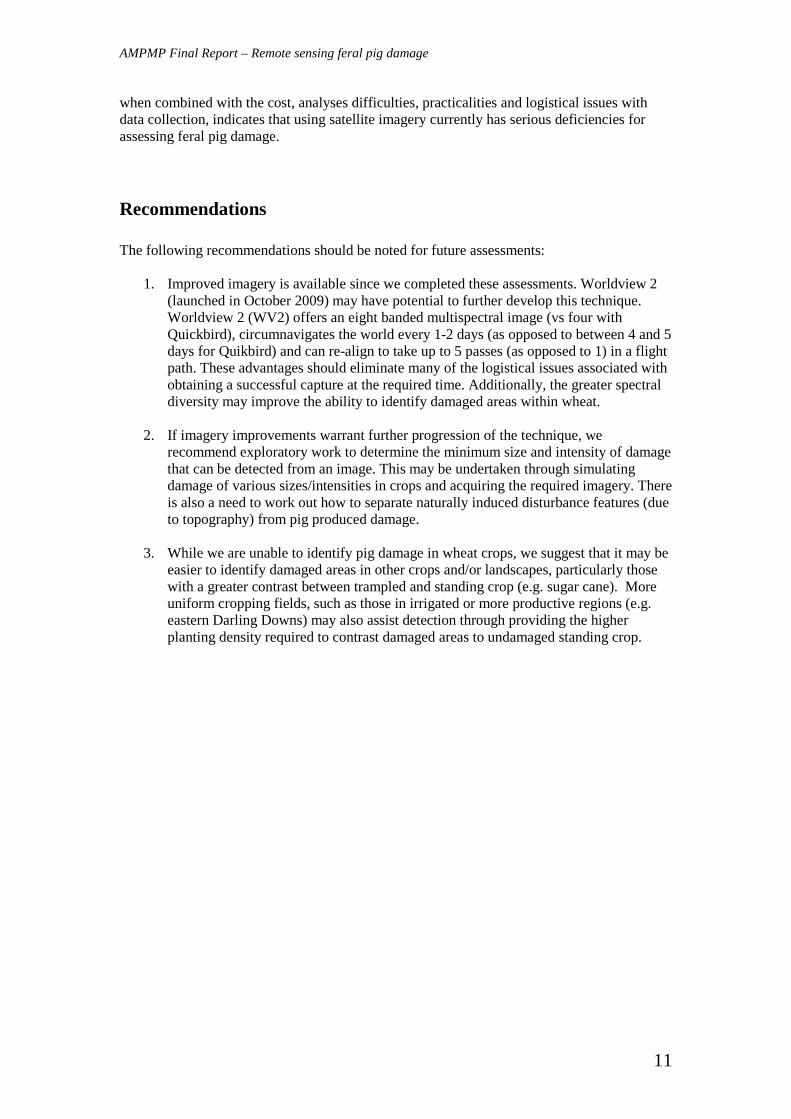
Recommendations The following recommendations should be noted for future assessments:
1. Improved imagery is available since we completed these assessments. Worldview 2 (launched in October 2009) may have potential to further develop this technique. Worldview 2 (WV2) offers an eight banded multispectral image (vs four with Quickbird), circumnavigates the world every 1-2 days (as opposed to between 4 and 5 days for Quikbird) and can re-align to take up to 5 passes (as opposed to 1) in a flight path. These advantages should eliminate many of the logistical issues associated with obtaining a successful capture at the required time. Additionally, the greater spectral diversity may improve the ability to identify damaged areas within wheat.
2. If imagery improvements warrant further progression of the technique, we
recommend exploratory work to determine the minimum size and intensity of damage that can be detected from an image. This may be undertaken through simulating damage of various sizes/intensities in crops and acquiring the required imagery. There is also a need to work out how to separate naturally induced disturbance features (due to topography) from pig produced damage.
3. While we are unable to identify pig damage in wheat crops, we suggest that it may be
easier to identify damaged areas in other crops and/or landscapes, particularly those with a greater contrast between trampled and standing crop (e.g. sugar cane). More uniform cropping fields, such as those in irrigated or more productive regions (e.g. eastern Darling Downs) may also assist detection through providing the higher planting density required to contrast damaged areas to undamaged standing crop.

Robert Wicks Animal Research Centre, Biosecurity Queensland
12
References
Caley, P. (1993) The ecology and management of feral pigs in the 'wet-dry' tropics of the Northern Territory. Unpublished Master of Applied Science thesis, University of Canberra, Canberra.
McLeod, R. (2004) Counting the Cost: Impact of Invasive Animals in Australia, Pest Animal Control Cooperative Research Centre, Canberra.
AMPMP Final Report – Remote sensing feral pig damage
13
Appendix 1
Example of analyses conducted by the University of Queensland
Pig-damage processing and visual inspection notes – Southwood Quickbird image and field data Image: 09SEP26001742-M2AS_R1C2-052248929010_01_P003.TIF Field survey data: Daisy_Southwood_Assessments.shp Description of Process:
1) All Quickbird multispectral (2.4 m pixel) files were opened and displayed. They shapefile (Daisy_Southwood_Assessments.shp) with all field survey data was then displayed on top of the images and used to select the image tile with most survey points and most variety of impacts.
2) The 09SEP26001742-M2AS_R1C2-052248929010_01_P003.TIF09SEP26001742-M2AS_R1C2-052248929010_01_P003.TIF image was selected for further analysis and all survey points were displayed on top of this. As there was no clear match between survey points and evident damage in the image the image was re-projected to match the datum of the field survey points.
3) The reprojected image and field survey data locations of pig grazing impacts still did not match after the re-projection. Later confirmation revealed that data points were correct and reprojection were not necessary.
4) Each field survey point within 09SEP26001742-M2AS_R1C2-052248929010_01_P003.TIF was highlighted one at a time to identify the impacted areas of ground corresponding to each recorded pig damage incident. It was impossible to match field survey to areas of evident damage on the image.
5) The damage to fields evident on the Quickbird-2 multi-spectral image 09SEP26001742-M2AS_R1C2-052248929010_01_P003.TIF, ranged from 1 to 20-30 pixels wide. Each impact site appear to represent and area where the wheat canopy has been pushed down or removed and the bare ground is left open and dried in some cases. Further work is needed to develop and validate a mapping approach for these features, however that should be relative straightforward and could use per-pixel or object based mapping. However, later confirmation revealed that these areas were gilgais, or areas of bare ground where the crop did not strike. These are a feature of soils in the study area and do not result from any pig activity.

Robert Wicks Animal Research Centre, Biosecurity Queensland
14
Full image tile used for 09SEP26001742-M2AS_R1C2-052248929010_01_P003.TIF

AMPMP Final Report – Remote sensing feral pig damage
15
Zoomed in subset of 09SEP26001742-M2AS_R1C2-052248929010_01_P003.TIF, showing the field data overlaid on the Quickbird 2 multispectral data with 2.4 m pixels. Significant “holes” are evident across the wheat canopy. The field data do not match up to any form of impact. Initially this was thought to be most likely due to mis-registration problems between the data sets. However, later clarification indicates that the data points were correct but did not coincide with any imagery.

Robert Wicks Animal Research Centre, Biosecurity Queensland
16
Zoomed in subset of 09SEP26001742-M2AS_R1C2-052248929010_01_P003.TIF southern section showing location of pig damage and gilgais.

AMPMP Final Report – Remote sensing feral pig damage
17
Zoomed in subset of 09SEP26001742-M2AS_R1C2-052248929010_01_P003.TIF, a single band vegetation index image at 2.4 m pixels.