Assembly Equipment Integration for Production control ... · Assembly Equipment Integration for...
95
Assembly Equipment Integration for Production control - Current System Architectures and Opportunities Ellinor Lindström Isa Nedersjö MG202X Master of Science Thesis, Industrial Engineering and Management 2017-06-14 Stockholm
Transcript of Assembly Equipment Integration for Production control ... · Assembly Equipment Integration for...
Assembly Equipment Integration for Production control - Current System
Architectures and Opportunities
Ellinor Lindström Isa Nedersjö
MG202X Master of Science Thesis,
Industrial Engineering and Management
2017-06-14 Stockholm

i
Master of Science Thesis Industrial Engineering and Management MG202X
Assembly equipment integration for production control- current landscape and opportunities
Ellinor Lindström
Isa Nedersjö
Approved
Examiner
Supervisor
Commissioner
Contact person
Abstract
The current manufacturing trend is evolving towards a higher degree of automation through
adaptive and flexible manufacturing systems to satisfy the demand of customized products.
Traditional manufacturing IT system architecture models, for example ISA-95 Functional
Hierarchy Model (FHM), can be used in order to explain current manufacturing IT system
architectures. However, the hierarchic structure of the model does not always correspond to
reality. Due to the rapid development of technique, the borders between the levels of these
models becomes more diffuse. Therefore, the purpose of this thesis was to investigate The
Company’s Division 1 customers’ current system architectures with respect to the levels of ISA-
95 FHM, and their future needs and trends, in order to provide The Company with guidance on
how to integrate their product portfolio with their customers’ system architectures.
The investigated cases of this thesis are four Division 1 customers and one Division 2 customer.
Based on the four key aspects ‘Operator Guidance’, ‘Quality Control’, ‘Real Time Management’
and ‘Future Trends and Needs’, the system architecture of each company was mapped into a
BPMN-models with respect to the levels of ISA-95 FHM. From the maps the authors could
identify two different types of architectures. The first type was developed in-house during
decades, with a high connectivity and similarities to the ISA-95 FHM. The second type was
recently developed, with low connectivity, and mainly constituted by an ERP system and other
applications from the software vendor SAP.
The authors concluded that the second type of architecture can reflect the emerging need of
connectivity within manufacturing enterprises of similar structure, and the trend of connecting
applications directly into the ERP system- built as a service-oriented architecture (SOA). If The
Company wants to compete with the major vendors within the ERP-market, the authors
recommend a development of an MES with a SOA. The MES should include basic MES
functions, such as an Operator Guidance with built in Quality Control-system, and an RTM,
supporting the Smart Manufacturing capabilities productivity, agility and quality. By providing
such a system, which can be customized to meet the customers’ requirements, neither The
Company, nor the customers must be omitted to connect to systems of the big ERP vendors.

ii

iii
Examensarbete inom Industriell Produktion MG202X
Assembly equipment integration for production
control- current landscape and opportunities
Ellinor Lindström
Isa Nedersjö
Godkänt
Examinator
Handledare
Uppdragsgivare
Kontaktperson
Sammanfattning
Den nuvarande trenden inom flera tillverkningsindustrier går mot högre automationsgrad genom
adaptiva och flexibla tillverkningssystem för att tillfredsställa det framtida behovet av
kundanpassade produkter. Traditionella systemarkitektursmodeller för tillverkningssystem, så
som ISA-95 Functional Hierarchy Model (FHM), kan användas för att förklara rådande IT-
systemarkitekturer, men den hierarkiska strukturen av sådana modeller speglar inte alltid
verkligheten. På grund av den snabba utvecklingen av teknik har gränserna mellan de olika
nivåerna i modellerna suddats ut. Syftet med denna avhandling var därför att undersöka The
Company’s Division 1’s kunders nuvarande systemarkitekturer, med avseende på nivåerna i ISA-
95 FHM, och deras framtida behov och trender för att ge vägledning till The Company om hur
de ska kunna integrera sin produktportfölj med sina kunders systemarkitekturer.
De undersökta fallen i denna avhandling är fyra kunder från Division 1 och en kund från
Division 2. Baserat på de fyra nyckelaspekterna ’Operator Guidance’, ’Quality Control’, ’Real
Time Management’ och ’Future Trends and Needs’, kartlades systemarkitekturen för alla fallen
med hjälp av BPMN-modeller, strukturerade efter nivåerna beskrivna i ISA-95 FHM. Från
uppmappningen identifierades två olika typer av arkitekturer. En typ var utvecklad under
årtionden och hade en hög uppkoppling och tydliga likheter med ISA-95 FHM. Den andra typen
var nyligen utvecklad, hade låg uppkoppling och bestod huvudsakligen av ett ERP-system och
andra applikationer från mjukvaruförsäljaren SAP.
Författarna drog slutsatsen att den andra typen av arkitektur kan spegla det växande behovet av
uppkoppling hos liknande kunder och möjligheten att koppla applikationer från verkstadsgolvet
till ERP-systemet, uppbyggt som en serviceorienterad arkitektur (SOA). Om The Company vill
konkurrera med de stora leverantörerna av ERP-system, rekommenderar författarna en
utveckling av ett MES med en SOA. MES:et bör erbjuda grundläggande MES funktioner, så som
ett ”Operator Guidance System” med ett inbyggd kvalitetskontroll och RTM, som stöder
produktiviteten, smidigheten och kvaliteten, uttryckt inom Smart Manufacturing. Genom att
erbjuda ett sådant system, som kan kundanpassas för att uppfylla kundernas olika krav, blir
varken The Company eller kunderna utelämnade till att koppla upp sig till system från de stora
ERP-leverantörerna.

iv

v
FOREWORD
We would like to thank all the people being involved in our thesis project. A special thank you to
our supervisor at The Company, Anders Gibeck, who assigned us the project and always took
time to help, encourage and guide us. We would like to thank the contributing companies for
their warm reception, and the people involved in the process of finding suitable case studies for
the thesis, especially Nico Gruenemund and Stefan Hemker.
We would also like to thank friends and family, who have been a great support for us during our
years of studies at KTH.
With love, Thank you!
Ellinor Lindström and Isa Nedersjö
Stockholm, June 2017

vi

vii
ABBREVIATIONS
AGV Automated Guided Vehicle
BPMN Business Process Management Notation
CCX Continuous Commissioning
CIM Computer Integrated Manufacturing
CPS Cyber Physical Systems
ERP Enterprise Resource Planning
ISA Instrumentation, Systems and Automation Society
ISA-95 ISA- Enterprise-Control System Integration
ISA-95 FHM ISA-95 Functional Hierarchy Model
M2M Machine to Machine
MES Manufacturing Execution System
MESA Manufacturing Execution System Association
NOK Not OK
PCS Process Control System
PLC Programmable Logic Controller
PLM Product Lifecycle Management
RFID Radio Frequency Identification
RTM Real Time Management
SCADA Supervisory Control And Data Acquisition
WIP Work In Progress

viii
ix
TABLE OF CONTENTS
1 INTRODUCTION 1
1.1 Background 1
1.2 Problem formulation 2
1.3 The Company 2
1.4 Purpose 2
1.5 Research questions 3
1.6 Delimitations 3
2 METHOD 5
2.1 Research design 5
2.2 Research method 6
Method of BPMN-mapping 7
2.3 Validity and reliability 10
2.4 Sample selection 10
3 LITERATURE REVIEW 11
3.1 System Architectures- An Introduction 11
3.2 ISA 12
Models and Terminology 13
3.3 ERP 16
Planning and Material Management in an ERP system 17
3.4 MES 18
3.5 Vertical and horizontal integration 19
SOA – Service Oriented Architecture 20
3.6 Smart Manufacturing 21
Smart Manufacturing Ecosystem 23
3.7 Industry 4.0 26
3.8 IoT- Internet of Things 27
3.9 Big Data 30
4 CASE STUDIES 31
4.1 Company A 31
4.1.1 Plant description 31
4.1.2 Current software applications/vendors 32
4.1.3 Current system architecture 33

x
4.1.4 Future trends and needs 34
4.2 Company B 35
4.2.1 Plant description 35
4.2.2 Current software applications/vendors 35
4.2.3 Current system architecture 37
4.2.4 Future trends and needs 39
4.3 Company C 39
4.3.1 Plant description 39
4.3.2 Current Software Applications/Vendors 40
4.3.3 Current system architecture 41
4.3.4 Future trends and needs 42
4.4 Company D 43
4.4.1 Plant description 43
4.4.2 Current Software Applications/vendors 43
4.4.3 Current System architecture 45
4.4.4 Future trends and needs 46
4.5 Company E 47
4.5.1 Plant description 47
4.5.2 Current Software Applications/vendors 47
4.5.3 Current System architecture 48
4.5.4 Future trends and needs 50
5 ANALYSIS 51
5.1 Current system architecture 51
5.2 Operator Guidance 51
5.3 Quality Control 52
5.4 Real Time Management 52
5.5 Future trends and needs 53
6 CONCLUSION 55
6.1 Conclusion - Sub-research questions 55
6.1.1 Current system architectures 55
6.1.2 Current software vendors 56
6.1.3 Future trends and needs 57
6.2 Conclusion - Main Research question 59
Guidelines 59
7 DISCUSSION 63
xi
7.1 Discussion 63
7.2 Validity/Reliability 63
8 RECOMMENDED FUTURE WORK 65
9 REFERENCES 67
10 TABLE OF FIGURES 69
APPENDIX A: INTERVIEW TEMPLATE 71
APPENDIX B: BPMN MODEL COMPANY A 73
APPENDIX C: BPMN MODEL COMPANY B 75
APPENDIX D: BPMN MODEL COMPANY C 77
APPENDIX E: BPMN MODEL COMPANY D 79
APPENDIX F: BPMN MODEL COMPANY E 81

xii

1
1 INTRODUCTION
Following chapter presents an introduction to the thesis project, describing the background,
problem formulation, purpose, research question and delimitations of the thesis.
1.1 Background Global manufacturers are undergoing a shift in paradigm- a forth industrial revolution, where
cyber- and physical systems and the real- and virtual worlds merge (Optico AB, 2016). For
decades, manufacturing companies have been implementing sensors and computerized
automation. Also, design-, manufacturing-, logistics- and services departments have significantly
transformed with the rapid development of information communication technologies, enabling
the era of Smart Manufacturing (Yue, Hu, Hehua, Caifeng, & Keliang, 2015). The rapid
development of technology has led to increasing demands of greater variability and
customization, smaller lot sizes, and sudden changes within the supply chain and distribution
(Yue, Hu, Hehua, Caifeng, & Keliang, 2015). To stay competitive within the global market,
manufacturers must seek productivity gains and advantages through the new era (Optico AB,
2016).
To gain full potential of Smart Manufacturing, the key enabler becomes connectivity between
people, equipment, machines and enterprise systems. Connected systems of the future include
communication within every step of the value chain, from production development to after sales
and service, extended to external partners through Big Data. Connectivity enables an improved
capacity for integrated analysis and use of larger amounts of data across value chains. The
information and data can in return be used to improve quality and find opportunities to introduce
new or improved services to the customer, such as shorter time to market and customization.
However, a fully connected manufacturing network is still rare, which leads to new demands of
business relations to develop and build the future smart connected production networks. (Optico
AB, 2016)
Since the 1960’s, manufacturing system architectures have been described through a hierarchical
structure. One of the most common models is the Purdue Reference Model, visualized in Figure
1. A more detailed distribution of the model is presented in the Functional Hierarchy Model,
from the current standard of manufacturing system architectures ISA- 95. However, the
hierarchic structure of both these models does not always correspond to the manufacturing
reality. (Günther, 2008)
Figure 1. The Purdue Reference Model (Sudheer, 2017)

2
1.2 Problem formulation Even though The Functional Hierarchy Model of ISA- 95 presents a recommended standard of a
clear hierarchal structure for control and decision making, it does not always correspond to the
reality of today. The boarders between the levels are not definite, as illustrated in Figure 2, and
the information does not always follow structured paths between the levels. For example, some
companies do not use an MES, but instead connect the shop floor level directly to the ERP-level.
(Günther, 2008)
Figure 2. Example of undefined boarders between control systems and MES, within
Maintenance, Production, Quality and Inventory. (Günther, 2008).
Günther (2008) emphasizes that the new manufacturing era requires new business processes and
business models for manufacturing. Within the adaption of Smart Manufacturing/Industry 4.0,
the manufacturing software landscape is potentially the area that is going to change the most
(Optico AB, 2016). Trends within the new manufacturing era shows that the strictly layered
approach is no longer feasible within the modern IT environments (Günther, 2008). Modern
business trends ask for more flexible and service-oriented architectures, which allow both a
vertical integration, across ERP and MES systems down to the shop floor, and a horizontal
integration such as information exchange between business partners and machine-to-machine
(M2M).
To assure that the smart manufacturing technologies are adaptable to each other and existing
manufacturing system, it is critical that manufacturers and solution providers collaborate to
identify best practice (Helu, Morris, Jung, Lyons, & Leong, 2015). A shared understanding can
enable a successful deployment and benefit the entire manufacturing community. Thus, in order
to define a fully connected IT-system, sustainable for the future manufacturing trends, the
current software landscape of manufacturing needs and trends must first be identified.
1.3 The Company The thesis is written at the request of a company producing industrial equipment for assembly
processes and associated software and station solutions. The company will be referred to as ‘The
Company’ within this report. The current software products of The Company will be referred to
as CS-1, CSS-1 and CCS-1.
1.4 Purpose The purpose of this thesis is to investigate The Company’s Division 1’s customers’ current
system architectures with respect to the levels of ISA-95 Functional Hierarchy Model, and their
future needs and trends, in order to provide The Company with guidance on how to integrate
their product portfolio into their customers’ system architectures.
3
1.5 Research questions Based on the purpose of the thesis, a main research question and three sub-research questions
were stated. The purpose of the sub-questions was to lead up to a resulting answer of the main
research question.
Main research question:
What future opportunities are there for The Company’s Division 1 to integrate their product
portfolio within their customers’ system architectures, with respect to levels of ISA-95
Functional Hierarchy Model?
Sub-research questions:
- What are the customers' current system architectures with respect to levels of the ISA-95
Functional Hierarchy Model?
- Which are the different software vendors within the customers’ system architectures, and what
are the software purposes and features within the architectures?
- What are the future trends and needs of Division 1’s customers?
1.6 Delimitations The thesis aims to provide guidance within customers’ systems architecture from a production
perspective. The focus of the study will be on the operators’ work and related information flows
within the assembly processes and the associated IT-systems relation to each other. In order to
provide holistic maps of the studied cases, the thesis is limited to the levels of ISA-95 Functional
Hierarchy Model, and will not contain any technical details, constrains or solutions. The cases
studied, i.e. customers, will primarily be customers associated with to The Company’s Division
1, which includes all industrial segments except the ones covered by Division 2. However, one
Division 2 customer will be included for comparison.

4

5
2 METHOD Following chapter presents the method that was used to perform study. It discusses the general
approach of the research, the research method, and the validity and reliability due to the chosen
method. The chapter also presents the chosen samples, i.e. companies, for the study.
2.1 Research design The research method was designed in order to answer the research questions. The research
approach was abductive, which implies that the theories and ideas from the literature affect the
empirical studies and vice versa. The strength of this approach is its great responsiveness to the
empirical material. A weakness is that it might be a time consuming process, while new ideas
will lead to new literature and theories, in order to completely understand the results. (Blomkvist,
2015)
In order to investigate the current IT landscape and answer the research questions, explorative
case studies were considered a suitable research design. According to Blomkvist (2015), case
studies reflect the real life and provide the investigator(s) with a great amount of data and
information about the phenomenon. The critics of case studies are however described by
Blomkvist & Hallin (p.61, 2015) as “How can one case be used, in order to conclude something
about a phenomenon, which can look differently in different cases”. Blomkvist & Hallin also
states: “Remember that a case study is characterized by systematic selection of cases, choice of
data collection method and selection of analytical methods, as well as a clear explanation of this,
combined with motivations and reflections that have been made and how the research journey
has gone.” The selection of cases, data collection method and analytical methods are described
and motivated in the following chapter, while a reflection of how the “research journey” can be
found in the Discussion.
6
2.2 Research method The research method constituted of four phases; Literature review, Case studies, Analysis and
Conclusion, visualized in Figure 3.
Figure 3. Visualization of the research method
A literature study was performed, in order to obtain a thorough understanding about the concepts
within future system architecture and the visions and missions of Industry 4.0 and future
manufacturing systems. The information was gathered through various sources, such as books,
articles and internet.
The literature study, in combination with the delimitations of the project, led to a selection of
three key aspects, connected to the operators work and related information within the assembly
process. These aspects were ‘Quality Control’, ‘Operator Guidance’ and ‘Real Time
Management’. The key aspects were used in order to create an “interview template”, which can
be viewed in Appendix 1. A fourth key aspect “Future trends and needs” was added in order to
cover research questions. Open questions were formed based on the key aspects, with the aim to
cover the company’s current and future state.
Four Division 1 customers were willing to contribute to the study; Company A, Company B,
Company C and Company D. A fifth company, Company E, associated to Division 2, was
included to strengthen the future trends within system architectures, due to their forefront in
technology and well-developed system architectures. During study visits, semi-structured
interviews were performed, with the question template as a base. The empirics from each study
visit where than formulated within the sub-headlines ‘Plant description’, ‘Current software
applications/vendors’, ‘Current system architecture’ and ‘Future trends and needs’. The ‘Plant
description’ aimed to give the reader a better understanding of each case’s assembly process. The
descriptions were complemented with a simplified picture of each assembly line layout. ‘Current
Litterature review
•Future System Architecture
Empirics- Case studies
•Plant description
•Current Software and systems
•Current state architecture
•Future trends and needs
Analysis
•Individual case analyses
•Concluding analyses
Conclusion
•General conclusion
•Guidelines
7
software application’ aimed to map the used software and applications, their use and functions
within the architecture, and their corresponding level with respect to ISA-95 FHM, in order to
give the reader an easy overview. To provide an understanding for the existing system
architectures, the current software and systems with corresponding assembly process, each
system architecture were described through BPMN-models, divided by the levels of ISA-95
FHM. The method of the BPMN-mapping is described in a separate section in this chapter
‘Method of BPMN-mapping’. The purpose of the maps was to provide an increased
understanding of the IT-infrastructure, and how the different systems and software are related to
each other. The maps did therefore not to give an absolute picture of how the IT-infrastructure
work. The last sub-headlines of the empirics ‘Future trends and needs’, presented the future
outlook that each company expressed during the study visit.
The empirics was then analyzed and connected to the literature review. From the analysis, the
authors draw conclusions, which resulted in guidelines. The conclusions and guidelines were
discussed in the ‘Discussion’ chapter followed by recommendations of future work, presented in
‘Recommended future work’.
Method of BPMN-mapping Business Process Management Notation (BPMN) is a modelling standard within Business
Process Management (BPM). In broad terms, BPM “uses, complements, integrate and extends
theories, methods and tools from other scientific disciplines, for example strategic management,
information technology, managerial accounting and operations management” (p.7, Glykas,
2013). Since the 1970’s, BPM has been developed aligned with IT and organizational
development and performed under different approaches, such as Structured Analysis in the 70’s,
Business Process Reengineering in the late 80’s/early 90’s, and Work Management in the 90ies.
From focusing on business process modeling, analysis, simulations, activity based costs,
performance measurement etc., the focus of BPM nowadays is on information technology,
workflows, business process modeling and human resources management tools, such as
Knowledge Management, ERP- systems, Service Oriented Architectures (SOAs), Process
Intelligence and Social Networks. (Glykas, 2013)
Within BPM there are three classical perspectives of modelling; structural, functional and
behavioral perspective. However, modern modeling frameworks mix several perspectives in
integrating approaches, further defined in different modeling standards and languages. One
modeling standard is BPMN, which is within the perspective of combined Behavioral and
Functional Approach. The version of BPMN was introduced in 2004 and became widely
supported in industries. The standard was updated in 2011 to BPMN 2.0. A primary goal of
BPMN was to provide a readily understandable notation standard by all stakeholders, such as
business analysts, technical developers, and the business people who manage and monitor the
process in interest. The approach of reaching understanding at all levels of stakeholders has
become a success factor for standard. Therefore, BPMN allows a modelling of an end-to-end
business process and is designed to cover many types of tasks constrained to business processes.
(Glykas, 2013)
The BPMN graphics is represented by Business Process Diagram (BPD). The languages
elements are grouped in four basic categories; Flow Objects, Connecting Objects, Swim Lanes
and Artifacts, explained further down. The structuring elements allow the viewer to differentiate
tasks and events between sections, but also view the relation and interaction between the
sections. (Glykas, 2013)
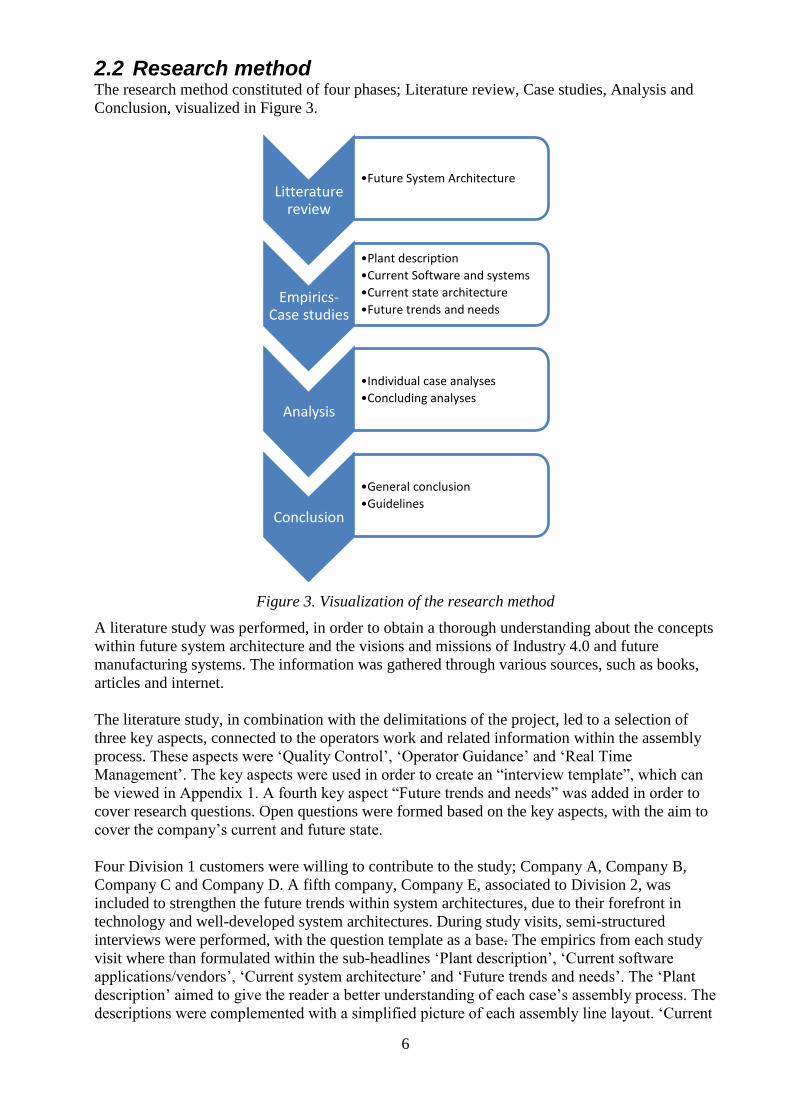
Flow Objects, symbols viewed in Figure 4
o Events - Start event, intermediate events or events.
8
o Activities - Processes, sub-processes or tasks.
o Gateways - Determining branching or merging of paths within the process.
Figure 4. Symbols of Flow Obejcts ; Events, Activity and Gateways (Glykas, 2013)
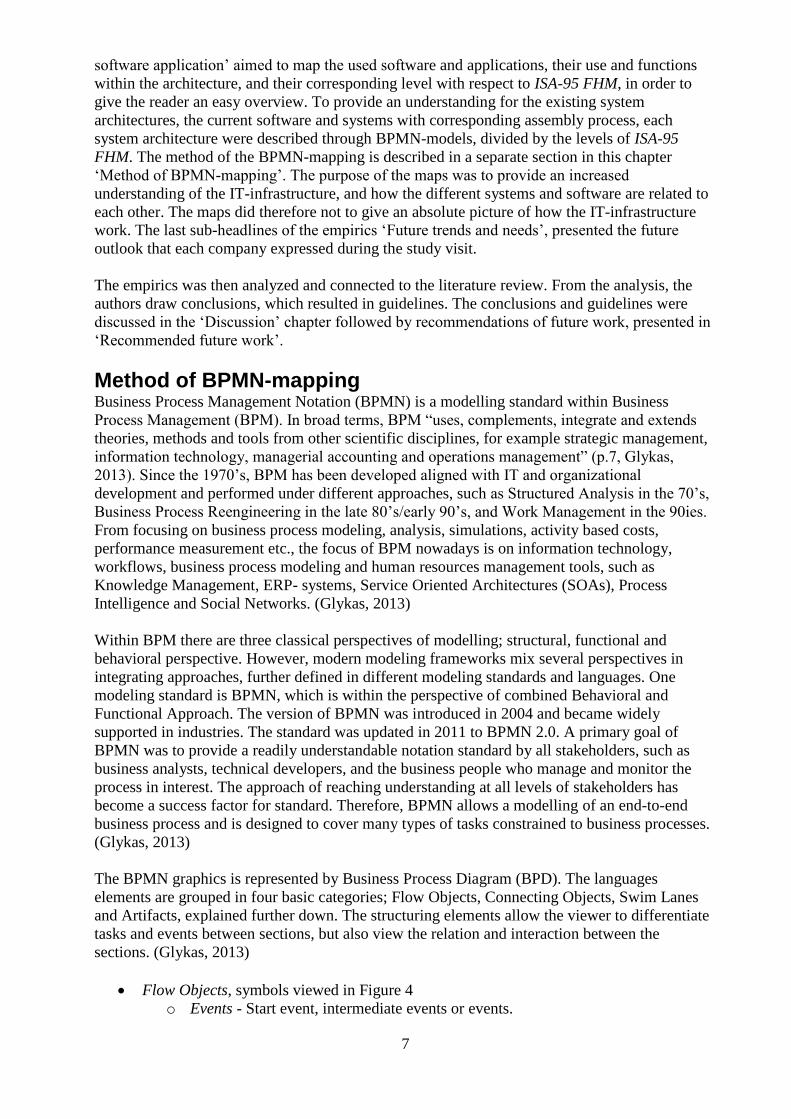
Connecting objects, symbols viewed in Figure 5
o Sequence Flow - Defines the execution order of activities
o Message Flow - Indicates the flow of messages between entities
o Association - Associates text and graphical non-flow objects with flow objects.
Figure 5. Symboles of Connecting Objects; Sequence-, Message-, and Association flow. (Glykas,
2013)
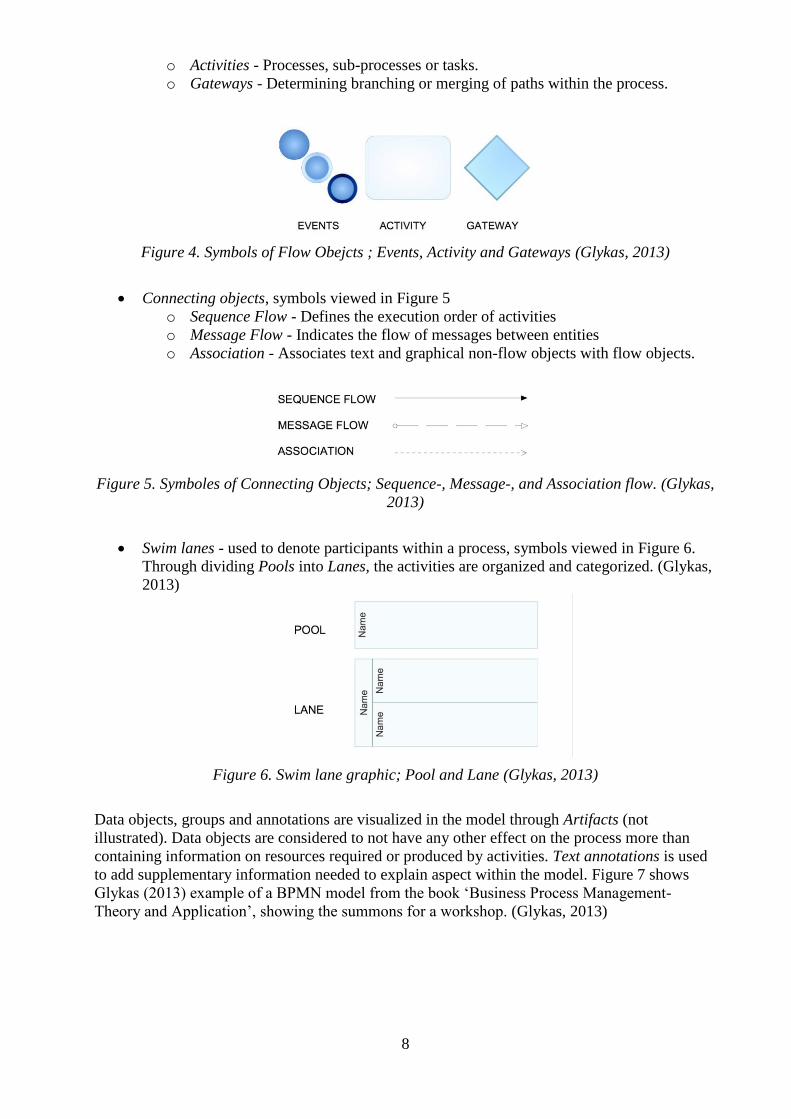
Swim lanes - used to denote participants within a process, symbols viewed in Figure 6.
Through dividing Pools into Lanes, the activities are organized and categorized. (Glykas,
2013)
Figure 6. Swim lane graphic; Pool and Lane (Glykas, 2013)
Data objects, groups and annotations are visualized in the model through Artifacts (not
illustrated). Data objects are considered to not have any other effect on the process more than
containing information on resources required or produced by activities. Text annotations is used
to add supplementary information needed to explain aspect within the model. Figure 7 shows
Glykas (2013) example of a BPMN model from the book ‘Business Process Management-
Theory and Application’, showing the summons for a workshop. (Glykas, 2013)
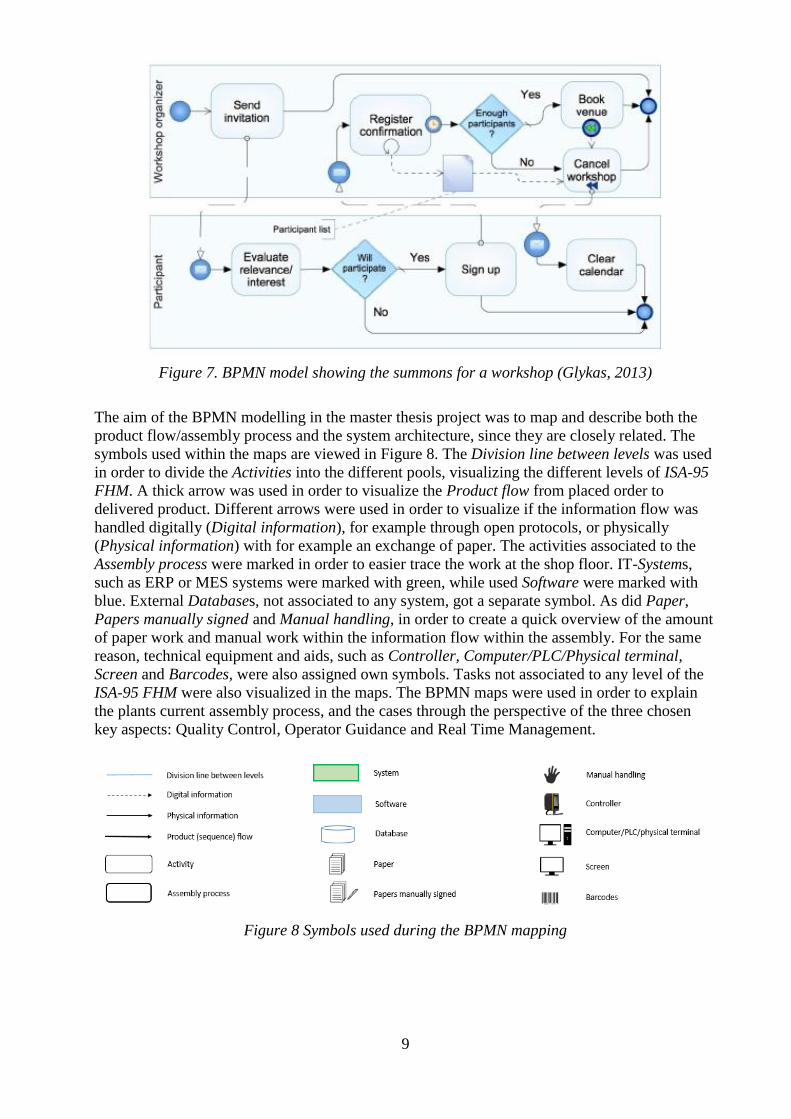
9
Figure 7. BPMN model showing the summons for a workshop (Glykas, 2013)
The aim of the BPMN modelling in the master thesis project was to map and describe both the
product flow/assembly process and the system architecture, since they are closely related. The
symbols used within the maps are viewed in Figure 8. The Division line between levels was used
in order to divide the Activities into the different pools, visualizing the different levels of ISA-95
FHM. A thick arrow was used in order to visualize the Product flow from placed order to
delivered product. Different arrows were used in order to visualize if the information flow was
handled digitally (Digital information), for example through open protocols, or physically
(Physical information) with for example an exchange of paper. The activities associated to the
Assembly process were marked in order to easier trace the work at the shop floor. IT-Systems,
such as ERP or MES systems were marked with green, while used Software were marked with
blue. External Databases, not associated to any system, got a separate symbol. As did Paper,
Papers manually signed and Manual handling, in order to create a quick overview of the amount
of paper work and manual work within the information flow within the assembly. For the same
reason, technical equipment and aids, such as Controller, Computer/PLC/Physical terminal,
Screen and Barcodes, were also assigned own symbols. Tasks not associated to any level of the
ISA-95 FHM were also visualized in the maps. The BPMN maps were used in order to explain
the plants current assembly process, and the cases through the perspective of the three chosen
key aspects: Quality Control, Operator Guidance and Real Time Management.
Figure 8 Symbols used during the BPMN mapping

10
2.3 Validity and reliability Blomkvist&Hallin (2015) state that the validity and reliability of a study is connected to whether
the correct object is being investigated respectively if the research is performed in a correct
manner. The level of validity depends on the how well connected the problem formulation,
purpose and research question are to the literature review and the choice of cases and data
collection.
The research questions correspond to the literature review. The analysis of the gathered
empirical data has been performed with an impartial approach, with unambiguousness and
mutual respect among the analyzers. According to Blomkvist &Hallin (2015), this increases the
dialogic reliability and in turn the overall reliability of the research.
2.4 Sample selection The samples, i.e. the customers chosen for the case studies, were “non-probability-samples”,
which in this study meant the customers agreeing to a participation. The problems with “non-
probability-samples” are that the conclusions drawn from such samples do not necessarily
represent other companies than the ones included in the study. In addition, a case study cannot
result in statistically covered conclusions. The selection of “non-probability-samples” can
however be beneficial when having limited time to collect the empirics, or when the study does
not primarily aim to provide absolute and correct answers. (Blomkvist & Hallin, 2012). Since the
aim of this study is to provide guidance and examples of what different system architectures
currently look like, and not to provide correct answers, the sample-selection method was
considered suitable. The companies agreeing to participate in the study were four Division 1
customers, and one Division 2 customer. Even though the delimitations stated that the study only
would include Division 1 customers, the Division 2 customer was included as a comparing case.
The cases are presented below:
Company A - Manufacturer of agriculture equipment
Company B - Manufacturer of white goods
Company C - (Anonymous)
Company D - Manufacturer of machine components
Company E - Manufacturer of cars

11
3 LITERATURE REVIEW
Following chapter presents the studied literature, used as a foundation of knowledge for the
thesis research. It presents a summary of the manufacturing IT system architectures history, the
current system architecture standard ISA-95- formulated by ISA, and some key aspects to the
subject; ERP, MES, and vertical and horizontal integration. The chapter also presents the future
visons of Industry 4.0 and Smart Manufacturing on the future manufacturing IT system
architecture.
3.1 System Architectures- An Introduction System architectures have been heavily influenced by the development of technology. As
systems became more complex, with functionalities and systemized activities, the landscape of
system architectures changed. Some of the first system architectures visualized a three-leveled
model, with Planning, Execution and Control in a hierarchal layout, viewed in Figure 9.
However, it also showed architecture built on integration and overlapping functionalities.
(Greedd & Ghoshal, 2004)
Figure 9. The three-level systems architecture (Greedd & Ghoshal, 2004)
Supply chain tools were excluded in the three-leveled model. The Manufacturing Execution
Systems Association (MESA) developed a model to include the supply-chain management
(SCM) tools at the top, resulting in the four-level model, viewed in Figure 10 (Greedd &
Ghoshal, 2004).
Figure 10. The four-level system architecture. (Greedd & Ghoshal, 2004)
The system architectures then evolved into an even more detailed and hierarchical structure, with
five levels, viewed in Figure 11 (Greedd & Ghoshal, 2004). At the year 2000, ISA, the
Instrumentation, Systems and Automation Society, formulated recommendations by the ISA-95
FHM, which is still a used as a reference model of system architectures. ISA, and the Functional
Hierarchy Model are further described in the section ‘ISA’.

12
Figure 11. Five-level systems architecture (Greedd & Ghoshal, 2004)
3.2 ISA Already in the 1990’s, Industrial Companies had for decades made big investments in Enterprise
Resource Planning systems (ERP) and Process Control Systems (PCS). Such investments bring
important strategic advantages. However, ERP systems are only valuable when provided with
current information, and the ERP users, satisfied with the reports that the system delivered, were
not always aware that their colleagues at the shop floor were entering all the data manually.
(Scholten, 2007)
The implementation of ERP:s and PCS:s require the involvement of many departments, such as
IT, production, maintenance and the engineering departments, while the automation is often
performed by a third part. The different departments do not always have a good understanding in
each other’s work, and the importance of the different departments “speaking the same
language” increases, since they must be able to cope with a high degree of heterogeneity. Many
companies investing in ERP:s and PCS:s were confronted with a gap between the ERP and the
PCS levels, which could lead to expensive errors. (Scholten, 2007)
Since 2000, “ISA”, stands for “Instrumentation, Systems and Automation Society” and is best
described as a method or mindset for working and communication. The society has created a
standard, called ISA-95, Enterprise-Control System Integration, or just ISA-95, in order to reduce
the risks, errors and costs, earlier mentioned, that an implementation could bring (Scholten,
2007). The purposes of the standard are to:
- Provide definitions for the interface between the shop floor and top floor. “The interface
initially considered is the interface between levels 3 and 4 of that model. Additional
interfaces will be considered, as appropriate.”
- Provide definitions for a safe, robust and cost-efficient information exchange mechanism,
which can preserve each system’s information and control span integrity. (ISA, 2017)
The scope of ISA-95 is to:
- In detail define an abstract model of the enterprise and the included manufacturing
control and business functions and its information exchange.
- Establish common terminology and define the electronic information exchange of
enterprise, including manufacturing control and business functions and its information
exchange. (ISA, 2017)
The ISA-95 standard, consists of five parts, in about 100 documents each. The five parts are
summarized below:

13
“Part 1 presents models and terminology for analyzing and standardizing the information
exchange between level 4 and level 3 within a specific manufacturing company.
Part 2 presents data models that standardize the structure and content of the information
flows in Part 1.
Part 3 presents models with which one can analyze the Control Domain in a specific
manufacturing company. Part 3 defines four groups of activities within the Control
Domain, namely Production, Maintenance, Quality, and Inventory. Using models, part 3
makes clear which activities these groups comprise.
Part 4 is still in development and standardized the information exchange between
Maintenance, Quality, and Inventory systems internally and between these systems on
one side and MES and ERP on the other.
Part 5 present standard verbs and nouns for the message exchange between ERP and
MES systems. In this way, Part 5 makes clear what the ERP and MES systems should do
with the information flows specified in Parts 1 and 2.” (Scholten, 2007, s. 61)
The standard can be applied in various ways, such as an analysis tool, a basis for a standardized
information exchange or as a basis for developing MES applications. An application of the
standard can lead advantages, such as a better insight into diverse aspects of manufacturing
companies and more standardized, well-conceived MES-applications that more easily can be
maintained or interface other vendors. (Scholten, 2007)
Models and Terminology The most important models in Part 1 of ISA-95 are the Functional Hierarchy model, the
Equipment Hierarchy Model, the Functional Enterprise-Control Model, the Categories of
Information Exchange Model, and the Object Models. The Functional Hierarchy Model and the
Functional Enterprise-Control Model are presented in the following subchapters.
The Functional Hierarchy Model The Functional Hierarchy Model (FHM) makes a clear difference between the, by ISA-95
defined, Enterprise Domain and the Control Domain. The Enterprise Domain refers to Level 4,
and the Control Domain refers to Level 3 and lower, in the Functional Hierarchy Model, in
Figure 12.
Figure 12. ISA-95 The Functional Hierarchy Model (simplified) (Scholten, 2007)

14
ISA-95 nowhere use the terms ERP and MES in correlation to the levels of the model above.
Popularly, Level 4 correlates to an ERP level, Level 3 to an MES level, Level 2 and 1 to a
Process Control System (PCS) level, and level 0 is the physical process itself.
A more detailed explanation of the different levels is:
“Level 4: Business planning and logistics: plant production scheduling, production,
material use, delivery and shipping, inventory management.” (Günther, 2008)
Relevant time frame: Years, months, weeks, days
Scope: Extends beyond the walls of the factory (Scholten, 2007)
“Level 3: Manufacturing operations and control: dispatching production, detailed
production scheduling, reliability assurance, etc.; maintenance of records and
optimization of the production process.” (Günther, 2008)
Relevant time frame: Days, hours, minutes, seconds.
Scope: Within the walls of the factory (Scholten, 2007)
“Level 2: Monitoring and controlling of physical processes (PLC, human–machine
interface)” (Günther, 2008)
Relevant time frame: Hours, minutes, seconds and even more finely grained.
Scope: Within the walls of the factory (Scholten, 2007)
“Level 1: Sensing and manipulating of physical processes (sensors, actuators, RFID
readers)” (Günther, 2008)
Relevant time frame: Hours, minutes, seconds and even more finely grained.
Scope: Within the walls of the factory (Scholten, 2007)
“Level 0: Physical processes (machines); location of the actual production processes.”
(Günther, 2008)
A concern regarding the vertical integration projects based on ISA-95, is ‘Who owns the data?’.
The owning of data within the architecture is sometimes considered as a measure of the system
importance. In older system architectures, systems controlled data, and shared it reluctantly.
Today, information sharing is valuable and desirable. “When asked a question about who owns
the data, respond by trying to understand all the roles that the systems will have and don’t get
involved over a battle of data ownership” (Scholten, 2007, s. 188).
15
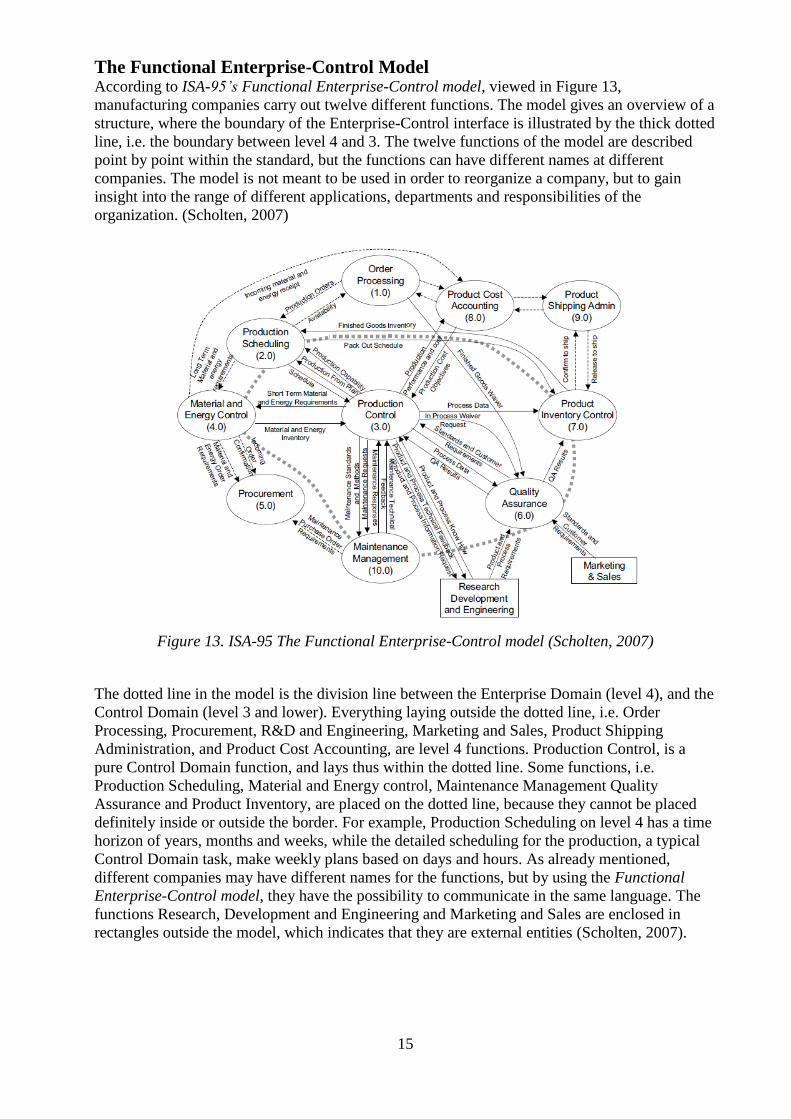
The Functional Enterprise-Control Model According to ISA-95’s Functional Enterprise-Control model, viewed in Figure 13,
manufacturing companies carry out twelve different functions. The model gives an overview of a
structure, where the boundary of the Enterprise-Control interface is illustrated by the thick dotted
line, i.e. the boundary between level 4 and 3. The twelve functions of the model are described
point by point within the standard, but the functions can have different names at different
companies. The model is not meant to be used in order to reorganize a company, but to gain
insight into the range of different applications, departments and responsibilities of the
organization. (Scholten, 2007)
Figure 13. ISA-95 The Functional Enterprise-Control model (Scholten, 2007)
The dotted line in the model is the division line between the Enterprise Domain (level 4), and the
Control Domain (level 3 and lower). Everything laying outside the dotted line, i.e. Order
Processing, Procurement, R&D and Engineering, Marketing and Sales, Product Shipping
Administration, and Product Cost Accounting, are level 4 functions. Production Control, is a
pure Control Domain function, and lays thus within the dotted line. Some functions, i.e.
Production Scheduling, Material and Energy control, Maintenance Management Quality
Assurance and Product Inventory, are placed on the dotted line, because they cannot be placed
definitely inside or outside the border. For example, Production Scheduling on level 4 has a time
horizon of years, months and weeks, while the detailed scheduling for the production, a typical
Control Domain task, make weekly plans based on days and hours. As already mentioned,
different companies may have different names for the functions, but by using the Functional
Enterprise-Control model, they have the possibility to communicate in the same language. The
functions Research, Development and Engineering and Marketing and Sales are enclosed in
rectangles outside the model, which indicates that they are external entities (Scholten, 2007).
16
3.3 ERP ERP is the abbreviation of Enterprise Recourse Planning, which aims to the software systems
that provide a comprehensive management of financial, manufacturing, sales, distribution,
service and human resources across the enterprise (Shtub & Karni, 2010). The system handles
data, information and communication requirements of the whole organization, but it also
integrates business processes, leading to improved operational efficiency (Chen, Chiu, Huang, &
Pai, 2012).
The major ERP vendors, such as SAP, Oracle and PeopleSoft, include modules supporting
business functionalities such as:
Sales Order
Processing
Purchasing
Production
Planning
Financial
accounting
Management
accounting
Human Recourses.
The current global market has led to an increasing demand for the manufacturers to be agile
(Günther, 2008). To be able to deliver on time, manufactures are highly dependent on their
supply network, leading to horizontal integration between business partners, exchanging real-
time information between the partners. ERP systems have grown into a multi-billion industry,
which produces components to support a variety of business functions (Shaul & Doron, 2013).
The ability to integrate multiple functions within an enterprise leads to organizational excellence,
by means of reduced inventory, higher efficiency within production, thus- leading to greater
responsiveness to customers and a better competitive edge in terms of improved strategic
initiative. Therefore, a successful implementation of the ERP system is crucial for companies.
An ERP system is a large investment for a company, using a variety of business justifications,
including the replacement of legacy systems, reduction in cycle times from order to delivery or
reduction in operating cost. The investment cost can result between $50,000 and hundreds of
millions of dollars, depending on which ERP implementation alternative is chosen. The main
challenge for an organization implementing an ERP, is whether to change the organization’s
business process to fit the software, or to modify the software to fit the organization’s business
practice. One alternative is the “vanilla” ERP implementation, which implies a complete
implementation from one ERP vendor. This type of implementation offer a total integration a re-
engineering of business processes. A limited customization makes the ERP system easier to
upgrade over time, and thereby “best-practice” of the system can be gained. However, the
“vanilla” implementation is costly and time-consuming. A less costly alternative, both in cost
and time-consumption, is a partial ERP implementation. The implementation offers a modular
ERP system where the investing organization has the ability to choose which modules shall be
implemented. The drawback of the implementation alternative is the lack of a total integration of
data across multiple functional areas of the organization. A third alternative is to build up ERP
system in-house. The advantage of the alternative is that the ERP system gets customized to the
organization and it does not have to be compromised by “best-practice” with other companies
having the same type of ERP system, such in the “vanilla”-alternative. However, this is the most
expensive alternative, in both cost and time-consumption. The fourth alternative is to not
implement an ERP system at all, the Status quo-alternative. The alternative implies no cost, but
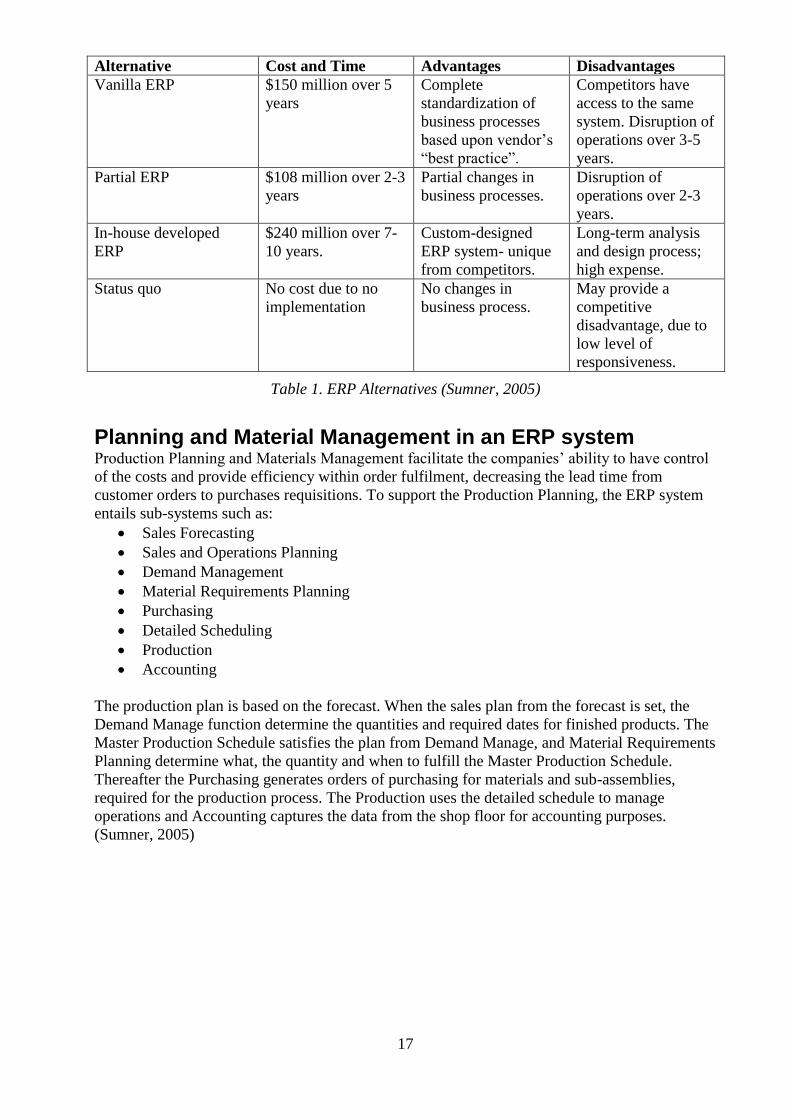
no gains either. A summary of the ERP implementation alternative is viewed in Table 1. A
successful ERP implementation is due to effective management, organizational change, and the
use of advanced technology. Some projects do even fail to gain full potential of ER, due to the
lack of competence (Sumner, 2005).
17
Alternative Cost and Time Advantages Disadvantages
Vanilla ERP $150 million over 5
years
Complete
standardization of
business processes
based upon vendor’s
“best practice”.
Competitors have
access to the same
system. Disruption of
operations over 3-5
years.
Partial ERP $108 million over 2-3
years
Partial changes in
business processes.
Disruption of
operations over 2-3
years.
In-house developed
ERP
$240 million over 7-
10 years.
Custom-designed
ERP system- unique
from competitors.
Long-term analysis
and design process;
high expense.
Status quo No cost due to no
implementation
No changes in
business process.
May provide a
competitive
disadvantage, due to
low level of
responsiveness.
Table 1. ERP Alternatives (Sumner, 2005)
Planning and Material Management in an ERP system Production Planning and Materials Management facilitate the companies’ ability to have control
of the costs and provide efficiency within order fulfilment, decreasing the lead time from
customer orders to purchases requisitions. To support the Production Planning, the ERP system
entails sub-systems such as:
Sales Forecasting
Sales and Operations Planning
Demand Management
Material Requirements Planning
Purchasing
Detailed Scheduling
Production
Accounting
The production plan is based on the forecast. When the sales plan from the forecast is set, the
Demand Manage function determine the quantities and required dates for finished products. The
Master Production Schedule satisfies the plan from Demand Manage, and Material Requirements
Planning determine what, the quantity and when to fulfill the Master Production Schedule.
Thereafter the Purchasing generates orders of purchasing for materials and sub-assemblies,
required for the production process. The Production uses the detailed schedule to manage
operations and Accounting captures the data from the shop floor for accounting purposes.
(Sumner, 2005)
18
3.4 MES When the concept of Computer Integrated Manufacturing (CIM) arose in the 1970’s (ESPRIT,
1988), production, personnel and quality were no longer seen as independent of each other
(Kletti, 2007). Since these task areas cannot be separated from each other in the real world, data
crossovers became necessary, resulting in Manufacturing Execution Systems (MES), a tool for
Production management (Kletti, 2007). The MES supports the production management
objectives: increasing transparency, responsiveness and cost efficiency. According to Günther
(2008) an MES has following tasks and functions:
Detailed scheduling and detailed control: Holds the current production plan, which in
an optimal MES can be optimized and updated in real time.
Management of operating resources: Registration of when and which resources are
used. Can be used for example statistics of efficiency and availability of the resources
Materials management: Administration of Work In Progress (WIP). Optimal MES:s
use the material management as a basis for traceability solutions.
Personnel management: Personnel scheduling and provision of personnel capacities
Data collection: Real-Time collection of relevant data. The data facilitates the
performance of efficient regenerating planning and rescheduling procedure
Activity Analysis: Compare actual, measured values to the target conditions, which
increases the possibility of a quick action/response to faulty processes.
Quality management: Quality planning support, Quality inspection control, managing
appropriate gauges. “Quality management should be designed in such a way that
processes can directly be influenced as required by the respective results.” (Günther,
2008)
Information management: Papers that have become a basic prerequisite for efficient
production, such as work floor papers or bills of material are prepared and made available
on workplaces or data input stations. Events that affect processes are generated in order
to quickly identify erroneous processes and remedy them. In addition, other MES-tasks
can be triggered by these pieces of information.” (Günther, 2008)
19
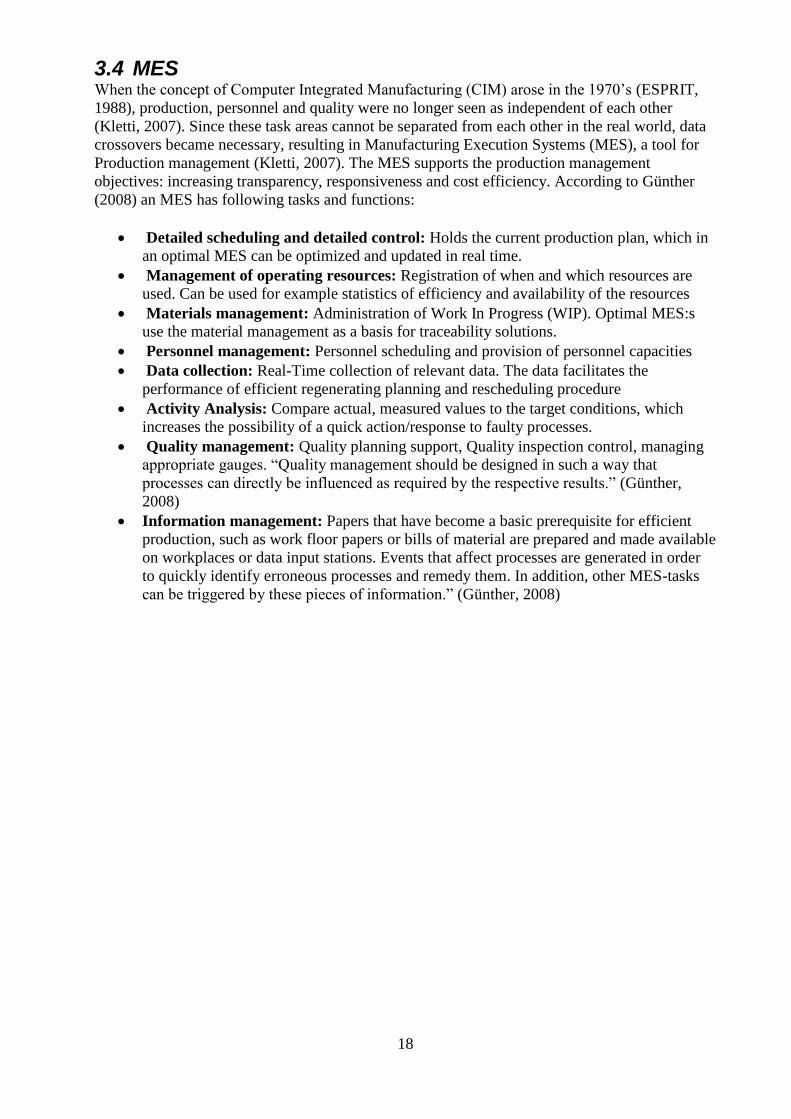
Figure 14 shows an example of how the MES functions are distributed into modules in a real
MES product - HYRDA.
Figure 14. Example of a MES: HYRDA, with software modules representing MES functions
(Günther, 2008).
PDC Plant data collection
MDC Machine data collection
DNC Administration of machine control programs
SFC Shop floor control
T&A Time and attendance
AC Access control
QDC Quality data collection
PDP Process data processing
TRM Tool and resource management
MPL Material and production logistics (Günther, 2008)
Since every minute of downtime for a part of a plant is costly, the aim of an MES-system is to
increase the transparency of the value-adding processes and to create both horizontal and vertical
control cycles. Having an MES and control over the production also contribute to better
customer service, increased product quality and more cost savings, due to improved delivery
reliability and capability as well as inventory reductions and improved workforce positioning.
The result of increased control and communication of the RTM, Real Time Management, is that
the production can react and adapt more quickly and cost-efficiently in order to reach the
requirements. The tasks being performed can with a MES be measured in multiple of minutes
instead of in days or shifts as in a traditional ERP environment. (Kletti, 2007)
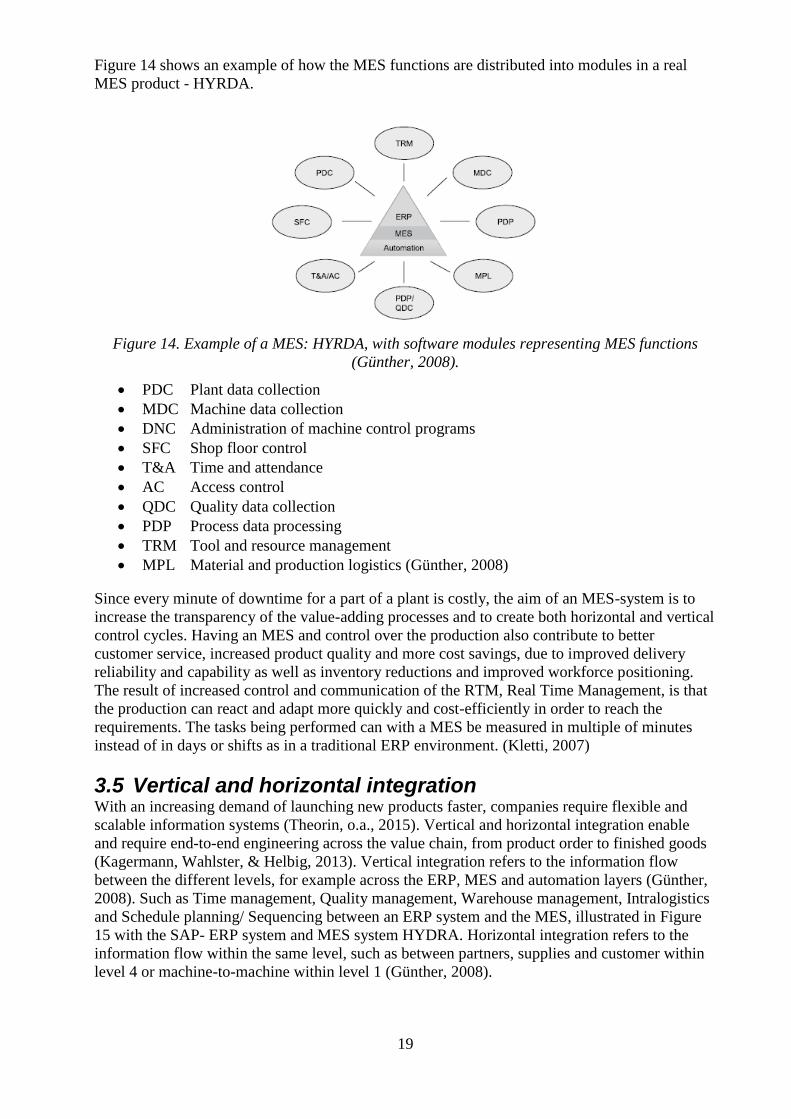
3.5 Vertical and horizontal integration With an increasing demand of launching new products faster, companies require flexible and
scalable information systems (Theorin, o.a., 2015). Vertical and horizontal integration enable
and require end-to-end engineering across the value chain, from product order to finished goods
(Kagermann, Wahlster, & Helbig, 2013). Vertical integration refers to the information flow
between the different levels, for example across the ERP, MES and automation layers (Günther,
2008). Such as Time management, Quality management, Warehouse management, Intralogistics
and Schedule planning/ Sequencing between an ERP system and the MES, illustrated in Figure
15 with the SAP- ERP system and MES system HYDRA. Horizontal integration refers to the
information flow within the same level, such as between partners, supplies and customer within
level 4 or machine-to-machine within level 1 (Günther, 2008).
20
Figure 15. Example: flow of information from and to SAP applications and Hyrda (Günther,
2008)
The trend towards improved vertical and horizontal integration is reflected in the changes of
manufacturing application software. Traditionally, the integration approach in manufacturing has
been to connect applications on a Point-to-Point basis, using client/server pattern (Theorin, o.a.,
2015). The pattern commands that the server and the client know about each other, leading to a
“spaghetti integration” for a fully connected network, containing a number of connections which
increase squarely with the number of applications. The need and trends for improved horizontal
and vertical integration have been reflected in the manufacturing application software (Günther,
2008). New software architectures have been developed, enabling a direct connection of shop
floor equipment and hardware devices to the ERP system. The development has led to that the
borders between ERP, MES, and other specialized control software gradually becoming less
sharp.
SOA – Service Oriented Architecture Service Oriented Architecture (SOA), is a modern software architecture which meets the need of
flexibility and improved information flow (Günther, 2008). The architecture has received much
attention both in academia and industry, and has been widely adopted in the business level and is
expected to revolutionize the manufacturing area (Theorin, o.a., 2015). The SOA works through
self-contained applications exposing themselves as services, other applications can connect to
them and use (Theorin, o.a., 2015). Through the architecture, services from different vendors are
possible to combine (Günther, 2008). To reach full potential of the architecture, with loose
coupling and high flexibility, the SOA applications should be self-describing, discoverable, as
well as platform- and language- independent (Theorin, o.a., 2015). One software vendor working
with SOA is SAP through their SAP NetWeaver technology platform (Günther, 2008).
21
An existing system with a Service Oriented Architecture is the ‘SAP Connected Manufacturing’.
‘SAP Connected Manufacturing' is a showcase, implemented with seven co-innovative
equipment-, and automation partners from SAP, which targets the main challenge of an end-to-
end seamless integrated manufacturing execution system. The system has a Service Oriented
Architecture, where machines and work stations offer services to execute different tasks. SAP
manufacturing execution consumes and combines these services according to the individual
requirements production order, and no additional data feeds are required.
The system knows where the product should stop and how it should be machined. Such
information is today often maintained by additional software systems. The showcase manages to
come from the sales order with the individual product configuration down to the machine in one
go, and enables a lot size of one. In case of manual activities, the interaction with the worker is
in focus. Case related visual work instructions are used to guide the work force how to for
example repair a deficient piece. The consistent and seamless integrated process of SAP
connected manufacturing enables the individualized and personalized products can be produced
as profitable as mass products (Youtube, 2017).
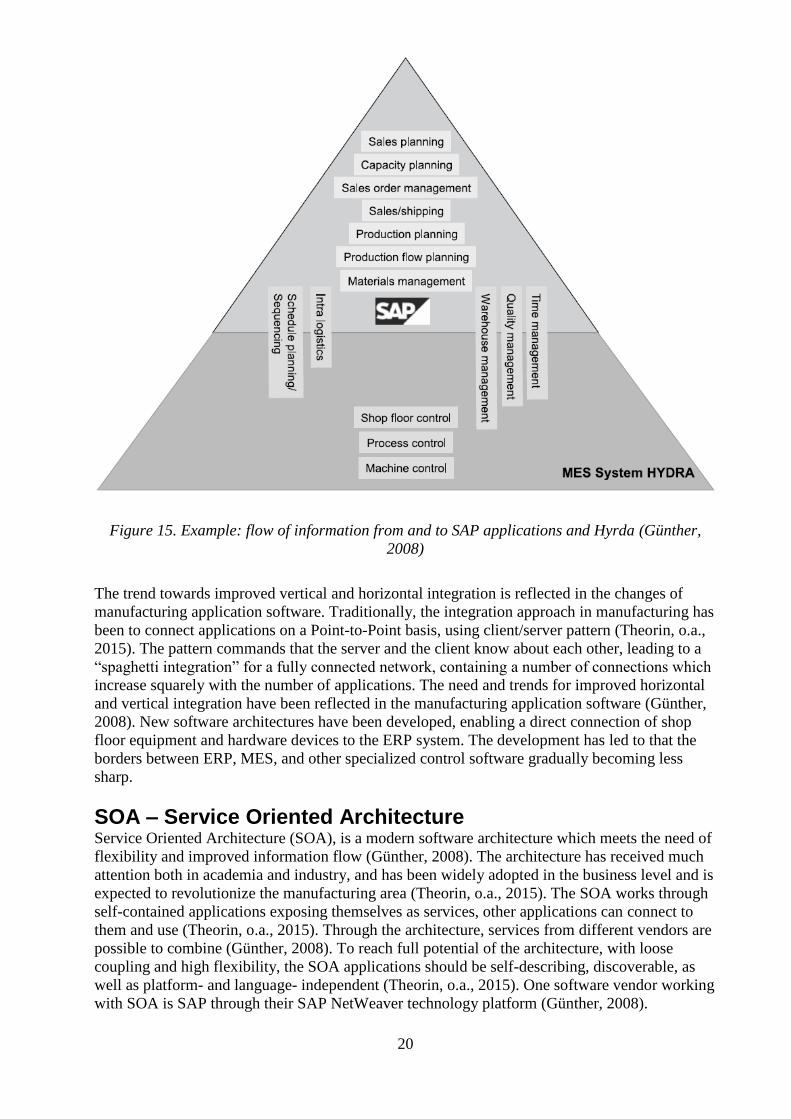
3.6 Smart Manufacturing The term Smart Manufacturing implies an umbrella of multiple consortium efforts to modernize
industrial practices, towards an open connectivity in the entire value chain between smarter
equipment, facilities, products and processes, viewed in Figure 16 (Kueppers, 2016). Within the
umbrella of Smart Manufacturing exist the consortiums Industry 4.0 (Germany), Smart
Manufacturing Leadership Coalition (US), Industrial Internet Consortium (US), Made in China
2025 (China) and Make in India (India) (Optico AB, 2016).
Figure 16. Smart Manufacturing and its basis (Kueppers, 2016).
Smart Manufacturing, or Smart Manufacturing Systems (SMS) refers to the next-generations
manufacturing. SMS aim to maximize the capabilities with respect to cost, delivery, flexibility
and quality. Through using advanced technologies and digital information within and between
different manufacturing systems, SMS are driving unique gains in production agility, quality,

22
and efficiency across U.S. manufacturing, achieving a long-term competitiveness. (National
Institute of Standards and Technology, 2016)
Table 2. The relation of Smart Manufacturing paradigm to other manufacturing paradigms.
(National Institute of Standards and Technology, 2016)
Compared to other manufacturing paradigms, viewed in Table 2 , the main characteristics of
Smart Manufacturing are (National Institute of Standards and Technology, 2016):
Digitalization within every part of a manufacturing enterprise, enhancing interoperability
and productivity.
Connected devices and distributed intelligence leading to real time control and flexible
production of small batch products.
Supply chain management built on collaboration to be able to be agile to market changes
and supply chain distribution.
Energy and resource efficiency through integrated and optimal decision making.
Fast innovation cycle through big data analytics and advanced sensors.
The report from National Institution of Standards and Technology (2016) emphasizes the
importance of a manufacturing system being developed aligned with the competitive strategy, in
order to achieve corporate competitive goals of the company. As key capabilities for SMS the
report identifies four categories;
Productivity - the ratio of production output to inputs used in the product process.
Should be adjusted to the responsiveness of the customer demands.
Capability Decomposition: Throughput, Overall Equipment Efficiency and Labor
productivity.
Agility - Defined by “the capability of surviving and prospering in a competitive
environment of continuous and unpredictable change by reacting quickly and effective to
23
changing markets, driven by customer-designed products and services” National Institute
of Standards and Technology, p.3, 2016).
Capability Decomposition: Response to change, On-Time Delivery to Commit and
Resilience to fault.
Quality - Quality within SMS includes how well the finished products meet the design
specifications. It also includes measures of product innovation and customization.
Capability Decomposition: Product quality, Innovation, Variety and Customer service.
Sustainability - Manufacturing sustainability is defined in terms of environmental
impact (energy and natural resources), the safety and well-being of employees, and
economic feasibility. It is an upcoming driver that has taken on more importance among
the traditional drivers, such as time and cost measures. Comparing to the other drivers,
the area of manufacturing sustainability is still not as mature.
Capability Decomposition: Product, Process and Logistics.
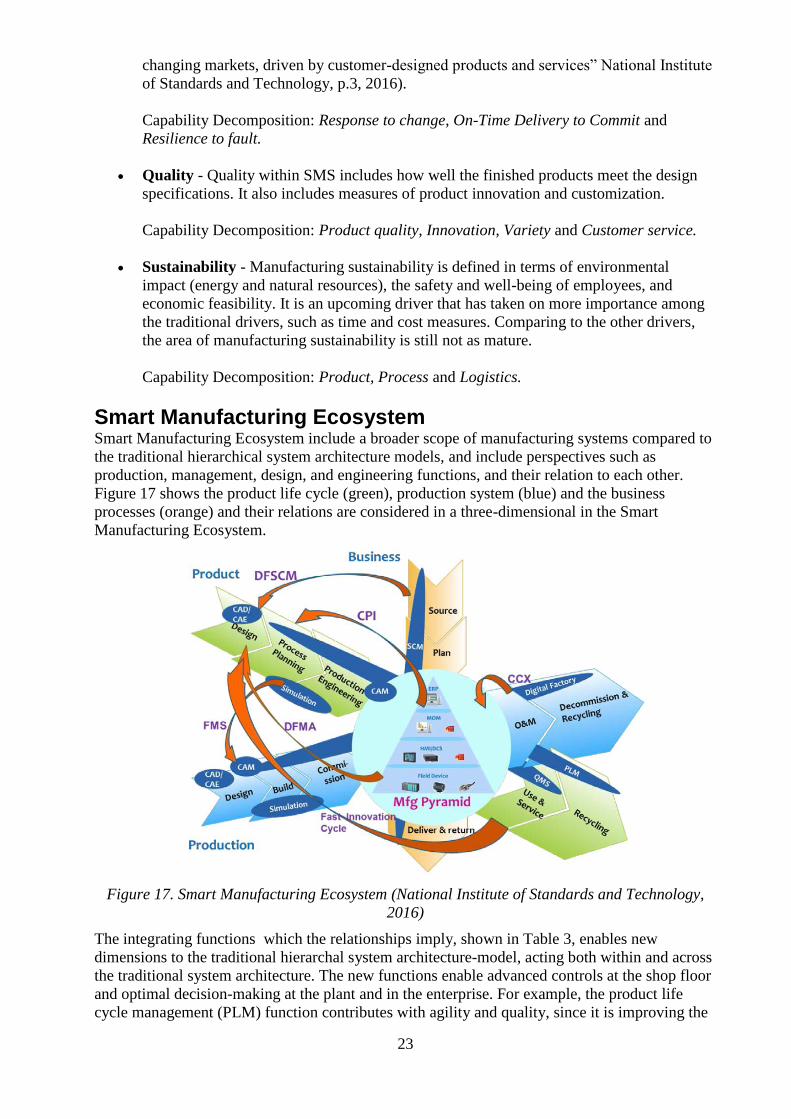
Smart Manufacturing Ecosystem Smart Manufacturing Ecosystem include a broader scope of manufacturing systems compared to
the traditional hierarchical system architecture models, and include perspectives such as
production, management, design, and engineering functions, and their relation to each other.
Figure 17 shows the product life cycle (green), production system (blue) and the business
processes (orange) and their relations are considered in a three-dimensional in the Smart
Manufacturing Ecosystem.
Figure 17. Smart Manufacturing Ecosystem (National Institute of Standards and Technology,
2016)
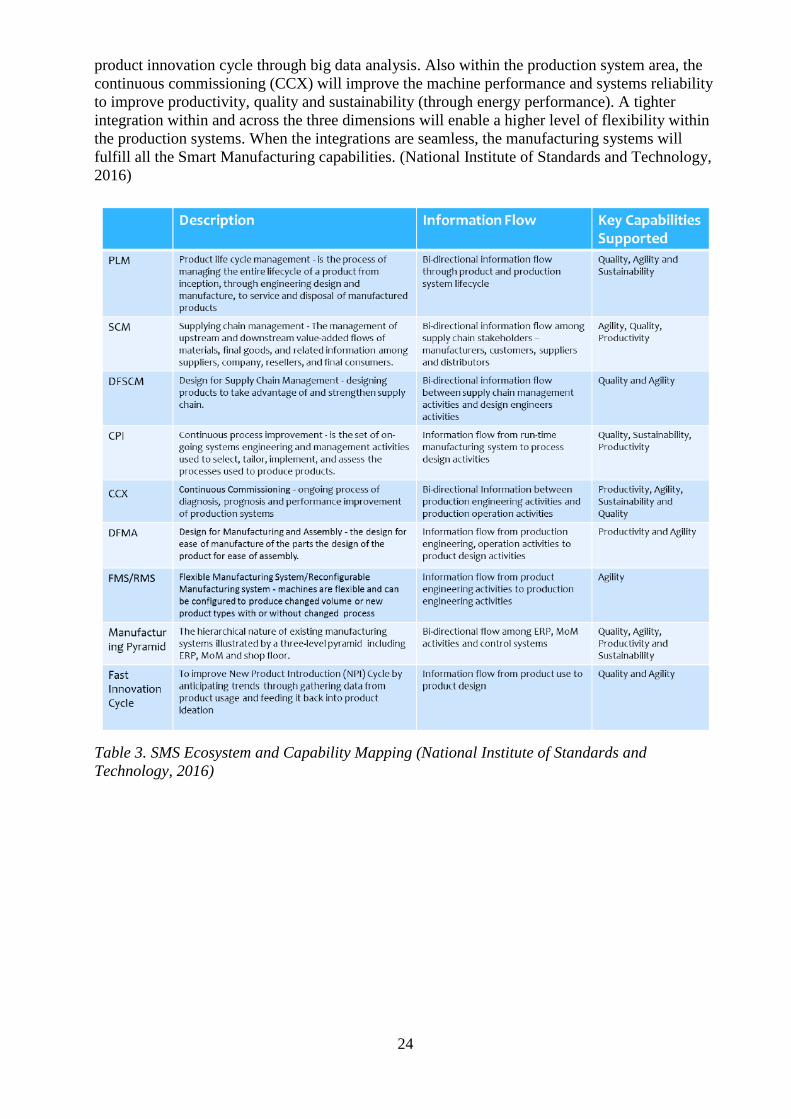
The integrating functions which the relationships imply, shown in Table 3, enables new
dimensions to the traditional hierarchal system architecture-model, acting both within and across
the traditional system architecture. The new functions enable advanced controls at the shop floor
and optimal decision-making at the plant and in the enterprise. For example, the product life
cycle management (PLM) function contributes with agility and quality, since it is improving the
24
product innovation cycle through big data analysis. Also within the production system area, the
continuous commissioning (CCX) will improve the machine performance and systems reliability
to improve productivity, quality and sustainability (through energy performance). A tighter
integration within and across the three dimensions will enable a higher level of flexibility within
the production systems. When the integrations are seamless, the manufacturing systems will
fulfill all the Smart Manufacturing capabilities. (National Institute of Standards and Technology,
2016)
Table 3. SMS Ecosystem and Capability Mapping (National Institute of Standards and
Technology, 2016)
25
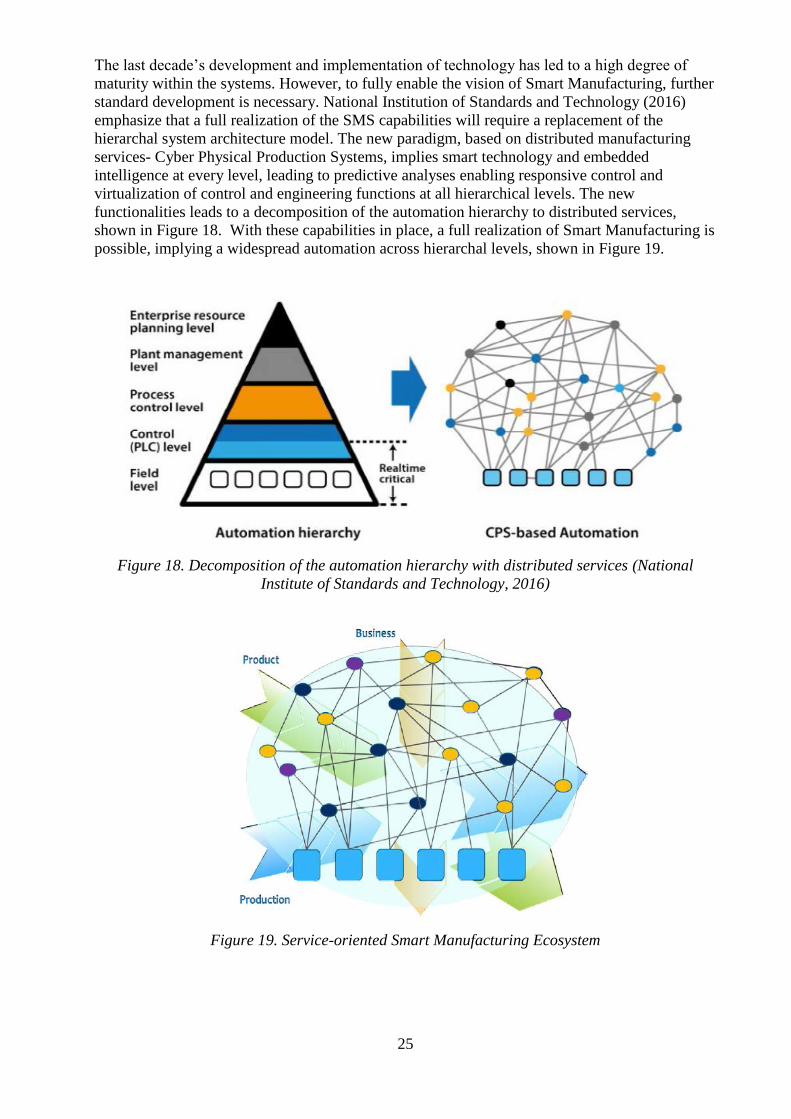
The last decade’s development and implementation of technology has led to a high degree of
maturity within the systems. However, to fully enable the vision of Smart Manufacturing, further
standard development is necessary. National Institution of Standards and Technology (2016)
emphasize that a full realization of the SMS capabilities will require a replacement of the
hierarchal system architecture model. The new paradigm, based on distributed manufacturing
services- Cyber Physical Production Systems, implies smart technology and embedded
intelligence at every level, leading to predictive analyses enabling responsive control and
virtualization of control and engineering functions at all hierarchical levels. The new
functionalities leads to a decomposition of the automation hierarchy to distributed services,
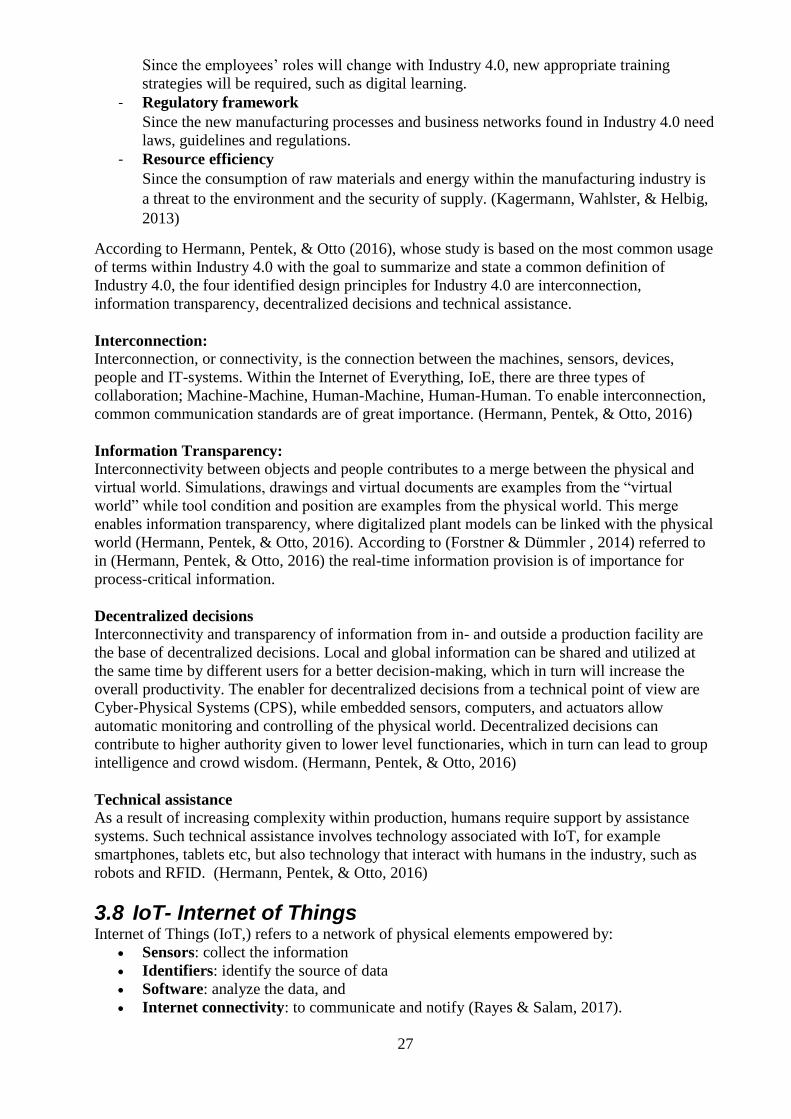
shown in Figure 18. With these capabilities in place, a full realization of Smart Manufacturing is
possible, implying a widespread automation across hierarchal levels, shown in Figure 19.
Figure 18. Decomposition of the automation hierarchy with distributed services (National
Institute of Standards and Technology, 2016)
Figure 19. Service-oriented Smart Manufacturing Ecosystem

26
3.7 Industry 4.0 Industry 4.0 was introduced in 2011 at the Hannover fair as an initiative of a high-tech strategy
from the German Government. The 4.0 refers to the fourth industrial revolution. The vision of
Industry 4.0 is automated and autonomous factories, where materials, products and equipment
will communicate with each other, exchanging information and instructions in real time and
where workers only interfere if any corrections are needed. The consortium Industry 4.0 has
grown wide within European manufacturing, and has today become a buzzword along with the
fourth industrial revolution. (Optico AB, 2016)
Even though Industry 4.0 has become a top priority topic for industries, academies and research
centers, there is no generally accepted understanding of the term. The two German key
promoters of the initiative, ‘Industrie 4.0 Working Group’ and ‘Plattform Industrie 4.0’ only
describe a vision, selected scenarios and the basic technologies of a fourth industrial revolution,
which has led to the lack of a concrete definition of the term. Because of the lack of definition,
companies struggle with the implementation and identification of Industry 4.0 environment.
(Hermann, Pentek, & Otto, 2016)
According to the Industrie 4.0 Working group, one of the key promoters of Industry 4.0,
production facilities will in the future be controlled and operated by Cyber Physical Systems
(CPS), where smart machines and technology can steer the production autonomously. In
addition, smart factories will bring a new approach to production. Smart products will provide
their own production information, can be tracked all time, and will communicate with the smart
factory and enterprise systems. In order to create a leading market for CPS technology and
products, the Industrie 4.0 Working group emphasizes that horizontal integration through value
networks, vertical integration and networked manufacturing systems and end-to-end digital
integration of engineering across the entire value chain should be implemented. (Kagermann,
Wahlster, & Helbig, 2013)
According to the Industrie 4.0 Working Group, the effects of an Industry 4.0 environment are
increased traceability, interconnectivity, transparency, customization and flexibility and resource
productivity and efficiency, which in turn will reduce the environmental impact and increase the
profitability. The Industrie 4.0 Working group also emphasizes the need of research within
following eight Industry 4.0 key areas:
- Standardization and reference architecture
Since there is no current architecture or implementation standard for an Industry 4.0
facility or environment.
- Managing complex systems
Since the handling of the growing complexity of production requires planning and
suitable models and methods.
- A comprehensive broadband infrastructure for industry
Since universe, reliable, comprehensive and high-quality communication networks are
required for Industry 4.0
- Safety and security
Since an integrated safety and security standard and proper education is required in order
to ensure that products and production facilities do not entail danger to people or the
environment
- Work organization and design
Since the importance of real-time oriented control will increase in “smart factories”, the
employer’s role will change. Personal development of the employees will remain
important, and it will require new, suitable learning methods.
- Training and continuing professional development
27
Since the employees’ roles will change with Industry 4.0, new appropriate training
strategies will be required, such as digital learning.
- Regulatory framework
Since the new manufacturing processes and business networks found in Industry 4.0 need
laws, guidelines and regulations.
- Resource efficiency
Since the consumption of raw materials and energy within the manufacturing industry is
a threat to the environment and the security of supply. (Kagermann, Wahlster, & Helbig,
2013)
According to Hermann, Pentek, & Otto (2016), whose study is based on the most common usage
of terms within Industry 4.0 with the goal to summarize and state a common definition of
Industry 4.0, the four identified design principles for Industry 4.0 are interconnection,
information transparency, decentralized decisions and technical assistance.
Interconnection: Interconnection, or connectivity, is the connection between the machines, sensors, devices,
people and IT-systems. Within the Internet of Everything, IoE, there are three types of
collaboration; Machine-Machine, Human-Machine, Human-Human. To enable interconnection,
common communication standards are of great importance. (Hermann, Pentek, & Otto, 2016)
Information Transparency: Interconnectivity between objects and people contributes to a merge between the physical and
virtual world. Simulations, drawings and virtual documents are examples from the “virtual
world” while tool condition and position are examples from the physical world. This merge
enables information transparency, where digitalized plant models can be linked with the physical
world (Hermann, Pentek, & Otto, 2016). According to (Forstner & Dümmler , 2014) referred to
in (Hermann, Pentek, & Otto, 2016) the real-time information provision is of importance for
process-critical information.
Decentralized decisions Interconnectivity and transparency of information from in- and outside a production facility are
the base of decentralized decisions. Local and global information can be shared and utilized at
the same time by different users for a better decision-making, which in turn will increase the
overall productivity. The enabler for decentralized decisions from a technical point of view are
Cyber-Physical Systems (CPS), while embedded sensors, computers, and actuators allow
automatic monitoring and controlling of the physical world. Decentralized decisions can
contribute to higher authority given to lower level functionaries, which in turn can lead to group
intelligence and crowd wisdom. (Hermann, Pentek, & Otto, 2016)
Technical assistance
As a result of increasing complexity within production, humans require support by assistance
systems. Such technical assistance involves technology associated with IoT, for example
smartphones, tablets etc, but also technology that interact with humans in the industry, such as
robots and RFID. (Hermann, Pentek, & Otto, 2016)
3.8 IoT- Internet of Things Internet of Things (IoT,) refers to a network of physical elements empowered by:
Sensors: collect the information
Identifiers: identify the source of data
Software: analyze the data, and
Internet connectivity: to communicate and notify (Rayes & Salam, 2017).
28
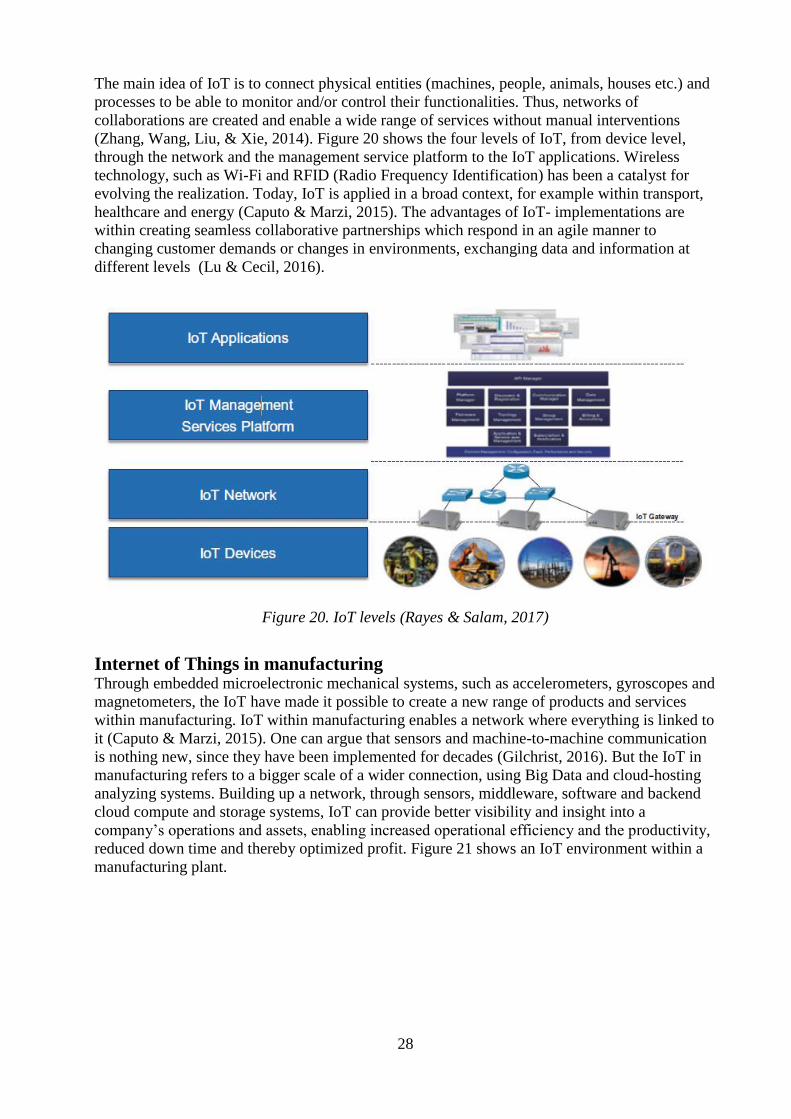
The main idea of IoT is to connect physical entities (machines, people, animals, houses etc.) and
processes to be able to monitor and/or control their functionalities. Thus, networks of
collaborations are created and enable a wide range of services without manual interventions
(Zhang, Wang, Liu, & Xie, 2014). Figure 20 shows the four levels of IoT, from device level,
through the network and the management service platform to the IoT applications. Wireless
technology, such as Wi-Fi and RFID (Radio Frequency Identification) has been a catalyst for
evolving the realization. Today, IoT is applied in a broad context, for example within transport,
healthcare and energy (Caputo & Marzi, 2015). The advantages of IoT- implementations are
within creating seamless collaborative partnerships which respond in an agile manner to
changing customer demands or changes in environments, exchanging data and information at
different levels (Lu & Cecil, 2016).
Figure 20. IoT levels (Rayes & Salam, 2017)
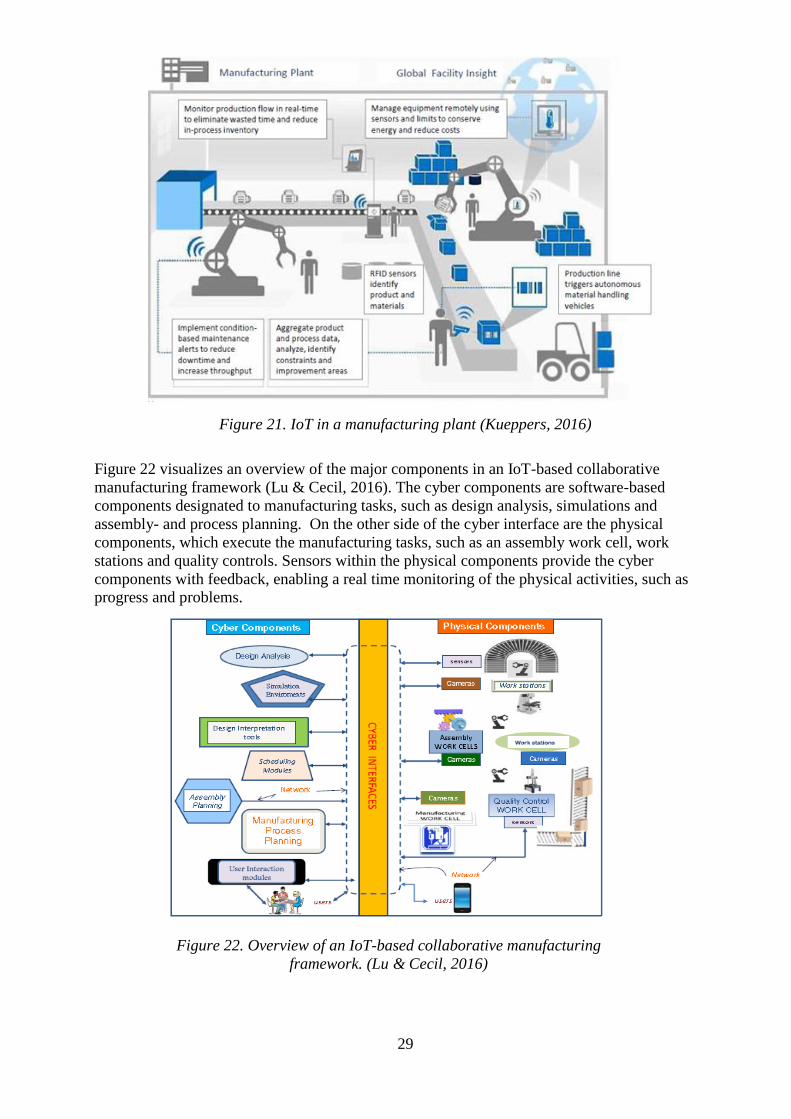
Internet of Things in manufacturing Through embedded microelectronic mechanical systems, such as accelerometers, gyroscopes and
magnetometers, the IoT have made it possible to create a new range of products and services
within manufacturing. IoT within manufacturing enables a network where everything is linked to
it (Caputo & Marzi, 2015). One can argue that sensors and machine-to-machine communication
is nothing new, since they have been implemented for decades (Gilchrist, 2016). But the IoT in
manufacturing refers to a bigger scale of a wider connection, using Big Data and cloud-hosting
analyzing systems. Building up a network, through sensors, middleware, software and backend
cloud compute and storage systems, IoT can provide better visibility and insight into a
company’s operations and assets, enabling increased operational efficiency and the productivity,
reduced down time and thereby optimized profit. Figure 21 shows an IoT environment within a
manufacturing plant.
29
Figure 21. IoT in a manufacturing plant (Kueppers, 2016)
Figure 22 visualizes an overview of the major components in an IoT-based collaborative
manufacturing framework (Lu & Cecil, 2016). The cyber components are software-based
components designated to manufacturing tasks, such as design analysis, simulations and
assembly- and process planning. On the other side of the cyber interface are the physical
components, which execute the manufacturing tasks, such as an assembly work cell, work
stations and quality controls. Sensors within the physical components provide the cyber
components with feedback, enabling a real time monitoring of the physical activities, such as
progress and problems.
Figure 22. Overview of an IoT-based collaborative manufacturing
framework. (Lu & Cecil, 2016)
30
3.9 Big Data The many different definitions of “Big Data” have evolved rapidly. One definition is from
TechAmerica Foundations:
“Big data is a term that describes large volumes of high velocity, complex and variable data that
require advanced techniques and technologies to enable the capture, storage, distribution,
management, and analysis of the information.” (Gandomi, p.140, 2014)
The three Vs of Big data are Volume, Variety and Velocity, and refers to the magnitude of data,
the structural heterogeneity in a dataset and the rate at which the data is generated and the speed
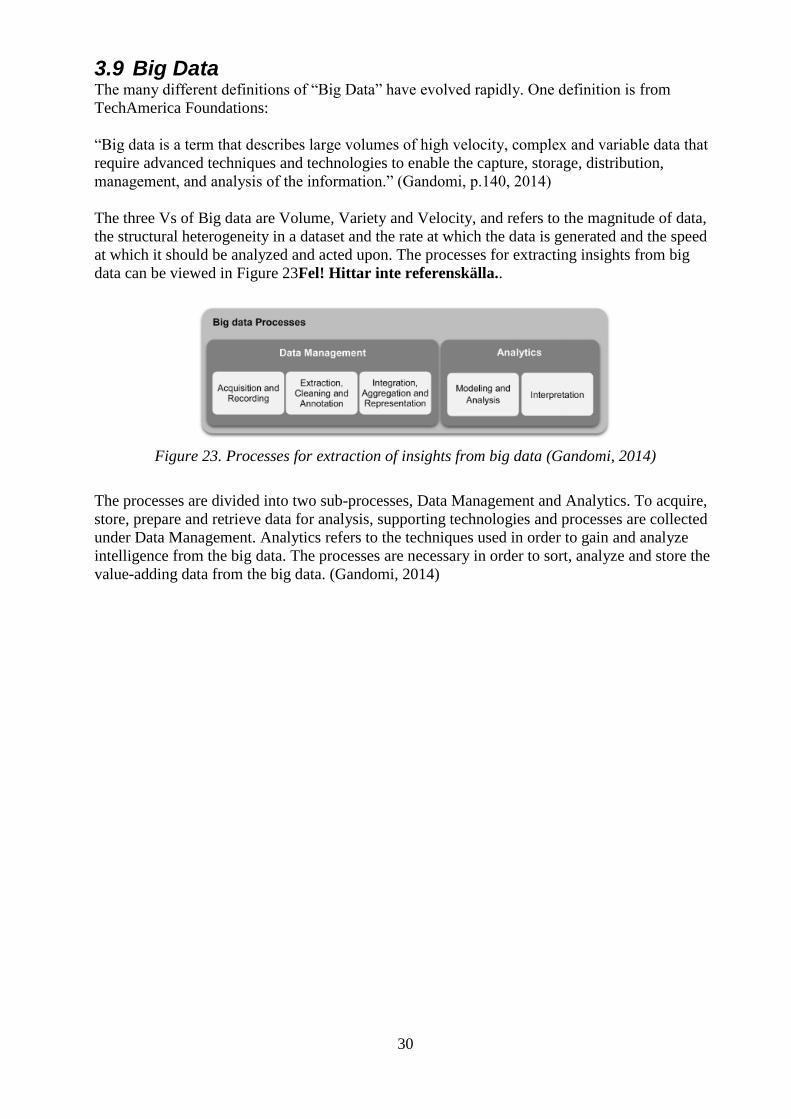
at which it should be analyzed and acted upon. The processes for extracting insights from big
data can be viewed in Figure 23Fel! Hittar inte referenskälla..
Figure 23. Processes for extraction of insights from big data (Gandomi, 2014)
The processes are divided into two sub-processes, Data Management and Analytics. To acquire,
store, prepare and retrieve data for analysis, supporting technologies and processes are collected
under Data Management. Analytics refers to the techniques used in order to gain and analyze
intelligence from the big data. The processes are necessary in order to sort, analyze and store the
value-adding data from the big data. (Gandomi, 2014)
31
4 CASE STUDIES Following chapter presents the collected empirics of the study. For each company, an
introduction of the studied plant, the current software applications/vendors, the current systems
architecture, and the future outlook are presented. The current architecture is presented through
a BPMN model, which is described through the perspectives: Current assembly process,
Operator Guidance, Quality Control and Real Time Management. The current software systems
used at level 4, 3 and 2 are presented, with a description of what they are used for. The first four
companies, Company A, Company B, Company C and Company D, are customers to Division 1.
The fifth company; Company E, presents a case of a Division 2 customer.
4.1 Company A Empirics of the case study at Company A.
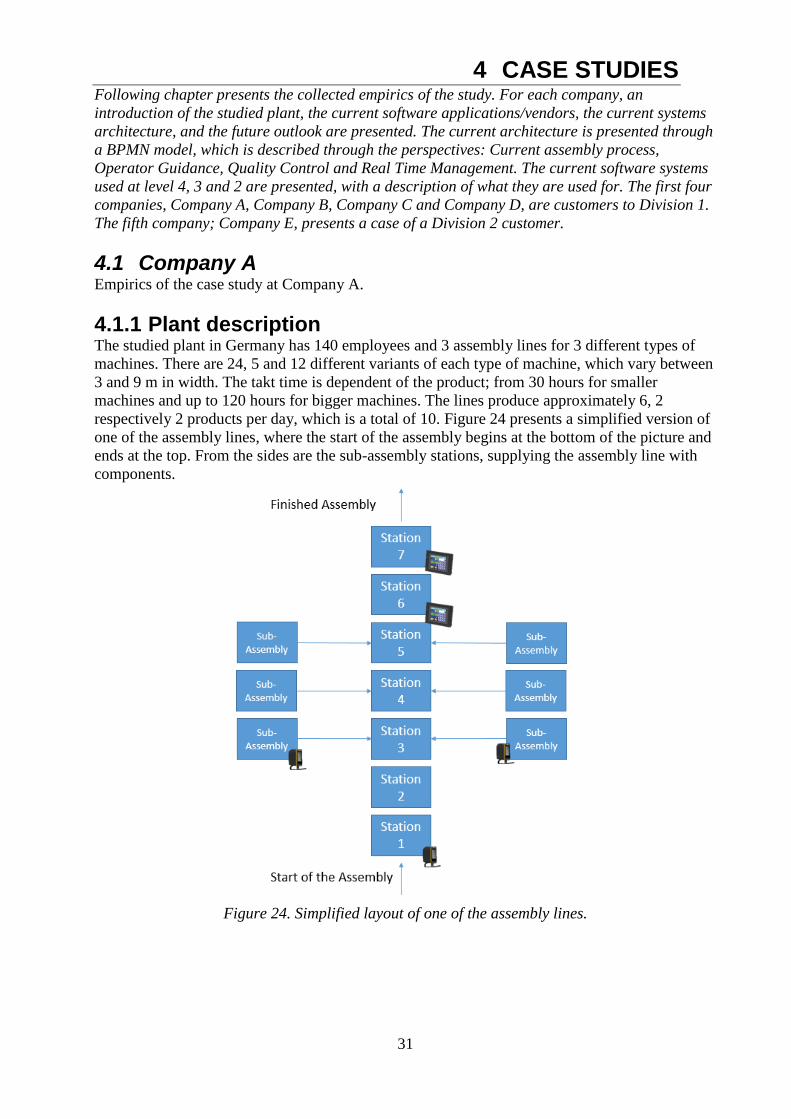
4.1.1 Plant description The studied plant in Germany has 140 employees and 3 assembly lines for 3 different types of
machines. There are 24, 5 and 12 different variants of each type of machine, which vary between
3 and 9 m in width. The takt time is dependent of the product; from 30 hours for smaller
machines and up to 120 hours for bigger machines. The lines produce approximately 6, 2
respectively 2 products per day, which is a total of 10. Figure 24 presents a simplified version of
one of the assembly lines, where the start of the assembly begins at the bottom of the picture and
ends at the top. From the sides are the sub-assembly stations, supplying the assembly line with
components.
Figure 24. Simplified layout of one of the assembly lines.

32
4.1.2 Current software applications/vendors The software applications and systems used within the studied plants IT-infrastructure are
presented below, and divided due to their respective level within the ISA-95 FHM. The software
functions and applications are presented in bullet points. In this case, all applications are bought
or developed in cooperation with commercial software vendors.
Level 4
SAP ERP system
Assembly related modules:
o Sales and Distribution: handling of registered orders,
inventory and deliveries of ordered products
o Production planning: Partly performed in SAP. A set
production plan is made six week before planned production
and registered in SAP
o Material Requirement Planning: Parts needed for assembly
and stock is handled in SAP
o Quality data storage: Quality Check data from the “SAP-
controller (level 2) is stored in SAP
Level 3
Excel Detailed planning
Data collection: Tightening data collected by the CS-1’s are manually
transferred to Excel
Level 2
CS-1
Monitoring of physical processes: Indicates an OK tightening with
green light, and a NOK with a red light
Controlling of physical processes: Holds programming and P-sets for
the connected tools.
Screen Monitoring of physical processes: Shows production performance
and backlog. Data of produced products are manually transferred
from SAP and presented on a screen. The data is compared to the
setpoint, so that backlog can be presented on the screen both in
products and time. Other data, such as when the latest accident at the
plant occurred, is also presented
SAP controller Controlling of physical processes: The controller and associated test
equipment are manually connected to the product. The controller
automatically perform a pre-programmed test program and store the
test results automatically in SAP (level 4)

33
4.1.3 Current system architecture The systems architecture in Figure 25 is presented from the perspective of one of the three
assembly lines at the studied plant, from customer order to delivered product.
Figure 25. Current systems architecture, Company A
Current assembly process
New orders are registered in the ERP-system SAP (Sales and Distribution, level 4). The
production is partly planned in SAP, but also in Excel to be able to plan in detail (Detailed
Planning, level 3). In SAP the plan gets updated with what material is required for the production
(Material Requirement Planning, level 4). When the production plan is set it gets registered in
SAP (Production Planning, level 4). The 12 next work orders are printed and manually queued
and dispatched for the assembly lines (Dispatching, level 3). The logistic department (Logistics,
level 3) uses the registered production plan in SAP to know when to bring which components to
the assembly line (Assembly Process, level 0). The work orders at the assembly line are
manually taken from the que stand in the planed order. The work order follows the product
through the complete assembly process (Assembly Process, level 0). During the assembly
process the operators manually sign every performed assembly task in the work order. When all
the assembly tasks are completed and the quality checks have been performed, the paper form
work order is manually scanned. Both the paper form of the work order and the scanned copy are
stored (Work order storage, level 4). A completed product is manually registered in SAP as a
finished product (Stock, material and finished goods, level 4).
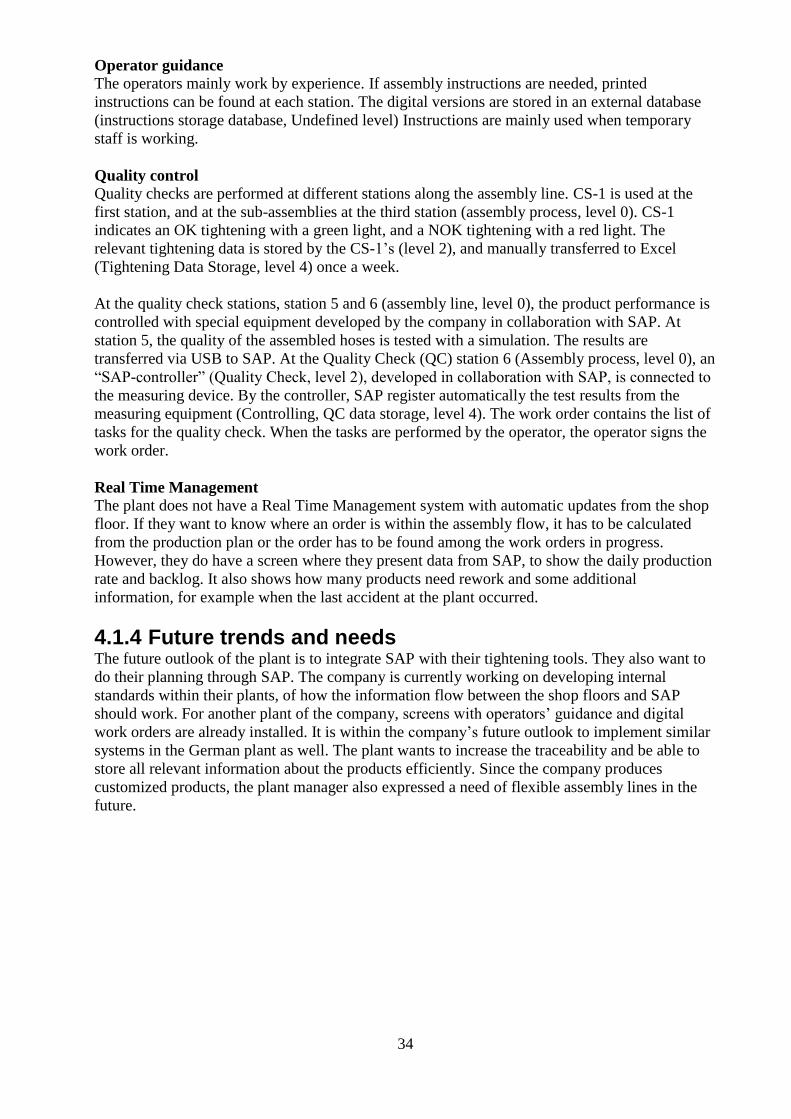
34
Operator guidance The operators mainly work by experience. If assembly instructions are needed, printed
instructions can be found at each station. The digital versions are stored in an external database
(instructions storage database, Undefined level) Instructions are mainly used when temporary
staff is working.
Quality control
Quality checks are performed at different stations along the assembly line. CS-1 is used at the
first station, and at the sub-assemblies at the third station (assembly process, level 0). CS-1
indicates an OK tightening with a green light, and a NOK tightening with a red light. The
relevant tightening data is stored by the CS-1’s (level 2), and manually transferred to Excel
(Tightening Data Storage, level 4) once a week.
At the quality check stations, station 5 and 6 (assembly line, level 0), the product performance is
controlled with special equipment developed by the company in collaboration with SAP. At
station 5, the quality of the assembled hoses is tested with a simulation. The results are
transferred via USB to SAP. At the Quality Check (QC) station 6 (Assembly process, level 0), an
“SAP-controller” (Quality Check, level 2), developed in collaboration with SAP, is connected to
the measuring device. By the controller, SAP register automatically the test results from the
measuring equipment (Controlling, QC data storage, level 4). The work order contains the list of
tasks for the quality check. When the tasks are performed by the operator, the operator signs the
work order.
Real Time Management
The plant does not have a Real Time Management system with automatic updates from the shop
floor. If they want to know where an order is within the assembly flow, it has to be calculated
from the production plan or the order has to be found among the work orders in progress.
However, they do have a screen where they present data from SAP, to show the daily production
rate and backlog. It also shows how many products need rework and some additional
information, for example when the last accident at the plant occurred.
4.1.4 Future trends and needs The future outlook of the plant is to integrate SAP with their tightening tools. They also want to
do their planning through SAP. The company is currently working on developing internal
standards within their plants, of how the information flow between the shop floors and SAP
should work. For another plant of the company, screens with operators’ guidance and digital
work orders are already installed. It is within the company’s future outlook to implement similar
systems in the German plant as well. The plant wants to increase the traceability and be able to
store all relevant information about the products efficiently. Since the company produces
customized products, the plant manager also expressed a need of flexible assembly lines in the
future.
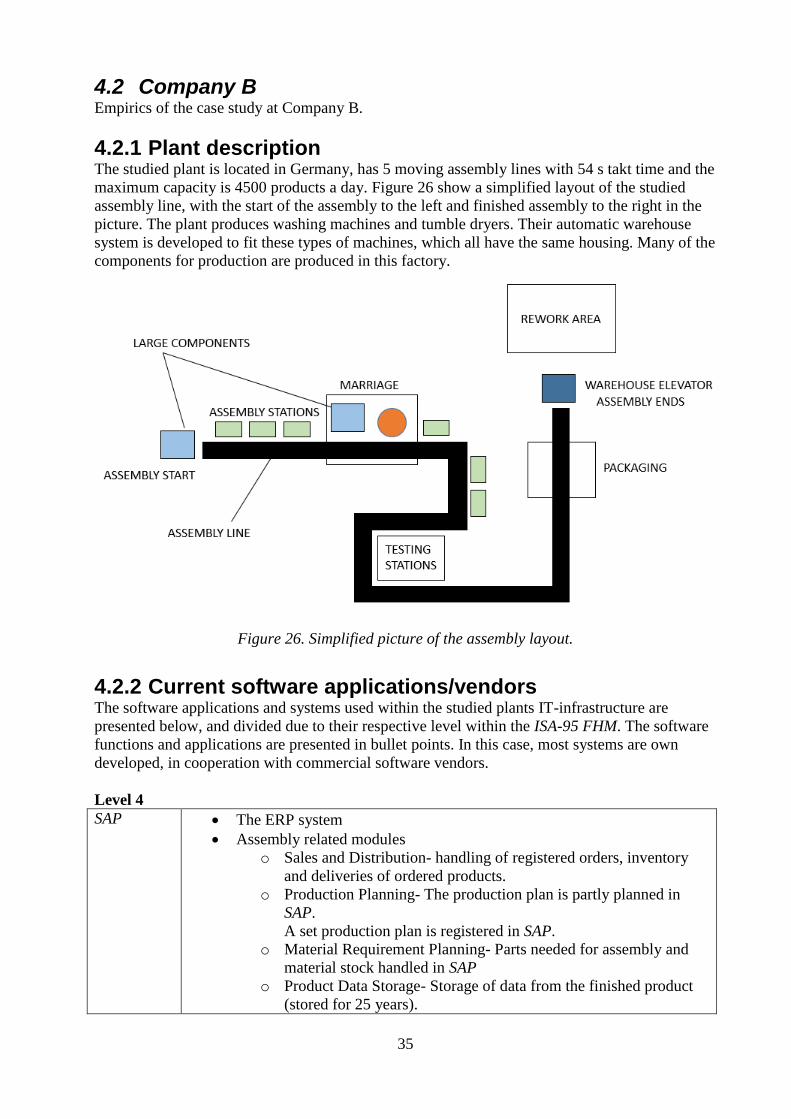
35
4.2 Company B Empirics of the case study at Company B.
4.2.1 Plant description The studied plant is located in Germany, has 5 moving assembly lines with 54 s takt time and the
maximum capacity is 4500 products a day. Figure 26 show a simplified layout of the studied
assembly line, with the start of the assembly to the left and finished assembly to the right in the
picture. The plant produces washing machines and tumble dryers. Their automatic warehouse
system is developed to fit these types of machines, which all have the same housing. Many of the
components for production are produced in this factory.
Figure 26. Simplified picture of the assembly layout.
4.2.2 Current software applications/vendors The software applications and systems used within the studied plants IT-infrastructure are
presented below, and divided due to their respective level within the ISA-95 FHM. The software
functions and applications are presented in bullet points. In this case, most systems are own
developed, in cooperation with commercial software vendors.
Level 4
SAP The ERP system
Assembly related modules
o Sales and Distribution- handling of registered orders, inventory
and deliveries of ordered products.
o Production Planning- The production plan is partly planned in
SAP.
A set production plan is registered in SAP.
o Material Requirement Planning- Parts needed for assembly and
material stock handled in SAP
o Product Data Storage- Storage of data from the finished product
(stored for 25 years).

36
Excel Used to create charts and graphs to visualize the production data over
time.
Level 3
MES-B1 MES- Developed by themselves in collaboration with different software
developers, such as IBM. The system has been continuously developed
and improved for 25 years.
Coordinates ALS-B1 and LS-B1 to deliver the right products and
components ‘just-in-sequence’.
Collect quality data of the product, such as tightening and test data.
o The quality data are kept in MES-B1 for three weeks, in case of
potential rework which can be fixed during this period. After three
weeks the data is transferred to SAP.
Excel Additional software to the Production Planning in SAP
Level 2
LS-B1 SCADA- Logistics
Logistic transport system of material and components
The system is developed by the company themselves.
Receives the production sequence from MES-B1. LS-B1 enables the
components to arrive ‘just in sequence’ within the assembly process.
ALS-B1 SCADA- Assembly Line
Assembly system that communicates data between the shop floor and
MES-B1.
The system is developed by the company themselves.
Receives the production plan for the next eight hours. In this way ALS-B1
is
Ability to function independent of MES-B1 for the next eight hours, for
example if MES-B1 is down during service.
By scanning the barcode at each assembly station the ALS-B1 system can
keep track of each product.
The ALS-B1 system also filters and registers the important tightening data
and sends it further to MES-B1
WS-C1 SCADA- Warehouse
Automatic warehouse system.
Developed by Siemens
Store housings and finished goods
CS-1 The controller is connected to tools and the ALS-B1.
It reports OK or NOK of tightening to the ALS-B1 system.

37
4.2.3 Current system architecture The system architecture for the studied Company B plant is presented in the BPMN mapping in
Figure 27. The 'Current assembly process' describes the BPMN map from the perspective of the
assembly process of one of the plants seven assembly lines.
Figure 27. BPMN-model, Company B
Current assembly process
An assembly order starts when a customer order is placed and registered in SAP (Sales and
Distribution, level 4). Thereafter the production planning department use SAP, but also Excel as
complementary software, to schedule the orders into the production plan (Production
Scheduling, level 4). The department manually plans and dispatches the production of the 5
lines, because not every product can be produced on every line. From SAP, the production plan
department gets the information of which components are required for the different types of
products (Material Requirement Planning, level 4). When the production plan is set for the
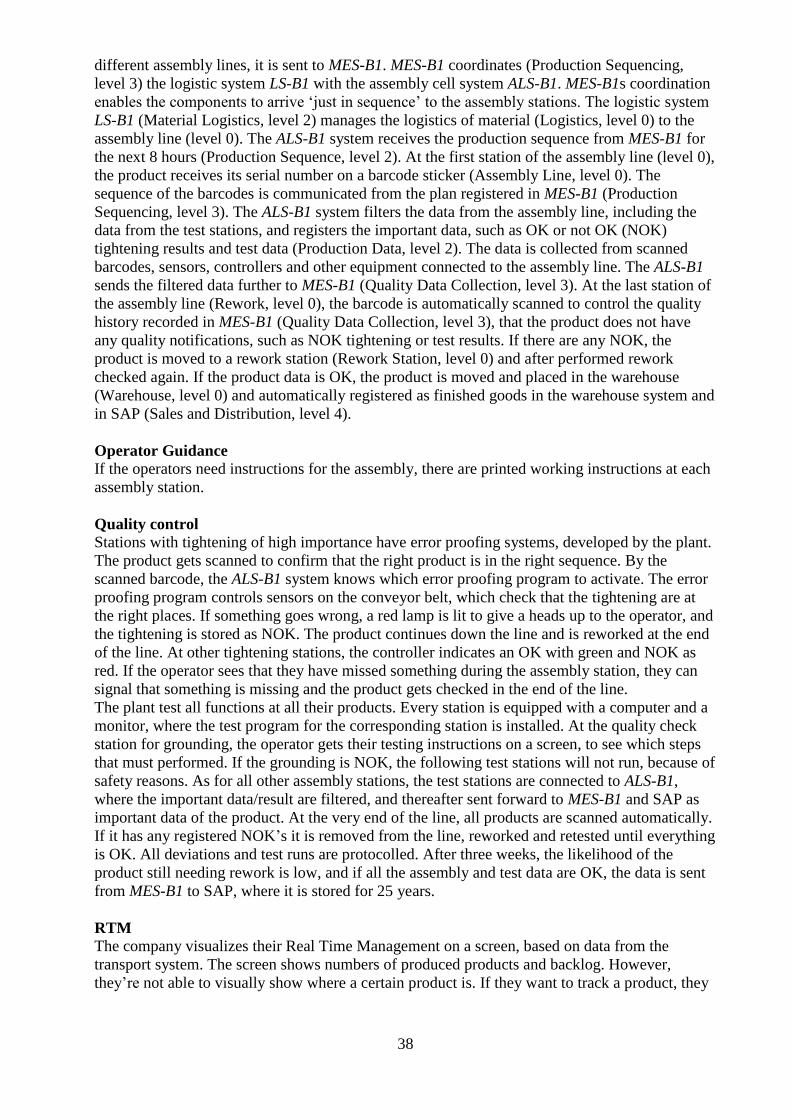
38
different assembly lines, it is sent to MES-B1. MES-B1 coordinates (Production Sequencing,
level 3) the logistic system LS-B1 with the assembly cell system ALS-B1. MES-B1s coordination
enables the components to arrive ‘just in sequence’ to the assembly stations. The logistic system
LS-B1 (Material Logistics, level 2) manages the logistics of material (Logistics, level 0) to the
assembly line (level 0). The ALS-B1 system receives the production sequence from MES-B1 for
the next 8 hours (Production Sequence, level 2). At the first station of the assembly line (level 0),
the product receives its serial number on a barcode sticker (Assembly Line, level 0). The
sequence of the barcodes is communicated from the plan registered in MES-B1 (Production
Sequencing, level 3). The ALS-B1 system filters the data from the assembly line, including the
data from the test stations, and registers the important data, such as OK or not OK (NOK)
tightening results and test data (Production Data, level 2). The data is collected from scanned
barcodes, sensors, controllers and other equipment connected to the assembly line. The ALS-B1
sends the filtered data further to MES-B1 (Quality Data Collection, level 3). At the last station of
the assembly line (Rework, level 0), the barcode is automatically scanned to control the quality
history recorded in MES-B1 (Quality Data Collection, level 3), that the product does not have
any quality notifications, such as NOK tightening or test results. If there are any NOK, the
product is moved to a rework station (Rework Station, level 0) and after performed rework
checked again. If the product data is OK, the product is moved and placed in the warehouse
(Warehouse, level 0) and automatically registered as finished goods in the warehouse system and
in SAP (Sales and Distribution, level 4).
Operator Guidance
If the operators need instructions for the assembly, there are printed working instructions at each
assembly station.
Quality control
Stations with tightening of high importance have error proofing systems, developed by the plant.
The product gets scanned to confirm that the right product is in the right sequence. By the
scanned barcode, the ALS-B1 system knows which error proofing program to activate. The error
proofing program controls sensors on the conveyor belt, which check that the tightening are at
the right places. If something goes wrong, a red lamp is lit to give a heads up to the operator, and
the tightening is stored as NOK. The product continues down the line and is reworked at the end
of the line. At other tightening stations, the controller indicates an OK with green and NOK as
red. If the operator sees that they have missed something during the assembly station, they can
signal that something is missing and the product gets checked in the end of the line.
The plant test all functions at all their products. Every station is equipped with a computer and a
monitor, where the test program for the corresponding station is installed. At the quality check
station for grounding, the operator gets their testing instructions on a screen, to see which steps
that must performed. If the grounding is NOK, the following test stations will not run, because of
safety reasons. As for all other assembly stations, the test stations are connected to ALS-B1,
where the important data/result are filtered, and thereafter sent forward to MES-B1 and SAP as
important data of the product. At the very end of the line, all products are scanned automatically.
If it has any registered NOK’s it is removed from the line, reworked and retested until everything
is OK. All deviations and test runs are protocolled. After three weeks, the likelihood of the
product still needing rework is low, and if all the assembly and test data are OK, the data is sent
from MES-B1 to SAP, where it is stored for 25 years.
RTM
The company visualizes their Real Time Management on a screen, based on data from the
transport system. The screen shows numbers of produced products and backlog. However,
they’re not able to visually show where a certain product is. If they want to track a product, they
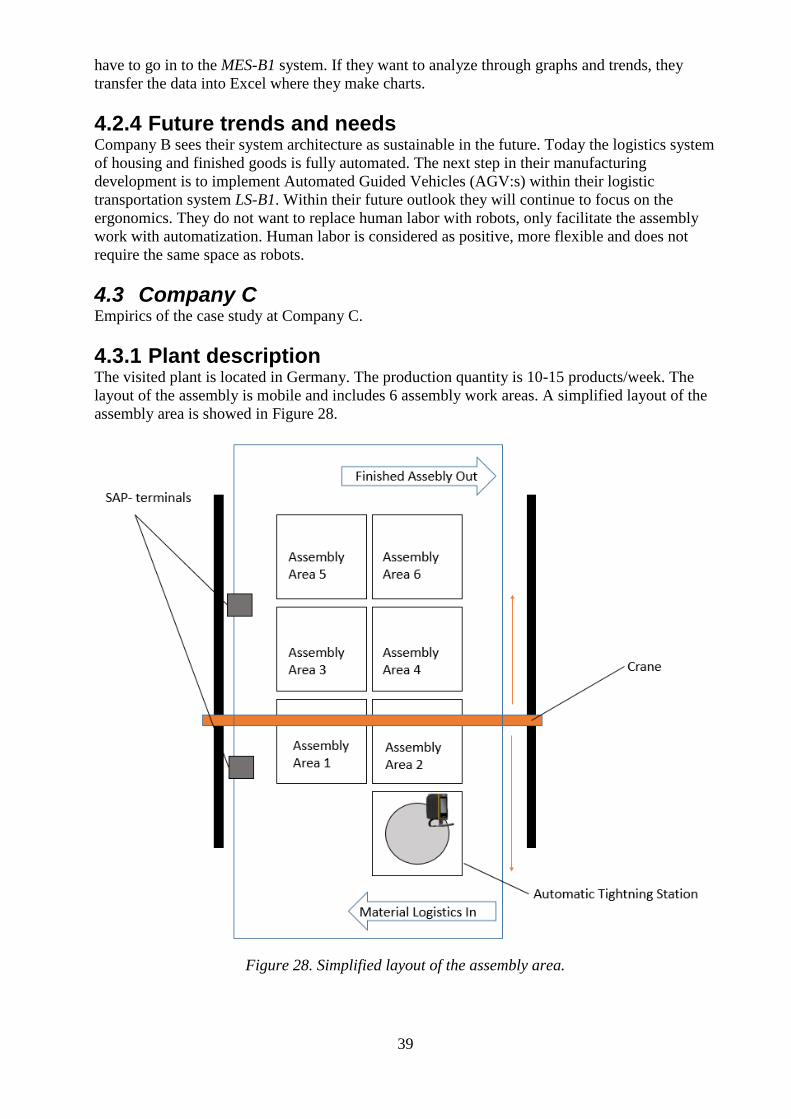
39
have to go in to the MES-B1 system. If they want to analyze through graphs and trends, they
transfer the data into Excel where they make charts.
4.2.4 Future trends and needs Company B sees their system architecture as sustainable in the future. Today the logistics system
of housing and finished goods is fully automated. The next step in their manufacturing
development is to implement Automated Guided Vehicles (AGV:s) within their logistic
transportation system LS-B1. Within their future outlook they will continue to focus on the
ergonomics. They do not want to replace human labor with robots, only facilitate the assembly
work with automatization. Human labor is considered as positive, more flexible and does not
require the same space as robots.
4.3 Company C Empirics of the case study at Company C.
4.3.1 Plant description The visited plant is located in Germany. The production quantity is 10-15 products/week. The
layout of the assembly is mobile and includes 6 assembly work areas. A simplified layout of the
assembly area is showed in Figure 28.
Figure 28. Simplified layout of the assembly area.
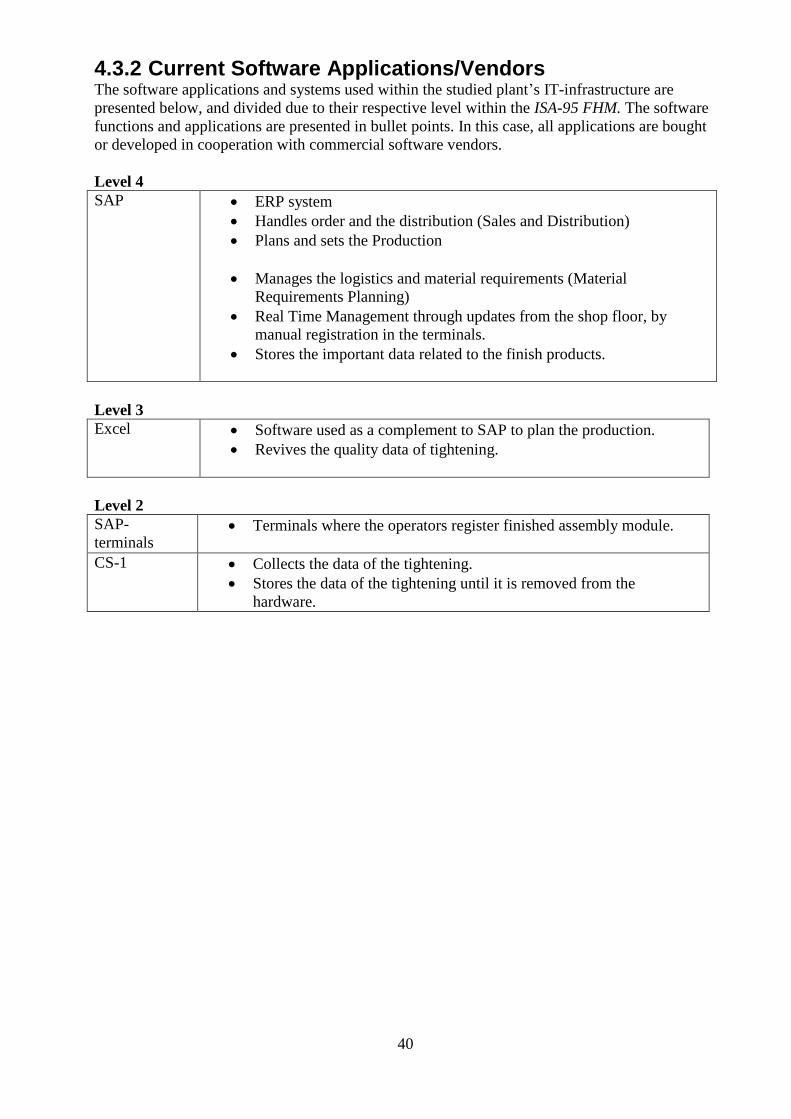
40
4.3.2 Current Software Applications/Vendors The software applications and systems used within the studied plant’s IT-infrastructure are
presented below, and divided due to their respective level within the ISA-95 FHM. The software
functions and applications are presented in bullet points. In this case, all applications are bought
or developed in cooperation with commercial software vendors.
Level 4
SAP ERP system
Handles order and the distribution (Sales and Distribution)
Plans and sets the Production
Manages the logistics and material requirements (Material
Requirements Planning)
Real Time Management through updates from the shop floor, by
manual registration in the terminals.
Stores the important data related to the finish products.
Level 3
Excel Software used as a complement to SAP to plan the production.
Revives the quality data of tightening.
Level 2
SAP-
terminals Terminals where the operators register finished assembly module.
CS-1 Collects the data of the tightening.
Stores the data of the tightening until it is removed from the
hardware.
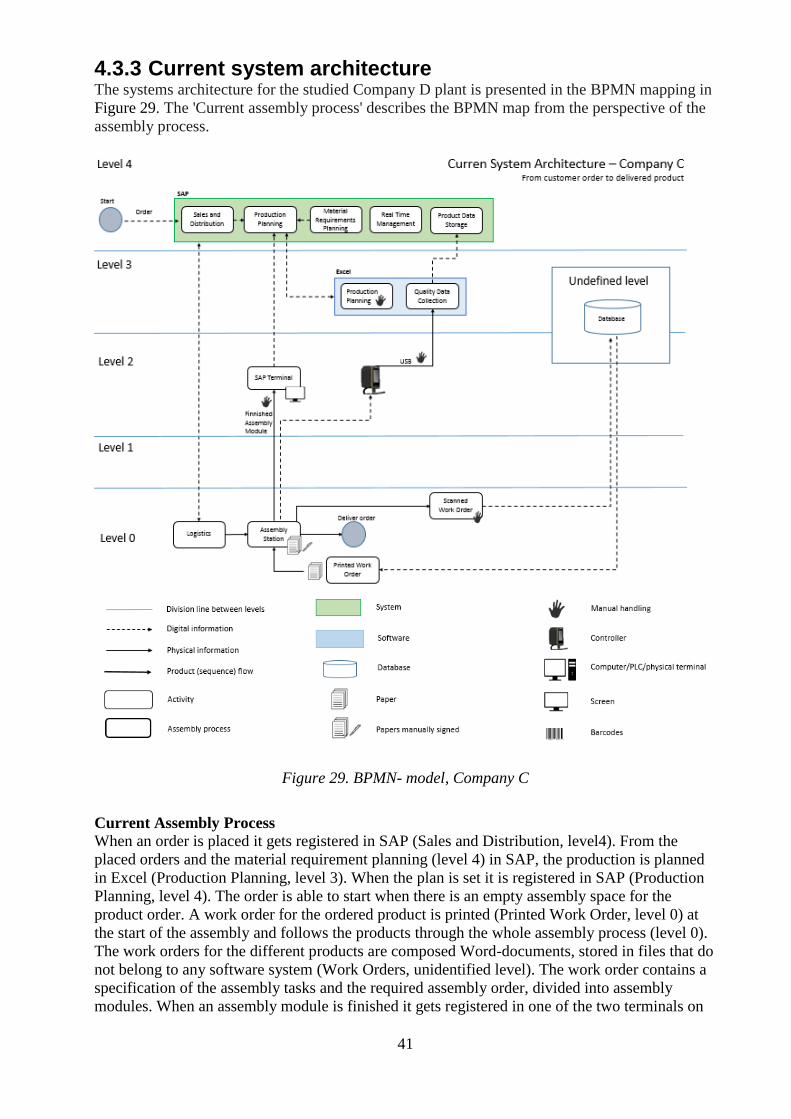
41
4.3.3 Current system architecture The systems architecture for the studied Company D plant is presented in the BPMN mapping in
Figure 29. The 'Current assembly process' describes the BPMN map from the perspective of the
assembly process.
Figure 29. BPMN- model, Company C
Current Assembly Process
When an order is placed it gets registered in SAP (Sales and Distribution, level4). From the
placed orders and the material requirement planning (level 4) in SAP, the production is planned
in Excel (Production Planning, level 3). When the plan is set it is registered in SAP (Production
Planning, level 4). The order is able to start when there is an empty assembly space for the
product order. A work order for the ordered product is printed (Printed Work Order, level 0) at
the start of the assembly and follows the products through the whole assembly process (level 0).
The work orders for the different products are composed Word-documents, stored in files that do
not belong to any software system (Work Orders, unidentified level). The work order contains a
specification of the assembly tasks and the required assembly order, divided into assembly
modules. When an assembly module is finished it gets registered in one of the two terminals on
42
the shop floor, which are connected to SAP (SAP- Terminal, level 2). The operator logs on to
the terminal with their operator ID and registers which task has been done on the specific
product. Since the logistics is handled through SAP, the logistics (level 0) gets updated and
deliver the right components for the right assembly module to the assembly station. The
performed tasks and modules are manually signed by the operators in the work orders. When the
last assembly module is finished it is registered in SAP which registers the product as finished
goods. The finished assembly is then moved from the assembly space to be transported out to be
delivered (level 0). A finished work order, containing the assembly information, is then scanned
(Scanned Work Order, level 0) and stored in a database (Database, undefined level).
Operator Guidance
The plant does not use any digital operator guidance within their assembly. The operators get
trained within the different assembly modules. Only special or important tasks include
instructions in the work order. There is little variation between the product types and only the
parts brought to the working space are needed. Due to the logistic system, the workers training
and experience and the design of the product, the risk of an operator error is reduced.
Quality control
To check the quality during the assembly, one operator with quality responsibility performs
visual checks due to corresponding checklist of the module (level 0). This type of quality check
must be performed and approved before a module can be reported as finished in the SAP
terminal (level 2). If the operator identifies the need of an extra quality control, a quality check
during the assembly can be performed as well.
The plant save the tightening data within the controller (CS-1, level 2) until it is transferred, once
a week, through a USB, to an Excel-sheet (Quality Data Collection, level 2). Data of the product
is then transferred to SAP where it is stored. One assembly module is performed automatically
by a programmed PLC (Assembly Stations, level 0). This module does also have automatic
quality check that is programmed to approve three different tightenings in a row, before
approving the assembly. The logic needed for this quality test cannot be performed by the
currently used CS-1.
Real Time Management
The plant’s system for real time management is based on the updates from the assembly modules
of each product order, which are logged in SAP (Real Time Management, level 2). Because of
this logging, one can use the terminals to track a certain product and see at which production step
it is (SAP Terminal, level 2), although this is not the original purpose of these terminals.
4.3.4 Future trends and needs The plant sees CSS-1 as a too complex system that provides functions they do not require. They
are therefore looking for another software solution that is cheaper and provides only the
functions that they need. Functions that they require are data of the tightening, obtaining traces
of how the tightening torque change over time, and the ability to store chosen tightening data.
The future outlook of the plant requires a greater possibility to store large amount of data, which
today is not possible for their hand held tools. The plant also identify safety as a big question for
the future, which also set requirements on traceability and data storage of tightening, in order to
prove that the assembly was correctly performed.
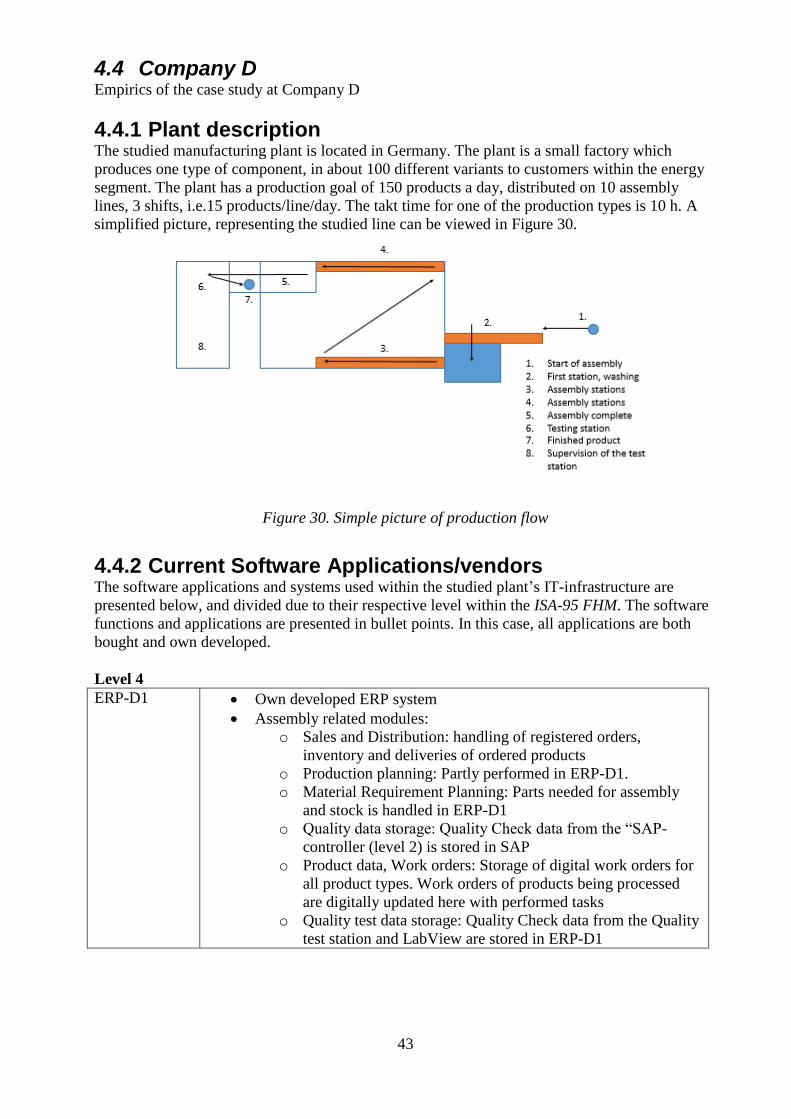
43
4.4 Company D Empirics of the case study at Company D
4.4.1 Plant description The studied manufacturing plant is located in Germany. The plant is a small factory which
produces one type of component, in about 100 different variants to customers within the energy
segment. The plant has a production goal of 150 products a day, distributed on 10 assembly
lines, 3 shifts, i.e.15 products/line/day. The takt time for one of the production types is 10 h. A
simplified picture, representing the studied line can be viewed in Figure 30.
Figure 30. Simple picture of production flow
4.4.2 Current Software Applications/vendors The software applications and systems used within the studied plant’s IT-infrastructure are
presented below, and divided due to their respective level within the ISA-95 FHM. The software
functions and applications are presented in bullet points. In this case, all applications are both
bought and own developed.
Level 4
ERP-D1 Own developed ERP system
Assembly related modules:
o Sales and Distribution: handling of registered orders,
inventory and deliveries of ordered products
o Production planning: Partly performed in ERP-D1.
o Material Requirement Planning: Parts needed for assembly
and stock is handled in ERP-D1
o Quality data storage: Quality Check data from the “SAP-
controller (level 2) is stored in SAP
o Product data, Work orders: Storage of digital work orders for
all product types. Work orders of products being processed
are digitally updated here with performed tasks
o Quality test data storage: Quality Check data from the Quality
test station and LabView are stored in ERP-D1

44
Level 3
Excel Detailed planning: Complementing tool for the production plan in
ERP-D1. Detailed planning, and a more visual plan is created and
printed to the shop floor
CSS-1
Quality data collection: Storage of tightening data
Storage of controller configurations
Level 2
CS-1 Monitoring of physical processes: Indicates an OK tightening with
green light, and a NOK with a red light
Controlling of physical processes: Holds programming and P-sets for
the connected tools.
LabView Monitoring of physical processes: Display the test results from the
PLC controlled Quality Check station
Excel Monitoring and Control of physical processes: Creates and shows
quality test statistics
OG-1 Monitoring of physical processes:
o Display the location of tightenings
o Display which tool head to use
Undefined level
Database Quality data storage from test results and manually updated Logbook,
both from Excel

45
4.4.3 Current System architecture The system architecture for the studied Company D plant is presented in the BPMN map in
Figure 31. The 'Current assembly process' describes the BPMN map from the perspective of the
assembly process of one of the plants ten assembly lines.
Figure 31. BPNM- model, Company D
Current assembly process
The company has an own developed ERP, called ERP-D1 (level 4). Placed orders are registered
and planned in ERP-D1 (Sales and Distribution & Production planning level 4). ERP-E1 does
not cover all required planning functions. Therefore, Excel is used as a complement (Detailed
planning, level 3). When a first draft of the production plan is done, it is discusses during a
capacitation meeting with the assembly process manager and production coordinators (Weekly
meetings, level 0). After the meeting, the plan gets revised or directly approved. The production
plan is updated twice a week, and a more visual version made in Excel (Detailed Planning, level
3) is printed to the shop floor (Assembly Process, level 0). The production plan, stored in in
ERP-E1 (Production Planning, level 4), is used by the Logistic department (Logistics, level 0),
who are responsible for bringing the right parts at the right time to the shop floor (Assembly
process, level 0).
Work Orders (WO), with specifications of the assembly task order for the product, are printed
from ERP-D1 (Product Data, Work Orders, level 4), and manually dispatched before the
production starts (Dispatching, level 0). The printed WO’s can get complemented with some
handwritten notes from the planner (Dispatching, level 0). The work order follows the product
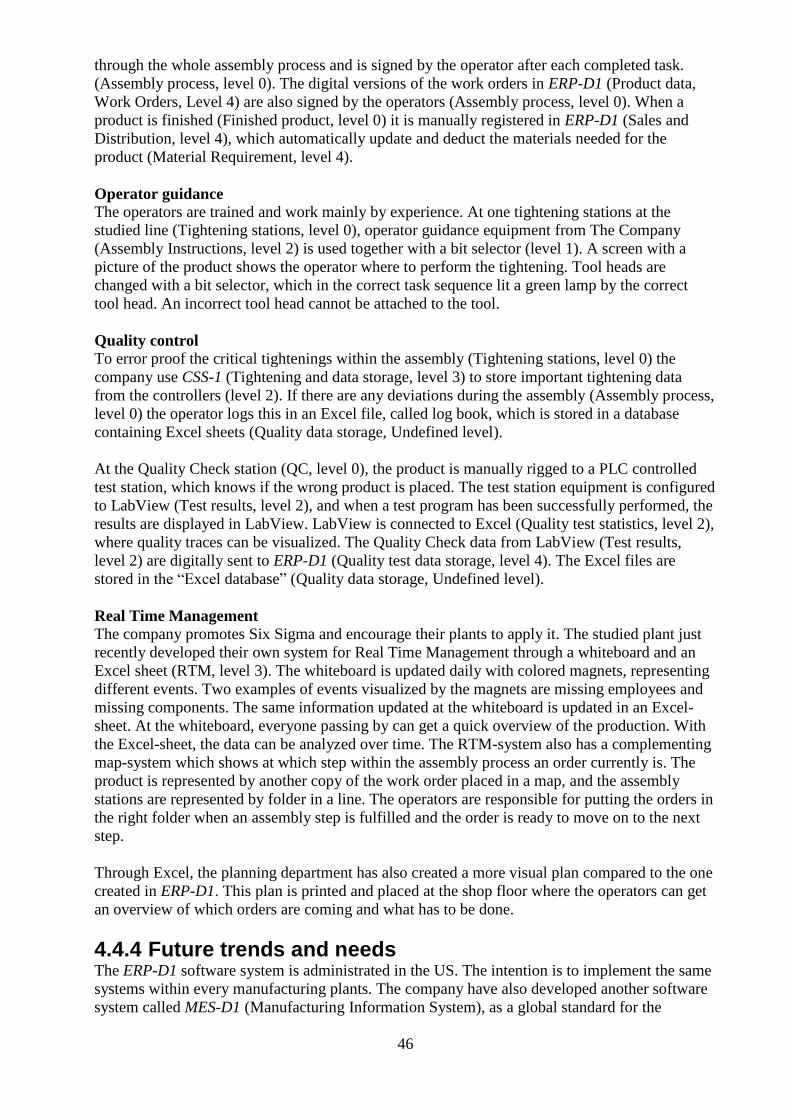
46
through the whole assembly process and is signed by the operator after each completed task.
(Assembly process, level 0). The digital versions of the work orders in ERP-D1 (Product data,
Work Orders, Level 4) are also signed by the operators (Assembly process, level 0). When a
product is finished (Finished product, level 0) it is manually registered in ERP-D1 (Sales and
Distribution, level 4), which automatically update and deduct the materials needed for the
product (Material Requirement, level 4).
Operator guidance
The operators are trained and work mainly by experience. At one tightening stations at the
studied line (Tightening stations, level 0), operator guidance equipment from The Company
(Assembly Instructions, level 2) is used together with a bit selector (level 1). A screen with a
picture of the product shows the operator where to perform the tightening. Tool heads are
changed with a bit selector, which in the correct task sequence lit a green lamp by the correct
tool head. An incorrect tool head cannot be attached to the tool.
Quality control To error proof the critical tightenings within the assembly (Tightening stations, level 0) the
company use CSS-1 (Tightening and data storage, level 3) to store important tightening data
from the controllers (level 2). If there are any deviations during the assembly (Assembly process,
level 0) the operator logs this in an Excel file, called log book, which is stored in a database
containing Excel sheets (Quality data storage, Undefined level).
At the Quality Check station (QC, level 0), the product is manually rigged to a PLC controlled
test station, which knows if the wrong product is placed. The test station equipment is configured
to LabView (Test results, level 2), and when a test program has been successfully performed, the
results are displayed in LabView. LabView is connected to Excel (Quality test statistics, level 2),
where quality traces can be visualized. The Quality Check data from LabView (Test results,
level 2) are digitally sent to ERP-D1 (Quality test data storage, level 4). The Excel files are
stored in the “Excel database” (Quality data storage, Undefined level).
Real Time Management
The company promotes Six Sigma and encourage their plants to apply it. The studied plant just
recently developed their own system for Real Time Management through a whiteboard and an
Excel sheet (RTM, level 3). The whiteboard is updated daily with colored magnets, representing
different events. Two examples of events visualized by the magnets are missing employees and
missing components. The same information updated at the whiteboard is updated in an Excel-
sheet. At the whiteboard, everyone passing by can get a quick overview of the production. With
the Excel-sheet, the data can be analyzed over time. The RTM-system also has a complementing
map-system which shows at which step within the assembly process an order currently is. The
product is represented by another copy of the work order placed in a map, and the assembly
stations are represented by folder in a line. The operators are responsible for putting the orders in
the right folder when an assembly step is fulfilled and the order is ready to move on to the next
step.
Through Excel, the planning department has also created a more visual plan compared to the one
created in ERP-D1. This plan is printed and placed at the shop floor where the operators can get
an overview of which orders are coming and what has to be done.
4.4.4 Future trends and needs The ERP-D1 software system is administrated in the US. The intention is to implement the same
systems within every manufacturing plants. The company have also developed another software
system called MES-D1 (Manufacturing Information System), as a global standard for the

47
company’s manufacturing plants. The software aims to give the operator information and
guidance within every assembly step. The implementation of the MES-D1 software failed within
the studied plant when they did not have the competence in-house to finish the implementation.
4.5 Company E Empirics of the case study at Company E.
4.5.1 Plant description The plant is located in Germany. A picture of the assembly is visualized in Figure 32.
Figure 32. Simplified assembly layout of one of the assembly levels at Company E
4.5.2 Current Software Applications/vendors The software applications and systems used within the studied plants IT-infrastructure are
presented below, and divided due to their respective level within the ISA-95 FHM. The software
functions and applications are presented in bullet points. In this case, both bought and own
developed systems were identified.
Level 4
SAP ERP system
Level 3
MES-E1 MES- developed by Company E.
Developed for 20 years
The system is used in all the Company E plants, worldwide.
Plans the production.
48
Sends out tasks to the sub-systems
Manages the electronical work orders
TS-E1 The systems of tightening
Saves the important tightening data
Includes operator guidance
KUKA Robot system
Sub-system
4.5.3 Current System architecture The system architecture for the studied Company E plant is presented in the BPMN mapping in
Figure 33. The 'Current assembly process' describes the BPMN map from the perspective of the
assembly process.
Figure 33. BPMN-model, Company E

49
Current Assembly Process
A production order is registered in the SAP-ERP system (Sales and Distribution, level 4). The
order is communicated and planned (Production Planning and Material Requirements Planning,
level 3) in their own developed MES system - MES-E1. The MES-E1 coordinates and sends out
subtasks to the sub-systems (Coordinating Sub-systems, level 3), such as logistics and the robot
systems (KUKA-system, level 3), which it also coordinates. The car bodies arrives pained from
another factory and are placed in a que. The assembly starts (Assembly Line, level 0) when a car
body gets pricked up by a ceiling conveyer crane and placed on the slowly moving conveyor
floor, i.e. the moving assembly line. At the first station, the product is provided with a barcode
on each side of the car. The bar code identifies the car throughout the assembly. Between the
stations the AGV’s have the ability to provide the stations with the right material for the current
assembly. The logistic department (Logistics, level 0) gets their instruction from MES-E1 and
supplies the AGV’s with the right material for the corresponding station. The AGVs travel
between the logistic and assembly levels through an AGV elevator. At each station the assembly
order, the car, gets scanned. The system can thereby discover if an order is at the wrong station.
By scanning the assembly the operators gets the right working instructions through an
electronical work order of the assembly from MES-E1 (Work Order, level 3), but also provided
with operator guidance for the tightening through the TS-E1- system (Operator Guidance of
Tightening, level 3). The operator checks-off the assembly tasks electronically within the system,
which gets directly updated about the progress. When an assembly order has proceeded through
all the stations within the assembly floor, it proceeds to the lower floor, until the assembly
process is finished at the ground floor. One of the last stations at the line, the car gets checked,
through the assembly protocols in MES-E1, if there is any rework necessary (Rework, level 0). If
it is, the assembly gets transported to a Rework Station (level 0). When the whole assembly is
checked and there is no notifications of deviations within the MES-E1 protocols, the car gets
tested driven (Testing, level 0), first in a simulator and then outside. Afterwards, it washed and
goes through a light tunnel where it is visually inspected, before it is stored in the finished
storage. When the product is finished, the MES-E1 system reports to SAP that the order is
finished.
Operator Guidance
The operator guidance includes guidance of two perspectives; work order and tightening.
The operators are trained in their assembly tasks, therefore instructions of each assembly task are
not necessary at the assembly stations. To facilitate the handling of each assembly order, the
work order of each assembly is digital, managed by MES-E1. The operators reach the work order
through a tablet device or a terminal. At the assembly stations, the operator can scan the barcode
of the assembly object and get the work order wirelessly from MES-E1 to a tablet device or a
terminal (level 2). If an assembly order is placed incorrectly, the system will discover it and will
thereby not function. The work order contains which task the assembly station includes and a
Quality list of the assembly tasks. When an assembly task has been performed, the operator
registers this in the tablet/terminal with an OK in the Quality list, their operator number and the
date when the task was completed.
By scanning the barcodes, the operator is also provided with guidance through the TS-E1 system.
TS-E1 is connected to a tablet device, another one than the tablet connected to MES-E1. The
tablet guides the operator to perform the right tightening in the right order, through showing a
picture of the placement of the tightening. The TS-E1 tablet also shows the operator the respond
of the tightening, green for OK and red for NOK. All critical tightening are stored in TS-E1
system. If a faulty tightening occurs, the car continues in the assembly flow and the NOK’s are
reworked at a rework station at the end of the line.

50
Quality control
Through the registration of each performed assembly task in the Quality list, MES-E1 gets
updated about the assembly process and the quality of each order. At the end of the assembly
line the assembly goes through a quality control station, where every car is scanned manually.
Through a terminal connected to MES-E1, the operator gets lists of all the performed assembly
steps. The operator checks the list of performed tasks to see that everything is performed correct,
and thereby marked with green. If there is any NOK at an assembly task, a red mark, the operator
can make sure that the NOK’s gets fixed before it continues further in the quality process.
Real Time Management
By the transportation system it is possible to view where an order is within the assembly
procedure.
4.5.4 Future trends and needs The factory was newly updated and therefore the manufacturing IT system is developed to
handle the future demands.
51
5 ANALYSIS Following chapter presents the analysis of the study, where the case studies are compared to
each other and to the literature review The chapter is structured by current system architecture,
operator guidance, quality control, real time management and future trends and needs.
5.1 Current system architecture Even though the literature expressed that fully established connected production networks are
rare (Optico AB, 2016), highly connected system architectures could be identified at Company B
and Company E. However, they did not contain only one system, such as only one ERP system
connected directly to the shop floor, which Günther (2008) expressed. Instead, the architectures
were well-defined with a high similarity to the recommendations of ISA-95 FHM. The structure
was clearly hierarchical and both of the system architectures included MES systems. The MES’s
performed typical MES-functions, such as data collection, quality management and information
management (Günther, 2008) digitally, and both systems architectures had a high level of
connectivity. Even though Günther (2008) emphasized that a strictly layered approach is no
longer feasible in IT environments of the new manufacturing era, Company B expressed that
their system architecture is considered sustainable for their future production demands too.
Bianca Scholten (2007) stated that the purpose and scope of ISA-95, was to minimize the
“communication gap” that can appear between the enterprise and control domain. Both Company
A and Company C wanted to skip the levels between the shop and top floor, and none of the
cases had MES-systems. Kagermann, Wahlster & Helbig (2013) state that one benefit of vertical
and horizontal integration is that it enables end-to-end engineering across the value chain, from
product order to finished goods. Company A and Company C were characterized by a low level
of horizontal and vertical integration, and by manual tasks, data collection, and work within
Excel. Company D, with the same characteristics, did not have an MES system either. Compared
to Company B and primarily Company E, Company A and Company C did not have much
technical assistance, such as robots, RFID and other technology, which according to Hermann,
Pentek, & Otto (2016) is required in a production future with increasing complexity.
Marry Sumner (2009) emphasizes the importance of in-house competence to reach a successful
implementation of an ERP system. A parallel can be drawn to a successive implementation of all
systems within a system architecture. The in-house developed systems at Company B and
Company E were well-conceived, and had been continuously developed and improved for many
years. The importance of in house competence was also reflected by Company D, where the
implementation of MES-D1, by the authors interpreted as an MES, failed due to lacking in house
competence. The importance of collaboration between manufacturers and solution providers to
identify best practice, expressed by Helu, Morris, Jung, Lyons & Leong (2015) could also be
identified at Company D. The aim of Company D’s own developed systems, ERP-D1 and MES-
D1, is to implement them at all plants globally. However, ERP-D1 did not fulfill vital
requirements that the visited plant had. A collaboration between manufacturers and solution
providers, i.e. SAP, was also reflected at both Company A and Company C, whose system
architectures only included applications from SAP, not only at level 4. Both cases showed an
interest of further integration of equipment directly into the SAP-ERP system. Which equipment
and how, was not further investigated during the visits.
5.2 Operator Guidance ‘Quality’ is one of the key capabilities of Smart Manufacturing according to (National Institute
of Standards and Technology, 2016). In most of the cases, much work was performed manually.
Without operator guidance, i.e. ‘Technical assistance’, mentioned in the previous sub-chapter,
the operators have more freedom in their way of working, which can lead to quality deviations.
Digital OGS’s were only found at Company E for the entire assembly process. At Company B
52
and Company D, some stations were equipped with digital OGS’s, and others by papers, placed
at the corresponding station. Company A and Company C, only had paper based operator
guidance instructions.
5.3 Quality Control ‘Quality’ has always been essential within manufacturing. Quality defects can lead to a damaged
brand reputation or expensive rework, recalls or summons due to security. ‘Quality’ is also one
of the future key capabilities of Smart Manufacturing according to National Institute of
Standards and Technology (2016). The demands and requirements on quality were identified
within all cases. Company A, Company D and Company C requested better storage and
traceability of the quality data, due to both their own and for example the governments
regulations.
“With increasing complexity within production, humans require support by assistance systems
and technology that interact with humans in the industry, such as robots and RFID, in order to
meet the quality requirements” (Hermann, Pentek, & Otto, 2016) However, Company A,
Company D and Company C were characterized by a low degree of automation. Even though
Company D had several different software systems, such as CSS-1, CCS-1 and an Operator
Guidance system from The Company, all plants partly handled their quality control manually,
with paperwork or/and through Excel. Excel was in all three cases used for detailed planning,
storage of production and quality data, and to create charts and traces of quality over time.
However, the above mentioned “assistance systems” were identified at Company B and
Company E. Their system architectures and own built systems provided automatic built-in-
quality, and automatic data collection by sensors and barcodes. According to Rayes & Salam
(2017), IoT refers to the network of physical elements with technology like sensors and
identifiers. They also state that by Building up a network, through sensors, middleware, software
and backend cloud compute and storage systems, IoT can provide better visibility and insight
into a company’s operations and assets, enabling increased operational efficiency and the
productivity, reduced down time and thereby optimized profit. That was identified at Company B
and Company E. The “IoT equipment” enables the aggregation product and process data, which
can be analyzed in order to identify constrains and imporovement areas (Kueppers, 2016). The
“IoT equipment also enables a faster innovation cycle through big data analytics and advanced
sensors (National Institute of Standards and Technology, 2016). However, in spite of the
automatic data collection through sensors at Company B, production charts and trends were
manually created in Excel.
5.4 Real Time Management According to Kletti (2007), an RTM helps the production to react and adapt more quickly and
cost-efficiently in order to reach requirements. This can be directly linked to agility, a key
capability of SMS. Even though digitalization is a main characteristic of Smart Manufacturing
according to the National Institute of Standards and Technology (2016), all the visited cases
were lacking well-developed and visual RTM-systems. Company D was trying out a manually
handled RTM system, i.e. without the connected devices mentioned in the literature. The real
time control was considered, but a manually updated system, through both a whiteboard and an
excel file is not agile, and it implies non-value adding work, responsibility and time from the
operators. Company A, who requested more flexible systems in the future, was handling their
“RTM” by showing production numbers on a screen, manually updated, while Company C had
no visualization of their production. When somebody wanted to know how par along the
production a certain product was at Company A or Company D, they had to go and look among
the work orders along the production. At Company C, the terminals could be used in order to see

53
which assembly modules were performed. However, the terminals were manually updated, and
there was no way of knowing how far along a product was within an assembly module.
IoT can according to Lu & Cecil (2016) provide monitoring and control of the production flow
in real-time, which can eliminate wasted time and reduce the in-process inventory. According to
the National Institute of Standards and Technology (2016), Connected devices and distributed
intelligence leads to real time control and flexible production of small batch products. As
mentioned above, Company B and Company E were identified to be in the forefront of
technologic equipment and automatization. However, Company B did not gain full advantage of
the automatic data collection. A visualized Real Time Management system keeping track of for
example WIP and bottle necks was missing, and they did not express a need of such a system
either.
5.5 Future trends and needs The trend within the new manufacturing era shows according to Günther (2008), that a strictly
layered approach is no longer feasible in modern IT environments and that modern business
trends ask for more flexible and service-oriented architectures, which allows both a vertical
integration. Company E was in the forefront of technology and had a high connectivity, which is
required in an Industy 4.0 environment. However, the hierarchical structure of ISA-95 FHM
could still be identified. The only case expressing a need of greater flexibility in the future was
Company A, due to their already customized products.
According to Optico AB (2016) Industry 4.0 entails automated and autonomous factories, where
materials, products and equipment will communicate with each other, exchanging information
and instructions in real time and where workers only interfere if any corrections are needed.
However, many of the cases had much manual data collection and work. Even Company B, the
Divison 1 case with the highest level of connectivity, expressed that they do not want to replace
all human labor in the future.
Even though the literature forecast a greater need of technical assistance in the future, Company
C expressed that CSS-1 is a too complex system that provides functions that for them are
unnecessary. They are therefore looking for another software solution that are cheaper and
provides the functions that they need.
To assure that the smart manufacturing technologies are adaptable to each other and existing
manufacturing system, it is critical that manufacturers and solution providers collaborate to
identify best practice (Helu, Morris, Jung, Lyons, & Leong, 2015). The need of collaboration
was identified at Company A and Company C, who both expressed a future collaboration with
SAP too.

54
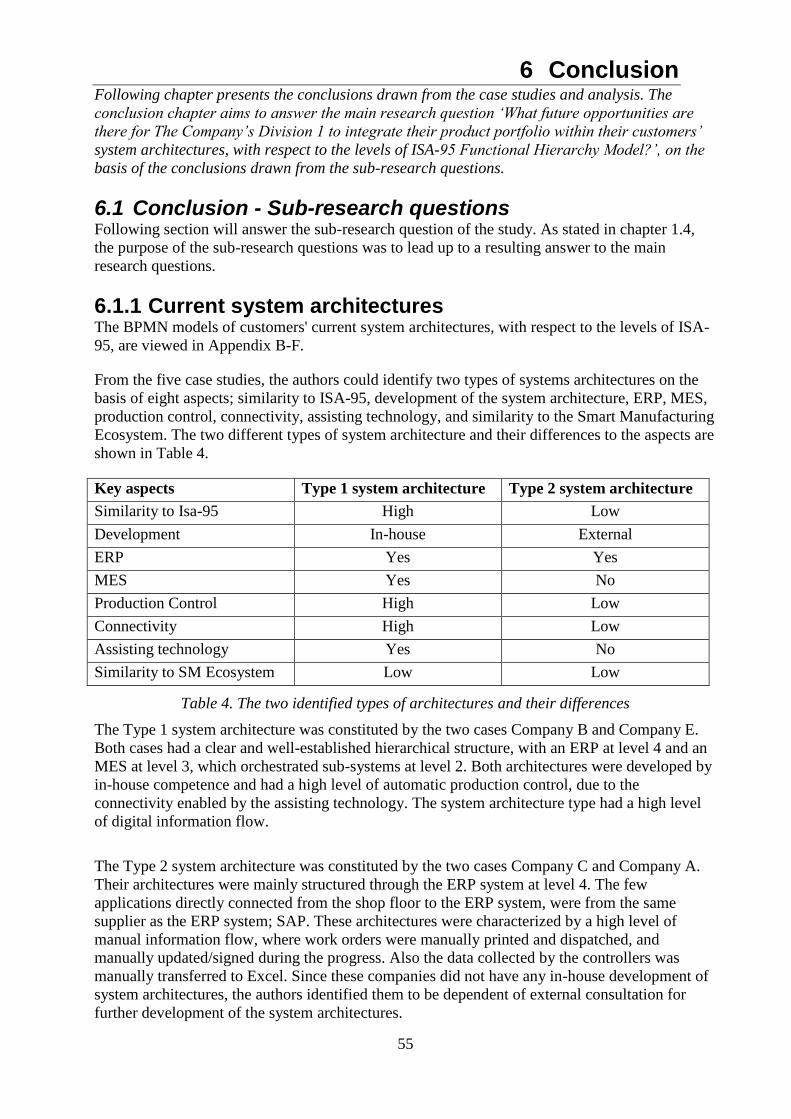
55
6 Conclusion Following chapter presents the conclusions drawn from the case studies and analysis. The
conclusion chapter aims to answer the main research question ‘What future opportunities are
there for The Company’s Division 1 to integrate their product portfolio within their customers’
system architectures, with respect to the levels of ISA-95 Functional Hierarchy Model?’, on the
basis of the conclusions drawn from the sub-research questions.
6.1 Conclusion - Sub-research questions Following section will answer the sub-research question of the study. As stated in chapter 1.4,
the purpose of the sub-research questions was to lead up to a resulting answer to the main
research questions.
6.1.1 Current system architectures The BPMN models of customers' current system architectures, with respect to the levels of ISA-
95, are viewed in Appendix B-F.
From the five case studies, the authors could identify two types of systems architectures on the
basis of eight aspects; similarity to ISA-95, development of the system architecture, ERP, MES,
production control, connectivity, assisting technology, and similarity to the Smart Manufacturing
Ecosystem. The two different types of system architecture and their differences to the aspects are
shown in Table 4.
Key aspects Type 1 system architecture Type 2 system architecture
Similarity to Isa-95 High Low
Development In-house External
ERP Yes Yes
MES Yes No
Production Control High Low
Connectivity High Low
Assisting technology Yes No
Similarity to SM Ecosystem Low Low
Table 4. The two identified types of architectures and their differences
The Type 1 system architecture was constituted by the two cases Company B and Company E.
Both cases had a clear and well-established hierarchical structure, with an ERP at level 4 and an
MES at level 3, which orchestrated sub-systems at level 2. Both architectures were developed by
in-house competence and had a high level of automatic production control, due to the
connectivity enabled by the assisting technology. The system architecture type had a high level
of digital information flow.
The Type 2 system architecture was constituted by the two cases Company C and Company A.
Their architectures were mainly structured through the ERP system at level 4. The few
applications directly connected from the shop floor to the ERP system, were from the same
supplier as the ERP system; SAP. These architectures were characterized by a high level of
manual information flow, where work orders were manually printed and dispatched, and
manually updated/signed during the progress. Also the data collected by the controllers was
manually transferred to Excel. Since these companies did not have any in-house development of
system architectures, the authors identified them to be dependent of external consultation for
further development of the system architectures.

56
Company D’s system architecture could not be identified within any of the two architecture
types above. The company showed a willingness towards connectivity, through implementing
their own developed systems, which were interpreted by the authors as ERP and MES systems.
However the systems were highly lacking functionality. The attempt of implementing the MES-
D1, interpreted by the authors as an MES, failed due to lack of in-house competence according
to the plant manager. The authors conclude that the plant’s current system architecture is highly
dependent on the in-house IT-department, placed in the US. However, the authors identify that if
the implementation of the MES-D1 would have succeed, the system architecture could be
classified as Type 1 system architecture, due to the in-house development and the hierarchal
structure.
6.1.2 Current software vendors Following software vendors were identified within the cases’ system architectures, with respect
to the levels 4, 3 and 2 of ISA-95, shown in Figure 34.
Figure 34. The software vendors within the customers’ system architectures
SAP
SAP was the ERP software supplier in four of five cases. In all of the four cases SAP-ERP
systems were well-established within the customers’ system architectures. In two of the cases,
Company A and Company C, the authors identified their use of SAP as the need of external
consultation to develop their system architectures towards higher connectivity. In those cases,
SAP provided their own applications to satisfy the customer’s needs. For example, at Company
A, the SAP controllers were integrated and developed to assure the quality test data.
In-house developments
In two of the cases, Company B and Company E, they had their own in-house competence and
therefore the ability to build up their own systems after their own needs. At Company B, the
system architecture was developed in collaboration with IBM. However, an absolute IBM
solution could not be identified within Company B’s system architecture.
Excel
Excel was frequently used software for many different tasks, from managing the planning to
visualize the real time management and storing data. The authors identified the use of Excel as a
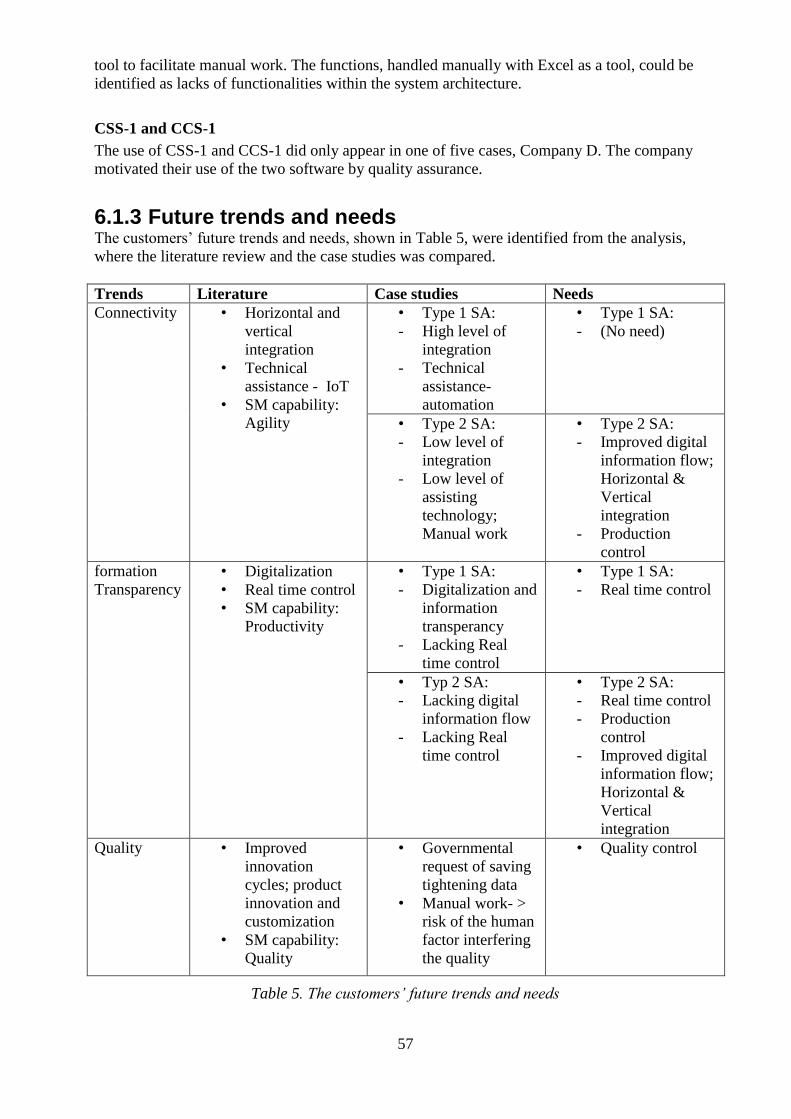
57
tool to facilitate manual work. The functions, handled manually with Excel as a tool, could be
identified as lacks of functionalities within the system architecture.
CSS-1 and CCS-1
The use of CSS-1 and CCS-1 did only appear in one of five cases, Company D. The company
motivated their use of the two software by quality assurance.
6.1.3 Future trends and needs The customers’ future trends and needs, shown in Table 5, were identified from the analysis,
where the literature review and the case studies was compared.
Trends Literature Case studies Needs
Connectivity • Horizontal and
vertical
integration
• Technical
assistance - IoT
• SM capability:
Agility
• Type 1 SA:
- High level of
integration
- Technical
assistance-
automation
• Type 1 SA:
- (No need)
• Type 2 SA:
- Low level of
integration
- Low level of
assisting
technology;
Manual work
• Type 2 SA:
- Improved digital
information flow;
Horizontal &
Vertical
integration
- Production
control
formation
Transparency
• Digitalization
• Real time control
• SM capability:
Productivity
• Type 1 SA:
- Digitalization and
information
transperancy
- Lacking Real
time control
• Type 1 SA:
- Real time control
• Typ 2 SA:
- Lacking digital
information flow
- Lacking Real
time control
• Type 2 SA:
- Real time control
- Production
control
- Improved digital
information flow;
Horizontal &
Vertical
integration
Quality • Improved
innovation
cycles; product
innovation and
customization
• SM capability:
Quality
• Governmental
request of saving
tightening data
• Manual work- >
risk of the human
factor interfering
the quality
• Quality control
Table 5. The customers’ future trends and needs
58
The first column ‘Trends’ represent the identified trends, based on the literature and the case
studies. The second column ‘Literature’ summarizes how the literature stated the related trends.
The third column ‘Case studies’ summarize how the trend was reflected within the studied cases,
divided into the two identified types of system architectures. The fourth and last column ‘Needs’
represents the identified need due to the trends, with respect to the different types of system
architectures.
Following needs were identified:
Improved digital information flow
The literature emphasized the importance of connectivity to enable a flexible production
system in order to be agile towards the customer’s demand. The literature also stated the
importance of information transparency to reach a high productivity. These trends were
identified by the authors as fulfilled within the type 1 system architecture, due to the high
level of connectivity and digital information flow. However, for the type 2 architecture,
characterized by a low level of connectivity, the authors identified a great need of an
improved digital information flow, in order to increase the connectivity and information
transparency.
Quality control
Quality is one of the key capabilities of SMS. ‘Quality’ refers to the production of quality
products, but also quality within innovation, variety and customer service (National
Institute of Standards and Technology, 2016). The demand of quality control was
expressed by the customers within the case studies, in order to assure tightenings, trace
the product quality, and analyze the quality trends.
The authors identified the manual information flow, within the type 2 system
architecture, as a big risk of the human factor interfering the quality. In order to assure
the quality, the architecture type is identified by the authors to be in a great need of
replacing the manual information flow with a digital information flow by Real time
control.
The IoT visons emphasize the importance of making the data visual, in order to reach
high efficient manufacturing systems. In every Division 1 case the authors could identify
a lack of an automated RTM system. An RTM reveals areas of improvement and can
collect data to support other functions, such as production planning and production
engineering. Thus, integrating functions across the layers in order to improve and
improve the efficiency within the system, which are in line with the visions of the smart
manufacturing ecosystem.
Production control
Production control- in the literature review expressed as one of the Smart Manufacturing
key capabilities; ‘productivity’. Productivity reflects the ratio of production output to
inputs used in the product process, which should be adjusted to the responsiveness of the
customer demands (National Institute of Standards and Technology, 2016). Production
control was one of the major key aspects when dividing the systems architectures into
two types. For Type 1 system architecture, the production control was essential-
controlled and steered by an MES. However, for the Type 2 system architecture, the lack
of production control was highly present.

59
6.2 Conclusion - Main Research question Based on the answers of the sub-research questions, the authors could draw following
conclusions:
Hierarchical structure is not out dated
The hierarchal structure within the system architectures is not considered to be out dated. All of
the companies had well-established ERP system which handled the business information,
pushing the production order information down to lower levels. Since the authors identify these
systems as well-established and as large investments, conclusions can be drawn that the Division
1 customers will have a similar structure in the future.
MES- a vital function for integration
From the case studies, the MES function was considered to be vital, in order to reach a high level
of connectivity. The MES managed both the vertical and horizontal integration within the Type 1
system architecture, which had the highest level of connectivity and digital information flow.
The MES function was thereby concluded to be a central function of high connectivity within
hierarchical system architecture.
Type 1 system architecture
Since the companies with in-house competence, Type 1 system architecture, define and develop
their own system architecture and systems, the authors identify this segment to have less
potential for further developments of The Company software and station solutions. The minor
need of external solutions for this type of system architecture can be reflected by the identified
need, ‘Real time control’. Therefore, in order to stay present within this type’s architectures, The
Company should continue to offer flexible and high qualitative products, which the customers
can include within their system architectures.
Type 2 system architecture
This type is identified by the authors to have the biggest potential for further developments of
The Company software and station solutions. Due to the lack of in-house competence, which
characterizes the system architecture type, the authors identified a need of external consultation,
in order to develop and define their system architectures. The need of external consultation was
identified by the authors due to the customer use of SAP application within the lower levels of
their system architectures. The need of further development of the system architecture was
reflected in the identified needs of the Type 2 system architecture; digital information flow,
quality, real time control and production control. Within future developments of The Company’s
product portfolio of software and station solutions, these needs should be fulfilled for manual
assembly. However, the solutions should also be developed in line with Smart Manufacturing
Ecosystem and the Smart Manufacturing capabilities, in order to withstand the global
competition.
Guidelines Based on the conclusions drawn from the sub-research questions, the authors stated guidelines
depending on the type of system architecture.
For Type 1 system architecture For the Type 1 system architecture, the authors suggest two strategies; ‘Flexible products’ and
‘Products as service’. By ‘Flexile products’ the authors mean that The Company should continue
to offer flexible products, which can be connected to the companies own built systems. By the
strategy ‘Products as services’ the author’s mean that since the likelihood that this type of
companies will go towards service-oriented architectures within their systems, due to the

60
formulated expectation of the architecture to revolutionize the manufacturing area, the products
of The Company should be offered as services, which can be connected to a SOA.
For Type 2 system architecture For the Type 2 system architecture, the authors suggest a modular and scalable ‘MES’- solution
with a service-oriented architecture, adapted to manual assembly.
The identified needs of the type of system architecture; production control, real time control,
digital information flow and quality control, are recognized to be fulfilled by a MES. Through an
MES, the needs of vertical a horizontal integration (digital information flow) can be meet, and
the needs of production, real time control and quality control can be meet by modules within the
MES, illustrated in Figure 35.
Figure 35. Example of modules within the MES
Putting the needs in relation to the current software systems, the authors identify that an operator
guiding system (OGS) module could meet the needs of production and quality control within
manual assembly. Data generated within the OGS, such as cycle times for assembly tasks and
throughput time, could be shared to a real time management (RTM) module, which would
increase the visualization of the productivity.
By taking the Smart Manufacturing Eco system in consideration, the MES should be connected
to software applications for data analyses within engineering departments such as process
planning, research and development (R&D) and production engineering, shown in Figure 36.
Through big data analyses of the data, trend charts can be created in order to find improvements
within the process or the product, leading to faster innovation cycles which corresponds the three
Smart Manufacturing capabilities ‘productivity’ and ‘quality’ and ‘agility’.
Figure 36. The MES’s relation to the ERP and the engineering departments
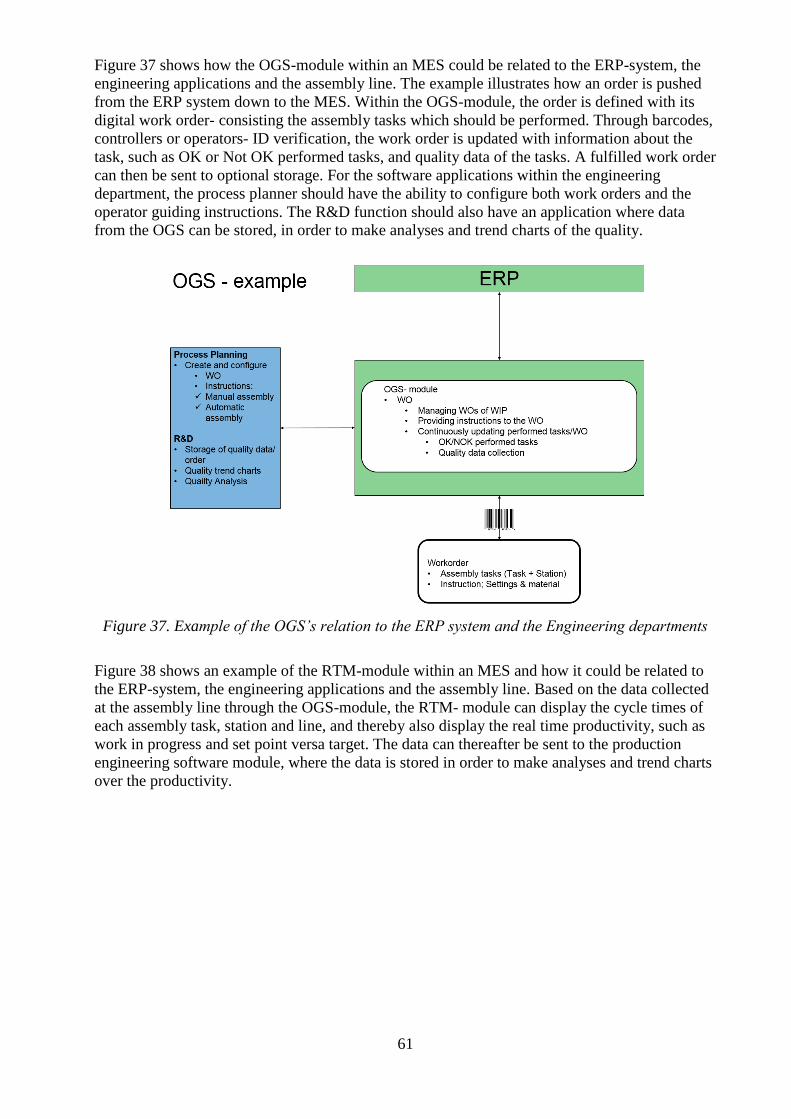
61
Figure 37 shows how the OGS-module within an MES could be related to the ERP-system, the
engineering applications and the assembly line. The example illustrates how an order is pushed
from the ERP system down to the MES. Within the OGS-module, the order is defined with its
digital work order- consisting the assembly tasks which should be performed. Through barcodes,
controllers or operators- ID verification, the work order is updated with information about the
task, such as OK or Not OK performed tasks, and quality data of the tasks. A fulfilled work order
can then be sent to optional storage. For the software applications within the engineering
department, the process planner should have the ability to configure both work orders and the
operator guiding instructions. The R&D function should also have an application where data
from the OGS can be stored, in order to make analyses and trend charts of the quality.
Figure 37. Example of the OGS’s relation to the ERP system and the Engineering departments
Figure 38 shows an example of the RTM-module within an MES and how it could be related to
the ERP-system, the engineering applications and the assembly line. Based on the data collected
at the assembly line through the OGS-module, the RTM- module can display the cycle times of
each assembly task, station and line, and thereby also display the real time productivity, such as
work in progress and set point versa target. The data can thereafter be sent to the production
engineering software module, where the data is stored in order to make analyses and trend charts
over the productivity.
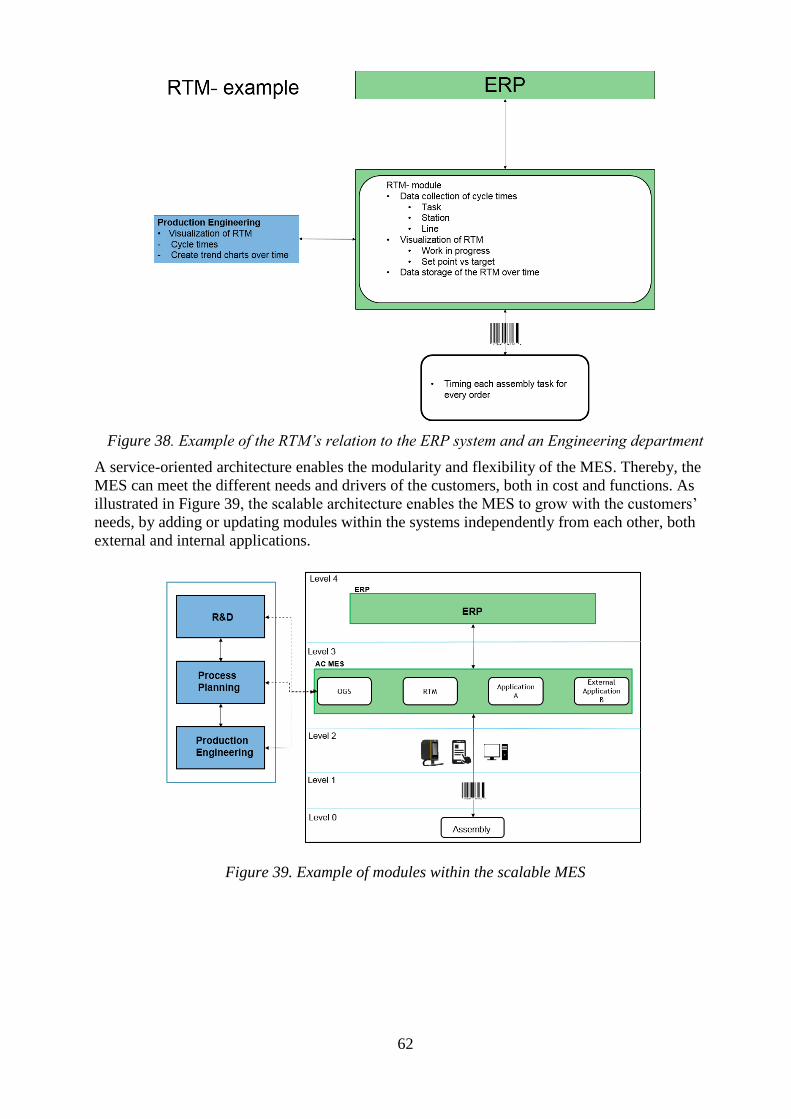
62
Figure 38. Example of the RTM’s relation to the ERP system and an Engineering department
A service-oriented architecture enables the modularity and flexibility of the MES. Thereby, the
MES can meet the different needs and drivers of the customers, both in cost and functions. As
illustrated in Figure 39, the scalable architecture enables the MES to grow with the customers’
needs, by adding or updating modules within the systems independently from each other, both
external and internal applications.
Figure 39. Example of modules within the scalable MES
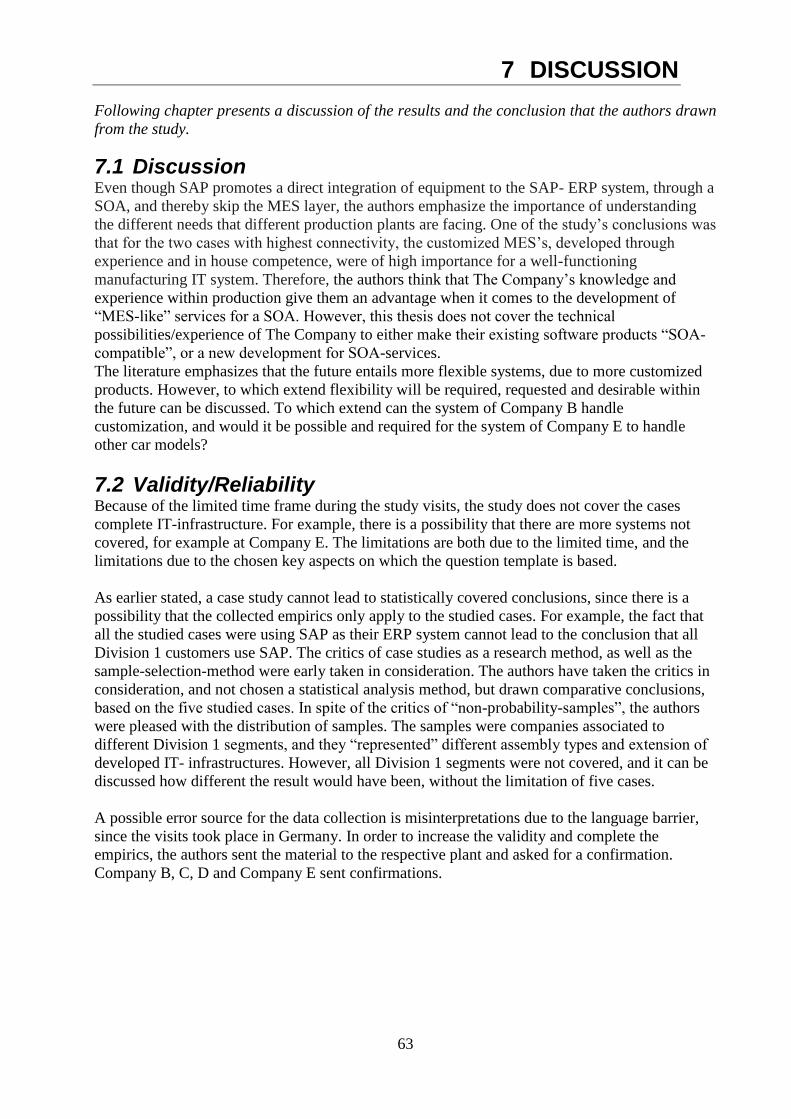
63
7 DISCUSSION
Following chapter presents a discussion of the results and the conclusion that the authors drawn
from the study.
7.1 Discussion Even though SAP promotes a direct integration of equipment to the SAP- ERP system, through a
SOA, and thereby skip the MES layer, the authors emphasize the importance of understanding
the different needs that different production plants are facing. One of the study’s conclusions was
that for the two cases with highest connectivity, the customized MES’s, developed through
experience and in house competence, were of high importance for a well-functioning
manufacturing IT system. Therefore, the authors think that The Company’s knowledge and
experience within production give them an advantage when it comes to the development of
“MES-like” services for a SOA. However, this thesis does not cover the technical
possibilities/experience of The Company to either make their existing software products “SOA-
compatible”, or a new development for SOA-services.
The literature emphasizes that the future entails more flexible systems, due to more customized
products. However, to which extend flexibility will be required, requested and desirable within
the future can be discussed. To which extend can the system of Company B handle
customization, and would it be possible and required for the system of Company E to handle
other car models?
7.2 Validity/Reliability Because of the limited time frame during the study visits, the study does not cover the cases
complete IT-infrastructure. For example, there is a possibility that there are more systems not
covered, for example at Company E. The limitations are both due to the limited time, and the
limitations due to the chosen key aspects on which the question template is based.
As earlier stated, a case study cannot lead to statistically covered conclusions, since there is a
possibility that the collected empirics only apply to the studied cases. For example, the fact that
all the studied cases were using SAP as their ERP system cannot lead to the conclusion that all
Division 1 customers use SAP. The critics of case studies as a research method, as well as the
sample-selection-method were early taken in consideration. The authors have taken the critics in
consideration, and not chosen a statistical analysis method, but drawn comparative conclusions,
based on the five studied cases. In spite of the critics of “non-probability-samples”, the authors
were pleased with the distribution of samples. The samples were companies associated to
different Division 1 segments, and they “represented” different assembly types and extension of
developed IT- infrastructures. However, all Division 1 segments were not covered, and it can be
discussed how different the result would have been, without the limitation of five cases.
A possible error source for the data collection is misinterpretations due to the language barrier,
since the visits took place in Germany. In order to increase the validity and complete the
empirics, the authors sent the material to the respective plant and asked for a confirmation.
Company B, C, D and Company E sent confirmations.

64

65
8 RECOMMENDED FUTURE WORK Following chapter presents recommendations of future work from the authors, summarized in
bullet points.
Investigate The Company’s ability of a development of an MES, and the possibilities of
making the current product portfolio into services for a SOA
Investigate and map more Division 1 customers’ system architectures: More cases and
segments from more countries.
Investigate and map system architectures of Division 2 customers, in order to identify
trends and needs relevant for the Division 1 customers as well
Investigate the currently used ERP-SAP at Company A and Company C, is it SOA? If so,
keep the possibility of the existence of a service oriented architecture when investigating
other customers
Investigating Event-Driven Architecture and its effect of the system architecture.
Keep track of the work of ‘Industrie 4.0 Working Group’, who emphasizes the need of
research within “Standardization and reference architecture”. If they, or anyone, would
come up with recognized reference architecture, it would be interesting for The Company
to consider. The recommendation is strengthened by the fact that the most successful
system architectures among the studied cases, were the ones with similarities to the
current standard, ISA-95

66
67
9 References Atlas Copco. (2015). Industrial Tools and Solutions- Product catalogue. i A. Copco, Product
catalogue (ss. 143-149). Stockholm: Atlas Copco.
Atlas Copco. (den 30 may 2017). AtlasCopco.com. Hämtat från AtlasCopco.com:
http://www.atlascopco.com.au/en-au/itba/products/assembly-solutions/Error-proofing-
solutions/ToolsNet-4000
Atlas Copco AB. (u.d.). Industrial Technique. Hämtat från atlascopcogroup.com:
http://www.atlascopcogroup.com/en/investor-relations/atlas-copco-for-
investors/industrial-technique den 12 02 2017
Automation, T. I. (u.d.). ISA Setting the Standards for Automation. Hämtat från
https://www.isa.org/belgium/standards-publications/ISA95/
Blomkvist, H. (2015). Metod för teknologer, Examensarbete enligt 4-fasmodellen. Lund:
Studentlitteratur AB.
Caputo, A., & Marzi, G. (den 20 10 2015). The Internet of Things in manufacturing innovation
processes- Development and application of a conceptual framwork. Business Procdess
Magagment Journal, s. 22.
Chen, H.-J., Chiu, A.-A., Huang, S., & Pai, F.-C. (2012). The ERP system impact on the role of
accountants. Industrial Management & Data Systems, 83-101.
Copco, A. (u.d.). Atlas Copco. Hämtat från http://www.atlascopco.com.au/en-
au/itba/products/assembly-solutions/Error-proofing-solutions/ToolsNet-4000
Copco, A. (u.d.). atlascopco.com. Hämtat från http://www.atlascopco.com.au/en-
au/itba/products/assembly-solutions/Error-proofing-solutions/ToolsNet-4000
Enercon. (May 2017). Hämtat från enercon.de: http://www.enercon.de/en/company/production/
Enercon. (den 11 may 2017). Enercon Market Shares. Hämtat från Enercon.de:
http://www.enercon.de/en/company/market-share/
Enercon. (den 11 may 2017). Enercon.de. Hämtat från Enercon Guidlines:
http://www.enercon.de/en/company/guidelines/
ESPRIT. (1988). Open Systems Architecture for CIM. Berlin: Springer Verlag. Hämtat från [1]
ESPRIT, Project 688, AMICE, OPen Systems Architecture for CIM, Springer Verlag,
Berlin (1988)
Forstner, L., & Dümmler , M. (den 19 September 2014). Integrierte Wertschöpfungsnetwerke-
Chancen und Potentiale durch Industrie 4.0. Elektrontechnik & Informationstechnik, ss.
199-201.
Gandomi, H. (2014). Beyond the hype: Big data concepts, methods, and analytics. International
Journal of Information Management, 140-141.
Gilchrist, A. (2016). Industry 4.0- The Industrial Internet of Things. New York: Apress.
Glykas, M. (2013). Business Process Management- Theory and Application. Berlin: Springer.
Greedd, G., & Ghoshal, R. (2004). i G. Greedd, & R. Ghoshal, Practical E-Manufacturing and
Supply Chain Management (ss. 26-65). Burlington: Elsevier Science.
Günther, K. K. (2008). RFID in Manufacturing. Berlin: Springer.
Hagelberg. (2015). Automatiseringsteknik. Stockholm.
Helu, M., Morris, K., Jung, K., Lyons, K., & Leong, S. (2015). Identifying perdormance
assurance challanges for smart manufaturing. Manufacturing Letters 6, 1-4.
Hermann, M., Pentek, T., & Otto, B. (2016). Design Pinciples for Industrie 4.0. 2016 49th
Hawaii International Conference on System Sciences (ss. 3929-3937). IEEE Computer
Society.
ISA. (den 30 May 2017). isa.org. Hämtat från ISA Setting the Standards for Automation:
https://www.isa.org/isa95/
Kagermann, H., Wahlster, W., & Helbig, J. (2013). Recommendations for implementing the
strategic initiative INDUSTRIE 4.0, Final report of the Industrie 4.0 Working Group.
Frankfurt: National Academy of Science and Engineering.

68
Kletti. (2007). Manufacturing Execution System-MES. Berlin: Springer.
Kueppers, O. (den 29 09 2016). MESA international. Hämtat från MESA.org:
http://www.networkevent.be/abiss/sites/default/files/Sprekers/abiss_mesa-smart-
manufacturing_sig_-_20160921.pdf
Leiva, C. (den 20 06 2015). For Smart Manufacturing- Integration Standards are a Must.
Hämtat från ibaset: http://www.ibaset.com/blog/smart-manufacturing-integration-
standards-opc-ua-step-oagis-isa95/
Lu, Y., & Cecil, J. (2016). An Internet of Things (IoT)-based collaborative framwork for
advanced manufacturing. The International Journal of Advanced Manufacturing
Technology, 1141-1152.
Miele. (den 30 May 2017). Miele.com. Hämtat från Miele.com:
https://www.miele.com/en/com/index.htm
Miele. (u.d.). Miele.com. Hämtat från https://www.miele.com/en/com/index.htm
National Institute of Standards and Technology. (2016). Current Standards Landscape for Smart
Manufacturing Systems. Gaithersburg: National Institute of Standards and Technology.
Optico AB. (2016). Smart Connected Assembly Whitepaper- From Vison To Reality. Stockholm:
Atlas Copco Industrial Technique AB.
Pöttinger. (den 22 May 2017). poettinger.at. Hämtat från poettinger.at:
https://www.poettinger.at/en_ie/Home/Index
Rayes, A., & Salam, S. (2017). Internet of Thing- From Hype to Reality; The Road to
Digitalization. SpringerLink.
Scholten, B. (2007). The Road to Integration: a guide to applying the ISA-95 standard in
manufacturing. i B. Scholten. New York: ISA- Instrumentation, Systems, and
Automation Society.
Shaul, L., & Doron, T. (2013). Critical Success Factors in Enterprise Resource Planning
Systems: Review of the Last Decade. ACM Comput. Surv.45, 4 Article 55, 1-39.
Shtub, A., & Karni, R. (2010). ERP- The Dynamics of Supply Chain and Process Management.
London: Springer New York Dordrecht Heidelberg London.
Sudheer. (den 30 May 2017). Sudheer- About Shopfloor Solutions. Hämtat från Sudheer- About
Shopfloor Solutions: https://sudheerms.wordpress.com/category/mes/page/2/
Sumner, M. (2005). Enterprise Resource Planning. New Yersey: Pearson Prentice Hall.
Theorin, A., Bengtsson, K., Provost, J., Lieder, M., Johnsson, C., Lundholm, T., & Lennartson,
B. (2015). An Event-Driven Manufactuing Information System Architecture. IFAC/IEEE
Symposium on Information Control.
Volkswagen. (den 27 05 2017). Das Glaeserne Manufaktur. Hämtat från Das Glaeserne
Manufaktur- The Manufactory: https://www.glaesernemanufaktur.de/en/the-manufactory
Volkswagenag. (den 20 May 2017). volkswagenag.com. Hämtat från volkswagenag.com:
https://www.volkswagenag.com/en/InvestorRelations/strategy/volkswagen-group-at-a-
glance.html
Woodward. (2016). 2016 Annual Report. Woodward.
Woodward. (den 26 May 2017). Hämtat från http://www.woodward.com/aboutwoodward.aspx
Youtube. (den 07 June 2017). Hämtat från Youtube:
https://www.youtube.com/watch?v=zxnEI7dOQUk
Yue, X., Hu, C., Hehua, Y., Caifeng, Z., & Keliang, Z. (2015). Cloud-assisted industrial cyber-
physical systems: an insight. Microprocessors and Microsystems, 1262-1270.
Zhang, Y., Wang, W., Liu, S., & Xie, G. (2014). Real-Time Shop-Floor Production
Performance. Advances in Mechanical Engineering, 1-10.
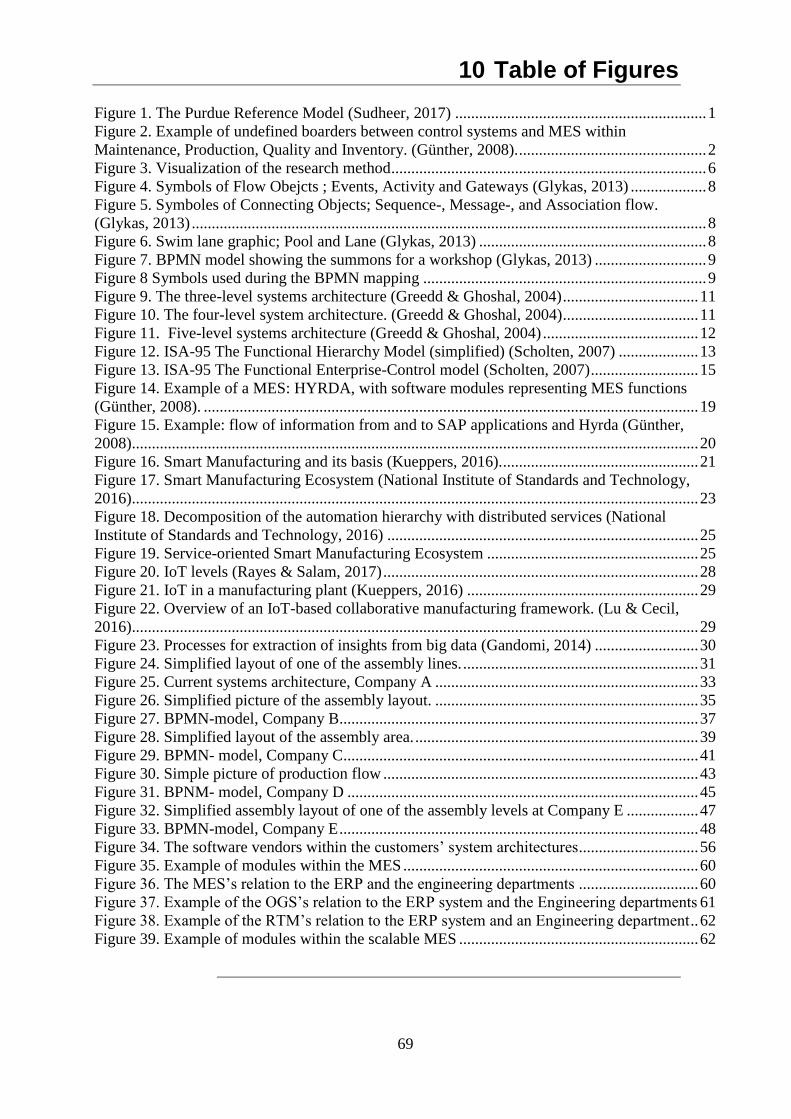
69
10 Table of Figures Figure 1. The Purdue Reference Model (Sudheer, 2017) ............................................................... 1
Figure 2. Example of undefined boarders between control systems and MES within
Maintenance, Production, Quality and Inventory. (Günther, 2008). ............................................... 2
Figure 3. Visualization of the research method ............................................................................... 6 Figure 4. Symbols of Flow Obejcts ; Events, Activity and Gateways (Glykas, 2013) ................... 8 Figure 5. Symboles of Connecting Objects; Sequence-, Message-, and Association flow.
(Glykas, 2013) ................................................................................................................................. 8 Figure 6. Swim lane graphic; Pool and Lane (Glykas, 2013) ......................................................... 8 Figure 7. BPMN model showing the summons for a workshop (Glykas, 2013) ............................ 9
Figure 8 Symbols used during the BPMN mapping ....................................................................... 9 Figure 9. The three-level systems architecture (Greedd & Ghoshal, 2004) .................................. 11 Figure 10. The four-level system architecture. (Greedd & Ghoshal, 2004) .................................. 11 Figure 11. Five-level systems architecture (Greedd & Ghoshal, 2004) ....................................... 12 Figure 12. ISA-95 The Functional Hierarchy Model (simplified) (Scholten, 2007) .................... 13
Figure 13. ISA-95 The Functional Enterprise-Control model (Scholten, 2007) ........................... 15
Figure 14. Example of a MES: HYRDA, with software modules representing MES functions
(Günther, 2008). ............................................................................................................................ 19 Figure 15. Example: flow of information from and to SAP applications and Hyrda (Günther,
2008) .............................................................................................................................................. 20 Figure 16. Smart Manufacturing and its basis (Kueppers, 2016). ................................................. 21
Figure 17. Smart Manufacturing Ecosystem (National Institute of Standards and Technology,
2016) .............................................................................................................................................. 23
Figure 18. Decomposition of the automation hierarchy with distributed services (National
Institute of Standards and Technology, 2016) .............................................................................. 25 Figure 19. Service-oriented Smart Manufacturing Ecosystem ..................................................... 25
Figure 20. IoT levels (Rayes & Salam, 2017) ............................................................................... 28 Figure 21. IoT in a manufacturing plant (Kueppers, 2016) .......................................................... 29
Figure 22. Overview of an IoT-based collaborative manufacturing framework. (Lu & Cecil,
2016) .............................................................................................................................................. 29
Figure 23. Processes for extraction of insights from big data (Gandomi, 2014) .......................... 30 Figure 24. Simplified layout of one of the assembly lines. ........................................................... 31 Figure 25. Current systems architecture, Company A .................................................................. 33 Figure 26. Simplified picture of the assembly layout. .................................................................. 35
Figure 27. BPMN-model, Company B.......................................................................................... 37 Figure 28. Simplified layout of the assembly area. ....................................................................... 39 Figure 29. BPMN- model, Company C ......................................................................................... 41 Figure 30. Simple picture of production flow ............................................................................... 43 Figure 31. BPNM- model, Company D ........................................................................................ 45
Figure 32. Simplified assembly layout of one of the assembly levels at Company E .................. 47 Figure 33. BPMN-model, Company E .......................................................................................... 48 Figure 34. The software vendors within the customers’ system architectures .............................. 56 Figure 35. Example of modules within the MES .......................................................................... 60
Figure 36. The MES’s relation to the ERP and the engineering departments .............................. 60 Figure 37. Example of the OGS’s relation to the ERP system and the Engineering departments 61 Figure 38. Example of the RTM’s relation to the ERP system and an Engineering department .. 62
Figure 39. Example of modules within the scalable MES ............................................................ 62

70
71
APPENDIX A: Interview template
1. Where is a new order registered?
2. How is the production planned?
3. How is the production plan communicated to the start of the production?
4. Where does the operators’ assembly instructions come from?
5. How is the Real time management and the tracking of products conducted?
6. During production, how are errors and deviations reported?
7. How and when is a completed product registered?
8. Which product data is saved during the production?
9. How does the operator know that the work is correctly done?
10. How is the quality control performed?
11. What is the future vision of the production system?
12. What are your future customer demands/requirements? Ex. Traceability, customization
etc.

72
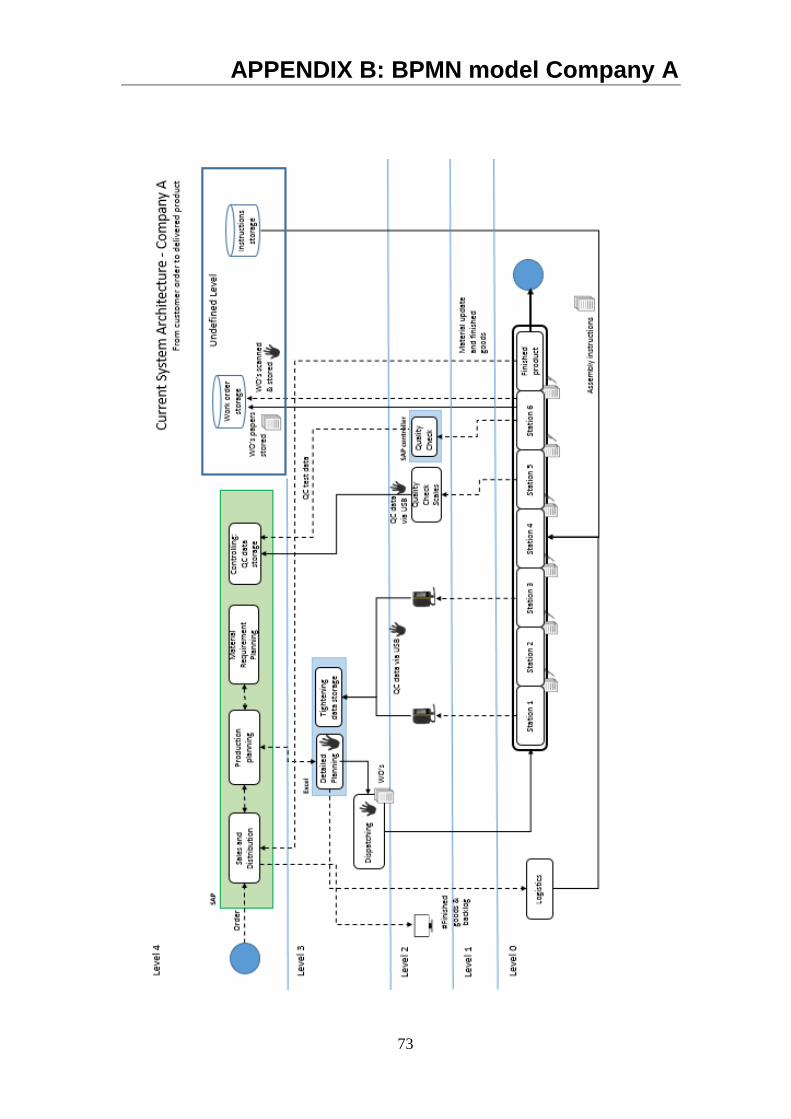
73
APPENDIX B: BPMN model Company A

74
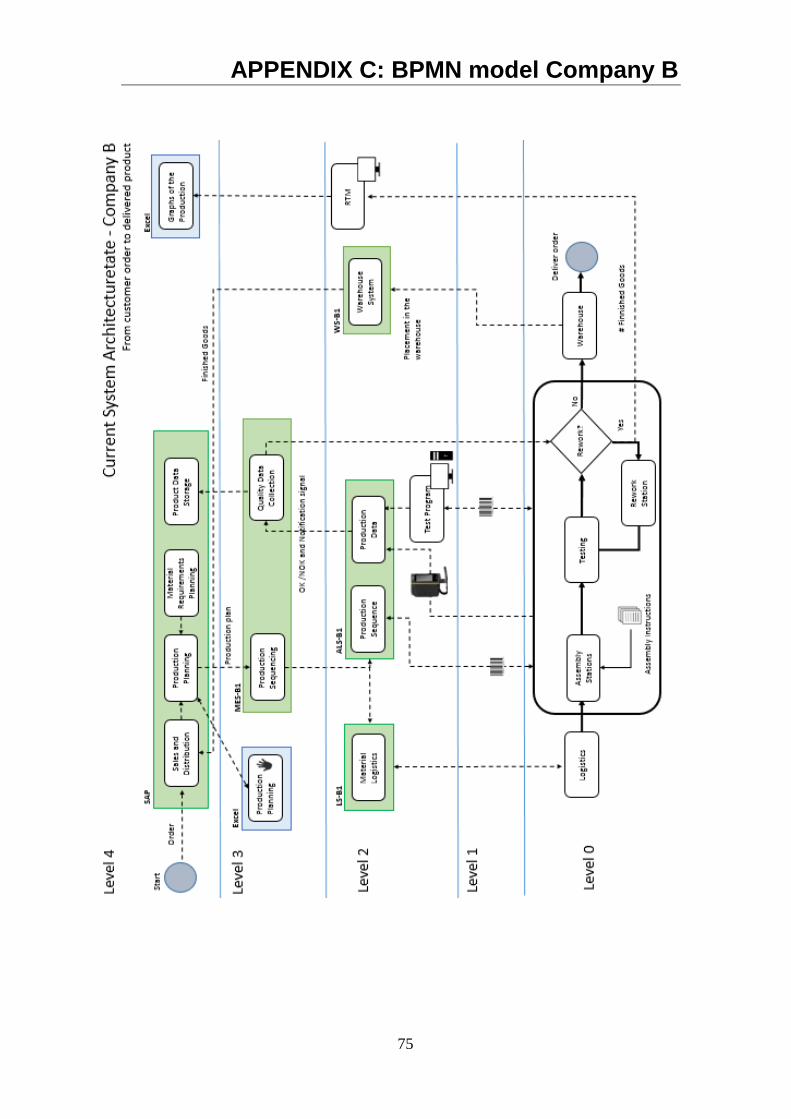
75
APPENDIX C: BPMN model Company B

76
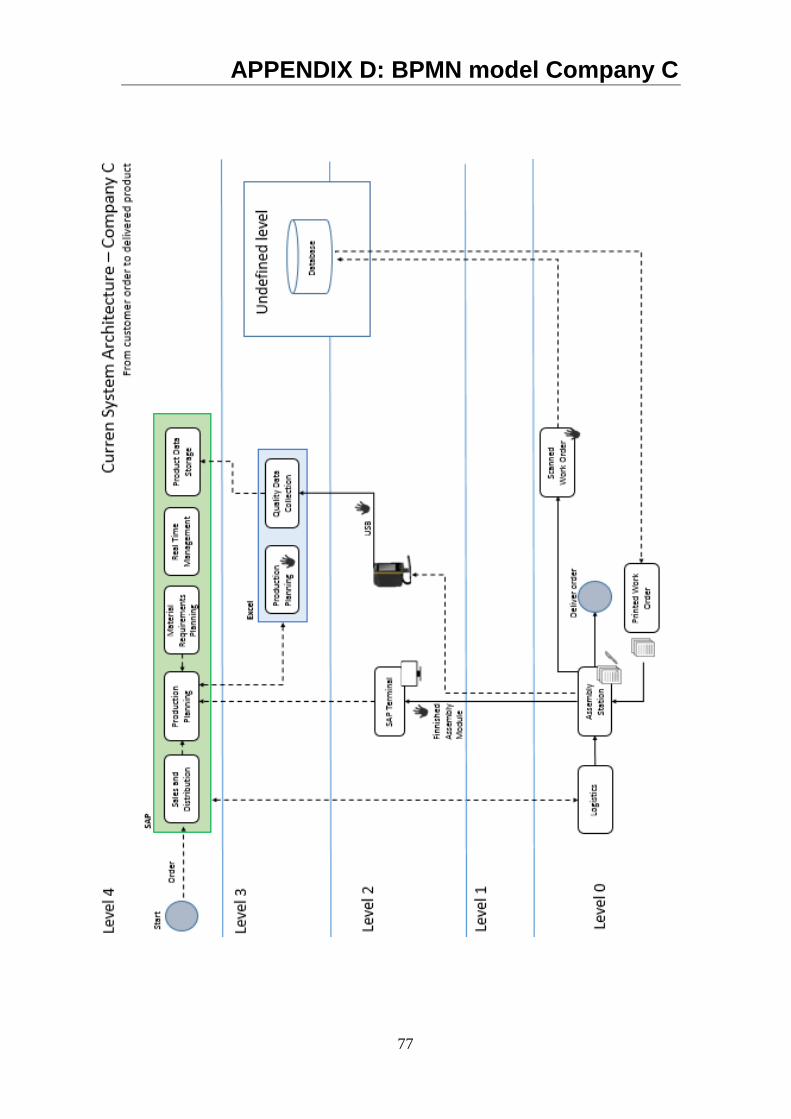
77
APPENDIX D: BPMN model Company C

78

79
APPENDIX E: BPMN model Company D

80
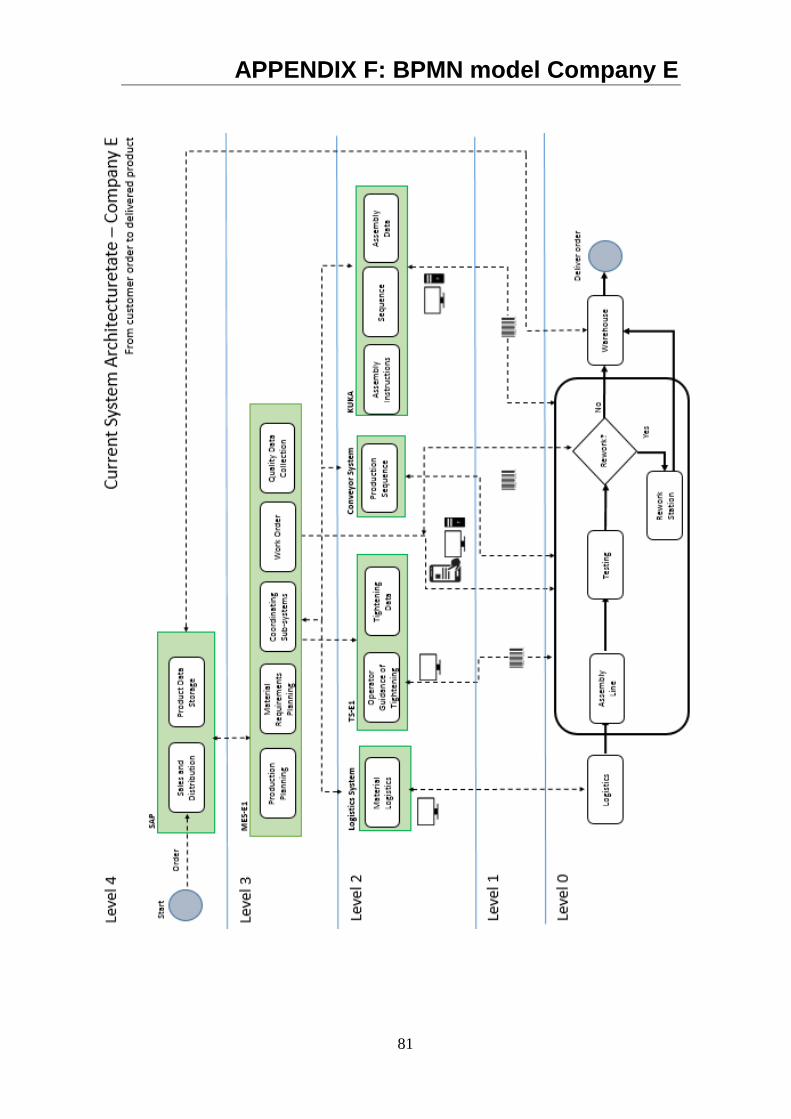
81
APPENDIX F: BPMN model Company E