Aspinall on Dependence; ERF, & PCPI 1 - University … · Probability of picking an individual...
25
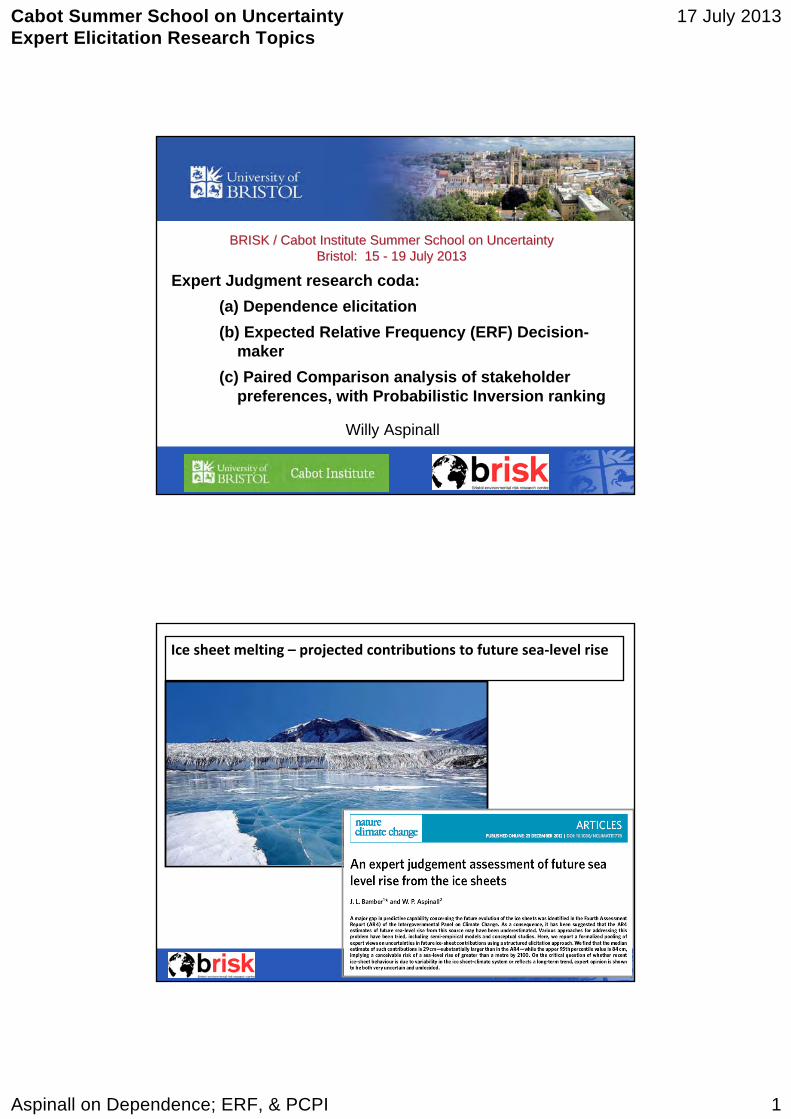
Cabot Summer School on Uncertainty Expert Elicitation Research Topics 17 July 2013 Aspinall on Dependence; ERF, & PCPI 1 Willy Aspinall Expert Judgment research coda: (a) Dependence elicitation (b) Expected Relative Frequency (ERF) Decision- maker (c) Paired Comparison analysis of stakeholder preferences, with Probabilistic Inversion ranking BRISK / Cabot Institute Summer School on Uncertainty BRISK / Cabot Institute Summer School on Uncertainty Bristol: 15 Bristol: 15 - 19 July 2013 19 July 2013 Ice sheet melting – projected contributions to future sea‐level rise
Transcript of Aspinall on Dependence; ERF, & PCPI 1 - University … · Probability of picking an individual...
Cabot Summer School on UncertaintyExpert Elicitation Research Topics
17 July 2013
Aspinall on Dependence; ERF, & PCPI 1
Willy Aspinall
Expert Judgment research coda: (a) Dependence elicitation (b) Expected Relative Frequency (ERF) Decision-
maker (c) Paired Comparison analysis of stakeholder
preferences, with Probabilistic Inversion ranking
BRISK / Cabot Institute Summer School on UncertaintyBRISK / Cabot Institute Summer School on UncertaintyBristol: 15 Bristol: 15 -- 19 July 2013 19 July 2013
Ice sheet melting – projected contributions to future sea‐level rise
Cabot Summer School on UncertaintyExpert Elicitation Research Topics
17 July 2013
Aspinall on Dependence; ERF, & PCPI 2
World in crisis 2008 –Slide Number 3
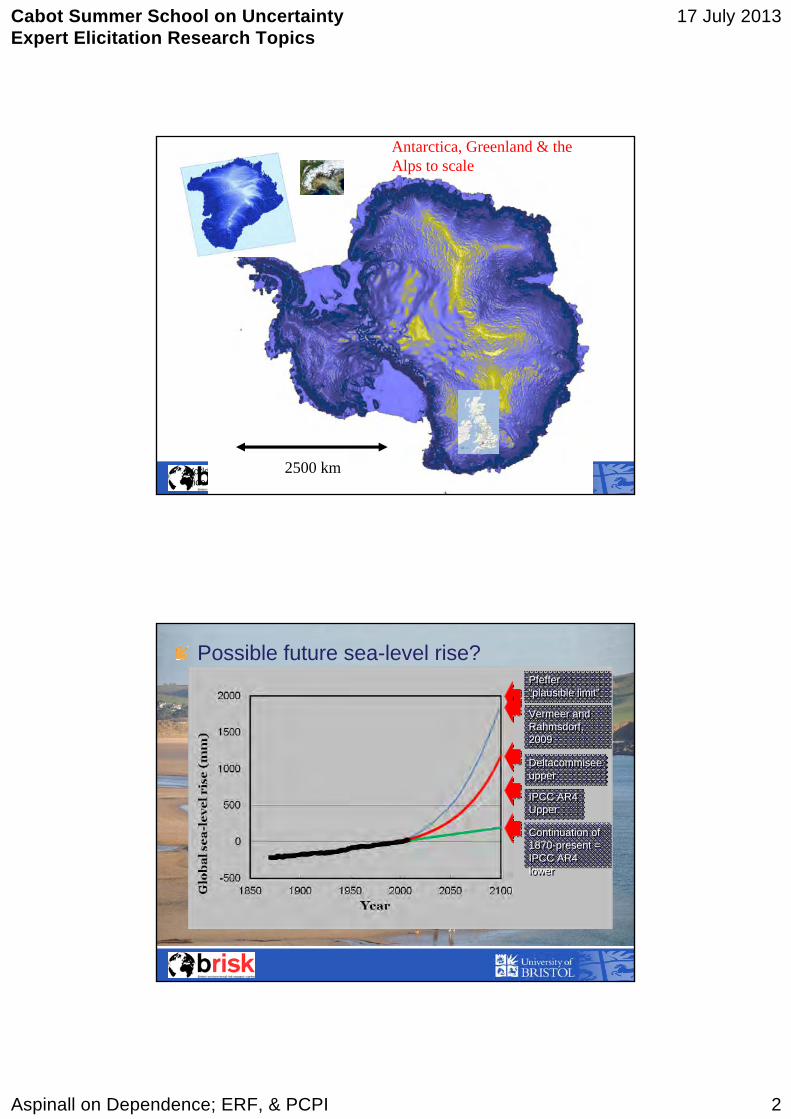
2500 km
Antarctica, Greenland & the Alps to scale
Possible future sea-level rise?
IPCC AR4UpperIPCC AR4Upper
Continuation of 1870-present = IPCC AR4 lower
Continuation of 1870-present = IPCC AR4 lower
Pfeffer“plausible limit”Pfeffer“plausible limit”
Vermeer and Rahmsdorf, 2009
Vermeer and Rahmsdorf, 2009
DeltacommiseeupperDeltacommiseeupper
Cabot Summer School on UncertaintyExpert Elicitation Research Topics
17 July 2013
Aspinall on Dependence; ERF, & PCPI 3
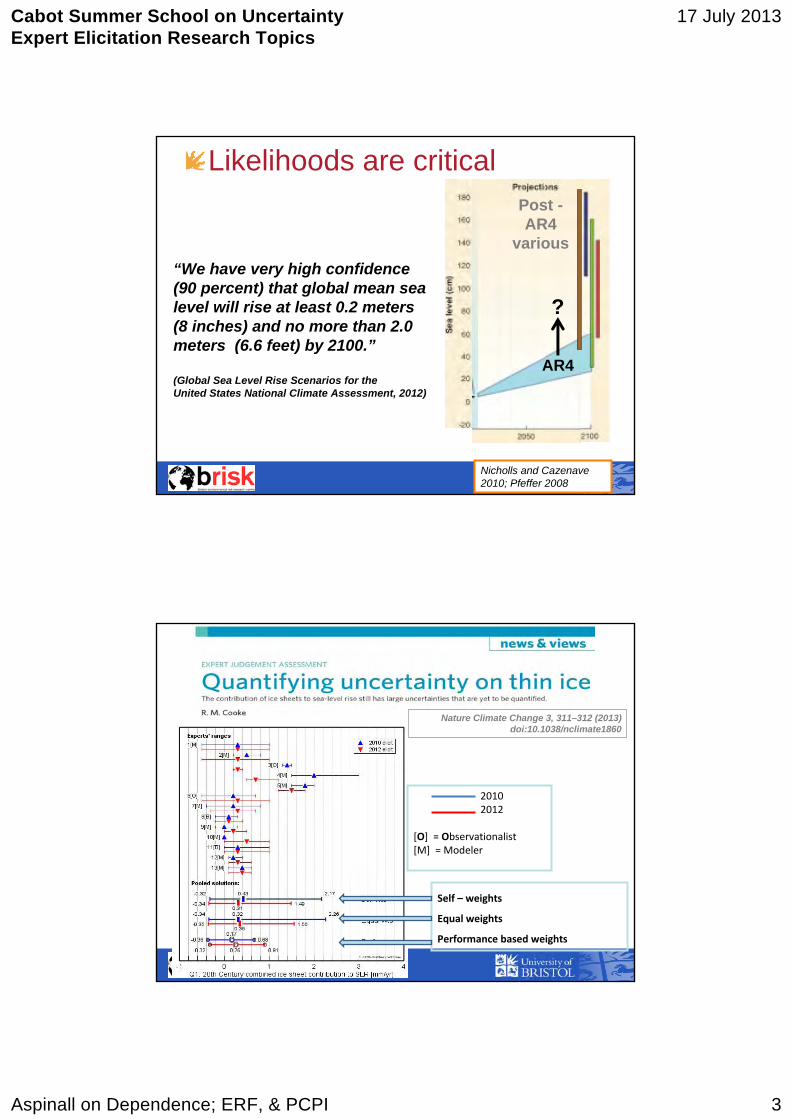
Likelihoods are critical
Nicholls and Cazenave2010; Pfeffer 2008
AR4
?
“We have very high confidence (90 percent) that global mean sea level will rise at least 0.2 meters (8 inches) and no more than 2.0 meters (6.6 feet) by 2100.”
(Global Sea Level Rise Scenarios for the United States National Climate Assessment, 2012)
Post -AR4
various
20102012
[O] = Observationalist[M] = Modeler
Self – weights
Equal weights
Performance based weights
Nature Climate Change 3, 311–312 (2013)doi:10.1038/nclimate1860
Cabot Summer School on UncertaintyExpert Elicitation Research Topics
17 July 2013
Aspinall on Dependence; ERF, & PCPI 4
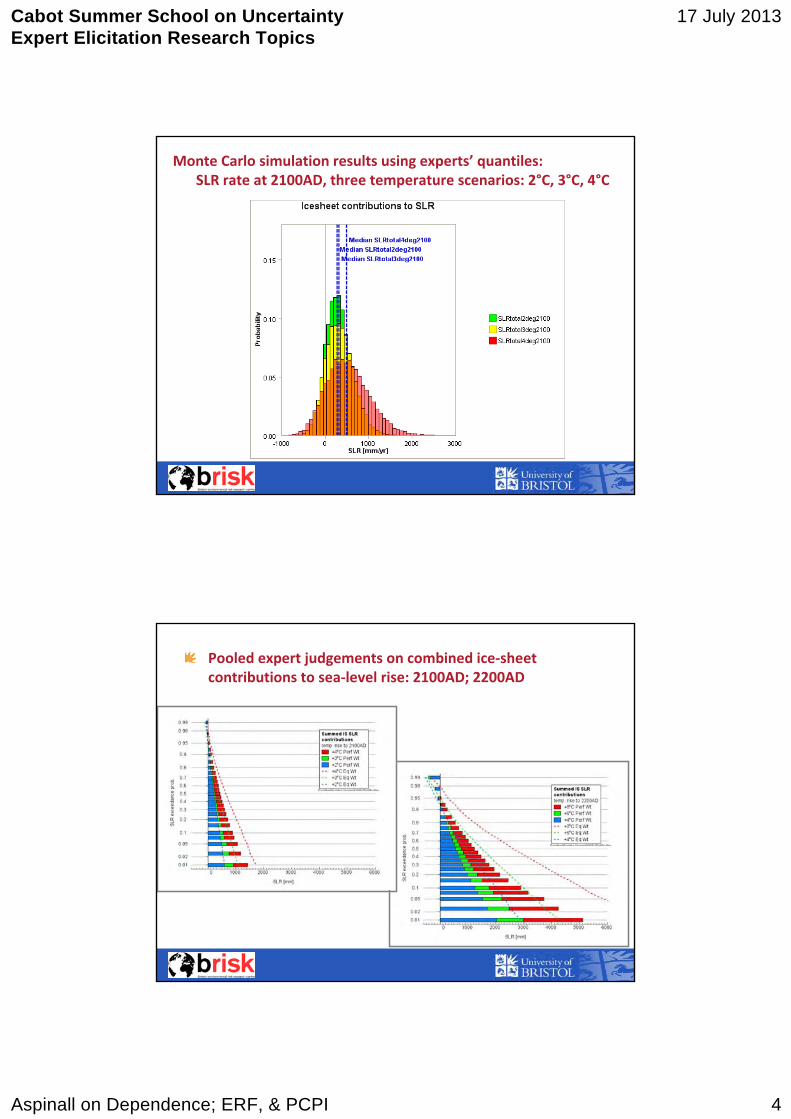
Monte Carlo simulation results using experts’ quantiles:SLR rate at 2100AD, three temperature scenarios: 2°C, 3°C, 4°C
Pooled expert judgements on combined ice‐sheet contributions to sea‐level rise: 2100AD; 2200AD
Cabot Summer School on UncertaintyExpert Elicitation Research Topics
17 July 2013
Aspinall on Dependence; ERF, & PCPI 5
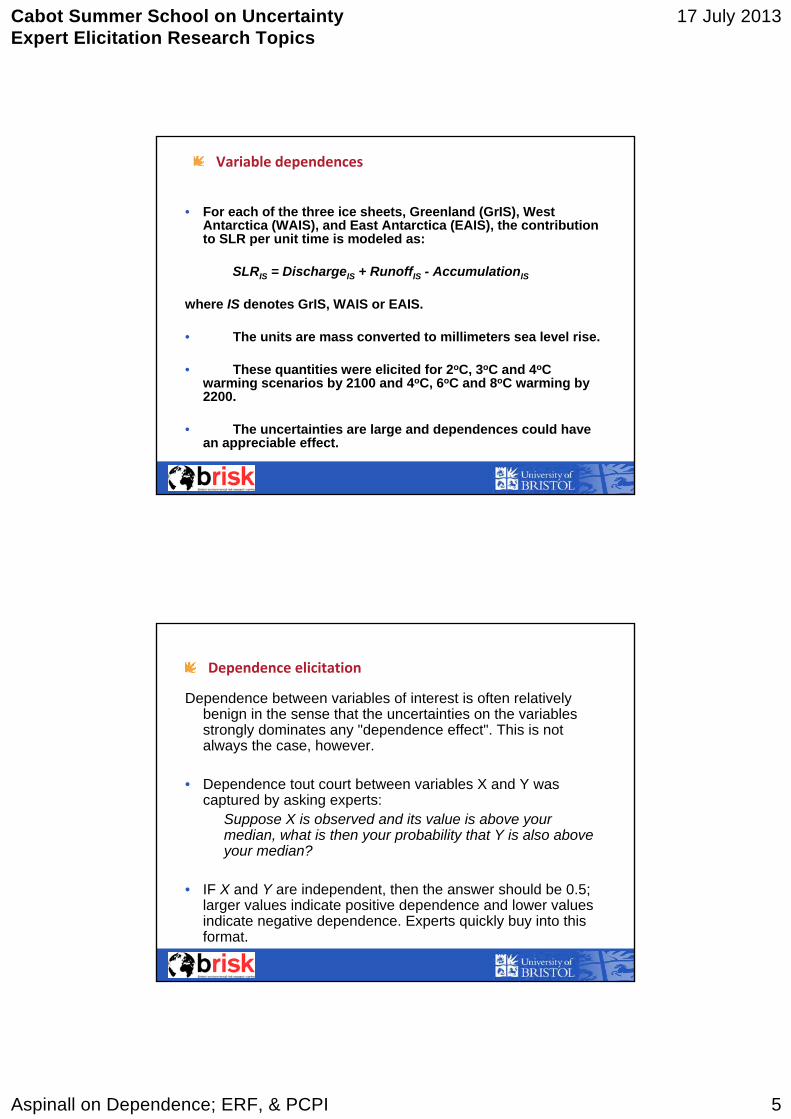
Variable dependences
• For each of the three ice sheets, Greenland (GrIS), West Antarctica (WAIS), and East Antarctica (EAIS), the contribution to SLR per unit time is modeled as:
SLRIS = DischargeIS + RunoffIS - AccumulationIS
where IS denotes GrIS, WAIS or EAIS.
• The units are mass converted to millimeters sea level rise.
• These quantities were elicited for 2oC, 3oC and 4oC warming scenarios by 2100 and 4oC, 6oC and 8oC warming by 2200.
• The uncertainties are large and dependences could have an appreciable effect.
Dependence elicitation
Dependence between variables of interest is often relatively benign in the sense that the uncertainties on the variables strongly dominates any "dependence effect". This is not always the case, however.
• Dependence tout court between variables X and Y was captured by asking experts:
Suppose X is observed and its value is above your median, what is then your probability that Y is also above your median?
• IF X and Y are independent, then the answer should be 0.5; larger values indicate positive dependence and lower values indicate negative dependence. Experts quickly buy into this format.
Cabot Summer School on UncertaintyExpert Elicitation Research Topics
17 July 2013
Aspinall on Dependence; ERF, & PCPI 6
• The use of tail independent copulae is not conservative and has been charged with inducing excessive risk taking on Wall Street (Solamon 2009). Therefore to allow for the possibility of tail dependence, experts are asked, in addition to previous, median-related question:
Suppose X is observed and its value is above your 95 percentile, what is then your probability that Y is also above your 95 percentile?
• if these uncertainties are independent, the elicited probabilityshould 0.05; probabilities greater than 0.05 indicate positive association, less than 0.05 indicate negative association.
By observing the relations between these two exceedance probabilities, a choice can be made, typically, between one-parameter copula families, namely two with tail independence(normal and Frank) and two with tail dependence (Gumbel and reverse Clayton).
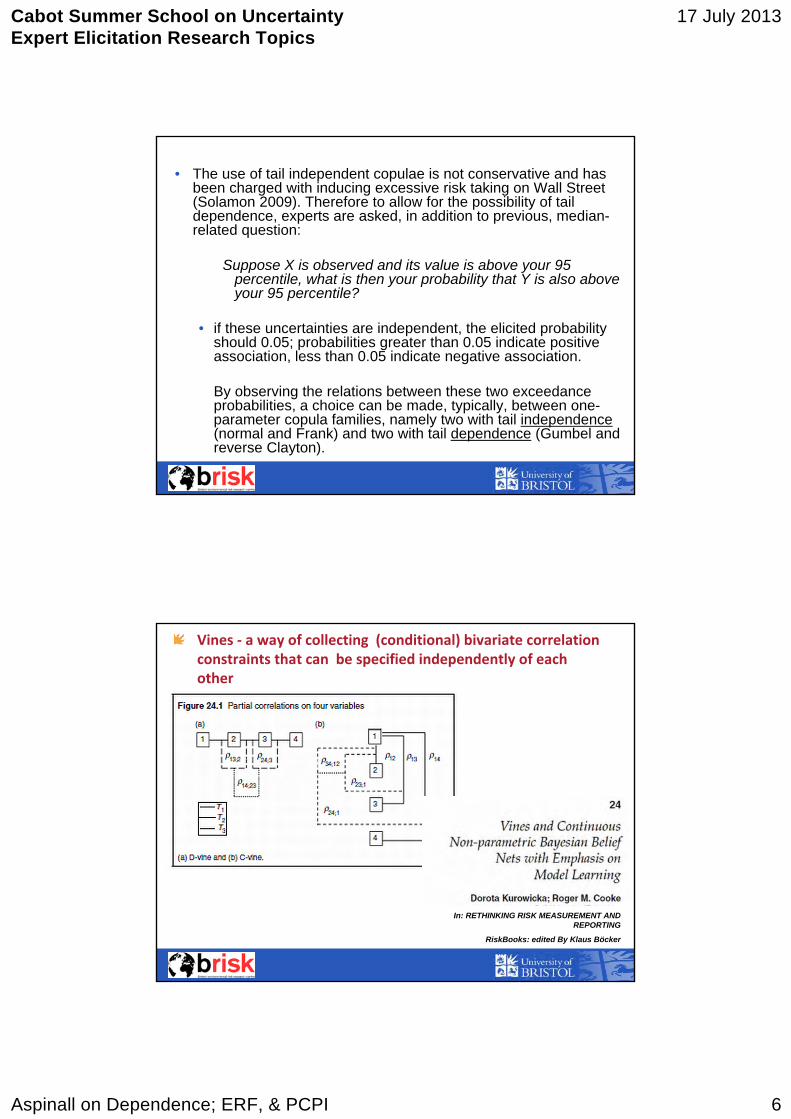
Vines ‐ a way of collecting (conditional) bivariate correlation constraints that can be specified independently of each other
In: RETHINKING RISK MEASUREMENT AND REPORTING
RiskBooks: edited By Klaus Böcker
Cabot Summer School on UncertaintyExpert Elicitation Research Topics
17 July 2013
Aspinall on Dependence; ERF, & PCPI 7
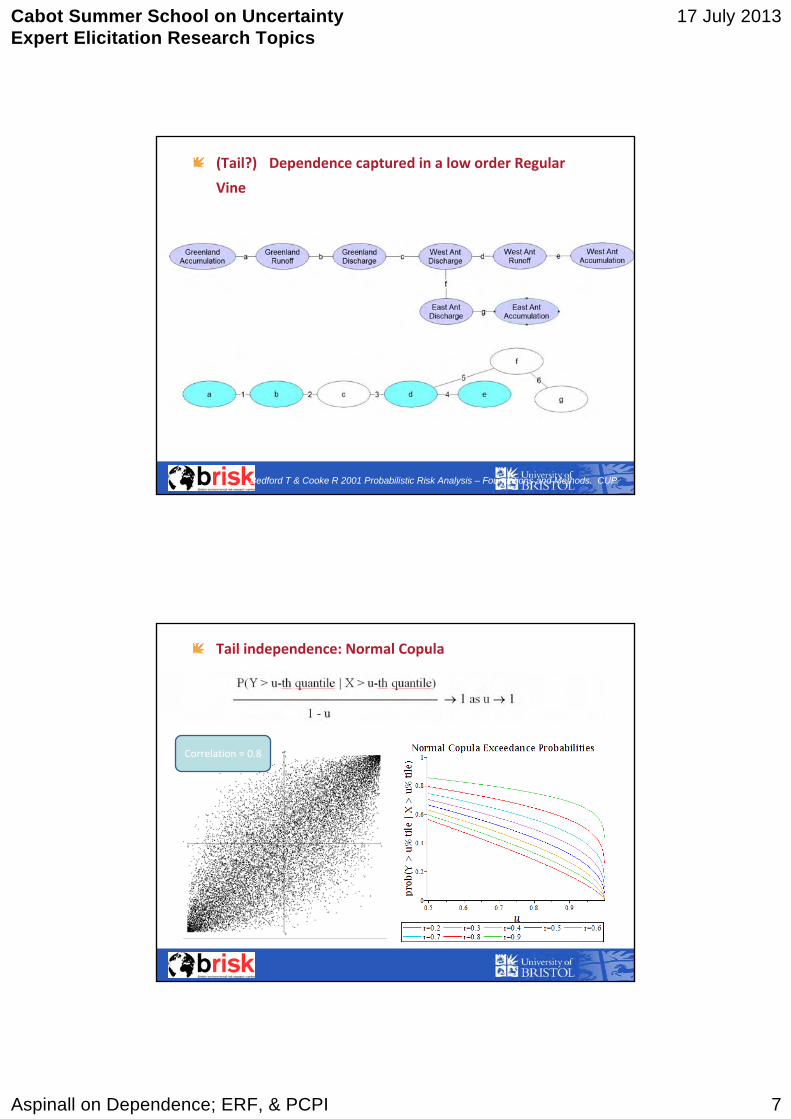
(Tail?) Dependence captured in a low order Regular
Vine
A “vine” is a generalization of a rank correlation dependence tree, allowing arbitrary correlation matrices to be modelled …. [Bedford & Cooke, 2001]
Bedford T & Cooke R 2001 Probabilistic Risk Analysis – Foundations and Methods. CUP
Ice sheet SLR contributions: dependence structure
Tail independence: Normal Copula
Correlation = 0.8
Cabot Summer School on UncertaintyExpert Elicitation Research Topics
17 July 2013
Aspinall on Dependence; ERF, & PCPI 8
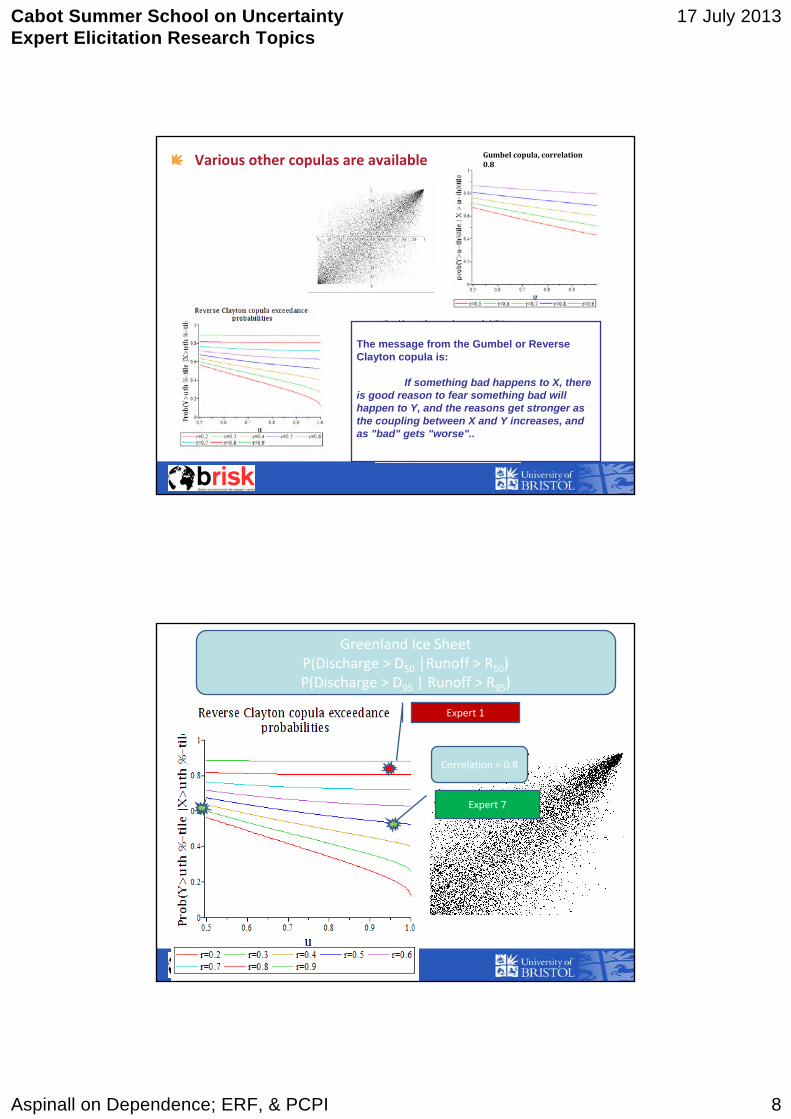
Various other copulas are available Gumbel copula, correlation 0.8
The message from the Gumbel or Reverse Clayton copula is:
If something bad happens to X, there is good reason to fear something bad will happen to Y, and the reasons get stronger as the coupling between X and Y increases, and as "bad" gets "worse"..
(reverse) Clayton, tail dependent
Correlation = 0.8
Expert 1
Expert 7
Greenland Ice Sheet P(Discharge > D50 |Runoff > R50)P(Discharge > D95 | Runoff > R95)
Cabot Summer School on UncertaintyExpert Elicitation Research Topics
17 July 2013
Aspinall on Dependence; ERF, & PCPI 9
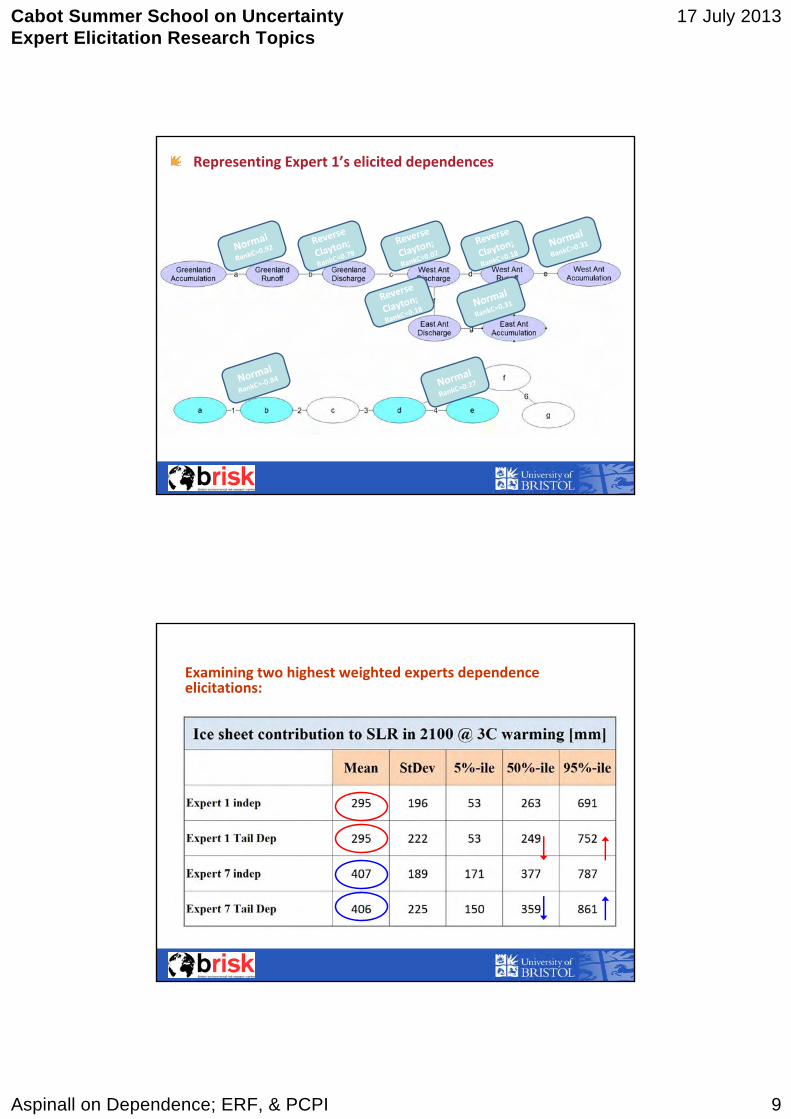
Representing Expert 1’s elicited dependences
Reverse
Clayton;
RankC=0.7
9
Reverse
Clayton;
RankC=0.1
8
Normal
RankC=0.3
1Reverse
Clayton;
RankC=0.0
7
Reverse
Clayton;
RankC=0.1
8Norm
al
RankC=0.9
2
Normal
RankC=0.3
1
Normal
RankC=‐0.
84 Normal
RankC=0.2
7
Examining two highest weighted experts dependence elicitations:
Cabot Summer School on UncertaintyExpert Elicitation Research Topics
17 July 2013
Aspinall on Dependence; ERF, & PCPI 10
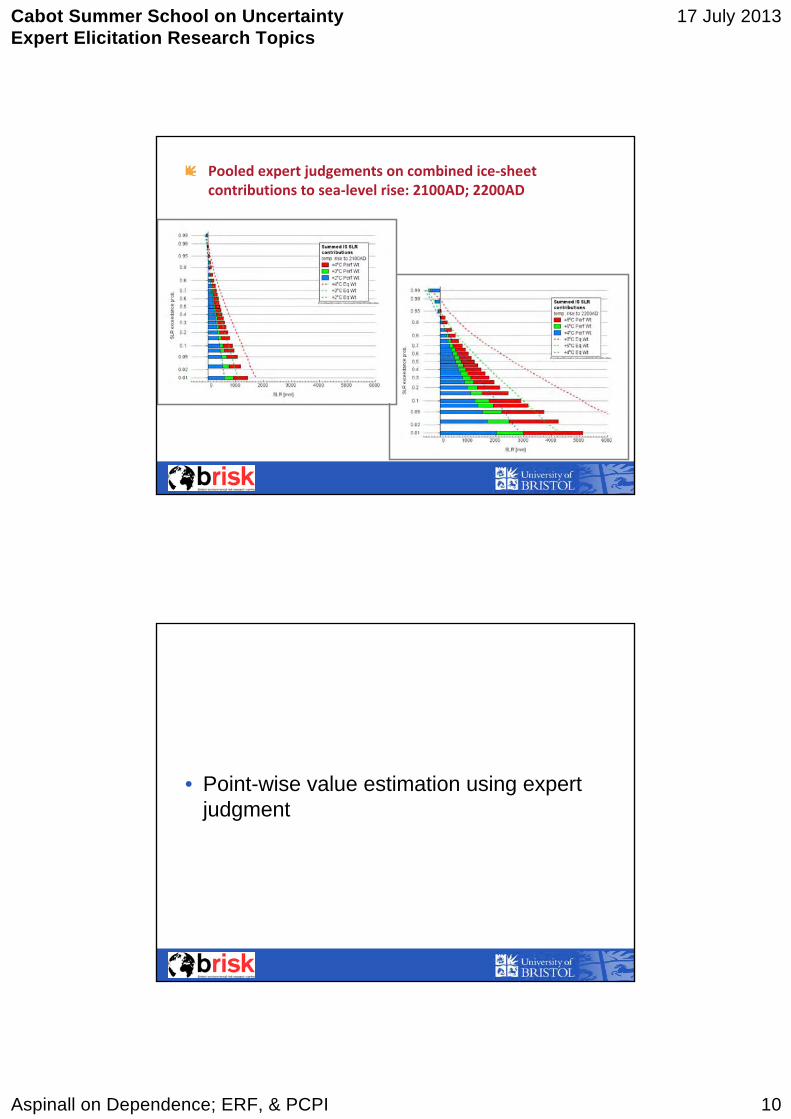
Pooled expert judgements on combined ice‐sheet contributions to sea‐level rise: 2100AD; 2200AD
• Point-wise value estimation using expert judgment
Cabot Summer School on UncertaintyExpert Elicitation Research Topics
17 July 2013
Aspinall on Dependence; ERF, & PCPI 11
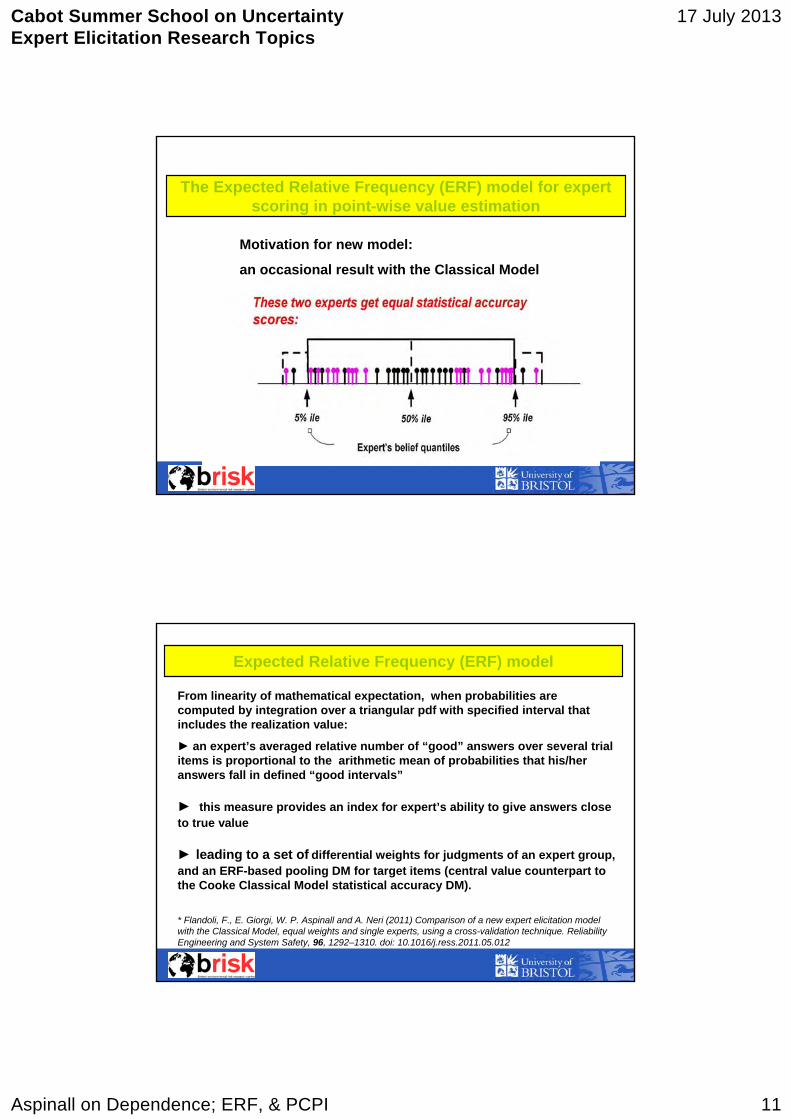
Motivation for new model:
an occasional result with the Classical Model
The Expected Relative Frequency (ERF) model for expert scoring in point-wise value estimation
From linearity of mathematical expectation, when probabilities are computed by integration over a triangular pdf with specified interval that includes the realization value:
► an expert’s averaged relative number of “good” answers over several trial items is proportional to the arithmetic mean of probabilities that his/her answers fall in defined “good intervals”
► this measure provides an index for expert’s ability to give answers close to true value
► leading to a set of differential weights for judgments of an expert group, and an ERF-based pooling DM for target items (central value counterpart to the Cooke Classical Model statistical accuracy DM).
* Flandoli, F., E. Giorgi, W. P. Aspinall and A. Neri (2011) Comparison of a new expert elicitation model with the Classical Model, equal weights and single experts, using a cross-validation technique. Reliability Engineering and System Safety, 96, 1292–1310. doi: 10.1016/j.ress.2011.05.012
Expected Relative Frequency (ERF) model
Cabot Summer School on UncertaintyExpert Elicitation Research Topics
17 July 2013
Aspinall on Dependence; ERF, & PCPI 12
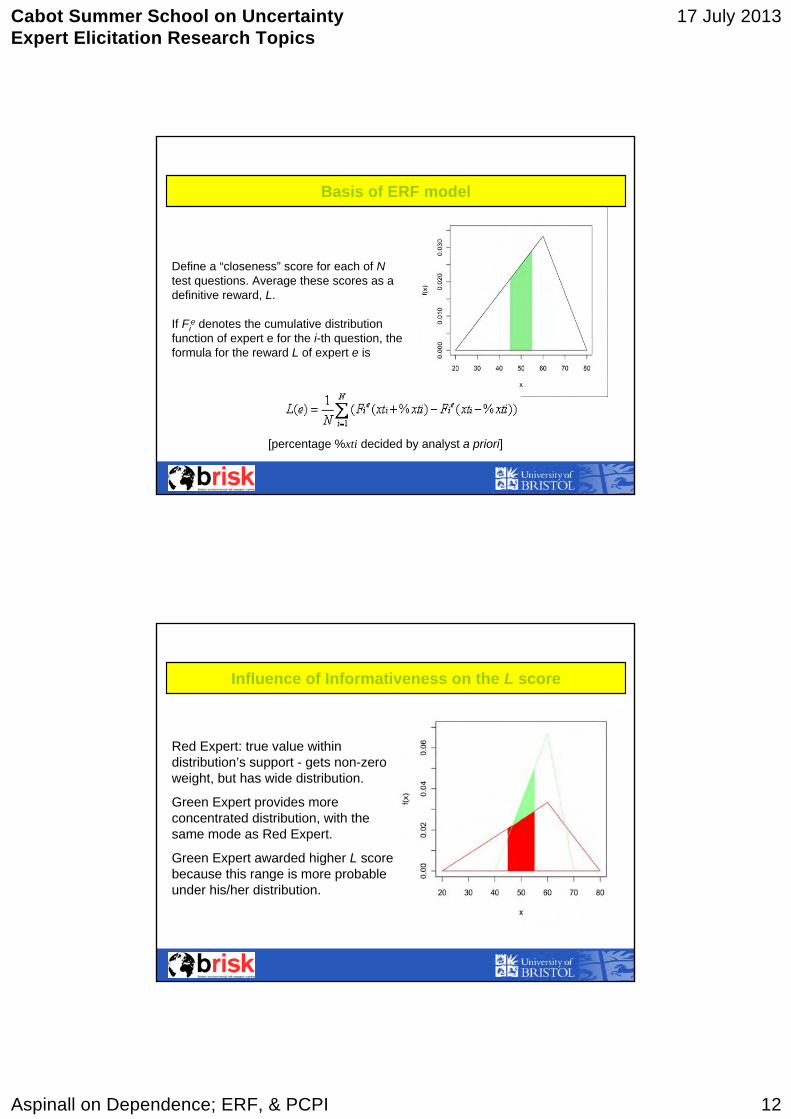
Define a “closeness” score for each of Ntest questions. Average these scores as a definitive reward, L.
If Fie denotes the cumulative distribution
function of expert e for the i-th question, the formula for the reward L of expert e is
[percentage %xti decided by analyst a priori]
Basis of ERF model
Red Expert: true value within distribution’s support - gets non-zero weight, but has wide distribution.
Green Expert provides more concentrated distribution, with the same mode as Red Expert.
Green Expert awarded higher L score because this range is more probable under his/her distribution.
Influence of Informativeness on the L score
Cabot Summer School on UncertaintyExpert Elicitation Research Topics
17 July 2013
Aspinall on Dependence; ERF, & PCPI 13
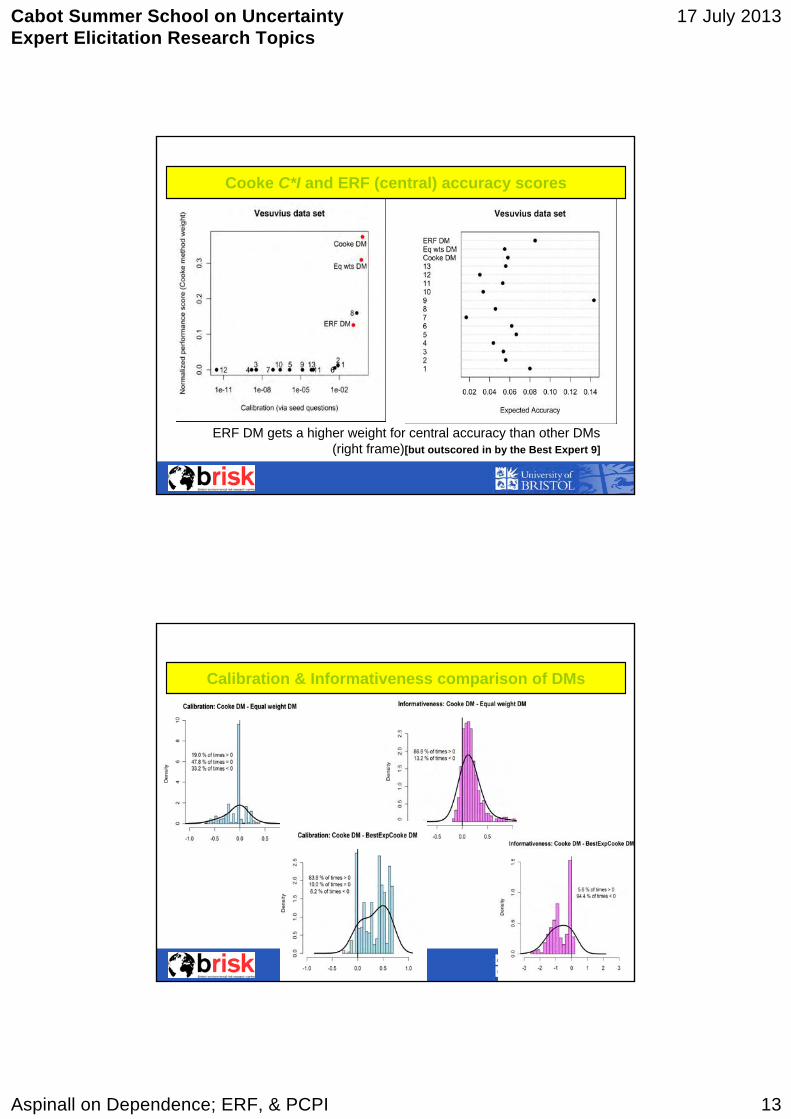
ERF DM gets a higher weight for central accuracy than other DMs(right frame)[but outscored in by the Best Expert 9]
Cooke C*I and ERF (central) accuracy scores
Calibration & Informativeness comparison of DMs
Cabot Summer School on UncertaintyExpert Elicitation Research Topics
17 July 2013
Aspinall on Dependence; ERF, & PCPI 14
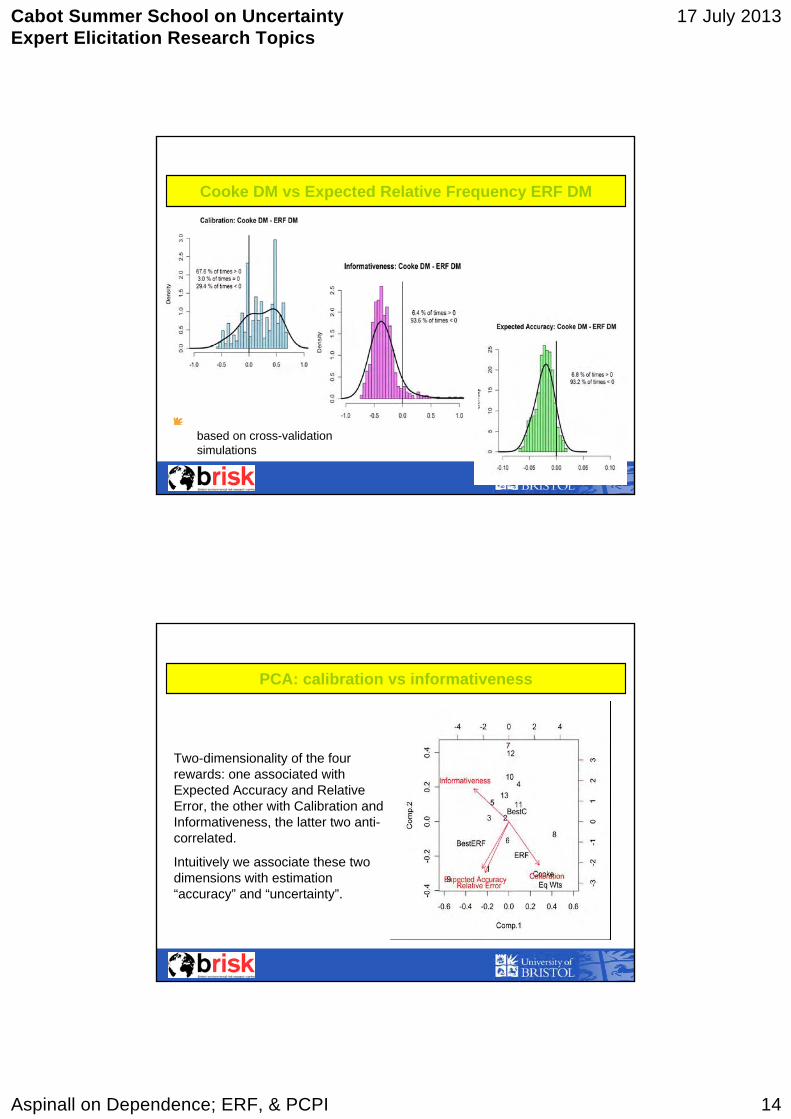
based on cross-validation simulations
Cooke DM vs Expected Relative Frequency ERF DM
Two-dimensionality of the four rewards: one associated with Expected Accuracy and Relative Error, the other with Calibration and Informativeness, the latter two anti-correlated.
Intuitively we associate these two dimensions with estimation “accuracy” and “uncertainty”.
PCA: calibration vs informativeness
Cabot Summer School on UncertaintyExpert Elicitation Research Topics
17 July 2013
Aspinall on Dependence; ERF, & PCPI 15
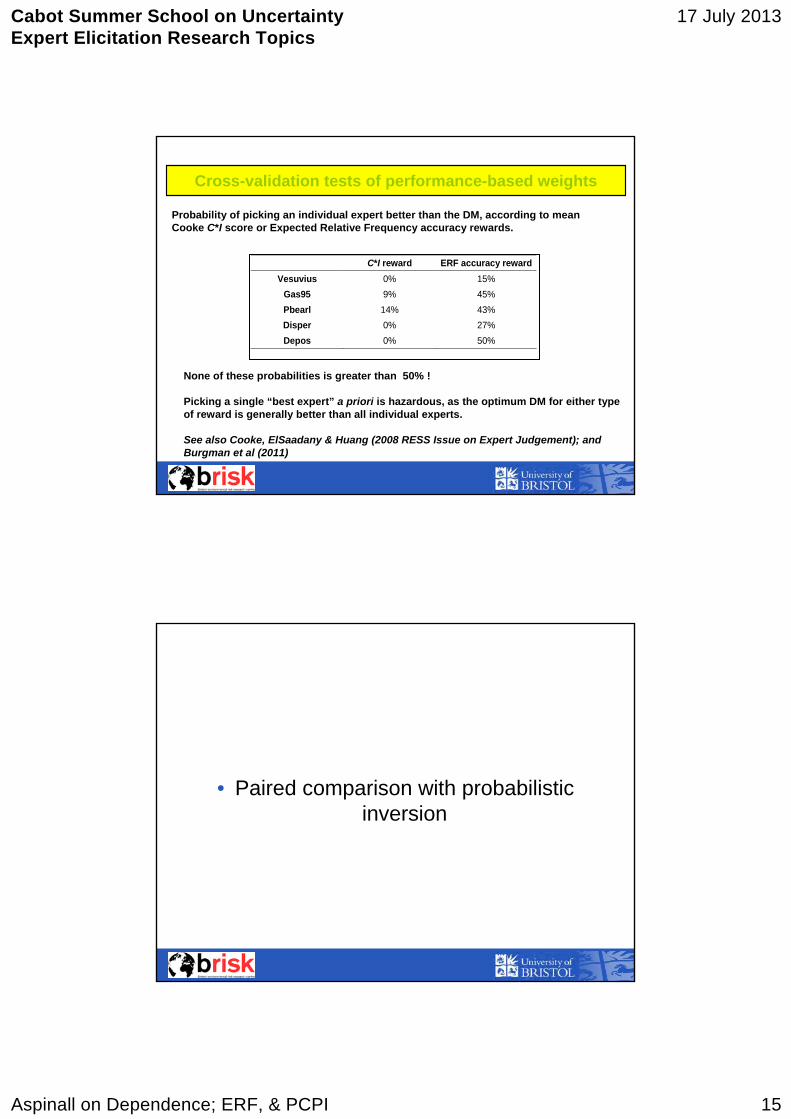
Probability of picking an individual expert better than the DM, according to mean Cooke C*I score or Expected Relative Frequency accuracy rewards.
C*I reward ERF accuracy rewardVesuvius 0% 15%
Gas95 9% 45% Pbearl 14% 43% Disper 0% 27% Depos 0% 50%
None of these probabilities is greater than 50% !
Picking a single “best expert” a priori is hazardous, as the optimum DM for either type of reward is generally better than all individual experts.
See also Cooke, ElSaadany & Huang (2008 RESS Issue on Expert Judgement); and Burgman et al (2011)
Cross-validation tests of performance-based weights
• Paired comparison with probabilistic inversion
Cabot Summer School on UncertaintyExpert Elicitation Research Topics
17 July 2013
Aspinall on Dependence; ERF, & PCPI 16
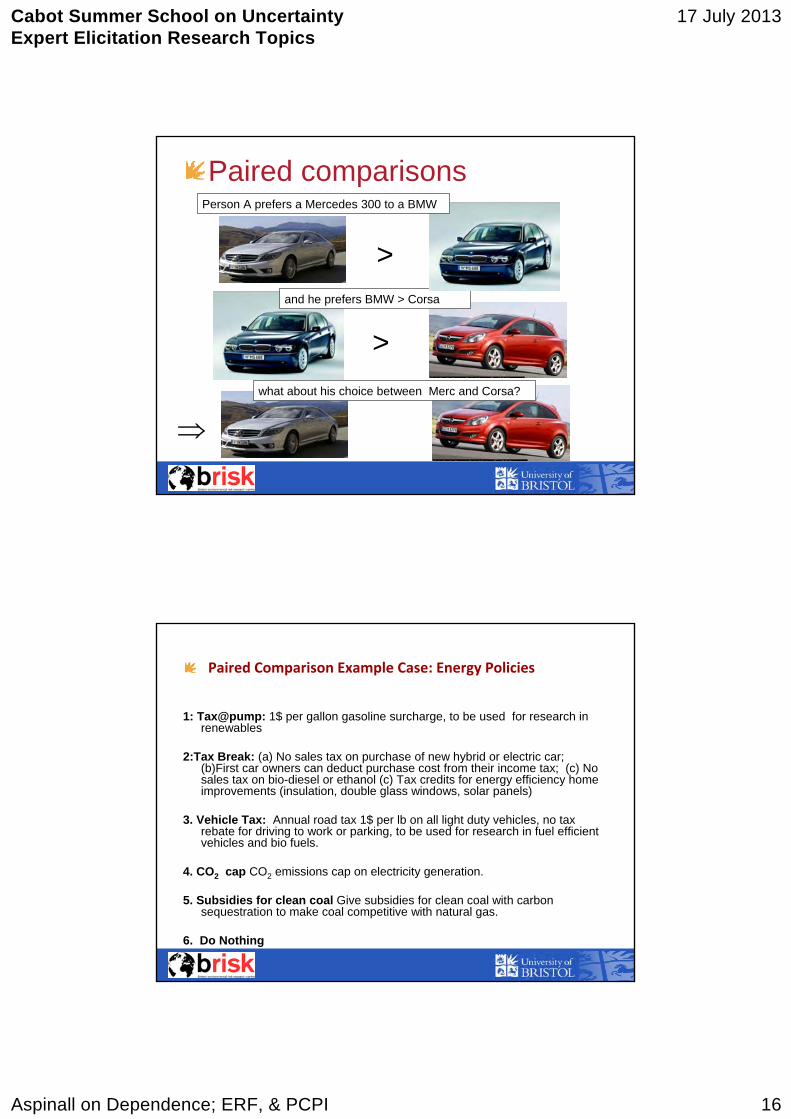
Paired comparisons
>
>
⇒
and he prefers BMW > Corsa
what about his choice between Merc and Corsa?
Person A prefers a Mercedes 300 to a BMW
Paired Comparison Example Case: Energy Policies
1: Tax@pump: 1$ per gallon gasoline surcharge, to be used for research in renewables
2:Tax Break: (a) No sales tax on purchase of new hybrid or electric car; (b)First car owners can deduct purchase cost from their income tax; (c) No sales tax on bio-diesel or ethanol (c) Tax credits for energy efficiency home improvements (insulation, double glass windows, solar panels)
3. Vehicle Tax: Annual road tax 1$ per lb on all light duty vehicles, no tax rebate for driving to work or parking, to be used for research in fuel efficient vehicles and bio fuels.
4. CO2 cap CO2 emissions cap on electricity generation.
5. Subsidies for clean coal Give subsidies for clean coal with carbon sequestration to make coal competitive with natural gas.
6. Do Nothing
Cabot Summer School on UncertaintyExpert Elicitation Research Topics
17 July 2013
Aspinall on Dependence; ERF, & PCPI 17
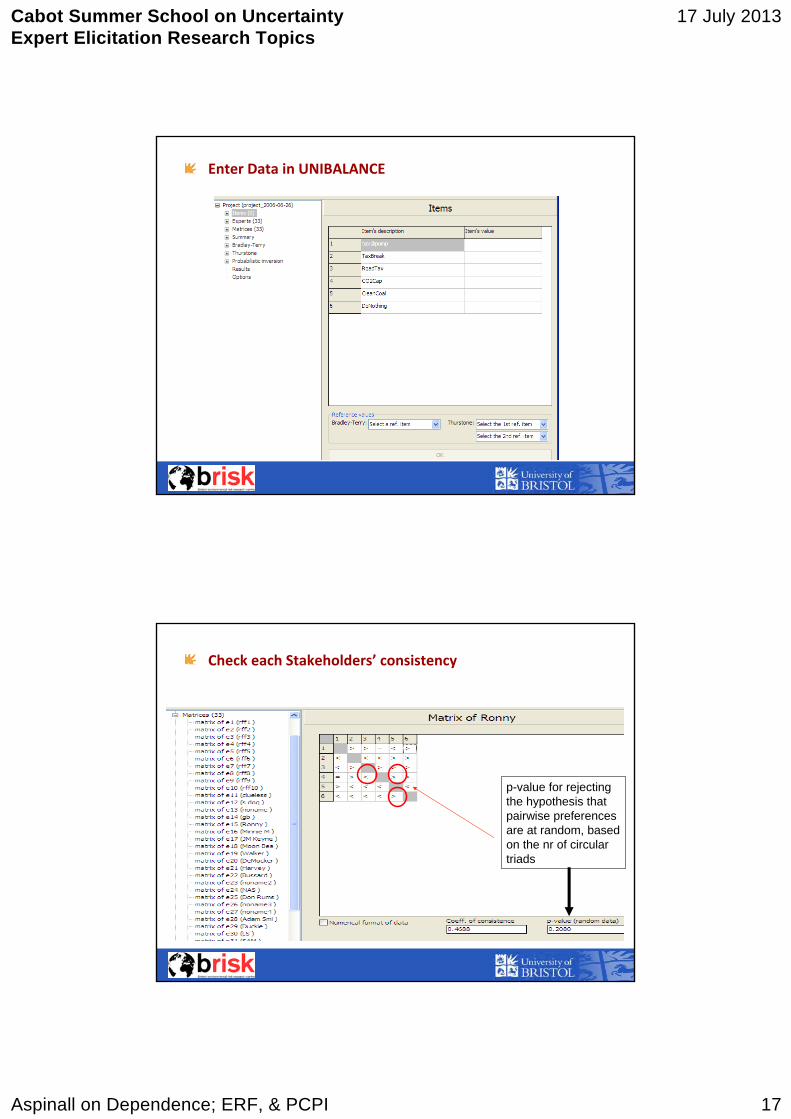
Enter Data in UNIBALANCE
Check each Stakeholders’ consistency
p-value for rejecting the hypothesis that pairwise preferences are at random, based on the nr of circular triads
Cabot Summer School on UncertaintyExpert Elicitation Research Topics
17 July 2013
Aspinall on Dependence; ERF, & PCPI 18
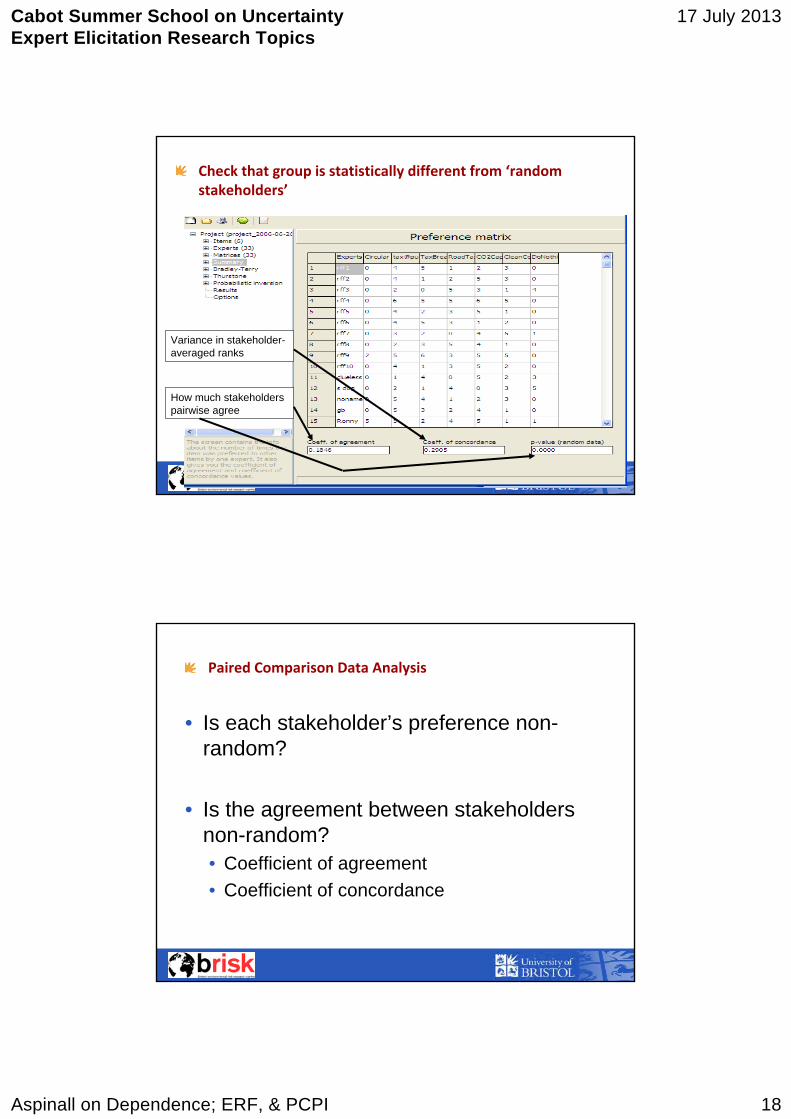
Check that group is statistically different from ‘random stakeholders’
Variance in stakeholder-averaged ranks
How much stakeholders pairwise agree
Paired Comparison Data Analysis
• Is each stakeholder’s preference non-random?
• Is the agreement between stakeholders non-random?• Coefficient of agreement• Coefficient of concordance
Cabot Summer School on UncertaintyExpert Elicitation Research Topics
17 July 2013
Aspinall on Dependence; ERF, & PCPI 19
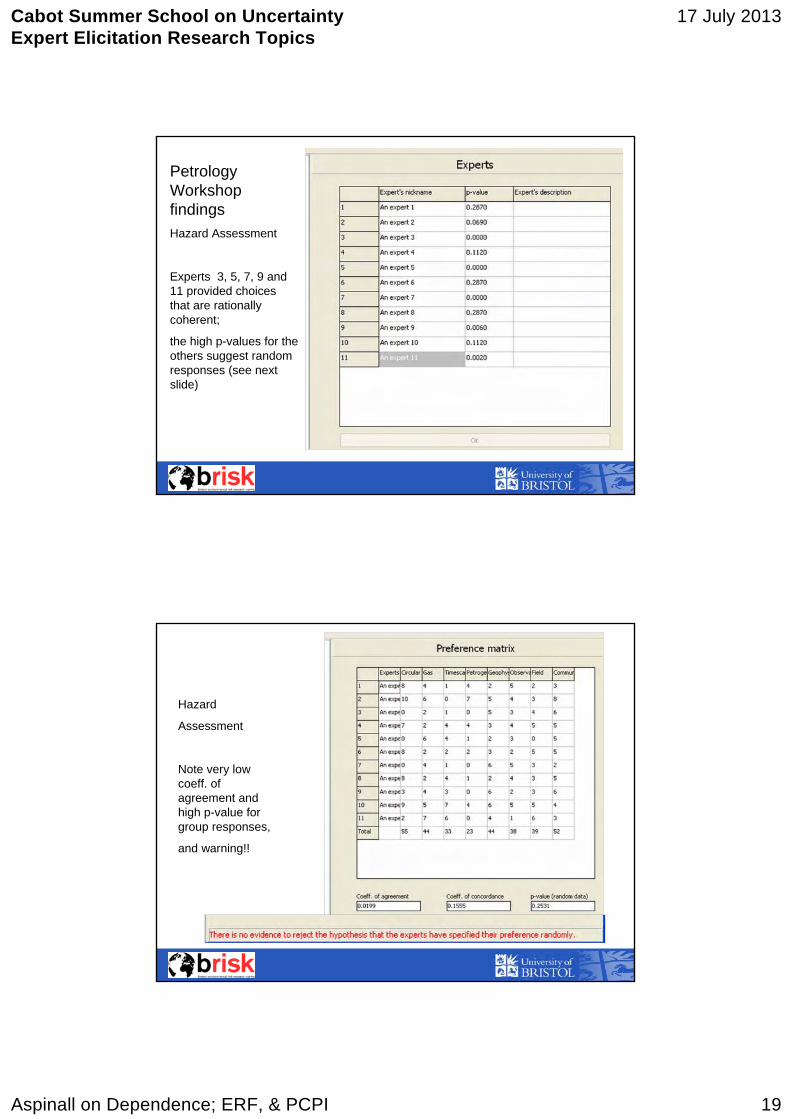
Petrology Workshop findingsHazard Assessment
Experts 3, 5, 7, 9 and 11 provided choices that are rationally coherent;
the high p-values for the others suggest random responses (see next slide)
Hazard
Assessment
Note very low coeff. of agreement and high p-value for group responses,
and warning!!
Cabot Summer School on UncertaintyExpert Elicitation Research Topics
17 July 2013
Aspinall on Dependence; ERF, & PCPI 20
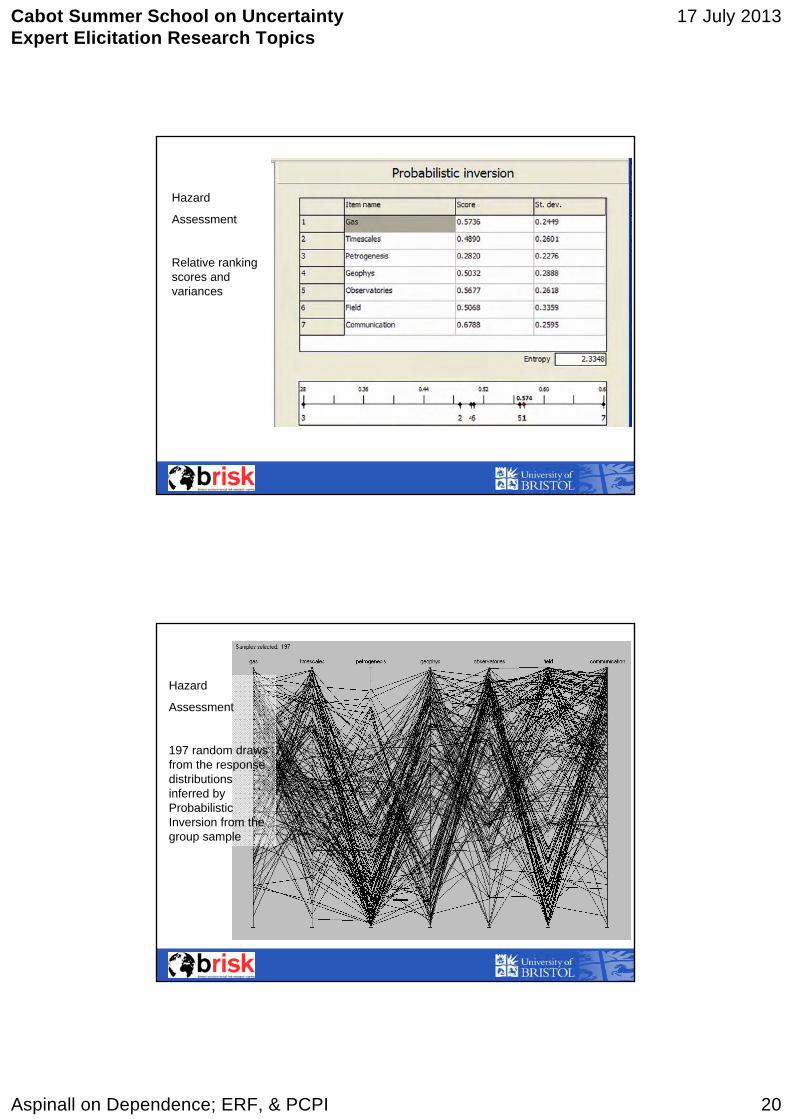
Hazard
Assessment
Relative ranking scores and variances
Hazard
Assessment
197 random draws from the response distributions inferred by Probabilistic Inversion from the group sample
Cabot Summer School on UncertaintyExpert Elicitation Research Topics
17 July 2013
Aspinall on Dependence; ERF, & PCPI 21
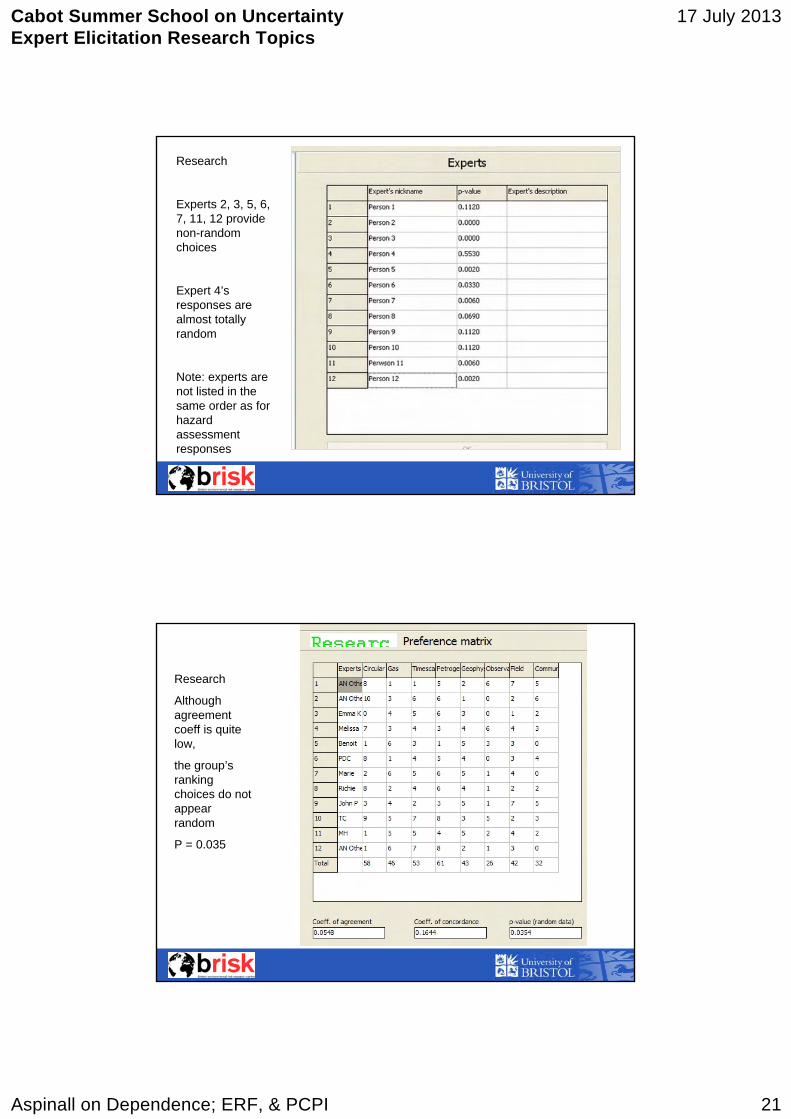
Research
Experts 2, 3, 5, 6, 7, 11, 12 provide non-random choices
Expert 4’s responses are almost totally random
Note: experts are not listed in the same order as for hazard assessment responses
Research
Although agreement coeff is quite low,
the group’s ranking choices do not appear random
P = 0.035
Cabot Summer School on UncertaintyExpert Elicitation Research Topics
17 July 2013
Aspinall on Dependence; ERF, & PCPI 22
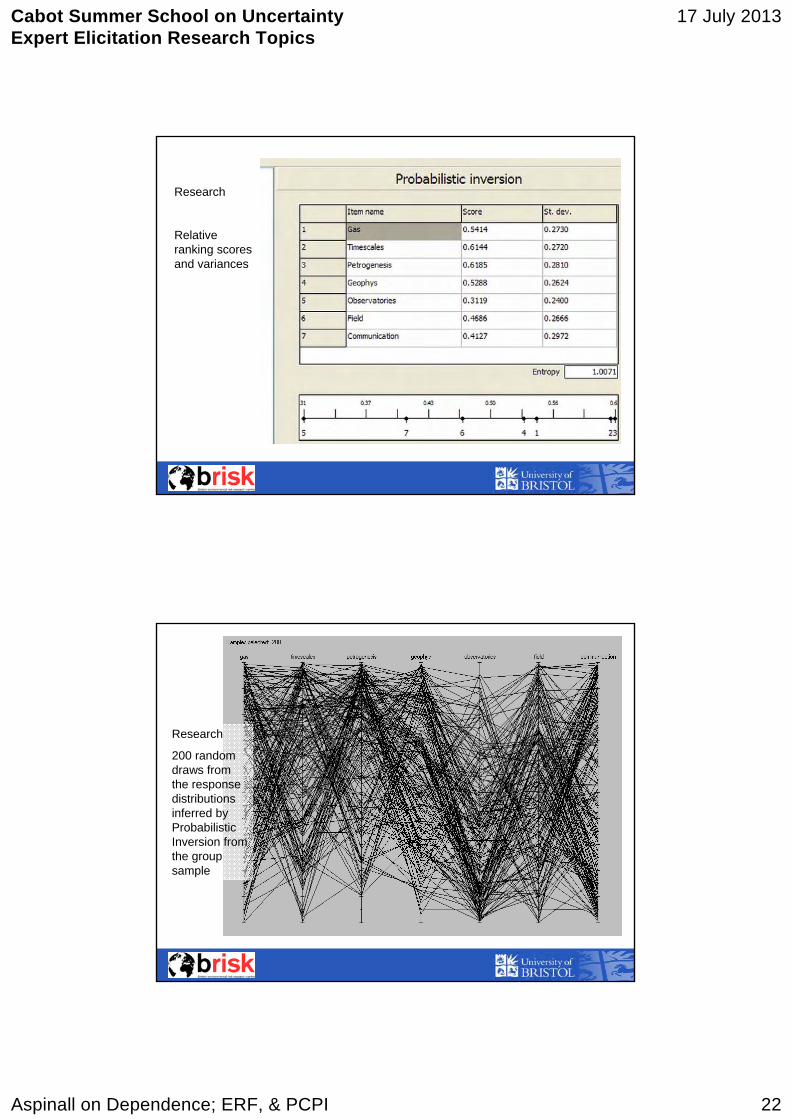
Research
Relative ranking scores and variances
Research
200 random draws from the response distributions inferred by Probabilistic Inversion from the group sample
Cabot Summer School on UncertaintyExpert Elicitation Research Topics
17 July 2013
Aspinall on Dependence; ERF, & PCPI 23
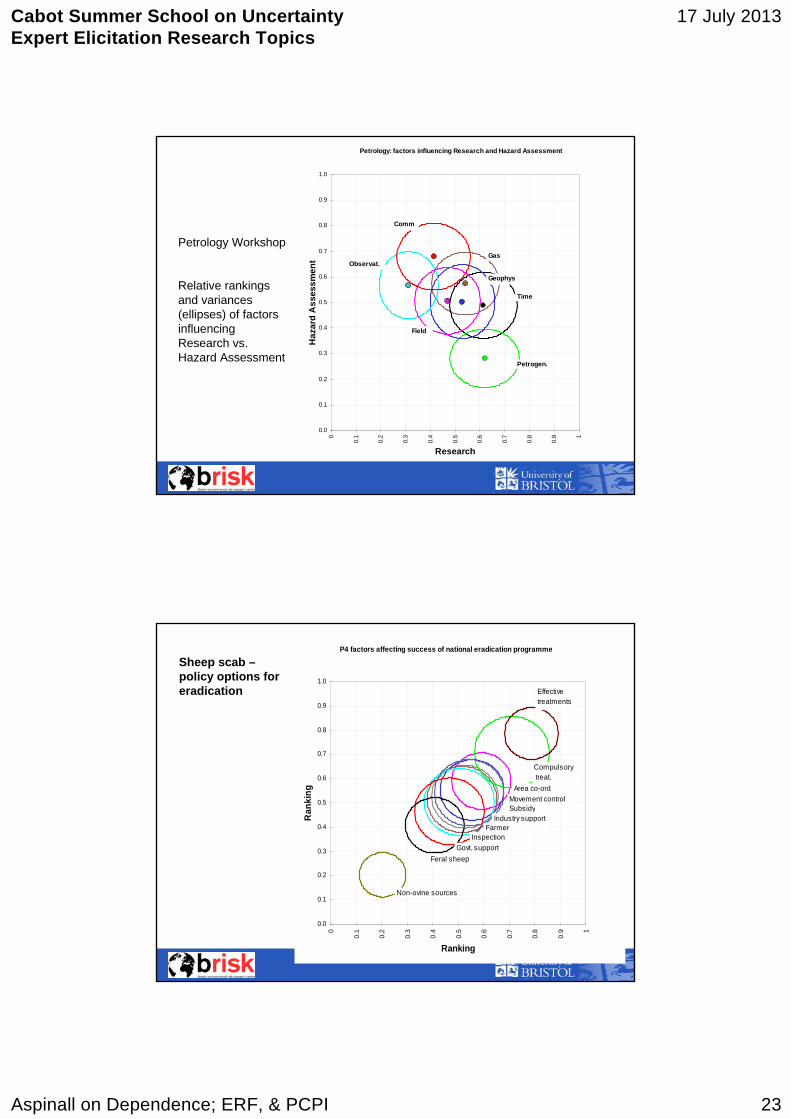
Petrology: factors influencing Research and Hazard Assessment
0.0
0.1
0.2
0.3
0.4
0.5
0.6
0.7
0.8
0.9
1.0
0
0.1
0.2
0.3
0.4
0.5
0.6
0.7
0.8
0.9 1
Research
Haz
ard
Ass
essm
ent
Time
Petrogen.
Gas
Geophys
Field
Comm
Observat.
Petrology Workshop
Relative rankings and variances (ellipses) of factors influencing Research vs. Hazard Assessment
P4 factors affecting success of national eradication programme
0.0
0.1
0.2
0.3
0.4
0.5
0.6
0.7
0.8
0.9
1.0
0
0.1
0.2
0.3
0.4
0.5
0.6
0.7
0.8
0.9 1
Ranking
Ran
king
Inspection
Industry supportSubsidy
Compulsory treat.
Movement control
Farmer
Effectivetreatments
Area co-ord
Govt. supportFeral sheep
Non-ovine sources
Sheep scab –policy options for eradication
Cabot Summer School on UncertaintyExpert Elicitation Research Topics
17 July 2013
Aspinall on Dependence; ERF, & PCPI 24
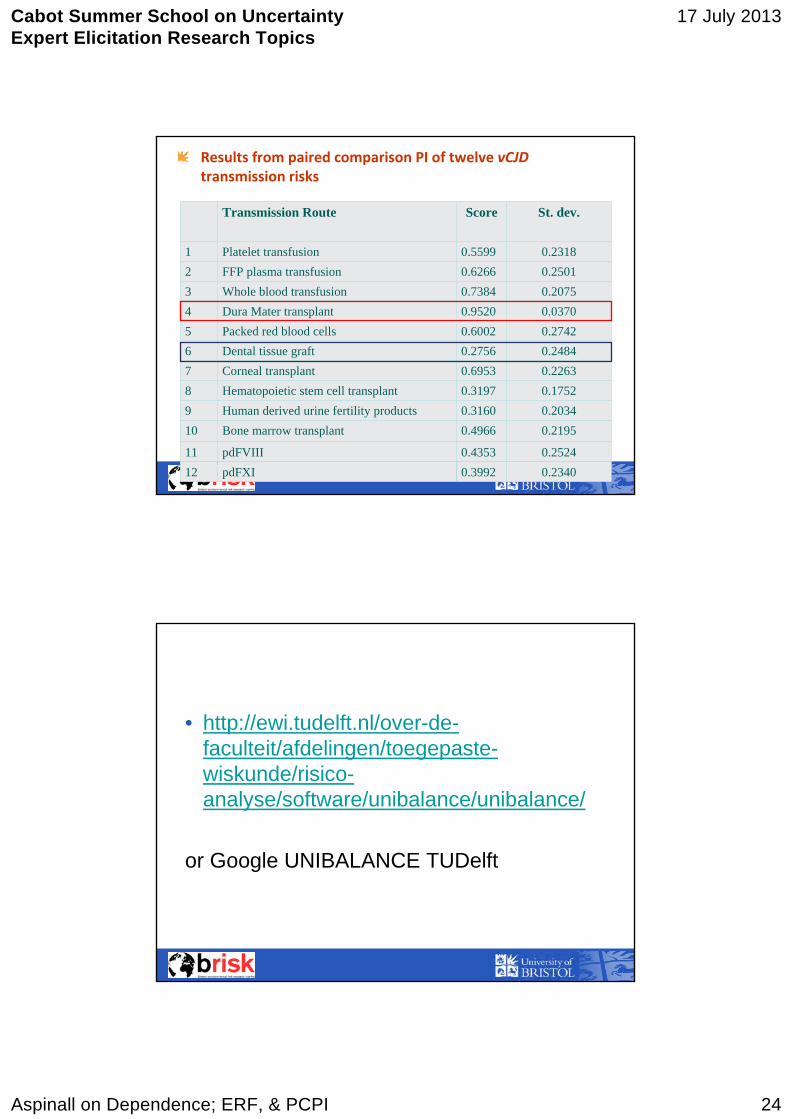
Results from paired comparison PI of twelve vCJDtransmission risks
Transmission Route Score St. dev.
1 Platelet transfusion 0.5599 0.23182 FFP plasma transfusion 0.6266 0.25013 Whole blood transfusion 0.7384 0.20754 Dura Mater transplant 0.9520 0.03705 Packed red blood cells 0.6002 0.27426 Dental tissue graft 0.2756 0.24847 Corneal transplant 0.6953 0.22638 Hematopoietic stem cell transplant 0.3197 0.17529 Human derived urine fertility products 0.3160 0.203410 Bone marrow transplant 0.4966 0.2195
11 pdFVIII 0.4353 0.252412 pdFXI 0.3992 0.2340
• http://ewi.tudelft.nl/over-de-faculteit/afdelingen/toegepaste-wiskunde/risico-analyse/software/unibalance/unibalance/
or Google UNIBALANCE TUDelft
Cabot Summer School on UncertaintyExpert Elicitation Research Topics
17 July 2013
Aspinall on Dependence; ERF, & PCPI 25
Thank you!Back to a climate change image for the last word …….


![[Edward Aspinall] Opposing Suharto Compromise, Re(BookFi.org)](https://static.fdocuments.us/doc/165x107/563db81b550346aa9a90a149/edward-aspinall-opposing-suharto-compromise-rebookfiorg.jpg)