Mara G. Aspinall President Genzyme...
31
The Health Industry Forum October 12, 2006 Mara G. Aspinall President Genzyme Genetics
Transcript of Mara G. Aspinall President Genzyme...
The Health Industry Forum
October 12, 2006
Mara G. AspinallPresidentGenzyme Genetics
Themes for today
Diagnostics (both genetic and non-genetic) to play larger role in the future
Evolving toward sustainable business models
Policy decisions needed today to support innovation and improved outcomes
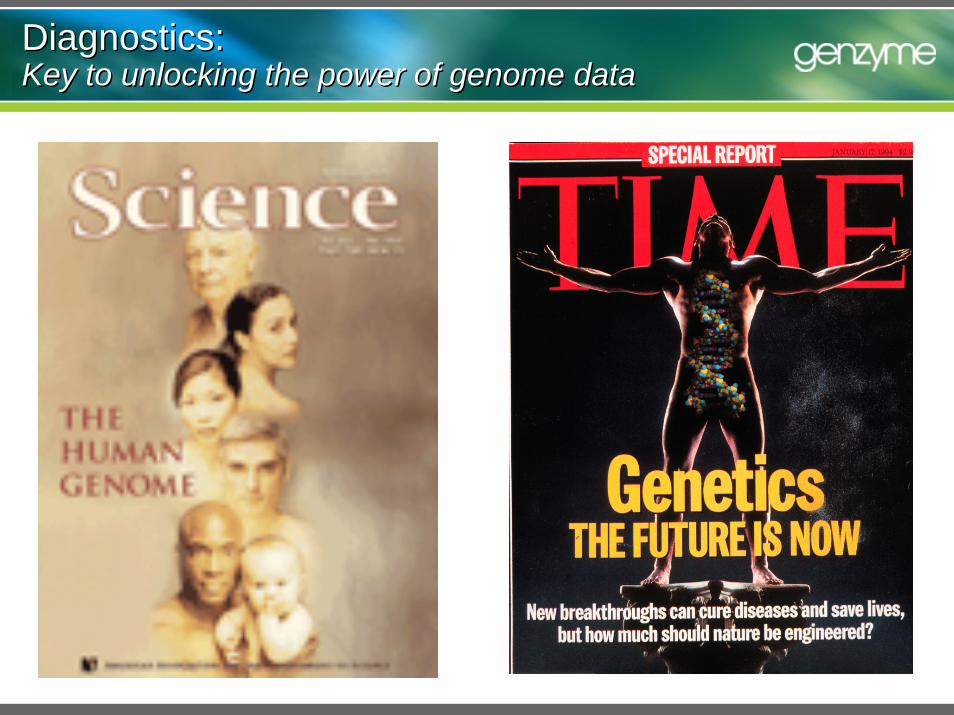
Diagnostics: Key to unlocking the power of genome dataDiagnostics: Key to unlocking the power of genome data
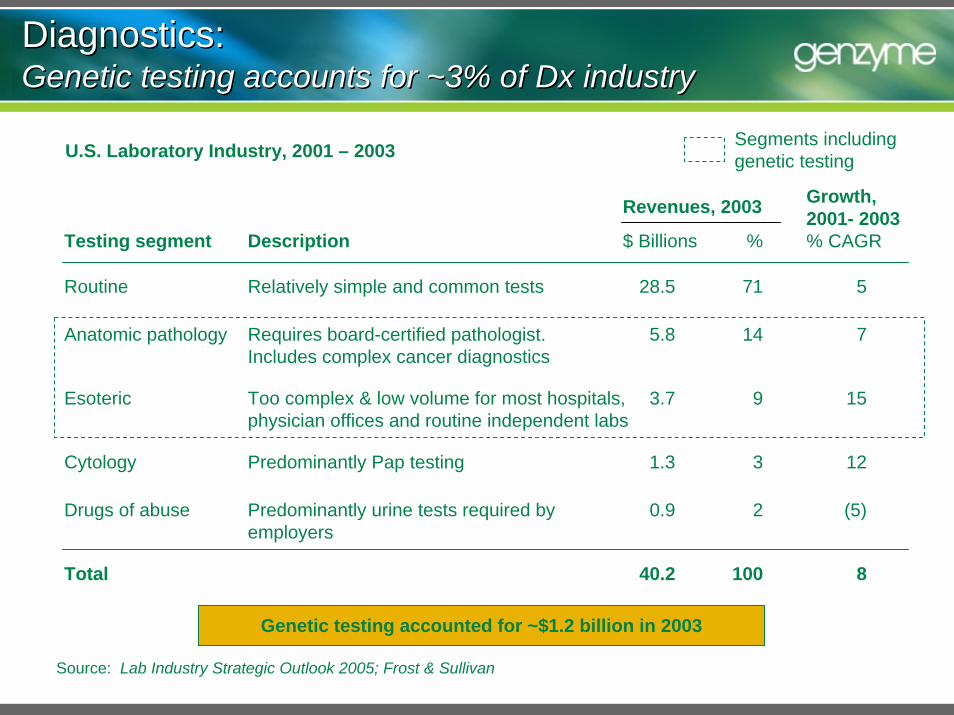
Source: Lab Industry Strategic Outlook 2005; Frost & Sullivan
Testing segment
Drugs of abuse
Routine
Revenues, 2003
28.5
Cytology 1.3
0.9
Anatomic pathology 5.8
Esoteric 3.7
14
9
$ Billions %
71
3
2
Growth, 2001- 2003% CAGR
5
12
(5)
7
15
Requires board-certified pathologist. Includes complex cancer diagnostics
Too complex & low volume for most hospitals, physician offices and routine independent labs
Description
Predominantly urine tests required by employers
Relatively simple and common tests
Predominantly Pap testing
Total 40.2 100 8
Genetic testing accounted for ~$1.2 billion in 2003
Diagnostics: Genetic testing accounts for ~3% of Dx industryDiagnostics: Genetic testing accounts for ~3% of Dx industry
U.S. Laboratory Industry, 2001 – 2003 Segments including genetic testing
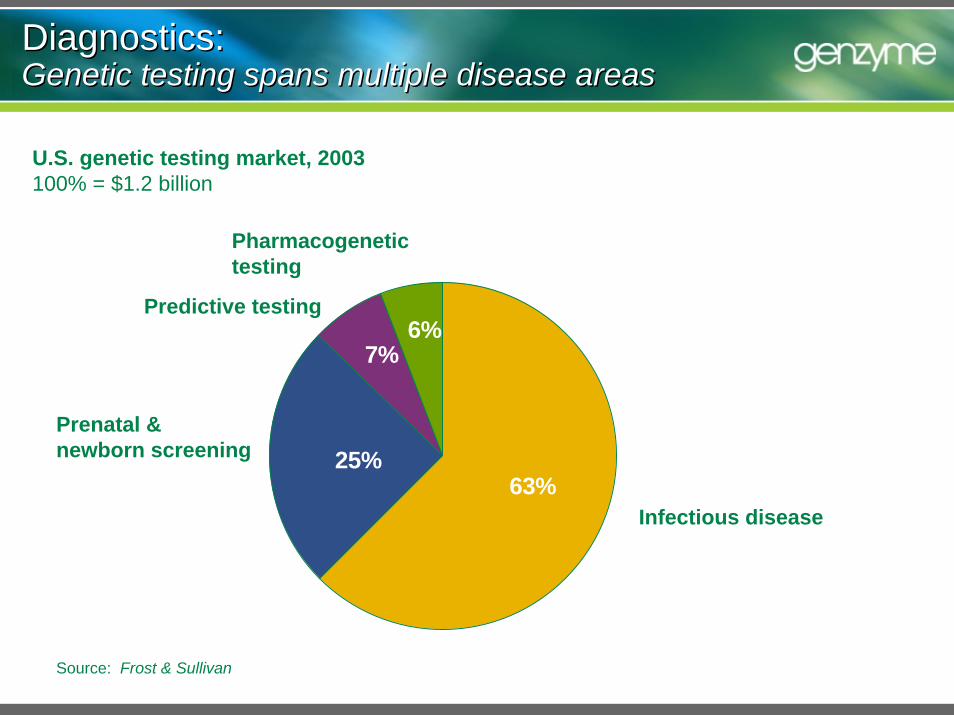
Source: Frost & Sullivan
Infectious disease
Pharmacogenetic testing
Prenatal & newborn screening
Predictive testing
Diagnostics: Genetic testing spans multiple disease areasDiagnostics: Genetic testing spans multiple disease areas
U.S. genetic testing market, 2003100% = $1.2 billion
6%7%
25%63%
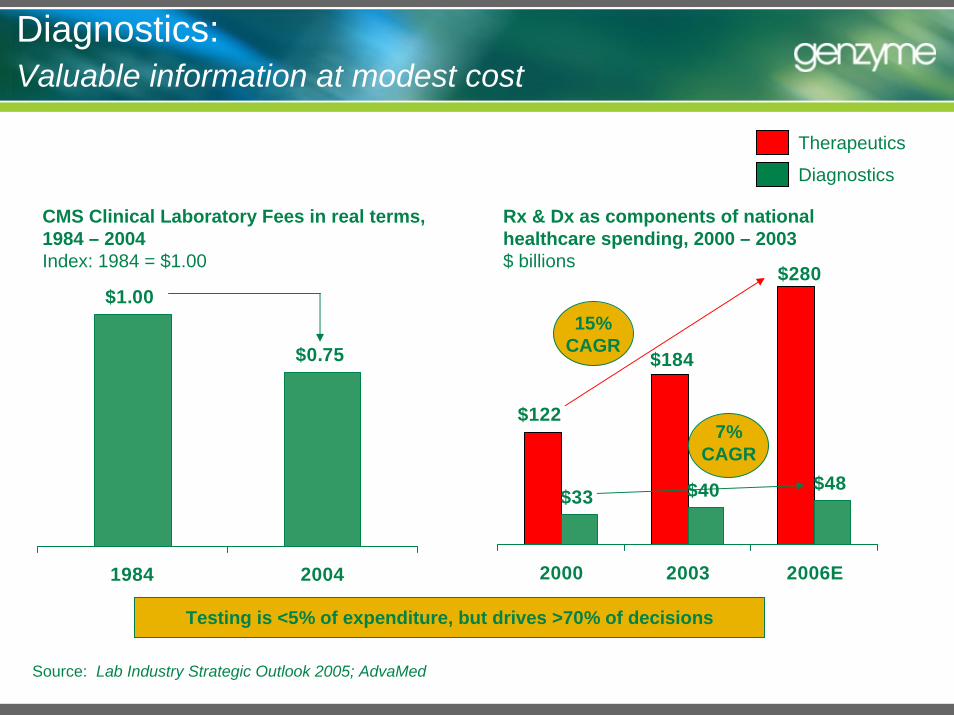
Diagnostics: Valuable information at modest cost
Source: Lab Industry Strategic Outlook 2005; AdvaMed
Rx & Dx as components of national healthcare spending, 2000 – 2003$ billions
$122
$33 $40 $48
$184
$280
2000 2003 2006E
CMS Clinical Laboratory Fees in real terms, 1984 – 2004Index: 1984 = $1.00
$1.00
$0.75
1984 2004
15% CAGR
7% CAGR
Testing is <5% of expenditure, but drives >70% of decisions
Therapeutics
Diagnostics
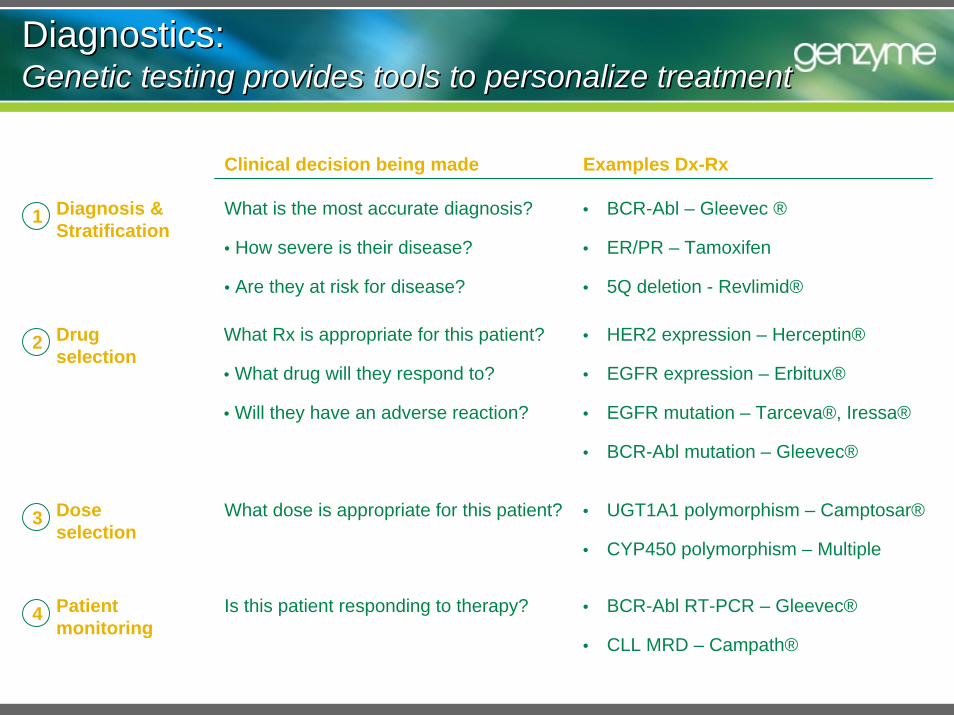
Diagnostics: Genetic testing provides tools to personalize treatmentDiagnostics: Genetic testing provides tools to personalize treatment
What is the most accurate diagnosis?
• How severe is their disease?
• Are they at risk for disease?
Diagnosis &Stratification
What Rx is appropriate for this patient?
• What drug will they respond to?
• Will they have an adverse reaction?
Drug selection
Clinical decision being made Examples Dx-Rx
• BCR-Abl – Gleevec ®
• ER/PR – Tamoxifen
• 5Q deletion - Revlimid®
1
• HER2 expression – Herceptin®
• EGFR expression – Erbitux®
• EGFR mutation – Tarceva®, Iressa®
• BCR-Abl mutation – Gleevec®
What dose is appropriate for this patient? • UGT1A1 polymorphism – Camptosar®
• CYP450 polymorphism – Multiple
Dose selection
Is this patient responding to therapy? • BCR-Abl RT-PCR – Gleevec®
• CLL MRD – Campath®
Patient monitoring
2
3
4
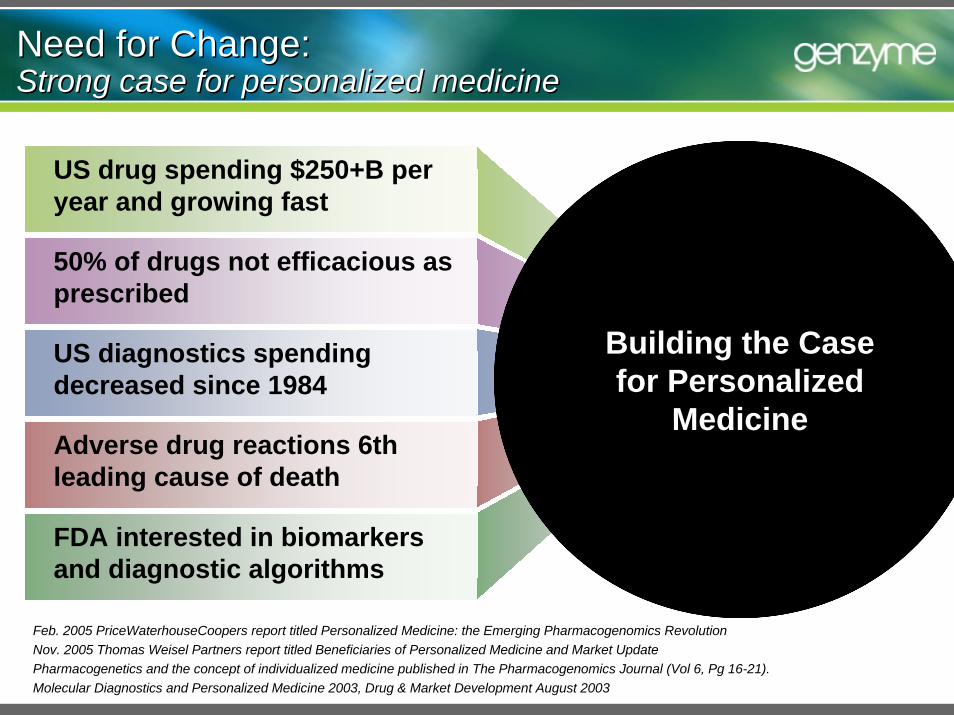
Feb. 2005 PriceWaterhouseCoopers report titled Personalized Medicine: the Emerging Pharmacogenomics Revolution Nov. 2005 Thomas Weisel Partners report titled Beneficiaries of Personalized Medicine and Market UpdatePharmacogenetics and the concept of individualized medicine published in The Pharmacogenomics Journal (Vol 6, Pg 16-21).Molecular Diagnostics and Personalized Medicine 2003, Drug & Market Development August 2003
Need for Change:Strong case for personalized medicineNeed for Change:Strong case for personalized medicine
50% of drugs not efficacious as prescribed
FDA interested in biomarkers and diagnostic algorithms
US diagnostics spending decreased since 1984
Adverse drug reactions 6th leading cause of death
US drug spending $250+B per year and growing fast
Building the Case for Personalized
Medicine
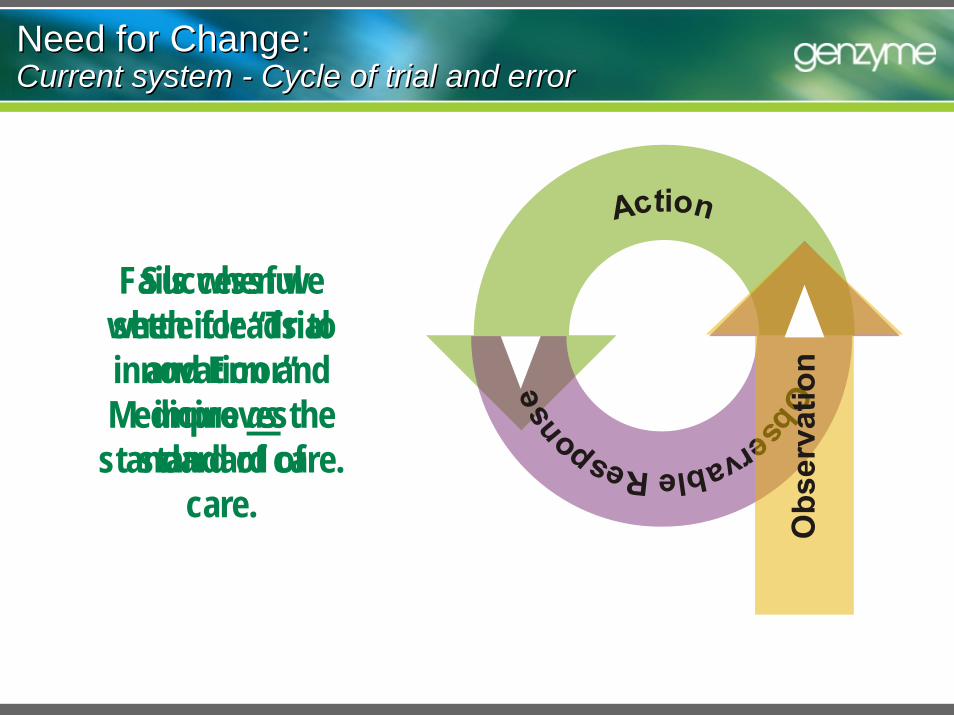
Successful when it leads to innovation and
improves standard of
care.
Fails when we settle for “Trial
and Error”Medicine as the
standard of care.
Need for Change:Current system - Cycle of trial and errorNeed for Change:Current system - Cycle of trial and error
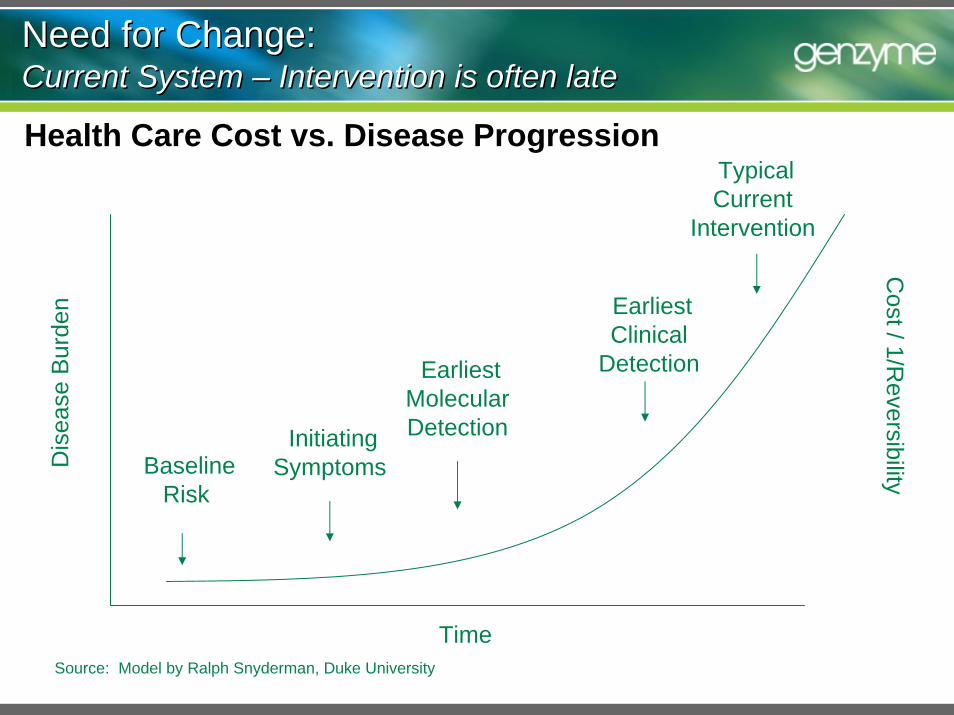
Need for Change:Current System – Intervention is often lateNeed for Change:Current System – Intervention is often late
Health Care Cost vs. Disease Progression
Dis
ease
Bur
den
Baseline Risk
EarliestMolecular DetectionInitiating
Symptoms
Earliest Clinical
Detection
Typical Current
Intervention
Time
Cost / 1/R
eversibility
Source: Model by Ralph Snyderman, Duke University
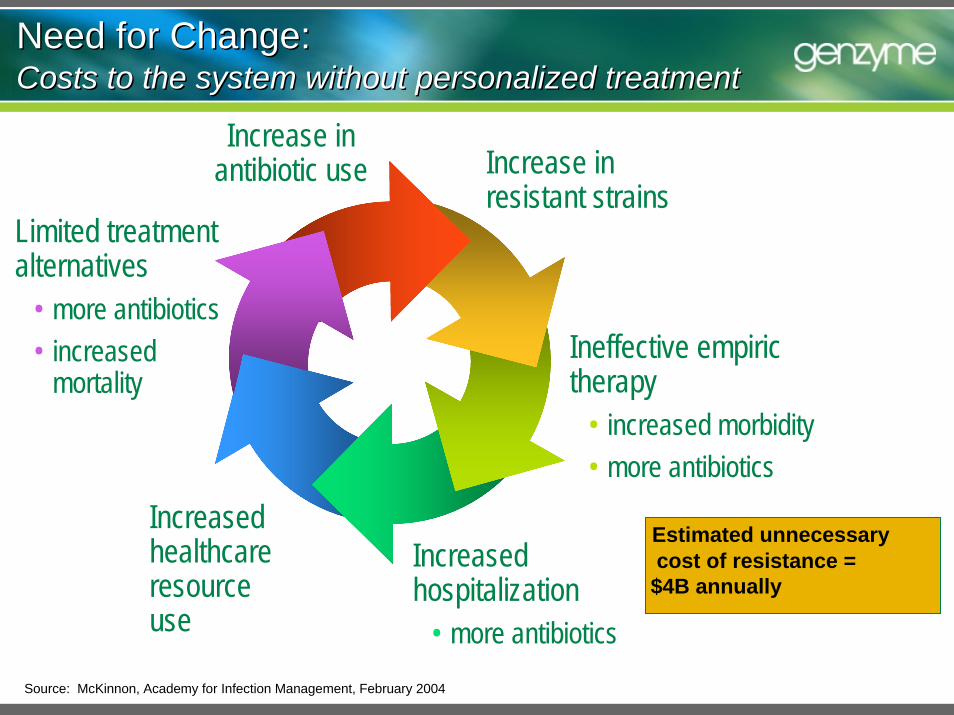
Increase inantibiotic use Increase in
resistant strains
Ineffective empirictherapy
• increased morbidity• more antibiotics
Increased healthcare resource use
Limited treatment alternatives
• more antibiotics• increased
mortality
Increasedhospitalization
• more antibiotics
Estimated unnecessarycost of resistance =
$4B annually
Source: McKinnon, Academy for Infection Management, February 2004
Need for Change: Costs to the system without personalized treatmentNeed for Change: Costs to the system without personalized treatment
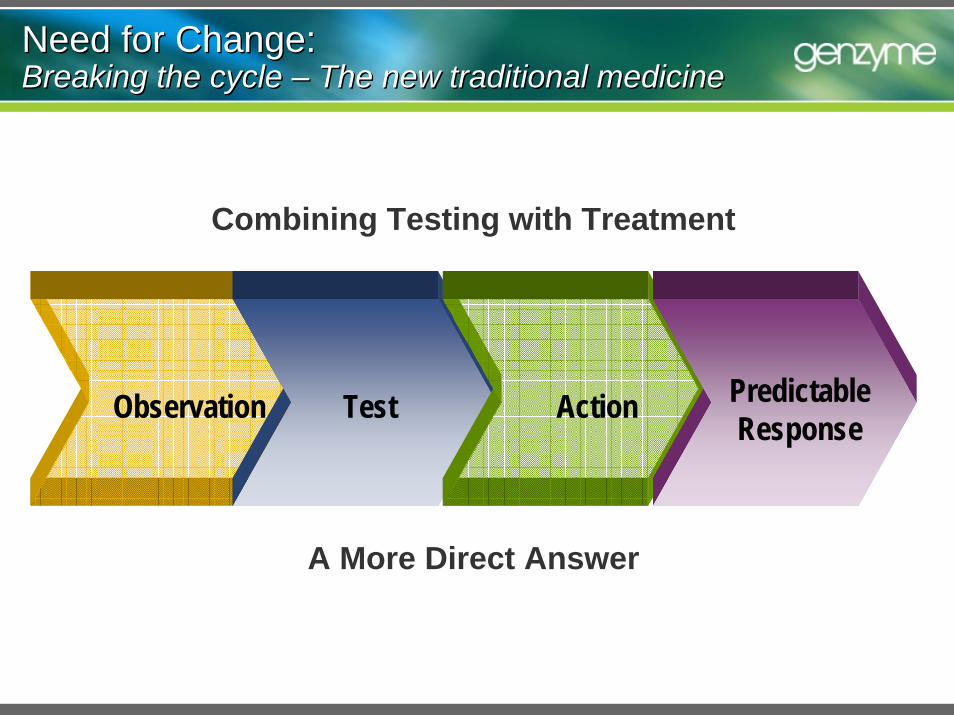
Combining Testing with Treatment
A More Direct Answer
Observation Test Action Predictable Response
Need for Change: Breaking the cycle – The new traditional medicineNeed for Change: Breaking the cycle – The new traditional medicine

Disease1 Year
Survival5 Year
Survival
Lung cancer (small cell-non small cell) 36-41%
Colorectal cancer 60% 39%
Chronic myeloid leukemia (CML) 73% 37%
Heart failure (male-female) 76-72% 41-55%
End stage renal disease 78% 38%
6-13%
12005 USRDS Annual Data Report2 Levy, et. al., Long-term trends in the incidence and survival from heart failure, NEJM, 2002; 347(18):1397-4023Cancer Perspectives U.S., 2004 Fourth Edition, DaVinci Healthcare Partners; NCI SEER data, average across all stages at Dx
Need for Change:Patients don’t have time for trial & errorNeed for Change:Patients don’t have time for trial & error
93% 80%
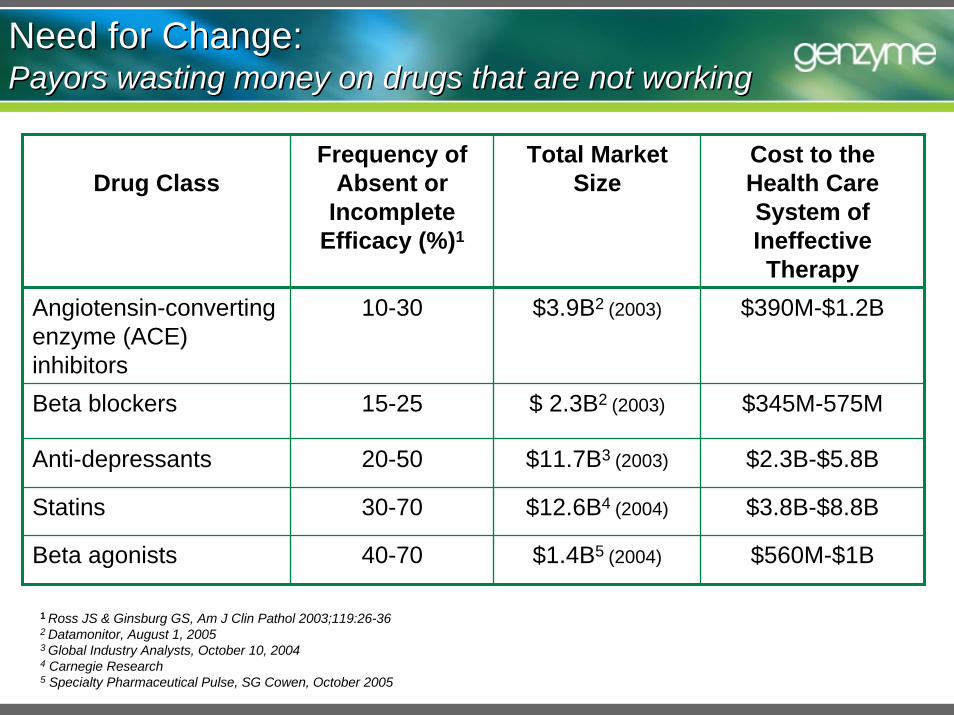
Need for Change:Payors wasting money on drugs that are not workingNeed for Change:Payors wasting money on drugs that are not working
Drug ClassFrequency of
Absent or Incomplete
Efficacy (%)1
Total Market Size
Cost to the Health Care System of Ineffective Therapy
Angiotensin-converting enzyme (ACE) inhibitors
10-30
15-25
20-50
30-70
40-70
$390M-$1.2B
Beta blockers
$3.9B2 (2003)
$ 2.3B2 (2003)
$11.7B3 (2003)
$12.6B4 (2004)
$345M-575M
Anti-depressants $2.3B-$5.8B
Statins $3.8B-$8.8B
Beta agonists $1.4B5 (2004) $560M-$1B
1 Ross JS & Ginsburg GS, Am J Clin Pathol 2003;119:26-362 Datamonitor, August 1, 20053 Global Industry Analysts, October 10, 20044 Carnegie Research5 Specialty Pharmaceutical Pulse, SG Cowen, October 2005
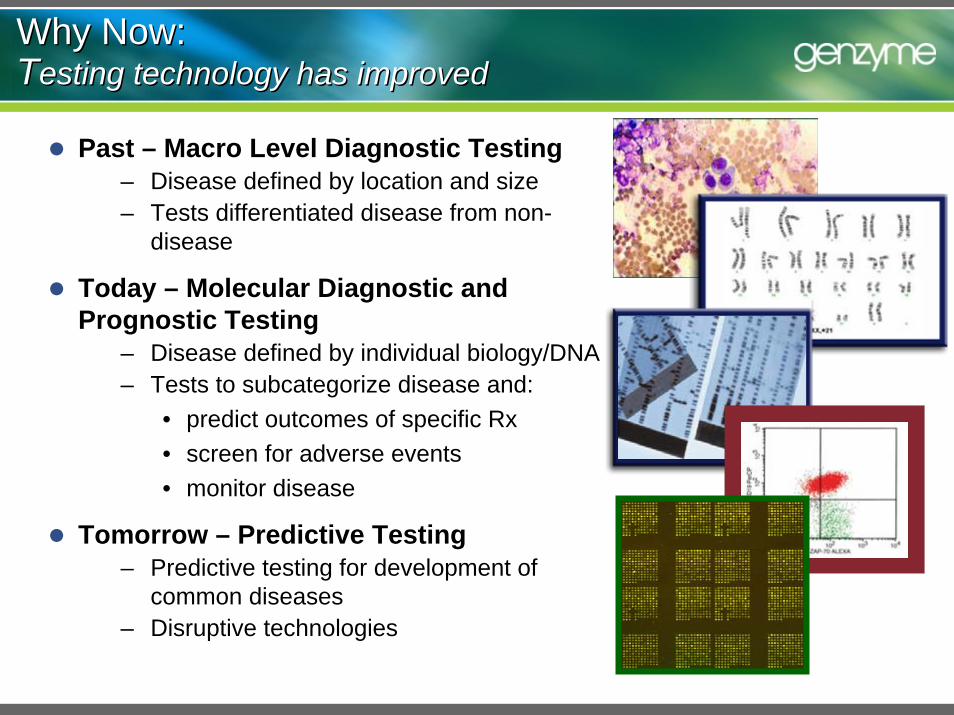
Past – Macro Level Diagnostic Testing– Disease defined by location and size– Tests differentiated disease from non-
disease
Today – Molecular Diagnostic and Prognostic Testing
– Disease defined by individual biology/DNA – Tests to subcategorize disease and:
• predict outcomes of specific Rx• screen for adverse events• monitor disease
Tomorrow – Predictive Testing– Predictive testing for development of
common diseases– Disruptive technologies
Why Now: Testing technology has improvedWhy Now: Testing technology has improved
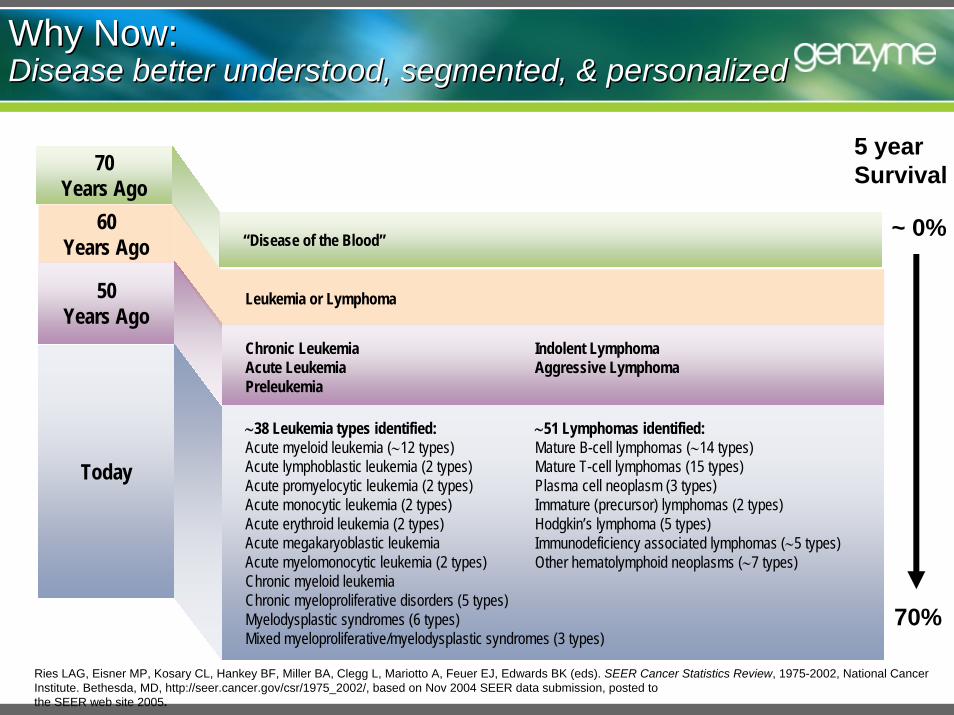
Ries LAG, Eisner MP, Kosary CL, Hankey BF, Miller BA, Clegg L, Mariotto A, Feuer EJ, Edwards BK (eds). SEER Cancer Statistics Review, 1975-2002, National Cancer Institute. Bethesda, MD, http://seer.cancer.gov/csr/1975_2002/, based on Nov 2004 SEER data submission, posted to the SEER web site 2005.
Why Now:Disease better understood, segmented, & personalizedWhy Now:Disease better understood, segmented, & personalized
60 Years Ago
Leukemia or Lymphoma50 Years Ago
Chronic LeukemiaAcute LeukemiaPreleukemia
Indolent LymphomaAggressive Lymphoma
70 Years Ago
“Disease of the Blood”
Today
∼38 Leukemia types identified:Acute myeloid leukemia (∼12 types)Acute lymphoblastic leukemia (2 types)Acute promyelocytic leukemia (2 types)Acute monocytic leukemia (2 types)Acute erythroid leukemia (2 types)Acute megakaryoblastic leukemiaAcute myelomonocytic leukemia (2 types)Chronic myeloid leukemiaChronic myeloproliferative disorders (5 types)Myelodysplastic syndromes (6 types)Mixed myeloproliferative/myelodysplastic syndromes (3 types)
∼51 Lymphomas identified:Mature B-cell lymphomas (∼14 types)Mature T-cell lymphomas (15 types)Plasma cell neoplasm (3 types)Immature (precursor) lymphomas (2 types)Hodgkin’s lymphoma (5 types)Immunodeficiency associated lymphomas (∼5 types)Other hematolymphoid neoplasms (∼7 types)
5 yearSurvival
~ 0%
70%
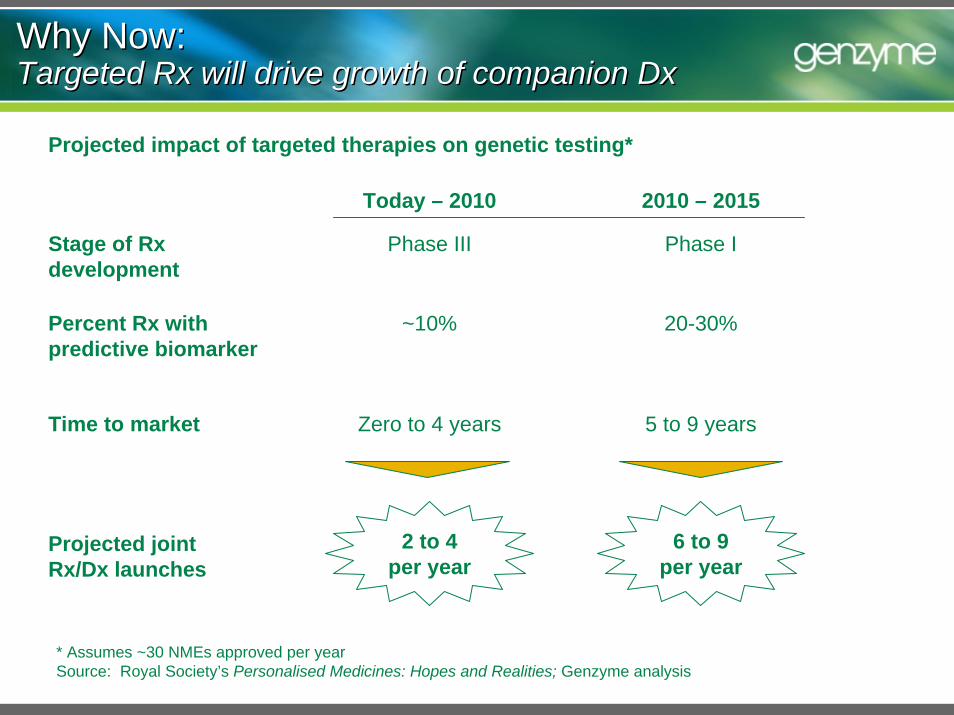
Why Now: Targeted Rx will drive growth of companion DxWhy Now: Targeted Rx will drive growth of companion Dx
Projected impact of targeted therapies on genetic testing*
2 to 4 per year
Today – 2010 2010 – 2015
Stage of Rx development
Percent Rx with predictive biomarker
Time to market
Phase III
~10%
Zero to 4 years
Projected joint Rx/Dx launches
6 to 9 per year
Phase I
20-30%
5 to 9 years
* Assumes ~30 NMEs approved per yearSource: Royal Society’s Personalised Medicines: Hopes and Realities; Genzyme analysis
Business models and challenges
Diagnostic and therapeutic companies both drive innovation
Active area of venture investment and partnership
Significant challenges to sustainable business model
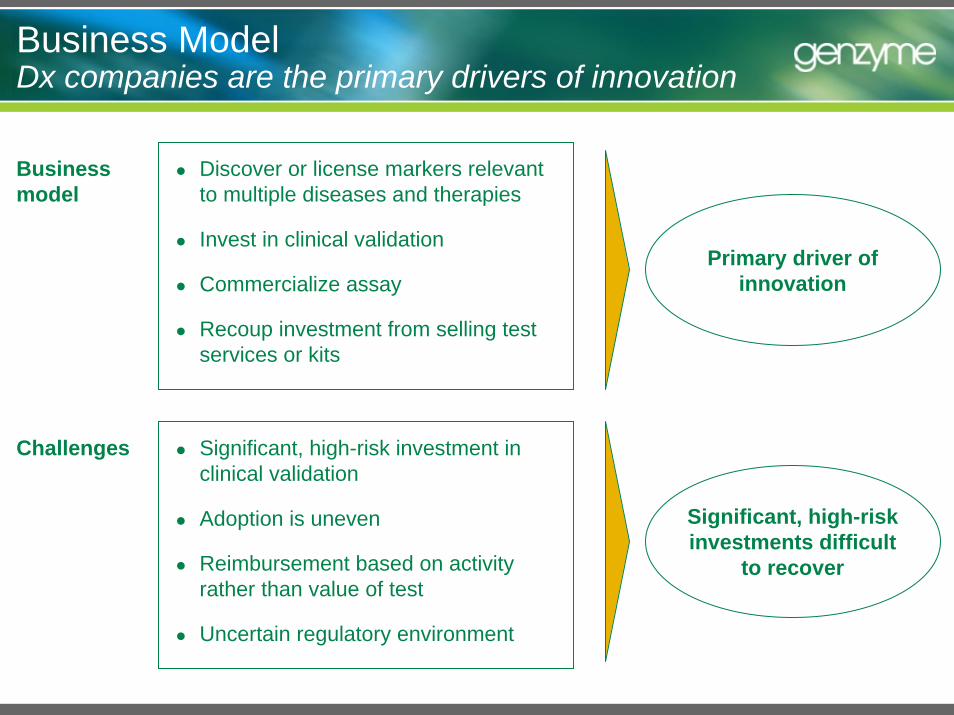
Business ModelDx companies are the primary drivers of innovation
Discover or license markers relevant to multiple diseases and therapies
Invest in clinical validation
Commercialize assay
Recoup investment from selling test services or kits
Business model
Primary driver of innovation
Significant, high-risk investment in clinical validation
Adoption is uneven
Reimbursement based on activity rather than value of test
Uncertain regulatory environment
Challenges
Significant, high-risk investments difficult
to recover
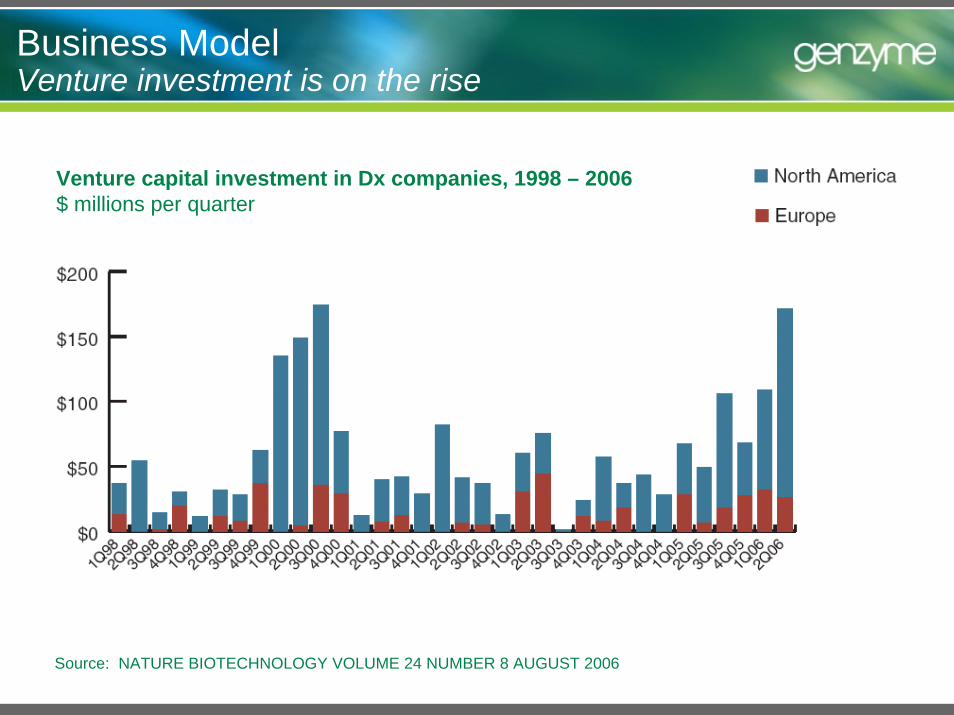
Business ModelVenture investment is on the rise
Source: NATURE BIOTECHNOLOGY VOLUME 24 NUMBER 8 AUGUST 2006
Venture capital investment in Dx companies, 1998 – 2006$ millions per quarter
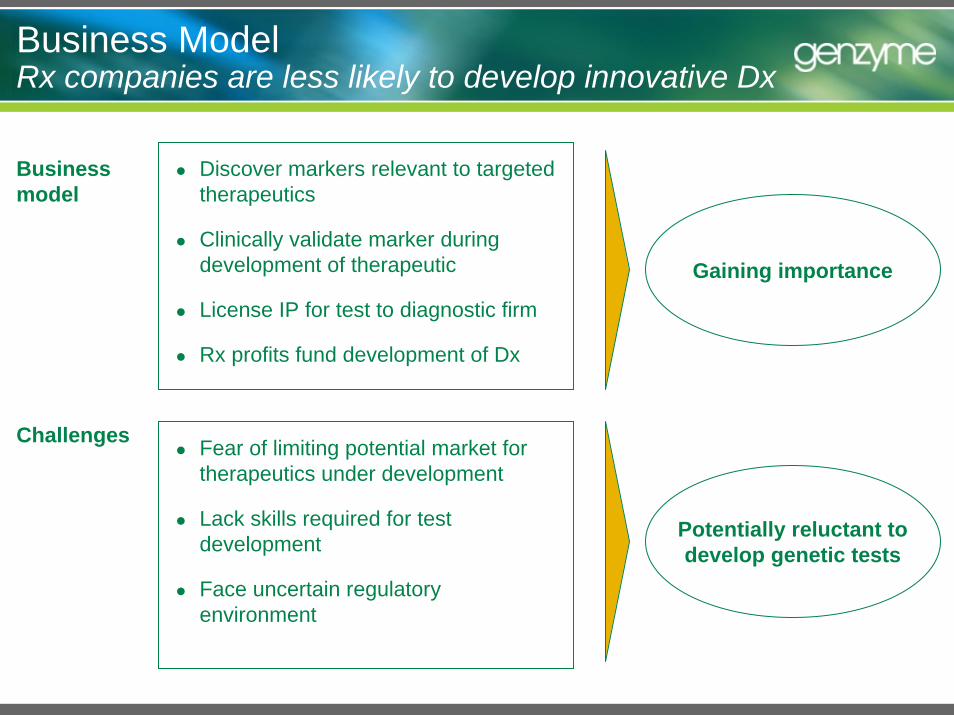
Business ModelRx companies are less likely to develop innovative Dx
Business model
Discover markers relevant to targeted therapeutics
Clinically validate marker during development of therapeutic
License IP for test to diagnostic firm
Rx profits fund development of Dx
Gaining importance
Fear of limiting potential market for therapeutics under development
Lack skills required for test development
Face uncertain regulatory environment
Challenges
Potentially reluctant to develop genetic tests
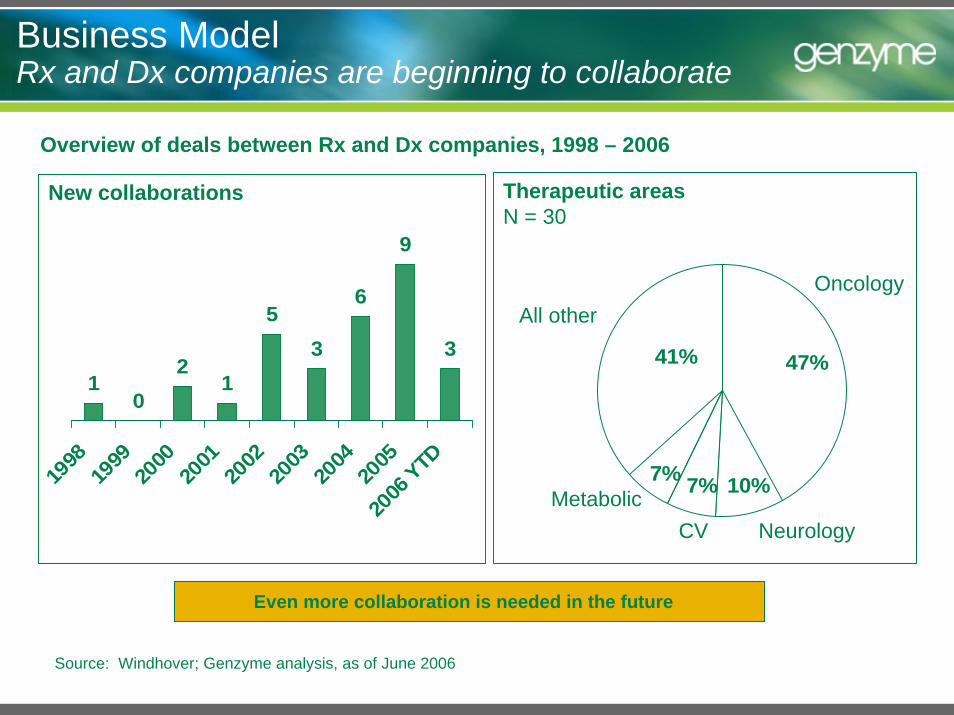
Business Model Rx and Dx companies are beginning to collaborate
Source: Windhover; Genzyme analysis, as of June 2006
Overview of deals between Rx and Dx companies, 1998 – 2006
10
21
53
6
9
3
1998
1999
2000
2001
2002
2003
2004
2005
2006
YTD
New collaborations
41%
7%7%
47%
10%
Oncology
NeurologyCVMetabolic
All other
Therapeutic areasN = 30
Even more collaboration is needed in the future
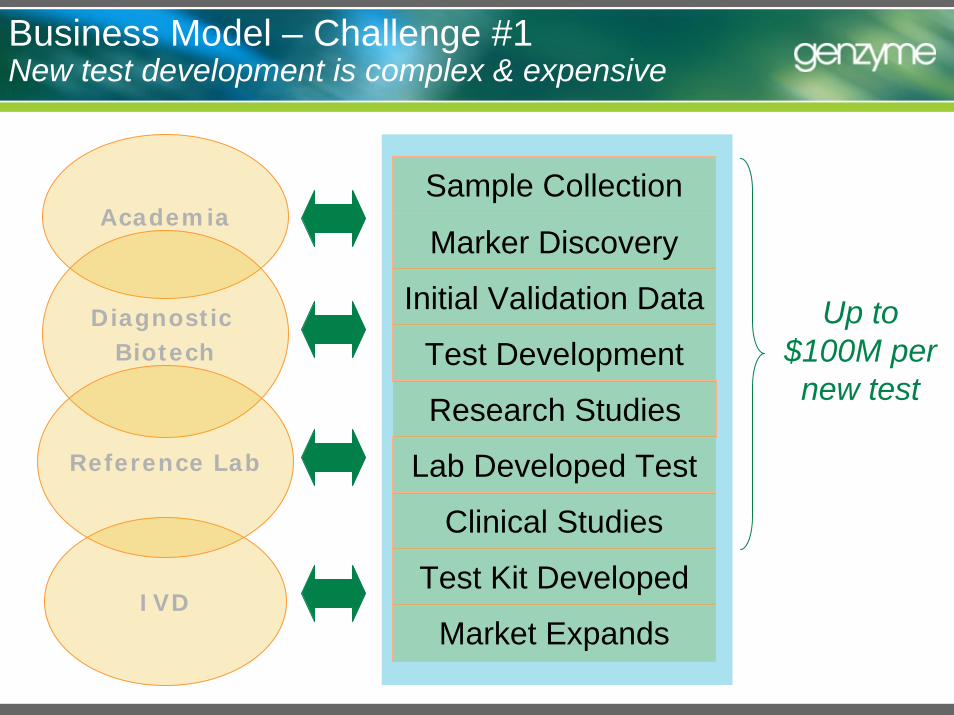
Business Model – Challenge #1New test development is complex & expensive
Market Expands
Test Kit Developed
Lab Developed Test
Clinical Studies
Test Development
Initial Validation Data
Marker Discovery
Sample CollectionAcademia
IVD
Diagnostic Biotech
Reference Lab
Research Studies
Up to $100M per new test
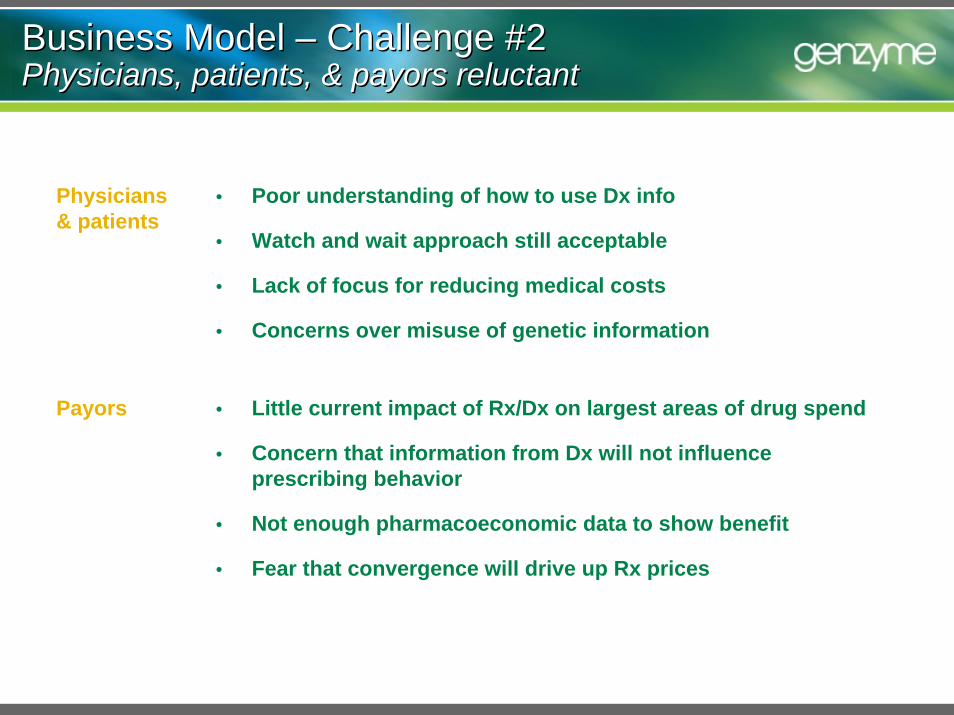
Business Model – Challenge #2Physicians, patients, & payors reluctantBusiness Model – Challenge #2Physicians, patients, & payors reluctant
Physicians & patients
• Poor understanding of how to use Dx info
• Watch and wait approach still acceptable
• Lack of focus for reducing medical costs
• Concerns over misuse of genetic information
Payors • Little current impact of Rx/Dx on largest areas of drug spend
• Concern that information from Dx will not influence prescribing behavior
• Not enough pharmacoeconomic data to show benefit
• Fear that convergence will drive up Rx prices
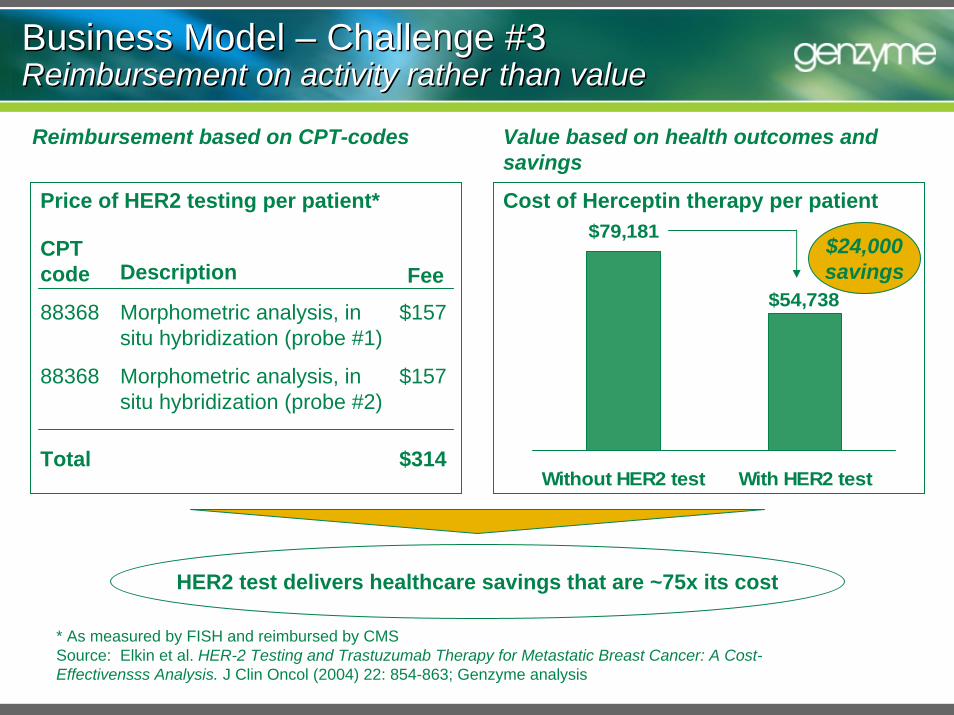
Business Model – Challenge #3Reimbursement on activity rather than valueBusiness Model – Challenge #3Reimbursement on activity rather than value
HER2 test delivers healthcare savings that are ~75x its cost
Value based on health outcomes and savings
$79,181
$54,738
Without HER2 test With HER2 test
Cost of Herceptin therapy per patient
$24,000savings
* As measured by FISH and reimbursed by CMSSource: Elkin et al. HER-2 Testing and Trastuzumab Therapy for Metastatic Breast Cancer: A Cost-Effectivensss Analysis. J Clin Oncol (2004) 22: 854-863; Genzyme analysis
Reimbursement based on CPT-codes
Price of HER2 testing per patient*
CPT code Description Fee88368 Morphometric analysis, in
situ hybridization (probe #1)$157
88368 Morphometric analysis, in situ hybridization (probe #2)
$157
Total $314
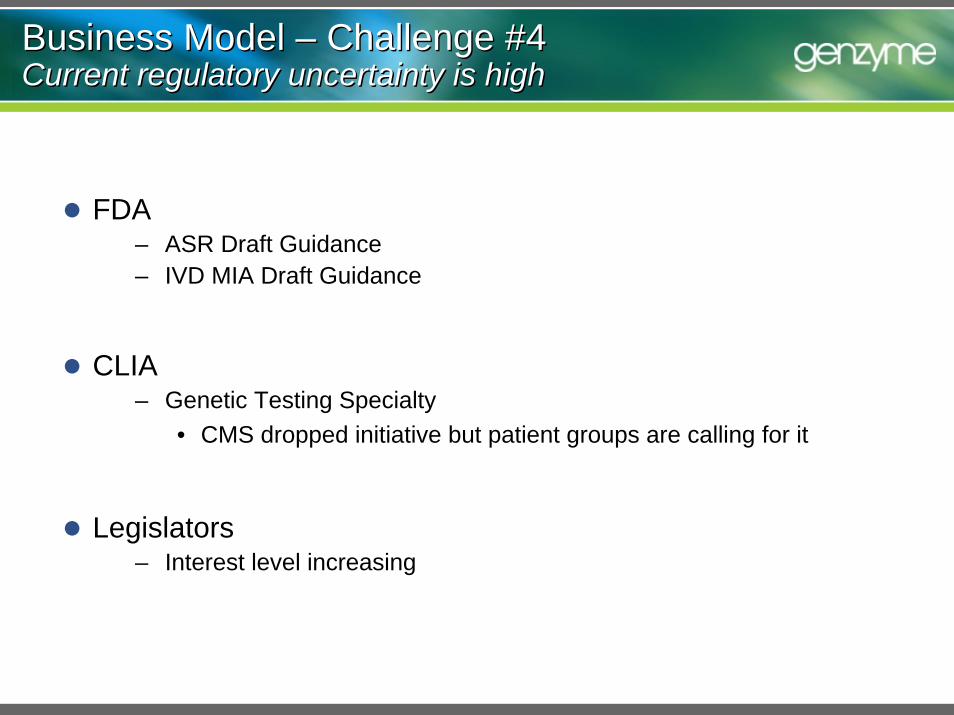
Business Model – Challenge #4Current regulatory uncertainty is highBusiness Model – Challenge #4Current regulatory uncertainty is high
FDA– ASR Draft Guidance– IVD MIA Draft Guidance
CLIA – Genetic Testing Specialty
• CMS dropped initiative but patient groups are calling for it
Legislators– Interest level increasing
Policy Needed to support innovation
Education, incentives, and system to ensure existing and new diagnostics lead to improved outcomes
Regulations that support rather than stifle innovation
Reimbursement based on value rather than activity
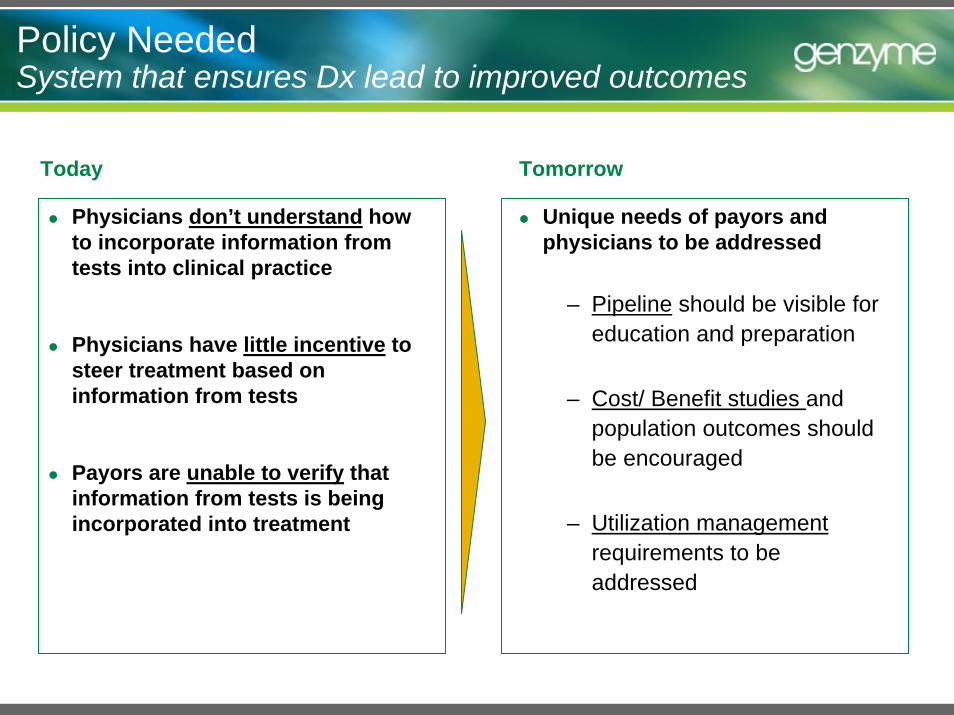
Policy Needed System that ensures Dx lead to improved outcomes
Today Tomorrow
Physicians don’t understand how to incorporate information from tests into clinical practice
Physicians have little incentive to steer treatment based on information from tests
Payors are unable to verify that information from tests is being incorporated into treatment
Unique needs of payors and physicians to be addressed
– Pipeline should be visible for education and preparation
– Cost/ Benefit studies and population outcomes should be encouraged
– Utilization managementrequirements to be addressed
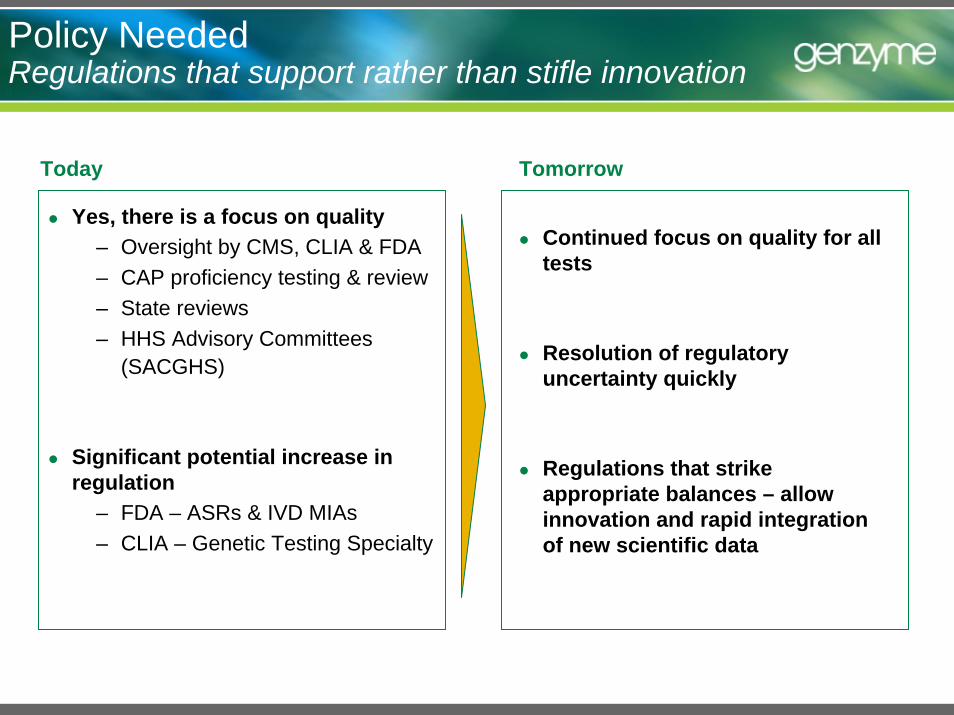
Policy Needed Regulations that support rather than stifle innovation
Today Tomorrow
Yes, there is a focus on quality– Oversight by CMS, CLIA & FDA– CAP proficiency testing & review– State reviews– HHS Advisory Committees
(SACGHS)
Significant potential increase in regulation
– FDA – ASRs & IVD MIAs– CLIA – Genetic Testing Specialty
Continued focus on quality for all tests
Resolution of regulatory uncertainty quickly
Regulations that strike appropriate balances – allow innovation and rapid integration of new scientific data
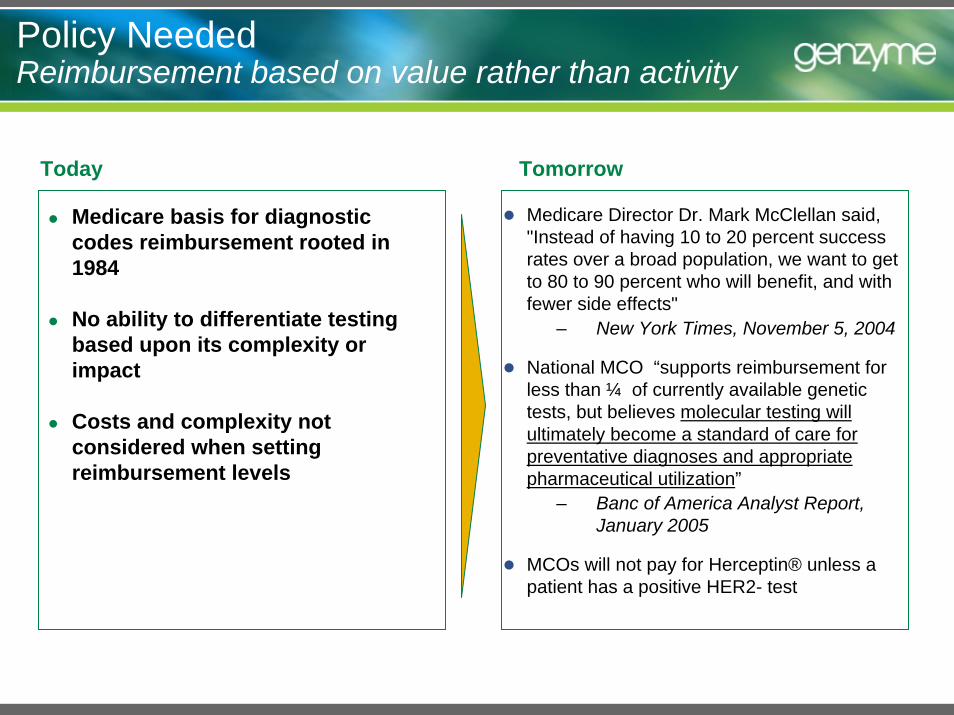
Policy Needed Reimbursement based on value rather than activity
Today Tomorrow
Medicare basis for diagnostic codes reimbursement rooted in 1984
No ability to differentiate testing based upon its complexity or impact
Costs and complexity not considered when setting reimbursement levels
Medicare Director Dr. Mark McClellan said, "Instead of having 10 to 20 percent success rates over a broad population, we want to get to 80 to 90 percent who will benefit, and with fewer side effects"
– New York Times, November 5, 2004
National MCO “supports reimbursement for less than ¼ of currently available genetic tests, but believes molecular testing will ultimately become a standard of care for preventative diagnoses and appropriate pharmaceutical utilization”
– Banc of America Analyst Report, January 2005
MCOs will not pay for Herceptin® unless a patient has a positive HER2- test
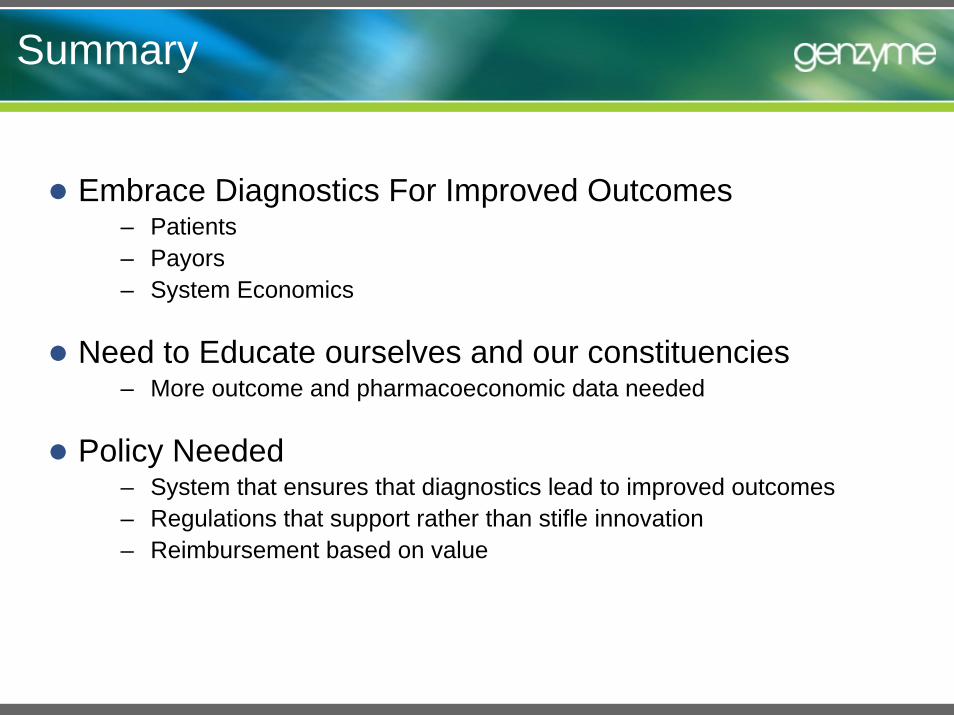
Summary
Embrace Diagnostics For Improved Outcomes– Patients– Payors– System Economics
Need to Educate ourselves and our constituencies– More outcome and pharmacoeconomic data needed
Policy Needed – System that ensures that diagnostics lead to improved outcomes – Regulations that support rather than stifle innovation– Reimbursement based on value