062110at823am Gulf Oil and All Deep Oil Reserves Maybe Radioactive

Asian NOCs in the Western HemisphereInvestments and Geopolitics
2007 Asian Energy Security Conference
The Rise of Asia’s National Oil Companies:Competitive Issues and Geopolitical Implications
May 3-4, 2007Washington D.C
Wenran Jiang, Ph.D.Director, China Institute
University of Alberta, Canada
China InstituteUniversity of Alberta

OVERVIEW
I. China, India & the Western Hemisphere
II. Chinese & Indian NOCs in the Hemisphere
III. Implications for the United States
China InstituteUniversity of Alberta
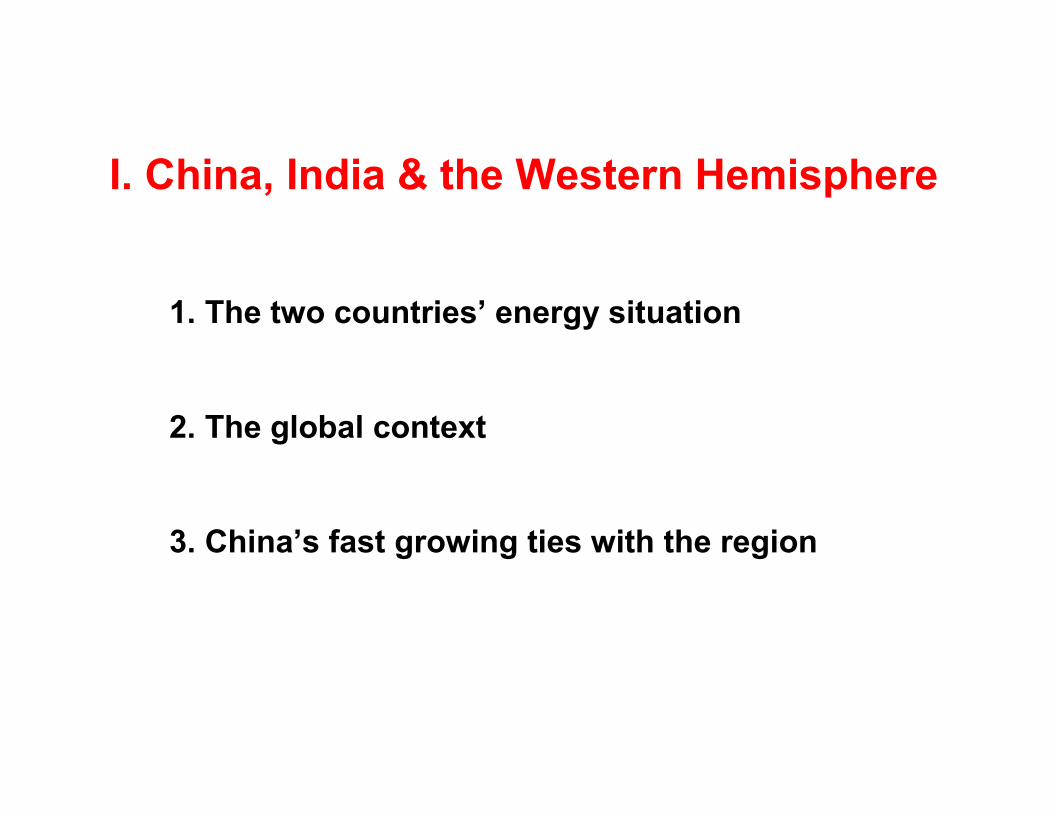
I. China, India & the Western Hemisphere
1. The two countries’ energy situation
2. The global context
3. China’s fast growing ties with the region
China InstituteUniversity of Alberta

163%
184%
170%
367%
238%
268%
0
50
100
150
200
250
N. America EU ASEAN Middle East Latin America Africa
2001
2005
China’s trade growth with major regions of the world 2001-2005
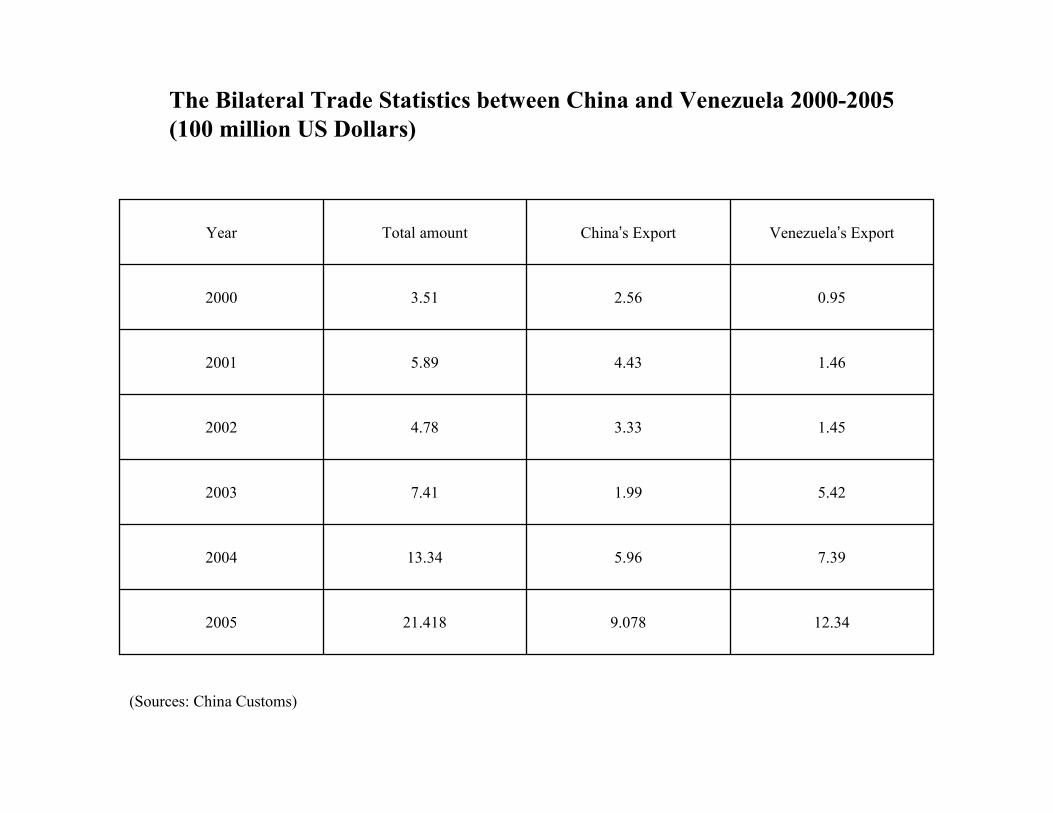
The Bilateral Trade Statistics between China and Venezuela 2000-2005
(100 million US Dollars)
12.349.07821.4182005
7.395.9613.342004
5.421.997.412003
1.453.334.782002
1.464.435.892001
0.952.563.512000
Venezuela’s ExportChina’s ExportTotal amountYear
(Sources: China Customs)
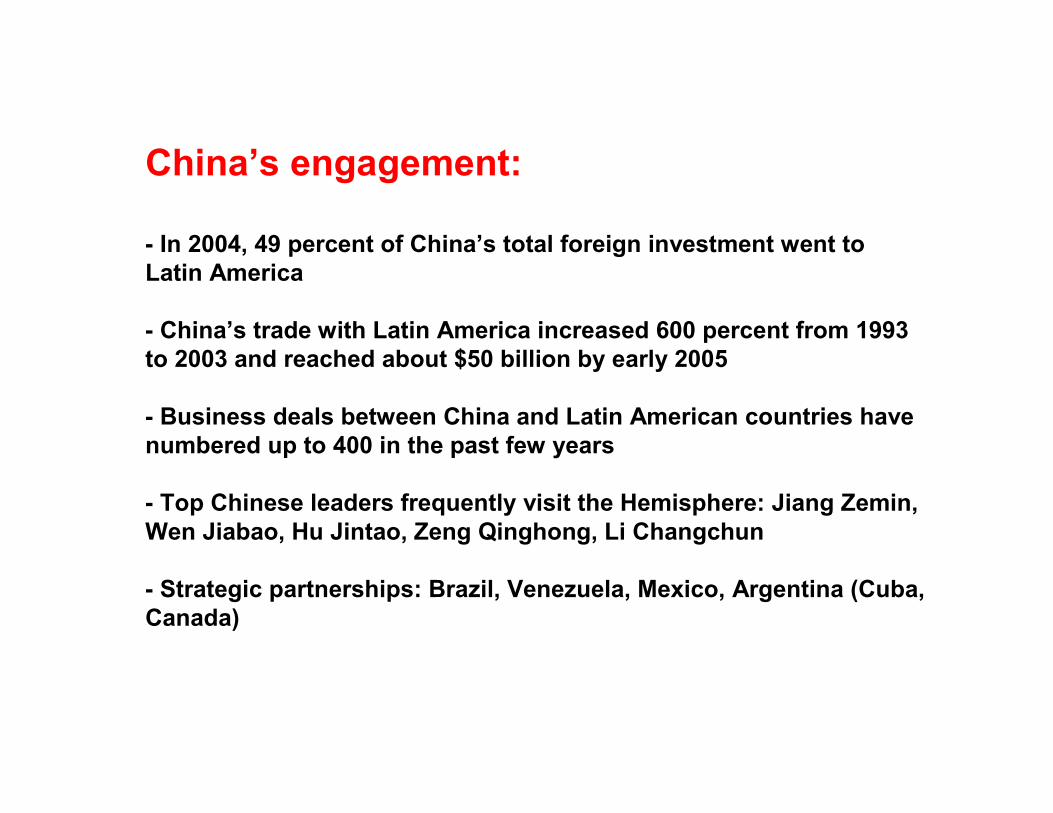
China’s engagement:
- In 2004, 49 percent of China’s total foreign investment went to Latin America
- China’s trade with Latin America increased 600 percent from 1993 to 2003 and reached about $50 billion by early 2005
- Business deals between China and Latin American countries have numbered up to 400 in the past few years
- Top Chinese leaders frequently visit the Hemisphere: Jiang Zemin, Wen Jiabao, Hu Jintao, Zeng Qinghong, Li Changchun
- Strategic partnerships: Brazil, Venezuela, Mexico, Argentina (Cuba, Canada)
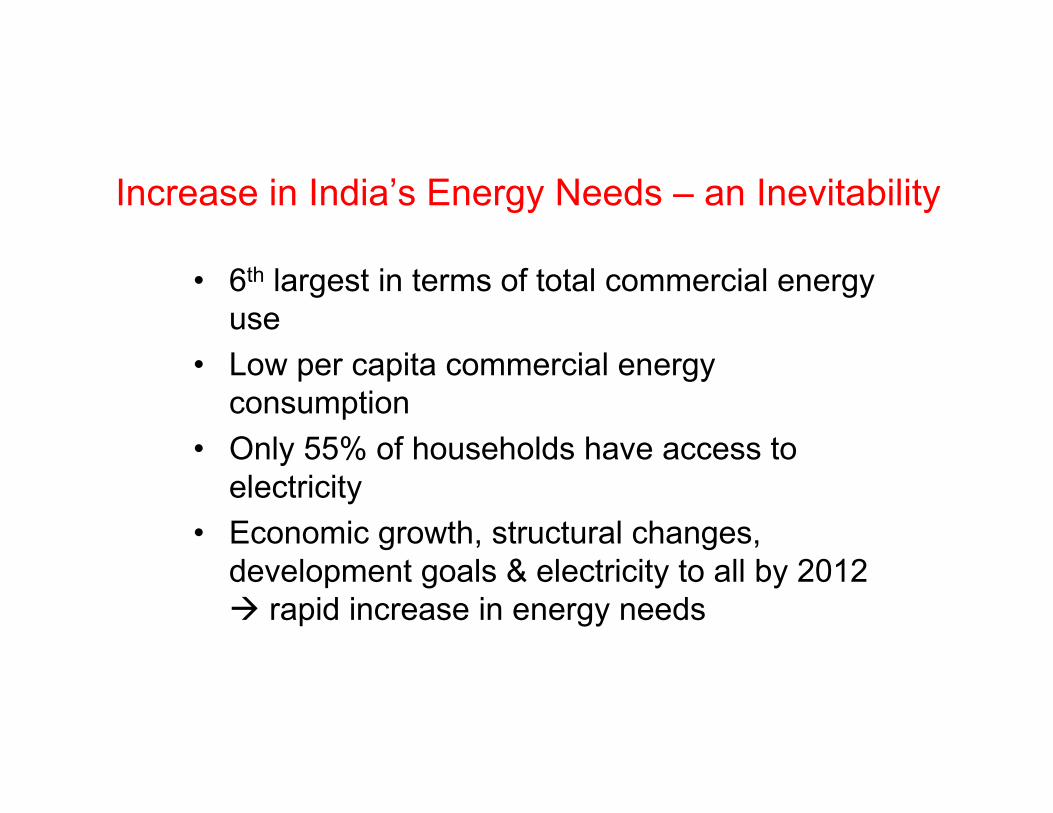
Increase in India’s Energy Needs – an Inevitability
• 6th largest in terms of total commercial energy use
• Low per capita commercial energy consumption
• Only 55% of households have access to electricity
• Economic growth, structural changes, development goals & electricity to all by 2012 � rapid increase in energy needs

India: Energy Security: High Import Dependency - BAU
75 222
660
1688
285527
1046
2123
27%
42%
63%
80%
0
500
1000
1500
2000
2500
2001 2011 2021 2031
Year
mto
e
20%
30%
40%
50%
60%
70%
80%
90%
Import Consumption Import Dependency
Fuel Import in 2031
�Coal import: 1438 MT
�~4 times of consumption in
2001
�Import dependency: 78%
�Oil import: 680 MT
�Import dependency: 93%
�Gas import: 93 BCM
�Import dependency: 67%

Oil Demand Compared
0
1,000
2,000
3,000
4,000
5,000
6,000
7,000
1990
1991
1992
1993
1994
1995
1996
1997
1998
1999
2000
2001
2002
2003
2004
2005
2006
(kb/d)
India China
FACTS Global Energy
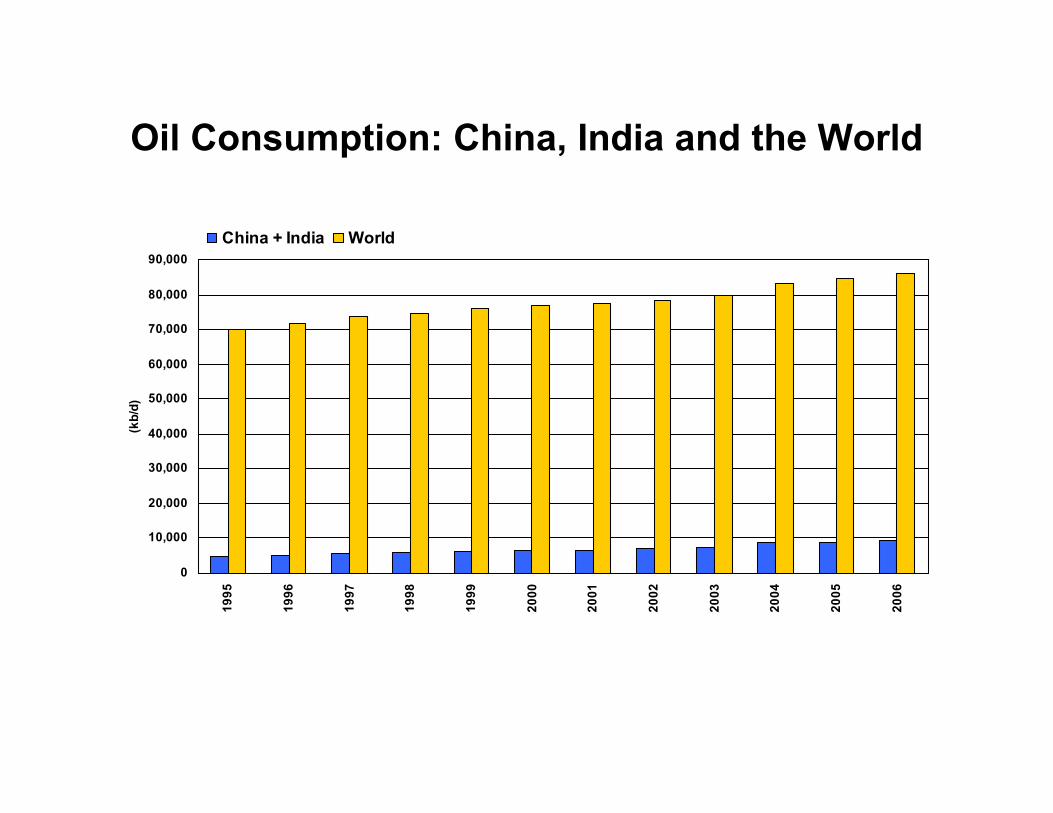
Oil Consumption: China, India and the World
0
10,000
20,000
30,000
40,000
50,000
60,000
70,000
80,000
90,000
1995
1996
1997
1998
1999
2000
2001
2002
2003
2004
2005
2006
(kb/d)
China + India World
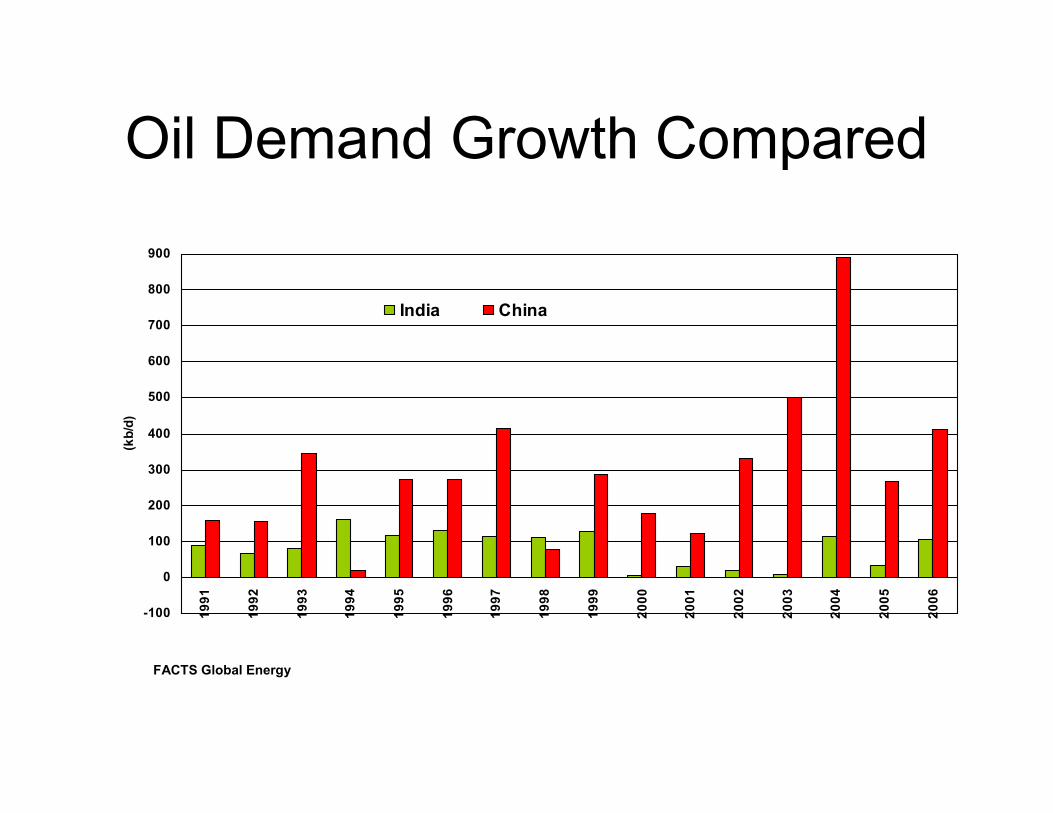
Oil Demand Growth Compared
-100
0
100
200
300
400
500
600
700
800
900
1991
1992
1993
1994
1995
1996
1997
1998
1999
2000
2001
2002
2003
2004
2005
2006
(kb/d)
India China
FACTS Global Energy


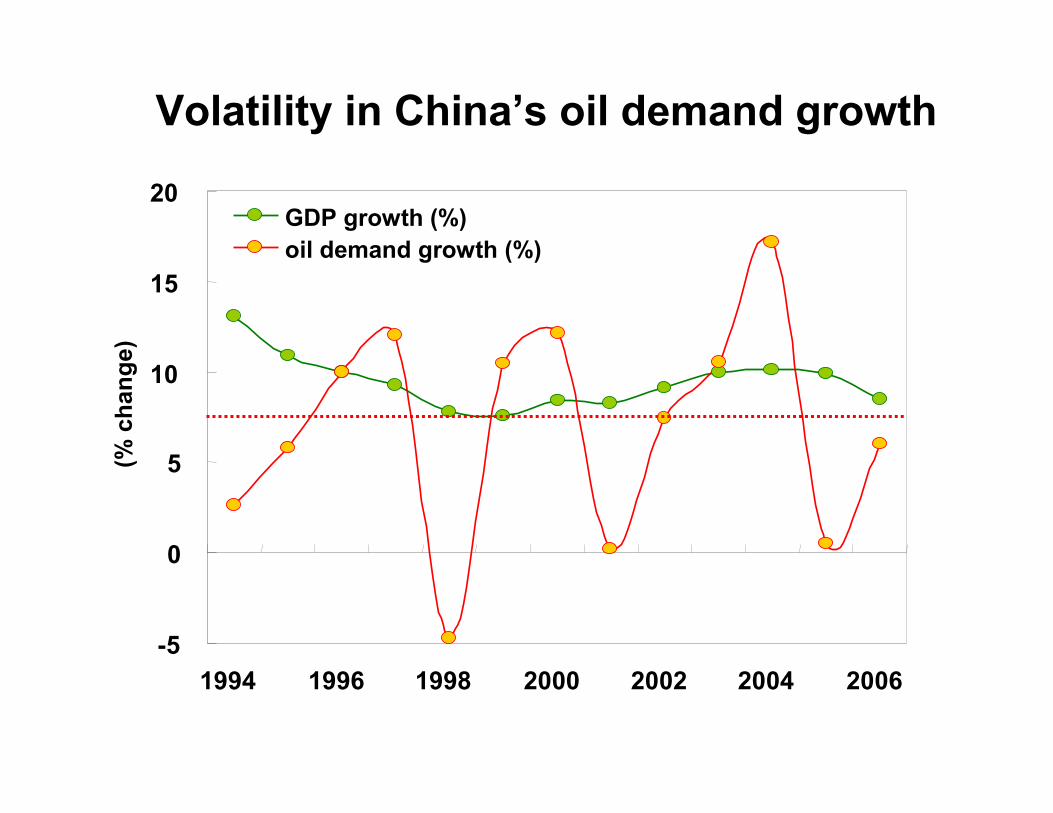
-5
0
5
10
15
20
1994 1996 1998 2000 2002 2004 2006
GDP growth (%)
oil demand growth (%)
(% change)
Volatility in China’s oil demand growth
II. Chinese & Indian NOCs in the Hemisphere
1. Chinese NOCs in Canada
2. China & the US: the lessons of the Unocal
3. China in Latin America
4. India’s engagement with the region & China
China InstituteUniversity of Alberta
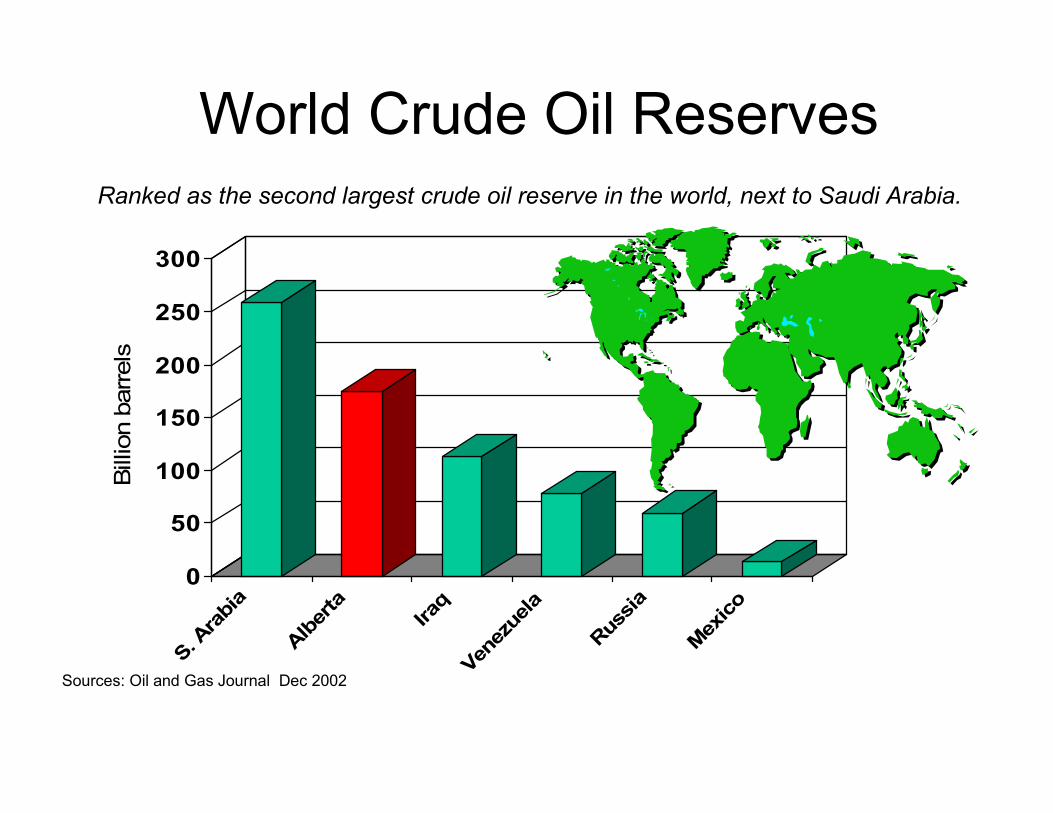
World Crude Oil Reserves
0
50
100
150
200
250
300
Billion barrels
S. A
rabi
a
Alb
erta
Iraq
Ven
ezue
la
Rus
sia
Mex
ico
Sources: Oil and Gas Journal Dec 2002
Ranked as the second largest crude oil reserve in the world, next to Saudi Arabia.

-- With total output of bitumen projected at 3.6 million barrels per day by 2020, Alberta’s objective is to become a major refining and petrochemical hub that would produce and export a significant portion of its oil sands output as high value-added finished petroleum products around the world, rather than exporting only lower value raw materials. Attraction of investment in downstream energy sectors is a priority for the Alberta government.
Alberta’s Oil Sands
-- International interest is increasing in Alberta’s oil sands, particularly since the Oil and Gas Journalofficially recognized oil sands reserves, ranking Canada’s proven crude oil reserves second only to Saudi Arabia (Dec. 2002).
-- From 1996 to 2004, $35 billion has been spent in developing Alberta’s oil sands. Investment is projected to be approximately over $100 billion for the period of 2005 - 2020.
Alberta’s Oil Sands
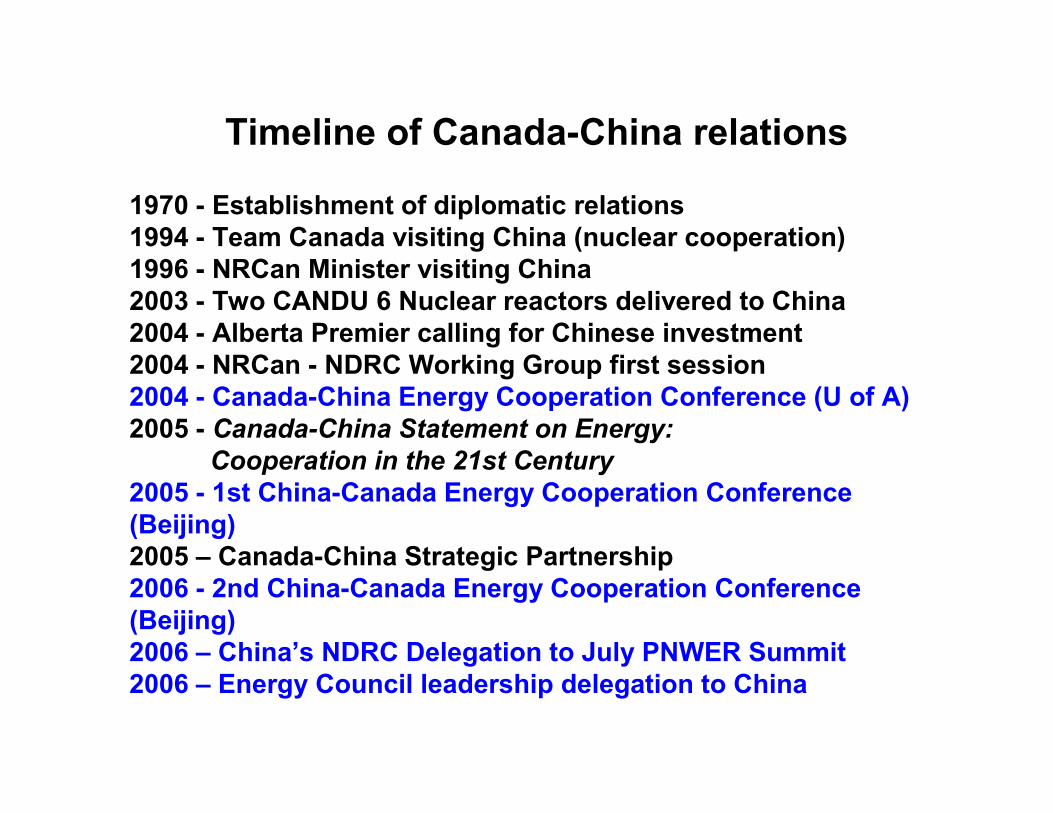
1970 - Establishment of diplomatic relations1994 - Team Canada visiting China (nuclear cooperation)1996 - NRCan Minister visiting China2003 - Two CANDU 6 Nuclear reactors delivered to China2004 - Alberta Premier calling for Chinese investment2004 - NRCan - NDRC Working Group first session2004 - Canada-China Energy Cooperation Conference (U of A)2005 - Canada-China Statement on Energy:
Cooperation in the 21st Century
2005 - 1st China-Canada Energy Cooperation Conference (Beijing)2005 – Canada-China Strategic Partnership 2006 - 2nd China-Canada Energy Cooperation Conference (Beijing)2006 – China’s NDRC Delegation to July PNWER Summit2006 – Energy Council leadership delegation to China
Timeline of Canada-China relations
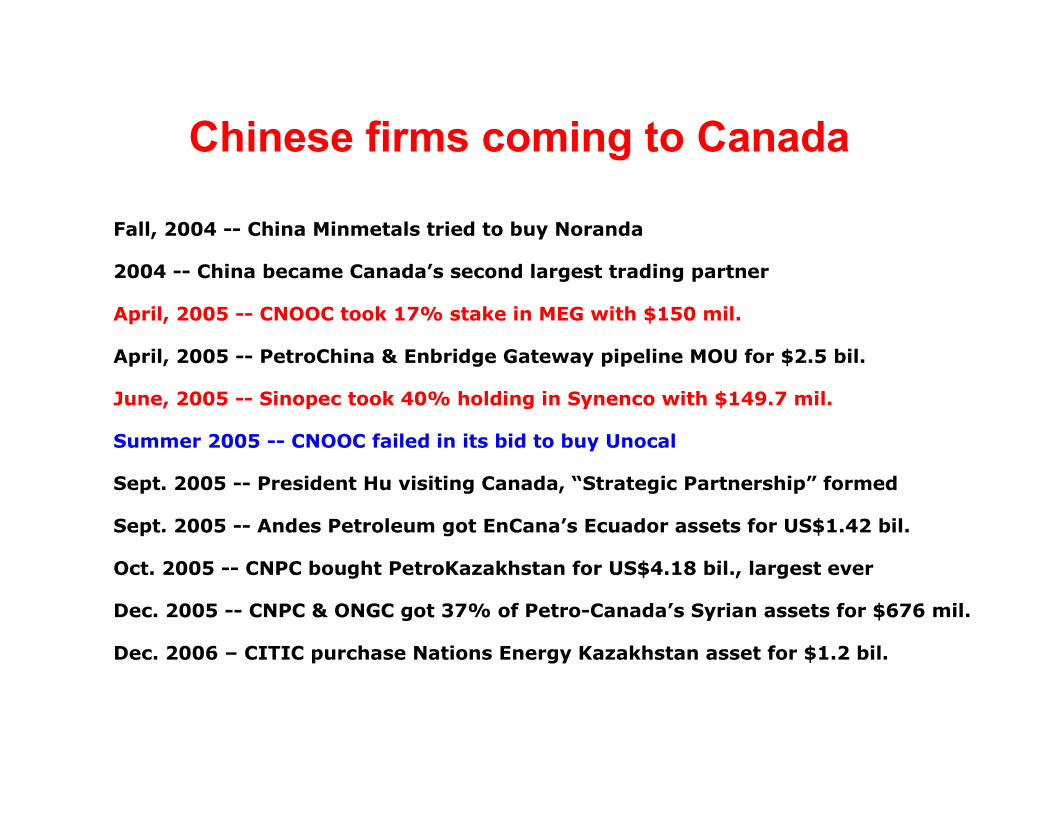
Chinese firms coming to Canada
China InstituteUniversity of Alberta
Fall, 2004 -- China Minmetals tried to buy Noranda
2004 -- China became Canada’s second largest trading partner
April, 2005 -- CNOOC took 17% stake in MEG with $150 mil.
April, 2005 -- PetroChina & Enbridge Gateway pipeline MOU for $2.5 bil.
June, 2005 -- Sinopec took 40% holding in Synenco with $149.7 mil.
Summer 2005 -- CNOOC failed in its bid to buy Unocal
Sept. 2005 -- President Hu visiting Canada, “Strategic Partnership” formed
Sept. 2005 -- Andes Petroleum got EnCana’s Ecuador assets for US$1.42 bil.
Oct. 2005 -- CNPC bought PetroKazakhstan for US$4.18 bil., largest ever
Dec. 2005 -- CNPC & ONGC got 37% of Petro-Canada’s Syrian assets for $676 mil.
Dec. 2006 – CITIC purchase Nations Energy Kazakhstan asset for $1.2 bil.
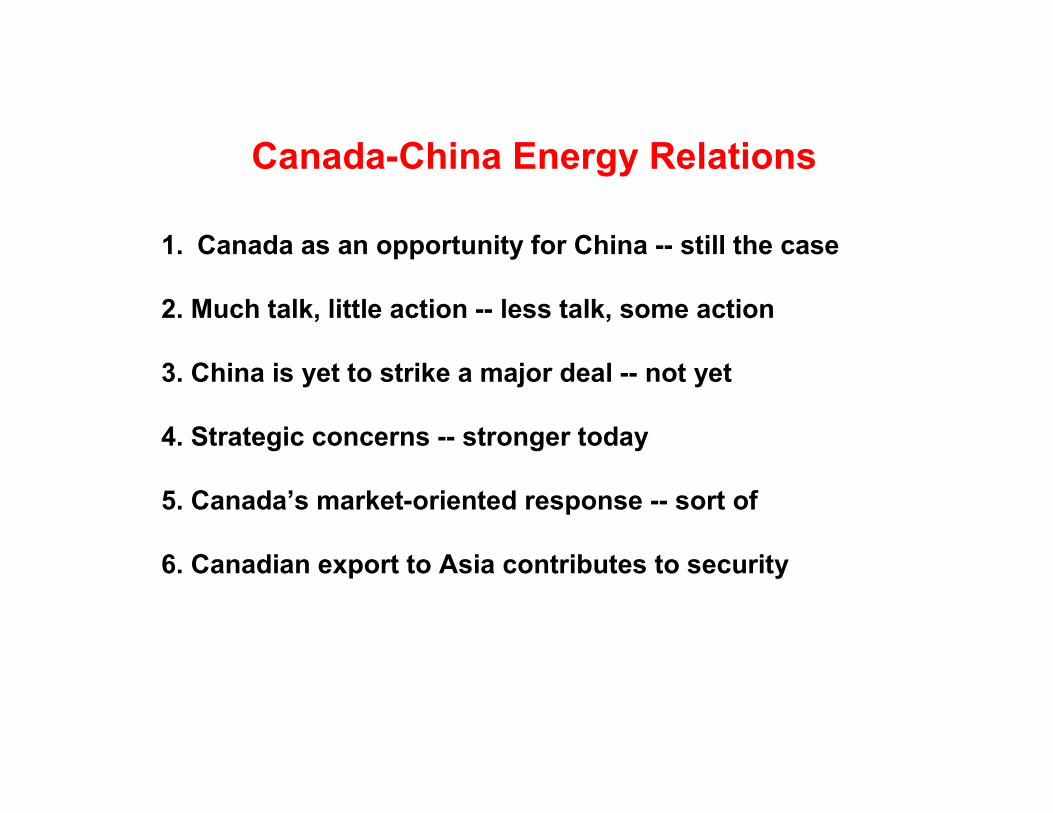
Canada-China Energy Relations
1. Canada as an opportunity for China -- still the case
2. Much talk, little action -- less talk, some action
3. China is yet to strike a major deal -- not yet
4. Strategic concerns -- stronger today
5. Canada’s market-oriented response -- sort of
6. Canadian export to Asia contributes to security
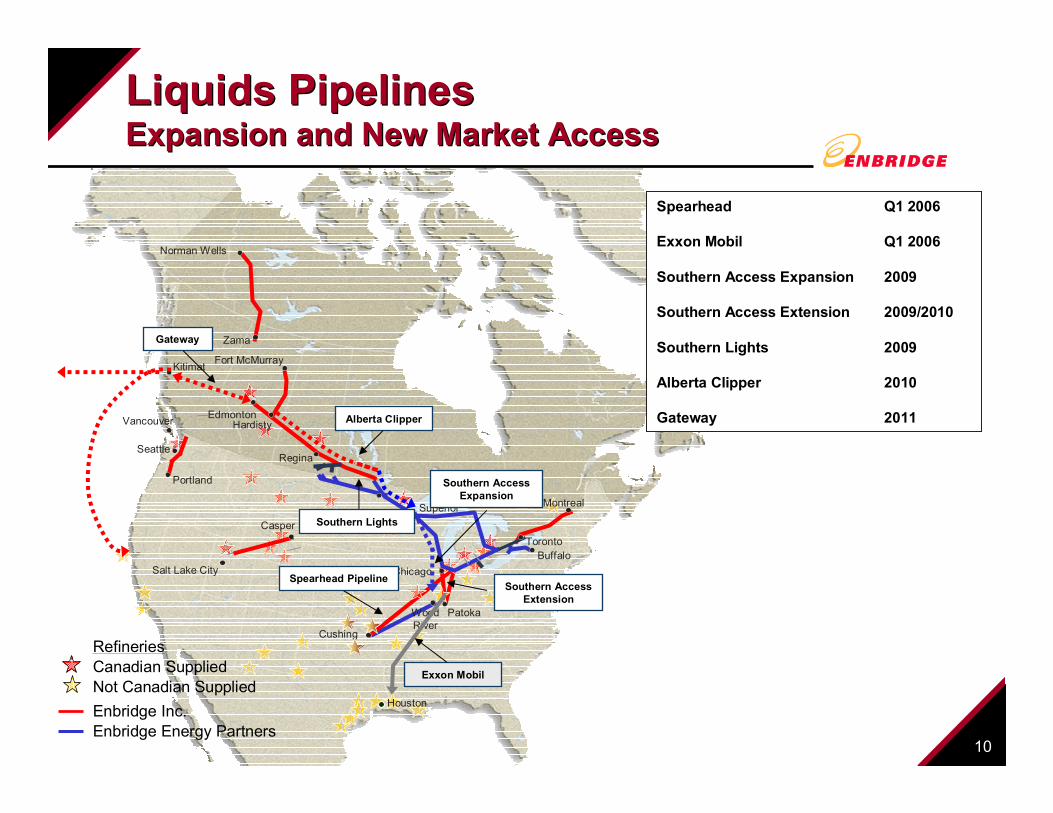
10
Alberta Clipper
Gateway
Exxon Mobil
Enbridge Inc.
Enbridge Energy Partners
Refineries
Canadian Supplied
Not Canadian Supplied
Chicago
Edmonton
Zama
Fort McMurray
Montreal
Toronto
Buffalo
Patoka
Casper
Norman Wells
Cushing
Vancouver
Houston
Hardisty
Salt Lake City
Kitimat
Regina
Spearhead Q1 2006
Exxon Mobil Q1 2006
Southern Access Expansion 2009
Southern Access Extension 2009/2010
Southern Lights 2009
Alberta Clipper 2010
Gateway 2011
Seattle
Portland
WoodRiver
Superior
Liquids Pipelines Expansion and New Market Access
Liquids Pipelines Expansion and New Market Access
Southern Lights
Spearhead PipelineSouthern Access
Extension
Southern Access Expansion

9
Cushing
Woodriver
Fort McMurray
Montreal
Toronto
Gretna
Regina
Hardisty
Kerrobert
Cromer
Patoka
Wood River
Catlettsburg
Casper
Mandan
Clearbrook
Superior
Salt Lake City
Sinclair
Cheyenne
DenverMcPherson
Ponca City
Tulsa
El DoradoCoffeyville
ArdmoreMemphis
Billings
Great Falls
ToledoDetroit
Robinson
Edmonton
Corpus Christi
HoustonPort Arthur
New Orleans
Lake Charles
Texas CityFreeport
Puget Sound
San Francisco
Bakersfield
Los Angeles
Borger/Sunray
St. Paul
Buffalo
Export
Liquids Pipelines Incremental Disposition Summary
Liquids Pipelines Incremental Disposition Summary
300-500
250
250-450
25
125
50750
Need to Accommodate 2.1 Million BPD incremental basin production by 2015
100
Chicago
Canton
Lima
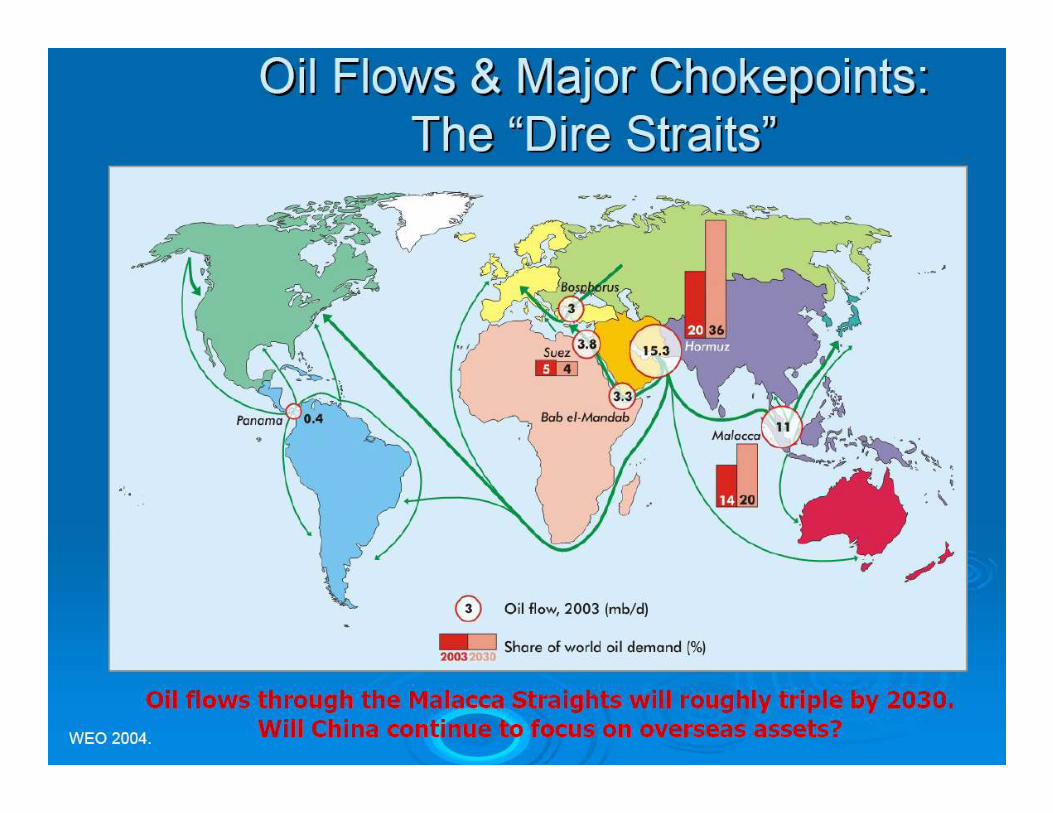
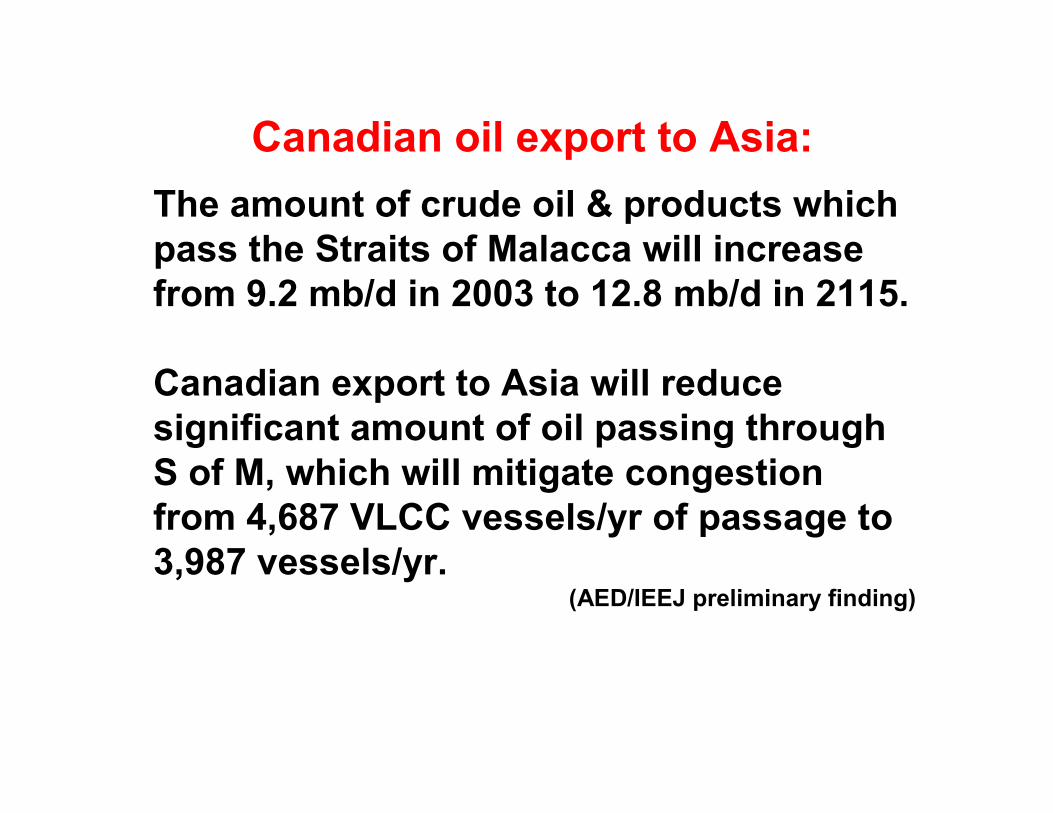
Canadian oil export to Asia:
The amount of crude oil & products which pass the Straits of Malacca will increase from 9.2 mb/d in 2003 to 12.8 mb/d in 2115.
Canadian export to Asia will reduce significant amount of oil passing through S of M, which will mitigate congestion from 4,687 VLCC vessels/yr of passage to 3,987 vessels/yr.
(AED/IEEJ preliminary finding)
China InstituteUniversity of Alberta
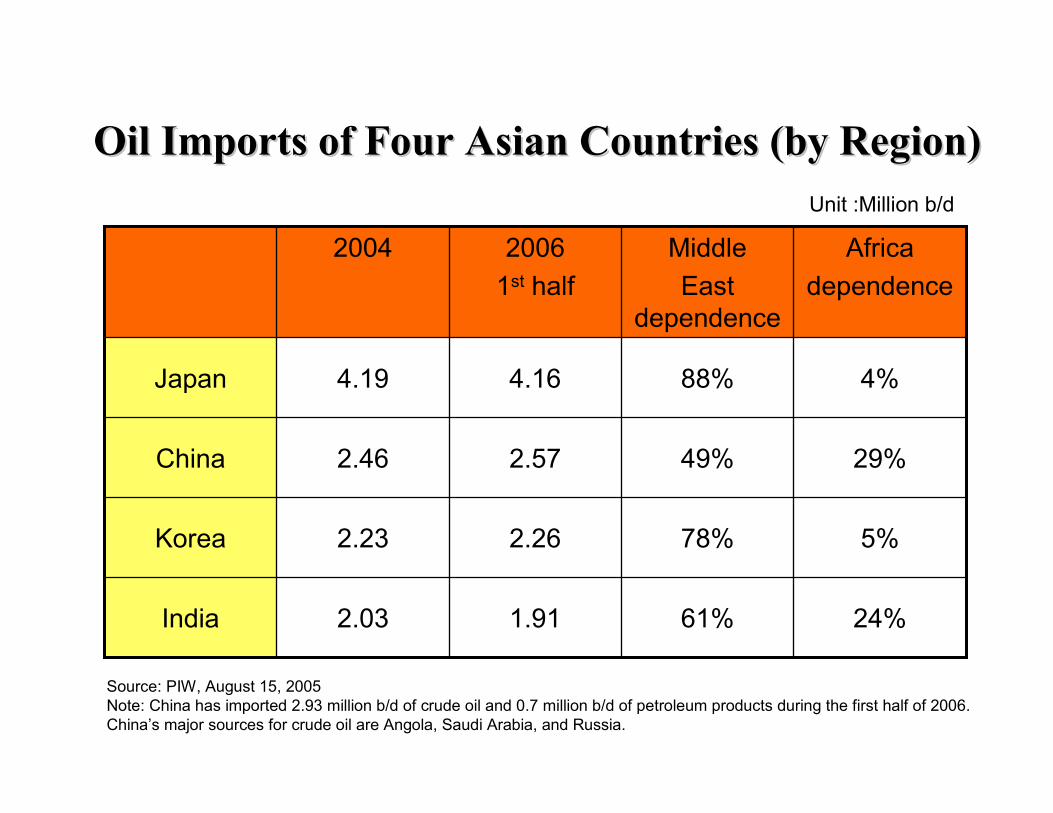
Oil Imports of Four Asian Countries (by Region)Oil Imports of Four Asian Countries (by Region)
29%49%2.572.46China
24%61%1.912.03India
5%78%2.262.23Korea
4%88%4.164.19Japan
Africa
dependence
Middle
East dependence
2006
1st half
2004
Unit :Million b/d
Source: PIW, August 15, 2005Note: China has imported 2.93 million b/d of crude oil and 0.7 million b/d of petroleum products during the first half of 2006. China’s major sources for crude oil are Angola, Saudi Arabia, and Russia.

China InstituteUniversity of Alberta
Participation in the US market
(% according to total imports)
0%
5%
10%
15%
20%
25%
1990
1991
1992
1993
1994
1995
1996
1997
1998
1999
2000
2001
2002
2003
Canada
Mexico
JapanChina
17.8%
9.4%
Source: U. S. Census Bureau
10.9%
12.0%
Chinese firms coming to the US

1. Short term: Backlash against perceived US hypocrisy
2. Medium term: Investment flow into troubled states
3. Long term: Impediment to China’s NOC reform along the market logic
CNOOC’s bid on Unocal: lessons
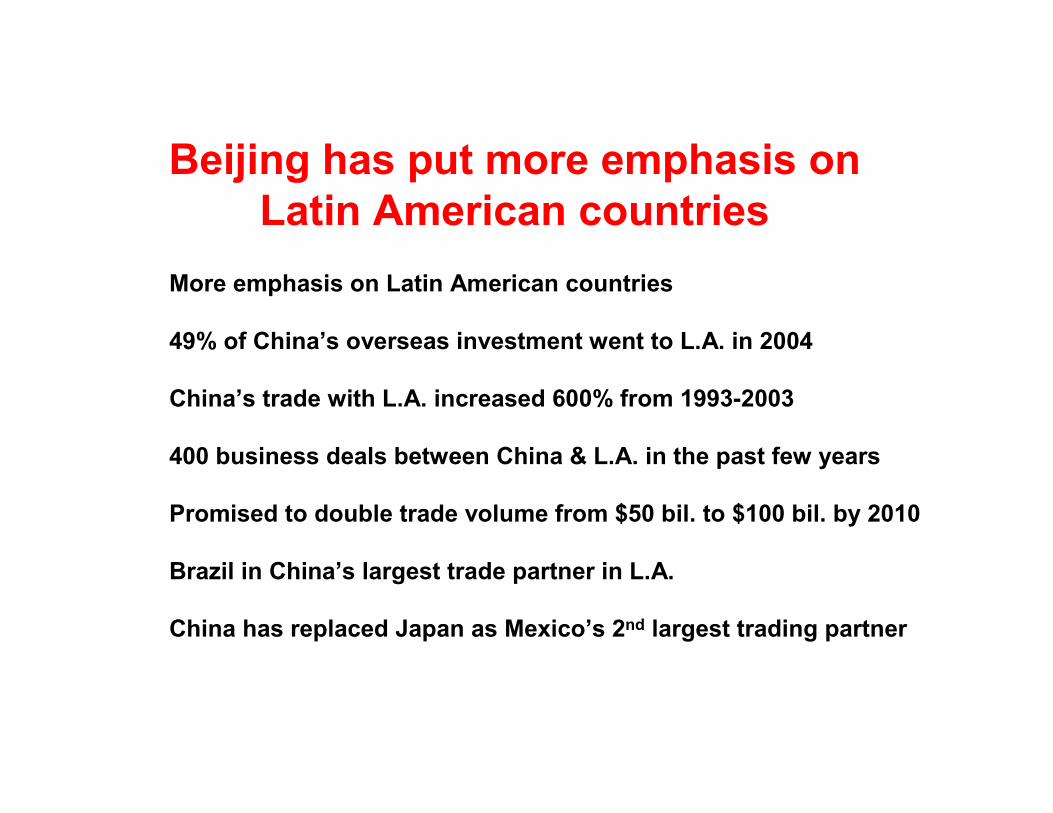
More emphasis on Latin American countries
49% of China’s overseas investment went to L.A. in 2004
China’s trade with L.A. increased 600% from 1993-2003
400 business deals between China & L.A. in the past few years
Promised to double trade volume from $50 bil. to $100 bil. by 2010
Brazil in China’s largest trade partner in L.A.
China has replaced Japan as Mexico’s 2nd largest trading partner
Beijing has put more emphasis onLatin American countries

Venezuela now supplies China with about 200,000 bpd
Brazil & China have signed over $2 bil. In energy related projects
CNPC spent $1.2 bil. to purchase EnCana’s assets in Ecuador
Argentina will get $25 bil. from China for railways & energy
India & Venezuela has extensive energy relations as well
Venezuela had shipped 2 mil. barrels of oil to India by early 2006
China & India – L.A. energy relations have developed rapidly in recent years
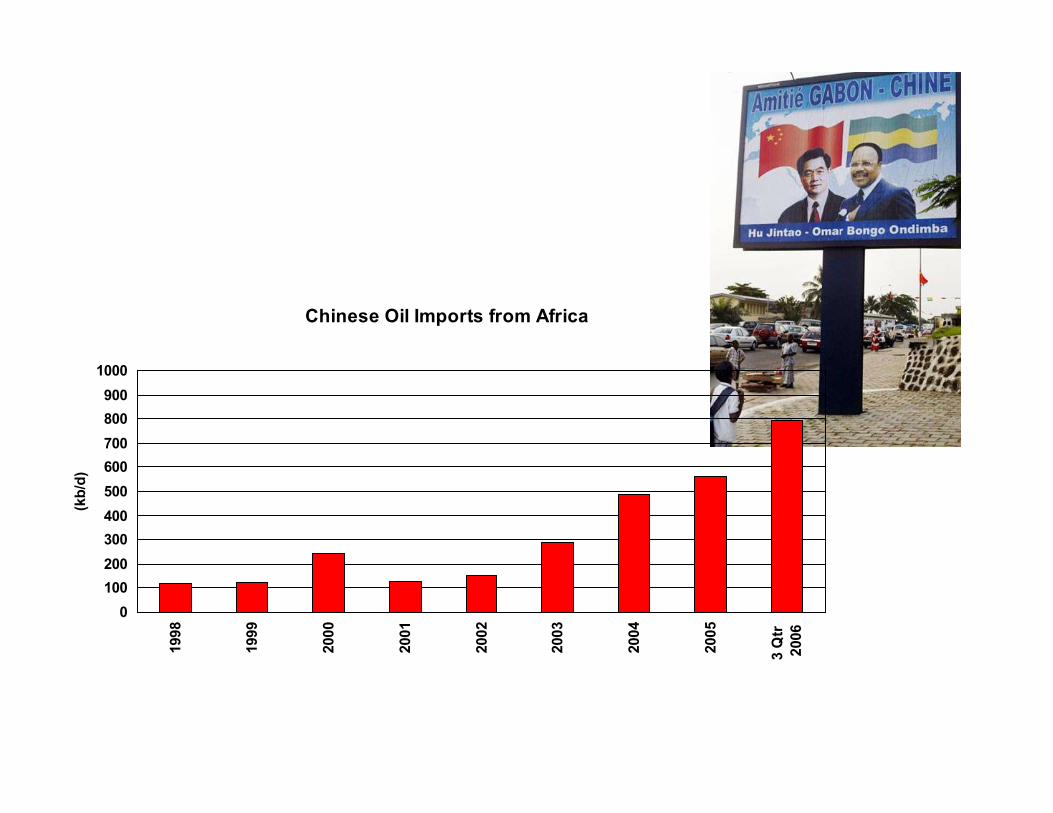
Chinese Oil Imports from Africa
0
100
200
300
400
500
600
700
800
900
1000
1998
1999
2000
2001
2002
2003
2004
2005
3 Qtr
2006
(kb/d)

Chinese Oil Imports from Saudi Arabia
0
100
200
300
400
500
1998
1999
2000
2001
2002
2003
2004
2005
3 Qtr 2006
(kb/d)
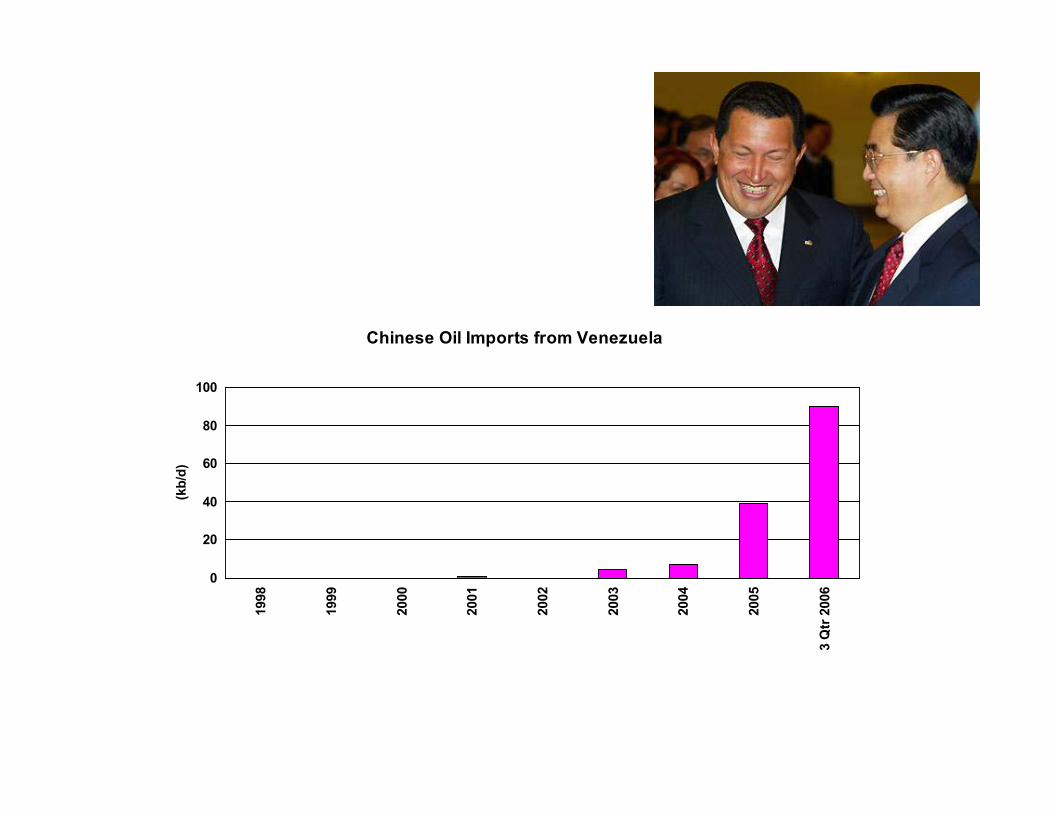
Chinese Oil Imports from Venezuela
0
20
40
60
80
100
1998
1999
2000
2001
2002
2003
2004
2005
3 Qtr 2006
(kb/d)

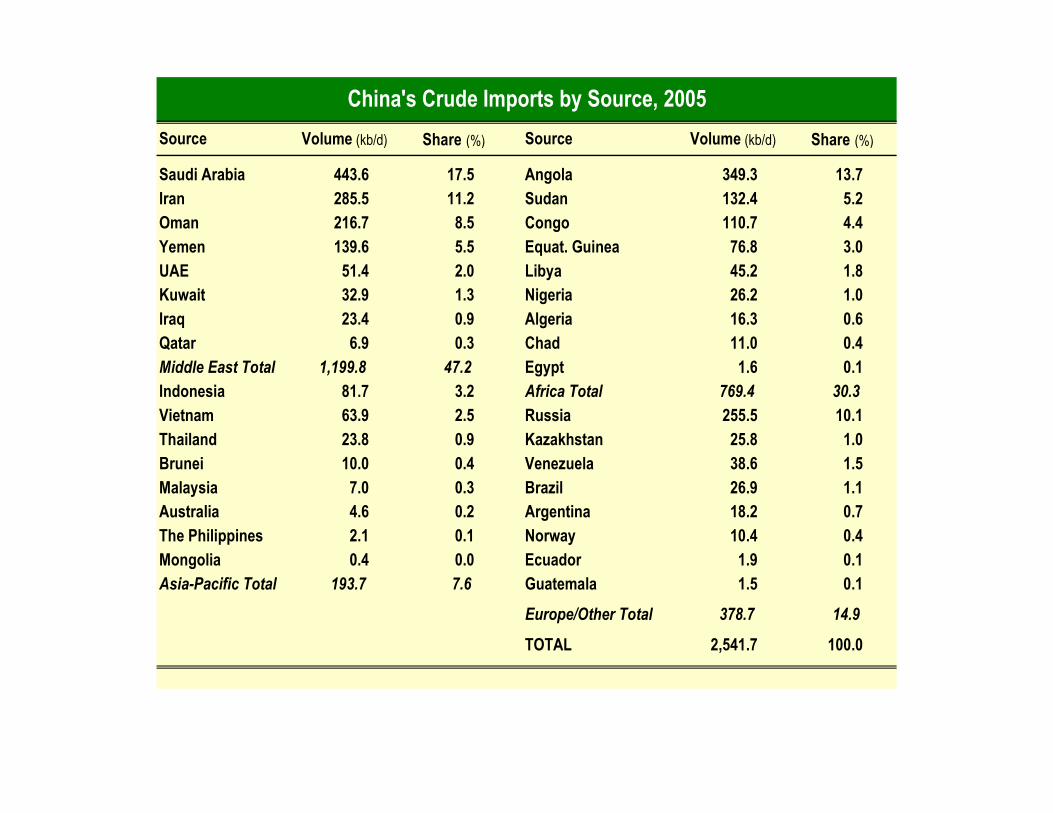
China's Crude Imports by Source, 2005
Source Volume (kb/d) Share (%) Source Volume (kb/d) Share (%)
Saudi Arabia 443.6 17.5 Angola 349.3 13.7
Iran 285.5 11.2 Sudan 132.4 5.2
Oman 216.7 8.5 Congo 110.7 4.4
Yemen 139.6 5.5 Equat. Guinea 76.8 3.0
UAE 51.4 2.0 Libya 45.2 1.8
Kuwait 32.9 1.3 Nigeria 26.2 1.0
Iraq 23.4 0.9 Algeria 16.3 0.6
Qatar 6.9 0.3 Chad 11.0 0.4
Middle East Total 1,199.8 47.2 Egypt 1.6 0.1
Indonesia 81.7 3.2 Africa Total 769.4 30.3
Vietnam 63.9 2.5 Russia 255.5 10.1
Thailand 23.8 0.9 Kazakhstan 25.8 1.0
Brunei 10.0 0.4 Venezuela 38.6 1.5
Malaysia 7.0 0.3 Brazil 26.9 1.1
Australia 4.6 0.2 Argentina 18.2 0.7
The Philippines 2.1 0.1 Norway 10.4 0.4
Mongolia 0.4 0.0 Ecuador 1.9 0.1
Asia-Pacific Total 193.7 7.6 Guatemala 1.5 0.1
Europe/Other Total 378.7 14.9
TOTAL 2,541.7 100.0

China's Crude Imports by Source, January-September 2006
Source Volume (kb/d) Share (%) Source Volume (kb/d) Share (%)
Saudi Arabia 481.3 16.5 Mauritania 14.5 0.5
Iran 345.6 11.8 Gabon 21.5 0.7
Oman 244.6 8.4 Chad 13.3 0.5
Yemen 104.3 3.6 Nigeria 8.3 0.3
UAE 59.5 2.0 Algeria 6.9 0.2
Kuwait 55.3 1.9 Cote d'Ivoire 3.8 0.1
Iraq 20.6 0.7 Egypt 1.9 0.1
Qatar 8.9 0.3 South Africa 1.2 0.0
Middle East Total 1,320.1 45.2 Africa Total 906.2 29.2
Indonesia 48.8 1.7 Russia 334.5 11.4
Thailand 25.1 0.9 Venezuela 90.1 3.1
Vietnam 19.5 0.7 Kazakhstan 50.1 1.7
Brunei 11.2 0.4 Brazil 42.7 1.5
Australia 8.6 0.3 Peru 21.3 0.7
Malaysia 3.0 0.1 Argentina 21.9 0.7
The Philippines 1.0 0.0 Norway 7.5 0.3
Mongolia 0.9 0.0 Guatemala 2.7 0.1
Asia-Pacific Total 118.1 4.0 Colombia 2.5 0.1
Angola 487.5 16.7 Cuba 1.5 0.1
Congo 113.9 3.9 Ecuador 1.3 0.0
Equat. Guinea 100.6 3.4 Canada 1.2 0.0
Libya 79.9 2.7 Europe/Other Total 577.3 19.8
Sudan 52.9 1.8 TOTAL 2,921.7 98.2

III. Implications for the US
China InstituteUniversity of Alberta
Three perspectives
Strategic thinking
Opportunities
North America-China Energy Conference

Strategic questions
1. Ignore the dragon?
2. Contain the dragon?
3. Slay the dragon?
4. Lure the dragon?
5. Dance with the dragon?
China InstituteUniversity of Alberta
Opportunities
1. China & India as the largest potential
market
2. Oil, gas, nuclear, renewable, alternative
3. New technologies for leap-frogging
4. Carbon credit, CDM
5. Environment
6. Easing the labor shortage of producers?
China InstituteUniversity of Alberta

North America-China Energy Cooperation Conference
June 20-22, 2007Edmonton, Alberta
www.china.ualberta.ca
China InstituteUniversity of Alberta
Thank youDr. Wenran JiangDirector, China InstituteUniversity of Alberta110D TELUS Centre87 Ave. & 111 St.Edmonton, Alberta T7G 2R1Tel. 780.492-9898Fax. 780.492.8200Email: [email protected]: www.china.ualberta.ca
China InstituteUniversity of Alberta