EY - Global oil and gas reserves study 2013FILE/EY-Global-oil-and-gas-reserves-study-2013.pdf ·...
112
Global oil and gas reserves study 2013
-
Upload
phunghuong -
Category
Documents
-
view
217 -
download
2
Transcript of EY - Global oil and gas reserves study 2013FILE/EY-Global-oil-and-gas-reserves-study-2013.pdf ·...

Global oil and gas reserves study2013

2 | Global oil and gas reserves study
Table of contentsStudy overview 1
Worldwide study results Capital expenditures 4 Revenues and results of operations 6 Oil reserves 8 Gas reserves 10 Performance measures 12 Worldwide company statistics Capital expenditures 18 Revenues and results of operations 22 Oil reserves 26 Gas reserves 30 Performance measures 34
Summary of 2012 study results 40
Africa and Middle East 44
Asia-Pacific 52
Canada 60
Europe 68
South and Central America 76
US 84 Other/unspecified 98
Other information Study companies and their areas of operations 106 Peer groups 108 Company footnotes 108

1Global oil and gas reserves study |
Study overviewThe Global oil and gas reserves study is a compilation and analysis of certain oil and gas reserve disclosure information as reported by companies in their annual reports filed with the United States (US) Securities and Exchange Commission (SEC) or in their publicly available annual reports. This report presents the worldwide and regional exploration and production (E&P) results for 75 companies for the five-year period from 2008 through 2012.
The companies
The study includes companies headquartered in 18 countries across the globe. The results are generally representative of the E&P industry as a whole, with the exception that many national oil companies do not publicly disclose financial and operational data and their performance trends may vary significantly. Due to the vast quantity of reserves held by national oil companies, the companies included herein account for only approximately 9% of total worldwide oil reserves and approximately 9% of total worldwide gas reserves, based on 1 January 2013 reserves estimates published by the Oil & Gas Journal. For consistency and comparability purposes, this study includes only companies that report their oil and gas reserve information according to US SEC standards.
The companies have been classified into three peer groups: integrated companies (integrateds), large independents and independents. Integrated companies are those that have oil refining activities in addition to exploration and production. Independents do not have oil refining activities, but may have midstream operations in addition to their exploration and production activities. The independents were classified as “large” if their 2012 worldwide ending reserves exceeded 1 billion barrels of oil equivalent.
Acquired companies and other transactions
Due to the significance of the operations of two companies that were acquired during the five-year study period, their capital expenditures, revenues and results of operations, oil reserves and gas reserves have been included in this report for the years prior to their acquisition as further discussed below. This provides a more meaningful comparison throughout the five-year study period.
In June 2010, XTO Energy was acquired by Exxon Mobil Corporation. XTO Energy’s 2008 and 2009 capital expenditures, revenues and results of operations, oil reserves and gas reserves have been included in this report. The capital expenditures, revenues and results of operations, oil reserves and gas reserves reported by ExxonMobil for 2010 include activity related to the operations acquired from XTO Energy. XTO Energy’s end-of-year 2009 oil reserves and gas reserves have been included in 2010 beginning-of-year reserves with an equal volume included as sales in 2010 to reflect the ExxonMobil transaction.
In August 2011, Petrohawk Energy was acquired by BHP Billiton Group. BHP Billiton has a 30 June fiscal year-end and its fiscal year includes the period from 1 July through 30 June. Thus, the capital expenditures, revenues and results of operations, oil reserves and gas reserves reported by BHP Billiton for 2012 include activity related to the operations acquired from Petrohawk Energy from the date of acquisition. Petrohawk Energy’s capital expenditures, revenues and results of operations, oil reserves and gas reserves have been included in this report for 2008 through 2011. Petrohawk Energy’s end-of-year 2011 oil reserves and gas reserves have been included in 2012 beginning-of-year reserves with an equal volume included as sales in 2012 to reflect the BHP Billiton transaction.
For purposes of the peer group analysis, XTO Energy is designated as a large independent and Petrohawk Energy is an independent.
In May 2012, the Argentine Congress passed a law that provided for the expropriation of the shares of YPF S.A. owned by Repsol YPF, S.A. As a result of this action, Repsol YPF was renamed Repsol S.A. and the oil reserves and gas reserves Repsol had recorded in connection with its ownership of YPF were reported as sales in 2012. Repsol’s sales related to YPF are reflected in reserve tables in this report; however, the sales are not included in the all sources production replacement rate calculations. YPF is included in this report with its 2012 beginning-of-year oil reserves and gas reserves reflected in the “Other” component of the reserves tables.

2 | Global oil and gas reserves study
Performance measuresThe performance measures presented herein were calculated based on the companies’ oil and gas reserve disclosure information. EY’s methodology for calculating the performance measures is defined below.
• Proved reserve acquisition costs are calculated as proved property acquisition costs and identified related asset retirement obligation costs, divided by proved reserves purchased.
• Finding and development costs are calculated as unproved property acquisition costs, exploration costs, development costs and identified related asset retirement obligation costs, divided by extensions and discoveries, revisions and improved recovery of proved reserves. The calculation excludes the effect of proved reserves purchased.
• Reserve replacement costs are calculated as total costs incurred divided by extensions and discoveries, revisions, improved recovery and purchases of proved reserves.
• Production replacement rate (all sources) is calculated as extensions and discoveries, improved recovery, revisions, purchases and sales of proved reserves, divided by production.
• Production replacement rate (excluding purchases and sales) is calculated as extensions and discoveries, improved recovery and revisions of proved reserves, divided by production.
• Production costs are calculated as production costs, including production taxes, transportation costs and production-related general and administrative expenses, divided by production.
Many individual companies calculate and report their own performance measures, and companies may use different methods that produce results different from those shown in this report.
The SEC RuleOn 31 December 2008, the SEC issued a final rule titled Modernization of Oil and Gas Reporting (the SEC Rule). The SEC Rule was effective for annual reports for fiscal years ending on or after 31 December 2009. The intent of the SEC Rule was to provide investors with a more meaningful and comprehensive understanding of oil and gas reserves. The SEC Rule also sought to modernize and update the oil and gas disclosure requirements to align them with current practices and changes in technology.
The main provisions of the SEC Rule include the following:
• The SEC Rule requires that proved reserves be estimated using the 12-month average beginning-of-month price for the year, rather than year-end prices.
• The SEC Rule limits the booking of proved undeveloped reserves to those reserves that are scheduled to be developed within five years, unless specific circumstances justify a longer time. As a result of the five-year requirement, some reserves previously classified as proved undeveloped were reclassified in 2009 as unproved reserves, resulting in the recording of downward revisions.
• The SEC Rule expands the definition of oil and gas producing activities to include synthetic products, such as oil or tar sands. Additionally, reserve quantities are now reported based on the final product sold after upgrading, rather than the product initially produced.
• The SEC Rule requires separate disclosure of information about reserve quantities and financial statement amounts by geographic area with individual countries that exceed 15% or more of proved reserves requiring separate disclosure.
The 2009 through 2012 oil and gas reserve information presented herein was determined in accordance with the SEC Rule; therefore, some comparisons of 2009 through 2012 results to 2008 and the five-year average performance measures are calculated using data presented before and after the SEC Rule was effective.
The addition of reserves associated with synthetic crude and bitumen resulted in significant oil reserve additions in Canada in 2009. These reserve additions are included in the “Revisions” component of the worldwide and Canada reserves tables but are not included in the performance measure calculations.

3Global oil and gas reserves study |
Report limitationsUsers of this report should keep in mind the following limitations on the data presented:
• This report excludes government and privately owned companies that do not publicly disclose their financial and operational data and also excludes smaller public companies.
• Individual companies did not prepare or review the compiled data presented in this report.
• Oil and gas companies that follow US generally accepted accounting principles (GAAP) are allowed to select either successful efforts accounting or full cost accounting for their oil and gas activities. Some companies included in this report follow US GAAP, while others follow International Financial Reporting Standards (IFRS) as adopted by their applicable country. These variations in standards can result in different results for some companies.
• Data for all companies may not be comparable because of differing interpretations or applications of reporting requirements.
• Oil and gas reserve estimates are imprecise and are revised as additional information about reserves becomes known.
OtherThe data included herein was obtained from IHS Herold, Inc. and, in some cases, the individual companies’ annual reports.
The data included herein is based on each year’s original disclosures made by the companies. Restatements or other adjustments made to costs incurred or revenues and results of operations data in subsequent years have not been incorporated herein. Restatements or other adjustments made to oil and gas reserve data are included in the “Other” component of the reserve tables, but these amounts are not included in the performance measure calculations.
All currency amounts are reported in US dollars. Foreign currency amounts were translated using the average exchange rate for the applicable year based on published exchange rates or rates disclosed by individual companies. Totals presented may not add due to rounding.
Data for the following companies are presented based on their applicable fiscal-year end: BHP Billiton (30 June), INPEX (31 March), Mitsui (31 March), National Fuel Gas (30 September) and Sasol (30 June).
The following units of measure are used in this report for gas reserves: Mcf (thousand cubic feet), Bcf (billion cubic feet) and Tcf (trillion cubic feet).
Certain amounts in this report are presented on a per barrel of oil equivalent (boe) basis. Natural gas volumes are converted to barrels at a ratio of six Mcf to one barrel of oil. This ratio has historically been viewed as being reflective of an approximate thermal equivalence between the two commodities. Prior to 2005, oil and natural gas prices were typically closely linked to this ratio. Since 2005, however, oil and natural gas price movements have reflected their different supply and demand fundamentals and thus have not necessarily moved in unison. In recent years, oil prices have risen sharply while North American natural gas prices have remained fairly weak. At one point in 2013, the observed market ratio of West Texas Intermediate oil to Henry Hub natural gas prices was as high as 50-to-1, implying that oil was more than eight times more costly than an equivalent amount of natural gas (in thermal terms). However, the volumetric conversion of six Mcf to one barrel of oil continues to be accepted as industry practice indicative of a long-term outlook on commodity pricing. In spite of this, some individual companies may use a higher ratio for their internal performance metrics to more closely reflect market equivalence.

4 | Global oil and gas reserves study
Total worldwide capital expenditures for the study companies increased 13% from $480.1 billion in 2011 to $541.0 billion in 2012. Strong growth in exploration spending and development spending was somewhat offset by declines in property acquisition costs.
Proved property acquisition costs declined 11% in 2012 to $27.0 billion while unproved property acquisition costs fell 21% to $50.7 billion. Property acquisition costs decreased for the study companies in all regions in 2012 except for Africa and Middle East and the US.
BHP Billiton was the leading purchaser of proved ($4.8 billion) and unproved properties ($10.4 billion) in 2012 as a result of its acquisition of Petrohawk Energy. This transaction was primarily focused on natural gas and provides BHP Billiton with company-operated resources in the Eagle Ford, Haynesville and Permian fields in the US.
Plains Exploration & Production posted property acquisition costs of $4.1 billion (proved) and $2.1 billion (unproved) in 2012, as the company acquired interests in various Gulf of Mexico fields from Royal Dutch Shell and BP.
Royal Dutch Shell posted unproved property acquisition costs of $5.2 billion along with proved costs of $955.0 million. Its most significant activity was in the US for its purchase of acreage in West Texas from Chesapeake Energy.
Exploration costs rose 14% from $73.3 billion in 2011 to $83.5 billion in 2012. Development costs were $378.5 billion in 2012, representing 22% growth from $311.3 billion in 2011.
The largest increases in combined exploration and development spending in 2012 were reported by Royal Dutch Shell ($10.0 billion increase) and PetroChina ($8.7 billion increase).
On a peer group basis, the large independents accounted for the largest percentage increase in combined exploration and development spending with their combined spending increasing 26% (a $23.8 billion increase). The integrateds had the largest dollar increase at $51.2 billion (or 21%). The independents posted only a 5% increase in combined exploration and development spending, in part due to their reserves being more heavily weighted toward gas and lower gas prices in the US and Canada throughout much of 2012 having an impact on their cash flows and spending ability.
Worldwide study resultsCapital expenditures
2008 2009 2010 2011 2012
Proved properties acquired $ 35,578.0 $ 15,614.0 $ 55,960.2 $ 30,476.9 $ 26,974.3
Unproved properties acquired 56,896.3 15,001.3 119,975.1 64,362.5 50,662.2
Exploration 61,067.4 56,021.5 60,984.5 73,276.3 83,513.2
Development 251,261.6 228,300.7 260,770.6 311,333.1 378,517.4
Other 1,720.4 540.7 486.4 697.0 1,345.1
Total $ 406,523.6 $ 315,478.3 $ 498,176.9 $ 480,145.9 $ 541,012.2
(a) Includes the 75 largest companies based on 2012 end-of-year oil and gas reserve estimates. Activity related to acquired companies has also been reflected as described on page 1.
Worldwide — capital expenditures (millions) (a)
Billi
ons
2008 2009 2010 2011 2012
$400
$500
$600
$300
$200
$100
$0
Worldwide — capital expenditures
Proved properties acquired
Unproved properties acquired
Exploration Development

5Global oil and gas reserves study |
Worldwide — 2012 capital expenditures — leading companies (millions)
Proved properties acquired Unproved properties acquired
BHP Billiton Group $ 4,746.0 BHP Billiton Group $ 10,371.0
Plains Exploration & Production Company (1) 4,139.0 Royal Dutch Shell plc (1) 5,172.0
Linn Energy, LLC 2,531.4 PetroChina Company Limited 3,896.6
SandRidge Energy, Inc. 1,761.6 Chesapeake Energy Corporation 2,981.0
Occidental Petroleum Corporation 1,703.0 Total S.A. (1) 2,528.3
Apache Corporation 1,251.0 Apache Corporation 2,355.0
Pengrowth Energy Corporation 1,156.7 Plains Exploration & Production Company (1) 2,102.6
Royal Dutch Shell plc (1) 955.0 Exxon Mobil Corporation (1) 1,875.0
Concho Resources Inc. 828.7 BP p.l.c. (1) 1,763.0
Marathon Oil Corporation 759.0 CNOOC Limited 1,708.8
Exploration Development
Royal Dutch Shell plc (1) $ 9,159.0 PetroChina Company Limited $ 27,559.7
Petroleo Brasileiro, S.A. (Petrobras) (1) 6,640.0 Exxon Mobil Corporation (1) 27,482.0
PetroChina Company Limited 6,486.7 Royal Dutch Shell plc (1) 21,989.0
BP p.l.c. (1) 4,581.0 Chevron Corporation (1) 20,984.0
Statoil ASA 3,592.1 Petroleo Brasileiro, S.A. (Petrobras) (1) 17,878.0
China Petroleum & Chemical Corporation (Sinopec)
3,587.7 Total S.A. (1) 17,694.2
Exxon Mobil Corporation (1) 2,861.0 Statoil ASA 15,434.1
Total S.A. (1) 2,691.6 BP p.l.c. (1) 15,247.0
Apache Corporation 2,689.0 ConocoPhillips (1) 14,552.0
Petroleos Mexicanos (PEMEX) 2,534.6 Eni SpA (1) 13,185.4(1) See company footnotes on page 108.
6 | Global oil and gas reserves study
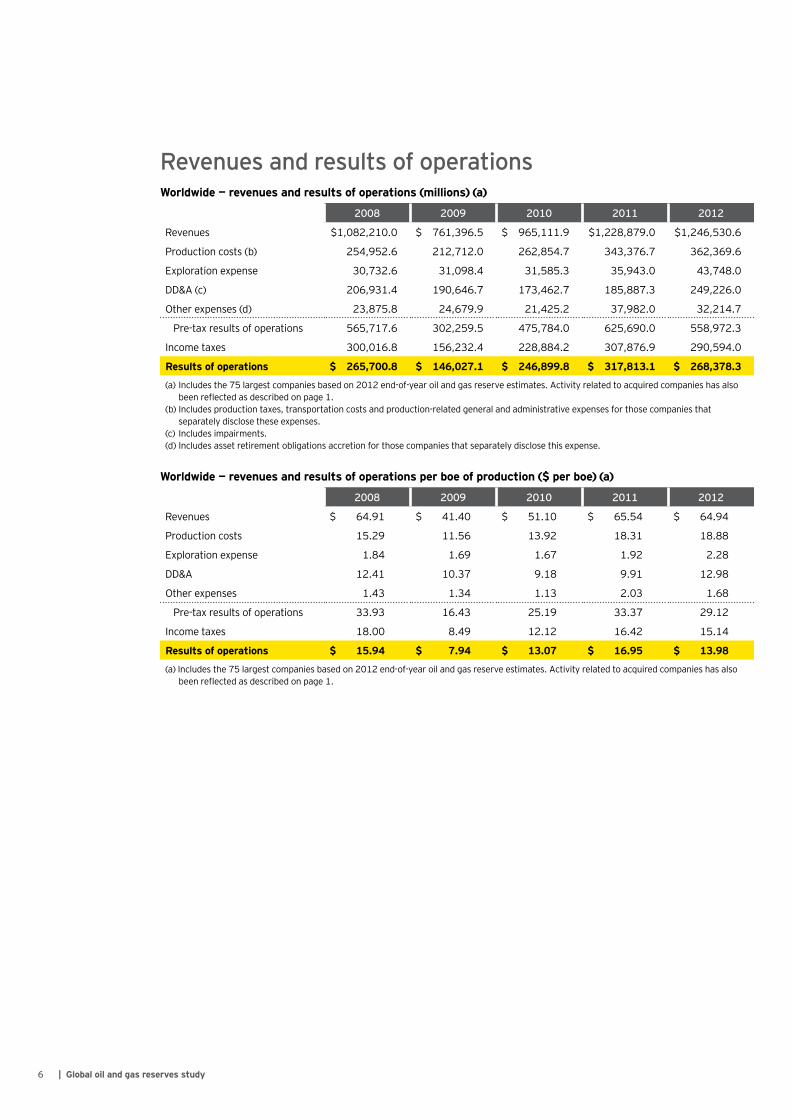
Revenues and results of operations
2008 2009 2010 2011 2012
Revenues $1,082,210.0 $ 761,396.5 $ 965,111.9 $1,228,879.0 $1,246,530.6
Production costs (b) 254,952.6 212,712.0 262,854.7 343,376.7 362,369.6
Exploration expense 30,732.6 31,098.4 31,585.3 35,943.0 43,748.0
DD&A (c) 206,931.4 190,646.7 173,462.7 185,887.3 249,226.0
Other expenses (d) 23,875.8 24,679.9 21,425.2 37,982.0 32,214.7
Pre-tax results of operations 565,717.6 302,259.5 475,784.0 625,690.0 558,972.3
Income taxes 300,016.8 156,232.4 228,884.2 307,876.9 290,594.0
Results of operations $ 265,700.8 $ 146,027.1 $ 246,899.8 $ 317,813.1 $ 268,378.3
(a) Includes the 75 largest companies based on 2012 end-of-year oil and gas reserve estimates. Activity related to acquired companies has also been reflected as described on page 1.
(b) Includes production taxes, transportation costs and production-related general and administrative expenses for those companies that separately disclose these expenses.
(c) Includes impairments.(d) Includes asset retirement obligations accretion for those companies that separately disclose this expense.
Worldwide — revenues and results of operations (millions) (a)
2008 2009 2010 2011 2012
Revenues $ 64.91 $ 41.40 $ 51.10 $ 65.54 $ 64.94
Production costs 15.29 11.56 13.92 18.31 18.88
Exploration expense 1.84 1.69 1.67 1.92 2.28
DD&A 12.41 10.37 9.18 9.91 12.98
Other expenses 1.43 1.34 1.13 2.03 1.68
Pre-tax results of operations 33.93 16.43 25.19 33.37 29.12
Income taxes 18.00 8.49 12.12 16.42 15.14
Results of operations $ 15.94 $ 7.94 $ 13.07 $ 16.95 $ 13.98
(a) Includes the 75 largest companies based on 2012 end-of-year oil and gas reserve estimates. Activity related to acquired companies has also been reflected as described on page 1.
Worldwide — revenues and results of operations per boe of production ($ per boe) (a)

7Global oil and gas reserves study |
Worldwide after-tax profits for the study companies declined 16% from $317.8 billion in 2011 to $268.4 billion in 2012.
Combined oil and gas production increased 2% in 2012, and revenues saw a 1% increase on an absolute basis, while revenues on a per-boe-of-production basis decreased 1%.
Production costs were $362.4 billion in 2012 compared with $343.4 billion in 2011, representing a 6% increase. This change was primarily driven by lease operating expenses, which grew 8% from $193.9 billion in 2011 to $210.3 billion in 2012.
Depreciation, depletion and amortization (DD&A) was $249.2 billion in 2012 compared with $185.9 billion in 2011. Recurring DD&A charges increased 20% in 2012 while property impairments of $33.8 billion were recorded. Natural gas producers in Canada and the US
were heavily impacted by low natural gas prices with the largest property impairments recorded in 2012 being recorded by Encana ($4.7 billion), Chesapeake Energy ($3.3 billion) and Ultra Petroleum ($3.0 billion).
Worldwide — 2012 revenues and results of operations — leading companies (millions)
Revenues Results of operations
Exxon Mobil Corporation (1) $ 106,545.0 PetroChina Company Limited $ 32,811.2
Petroleos Mexicanos (PEMEX) 101,342.8 Exxon Mobil Corporation (1) 27,063.0
PetroChina Company Limited 97,841.9 Petroleo Brasileiro, S.A. (Petrobras) (1) 24,853.0
Royal Dutch Shell plc (1) 90,772.0 Chevron Corporation (1) 23,839.0
Petroleo Brasileiro, S.A. (Petrobras) (1) 80,270.0 Royal Dutch Shell plc (1) 17,106.0
Chevron Corporation (1) 72,779.0 BP p.l.c. (1) (3) 16,144.0
BP p.l.c. (1) 65,634.0 Total S.A. (1) 10,679.0
Total S.A. (1) 57,788.1 Petroleos Mexicanos (PEMEX) 10,201.1
Statoil ASA 51,939.7 China Petroleum & Chemical Corporation (Sinopec)
9,746.3
OAO LUKOIL (1) 44,848.0 CNOOC Limited (1) 9,720.4(1) (3) See company footnotes on page 108.
Revenues Results of operations
Billi
ons
2008 2009 2010 2011 2012
$800
$1,000
$1,400
$1,200
$600
$400
$200
$0
Worldwide — revenues and results of operations

8 | Global oil and gas reserves study
Oil reserves
2008 2009 2010 (c) 2011 2012 (d)
Beginning of year 126,850.4 132,252.3 140,753.9 143,108.6 148,074.7
Additions:
Extensions and discoveries 5,075.8 7,142.3 7,256.1 8,846.2 9,903.6
Improved recovery 1,042.7 1,034.5 1,549.2 1,030.9 1,482.2
Revisions (e) 829.7 12,906.5 5,446.2 6,281.1 5,728.5
Production (10,400.0) (11,486.2) (11,674.5) (11,312.6) (11,558.6)
Purchases 593.8 711.6 2,399.7 1,350.0 1,175.0
Sales (f) (980.0) (1,731.8) (2,731.7) (909.6) (2,920.5)
Other (g) 9,239.9 (75.2) 109.8 (319.8) 589.7
End of year 132,252.3 140,753.9 143,108.6 148,074.7 152,474.7
(a) Includes condensate and natural gas liquids for all years and includes synthetic crude and bitumen for 2009 through 2012. (b) Includes the 75 largest companies based on 2012 end-of-year oil and gas reserve estimates. Activity related to acquired companies has also
been reflected as described on page 1.(c) Beginning-of-year reserves for 2010 include 387.6 million barrels, which represent XTO Energy’s end-of-year 2009 gas reserves. Sales for
2010 include 387.6 million barrels to reflect the sale of XTO Energy’s reserves to ExxonMobil.(d) Beginning-of-year reserves for 2012 include 114.8 million barrels, which represent Petrohawk Energy’s end-of-year 2011 oil reserves. Sales
for 2012 include 114.8 million barrels, to reflect the sale of Petrohawk Energy’s reserves to BHP Billiton. (e) Revisions for 2009 include 6,479.6 million barrels related to the addition of synthetic crude and bitumen due to the SEC Rule. These reserves
are not included in the performance measure calculations.(f) Sales for 2012 include 584.0 million barrels for the expropriation process of Repsol’s shares in YPF. This amount is not included in the all
sources production replacement rate calculation.(g) Includes transfers, reclassifications and other. The 2008 figure includes 9,413.8 million barrels related to the first-time inclusion of
investments accounted for by the equity method. The 2012 figure includes 586.0 million barrels, which represents YPF’s 2012 beginning-of-year oil reserves.
Worldwide — proved oil reserves (a) (million barrels) (b)
Worldwide end-of-year reserves for the study companies grew 3% in 2012 and reached 152.5 billion barrels. Oil reserves increased in all regions in 2012, except for Europe and Africa and Middle East.
Extensions and discoveries were 9.9 billion barrels in 2012, representing a 12% increase from 2011. For the second consecutive year, ExxonMobil posted the largest extensions and discoveries (760.0 million barrels) with its activity being concentrated in the US and Canada. PetroChina and Rosneft recorded extensions and discoveries of 737.0 million barrels and 736.0 million barrels, respectively, in Asia-Pacific.
After decreasing in 2011, oil production rose 2% in 2012 to 11.6 billion barrels. The largest increases in oil production were reported by PetroChina (31.0 million barrel increase) and Marathon Oil (25.0 million barrel increase). PetroChina’s production growth was largely due to increased volumes from Asia-Pacific’s Changqing field. Marathon Oil’s largest production gains were reported in the US and Africa.
Purchases of oil reserves were 1.2 billion barrels in 2012. ExxonMobil (219.0 million barrels) was the leading purchaser of oil reserves with most of its activity in the US. Plains Exploration & Production followed with purchases of 113.2 million barrels for its previously discussed acquisitions.
Sales of oil reserves were 2.9 billion barrels in 2012, with Rosneft (806.0 million barrels) reporting the largest sales. Repsol’s sales of oil reserves were 595.0 million barrels, which primarily related to the expropriation of its shares in YFP by the Argentine government.
Billi
on b
arre
ls
2008 2009 2010 2011 2012
80
120
100
160
140
60
40
20
0
Worldwide — end-of-year proved oil reserves
Integrateds Large independents Independents

9Global oil and gas reserves study |
Worldwide — 2012 proved oil reserves — leading companies (million barrels)
Ending reserves Production
OJSC Rosneft Oil Company (2) 16,773.0 Petroleos Mexicanos (PEMEX) 1,053.0
OAO LUKOIL (1) 13,381.0 PetroChina Company Limited 917.0
Exxon Mobil Corporation (1) 12,816.0 OJSC Rosneft Oil Company (2) 885.0
Petroleos Mexicanos (PEMEX) 11,424.0 Exxon Mobil Corporation (1) 799.0
PetroChina Company Limited 11,018.0 BP p.l.c. (1) 749.0
Petroleo Brasileiro, S.A. (Petrobras) (1) 10,961.3 Petroleo Brasileiro, S.A. (Petrobras) (1) 741.5
BP p.l.c. (1) 10,050.0 OAO LUKOIL (1) 677.0
Chevron Corporation (1) 6,481.0 Chevron Corporation (1) 646.0
Royal Dutch Shell plc (1) 6,196.0 Royal Dutch Shell plc (1) 598.0
Total S.A. (1) 5,685.0 Total S.A. (1) 446.0(1) (2) See company footnotes on page 108.

10 | Global oil and gas reserves study
Gas reserves
2008 2009 2010 (b) 2011 2012 (c)
Beginning of year 513,959.3 596,255.6 617,350.1 633,773.9 636,954.6
Additions:
Extensions and discoveries 36,381.4 60,034.2 52,150.4 59,012.5 64,792.2
Improved recovery 2,416.1 1,875.5 2,801.8 1,530.0 2,135.3
Revisions 10,873.4 (9,439.1) 8,440.0 2,158.5 (28,344.7)
Production (37,628.7) (41,440.8) (43,277.1) (44,617.0) (45,814.4)
Purchases 10,583.0 17,649.6 20,451.6 12,602.6 8,507.6
Sales (d) (5,070.9) (7,580.2) (24,199.5) (13,755.7) (16,347.1)
Other (e) 64,742.0 (4.6) 56.6 (13,750.2) 2,400.8
End of year 596,255.6 617,350.1 633,773.9 636,954.6 624,284.3
(a) Includes the 75 largest companies based on 2012 end-of-year oil and gas reserve estimates. Activity related to acquired companies has also been reflected as described on page 1.
(b) Beginning-of-year reserves for 2010 include 12,501.7 Bcf, which represent XTO Energy’s end-of-year 2009 gas reserves. Sales for 2010 include 12,501.7 Bcf to reflect the sale of XTO Energy’s reserves to ExxonMobil.
(c) Beginning-of-year reserves for 2012 include 3,355.1 Bcf, which represent Petrohawk Energy’s end-of-year 2011 gas reserves. Sales for 2012 include 3,355.1 Bcf to reflect the sale of Petrohawk Energy’s reserves to BHP Billiton.
(d) Sales for 2012 include 2,397.0 Bcf for the expropriation process of Repsol’s shares in YPF. This amount is not included in the all sources production replacement rate calculation.
(e) Includes transfers, reclassifications and other. The 2008 figure includes 63,966.7 Bcf related to the first-time inclusion of investments accounted for by the equity method. The 2011 figure includes (13,323.0) Bcf related to OAO NOVATEK’s reserves that were reclassified as equity method investments. The 2012 figure includes 2,401.0 Bcf, which represents YPF’s 2012 beginning-of-year gas reserves.
Worldwide — proved gas reserves (Bcf) (a)
Worldwide gas reserves for the study companies decreased 2% in 2012, falling from 637.0 Tcf in 2011 to 624.3 Tcf in 2012. The largest declines were seen in the US and Canada, where low natural gas prices prompted the recording of significant downward reserve revisions.
Extensions and discoveries increased 10% in 2012 to 64.8 Tcf. The largest extensions and discoveries were all related to activity in Asia-Pacific and were reported by OAO NOVATEK (13.5 Tcf), PetroChina (6.2 Tcf) and INPEX (5.4 Tcf).
Gas production increased 3% from 44.6 Tcf in 2011 to 45.8 Tcf in 2012. BHP Billiton reported the largest increase in production (452.1 Bcf increase) primarily due to increased US production related to its acquisition of Petrohawk Energy. Statoil’s gas production increased 313.0 Bcf in 2012, with the largest increase seen in Norway.
Purchases of gas reserves were 8.5 Tcf in 2012, with BHP Billiton (3.3 Tcf) and LINN Energy (1.2 Tcf) accounting for more than half of the activity. LINN Energy’s purchases focused on US properties purchased from BP.
Sales of gas reserves were 16.3 Tcf in 2012. Excluding the 3.4 Tcf related to Petrohawk Energy, the largest sales were reported by Repsol (2.4 Tcf), which primarily related to the expropriation of its shares in YFP by the Argentine government.
Tcf
2008 2009 2010 2011 2012
400
300
500
700
600
200
100
0
Worldwide — end-of-year proved gas reserves
Integrateds Large independents Independents
11Global oil and gas reserves study |
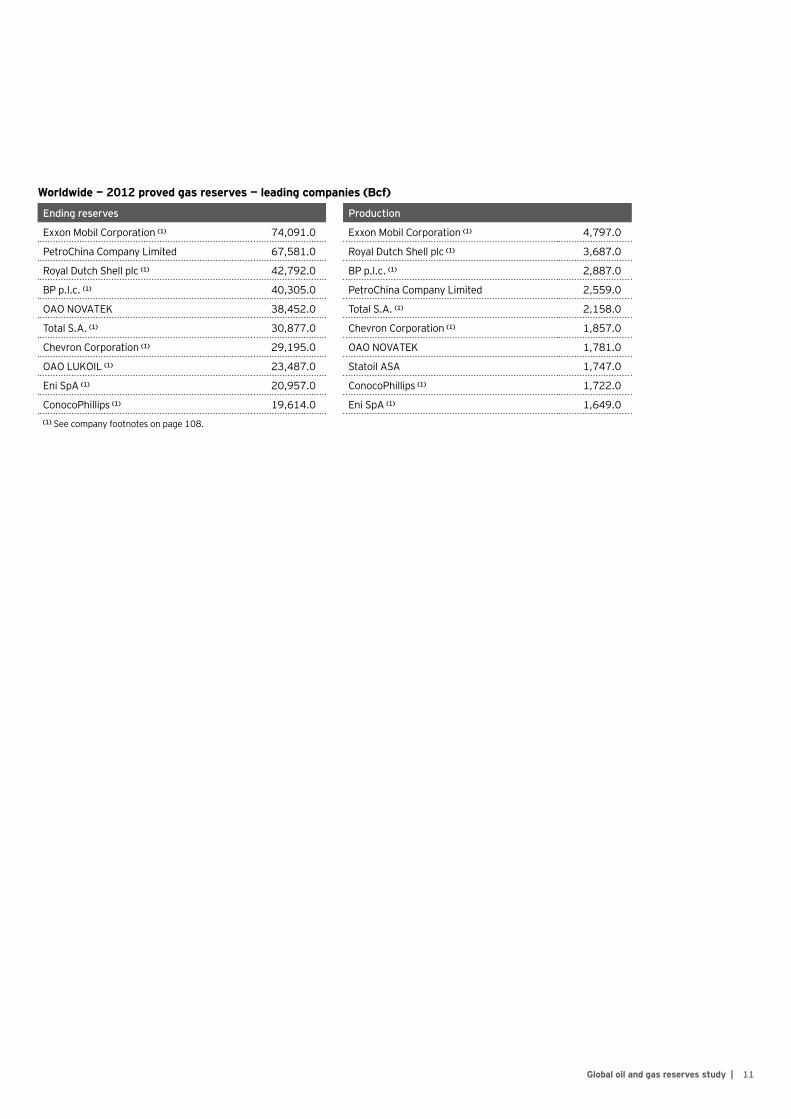
Worldwide — 2012 proved gas reserves — leading companies (Bcf)
Ending reserves Production
Exxon Mobil Corporation (1) 74,091.0 Exxon Mobil Corporation (1) 4,797.0
PetroChina Company Limited 67,581.0 Royal Dutch Shell plc (1) 3,687.0
Royal Dutch Shell plc (1) 42,792.0 BP p.l.c. (1) 2,887.0
BP p.l.c. (1) 40,305.0 PetroChina Company Limited 2,559.0
OAO NOVATEK 38,452.0 Total S.A. (1) 2,158.0
Total S.A. (1) 30,877.0 Chevron Corporation (1) 1,857.0
Chevron Corporation (1) 29,195.0 OAO NOVATEK 1,781.0
OAO LUKOIL (1) 23,487.0 Statoil ASA 1,747.0
Eni SpA (1) 20,957.0 ConocoPhillips (1) 1,722.0
ConocoPhillips (1) 19,614.0 Eni SpA (1) 1,649.0(1) See company footnotes on page 108.
12 | Global oil and gas reserves study
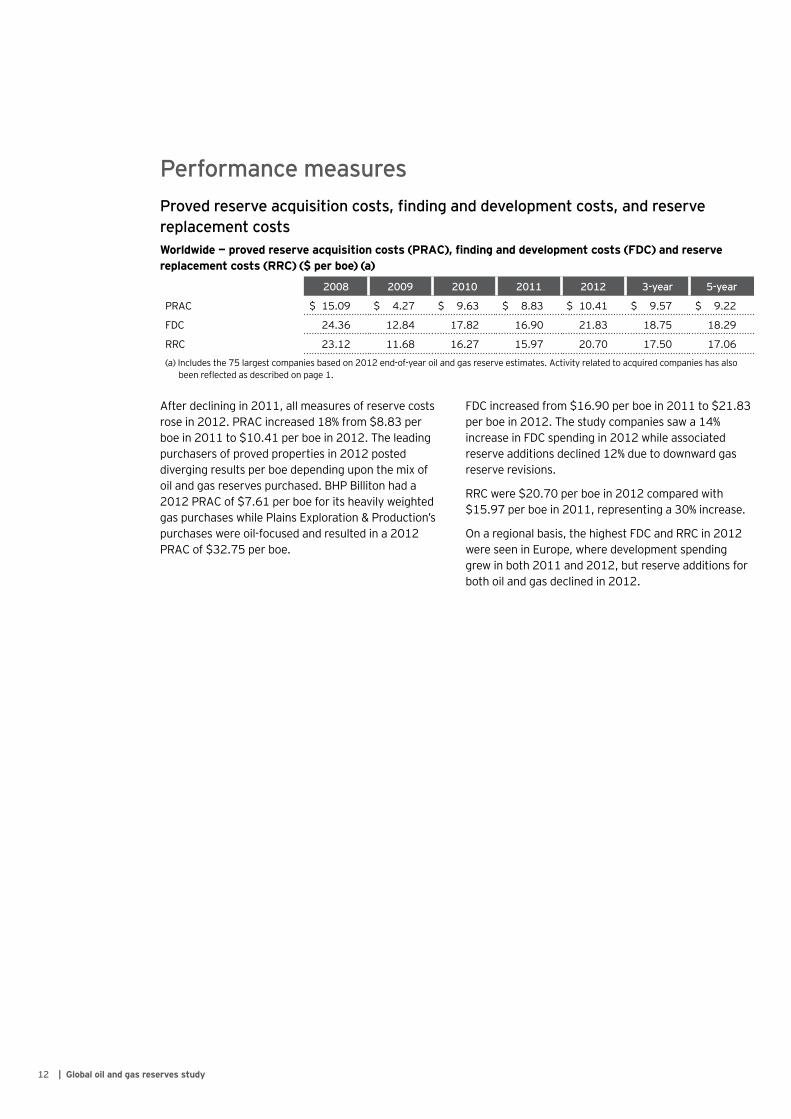
Performance measuresProved reserve acquisition costs, finding and development costs, and reserve replacement costs
After declining in 2011, all measures of reserve costs rose in 2012. PRAC increased 18% from $8.83 per boe in 2011 to $10.41 per boe in 2012. The leading purchasers of proved properties in 2012 posted diverging results per boe depending upon the mix of oil and gas reserves purchased. BHP Billiton had a 2012 PRAC of $7.61 per boe for its heavily weighted gas purchases while Plains Exploration & Production’s purchases were oil-focused and resulted in a 2012 PRAC of $32.75 per boe.
FDC increased from $16.90 per boe in 2011 to $21.83 per boe in 2012. The study companies saw a 14% increase in FDC spending in 2012 while associated reserve additions declined 12% due to downward gas reserve revisions.
RRC were $20.70 per boe in 2012 compared with $15.97 per boe in 2011, representing a 30% increase.
On a regional basis, the highest FDC and RRC in 2012 were seen in Europe, where development spending grew in both 2011 and 2012, but reserve additions for both oil and gas declined in 2012.
Worldwide — proved reserve acquisition costs (PRAC), finding and development costs (FDC) and reserve replacement costs (RRC) ($ per boe) (a)
2008 2009 2010 2011 2012 3-year 5-year
PRAC $ 15.09 $ 4.27 $ 9.63 $ 8.83 $ 10.41 $ 9.57 $ 9.22
FDC 24.36 12.84 17.82 16.90 21.83 18.75 18.29
RRC 23.12 11.68 16.27 15.97 20.70 17.50 17.06
(a) Includes the 75 largest companies based on 2012 end-of-year oil and gas reserve estimates. Activity related to acquired companies has also been reflected as described on page 1.

13Global oil and gas reserves study |
Worldwide — three-year (2010–12) PRAC, FDC and RRC — leading companies* ($ per boe)
PRAC** FDC
OAO LUKOIL (1) $ 2.25 OAO NOVATEK $ 0.82
Total S.A. (1) 3.88 Antero Resources LLC 2.83
Antero Resources LLC 4.23 OJSC Rosneft Oil Company 4.14
PDC Energy, Inc. 5.34 Sasol Limited 4.14
National Fuel Gas Company 5.72 Range Resources Corporation 5.14
Hess Corporation 5.87 Cabot Oil & Gas Corporation 6.12
Quicksilver Resources Inc. 5.91 Rosetta Resources Inc. 6.96
Chevron Corporation (1) 5.96 INPEX CORPORATION 7.11
Cimarex Energy Co. 6.23 EQT Corporation 7.63
Range Resources Corporation 6.30 CONSOL Energy, Inc. 10.28
RRC
OAO NOVATEK $ 0.89
Antero Resources LLC 2.88
OJSC Rosneft Oil Company 4.14
Sasol Limited 4.24
Range Resources Corporation 5.16
Cabot Oil & Gas Corporation 6.12
Rosetta Resources Inc. 6.99
INPEX CORPORATION 7.07
EQT Corporation 7.83
OAO LUKOIL (1) 10.04
* Based on companies with results for each year of the three-year period.** Based on companies with proved acquisition costs of at least $50 million for the three-year period.(1) See company footnotes on page 108.

14 | Global oil and gas reserves study
Production replacement rates
Oil
Worldwide — oil production replacement rates (a)
The excluding purchases and sales oil production replacement was 148% in 2012, representing the highest level of the five-year study period. This rate increased from 143% in 2011, primarily due to a 12% jump in extensions and discoveries in 2012.
Net sales recorded by the study companies resulted in a slightly lower all sources rate of 138% in 2012.
On a regional basis, Canada posted the highest excluding purchases and sales oil production replacement rate in 2012 at 368%. Growth in Canada was driven by recording of additional bitumen reserves by ConocoPhillips and ExxonMobil, along with positive revisions due to strong oil prices.
Europe saw the lowest excluding purchases and sales oil production replacement rate in 2012 at 51% as recent increases in capital spending have not yet resulted in reserve growth.
2008 2009 2010 2011 2012 3-year 5-year
All sources 63% 118% 119% 147% 138% 135% 118%
Excluding purchases and sales
67% 127% 122% 143% 148% 138% 122%
(a) Includes the 75 largest companies based on 2012 end-of-year oil and gas reserve estimates. Activity related to acquired companies has also been reflected as described on page 1.
All sources Excluding purchases and sales
PDC Energy, Inc. 1,081% Range Resources Corporation 1,126%
Laredo Petroleum Holdings, Inc. 1,042 Laredo Petroleum Holdings, Inc. 1,025
Range Resources Corporation 939 EP Energy LLC (1) 977
EP Energy LLC (1) 937 Chesapeake Energy Corporation 888
QEP Resources, Inc. 917 Rosetta Resources Inc. 857
Bill Barrett Corporation 916 PDC Energy, Inc. 856
Rosetta Resources Inc. 846 Bill Barrett Corporation 784
Continental Resources, Inc. 827 Continental Resources, Inc. 711
Vanguard Natural Resources, LLC 785 QEP Resources, Inc. 711
Chesapeake Energy Corporation 776 Sasol Limited 652
* Based on companies with at least 5 million barrels of production for the three-year period and companies that had results for each year of the three-year period.
(1) See company footnotes on page 108.
Worldwide — three-year (2010–12) oil production replacement rates — leading companies*

15Global oil and gas reserves study |
Gas
Worldwide — gas production replacement rates (a)
2008 2009 2010 2011 2012 3-year 5-year
All sources 147% 151% 138% 138% 72% 115% 128%
Excluding purchases and sales
132% 127% 146% 141% 84% 123% 125%
(a) Includes the 75 largest companies based on 2012 end-of-year oil and gas reserve estimates. Activity related to acquired companies has also been reflected as described on page 1.
Gas production replacement rates dropped significantly in 2012 as a 10% gain in extensions and discoveries was overshadowed by downward revisions of 28.3 Tcf. The excluding purchases and sales rate was 84% in 2012 while the all sources rate was 72%. The downward revisions were driven by depressed natural gas prices in the US and Canada.
Canada and the US posted excluding purchases and sales rates of (158)% and (24)%, respectively, in 2012. The highest rate was seen in Asia-Pacific with an excluding purchases and sales rate of 284%, which was driven by the recording of 30.0 Tcf of extensions and discoveries in 2012.
All sources Excluding purchases and sales
Vanguard Natural Resources, LLC 1,422% Antero Resources LLC 1,920%
Antero Resources LLC 1,287 Continental Resources, Inc. 702
Denbury Resources Inc. 888 Range Resources Corporation 687
Linn Energy, LLC 843 National Fuel Gas Company 589
Continental Resources, Inc. 772 Swift Energy Company 523
National Fuel Gas Company 603 INPEX CORPORATION 516
CONSOL Energy, Inc. 576 SandRidge Energy, Inc. 487
Range Resources Corporation 522 CONSOL Energy, Inc. 481
INPEX CORPORATION 512 Rosetta Resources Inc. 470
Concho Resources Inc. 501 Cabot Oil & Gas Corporation 448
*Based on companies that had results for each year of the three-year period.
Worldwide — three-year (2010–12) gas production replacement rates — leading companies*

16 | Global oil and gas reserves study
Production costs
Worldwide — production costs ($ per boe) (a)
2008 2009 2010 2011 2012 3-year 5-year
$ 15.29 $ 11.56 $ 13.92 $ 18.31 $ 18.88 $ 17.04 $ 15.63
(a) Includes the 75 largest companies based on 2012 end-of-year oil and gas reserve estimates. Activity related to acquired companies has also been reflected as described on page 1.
Production costs per boe saw a slight 3% increase in 2012 to $18.88 per boe. Total production costs rose 6%, while combined oil and gas production increased 2%. Lease operating costs, which were 8% higher in 2012, drove the overall increase in total costs.
All three peer groups saw similar increases in production costs per boe in 2012, with the integrateds’ and independents’ costs increasing 3% each and the large independents’ costs rising 4%.
EQT Corporation $2.45
Southwestern Energy Company 5.52
Total S.A. (1) (5) 6.18
Chesapeake Energy Corporation 6.25
Cabot Oil & Gas Corporation 6.55
Ultra Petroleum Corporation 6.67
BG Group plc 6.68
Petroleos Mexicanos (PEMEX) 6.78
EXCO Resources, Inc. 7.01
Range Resources Corporation 7.31
* Based on companies that had results for each year of the three-year period.
(1) (5) See company footnotes on page 108.
Worldwide — three-year (2010–12) production costs — leading companies ($ per boe)*
17Global oil and gas reserves study |
Worldwide company statistics
18 | Global oil and gas reserves study
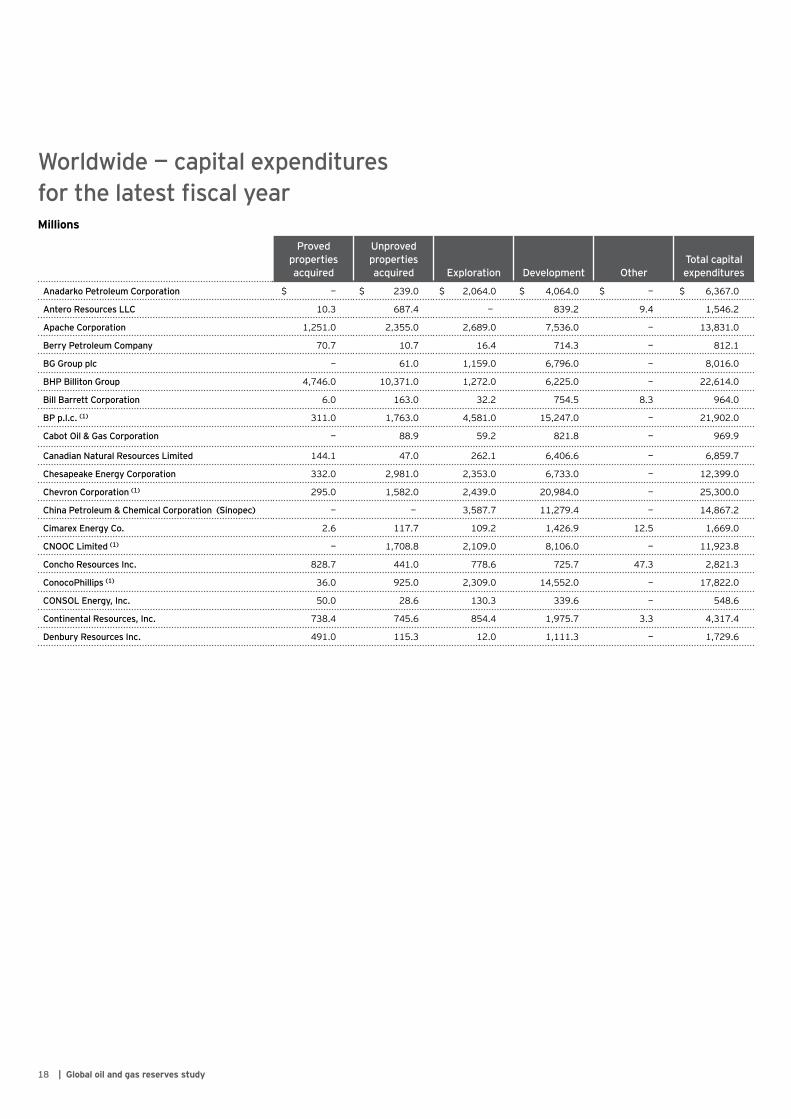
Worldwide — capital expenditures for the latest fiscal yearMillions
Proved propertiesacquired
Unproved propertiesacquired Exploration Development Other
Total capital expenditures
Anadarko Petroleum Corporation $ — $ 239.0 $ 2,064.0 $ 4,064.0 $ — $ 6,367.0
Antero Resources LLC 10.3 687.4 — 839.2 9.4 1,546.2
Apache Corporation 1,251.0 2,355.0 2,689.0 7,536.0 — 13,831.0
Berry Petroleum Company 70.7 10.7 16.4 714.3 — 812.1
BG Group plc — 61.0 1,159.0 6,796.0 — 8,016.0
BHP Billiton Group 4,746.0 10,371.0 1,272.0 6,225.0 — 22,614.0
Bill Barrett Corporation 6.0 163.0 32.2 754.5 8.3 964.0
BP p.l.c. (1) 311.0 1,763.0 4,581.0 15,247.0 — 21,902.0
Cabot Oil & Gas Corporation — 88.9 59.2 821.8 — 969.9
Canadian Natural Resources Limited 144.1 47.0 262.1 6,406.6 — 6,859.7
Chesapeake Energy Corporation 332.0 2,981.0 2,353.0 6,733.0 — 12,399.0
Chevron Corporation (1) 295.0 1,582.0 2,439.0 20,984.0 — 25,300.0
China Petroleum & Chemical Corporation (Sinopec) — — 3,587.7 11,279.4 — 14,867.2
Cimarex Energy Co. 2.6 117.7 109.2 1,426.9 12.5 1,669.0
CNOOC Limited (1) — 1,708.8 2,109.0 8,106.0 — 11,923.8
Concho Resources Inc. 828.7 441.0 778.6 725.7 47.3 2,821.3
ConocoPhillips (1) 36.0 925.0 2,309.0 14,552.0 — 17,822.0
CONSOL Energy, Inc. 50.0 28.6 130.3 339.6 — 548.6
Continental Resources, Inc. 738.4 745.6 854.4 1,975.7 3.3 4,317.4
Denbury Resources Inc. 491.0 115.3 12.0 1,111.3 — 1,729.6

19Global oil and gas reserves study |
Proved propertiesacquired
Unproved propertiesacquired Exploration Development Other
Total capital expenditures
Devon Energy Corporation $ 73.0 $ 1,178.0 $ 655.0 6,099.0 $ — $ 8,005.0
Ecopetrol S.A. — 37.3 932.3 5,117.8 — 6,087.3
Encana Corporation 23.0 356.0 834.0 2,460.0 — 3,673.0
Energen Corporation 79.9 58.6 419.3 749.3 — 1,307.0
Eni SpA (1) 55.3 — 2,417.7 13,185.4 — 15,658.4
EOG Resources, Inc. 0.7 505.3 445.6 5,989.6 127.0 7,068.2
EP Energy LLC (1) — 51.0 208.0 1,298.0 62.0 1,619.0
EQT Corporation 17.0 117.7 4.8 850.9 — 990.3
EXCO Resources, Inc. — 47.9 57.3 346.0 1.0 452.2
Exxon Mobil Corporation (1) 332.0 1,875.0 2,861.0 27,482.0 — 32,550.0
Forest Oil Corporation — 64.1 268.9 399.1 — 732.1
Hess Corporation — 267.0 1,089.0 7,505.0 — 8,861.0
Husky Energy Inc. 6.0 15.0 363.1 4,911.0 — 5,295.1
INPEX CORPORATION (7) — 7.6 415.4 2,186.8 — 2,609.8
Laredo Petroleum Holdings, Inc. 16.9 3.7 93.3 831.7 7.4 953.0
Linn Energy, LLC 2,531.4 181.1 0.5 1,062.0 4.7 3,779.7
Marathon Oil Corporation 759.0 505.0 1,856.0 3,527.0 — 6,647.0
Mitsui & Co., Ltd. (1) 116.5 49.5 350.6 1,860.3 — 2,377.0
Murphy Oil Corporation 311.5 132.5 449.6 3,348.4 171.7 4,413.7
National Fuel Gas Company 13.1 13.9 84.6 576.4 10.3 698.3

20 | Global oil and gas reserves study
Worldwide — capital expenditures for the latest fiscal yearMillions
Proved propertiesacquired
Unproved propertiesacquired Exploration Development Other
Total capital expenditures
Newfield Exploration Company 3.0 64.0 993.0 853.0 $ — $ 1,913.0
Nexen Inc. — 12.0 752.3 2,733.1 — 3,497.4
Noble Energy, Inc. — 96.0 689.0 2,993.0 — 3,778.0
OAO LUKOIL (1) 97.0 974.0 685.0 8,600.0 — 10,356.0
OAO NOVATEK — — 65.3 965.5 — 1,030.8
Occidental Petroleum Corporation 1,703.0 613.0 654.0 7,673.0 — 10,643.0
OJSC Rosneft Oil Company — 193.2 740.5 8,885.8 — 9,819.5
OMV Aktiengesellschaft 350.5 215.7 499.9 1,458.5 49.9 2,574.5
PDC Energy, Inc. 105.3 276.2 20.7 233.1 — 635.4
Pengrowth Energy Corporation 1,156.7 705.3 72.1 556.6 4.4 2,495.2
Penn West Petroleum Ltd. 52.0 37.0 241.0 1,595.0 — 1,925.0
PetroChina Company Limited — 3,896.6 6,486.7 27,559.7 — 37,943.0
Petrohawk Energy Corporation — — — — — —
Petroleo Brasileiro, S.A. (Petrobras) (1) 616.0 — 6,640.0 17,878.0 — 25,134.0
Petroleos Mexicanos (PEMEX) — — 2,534.6 12,042.2 — 14,576.9
Pioneer Natural Resources Company 16.9 140.5 964.6 1,824.8 58.9 3,005.8
Plains Exploration & Production Company (1) 4,139.0 2,102.6 1,241.1 835.8 — 8,318.6
QEP Resources, Inc. 714.4 692.6 14.3 1,310.0 — 2,731.3
Quicksilver Resources Inc. — 29.3 43.5 310.7 — 383.6
Range Resources Corporation — 188.8 379.6 1,090.2 58.0 1,716.6
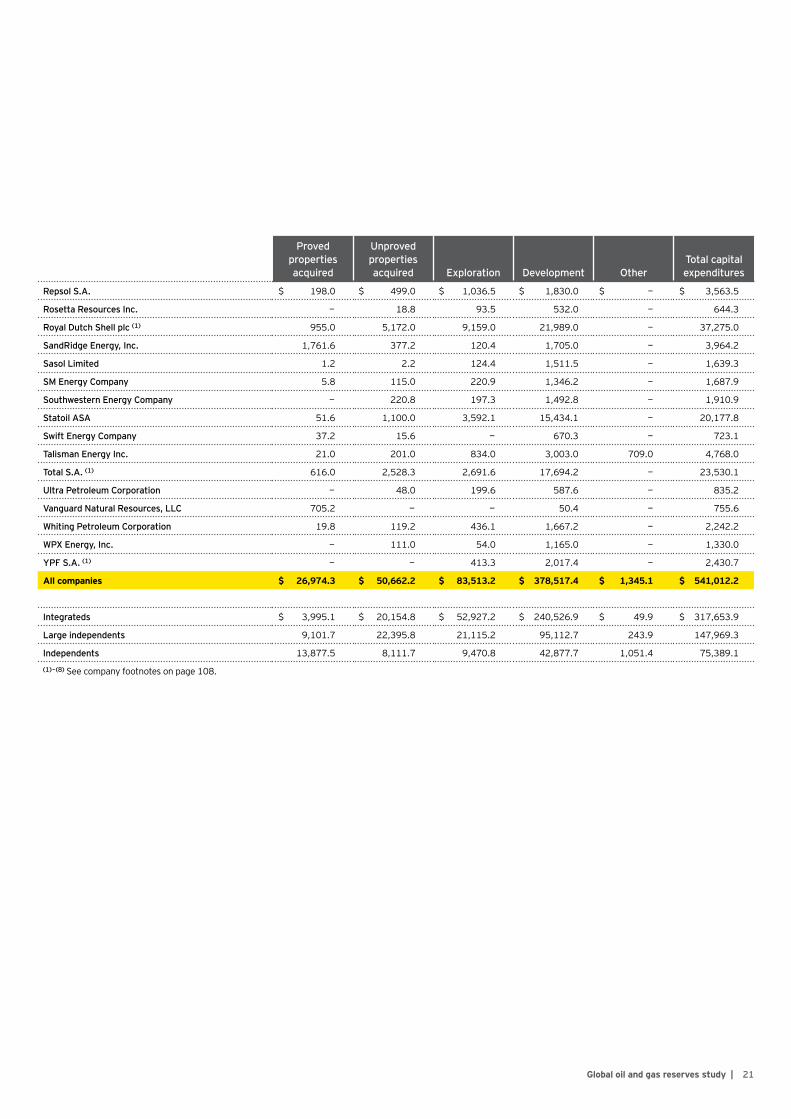
21Global oil and gas reserves study |
Proved propertiesacquired
Unproved propertiesacquired Exploration Development Other
Total capital expenditures
Repsol S.A. $ 198.0 $ 499.0 $ 1,036.5 $ 1,830.0 $ — $ 3,563.5
Rosetta Resources Inc. — 18.8 93.5 532.0 — 644.3
Royal Dutch Shell plc (1) 955.0 5,172.0 9,159.0 21,989.0 — 37,275.0
SandRidge Energy, Inc. 1,761.6 377.2 120.4 1,705.0 — 3,964.2
Sasol Limited 1.2 2.2 124.4 1,511.5 — 1,639.3
SM Energy Company 5.8 115.0 220.9 1,346.2 — 1,687.9
Southwestern Energy Company — 220.8 197.3 1,492.8 — 1,910.9
Statoil ASA 51.6 1,100.0 3,592.1 15,434.1 — 20,177.8
Swift Energy Company 37.2 15.6 — 670.3 — 723.1
Talisman Energy Inc. 21.0 201.0 834.0 3,003.0 709.0 4,768.0
Total S.A. (1) 616.0 2,528.3 2,691.6 17,694.2 — 23,530.1
Ultra Petroleum Corporation — 48.0 199.6 587.6 — 835.2
Vanguard Natural Resources, LLC 705.2 — — 50.4 — 755.6
Whiting Petroleum Corporation 19.8 119.2 436.1 1,667.2 — 2,242.2
WPX Energy, Inc. — 111.0 54.0 1,165.0 — 1,330.0
YPF S.A. (1) — — 413.3 2,017.4 — 2,430.7
All companies $ 26,974.3 $ 50,662.2 $ 83,513.2 $ 378,517.4 $ 1,345.1 $ 541,012.2
Integrateds $ 3,995.1 $ 20,154.8 $ 52,927.2 $ 240,526.9 $ 49.9 $ 317,653.9
Large independents 9,101.7 22,395.8 21,115.2 95,112.7 243.9 147,969.3
Independents 13,877.5 8,111.7 9,470.8 42,877.7 1,051.4 75,389.1
(1) – (8) See company footnotes on page 108.

22 | Global oil and gas reserves study
Millions
Worldwide — revenues and results of operations for the latest fiscal year (a)
RevenuesProduction
costs (b)Exploration
expense DD&A (c)
Other (income)
expense (d) Income taxesResults of operations
Anadarko Petroleum Corporation (4) $ 12,396.0 $ 3,445.0 $ 1,946.0 $ 4,074.0 $ — $ 912.3 $ 2,018.7
Antero Resources LLC 390.4 185.5 15.3 194.7 — (2.0) (3.2)
Apache Corporation 16,947.0 4,088.0 — 7,011.0 232.0 2,810.0 2,806.0
Berry Petroleum Company 872.6 311.6 20.9 226.0 — 106.6 207.6
BG Group plc 11,444.0 1,748.0 684.0 2,177.0 1,579.0 2,876.0 2,380.0
BHP Billiton Group 12,707.0 3,430.0 735.0 5,889.0 — 1,121.0 1,532.0
Bill Barrett Corporation 773.4 204.8 8.8 394.7 — 121.8 43.3
BP p.l.c. (1) (3) (6) 65,634.0 28,202.0 1,600.0 13,313.0 (2,592.0) 8,967.0 16,144.0
Cabot Oil & Gas Corporation 1,161.6 310.4 37.5 451.4 — 161.6 200.7
Canadian Natural Resources Limited 12,024.8 4,739.9 — 4,322.7 151.1 733.3 2,077.8
Chesapeake Energy Corporation 6,278.0 1,492.0 — 5,822.0 — (404.0) (632.0)
Chevron Corporation (1) 72,779.0 15,979.0 1,710.0 11,703.0 (2,110.0) 21,658.0 23,839.0
China Petroleum & Chemical Corporation (Sinopec)
36,059.8 13,828.4 2,461.8 6,385.4 — 3,637.8 9,746.3
Cimarex Energy Co. 1,581.7 402.9 — 484.5 13.0 251.2 430.0
CNOOC Limited (1) 31,388.5 10,542.8 1,444.3 5,436.2 219.5 4,025.3 9,720.4
Concho Resources Inc. 1,692.4 343.7 39.8 575.1 4.2 277.8 451.7
ConocoPhillips (1) 39,515.0 12,545.0 1,511.0 8,008.0 963.0 8,354.0 8,134.0
CONSOL Energy, Inc. 709.8 337.9 — 203.0 39.0 49.6 80.4
Continental Resources, Inc. 2,379.4 423.9 23.5 805.5 — 428.1 698.5
Denbury Resources Inc. 2,414.7 682.3 — 490.5 52.8 457.8 731.3

23Global oil and gas reserves study |
RevenuesProduction
costs (b)Exploration
expense DD&A (c)
Other (income)
expense (d) Income taxesResults of operations
Devon Energy Corporation $ 7,153.0 $ 2,765.0 $ — $ 4,482.0 $ 109.0 $ (96.0) $ (107.0)
Ecopetrol S.A. 23,627.7 3,742.2 774.4 1,871.4 3,615.3 4,483.8 9,140.6
Encana Corporation 6,125.0 2,094.0 — 6,514.0 — (814.0) (1,669.0)
Energen Corporation 1,167.2 306.4 19.4 394.7 7.5 157.7 281.6
Eni SpA (1) 43,764.1 6,572.8 2,388.1 8,684.4 2,228.7 14,540.9 9,349.3
EOG Resources, Inc. 7,999.5 2,070.1 200.5 4,295.2 — 722.9 710.8
EP Energy LLC (1) 1,709.0 508.0 52.0 660.0 — 43.0 446.0
EQT Corporation 793.8 96.2 10.4 409.6 — 109.7 168.0
EXCO Resources, Inc. 612.7 207.5 — 1,649.9 3.9 — (1,248.5)
Exxon Mobil Corporation (1) 106,545.0 32,605.0 1,866.0 13,201.0 — 31,810.0 27,063.0
Forest Oil Corporation 605.5 156.9 — 1,347.8 6.5 173.4 (1,079.2)
Hess Corporation 10,893.0 3,066.0 1,070.0 3,435.0 — 1,664.0 1,658.0
Husky Energy Inc. 5,633.3 1,829.7 350.1 2,104.8 — 390.2 958.4
INPEX CORPORATION (7) 14,625.9 5,006.3 148.7 277.2 — 6,435.6 2,758.1
Laredo Petroleum Holdings, Inc. 583.6 105.0 — 237.1 1.2 83.7 156.6
Linn Energy, LLC 1,725.9 525.0 1.9 1,001.9 (1.4) — 198.5
Marathon Oil Corporation (6) 12,400.0 2,845.0 729.0 2,759.0 — 4,587.0 1,480.0
Mitsui & Co., Ltd. (1) 4,505.6 763.8 249.5 1,002.5 — 1,167.9 1,321.9
Murphy Oil Corporation 4,608.1 1,234.4 251.1 1,574.2 38.4 605.0 905.0
National Fuel Gas Company 488.6 107.0 — 182.8 3.1 81.9 113.8

24 | Global oil and gas reserves study
Worldwide — revenues and results of operations for the latest fiscal year (a)
RevenuesProduction
costs (b)Exploration
expense DD&A (c)
Other (income)
expense (d) Income taxesResults of operations
Newfield Exploration Company $ 2,560.0 $ 851.0 $ — $ 2,415.0 $ — $ (239.0) $ (467.0)
Nexen Inc. 6,386.6 1,474.6 429.2 1,895.8 400.2 1,746.6 440.3
Noble Energy, Inc. 4,244.0 780.0 438.0 1,474.0 — 524.0 1,028.0
OAO LUKOIL (1) 44,848.0 29,197.0 370.0 3,170.0 — 2,469.0 9,642.0
OAO NOVATEK 5,944.1 2,641.1 65.1 340.9 — 579.4 2,317.7
Occidental Petroleum Corporation 18,950.0 4,856.0 345.0 5,664.0 990.0 2,919.0 4,176.0
OJSC Rosneft Oil Company 39,084.7 20,572.6 740.5 6,181.4 128.8 2,736.6 8,724.8
OMV Aktiengesellschaft 7,599.1 1,885.3 515.9 1,414.7 128.0 1,569.6 2,085.6
PDC Energy, Inc. 307.1 77.5 22.6 309.2 4.1 (40.4) (65.9)
Pengrowth Energy Corporation 1,203.3 483.6 — 645.9 20.4 88.6 (35.1)
Penn West Petroleum Ltd. 2,872.1 1,048.4 — 1,525.6 — 77.5 220.6
PetroChina Company Limited 97,841.9 37,404.1 3,799.3 14,975.6 671.5 8,180.1 32,811.2
Petrohawk Energy Corporation — — — — — — —
Petroleo Brasileiro, S.A. (Petrobras) (1) 80,270.0 28,826.0 3,974.0 7,502.0 1,932.0 13,183.0 24,853.0
Petroleos Mexicanos (PEMEX) 101,342.8 9,271.5 1,962.7 9,300.5 2,343.3 68,263.7 10,201.1
Pioneer Natural Resources Company 3,141.9 823.4 206.3 1,342.8 9.9 250.5 509.1
Plains Exploration & Production Company (1)
2,679.7 681.3 40.3 1,152.0 (0.4) 312.5 493.9
QEP Resources, Inc. 1,393.4 501.1 11.2 971.4 — (33.6) (56.7)
Quicksilver Resources Inc. 630.9 287.0 — 2,759.0 — (799.3) (1,615.7)
Range Resources Corporation 1,393.1 375.5 69.8 606.1 — 164.4 177.4
Millions
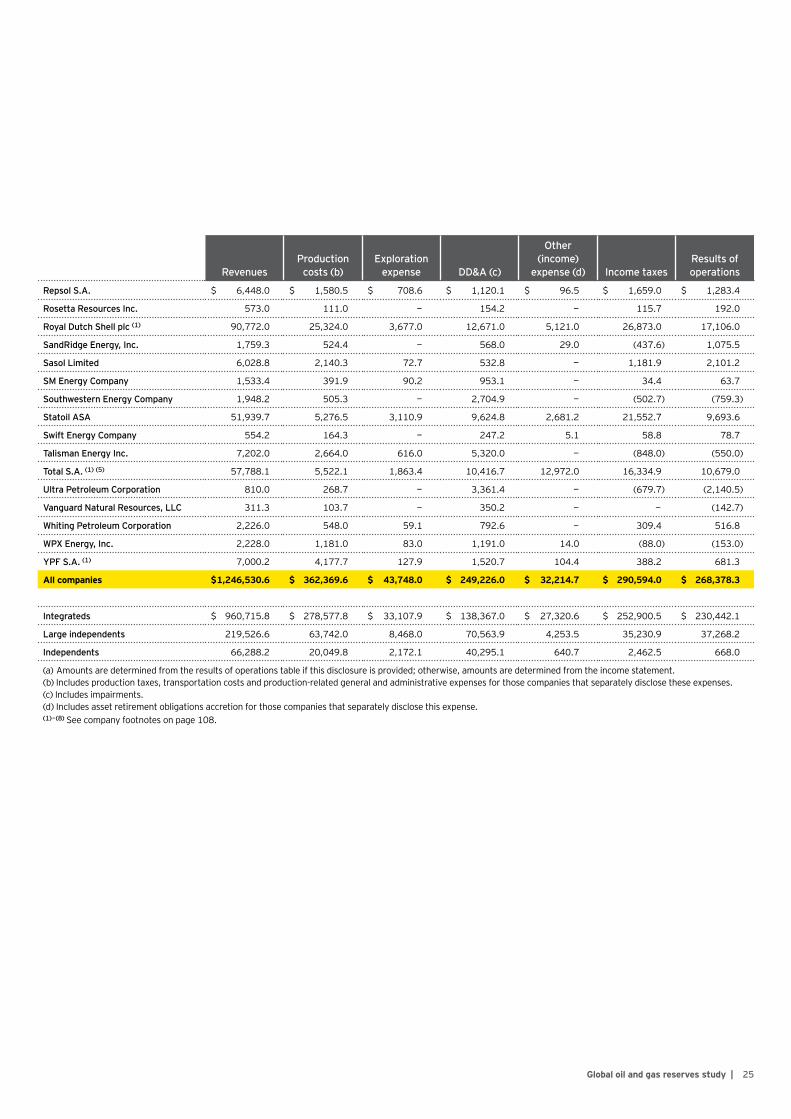
25Global oil and gas reserves study |
RevenuesProduction
costs (b)Exploration
expense DD&A (c)
Other (income)
expense (d) Income taxesResults of operations
Repsol S.A. $ 6,448.0 $ 1,580.5 $ 708.6 $ 1,120.1 $ 96.5 $ 1,659.0 $ 1,283.4
Rosetta Resources Inc. 573.0 111.0 — 154.2 — 115.7 192.0
Royal Dutch Shell plc (1) 90,772.0 25,324.0 3,677.0 12,671.0 5,121.0 26,873.0 17,106.0
SandRidge Energy, Inc. 1,759.3 524.4 — 568.0 29.0 (437.6) 1,075.5
Sasol Limited 6,028.8 2,140.3 72.7 532.8 — 1,181.9 2,101.2
SM Energy Company 1,533.4 391.9 90.2 953.1 — 34.4 63.7
Southwestern Energy Company 1,948.2 505.3 — 2,704.9 — (502.7) (759.3)
Statoil ASA 51,939.7 5,276.5 3,110.9 9,624.8 2,681.2 21,552.7 9,693.6
Swift Energy Company 554.2 164.3 — 247.2 5.1 58.8 78.7
Talisman Energy Inc. 7,202.0 2,664.0 616.0 5,320.0 — (848.0) (550.0)
Total S.A. (1) (5) 57,788.1 5,522.1 1,863.4 10,416.7 12,972.0 16,334.9 10,679.0
Ultra Petroleum Corporation 810.0 268.7 — 3,361.4 — (679.7) (2,140.5)
Vanguard Natural Resources, LLC 311.3 103.7 — 350.2 — — (142.7)
Whiting Petroleum Corporation 2,226.0 548.0 59.1 792.6 — 309.4 516.8
WPX Energy, Inc. 2,228.0 1,181.0 83.0 1,191.0 14.0 (88.0) (153.0)
YPF S.A. (1) 7,000.2 4,177.7 127.9 1,520.7 104.4 388.2 681.3
All companies $ 1,246,530.6 $ 362,369.6 $ 43,748.0 $ 249,226.0 $ 32,214.7 $ 290,594.0 $ 268,378.3
Integrateds $ 960,715.8 $ 278,577.8 $ 33,107.9 $ 138,367.0 $ 27,320.6 $ 252,900.5 $ 230,442.1
Large independents 219,526.6 63,742.0 8,468.0 70,563.9 4,253.5 35,230.9 37,268.2
Independents 66,288.2 20,049.8 2,172.1 40,295.1 640.7 2,462.5 668.0
(a) Amounts are determined from the results of operations table if this disclosure is provided; otherwise, amounts are determined from the income statement. (b) Includes production taxes, transportation costs and production-related general and administrative expenses for those companies that separately disclose these expenses.(c) Includes impairments.(d) Includes asset retirement obligations accretion for those companies that separately disclose this expense.(1) – (8) See company footnotes on page 108.

26 | Global oil and gas reserves study
Worldwide — oil reserves for the latest fiscal year (a)
Million barrels
Beginning
Extensions and
discoveriesImproved recovery Revisions Production Purchases Sales Other (b) Ending
Ending rank
Anadarko Petroleum Corporation
1,145.0 12.0 — 178.0 (115.0) — (48.0) — 1,172.0 23
Antero Resources LLC 181.0 118.0 — 4.0 — — (97.0) — 206.0 54
Apache Corporation 1,369.5 227.4 — (29.7) (145.1) 19.0 (0.1) — 1,441.0 19
Berry Petroleum Company 185.9 8.5 — 12.1 (10.0) 8.3 (0.6) — 204.2 55
BG Group plc 1,105.4 237.2 — 120.4 (63.3) — 0.8 — 1,400.5 20
BHP Billiton Group 583.1 13.8 34.1 184.3 (85.3) 73.9 — — 803.9 28
Bill Barrett Corporation 30.6 17.3 — 6.6 (2.7) 0.3 (1.3) — 50.8 68
BP p.l.c. (1) 10,565.0 93.0 229.0 114.0 (749.0) 25.0 (227.0) — 10,050.0 7
Cabot Oil & Gas Corporation 20.5 9.6 — (3.1) (2.4) — (0.2) — 24.4 70
Canadian Natural Resources Limited
3,403.0 95.0 35.0 271.0 (143.0) 2.0 — — 3,663.0 12
Chesapeake Energy Corporation
545.5 513.4 — (114.8) (48.9) 4.8 (107.2) — 792.8 29
Chevron Corporation (1) 6,455.0 218.0 77.0 390.0 (646.0) 10.0 (23.0) — 6,481.0 8
China Petroleum & Chemical Corporation (Sinopec)
2,848.0 151.0 163.0 9.0 (328.0) — — — 2,843.0 14
Cimarex Energy Co. 138.1 64.1 — (7.6) (18.5) 0.0 (8.4) — 167.8 57
CNOOC Limited (1) 2,165.0 364.0 — 124.0 (270.0) — — — 2,383.0 15
Concho Resources Inc. 238.3 60.4 — (15.9) (18.0) 30.3 (21.5) — 273.5 48
ConocoPhillips (1) 4,901.0 600.0 16.0 229.0 (318.0) 1.0 (56.0) — 5,373.0 11
CONSOL Energy, Inc. — — — — — — — — — —
Continental Resources, Inc. 326.1 166.8 — 33.3 (25.1) 67.1 (7.2) — 561.2 35
Denbury Resources Inc. 357.7 14.9 69.5 (7.5) (24.5) 24.7 (105.8) — 329.1 44

27Global oil and gas reserves study |
Beginning
Extensions and
discoveriesImproved recovery Revisions Production Purchases Sales Other (b) Ending
Ending rank
Devon Energy Corporation 1,257.0 255.0 — (30.0) (93.0) — — — 1,389.0 21
Ecopetrol S.A. 1,371.0 90.4 65.3 42.7 (199.2) — — — 1,370.2 22
Encana Corporation 133.2 65.1 — 28.9 (11.3) 0.1 (6.0) — 210.0 53
Energen Corporation 183.5 46.9 — (18.1) (11.3) 10.5 — — 211.5 52
Eni SpA (1) 3,434.0 90.0 28.0 182.0 (323.0) — (61.0) — 3,350.0 13
EOG Resources, Inc. 745.3 327.3 — 49.5 (78.3) 1.6 (24.6) — 1,020.8 25
EP Energy LLC (1) 200.8 122.8 — (6.7) (12.2) 0.0 (3.9) — 300.8 45
EQT Corporation 2.9 0.3 — 0.3 (0.3) — — — 3.2 73
EXCO Resources, Inc. 6.4 0.9 — 6.2 (1.2) — — — 12.2 72
Exxon Mobil Corporation (1) 12,228.0 760.0 23.0 471.0 (799.0) 219.0 (86.0) — 12,816.0 3
Forest Oil Corporation 76.0 23.5 — (12.2) (6.6) — (5.8) — 75.0 65
Hess Corporation 1,169.0 144.0 7.0 12.0 (110.0) — (51.0) — 1,171.0 24
Husky Energy Inc. 658.0 43.0 16.0 28.0 (68.0) — (1.0) — 676.0 32
INPEX CORPORATION (7) 714.0 190.0 — (8.0) (64.0) — (2.0) 1.0 831.0 26
Laredo Petroleum Holdings, Inc. 56.3 57.4 — (12.4) (4.8) 1.7 — — 98.1 62
Linn Energy, LLC 282.5 50.3 — (40.6) (19.7) 98.4 — — 370.9 39
Marathon Oil Corporation 1,356.0 179.0 2.0 83.0 (118.0) 52.0 — — 1,554.0 18
Mitsui & Co., Ltd. (1) 99.0 1.0 — 18.0 (24.0) 9.0 (3.0) — 100.0 61
Murphy Oil Corporation 349.7 84.0 7.2 2.6 (41.2) 12.5 — — 414.8 38
National Fuel Gas Company 43.3 1.3 — 1.1 (2.9) — — — 42.9 69
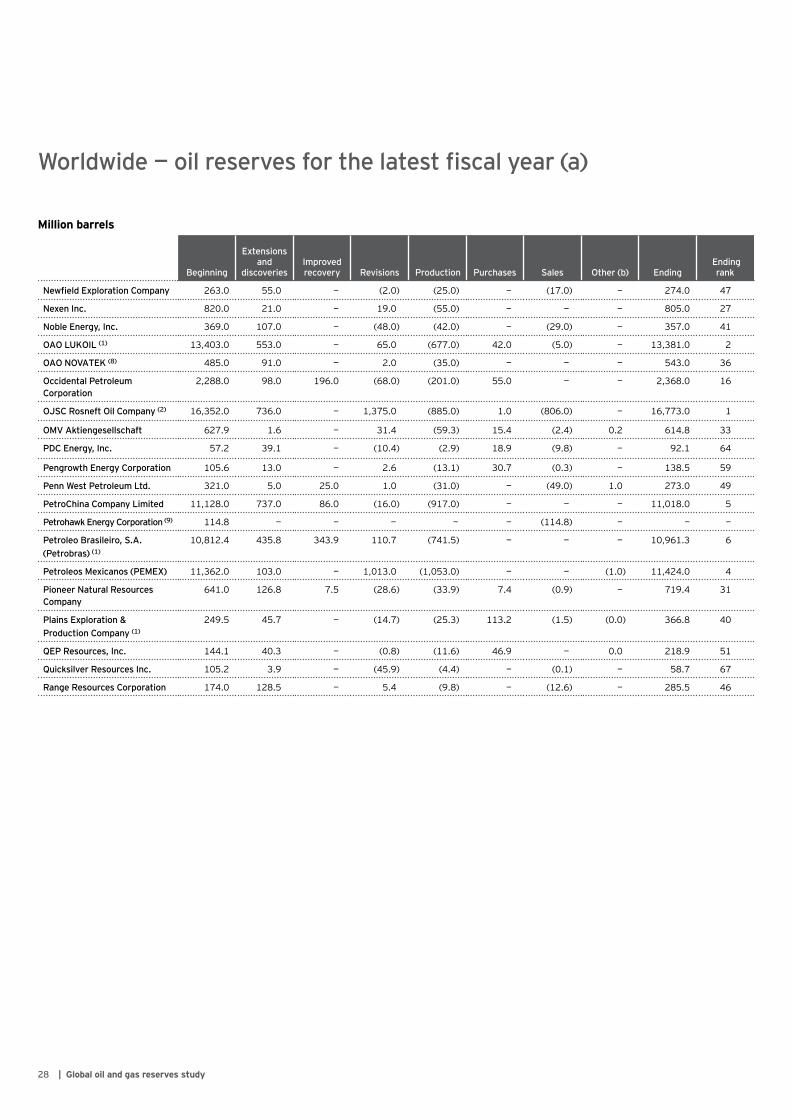
28 | Global oil and gas reserves study
Worldwide — oil reserves for the latest fiscal year (a)
Million barrels
Beginning
Extensions and
discoveriesImproved recovery Revisions Production Purchases Sales Other (b) Ending
Ending rank
Newfield Exploration Company 263.0 55.0 — (2.0) (25.0) — (17.0) — 274.0 47
Nexen Inc. 820.0 21.0 — 19.0 (55.0) — — — 805.0 27
Noble Energy, Inc. 369.0 107.0 — (48.0) (42.0) — (29.0) — 357.0 41
OAO LUKOIL (1) 13,403.0 553.0 — 65.0 (677.0) 42.0 (5.0) — 13,381.0 2
OAO NOVATEK (8) 485.0 91.0 — 2.0 (35.0) — — — 543.0 36
Occidental Petroleum Corporation
2,288.0 98.0 196.0 (68.0) (201.0) 55.0 — — 2,368.0 16
OJSC Rosneft Oil Company (2) 16,352.0 736.0 — 1,375.0 (885.0) 1.0 (806.0) — 16,773.0 1
OMV Aktiengesellschaft 627.9 1.6 — 31.4 (59.3) 15.4 (2.4) 0.2 614.8 33
PDC Energy, Inc. 57.2 39.1 — (10.4) (2.9) 18.9 (9.8) — 92.1 64
Pengrowth Energy Corporation 105.6 13.0 — 2.6 (13.1) 30.7 (0.3) — 138.5 59
Penn West Petroleum Ltd. 321.0 5.0 25.0 1.0 (31.0) — (49.0) 1.0 273.0 49
PetroChina Company Limited 11,128.0 737.0 86.0 (16.0) (917.0) — — — 11,018.0 5
Petrohawk Energy Corporation (9) 114.8 — — — — — (114.8) — — —
Petroleo Brasileiro, S.A. (Petrobras) (1)
10,812.4 435.8 343.9 110.7 (741.5) — — — 10,961.3 6
Petroleos Mexicanos (PEMEX) 11,362.0 103.0 — 1,013.0 (1,053.0) — — (1.0) 11,424.0 4
Pioneer Natural Resources Company
641.0 126.8 7.5 (28.6) (33.9) 7.4 (0.9) — 719.4 31
Plains Exploration & Production Company (1)
249.5 45.7 — (14.7) (25.3) 113.2 (1.5) (0.0) 366.8 40
QEP Resources, Inc. 144.1 40.3 — (0.8) (11.6) 46.9 — 0.0 218.9 51
Quicksilver Resources Inc. 105.2 3.9 — (45.9) (4.4) — (0.1) — 58.7 67
Range Resources Corporation 174.0 128.5 — 5.4 (9.8) — (12.6) — 285.5 46

29Global oil and gas reserves study |
Beginning
Extensions and
discoveriesImproved recovery Revisions Production Purchases Sales Other (b) Ending
Ending rank
Repsol S.A. 978.0 33.0 — 39.0 (52.0) 24.0 (595.0) 2.0 429.0 37
Rosetta Resources Inc. 86.6 39.2 — (0.0) (8.0) 0.2 (2.0) — 116.0 60
Royal Dutch Shell plc (1) 6,048.0 88.0 13.0 629.0 (598.0) 82.0 (66.0) — 6,196.0 9
SandRidge Energy, Inc. 244.8 116.9 — (22.3) (18.0) 32.2 (23.6) — 330.0 43
Sasol Limited 815.6 — 0.8 11.4 (44.2) — — 0.5 784.1 30
SM Energy Company 99.2 47.7 31.9 (6.9) (16.5) 0.1 (1.0) — 154.5 58
Southwestern Energy Company 1.0 0.2 — (0.0) (0.1) — (0.8) — 0.2 74
Statoil ASA 2,181.0 266.0 — 225.0 (350.0) 1.0 (18.0) — 2,305.0 17
Swift Energy Company 56.8 24.7 — 16.6 (5.6) — — — 92.5 63
Talisman Energy Inc. 451.1 9.6 — (20.3) (48.8) 1.1 (130.1) — 262.6 50
Total S.A. (1) 5,784.0 283.0 — 125.0 (446.0) 18.0 (79.0) — 5,685.0 10
Ultra Petroleum Corporation 33.1 5.4 — (19.1) (1.3) — — — 18.1 71
Vanguard Natural Resources, LLC
52.2 0.5 — (2.5) (3.4) 14.9 (0.5) — 61.2 66
Whiting Petroleum Corporation 297.8 74.7 — 3.2 (25.9) — (8.3) — 341.4 42
WPX Energy, Inc. 193.2 39.5 — (16.6) (16.4) — (1.3) — 198.4 56
YPF S.A. (1) (10) — 18.0 6.0 82.0 (101.0) — — 586.0 591.0 34
All companies 148,074.7 9,903.6 1,482.2 5,728.5 (11,558.6) 1,175.0 (2,920.5) 589.7 152,474.7
Integrateds 118,145.9 4,892.8 1,042.0 4,931.2 (9,137.2) 446.4 (2,022.4) 587.7 118,886.4
Large independents 22,898.0 3,539.7 290.6 946.7 (1,840.2) 216.9 (285.7) 1.0 25,767.1
Independents 7,030.8 1,471.1 149.6 (149.4) (581.3) 511.8 (612.5) 1.0 7,821.2
(a) Includes condensate, natural gas liquids, synthetic crude and bitumen. (b) Includes transfers, reclassifications and other.(1) – (8) See company footnotes on page 108.

30 | Global oil and gas reserves study
Worldwide — gas reserves for the latest fiscal year
Bcf
Beginning
Extensions and
discoveriesImproved recovery Revisions Production Purchases Sales Other (a) Ending
Ending rank
Anadarko Petroleum Corporation
8,365.0 418.0 — 635.0 (916.0) 26.0 (199.0) — 8,329.0 20
Antero Resources LLC 3,931.0 1,242.0 — 198.0 (87.0) — (1,590.0) — 3,694.0 33
Apache Corporation 9,722.3 869.9 — (1,614.2) (839.4) 326.6 (1.0) — 8,464.2 19
Berry Petroleum Company 534.3 100.1 — (205.8) (19.8) 16.7 — — 425.5 72
BG Group plc 12,854.0 958.0 — (544.0) (1,063.0) — (22.0) — 12,183.0 13
BHP Billiton Group 7,503.5 134.9 3.3 447.3 (857.1) 3,297.3 — — 10,529.2 16
Bill Barrett Corporation 1,181.1 83.4 — (212.7) (101.5) 0.3 (211.5) — 739.1 62
BP p.l.c. (1) 41,659.0 2,144.0 2,072.0 (1,212.0) (2,887.0) 248.0 (1,719.0) — 40,305.0 4
Cabot Oil & Gas Corporation 2,909.9 869.0 — 207.0 (253.0) — (37.0) 0.1 3,696.0 32
Canadian Natural Resources Limited
3,650.0 50.0 11.0 (530.0) (436.0) 34.0 (1.0) — 2,778.0 40
Chesapeake Energy Corporation
15,515.0 3,317.0 — (6,080.0) (1,129.0) 14.0 (704.0) — 10,933.0 15
Chevron Corporation (1) 28,683.0 1,011.0 8.0 1,855.0 (1,857.0) 33.0 (538.0) — 29,195.0 7
China Petroleum & Chemical Corporation (Sinopec)
6,709.0 232.0 109.0 278.0 (598.0) — — — 6,730.0 22
Cimarex Energy Co. 1,216.4 372.5 — (211.4) (118.5) 0.1 (7.2) — 1,251.9 53
CNOOC Limited (1) 6,049.0 1,087.0 — (211.0) (406.0) — — — 6,519.0 23
Concho Resources Inc. 889.3 189.4 — (40.5) (70.6) 157.3 (82.8) — 1,042.1 56
ConocoPhillips (1) 20,916.0 908.0 27.0 (349.0) (1,722.0) 11.0 (177.0) — 19,614.0 10
CONSOL Energy, Inc. 3,480.0 954.4 — (284.6) (156.3) — — — 3,993.5 31
Continental Resources, Inc. 1,093.8 400.8 — (174.7) (63.9) 89.1 (4.0) — 1,341.1 52
Denbury Resources Inc. 625.2 10.0 — (54.7) (10.7) 20.6 (108.8) — 481.6 71

31Global oil and gas reserves study |
Beginning
Extensions and
discoveriesImproved recovery Revisions Production Purchases Sales Other (a) Ending
Ending rank
Devon Energy Corporation 10,486.0 1,158.0 — (1,250.0) (938.0) 2.0 (12.0) — 9,446.0 17
Ecopetrol S.A. 2,768.4 298.6 — 8.8 (189.3) — — — 2,886.5 37
Encana Corporation 12,840.0 976.0 — (3,198.0) (1,090.0) 46.0 (782.0) — 8,792.0 18
Energen Corporation 957.4 61.2 — (143.7) (76.4) 10.7 — — 809.1 61
Eni SpA (1) 20,282.0 1,422.0 — 1,946.0 (1,649.0) — (1,044.0) — 20,957.0 9
EOG Resources, Inc. 7,850.9 478.1 — (2,653.0) (556.6) 14.8 (394.7) — 4,739.5 29
EP Energy LLC (1) 2,782.0 144.0 — (660.0) (249.0) — (72.0) — 1,945.0 46
EQT Corporation 5,347.4 1,654.2 — (755.8) (259.4) — (0.7) — 5,985.8 24
EXCO Resources, Inc. 1,291.5 96.6 — (266.5) (182.7) — (2.8) — 936.1 58
Exxon Mobil Corporation (1) 76,222.0 4,383.0 — (1,873.0) (4,797.0) 509.0 (353.0) — 74,091.0 1
Forest Oil Corporation 1,448.3 93.6 — (530.7) (81.0) — (17.3) — 912.8 59
Hess Corporation 2,423.0 248.0 4.0 56.0 (244.0) — (192.0) — 2,295.0 43
Husky Energy Inc. 1,932.0 411.0 — (357.0) (190.0) — — — 1,796.0 47
INPEX CORPORATION (7) 1,981.0 5,364.0 — 327.0 (316.0) — — (2.0) 7,354.0 21
Laredo Petroleum Holdings, Inc. 601.1 232.4 — (260.7) (39.1) 9.2 — — 542.9 66
Linn Energy, LLC 1,675.0 407.0 — (559.0) (128.0) 1,176.0 — — 2,571.0 42
Marathon Oil Corporation 2,666.0 335.0 — (5.0) (322.0) 105.0 — — 2,779.0 39
Mitsui & Co., Ltd. (1) 1,563.0 147.0 — 77.0 (195.0) 30.0 — — 1,622.0 49
Murphy Oil Corporation 1,106.1 173.5 7.2 20.2 (179.4) 9.4 — — 1,137.0 54
National Fuel Gas Company 674.9 436.1 — (56.5) (66.1) — — — 988.4 57

32 | Global oil and gas reserves study
Worldwide — gas reserves for the latest fiscal year
Bcf
Beginning
Extensions and
discoveriesImproved recovery Revisions Production Purchases Sales Other (a) Ending
Ending rank
Newfield Exploration Company 2,333.0 181.0 — (527.0) (153.0) 1.0 (80.0) — 1,755.0 48
Nexen Inc. 482.0 1.0 — (146.0) (72.0) — (69.0) — 196.0 74
Noble Energy, Inc. 5,043.0 659.0 — (288.0) (284.0) — (166.0) — 4,964.0 26
OAO LUKOIL (1) 23,196.0 693.0 — 459.0 (845.0) 1.0 (17.0) — 23,487.0 8
OAO NOVATEK (8) 26,547.0 13,455.0 — 231.0 (1,781.0) — — — 38,452.0 5
Occidental Petroleum Corporation
5,323.0 803.0 362.0 (686.0) (470.0) 236.0 — — 5,568.0 25
OJSC Rosneft Oil Company (2) — — — — — — — — — —
OMV Aktiengesellschaft 2,796.5 70.6 — 54.3 (290.5) 174.8 (9.7) (0.1) 2,795.9 38
PDC Energy, Inc. 672.1 172.9 — (289.4) (32.4) 87.2 (6.4) — 604.0 63
Pengrowth Energy Corporation 501.4 3.1 — (69.8) (78.8) 156.7 (2.4) — 510.2 69
Penn West Petroleum Ltd. 630.0 15.0 11.0 (20.0) (101.0) — (9.0) — 526.0 67
PetroChina Company Limited 66,653.0 6,218.0 — (2,731.0) (2,559.0) — — — 67,581.0 2
Petrohawk Energy Corporation (9) 3,355.1 — — — — — (3,355.1) — — —
Petroleo Brasileiro, S.A. (Petrobras) (1)
12,424.7 295.4 (623.5) 371.0 (865.0) — — — 11,602.6 14
Petroleos Mexicanos (PEMEX) 12,734.0 162.0 — 1,377.0 (1,560.0) — — — 12,713.0 12
Pioneer Natural Resources Company
2,531.0 320.2 — (485.2) (161.2) 9.5 (16.8) — 2,197.5 45
Plains Exploration & Production Company (1)
1,049.4 83.5 — (591.4) (98.5) 79.4 (11.3) (0.2) 510.8 68
QEP Resources, Inc. 2,749.4 330.6 — (240.6) (249.3) 32.3 — — 2,622.4 41
Quicksilver Resources Inc. 2,159.5 25.9 — (944.3) (105.6) — (20.6) — 1,114.8 55
Range Resources Corporation 4,009.7 996.1 — 76.9 (216.6) — (73.4) — 4,792.7 28

33Global oil and gas reserves study |
Beginning
Extensions and
discoveriesImproved recovery Revisions Production Purchases Sales Other (a) Ending
Ending rank
Repsol S.A. 6,747.0 691.0 — 217.0 (392.0) — (2,405.0) 2.0 4,860.0 27
Rosetta Resources Inc. 446.0 158.8 — (10.1) (33.9) 0.7 (52.1) (0.0) 509.5 70
Royal Dutch Shell plc (1) 47,662.0 667.0 16.0 (1,343.0) (3,687.0) 161.0 (684.0) — 42,792.0 3
SandRidge Energy, Inc. 1,355.1 489.3 — (538.2) (93.5) 203.0 (0.5) — 1,415.0 51
Sasol Limited 1,576.3 — (0.8) 28.9 (98.1) — — — 1,506.3 50
SM Energy Company 664.0 297.4 125.1 (123.3) (120.0) 1.2 (11.0) — 833.4 60
Southwestern Energy Company 5,887.2 918.6 — (2,088.0) (564.5) — (136.5) — 4,016.8 30
Statoil ASA 17,680.0 631.0 — 765.0 (1,747.0) 18.0 (319.0) — 17,028.0 11
Swift Energy Company 616.8 114.5 — (97.3) (36.4) — — — 597.6 64
Talisman Energy Inc. 4,744.3 (438.5) — (69.1) (469.1) 1.9 (126.6) — 3,642.9 34
Total S.A. (1) 30,717.0 1,600.0 — 250.0 (2,158.0) 706.0 (238.0) — 30,877.0 6
Ultra Petroleum Corporation 4,778.6 819.9 — (2,382.7) (249.3) — — — 2,966.4 36
Vanguard Natural Resources, LLC
162.8 0.3 — (9.5) (19.7) 446.1 (33.5) — 546.5 65
Whiting Petroleum Corporation 285.0 40.9 — (61.8) (25.8) — (14.0) — 224.3 73
WPX Energy, Inc. 4,057.9 414.9 — (422.8) (415.6) 5.8 (217.0) — 3,423.2 35
YPF S.A. (1) (10) — 31.0 4.0 228.0 (442.0) — — 2,401.0 2,222.0 44
All companies 636,954.6 64,792.2 2,135.3 (28,344.7) (45,814.4) 8,507.6 (16,347.1) 2,400.8 624,284.3
Integrateds 429,042.9 34,399.6 1,588.7 1,043.0 (28,840.9) 1,880.8 (7,518.7) 2,402.9 433,998.3
Large independents 142,652.8 20,486.5 403.3 (17,163.0) (11,982.2) 4,122.2 (2,549.7) (2.0) 135,967.8
Independents 65,258.9 9,906.2 143.3 (12,224.7) (4,991.3) 2,504.6 (6,278.7) (0.1) 54,318.2
(a) Includes transfers, reclassifications and other.(1) – (8) See company footnotes on page 108.

34 | Global oil and gas reserves study
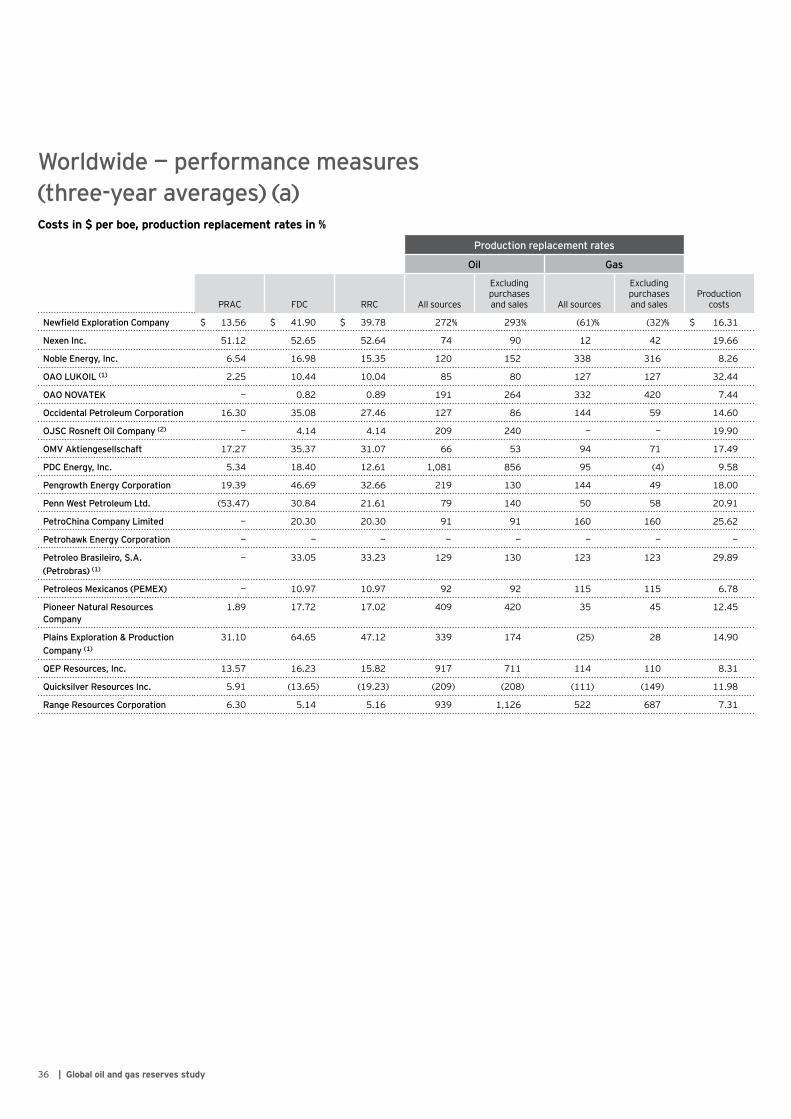
Worldwide — performance measures (three-year averages) (a)Costs in $ per boe, production replacement rates in %
Production replacement rates
Oil Gas
PRAC FDC RRC All sources
Excluding purchases and sales All sources
Excluding purchases and sales
Production costs
Anadarko Petroleum Corporation $ 4.00 $ 15.31 $ 15.26 151% 172% 122% 132% $ 13.50
Antero Resources LLC 4.23 2.83 2.88 18,718 27,355 1,287 1,920 10.67
Apache Corporation 16.99 49.36 31.28 192 115 128 32 13.43
Berry Petroleum Company 10.02 69.25 27.59 375 203 (205) (280) 20.80
BG Group plc 15.76 14.42 14.44 455 453 132 133 6.68
BHP Billiton Group 6.82 38.08 19.24 180 153 453 98 13.64
Bill Barrett Corporation 10.32 25.87 23.34 916 784 38 95 10.21
BP p.l.c. (1) 14.10 16.78 16.54 81 103 47 84 18.99
Cabot Oil & Gas Corporation 7.79 6.12 6.12 452 480 402 448 6.55
Canadian Natural Resources Limited
12.37 17.55 16.48 260 231 69 11 20.68
Chesapeake Energy Corporation 23.02 21.13 21.16 776 888 16 172 6.25
Chevron Corporation (1) 5.96 24.55 22.91 76 74 157 147 14.35
China Petroleum & Chemical Corporation (Sinopec)
— 30.57 30.57 92 92 99 99 29.29
Cimarex Energy Co. 6.23 15.97 15.74 326 344 118 172 10.90
CNOOC Limited (1) 6.92 25.20 19.89 190 137 146 93 25.82
Concho Resources Inc. 15.62 22.81 19.89 406 291 501 328 11.92
ConocoPhillips (1) 95.87 15.97 16.20 16 178 16 74 19.44
CONSOL Energy, Inc. 9.72 10.28 10.11 — — 576 481 12.88
Continental Resources, Inc. 9.60 13.09 12.61 827 711 772 702 11.83
Denbury Resources Inc. 12.08 21.49 15.70 299 264 888 283 25.31
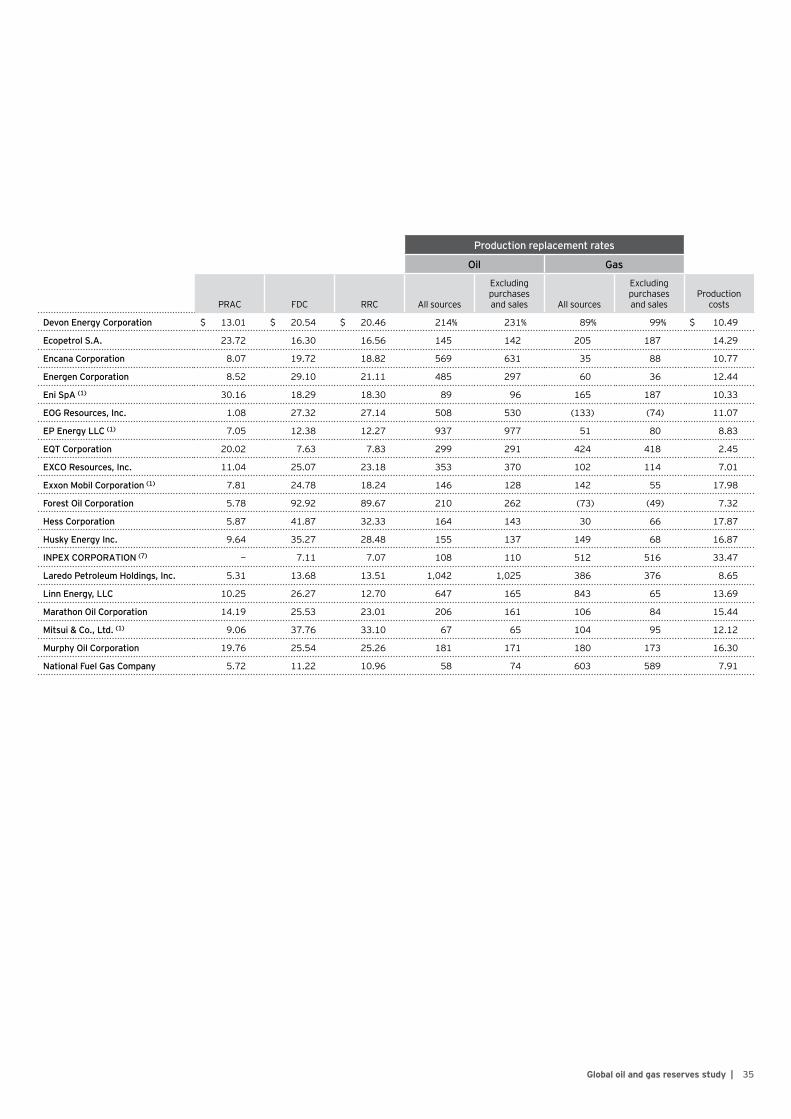
35Global oil and gas reserves study |
Production replacement rates
Oil Gas
PRAC FDC RRC All sources
Excluding purchases and sales All sources
Excluding purchases and sales
Production costs
Devon Energy Corporation $ 13.01 $ 20.54 $ 20.46 214% 231% 89% 99% $ 10.49
Ecopetrol S.A. 23.72 16.30 16.56 145 142 205 187 14.29
Encana Corporation 8.07 19.72 18.82 569 631 35 88 10.77
Energen Corporation 8.52 29.10 21.11 485 297 60 36 12.44
Eni SpA (1) 30.16 18.29 18.30 89 96 165 187 10.33
EOG Resources, Inc. 1.08 27.32 27.14 508 530 (133) (74) 11.07
EP Energy LLC (1) 7.05 12.38 12.27 937 977 51 80 8.83
EQT Corporation 20.02 7.63 7.83 299 291 424 418 2.45
EXCO Resources, Inc. 11.04 25.07 23.18 353 370 102 114 7.01
Exxon Mobil Corporation (1) 7.81 24.78 18.24 146 128 142 55 17.98
Forest Oil Corporation 5.78 92.92 89.67 210 262 (73) (49) 7.32
Hess Corporation 5.87 41.87 32.33 164 143 30 66 17.87
Husky Energy Inc. 9.64 35.27 28.48 155 137 149 68 16.87
INPEX CORPORATION (7) — 7.11 7.07 108 110 512 516 33.47
Laredo Petroleum Holdings, Inc. 5.31 13.68 13.51 1,042 1,025 386 376 8.65
Linn Energy, LLC 10.25 26.27 12.70 647 165 843 65 13.69
Marathon Oil Corporation 14.19 25.53 23.01 206 161 106 84 15.44
Mitsui & Co., Ltd. (1) 9.06 37.76 33.10 67 65 104 95 12.12
Murphy Oil Corporation 19.76 25.54 25.26 181 171 180 173 16.30
National Fuel Gas Company 5.72 11.22 10.96 58 74 603 589 7.91
36 | Global oil and gas reserves study
Worldwide — performance measures (three-year averages) (a)Costs in $ per boe, production replacement rates in %
Production replacement rates
Oil Gas
PRAC FDC RRC All sources
Excluding purchases and sales All sources
Excluding purchases and sales
Production costs
Newfield Exploration Company $ 13.56 $ 41.90 $ 39.78 272% 293% (61)% (32)% $ 16.31
Nexen Inc. 51.12 52.65 52.64 74 90 12 42 19.66
Noble Energy, Inc. 6.54 16.98 15.35 120 152 338 316 8.26
OAO LUKOIL (1) 2.25 10.44 10.04 85 80 127 127 32.44
OAO NOVATEK — 0.82 0.89 191 264 332 420 7.44
Occidental Petroleum Corporation 16.30 35.08 27.46 127 86 144 59 14.60
OJSC Rosneft Oil Company (2) — 4.14 4.14 209 240 — — 19.90
OMV Aktiengesellschaft 17.27 35.37 31.07 66 53 94 71 17.49
PDC Energy, Inc. 5.34 18.40 12.61 1,081 856 95 (4) 9.58
Pengrowth Energy Corporation 19.39 46.69 32.66 219 130 144 49 18.00
Penn West Petroleum Ltd. (53.47) 30.84 21.61 79 140 50 58 20.91
PetroChina Company Limited — 20.30 20.30 91 91 160 160 25.62
Petrohawk Energy Corporation — — — — — — — —
Petroleo Brasileiro, S.A. (Petrobras) (1)
— 33.05 33.23 129 130 123 123 29.89
Petroleos Mexicanos (PEMEX) — 10.97 10.97 92 92 115 115 6.78
Pioneer Natural Resources Company
1.89 17.72 17.02 409 420 35 45 12.45
Plains Exploration & Production Company (1)
31.10 64.65 47.12 339 174 (25) 28 14.90
QEP Resources, Inc. 13.57 16.23 15.82 917 711 114 110 8.31
Quicksilver Resources Inc. 5.91 (13.65) (19.23) (209) (208) (111) (149) 11.98
Range Resources Corporation 6.30 5.14 5.16 939 1,126 522 687 7.31

37Global oil and gas reserves study |
Production replacement rates
Oil Gas
PRAC FDC RRC All sources
Excluding purchases and sales All sources
Excluding purchases and sales
Production costs
Repsol S.A. $ 8.84 $ 13.03 $ 12.76 (30)% 124% 12% 131% $ 14.12
Rosetta Resources Inc. 8.76 6.96 6.99 846 857 301 470 7.64
Royal Dutch Shell plc (1) 7.94 26.71 25.62 128 129 42 55 18.41
SandRidge Energy, Inc. 20.70 12.71 14.85 704 601 407 487 15.06
Sasol Limited 12.99 4.14 4.24 652 652 45 21 33.58
SM Energy Company 19.31 14.67 14.67 392 457 231 252 10.54
Southwestern Energy Company 7.85 16.42 16.42 (132) 91 125 141 5.52
Statoil ASA 10.27 29.78 28.15 122 118 76 77 8.63
Swift Energy Company — 12.79 13.81 276 309 449 523 14.71
Talisman Energy Inc. 23.52 48.11 45.15 (31) 48 47 114 18.52
Total S.A. (1) (5) 3.88 32.92 19.38 100 56 171 103 6.18
Ultra Petroleum Corporation — (195.38) (195.38) (175) (175) (11) (11) 6.67
Vanguard Natural Resources, LLC 12.34 88.28 12.92 785 55 1,422 (51) 16.61
Whiting Petroleum Corporation 38.91 25.93 26.01 280 294 (4) 22 17.37
WPX Energy, Inc. 14.30 20.69 20.02 386 338 41 56 13.47
YPF S.A. (1) — 16.22 16.22 105 105 60 60 23.92
All companies $ 9.57 $ 18.75 $ 17.50 135% 138% 115% 123% $ 17.04
Integrateds $ 7.32 $ 18.18 $ 16.99 115% 118% 123% 118% $ 17.83
Large independents 11.39 19.71 18.34 180 202 79 119 15.33
Independents 12.72 20.14 18.50 287 270 139 166 13.52
(a) Performance measures are based on less than three years of results for companies that have had operations for less than three years. (1) – (8) See company footnotes on page 108.

38 | Global oil and gas reserves study

39Global oil and gas reserves study |
Summary of 2012 study results
40 | Global oil and gas reserves study
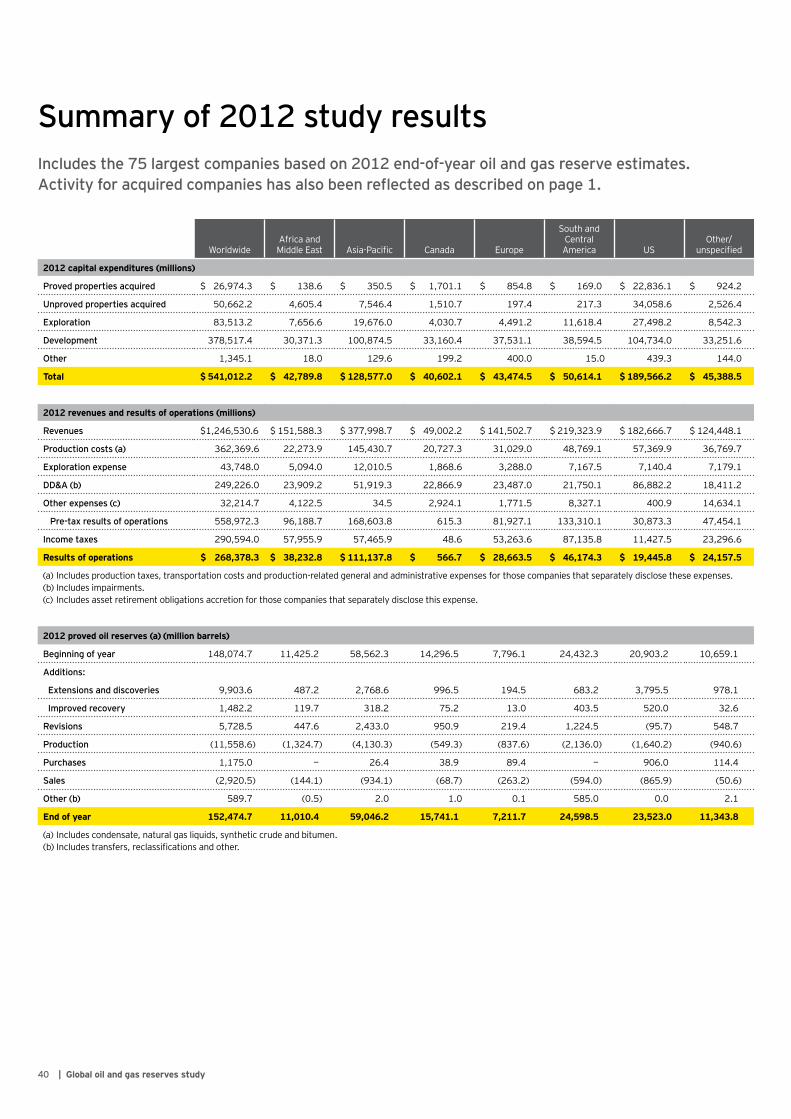
Summary of 2012 study resultsIncludes the 75 largest companies based on 2012 end-of-year oil and gas reserve estimates. Activity for acquired companies has also been reflected as described on page 1.
WorldwideAfrica and Middle East Asia-Pacific Canada Europe
South and Central America US
Other/unspecified
2012 capital expenditures (millions)
Proved properties acquired $ 26,974.3 $ 138.6 $ 350.5 $ 1,701.1 $ 854.8 $ 169.0 $ 22,836.1 $ 924.2
Unproved properties acquired 50,662.2 4,605.4 7,546.4 1,510.7 197.4 217.3 34,058.6 2,526.4
Exploration 83,513.2 7,656.6 19,676.0 4,030.7 4,491.2 11,618.4 27,498.2 8,542.3
Development 378,517.4 30,371.3 100,874.5 33,160.4 37,531.1 38,594.5 104,734.0 33,251.6
Other 1,345.1 18.0 129.6 199.2 400.0 15.0 439.3 144.0
Total $ 541,012.2 $ 42,789.8 $ 128,577.0 $ 40,602.1 $ 43,474.5 $ 50,614.1 $ 189,566.2 $ 45,388.5
2012 revenues and results of operations (millions)
Revenues $ 1,246,530.6 $ 151,588.3 $ 377,998.7 $ 49,002.2 $ 141,502.7 $ 219,323.9 $ 182,666.7 $ 124,448.1
Production costs (a) 362,369.6 22,273.9 145,430.7 20,727.3 31,029.0 48,769.1 57,369.9 36,769.7
Exploration expense 43,748.0 5,094.0 12,010.5 1,868.6 3,288.0 7,167.5 7,140.4 7,179.1
DD&A (b) 249,226.0 23,909.2 51,919.3 22,866.9 23,487.0 21,750.1 86,882.2 18,411.2
Other expenses (c) 32,214.7 4,122.5 34.5 2,924.1 1,771.5 8,327.1 400.9 14,634.1
Pre-tax results of operations 558,972.3 96,188.7 168,603.8 615.3 81,927.1 133,310.1 30,873.3 47,454.1
Income taxes 290,594.0 57,955.9 57,465.9 48.6 53,263.6 87,135.8 11,427.5 23,296.6
Results of operations $ 268,378.3 $ 38,232.8 $ 111,137.8 $ 566.7 $ 28,663.5 $ 46,174.3 $ 19,445.8 $ 24,157.5
(a) Includes production taxes, transportation costs and production-related general and administrative expenses for those companies that separately disclose these expenses.(b) Includes impairments.(c) Includes asset retirement obligations accretion for those companies that separately disclose this expense.
2012 proved oil reserves (a) (million barrels)
Beginning of year 148,074.7 11,425.2 58,562.3 14,296.5 7,796.1 24,432.3 20,903.2 10,659.1
Additions:
Extensions and discoveries 9,903.6 487.2 2,768.6 996.5 194.5 683.2 3,795.5 978.1
Improved recovery 1,482.2 119.7 318.2 75.2 13.0 403.5 520.0 32.6
Revisions 5,728.5 447.6 2,433.0 950.9 219.4 1,224.5 (95.7) 548.7
Production (11,558.6) (1,324.7) (4,130.3) (549.3) (837.6) (2,136.0) (1,640.2) (940.6)
Purchases 1,175.0 — 26.4 38.9 89.4 — 906.0 114.4
Sales (2,920.5) (144.1) (934.1) (68.7) (263.2) (594.0) (865.9) (50.6)
Other (b) 589.7 (0.5) 2.0 1.0 0.1 585.0 0.0 2.1
End of year 152,474.7 11,010.4 59,046.2 15,741.1 7,211.7 24,598.5 23,523.0 11,343.8
(a) Includes condensate, natural gas liquids, synthetic crude and bitumen. (b) Includes transfers, reclassifications and other.

41Global oil and gas reserves study |
WorldwideAfrica and Middle East Asia-Pacific Canada Europe
South and Central America US
Other/unspecified
2012 proved gas reserves (Bcf)
Beginning of year 636,954.6 35,573.8 202,004.5 26,008.9 63,287.4 45,328.2 184,651.1 80,100.7
Additions:
Extensions and discoveries 64,792.2 1,354.0 30,003.1 1,477.4 972.7 1,885.0 24,665.0 4,435.0
Improved recovery 2,135.3 103.0 273.2 21.2 97.0 147.5 1,382.4 111.0
Revisions (28,344.7) 154.1 1,602.2 (5,869.7) 1,444.7 2,046.9 (29,337.0) 1,614.1
Production (45,814.4) (2,714.4) (11,236.8) (2,757.9) (5,706.4) (4,449.5) (13,601.1) (5,348.3)
Purchases 8,507.6 — 3.6 235.6 190.5 — 7,286.1 791.8
Sales (16,347.1) (445.9) (1,018.1) (872.5) (2,029.3) (2,426.0) (9,273.6) (281.7)
Other (a) 2,400.8 — (2.0) — (0.1) 2,362.0 (0.1) 41.0
End of year 624,284.3 34,024.7 221,629.7 18,243.1 58,256.4 44,894.1 165,772.8 81,463.6
(a) Includes transfers, reclassifications and other.
2012 performance measures (costs in $ per boe, production replacement rates in %)
PRAC $ 10.41 $ — $ 12.99 $ 21.76 $ 7.06 $ — $ 10.78 $ 3.75
FDC 21.83 32.24 11.84 30.06 50.38 16.87 45.40 17.19
RRC 20.70 32.34 11.84 29.59 44.95 16.92 32.73 16.02
Oil production replacement rates:
All sources 138% 69% 112% 363% 30% 108% 260% 173%
Excluding purchases and sales 148% 80% 134% 368% 51% 108% 257% 166%
Gas production replacement rates:
All sources 72% 43% 275% (182)% 12% 91% (39)% 125%
Excluding purchases and sales 84% 59% 284% (158)% 44% 92% (24)% 115%
Production costs $ 18.88 $ 12.76 $ 24.56 $ 20.54 $ 17.35 $ 16.95 $ 14.68 $ 17.38
42 | Global oil and gas reserves study

43Global oil and gas reserves study |
Africa and Middle East

44 | Global oil and gas reserves study
Africa and Middle EastIncludes the 75 largest companies based on 2012 end-of-year oil and gas reserve estimates.
2008 2009 2010 2011 2012
Proved properties acquired $ 2,098.0 $ 1,487.5 $ 1,007.5 $ 125.0 $ 138.6
Unproved properties acquired 2,380.9 383.8 948.0 3,704.7 4,605.4
Exploration 6,464.2 6,046.8 4,979.8 5,216.9 7,656.6
Development 26,910.8 28,330.7 29,864.2 28,609.8 30,371.3
Other 657.8 0.9 5.8 (27.0) 18.0
Total $ 38,511.8 $ 36,249.6 $ 36,805.3 $ 37,629.4 $ 42,789.8
Africa and Middle East — capital expenditures (millions)
2008 2009 2010 2011 2012
Revenues $ 129,875.6 $ 93,269.9 $ 121,497.8 $ 138,125.5 $ 151,588.3
Production costs (a) 15,707.6 15,287.7 19,206.5 21,600.5 22,273.9
Exploration expense 3,989.1 4,549.1 3,792.9 3,664.3 5,094.0
DD&A (b) 16,228.5 19,621.0 21,823.7 19,744.9 23,909.2
Other expenses (c) 4,937.5 3,609.8 2,112.5 2,824.8 4,122.5
Pre-tax results of operations 89,013.0 50,202.3 74,562.2 90,290.9 96,188.7
Income taxes 54,195.9 29,486.3 43,665.8 51,241.1 57,955.9
Results of operations $ 34,817.1 $ 20,716.1 $ 30,896.4 $ 39,049.8 $ 38,232.8
(a) Includes production taxes, transportation costs and production-related general and administrative expenses for those companies that separately disclose these expenses.
(b) Includes impairments.(c) Includes asset retirement obligations accretion for those companies that separately disclose this expense.
Africa and Middle East — revenues and results of operations (millions)
2008 2009 2010 2011 2012
Beginning of year 11,229.3 11,851.2 11,730.4 12,714.5 11,425.2
Additions:
Extensions and discoveries 440.4 500.8 607.0 128.1 487.2
Improved recovery 132.0 167.3 136.9 120.1 119.7
Revisions 1,439.2 536.3 1,346.0 146.7 447.6
Production (1,342.8) (1,442.1) (1,520.5) (1,260.2) (1,324.7)
Purchases 32.0 13.0 55.3 7.4 —
Sales (78.7) (48.0) (82.6) (124.6) (144.1)
Other (b) (0.2) 152.0 442.0 (306.8) (0.5)
End of year 11,851.2 11,730.4 12,714.5 11,425.2 11,010.4
(a) Includes condensate, natural gas liquids, synthetic crude and bitumen. (b) Includes transfers, reclassifications and other.
Africa and Middle East — proved oil reserves (a) (million barrels)
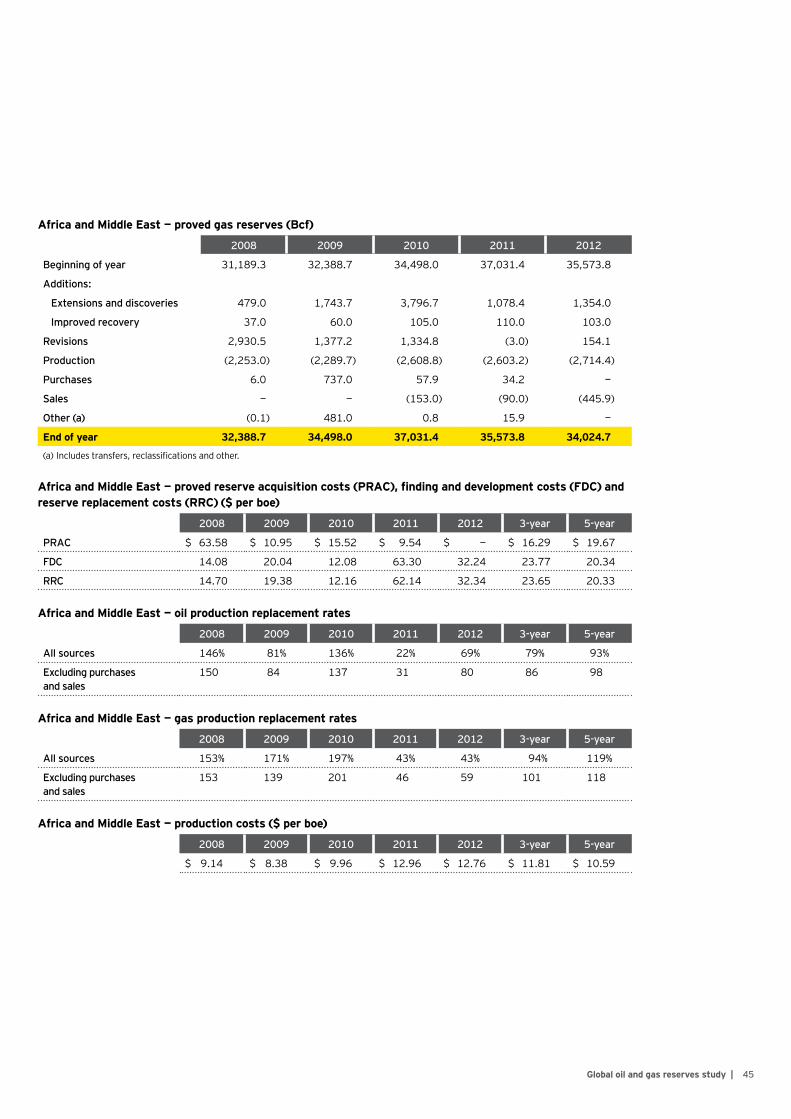
45Global oil and gas reserves study |
2008 2009 2010 2011 2012
Beginning of year 31,189.3 32,388.7 34,498.0 37,031.4 35,573.8
Additions:
Extensions and discoveries 479.0 1,743.7 3,796.7 1,078.4 1,354.0
Improved recovery 37.0 60.0 105.0 110.0 103.0
Revisions 2,930.5 1,377.2 1,334.8 (3.0) 154.1
Production (2,253.0) (2,289.7) (2,608.8) (2,603.2) (2,714.4)
Purchases 6.0 737.0 57.9 34.2 —
Sales — — (153.0) (90.0) (445.9)
Other (a) (0.1) 481.0 0.8 15.9 —
End of year 32,388.7 34,498.0 37,031.4 35,573.8 34,024.7
(a) Includes transfers, reclassifications and other.
Africa and Middle East — proved gas reserves (Bcf)
Africa and Middle East — proved reserve acquisition costs (PRAC), finding and development costs (FDC) and reserve replacement costs (RRC) ($ per boe)
2008 2009 2010 2011 2012 3-year 5-year
PRAC $ 63.58 $ 10.95 $ 15.52 $ 9.54 $ — $ 16.29 $ 19.67
FDC 14.08 20.04 12.08 63.30 32.24 23.77 20.34
RRC 14.70 19.38 12.16 62.14 32.34 23.65 20.33
Africa and Middle East — oil production replacement rates
2008 2009 2010 2011 2012 3-year 5-year
All sources 146% 81% 136% 22% 69% 79% 93%
Excluding purchases and sales
150 84 137 31 80 86 98
Africa and Middle East — gas production replacement rates
2008 2009 2010 2011 2012 3-year 5-year
All sources 153% 171% 197% 43% 43% 94% 119%
Excluding purchases and sales
153 139 201 46 59 101 118
Africa and Middle East — production costs ($ per boe)
2008 2009 2010 2011 2012 3-year 5-year
$ 9.14 $ 8.38 $ 9.96 $ 12.96 $ 12.76 $ 11.81 $ 10.59
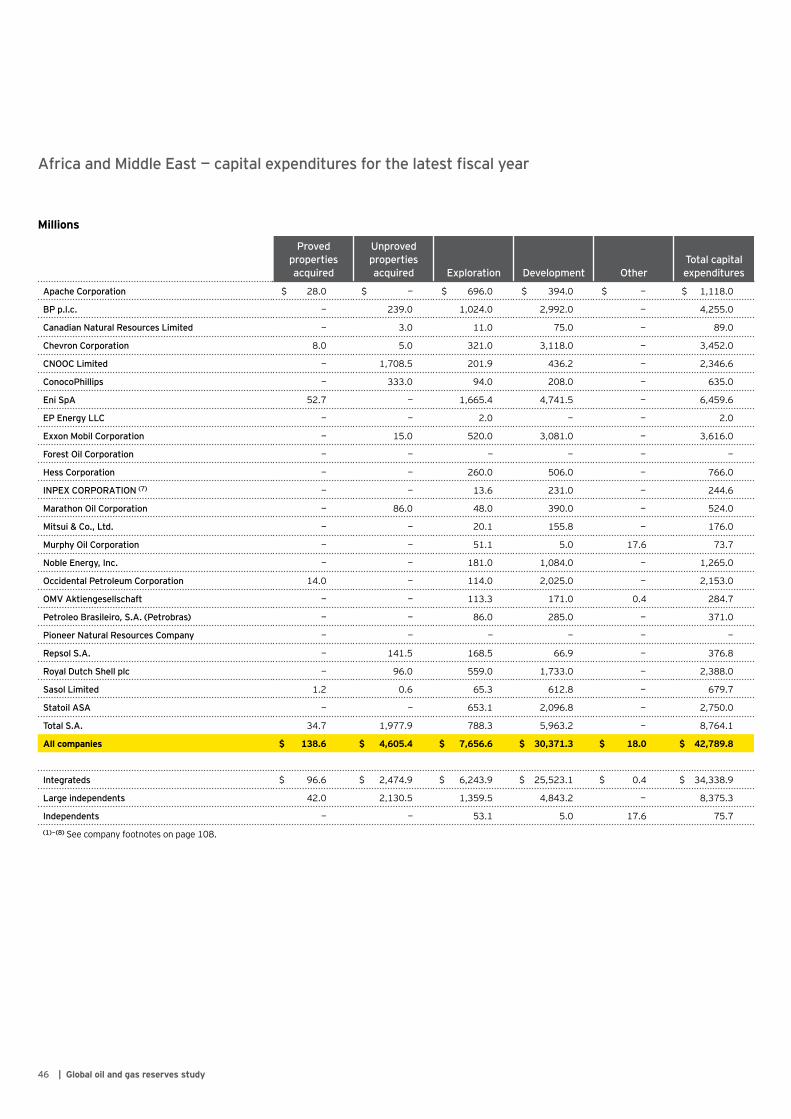
46 | Global oil and gas reserves study
Africa and Middle East — capital expenditures for the latest fiscal year
Millions
Proved properties acquired
Unproved properties acquired Exploration Development Other
Total capital expenditures
Apache Corporation $ 28.0 $ — $ 696.0 $ 394.0 $ — $ 1,118.0
BP p.l.c. — 239.0 1,024.0 2,992.0 — 4,255.0
Canadian Natural Resources Limited — 3.0 11.0 75.0 — 89.0
Chevron Corporation 8.0 5.0 321.0 3,118.0 — 3,452.0
CNOOC Limited — 1,708.5 201.9 436.2 — 2,346.6
ConocoPhillips — 333.0 94.0 208.0 — 635.0
Eni SpA 52.7 — 1,665.4 4,741.5 — 6,459.6
EP Energy LLC — — 2.0 — — 2.0
Exxon Mobil Corporation — 15.0 520.0 3,081.0 — 3,616.0
Forest Oil Corporation — — — — — —
Hess Corporation — — 260.0 506.0 — 766.0
INPEX CORPORATION (7) — — 13.6 231.0 — 244.6
Marathon Oil Corporation — 86.0 48.0 390.0 — 524.0
Mitsui & Co., Ltd. — — 20.1 155.8 — 176.0
Murphy Oil Corporation — — 51.1 5.0 17.6 73.7
Noble Energy, Inc. — — 181.0 1,084.0 — 1,265.0
Occidental Petroleum Corporation 14.0 — 114.0 2,025.0 — 2,153.0
OMV Aktiengesellschaft — — 113.3 171.0 0.4 284.7
Petroleo Brasileiro, S.A. (Petrobras) — — 86.0 285.0 — 371.0
Pioneer Natural Resources Company — — — — — —
Repsol S.A. — 141.5 168.5 66.9 — 376.8
Royal Dutch Shell plc — 96.0 559.0 1,733.0 — 2,388.0
Sasol Limited 1.2 0.6 65.3 612.8 — 679.7
Statoil ASA — — 653.1 2,096.8 — 2,750.0
Total S.A. 34.7 1,977.9 788.3 5,963.2 — 8,764.1
All companies $ 138.6 $ 4,605.4 $ 7,656.6 $ 30,371.3 $ 18.0 $ 42,789.8
Integrateds $ 96.6 $ 2,474.9 $ 6,243.9 $ 25,523.1 $ 0.4 $ 34,338.9
Large independents 42.0 2,130.5 1,359.5 4,843.2 — 8,375.3
Independents — — 53.1 5.0 17.6 75.7
(1) – (8) See company footnotes on page 108.

47Global oil and gas reserves study |
Africa and Middle East — revenues and results of operations for the latest fiscal year (a)
Millions
RevenuesProduction
costs (b)Exploration
expense DD&A (c)
Other (income)
expense (d) Income taxesResults of operations
Apache Corporation $ 4,554.0 $ 449.0 $ — $ 924.0 $ — $ 1,527.0 $ 1,654.0
BP p.l.c. (6) 9,057.0 1,323.0 310.0 2,281.0 245.0 2,371.0 2,527.0
Canadian Natural Resources Limited 574.2 164.1 — 165.1 7.0 55.0 183.1
Chevron Corporation 16,513.0 2,079.0 427.0 2,491.0 265.0 7,558.0 3,693.0
CNOOC Limited 2,324.4 273.7 101.0 689.4 8.6 679.8 572.0
ConocoPhillips 1,997.0 61.0 55.0 44.0 8.0 1,728.0 101.0
Eni SpA 25,398.7 3,506.9 1,473.8 3,712.7 1,779.8 9,904.8 5,020.6
EP Energy LLC — — — — — — —
Exxon Mobil Corporation 20,577.0 4,097.0 234.0 2,879.0 — 8,091.0 5,276.0
Forest Oil Corporation — — — 79.5 — — (79.5)
Hess Corporation 2,545.0 423.0 84.0 528.0 — 905.0 605.0
INPEX CORPORATION (7) — — — — — — —
Marathon Oil Corporation (6) 2,851.0 224.0 19.0 135.0 — 1,999.0 474.0
Mitsui & Co., Ltd. 754.4 73.7 31.7 163.7 — 290.2 195.0
Murphy Oil Corporation 57.6 51.6 76.8 233.9 0.9 (64.5) (241.1)
Noble Energy, Inc. 1,521.0 136.0 3.0 397.0 — 249.0 736.0
Occidental Petroleum Corporation 7,486.0 1,061.0 112.0 1,404.0 224.0 2,159.0 2,526.0
OMV Aktiengesellschaft 426.6 154.2 171.0 135.2 46.7 9.8 (90.3)
Petroleo Brasileiro, S.A. (Petrobras) 2,254.0 178.0 81.0 207.0 (176.0) 929.0 1,035.0
Pioneer Natural Resources Company — — — — — — —
Repsol S.A. 2,053.8 246.9 118.3 99.0 1.3 1,147.1 441.1
Royal Dutch Shell plc 13,171.0 2,788.0 699.0 1,261.0 (322.0) 5,358.0 3,387.0
Sasol Limited 5,820.3 2,090.6 20.5 341.4 — 1,212.4 2,155.4
Statoil ASA 6,496.8 601.6 584.4 1,839.0 85.9 1,856.2 1,529.7
Total S.A. (5) 25,155.6 2,291.7 492.5 3,899.2 1,948.3 9,991.0 6,532.9
All companies $ 151,588.3 $ 22,273.9 $ 5,094.0 $ 23,909.2 $ 4,122.5 $ 57,955.9 $ 38,232.8
Integrateds $ 130,223.1 $ 19,853.5 $ 4,727.2 $ 19,837.3 $ 3,874.0 $ 49,623.6 $ 32,307.4
Large independents 21,307.6 2,368.8 290.0 3,758.5 247.6 8,396.8 6,246.1
Independents 57.6 51.6 76.8 313.4 0.9 (64.5) (320.6)
(a) Amounts are determined from the results of operations table if this disclosure is provided; otherwise, amounts are determined from the income statement. Revenues determined from the income statement include oil and gas sales and hedging and derivative gains/losses.
(b) Includes production taxes, transportation costs and production-related general and administrative expenses for those companies that separately disclose these expenses.(c) Includes impairments.(d) Includes asset retirement obligations accretion for those companies that separately disclose this expense.(1) – (8) See company footnotes on page 108.

48 | Global oil and gas reserves study
Africa and Middle East — oil reserves for the latest fiscal year (a)
Million barrels
Beginning
Extensions and
discoveriesImproved recovery Revisions Production Purchases Sales Other (b) Ending
Ending rank
Apache Corporation 128.0 36.2 — (3.7) (36.5) — — — 124.0 17
BP p.l.c. 626.0 2.0 13.0 (1.0) (73.0) — — — 567.0 7
Canadian Natural Resources Limited
88.0 — 1.0 1.0 (5.0) — — — 85.0 19
Chevron Corporation 1,155.0 30.0 30.0 66.0 (151.0) — — — 1,130.0 4
CNOOC Limited 134.0 — — 23.0 (21.0) — — — 136.0 15
ConocoPhillips 261.0 7.0 — 2.0 (24.0) — — — 246.0 12
Eni SpA 1,587.0 75.0 27.0 81.0 (188.0) — (6.0) — 1,576.0 2
EP Energy LLC — — — — — — — — — —
Exxon Mobil Corporation 1,463.0 41.0 — 20.0 (173.0) — (58.0) — 1,293.0 3
Forest Oil Corporation — — — — — — — — — —
Hess Corporation 250.0 17.0 — (5.0) (28.0) — — — 234.0 13
INPEX CORPORATION (7) 404.0 — — 1.0 (31.0) — (2.0) (1.0) 371.0 9
Marathon Oil Corporation 357.0 7.0 — 1.0 (28.0) — — — 337.0 10
Mitsui & Co., Ltd. 22.0 1.0 — — (5.0) — — — 18.0 21
Murphy Oil Corporation 2.3 — — (1.6) (0.7) — — — — —
Noble Energy, Inc. 106.0 — — 9.0 (15.0) — — — 100.0 18
Occidental Petroleum Corporation
441.0 91.0 30.0 (3.0) (70.0) — — — 489.0 8
OMV Aktiengesellschaft 35.6 — — 2.2 (4.6) — — 0.1 33.3 20
Petroleo Brasileiro, S.A. (Petrobras)
118.1 — 18.7 22.4 (19.0) — — — 140.2 14
Pioneer Natural Resources Company
0.2 — — — (0.2) — (0.1) — — —
Repsol S.A. 115.0 3.0 — 23.0 (16.0) — — — 125.0 16
Royal Dutch Shell plc 731.0 1.0 — 95.0 (106.0) — (33.0) — 688.0 6
Sasol Limited 811.9 — — 10.3 (42.7) — — 0.4 779.9 5
Statoil ASA 313.0 — — 42.0 (56.0) — — — 299.0 11
Total S.A. 2,276.0 176.0 — 63.0 (231.0) — (45.0) — 2,239.0 1
All companies 11,425.2 487.2 119.7 447.6 (1,324.7) — (144.1) (0.5) 11,010.4
Integrateds 9,503.6 346.0 88.7 418.9 (1,093.3) — (142.0) 0.5 9,122.4
Large independents 1,919.3 141.2 31.0 30.3 (230.7) — (2.1) (1.0) 1,888.0
Independents 2.3 — — (1.6) (0.7) — — — —
(a) Includes condensate, natural gas liquids, synthetic crude and bitumen.(b) Includes transfers, reclassifications and other.(1) – (8) See company footnotes on page 108.

49Global oil and gas reserves study |
Africa and Middle East — gas reserves for the latest fiscal year
Bcf
Beginning
Extensions and
discoveriesImproved recovery Revisions Production Purchases Sales Other (a) Ending
Ending rank
Apache Corporation 983.0 56.0 — (14.0) (129.5) — — — 895.5 12
BP p.l.c. 3,257.0 1.0 69.0 (14.0) (251.0) — — — 3,062.0 4
Canadian Natural Resources Limited
54.0 — — — (6.0) — — — 48.0 16
Chevron Corporation 3,196.0 2.0 — (30.0) (87.0) — — — 3,081.0 3
CNOOC Limited — — — — — — — — — —
ConocoPhillips 872.0 2.0 — 109.0 (70.0) — — — 913.0 11
Eni SpA 8,139.0 114.0 — 284.0 (829.0) — (89.0) — 7,619.0 1
EP Energy LLC — — — — — — — — — —
Exxon Mobil Corporation 982.0 — — 2.0 (43.0) — (12.0) — 929.0 10
Forest Oil Corporation — — — — — — — — — —
Hess Corporation — — — — — — — — — —
INPEX CORPORATION (7) — — — — — — — — — —
Marathon Oil Corporation 1,675.0 111.0 — 9.0 (162.0) — — — 1,633.0 8
Mitsui & Co., Ltd. 37.0 4.0 — (3.0) (4.0) — — — 34.0 18
Murphy Oil Corporation — — — — — — — — — —
Noble Energy, Inc. 3,055.0 58.0 — (22.0) (123.0) — — — 2,968.0 5
Occidental Petroleum Corporation
1,925.0 784.0 34.0 62.0 (165.0) — — — 2,640.0 6
OMV Aktiengesellschaft 118.5 — — 47.1 (32.0) — — — 133.6 15
Petroleo Brasileiro, S.A. (Petrobras)
39.3 — — 6.2 — — — — 45.5 17
Pioneer Natural Resources Company
12.7 — — — (3.8) — (8.9) — — 19
Repsol S.A. 165.0 — — (1.0) (12.0) — — — 152.0 14
Royal Dutch Shell plc 2,800.0 89.0 — (142.0) (343.0) — (163.0) — 2,241.0 7
Sasol Limited 1,521.4 — — 10.8 (81.1) — — — 1,451.1 9
Statoil ASA 431.0 — — (49.0) (41.0) — — — 341.0 13
Total S.A. 6,311.0 133.0 — (101.0) (332.0) — (173.0) — 5,838.0 2
Total 35,573.8 1,354.0 103.0 154.1 (2,714.4) — (445.9) — 34,024.7
Integrateds 26,997.2 343.0 69.0 10.1 (2,055.1) — (437.0) — 24,927.2
Large independents 8,576.6 1,011.0 34.0 144.0 (659.3) — (8.9) — 9,097.5
Independents — — — — — — — — —
(a) Includes transfers, reclassifications and other.(1) – (8) See company footnotes on page 108.
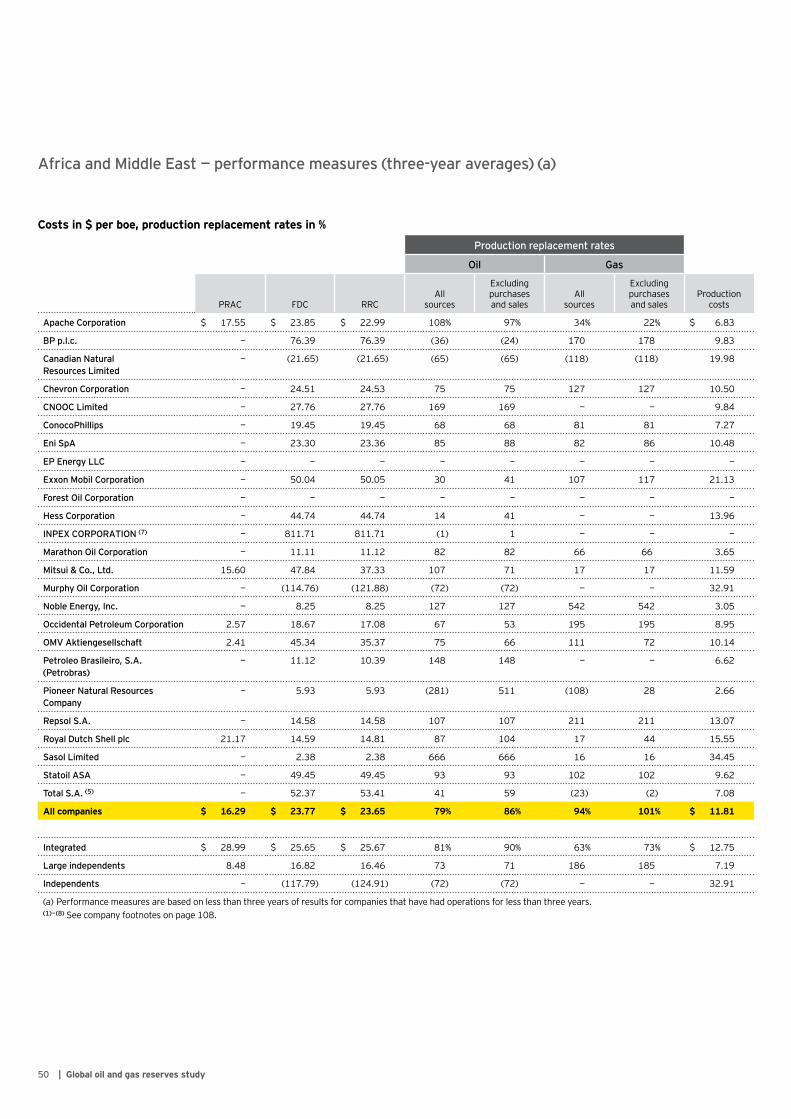
50 | Global oil and gas reserves study
Africa and Middle East — performance measures (three-year averages) (a)
Costs in $ per boe, production replacement rates in %
Production replacement rates
Oil Gas
PRAC FDC RRCAll
sources
Excluding purchases and sales
All sources
Excluding purchases and sales
Production costs
Apache Corporation $ 17.55 $ 23.85 $ 22.99 108% 97% 34% 22% $ 6.83
BP p.l.c. — 76.39 76.39 (36) (24) 170 178 9.83
Canadian Natural Resources Limited
— (21.65) (21.65) (65) (65) (118) (118) 19.98
Chevron Corporation — 24.51 24.53 75 75 127 127 10.50
CNOOC Limited — 27.76 27.76 169 169 — — 9.84
ConocoPhillips — 19.45 19.45 68 68 81 81 7.27
Eni SpA — 23.30 23.36 85 88 82 86 10.48
EP Energy LLC — — — — — — — —
Exxon Mobil Corporation — 50.04 50.05 30 41 107 117 21.13
Forest Oil Corporation — — — — — — — —
Hess Corporation — 44.74 44.74 14 41 — — 13.96
INPEX CORPORATION (7) — 811.71 811.71 (1) 1 — — —
Marathon Oil Corporation — 11.11 11.12 82 82 66 66 3.65
Mitsui & Co., Ltd. 15.60 47.84 37.33 107 71 17 17 11.59
Murphy Oil Corporation — (114.76) (121.88) (72) (72) — — 32.91
Noble Energy, Inc. — 8.25 8.25 127 127 542 542 3.05
Occidental Petroleum Corporation 2.57 18.67 17.08 67 53 195 195 8.95
OMV Aktiengesellschaft 2.41 45.34 35.37 75 66 111 72 10.14
Petroleo Brasileiro, S.A. (Petrobras)
— 11.12 10.39 148 148 — — 6.62
Pioneer Natural Resources Company
— 5.93 5.93 (281) 511 (108) 28 2.66
Repsol S.A. — 14.58 14.58 107 107 211 211 13.07
Royal Dutch Shell plc 21.17 14.59 14.81 87 104 17 44 15.55
Sasol Limited — 2.38 2.38 666 666 16 16 34.45
Statoil ASA — 49.45 49.45 93 93 102 102 9.62
Total S.A. (5) — 52.37 53.41 41 59 (23) (2) 7.08
All companies $ 16.29 $ 23.77 $ 23.65 79% 86% 94% 101% $ 11.81
Integrated $ 28.99 $ 25.65 $ 25.67 81% 90% 63% 73% $ 12.75
Large independents 8.48 16.82 16.46 73 71 186 185 7.19
Independents — (117.79) (124.91) (72) (72) — — 32.91
(a) Performance measures are based on less than three years of results for companies that have had operations for less than three years.(1) – (8) See company footnotes on page 108.
51Global oil and gas reserves study |
Asia-Pacific
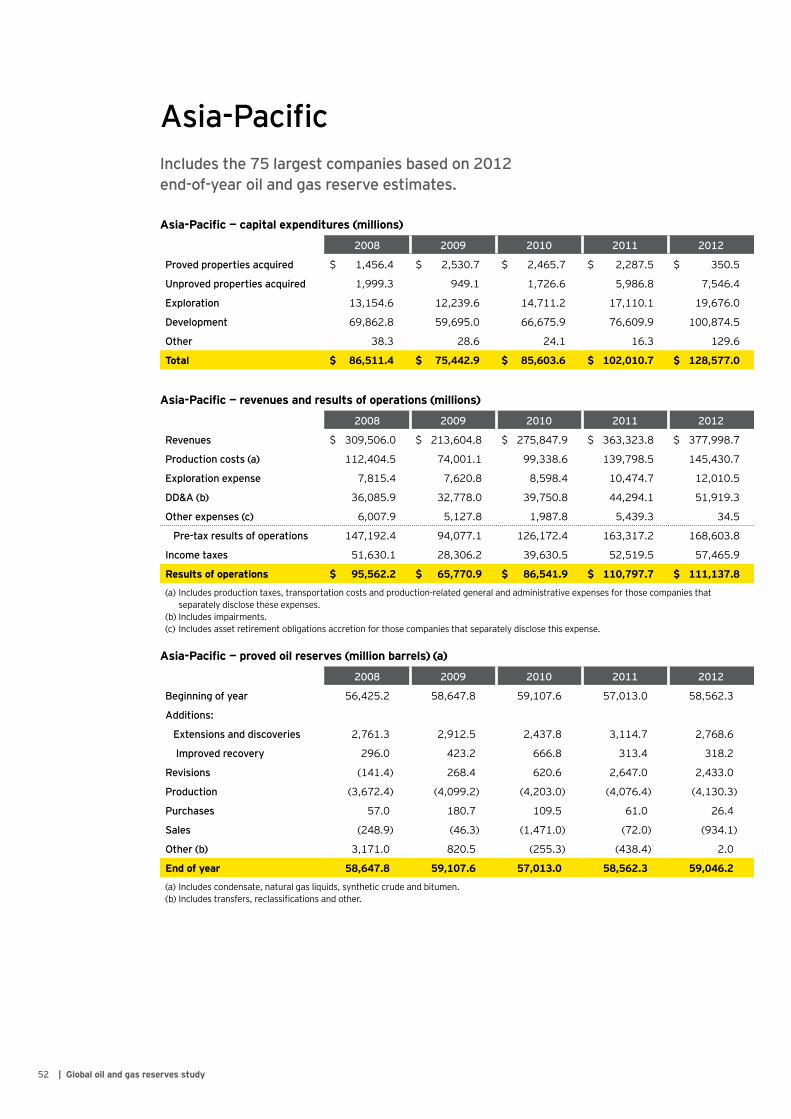
52 | Global oil and gas reserves study
Asia-PacificIncludes the 75 largest companies based on 2012 end-of-year oil and gas reserve estimates.
2008 2009 2010 2011 2012
Proved properties acquired $ 1,456.4 $ 2,530.7 $ 2,465.7 $ 2,287.5 $ 350.5
Unproved properties acquired 1,999.3 949.1 1,726.6 5,986.8 7,546.4
Exploration 13,154.6 12,239.6 14,711.2 17,110.1 19,676.0
Development 69,862.8 59,695.0 66,675.9 76,609.9 100,874.5
Other 38.3 28.6 24.1 16.3 129.6
Total $ 86,511.4 $ 75,442.9 $ 85,603.6 $ 102,010.7 $ 128,577.0
Asia-Pacific — capital expenditures (millions)
2008 2009 2010 2011 2012
Revenues $ 309,506.0 $ 213,604.8 $ 275,847.9 $ 363,323.8 $ 377,998.7
Production costs (a) 112,404.5 74,001.1 99,338.6 139,798.5 145,430.7
Exploration expense 7,815.4 7,620.8 8,598.4 10,474.7 12,010.5
DD&A (b) 36,085.9 32,778.0 39,750.8 44,294.1 51,919.3
Other expenses (c) 6,007.9 5,127.8 1,987.8 5,439.3 34.5
Pre-tax results of operations 147,192.4 94,077.1 126,172.4 163,317.2 168,603.8
Income taxes 51,630.1 28,306.2 39,630.5 52,519.5 57,465.9
Results of operations $ 95,562.2 $ 65,770.9 $ 86,541.9 $ 110,797.7 $ 111,137.8
(a) Includes production taxes, transportation costs and production-related general and administrative expenses for those companies that separately disclose these expenses.
(b) Includes impairments.(c) Includes asset retirement obligations accretion for those companies that separately disclose this expense.
Asia-Pacific — revenues and results of operations (millions)
2008 2009 2010 2011 2012
Beginning of year 56,425.2 58,647.8 59,107.6 57,013.0 58,562.3
Additions:
Extensions and discoveries 2,761.3 2,912.5 2,437.8 3,114.7 2,768.6
Improved recovery 296.0 423.2 666.8 313.4 318.2
Revisions (141.4) 268.4 620.6 2,647.0 2,433.0
Production (3,672.4) (4,099.2) (4,203.0) (4,076.4) (4,130.3)
Purchases 57.0 180.7 109.5 61.0 26.4
Sales (248.9) (46.3) (1,471.0) (72.0) (934.1)
Other (b) 3,171.0 820.5 (255.3) (438.4) 2.0
End of year 58,647.8 59,107.6 57,013.0 58,562.3 59,046.2
(a) Includes condensate, natural gas liquids, synthetic crude and bitumen. (b) Includes transfers, reclassifications and other.
Asia-Pacific — proved oil reserves (million barrels) (a)
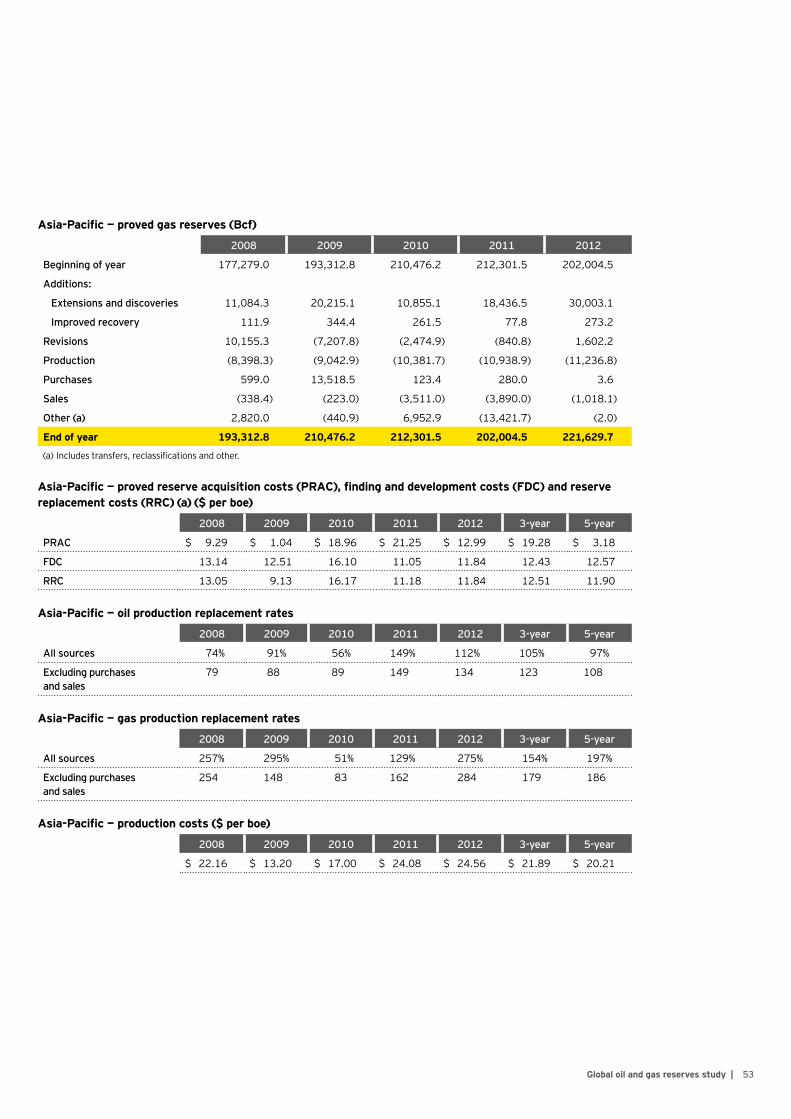
53Global oil and gas reserves study |
2008 2009 2010 2011 2012
Beginning of year 177,279.0 193,312.8 210,476.2 212,301.5 202,004.5
Additions:
Extensions and discoveries 11,084.3 20,215.1 10,855.1 18,436.5 30,003.1
Improved recovery 111.9 344.4 261.5 77.8 273.2
Revisions 10,155.3 (7,207.8) (2,474.9) (840.8) 1,602.2
Production (8,398.3) (9,042.9) (10,381.7) (10,938.9) (11,236.8)
Purchases 599.0 13,518.5 123.4 280.0 3.6
Sales (338.4) (223.0) (3,511.0) (3,890.0) (1,018.1)
Other (a) 2,820.0 (440.9) 6,952.9 (13,421.7) (2.0)
End of year 193,312.8 210,476.2 212,301.5 202,004.5 221,629.7
(a) Includes transfers, reclassifications and other.
Asia-Pacific — proved gas reserves (Bcf)
Asia-Pacific — proved reserve acquisition costs (PRAC), finding and development costs (FDC) and reserve replacement costs (RRC) (a) ($ per boe)
2008 2009 2010 2011 2012 3-year 5-year
PRAC $ 9.29 $ 1.04 $ 18.96 $ 21.25 $ 12.99 $ 19.28 $ 3.18
FDC 13.14 12.51 16.10 11.05 11.84 12.43 12.57
RRC 13.05 9.13 16.17 11.18 11.84 12.51 11.90
Asia-Pacific — oil production replacement rates
2008 2009 2010 2011 2012 3-year 5-year
All sources 74% 91% 56% 149% 112% 105% 97%
Excluding purchases and sales
79 88 89 149 134 123 108
Asia-Pacific — gas production replacement rates
2008 2009 2010 2011 2012 3-year 5-year
All sources 257% 295% 51% 129% 275% 154% 197%
Excluding purchases and sales
254 148 83 162 284 179 186
Asia-Pacific — production costs ($ per boe)
2008 2009 2010 2011 2012 3-year 5-year
$ 22.16 $ 13.20 $ 17.00 $ 24.08 $ 24.56 $ 21.89 $ 20.21

54 | Global oil and gas reserves study
Asia-Pacific — capital expenditures for the latest fiscal year
Millions
Proved properties acquired
Unproved properties acquired Exploration Development Other
Total capital expenditures
Apache Corporation $ 32.0 $ — $ 149.0 $ 915.0 $ — $ 1,096.0
BHP Billiton Group — 5.0 251.0 1,663.0 — 1,919.0
BP p.l.c. (1) 4.0 (53.0) 1,250.0 3,372.0 — 4,573.0
Chevron Corporation (1) 39.0 370.0 992.0 9,012.0 — 10,413.0
China Petroleum & Chemical Corporation (Sinopec) — — 3,587.7 11,279.4 — 14,867.2
CNOOC Limited — 0.3 1,823.0 5,670.0 — 7,493.2
ConocoPhillips (1) — — 249.0 1,126.0 — 1,375.0
Eni SpA — — 375.5 1,903.3 — 2,278.8
Exxon Mobil Corporation 43.0 31.0 802.0 5,680.0 — 6,556.0
INPEX CORPORATION (7) — 7.6 213.0 1,918.8 — 2,139.4
Mitsui & Co., Ltd. — 15.6 173.0 522.3 — 710.9
Murphy Oil Corporation — — 68.8 1,385.1 48.6 1,502.5
Newfield Exploration Company — — 64.0 194.0 — 258.0
OAO LUKOIL — 937.0 525.0 6,489.0 — 7,951.0
OAO NOVATEK — — 65.3 965.5 — 1,030.8
OJSC Rosneft Oil Company — 193.2 740.5 8,885.8 — 9,819.5
PetroChina Company Limited — 3,896.6 6,486.7 27,559.7 — 37,943.0
Repsol S.A. 198.0 101.6 55.3 9.0 — 363.9
Royal Dutch Shell plc — 1,917.0 1,219.0 7,674.0 — 10,810.0
Talisman Energy Inc. 19.0 91.0 149.0 367.0 81.0 707.0
Total S.A. 15.4 33.4 437.2 4,283.7 — 4,769.8
All companies $ 350.5 $ 7,546.4 $ 19,676.0 $ 100,874.5 $ 129.6 $ 128,577.0
Integrateds $ 299.5 $ 7,442.5 $ 16,709.2 $ 87,635.7 $ — $ 112,086.8
Large independents 32.0 12.9 2,685.0 11,292.7 — 14,022.6
Independents 19.0 91.0 281.8 1,946.1 129.6 2,467.5
(1) – (8) See company footnotes on page 108.

55Global oil and gas reserves study |
Asia-Pacific — revenues and results of operations for the latest fiscal year (a)
Millions
RevenuesProduction
costs (b)Exploration
expense DD&A (c)
Other (income)
expense (d) Income taxesResults of operations
Apache Corporation $ 1,575.0 $ 226.0 $ — $ 460.0 $ 17.0 $ 262.0 $ 610.0
BHP Billiton Group 6,233.0 1,667.0 156.0 707.0 — 1,332.0 2,371.0
BP p.l.c. (1) (6) 25,419.0 13,704.0 351.0 3,113.0 (40.0) 1,941.0 6,350.0
Chevron Corporation (1) 30,037.0 6,192.0 622.0 4,274.0 (2,644.0) 8,937.0 12,656.0
China Petroleum & Chemical Corporation (Sinopec)
36,059.8 13,828.4 2,461.8 6,385.4 — 3,637.8 9,746.3
CNOOC Limited 27,673.3 9,419.4 1,078.0 4,157.4 204.8 3,333.0 9,480.7
ConocoPhillips (1) 7,248.0 1,601.0 75.0 903.0 148.0 1,287.0 3,234.0
Eni SpA 5,654.6 738.2 457.8 1,295.0 (16.7) 1,383.7 1,796.6
Exxon Mobil Corporation 17,984.0 4,788.0 649.0 2,049.0 — 6,897.0 3,601.0
INPEX CORPORATION (7) — — — — — — —
Mitsui & Co., Ltd. 2,279.4 318.7 151.5 567.1 — 639.4 602.8
Murphy Oil Corporation 2,428.1 417.4 27.2 532.1 12.5 544.7 894.2
Newfield Exploration Company 1,091.0 385.0 — 266.0 — 162.0 278.0
OAO LUKOIL 40,176.0 27,809.0 205.0 2,544.0 — 1,618.0 8,000.0
OAO NOVATEK 5,944.1 2,641.1 65.1 340.9 — 579.4 2,317.7
OJSC Rosneft Oil Company 39,084.7 20,572.6 740.5 6,181.4 128.8 2,736.6 8,724.8
PetroChina Company Limited 97,841.9 37,404.1 3,799.3 14,975.6 671.5 8,180.1 32,811.2
Repsol S.A. 50.2 30.9 55.3 14.1 — (15.4) (34.7)
Royal Dutch Shell plc 23,501.0 2,709.0 636.0 1,526.0 1,388.0 11,846.0 5,396.0
Talisman Energy Inc. 2,190.0 471.0 170.0 422.0 — 539.0 588.0
Total S.A. (5) 5,528.5 508.0 309.9 1,206.3 164.6 1,625.5 1,714.2
All companies $ 377,998.7 $ 145,430.7 $ 12,010.5 $ 51,919.3 $ 34.5 $ 57,465.9 $ 111,137.8
Integrateds $ 329,560.3 $ 131,243.9 $ 10,504.3 $ 44,471.8 $ (347.8) $ 50,006.2 $ 93,681.9
Large independents 42,729.3 12,913.4 1,309.0 6,227.4 369.8 6,214.0 15,695.7
Independents 5,709.1 1,273.4 197.2 1,220.1 12.5 1,245.7 1,760.2
(a) Amounts are determined from the results of operations table if this disclosure is provided; otherwise, amounts are determined from the income statement. Revenues determined from the income statement include oil and gas sales and hedging and derivative gains/losses.
(b) Includes production taxes, transportation costs and production-related general and administrative expenses for those companies that separately disclose these expenses.(c) Includes impairments.(d) Includes asset retirement obligations accretion for those companies that separately disclose this expense.(1) – (8) See company footnotes on page 108.

56 | Global oil and gas reserves study
Asia-Pacific — oil reserves for the latest fiscal year (a)
Million barrels
Beginning
Extensions and
discoveriesImproved recovery Revisions Production Purchases Sales Other (b) Ending
Ending rank
Apache Corporation 67.9 6.3 — (0.1) (10.6) 0.3 — — 63.9 17
BHP Billiton Group 274.2 8.8 — 9.0 (39.1) — — — 252.9 15
BP p.l.c. (1) 4,771.0 67.0 49.0 460.0 (376.0) — (15.0) — 4,956.0 4
Chevron Corporation (1) 2,793.0 9.0 6.0 160.0 (243.0) — (22.0) — 2,703.0 6
China Petroleum & Chemical Corporation (Sinopec)
2,848.0 151.0 163.0 9.0 (328.0) — — — 2,843.0 5
CNOOC Limited 1,685.0 207.0 — 88.0 (232.0) — — — 1,748.0 8
ConocoPhillips (1) 300.0 32.0 — 11.0 (36.0) — (40.0) — 267.0 14
Eni SpA 784.0 — — 59.0 (44.0) — (23.0) — 776.0 10
Exxon Mobil Corporation 1,891.0 9.0 1.0 (5.0) (129.0) — — — 1,767.0 7
INPEX CORPORATION (7) 310.0 190.0 — (9.0) (33.0) — — 2.0 460.0 13
Mitsui & Co., Ltd. 42.0 — — 16.0 (15.0) — — — 43.0 18
Murphy Oil Corporation 104.4 3.8 7.2 (0.4) (19.3) — — — 95.7 16
Newfield Exploration Company
43.0 — — 2.0 (11.0) — — — 34.0 20
OAO LUKOIL 12,786.0 511.0 — 67.0 (631.0) — (3.0) — 12,730.0 2
OAO NOVATEK (8) 485.0 91.0 — 2.0 (35.0) — — — 543.0 12
OJSC Rosneft Oil Company (2)
16,352.0 736.0 — 1,375.0 (885.0) 1.0 (806.0) — 16,773.0 1
PetroChina Company Limited
11,128.0 737.0 86.0 (16.0) (917.0) — — — 11,018.0 3
Repsol S.A. — — — — (1.0) 24.0 — — 23.0 21
Royal Dutch Shell plc 1,279.0 2.0 6.0 196.0 (122.0) — (24.0) — 1,337.0 9
Talisman Energy Inc. 45.8 1.7 — (0.5) (9.3) 1.1 (1.1) — 37.7 19
Total S.A. 573.0 6.0 — 10.0 (14.0) — — — 575.0 11
All companies 58,562.3 2,768.6 318.2 2,433.0 (4,130.3) 26.4 (934.1) 2.0 59,046.2
Integrateds 55,732.0 2,319.0 311.0 2,333.0 (3,740.0) 25.0 (893.0) — 56,087.0
Large independents 2,637.1 444.1 — 98.9 (350.7) 0.3 (40.0) 2.0 2,791.8
Independents 193.2 5.5 7.2 1.1 (39.6) 1.1 (1.1) — 167.4
(a) Includes condensate, natural gas liquids, synthetic crude and bitumen.(b) Includes transfers, reclassifications and other.(1) – (8) See company footnotes on page 108.
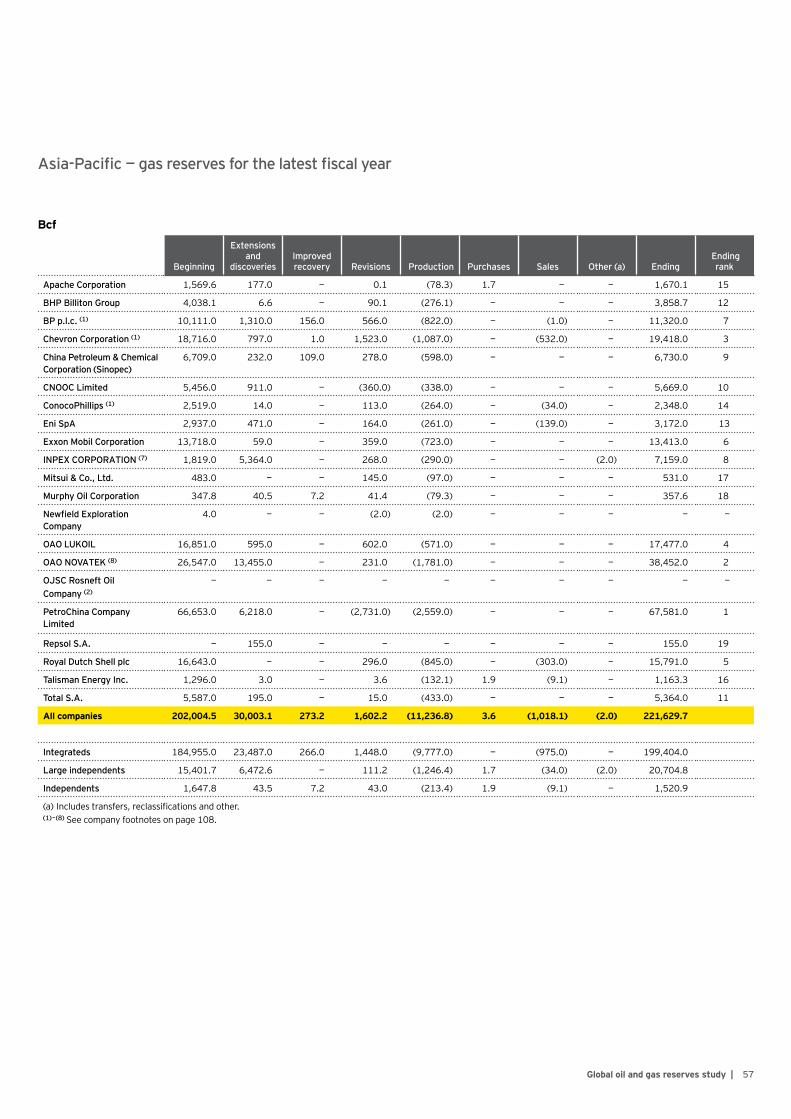
57Global oil and gas reserves study |
Asia-Pacific — gas reserves for the latest fiscal year
Bcf
Beginning
Extensions and
discoveriesImproved recovery Revisions Production Purchases Sales Other (a) Ending
Ending rank
Apache Corporation 1,569.6 177.0 — 0.1 (78.3) 1.7 — — 1,670.1 15
BHP Billiton Group 4,038.1 6.6 — 90.1 (276.1) — — — 3,858.7 12
BP p.l.c. (1) 10,111.0 1,310.0 156.0 566.0 (822.0) — (1.0) — 11,320.0 7
Chevron Corporation (1) 18,716.0 797.0 1.0 1,523.0 (1,087.0) — (532.0) — 19,418.0 3
China Petroleum & Chemical Corporation (Sinopec)
6,709.0 232.0 109.0 278.0 (598.0) — — — 6,730.0 9
CNOOC Limited 5,456.0 911.0 — (360.0) (338.0) — — — 5,669.0 10
ConocoPhillips (1) 2,519.0 14.0 — 113.0 (264.0) — (34.0) — 2,348.0 14
Eni SpA 2,937.0 471.0 — 164.0 (261.0) — (139.0) — 3,172.0 13
Exxon Mobil Corporation 13,718.0 59.0 — 359.0 (723.0) — — — 13,413.0 6
INPEX CORPORATION (7) 1,819.0 5,364.0 — 268.0 (290.0) — — (2.0) 7,159.0 8
Mitsui & Co., Ltd. 483.0 — — 145.0 (97.0) — — — 531.0 17
Murphy Oil Corporation 347.8 40.5 7.2 41.4 (79.3) — — — 357.6 18
Newfield Exploration Company
4.0 — — (2.0) (2.0) — — — — —
OAO LUKOIL 16,851.0 595.0 — 602.0 (571.0) — — — 17,477.0 4
OAO NOVATEK (8) 26,547.0 13,455.0 — 231.0 (1,781.0) — — — 38,452.0 2
OJSC Rosneft Oil Company (2)
— — — — — — — — — —
PetroChina Company Limited
66,653.0 6,218.0 — (2,731.0) (2,559.0) — — — 67,581.0 1
Repsol S.A. — 155.0 — — — — — — 155.0 19
Royal Dutch Shell plc 16,643.0 — — 296.0 (845.0) — (303.0) — 15,791.0 5
Talisman Energy Inc. 1,296.0 3.0 — 3.6 (132.1) 1.9 (9.1) — 1,163.3 16
Total S.A. 5,587.0 195.0 — 15.0 (433.0) — — — 5,364.0 11
All companies 202,004.5 30,003.1 273.2 1,602.2 (11,236.8) 3.6 (1,018.1) (2.0) 221,629.7
Integrateds 184,955.0 23,487.0 266.0 1,448.0 (9,777.0) — (975.0) — 199,404.0
Large independents 15,401.7 6,472.6 — 111.2 (1,246.4) 1.7 (34.0) (2.0) 20,704.8
Independents 1,647.8 43.5 7.2 43.0 (213.4) 1.9 (9.1) — 1,520.9
(a) Includes transfers, reclassifications and other.(1) – (8) See company footnotes on page 108.

58 | Global oil and gas reserves study
Asia-Pacific — performance measures (three-year averages) (a)
Costs in $ per boe, production replacement rates in %
Production replacement rates
Oil Gas
PRAC FDC RRCAll
sources
Excluding purchases and sales
All sources
Excluding purchases and sales
Production costs
Apache Corporation $ 56.45 $ 22.72 $ 22.89 65% 64% 241% 240% $ 8.08
BHP Billiton Group — 25.74 25.74 37 37 109 109 17.39
BP p.l.c. (1) 29.62 6.34 7.22 169 170 140 140 24.53
Chevron Corporation (1) 14.08 18.72 18.68 32 34 181 201 12.34
China Petroleum & Chemical Corporation (Sinopec)
— 30.57 30.57 92 92 99 99 29.29
CNOOC Limited 9.14 19.86 19.25 125 116 78 83 27.11
ConocoPhillips (1) — 48.82 51.00 (560) 18 (254) 33 21.66
Eni SpA — 142.08 142.08 (55) (38) 56 73 7.58
Exxon Mobil Corporation 63.50 94.28 93.62 41 40 6 6 15.59
INPEX CORPORATION (7) — 6.15 6.12 210 209 545 548% —
Mitsui & Co., Ltd. — 34.53 34.53 61 61 62 62 9.01
Murphy Oil Corporation — 44.58 44.58 77 77 35 35 11.83
Newfield Exploration Company — 29.35 30.08 108 108 100 100 36.86
OAO LUKOIL 5.72 8.07 8.07 83 83 192 192 34.60
OAO NOVATEK — 0.82 0.89 191 264 332 420 7.44
OJSC Rosneft Oil Company (2) — 4.14 4.14 209 240 — — 19.90
PetroChina Company Limited — 19.75 19.75 91 91 160 160 24.99
Repsol S.A. 8.25 11.32 9.84 2,400 — — — 30.86
Royal Dutch Shell plc 0.14 57.18 52.36 108 106 (17) 2 9.89
Talisman Energy Inc. 14.87 2,495.61 205.99 85 79 (20) (29) 13.67
Total S.A. (5) 36.83 22.38 22.64 107 123 241 236 4.84
All companies $ 19.28 $ 12.43 $ 12.51 105% 123% 154% 179% $ 21.89
Integrated $ 21.97 $ 11.92 $ 12.00 119% 127% 160% 179% $ 21.84
Large independents 11.79 15.33 15.24 (23) 93 135 203 23.24
Independents 16.77 63.26 58.52 85 84 1 (5) 15.43
(a) Performance measures are based on less than three years of results for companies that have had operations for less than three years.(1) – (8) See company footnotes on page 108.

59Global oil and gas reserves study |
Canada

60 | Global oil and gas reserves study
CanadaIncludes the 75 largest companies based on 2012 end-of-year oil and gas reserve estimates.
2008 2009 2010 2011 2012
Proved properties acquired $ 6,704.4 $ 1,019.0 $ 4,216.1 $ 2,151.0 $ 1,701.1
Unproved properties acquired 6,741.4 1,140.6 4,333.2 2,839.6 1,510.7
Exploration 3,922.4 2,783.6 3,382.2 4,083.9 4,030.7
Development 16,737.8 18,198.5 22,934.5 26,740.6 33,160.4
Other 130.4 51.0 96.1 201.6 199.2
Total $ 34,236.3 $ 23,192.7 $ 34,962.2 $ 36,016.7 $ 40,602.1
Canada — capital expenditures (millions)
2008 2009 2010 2011 2012
Revenues $ 57,702.7 $ 40,392.4 $ 47,581.3 $ 51,966.2 $ 49,002.2
Production costs (a) 12,726.4 14,636.8 17,070.6 19,150.1 20,727.3
Exploration expense 1,222.1 1,111.4 1,064.1 1,179.3 1,868.6
DD&A (b) 34,422.3 15,995.5 14,207.1 17,290.3 22,866.9
Other expenses (c) 954.2 1,621.1 (965.4) 2,763.4 2,924.1
Pre-tax results of operations 8,377.6 7,027.6 16,204.9 11,583.1 615.3
Income taxes 4,007.2 1,735.9 3,486.9 2,696.9 48.6
Results of operations $ 4,370.5 $ 5,291.7 $ 12,718.1 $ 8,886.3 $ 566.7
(a) Includes production taxes, transportation costs and production-related general and administrative expenses for those companies that separately disclose these expenses.
(b) Includes impairments.(c) Includes asset retirement obligations accretion for those companies that separately disclose this expense.
Canada — revenues and results of operations (millions)
2008 2009 2010 2011 2012
Beginning of year 5,618.2 5,312.9 12,392.9 12,695.5 14,296.5
Additions:
Extensions and discoveries 322.2 1,199.4 605.2 1,827.2 996.5
Improved recovery 29.0 98.0 42.0 65.0 75.2
Revisions (b) (308.5) 7,273.4 305.6 187.8 950.9
Production (434.0) (498.2) (488.3) (495.8) (549.3)
Purchases 101.1 100.4 163.4 88.0 38.9
Sales (15.0) (1,018.0) (325.4) (25.8) (68.7)
Other (c) — (75.0) — (45.3) 1.0
End of year 5,312.9 12,392.9 12,695.5 14,296.5 15,741.1
(a) Includes condensate, natural gas liquids, synthetic crude and bitumen.(b) Revisions for 2009 include 6,479.6 million barrels related to the addition of synthetic crude due to the SEC Rule. These reserves are not
included in the performance measure calculations.(c) Includes transfers, reclassifications and other.
Canada — proved oil reserves (a) (million barrels)

61Global oil and gas reserves study |
2008 2009 2010 2011 2012
Beginning of year 28,597.6 29,258.1 25,031.2 25,576.7 26,008.9
Additions:
Extensions and discoveries 2,726.2 2,917.8 2,992.9 3,390.7 1,477.4
Improved recovery 100.0 19.0 30.0 90.0 21.2
Revisions 390.8 (1,786.6) 897.8 95.1 (5,869.7)
Production (3,296.4) (3,296.0) (2,909.9) (2,887.3) (2,757.9)
Purchases 1,061.2 88.3 1,832.8 893.7 235.6
Sales (321.2) (2,050.3) (2,298.1) (883.0) (872.5)
Other (a) 0.0 (119.2) — (267.0) —
End of year 29,258.1 25,031.2 25,576.7 26,008.9 18,243.1
(a) Includes transfers, reclassifications and other.
Canada — proved gas reserves (Bcf)
Canada — proved reserve acquisition costs (PRAC), finding and development costs (FDC) and reserve replacement costs (RRC) ($ per boe)
2008 2009 2010 2011 2012 3-year 5-year
PRAC $ 24.12 $ 8.85 $ 8.99 $ 9.08 $ 21.76 $ 10.29 $ 13.42
FDC 47.57 9.71 19.14 12.66 30.06 18.56 18.16
RRC 39.96 9.67 16.85 12.36 29.59 17.54 17.58
Canada — oil production replacement rates
2008 2009 2010 2011 2012 3-year 5-year
All sources 30% 236% 162% 432% 363% 321% 253%
Excluding purchases and sales
10 420 195 420 368 330 292
Canada — gas production replacement rates
2008 2009 2010 2011 2012 3-year 5-year
All sources 120% (25)% 119% 124% (182)% 24% 34%
Excluding purchases and sales
98 35 135 124 (158) 37 49
Canada — production costs ($ per boe)
2008 2009 2010 2011 2012 3-year 5-year
$ 12.94 $ 13.97 $ 17.54 $ 19.60 $ 20.54 $ 19.24 $ 16.90

62 | Global oil and gas reserves study
Canada — capital expenditures for the latest fiscal year
Millions
Proved properties acquired
Unproved properties acquired Exploration Development Other
Total capital expenditures
Apache Corporation $ 5.0 $ — $ 111.0 $ 762.0 $ — $ 878.0
BP p.l.c. (1) — — 222.0 590.0 — 812.0
Canadian Natural Resources Limited 144.1 44.0 251.1 5,775.3 — 6,214.5
Chevron Corporation — — — — — —
ConocoPhillips (1) 3.0 26.0 295.0 3,394.0 — 3,718.0
Devon Energy Corporation 71.0 43.0 304.0 1,691.0 — 2,109.0
Encana Corporation 18.0 121.0 201.0 1,366.0 — 1,706.0
EOG Resources, Inc. — 33.6 38.5 246.0 33.0 351.1
Exxon Mobil Corporation 2.0 74.0 405.0 7,601.0 — 8,082.0
Husky Energy Inc. 6.0 15.0 338.1 4,076.6 — 4,435.8
Marathon Oil Corporation — — 31.0 195.0 — 226.0
Murphy Oil Corporation 242.4 14.6 56.9 583.8 80.8 978.5
Nexen Inc. — — 153.1 1,229.5 — 1,382.6
Pengrowth Energy Corporation 1,156.7 705.3 72.1 556.6 4.4 2,495.2
Penn West Petroleum Ltd. 52.0 37.0 241.0 1,595.0 — 1,925.0
Quicksilver Resources Inc. — 5.6 8.3 178.8 — 192.7
Royal Dutch Shell plc 1.0 381.0 1,109.0 2,113.0 — 3,604.0
Sasol Limited — — — 882.7 — 882.7
Southwestern Energy Company — 3.6 2.5 — — 6.1
Talisman Energy Inc. — 7.0 191.0 324.0 81.0 603.0
All companies $ 1,701.1 $ 1,510.7 $ 4,030.7 $ 33,160.4 $ 199.2 $ 40,602.1
Integrateds $ 3.0 $ 455.0 $ 1,736.0 $ 11,186.7 $ — $ 13,380.7
Large independents 241.1 267.6 1,231.6 13,429.3 33.0 15,202.6
Independents 1,457.1 788.2 1,063.0 8,544.4 166.2 12,018.9
(1) – (8) See company footnotes on page 108.
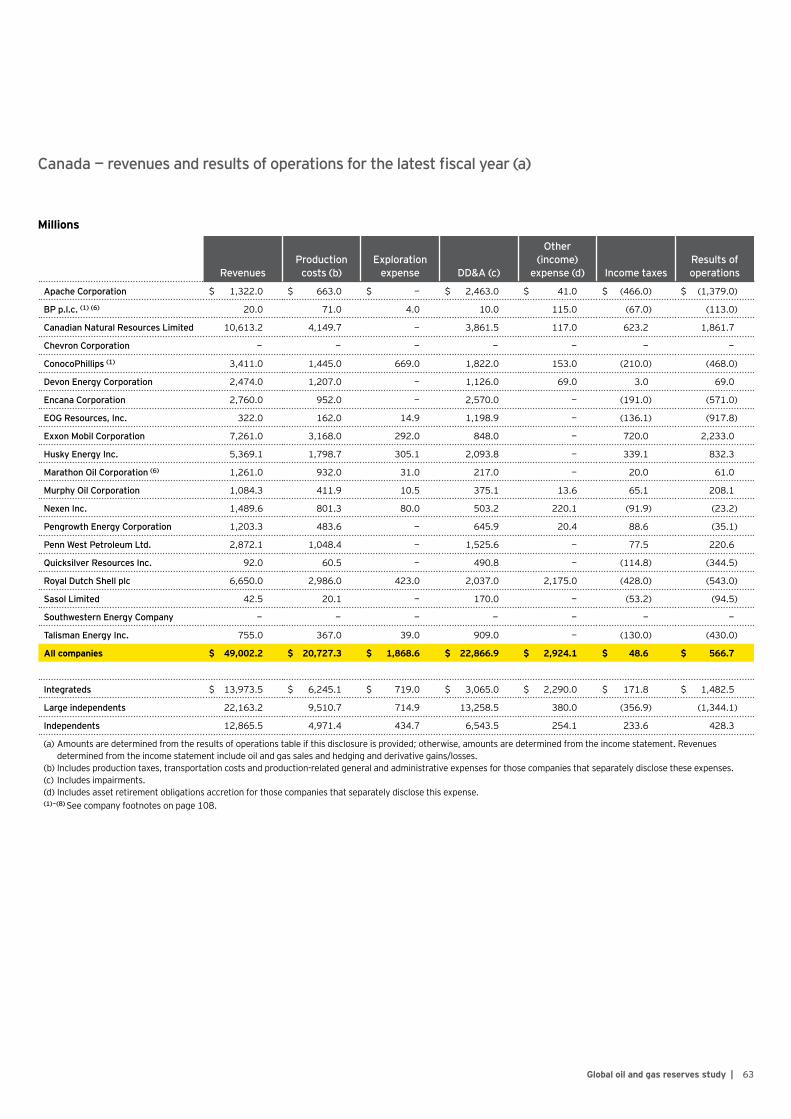
63Global oil and gas reserves study |
Canada — revenues and results of operations for the latest fiscal year (a)
Millions
RevenuesProduction
costs (b)Exploration
expense DD&A (c)
Other (income)
expense (d) Income taxesResults of operations
Apache Corporation $ 1,322.0 $ 663.0 $ — $ 2,463.0 $ 41.0 $ (466.0) $ (1,379.0)
BP p.l.c. (1) (6) 20.0 71.0 4.0 10.0 115.0 (67.0) (113.0)
Canadian Natural Resources Limited 10,613.2 4,149.7 — 3,861.5 117.0 623.2 1,861.7
Chevron Corporation — — — — — — —
ConocoPhillips (1) 3,411.0 1,445.0 669.0 1,822.0 153.0 (210.0) (468.0)
Devon Energy Corporation 2,474.0 1,207.0 — 1,126.0 69.0 3.0 69.0
Encana Corporation 2,760.0 952.0 — 2,570.0 — (191.0) (571.0)
EOG Resources, Inc. 322.0 162.0 14.9 1,198.9 — (136.1) (917.8)
Exxon Mobil Corporation 7,261.0 3,168.0 292.0 848.0 — 720.0 2,233.0
Husky Energy Inc. 5,369.1 1,798.7 305.1 2,093.8 — 339.1 832.3
Marathon Oil Corporation (6) 1,261.0 932.0 31.0 217.0 — 20.0 61.0
Murphy Oil Corporation 1,084.3 411.9 10.5 375.1 13.6 65.1 208.1
Nexen Inc. 1,489.6 801.3 80.0 503.2 220.1 (91.9) (23.2)
Pengrowth Energy Corporation 1,203.3 483.6 — 645.9 20.4 88.6 (35.1)
Penn West Petroleum Ltd. 2,872.1 1,048.4 — 1,525.6 — 77.5 220.6
Quicksilver Resources Inc. 92.0 60.5 — 490.8 — (114.8) (344.5)
Royal Dutch Shell plc 6,650.0 2,986.0 423.0 2,037.0 2,175.0 (428.0) (543.0)
Sasol Limited 42.5 20.1 — 170.0 — (53.2) (94.5)
Southwestern Energy Company — — — — — — —
Talisman Energy Inc. 755.0 367.0 39.0 909.0 — (130.0) (430.0)
All companies $ 49,002.2 $ 20,727.3 $ 1,868.6 $ 22,866.9 $ 2,924.1 $ 48.6 $ 566.7
Integrateds $ 13,973.5 $ 6,245.1 $ 719.0 $ 3,065.0 $ 2,290.0 $ 171.8 $ 1,482.5
Large independents 22,163.2 9,510.7 714.9 13,258.5 380.0 (356.9) (1,344.1)
Independents 12,865.5 4,971.4 434.7 6,543.5 254.1 233.6 428.3
(a) Amounts are determined from the results of operations table if this disclosure is provided; otherwise, amounts are determined from the income statement. Revenues determined from the income statement include oil and gas sales and hedging and derivative gains/losses.
(b) Includes production taxes, transportation costs and production-related general and administrative expenses for those companies that separately disclose these expenses.(c) Includes impairments.(d) Includes asset retirement obligations accretion for those companies that separately disclose this expense.(1) – (8) See company footnotes on page 108.

64 | Global oil and gas reserves study
Canada — oil reserves for the latest fiscal year (a)
Million barrels
Beginning
Extensions and
discoveriesImproved recovery Revisions Production Purchases Sales Other (b) Ending
Ending rank
Apache Corporation 173.0 26.6 — (7.1) (8.1) 0.2 — — 184.6 12
BP p.l.c. (1) 178.0 — — 17.0 — — — — 195.0 11
Canadian Natural Resources Limited
3,071.0 95.0 34.0 272.0 (131.0) 2.0 — — 3,343.0 2
Chevron Corporation 523.0 — — 6.0 (16.0) — — — 513.0 9
ConocoPhillips (1) 1,520.0 313.0 — 190.0 (47.0) — — — 1,976.0 3
Devon Energy Corporation 564.0 76.0 — 9.0 (36.0) — — — 613.0 7
Encana Corporation 95.0 25.9 — (10.0) (7.1) — (2.2) — 101.6 15
EOG Resources, Inc. 19.8 5.9 — (1.9) (2.9) — (1.4) — 19.4 17
Exxon Mobil Corporation 3,877.0 372.0 — 269.0 (88.0) — (1.0) — 4,429.0 1
Husky Energy Inc. 651.0 35.0 16.0 25.0 (66.0) — (1.0) — 660.0 5
Marathon Oil Corporation 623.0 — — 45.0 (15.0) — — — 653.0 6
Murphy Oil Corporation 166.1 2.9 — (8.7) (10.4) 6.0 — — 155.9 13
Nexen Inc. 577.0 14.0 — 2.0 (12.0) — — — 581.0 8
Pengrowth Energy Corporation
105.6 13.0 — 2.6 (13.1) 30.7 (0.3) — 138.5 14
Penn West Petroleum Ltd. 321.0 5.0 25.0 1.0 (31.0) — (49.0) 1.0 273.0 10
Quicksilver Resources Inc. 0.0 — — 0.0 (0.0) — — — 0.0 19
Royal Dutch Shell plc 1,770.0 2.0 — 135.0 (60.0) — (2.0) — 1,845.0 4
Sasol Limited — — 0.2 — — — — — 0.2 18
Southwestern Energy Company
— — — — — — — — — —
Talisman Energy Inc. 62.0 10.3 — 5.1 (5.7) — (11.8) — 59.9 16
All companies 14,296.5 996.5 75.2 950.9 (549.3) 38.9 (68.7) 1.0 15,741.1
Integrateds 6,348.0 374.0 0.2 427.0 (164.0) — (3.0) — 6,982.2
Large independents 6,065.8 542.3 34.0 496.9 (247.1) 2.2 (3.6) — 6,890.6
Independents 1,882.7 80.2 41.0 27.0 (138.2) 36.7 (62.1) 1.0 1,868.3
(a) Includes condensate, natural gas liquids and synthetic crude.(b) Includes transfers, reclassifications and other.(1) – (8) See company footnotes on page 108.

65Global oil and gas reserves study |
Canada — gas reserves for the latest fiscal year
Bcf
Beginning
Extensions and
discoveriesImproved recovery Revisions Production Purchases Sales Other (a) Ending
Ending rank
Apache Corporation 3,547.5 252.1 — (1,444.0) (219.8) 2.5 (0.4) — 2,137.9 3
BP p.l.c. (1) 28.0 — — (19.0) (5.0) — — — 4.0 17
Canadian Natural Resources Limited
3,499.0 50.0 11.0 (517.0) (429.0) 34.0 (1.0) — 2,647.0 2
Chevron Corporation — — — — — — — — — —
ConocoPhillips (1) 2,113.0 75.0 — (111.0) (313.0) 2.0 (2.0) — 1,764.0 4
Devon Energy Corporation 979.0 34.0 — (132.0) (186.0) — (11.0) — 684.0 9
Encana Corporation 6,329.0 638.0 — (1,497.0) (497.0) 38.0 (461.0) — 4,550.0 1
EOG Resources, Inc. 1,035.9 — — (894.5) (34.6) — (8.5) — 98.3 14
Exxon Mobil Corporation 835.0 95.0 — 168.0 (153.0) — (20.0) — 925.0 8
Husky Energy Inc. 1,824.0 140.0 — (357.0) (190.0) — — — 1,417.0 5
Marathon Oil Corporation — — — — — — — — — —
Murphy Oil Corporation 638.9 25.8 — (37.2) (79.5) 2.4 — — 550.4 10
Nexen Inc. 325.0 — — (139.0) (43.0) — (69.0) — 74.0 15
Pengrowth Energy Corporation
501.4 3.1 — (69.8) (78.8) 156.7 (2.4) — 510.2 12
Penn West Petroleum Ltd. 630.0 15.0 11.0 (20.0) (101.0) — (9.0) — 526.0 11
Quicksilver Resources Inc. 330.6 0.0 — (33.9) (29.9) — — — 266.8 13
Royal Dutch Shell plc 2,045.0 84.0 — (683.0) (244.0) — (191.0) — 1,011.0 7
Sasol Limited 54.9 — (0.8) 18.1 (17.0) — — — 55.2 16
Southwestern Energy Company
— — — — — — — — — —
Talisman Energy Inc. 1,292.7 65.4 — (101.4) (137.2) — (97.2) — 1,022.3 6
All companies 26,008.9 1,477.4 21.2 (5,869.7) (2,757.9) 235.6 (872.5) — 18,243.1
Integrateds 2,962.9 179.0 (0.8) (515.9) (419.0) — (211.0) — 1,995.2
Large independents 17,503.4 1,049.1 11.0 (4,595.5) (1,679.4) 76.5 (483.9) — 11,881.2
Independents 5,542.6 249.3 11.0 (758.3) (659.4) 159.1 (177.6) — 4,366.7
(a) Includes transfers, reclassifications and other.(1) – (8) See company footnotes on page 108.

66 | Global oil and gas reserves study
Canada — performance measures (three-year averages) (a)
Costs in $ per boe, production replacement rates in %
Production replacement rates
Oil Gas
PRAC FDC RRCAll
sources
Excluding purchases and sales
All sources
Excluding purchases and sales
Production costs
Apache Corporation $ 12.38 $ (46.58) $ 41.92 273% 82% 72% (93)% $ 14.72
BP p.l.c. (1) 6.75 14.44 14.39 9,250 9,800 (1,239) (34) 22.97
Canadian Natural Resources Limited
12.37 16.35 15.53 297 263 70 11 19.25
Chevron Corporation — — — 233 133 — — —
ConocoPhillips (1) 8.00 8.60 8.60 515 717 47 56 14.17
Devon Energy Corporation 18.41 35.58 35.08 167 167 1 (0) 16.15
Encana Corporation 9.51 22.73 21.19 484 532 47 79 9.89
EOG Resources, Inc. — (7.30) (7.30) 8 31 (832) (624) 15.16
Exxon Mobil Corporation — 10.28 10.28 667 671 21 87 23.87
Husky Energy Inc. 9.64 38.53 29.19 153 134 84 (3) 16.98
Marathon Oil Corporation — 16.59 16.65 232 232 — — 62.13
Murphy Oil Corporation 25.42 20.59 20.97 96 77 337 322 18.09
Nexen Inc. — 80.46 80.46 22 100 (33) 27 40.22
Pengrowth Energy Corporation 19.39 46.69 32.66 219 130 144 49 18.00
Penn West Petroleum Ltd. (53.47) 30.84 21.61 79 140 50 58 20.91
Quicksilver Resources Inc. 5.25 32.52 26.23 57 57 117 90 11.77
Royal Dutch Shell plc — 23.90 23.90 195 196 77 107 29.90
Sasol Limited 12.87 482.15 126.65 — — 377 87 7.05
Southwestern Energy Company — — — — — — — —
Talisman Energy Inc. — 28.67 28.75 (59) 88 (113) 103 12.18
All companies $ 10.29 $ 18.56 $ 17.54 321% 330% 24% 37% $ 19.24
Integrated $ 2.69 $13.24 $ 13.03 507% 504% (26)% 89% $ 24.77
Large independents 12.22 18.96 17.70 315 331 24 7 16.82
Independents 7.62 35.24 29.05 116 126 57 76 18.98
(a) Performance measures are based on less than three years of results for companies that have had operations for less than three years.(1) – (8) See company footnotes on page 108.
Europe
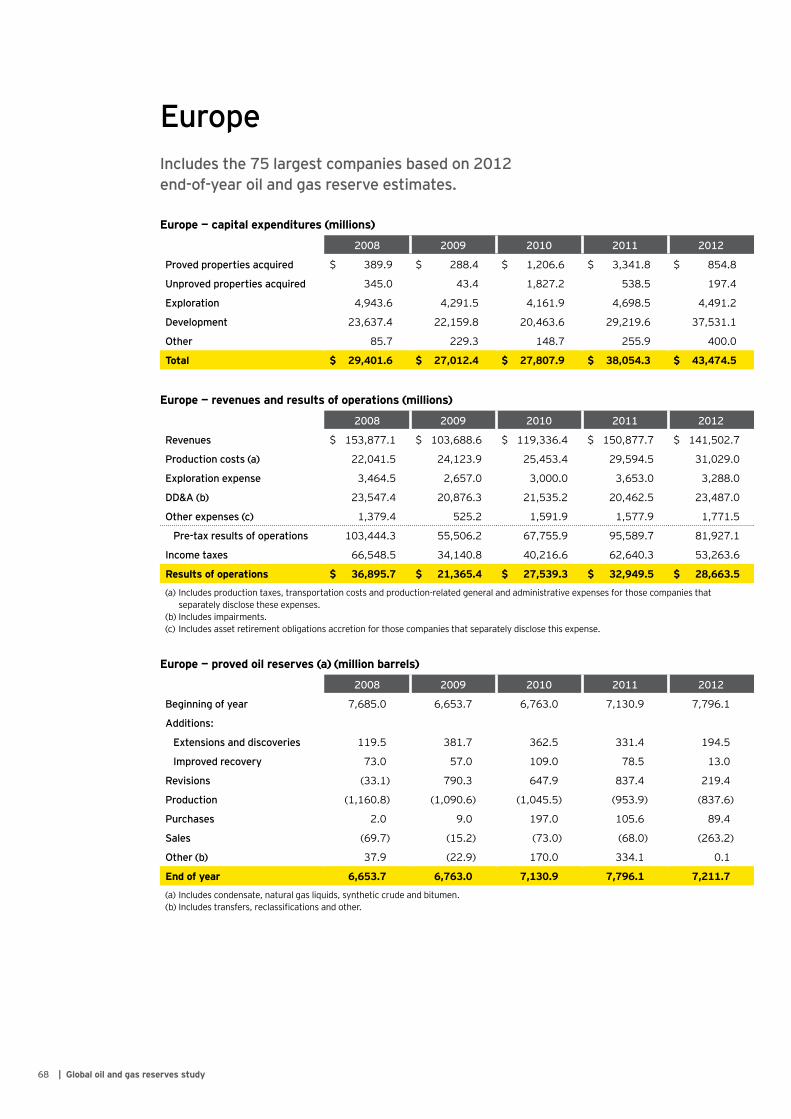
68 | Global oil and gas reserves study
EuropeIncludes the 75 largest companies based on 2012 end-of-year oil and gas reserve estimates.
2008 2009 2010 2011 2012
Proved properties acquired $ 389.9 $ 288.4 $ 1,206.6 $ 3,341.8 $ 854.8
Unproved properties acquired 345.0 43.4 1,827.2 538.5 197.4
Exploration 4,943.6 4,291.5 4,161.9 4,698.5 4,491.2
Development 23,637.4 22,159.8 20,463.6 29,219.6 37,531.1
Other 85.7 229.3 148.7 255.9 400.0
Total $ 29,401.6 $ 27,012.4 $ 27,807.9 $ 38,054.3 $ 43,474.5
Europe — capital expenditures (millions)
2008 2009 2010 2011 2012
Revenues $ 153,877.1 $ 103,688.6 $ 119,336.4 $ 150,877.7 $ 141,502.7
Production costs (a) 22,041.5 24,123.9 25,453.4 29,594.5 31,029.0
Exploration expense 3,464.5 2,657.0 3,000.0 3,653.0 3,288.0
DD&A (b) 23,547.4 20,876.3 21,535.2 20,462.5 23,487.0
Other expenses (c) 1,379.4 525.2 1,591.9 1,577.9 1,771.5
Pre-tax results of operations 103,444.3 55,506.2 67,755.9 95,589.7 81,927.1
Income taxes 66,548.5 34,140.8 40,216.6 62,640.3 53,263.6
Results of operations $ 36,895.7 $ 21,365.4 $ 27,539.3 $ 32,949.5 $ 28,663.5
(a) Includes production taxes, transportation costs and production-related general and administrative expenses for those companies that separately disclose these expenses.
(b) Includes impairments.(c) Includes asset retirement obligations accretion for those companies that separately disclose this expense.
Europe — revenues and results of operations (millions)
2008 2009 2010 2011 2012
Beginning of year 7,685.0 6,653.7 6,763.0 7,130.9 7,796.1
Additions:
Extensions and discoveries 119.5 381.7 362.5 331.4 194.5
Improved recovery 73.0 57.0 109.0 78.5 13.0
Revisions (33.1) 790.3 647.9 837.4 219.4
Production (1,160.8) (1,090.6) (1,045.5) (953.9) (837.6)
Purchases 2.0 9.0 197.0 105.6 89.4
Sales (69.7) (15.2) (73.0) (68.0) (263.2)
Other (b) 37.9 (22.9) 170.0 334.1 0.1
End of year 6,653.7 6,763.0 7,130.9 7,796.1 7,211.7
(a) Includes condensate, natural gas liquids, synthetic crude and bitumen.(b) Includes transfers, reclassifications and other.
Europe — proved oil reserves (a) (million barrels)
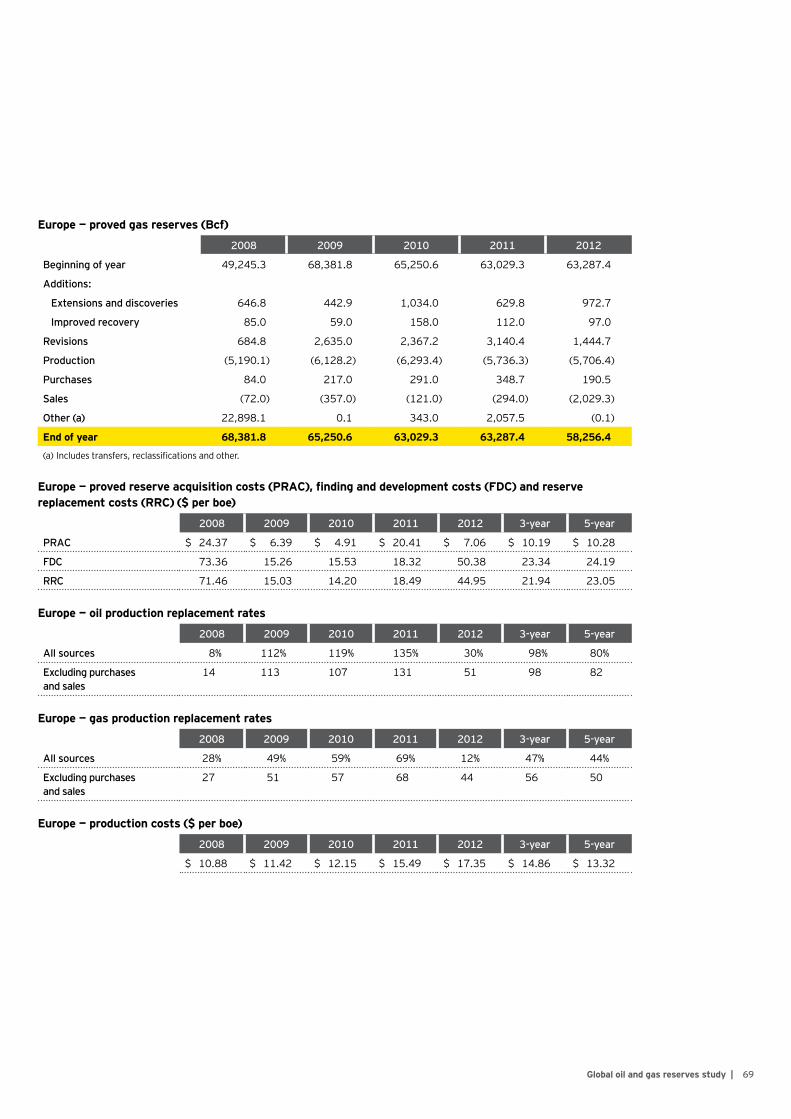
69Global oil and gas reserves study |
2008 2009 2010 2011 2012
Beginning of year 49,245.3 68,381.8 65,250.6 63,029.3 63,287.4
Additions:
Extensions and discoveries 646.8 442.9 1,034.0 629.8 972.7
Improved recovery 85.0 59.0 158.0 112.0 97.0
Revisions 684.8 2,635.0 2,367.2 3,140.4 1,444.7
Production (5,190.1) (6,128.2) (6,293.4) (5,736.3) (5,706.4)
Purchases 84.0 217.0 291.0 348.7 190.5
Sales (72.0) (357.0) (121.0) (294.0) (2,029.3)
Other (a) 22,898.1 0.1 343.0 2,057.5 (0.1)
End of year 68,381.8 65,250.6 63,029.3 63,287.4 58,256.4
(a) Includes transfers, reclassifications and other.
Europe — proved gas reserves (Bcf)
Europe — proved reserve acquisition costs (PRAC), finding and development costs (FDC) and reserve replacement costs (RRC) ($ per boe)
2008 2009 2010 2011 2012 3-year 5-year
PRAC $ 24.37 $ 6.39 $ 4.91 $ 20.41 $ 7.06 $ 10.19 $ 10.28
FDC 73.36 15.26 15.53 18.32 50.38 23.34 24.19
RRC 71.46 15.03 14.20 18.49 44.95 21.94 23.05
Europe — oil production replacement rates
2008 2009 2010 2011 2012 3-year 5-year
All sources 8% 112% 119% 135% 30% 98% 80%
Excluding purchases and sales
14 113 107 131 51 98 82
Europe — gas production replacement rates
2008 2009 2010 2011 2012 3-year 5-year
All sources 28% 49% 59% 69% 12% 47% 44%
Excluding purchases and sales
27 51 57 68 44 56 50
Europe — production costs ($ per boe)
2008 2009 2010 2011 2012 3-year 5-year
$ 10.88 $ 11.42 $ 12.15 $ 15.49 $ 17.35 $ 14.86 $ 13.32

70 | Global oil and gas reserves study
Europe — capital expenditures for the latest fiscal year
Millions
Proved properties acquired
Unproved properties acquired Exploration Development Other
Total capital expenditures
Apache Corporation $ 110.0 $ 26.0 $ 111.0 $ 837.0 $ — $ 1,084.0
BG Group plc — — 156.0 941.0 — 1,097.0
BP p.l.c. — — 220.0 2,691.0 — 2,911.0
Canadian Natural Resources Limited — — — 556.2 — 556.2
Chevron Corporation — — 253.0 753.0 — 1,006.0
ConocoPhillips — 2.0 102.0 3,515.0 — 3,619.0
Eni SpA (1) — — 252.1 4,564.0 — 4,816.1
Exxon Mobil Corporation (1) 95.0 24.0 488.0 2,793.0 — 3,400.0
Forest Oil Corporation — — 0.7 0.2 — 0.9
Hess Corporation — 78.0 89.0 1,792.0 — 1,959.0
Marathon Oil Corporation 3.0 — 54.0 468.0 — 525.0
Murphy Oil Corporation — — (1.0) 58.1 (11.5) 45.6
Nexen Inc. — — 202.1 1,003.4 — 1,205.5
OMV Aktiengesellschaft — — 207.7 1,088.8 (49.5) 1,247.0
Repsol S.A. — — 102.9 123.5 — 226.3
Royal Dutch Shell plc (1) 387.0 16.0 459.0 3,289.0 — 4,151.0
Statoil ASA — — 893.7 7,854.6 — 8,748.3
Talisman Energy Inc. — — 132.0 1,110.0 461.0 1,703.0
Total S.A. (5) 259.8 51.4 769.0 4,093.4 — 5,173.6
All companies $ 854.8 $ 197.4 $ 4,491.2 $ 37,531.1 $ 400.0 $ 43,474.5
Integrateds $ 741.8 $ 169.4 $ 3,734.4 $ 29,042.2 $ (49.5) $ 33,638.3
Large independents 113.0 28.0 423.0 6,317.2 — 6,881.2
Independents — — 333.8 2,171.7 449.5 2,955.0
(1) – (8) See company footnotes on page 108.

71Global oil and gas reserves study |
Europe — revenues and results of operations for the latest fiscal year (a)
Millions
RevenuesProduction
costs (b)Exploration
expense DD&A (c)
Other (income)
expense (d) Income taxesResults of operations
Apache Corporation $ 2,751.0 $ 790.0 $ — $ 912.0 $ 58.0 $ 614.0 $ 377.0
BG Group plc 2,951.0 516.0 86.0 340.0 90.0 1,234.0 685.0
BP p.l.c. (6) 5,429.0 1,750.0 134.0 1,391.0 (1,084.0) 808.0 2,430.0
Canadian Natural Resources Limited 837.3 426.2 — 296.1 27.0 55.0 33.0
Chevron Corporation 3,766.0 640.0 272.0 556.0 33.0 1,511.0 754.0
ConocoPhillips 8,198.0 1,235.0 104.0 1,169.0 172.0 3,980.0 1,538.0
Eni SpA (1) 9,845.7 1,626.8 245.6 1,944.4 423.1 3,140.4 2,465.3
Exxon Mobil Corporation (1) 18,648.0 6,894.0 291.0 1,711.0 — 6,307.0 3,445.0
Forest Oil Corporation — — — 34.8 0.1 — (34.9)
Hess Corporation 2,460.0 1,059.0 71.0 585.0 — 334.0 411.0
Marathon Oil Corporation (6) 4,449.0 393.0 42.0 614.0 — 2,537.0 863.0
Murphy Oil Corporation — — — — — — —
Nexen Inc. 3,890.6 439.2 117.0 752.3 18.0 2,047.8 516.2
OMV Aktiengesellschaft 4,460.6 1,420.6 138.6 764.0 50.2 413.9 1,673.3
Repsol S.A. 104.2 25.7 108.0 47.6 5.1 (48.9) (33.4)
Royal Dutch Shell plc (1) 21,428.0 6,851.0 364.0 1,740.0 941.0 7,296.0 4,236.0
Statoil ASA 37,932.2 3,815.6 601.6 5,121.8 618.7 19,885.6 7,888.9
Talisman Energy Inc. 2,980.0 1,452.0 92.0 2,954.0 — (1,324.0) (194.0)
Total S.A. (5) 11,372.2 1,695.0 621.1 2,554.0 419.2 4,472.7 1,610.1
All companies $ 141,502.7 $ 31,029.0 $ 3,288.0 $ 23,487.0 $ 1,771.5 $ 53,263.6 $ 28,663.5
Integrateds $ 115,445.8 $ 25,777.7 $ 2,847.0 $ 16,414.8 $ 1,406.5 $ 44,119.8 $ 24,880.1
Large independents 19,186.3 3,360.2 232.0 3,331.1 347.0 8,420.0 3,496.0
Independents 6,870.6 1,891.2 209.0 3,741.1 18.1 723.8 287.3
(a) Amounts are determined from the results of operations table if this disclosure is provided; otherwise, amounts are determined from the income statement. Revenues determined from the income statement include oil and gas sales and hedging and derivative gains/losses.
(b) Includes production taxes, transportation costs and production-related general and administrative expenses for those companies that separately disclose these expenses.(c) Includes impairments.(d) Includes asset retirement obligations accretion for those companies that separately disclose this expense.(1) – (8) See company footnotes on page 108.

72 | Global oil and gas reserves study
Europe — oil reserves for the latest fiscal year (a)
Million barrels
Beginning
Extensions and
discoveriesImproved recovery Revisions Production Purchases Sales Other (b) Ending
Ending rank
Apache Corporation 178.7 0.6 — (7.3) (23.9) 2.4 — — 150.5 14
BG Group plc 164.6 1.4 — 7.5 (20.8) — — — 152.7 13
BP p.l.c. 1,032.0 1.0 3.0 (55.0) (39.0) 4.0 (24.0) — 922.0 2
Canadian Natural Resources Limited
244.0 — — (2.0) (7.0) — — — 235.0 10
Chevron Corporation 159.0 — 9.0 16.0 (27.0) — — — 157.0 12
ConocoPhillips 555.0 3.0 — 26.0 (51.0) — (16.0) — 517.0 6
Eni SpA (1) 631.0 3.0 1.0 1.0 (58.0) — — — 578.0 5
Exxon Mobil Corporation (1) 346.0 8.0 — 15.0 (64.0) 20.0 (8.0) — 317.0 9
Forest Oil Corporation — — — — — — — — — —
Hess Corporation 494.0 18.0 — (16.0) (31.0) — (49.0) — 416.0 8
Marathon Oil Corporation 97.0 — — 28.0 (36.0) — — — 89.0 16
Murphy Oil Corporation 21.6 — — 0.3 (1.3) — — — 20.6 17
Nexen Inc. 193.0 4.0 — 18.0 (34.0) — — — 181.0 11
OMV Aktiengesellschaft 441.5 1.3 — 22.6 (34.5) — — 0.1 431.0 7
Repsol S.A. 6.0 — — — (1.0) — — — 5.0 18
Royal Dutch Shell plc (1) 754.0 44.0 — 19.0 (80.0) 56.0 — — 793.0 3
Statoil ASA 1,369.0 100.0 — 150.0 (231.0) — (17.0) — 1,371.0 1
Talisman Energy Inc. 297.7 (16.8) — (23.7) (26.1) — (117.2) — 113.9 15
Total S.A. 812.0 27.0 — 20.0 (72.0) 7.0 (32.0) — 762.0 4
All companies 7,796.1 194.5 13.0 219.4 (837.6) 89.4 (263.2) 0.1 7,211.7
Integrateds 6,044.5 202.3 13.0 172.6 (637.5) 87.0 (130.0) 0.1 5,752.0
Large independents 1,239.3 5.0 — 52.2 (138.7) 2.4 (16.0) — 1,144.2
Independents 512.3 (12.8) — (5.4) (61.4) — (117.2) — 315.5
(a) Includes condensate, natural gas liquids and synthetic crude.(b) Includes transfers, reclassifications and other.(1) – (8) See company footnotes on page 108.

73Global oil and gas reserves study |
Europe — gas reserves for the latest fiscal year
Bcf
Beginning
Extensions and
discoveriesImproved recovery Revisions Production Purchases Sales Other (a) Ending
Ending rank
Apache Corporation 108.4 16.4 — — (21.0) 8.5 — — 112.3 12
BG Group plc 936.0 (1.0) — (22.0) (87.0) — — — 826.0 9
BP p.l.c. 2,813.0 7.0 95.0 (31.0) (169.0) 16.0 (546.0) — 2,185.0 7
Canadian Natural Resources Limited
97.0 — — (13.0) (1.0) — — — 83.0 14
Chevron Corporation 258.0 — 2.0 84.0 (87.0) — — — 257.0 11
ConocoPhillips 1,896.0 36.0 — 96.0 (208.0) — (14.0) — 1,806.0 8
Eni SpA (1) 3,918.0 39.0 — 197.0 (422.0) — (782.0) — 2,950.0 5
Exxon Mobil Corporation (1) 13,755.0 184.0 — 185.0 (1,206.0) 6.0 (140.0) — 12,784.0 3
Forest Oil Corporation 51.7 — — (51.7) — — — — — —
Hess Corporation 563.0 1.0 — 4.0 (19.0) — (192.0) — 357.0 10
Marathon Oil Corporation 119.0 — — 15.0 (31.0) — — — 103.0 13
Murphy Oil Corporation 21.0 — — (0.5) (1.2) — — — 19.3 17
Nexen Inc. 66.0 1.0 — 13.0 (14.0) — — — 66.0 16
OMV Aktiengesellschaft 2,494.9 70.6 — (9.0) (230.7) — — (0.1) 2,325.7 6
Repsol S.A. — — — 2.0 (2.0) — — — — —
Royal Dutch Shell plc (1) 15,401.0 71.0 — (75.0) (1,251.0) 22.0 — — 14,168.0 2
Statoil ASA 15,689.0 279.0 — 824.0 (1,483.0) — (305.0) — 15,004.0 1
Talisman Energy Inc. 86.3 52.7 — (41.1) (11.5) — (20.3) — 66.1 15
Total S.A. 5,014.0 216.0 — 268.0 (462.0) 138.0 (30.0) — 5,144.0 4
All companies 63,287.4 972.7 97.0 1,444.7 (5,706.4) 190.5 (2,029.3) (0.1) 58,256.4
Integrateds 59,905.9 867.6 97.0 1,449.0 (5,331.7) 182.0 (1,995.0) (0.1) 55,174.7
Large independents 3,156.4 51.4 — 76.0 (348.0) 8.5 (14.0) — 2,930.3
Independents 225.0 53.7 — (80.3) (26.7) — (20.3) — 151.4
(a) Includes transfers, reclassifications and other.(1) – (8) See company footnotes on page 108.
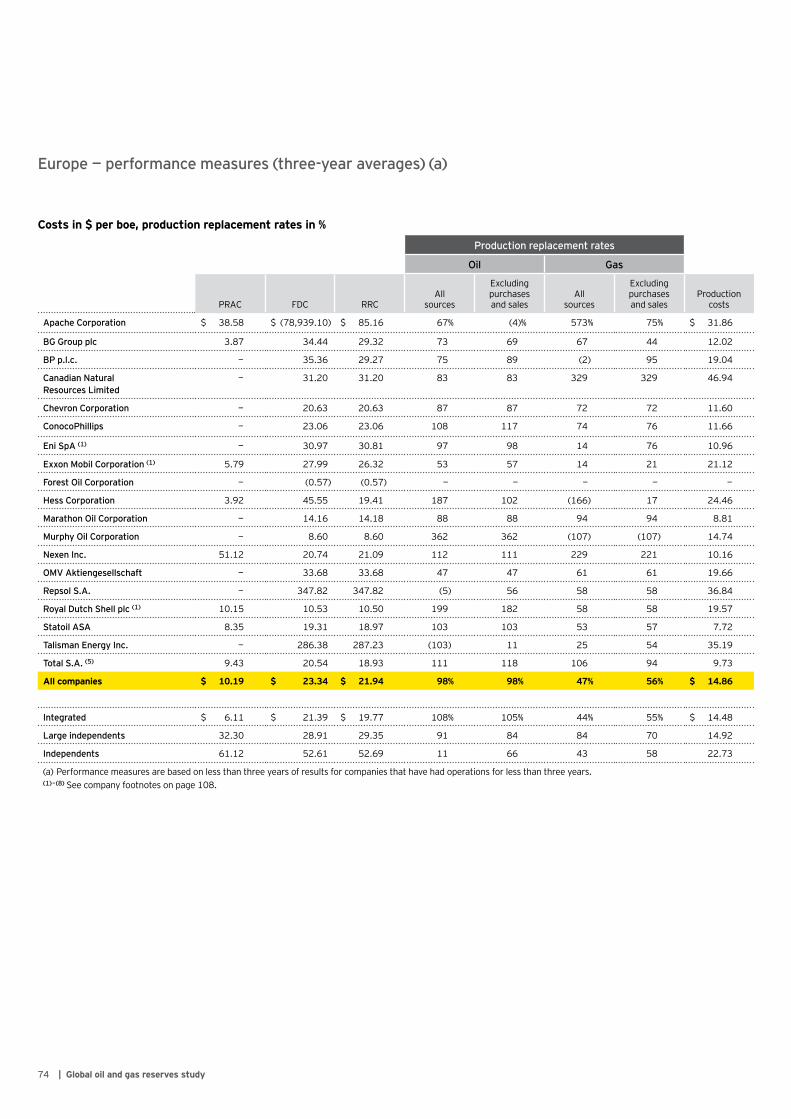
74 | Global oil and gas reserves study
Europe — performance measures (three-year averages) (a)
Costs in $ per boe, production replacement rates in %
Production replacement rates
Oil Gas
PRAC FDC RRCAll
sources
Excluding purchases and sales
All sources
Excluding purchases and sales
Production costs
Apache Corporation $ 38.58 $ (78,939.10) $ 85.16 67% (4)% 573% 75% $ 31.86
BG Group plc 3.87 34.44 29.32 73 69 67 44 12.02
BP p.l.c. — 35.36 29.27 75 89 (2) 95 19.04
Canadian Natural Resources Limited
— 31.20 31.20 83 83 329 329 46.94
Chevron Corporation — 20.63 20.63 87 87 72 72 11.60
ConocoPhillips — 23.06 23.06 108 117 74 76 11.66
Eni SpA (1) — 30.97 30.81 97 98 14 76 10.96
Exxon Mobil Corporation (1) 5.79 27.99 26.32 53 57 14 21 21.12
Forest Oil Corporation — (0.57) (0.57) — — — — —
Hess Corporation 3.92 45.55 19.41 187 102 (166) 17 24.46
Marathon Oil Corporation — 14.16 14.18 88 88 94 94 8.81
Murphy Oil Corporation — 8.60 8.60 362 362 (107) (107) 14.74
Nexen Inc. 51.12 20.74 21.09 112 111 229 221 10.16
OMV Aktiengesellschaft — 33.68 33.68 47 47 61 61 19.66
Repsol S.A. — 347.82 347.82 (5) 56 58 58 36.84
Royal Dutch Shell plc (1) 10.15 10.53 10.50 199 182 58 58 19.57
Statoil ASA 8.35 19.31 18.97 103 103 53 57 7.72
Talisman Energy Inc. — 286.38 287.23 (103) 11 25 54 35.19
Total S.A. (5) 9.43 20.54 18.93 111 118 106 94 9.73
All companies $ 10.19 $ 23.34 $ 21.94 98% 98% 47% 56% $ 14.86
Integrated $ 6.11 $ 21.39 $ 19.77 108% 105% 44% 55% $ 14.48
Large independents 32.30 28.91 29.35 91 84 84 70 14.92
Independents 61.12 52.61 52.69 11 66 43 58 22.73
(a) Performance measures are based on less than three years of results for companies that have had operations for less than three years.(1) – (8) See company footnotes on page 108.

75Global oil and gas reserves study |
South and Central America
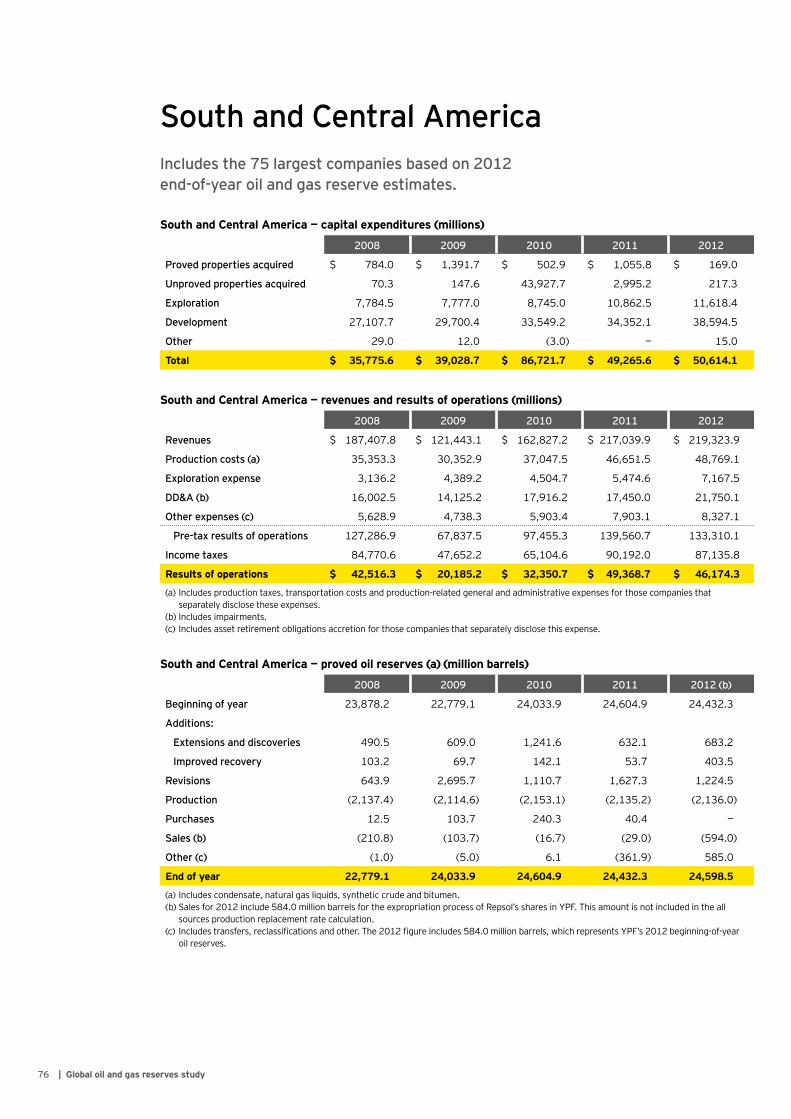
76 | Global oil and gas reserves study
South and Central AmericaIncludes the 75 largest companies based on 2012 end-of-year oil and gas reserve estimates.
2008 2009 2010 2011 2012
Proved properties acquired $ 784.0 $ 1,391.7 $ 502.9 $ 1,055.8 $ 169.0
Unproved properties acquired 70.3 147.6 43,927.7 2,995.2 217.3
Exploration 7,784.5 7,777.0 8,745.0 10,862.5 11,618.4
Development 27,107.7 29,700.4 33,549.2 34,352.1 38,594.5
Other 29.0 12.0 (3.0) — 15.0
Total $ 35,775.6 $ 39,028.7 $ 86,721.7 $ 49,265.6 $ 50,614.1
South and Central America — capital expenditures (millions)
2008 2009 2010 2011 2012
Revenues $ 187,407.8 $ 121,443.1 $ 162,827.2 $ 217,039.9 $ 219,323.9
Production costs (a) 35,353.3 30,352.9 37,047.5 46,651.5 48,769.1
Exploration expense 3,136.2 4,389.2 4,504.7 5,474.6 7,167.5
DD&A (b) 16,002.5 14,125.2 17,916.2 17,450.0 21,750.1
Other expenses (c) 5,628.9 4,738.3 5,903.4 7,903.1 8,327.1
Pre-tax results of operations 127,286.9 67,837.5 97,455.3 139,560.7 133,310.1
Income taxes 84,770.6 47,652.2 65,104.6 90,192.0 87,135.8
Results of operations $ 42,516.3 $ 20,185.2 $ 32,350.7 $ 49,368.7 $ 46,174.3
(a) Includes production taxes, transportation costs and production-related general and administrative expenses for those companies that separately disclose these expenses.
(b) Includes impairments.(c) Includes asset retirement obligations accretion for those companies that separately disclose this expense.
South and Central America — revenues and results of operations (millions)
2008 2009 2010 2011 2012 (b)
Beginning of year 23,878.2 22,779.1 24,033.9 24,604.9 24,432.3
Additions:
Extensions and discoveries 490.5 609.0 1,241.6 632.1 683.2
Improved recovery 103.2 69.7 142.1 53.7 403.5
Revisions 643.9 2,695.7 1,110.7 1,627.3 1,224.5
Production (2,137.4) (2,114.6) (2,153.1) (2,135.2) (2,136.0)
Purchases 12.5 103.7 240.3 40.4 —
Sales (b) (210.8) (103.7) (16.7) (29.0) (594.0)
Other (c) (1.0) (5.0) 6.1 (361.9) 585.0
End of year 22,779.1 24,033.9 24,604.9 24,432.3 24,598.5
(a) Includes condensate, natural gas liquids, synthetic crude and bitumen.(b) Sales for 2012 include 584.0 million barrels for the expropriation process of Repsol’s shares in YPF. This amount is not included in the all
sources production replacement rate calculation.(c) Includes transfers, reclassifications and other. The 2012 figure includes 584.0 million barrels, which represents YPF’s 2012 beginning-of-year
oil reserves.
South and Central America — proved oil reserves (a) (million barrels)
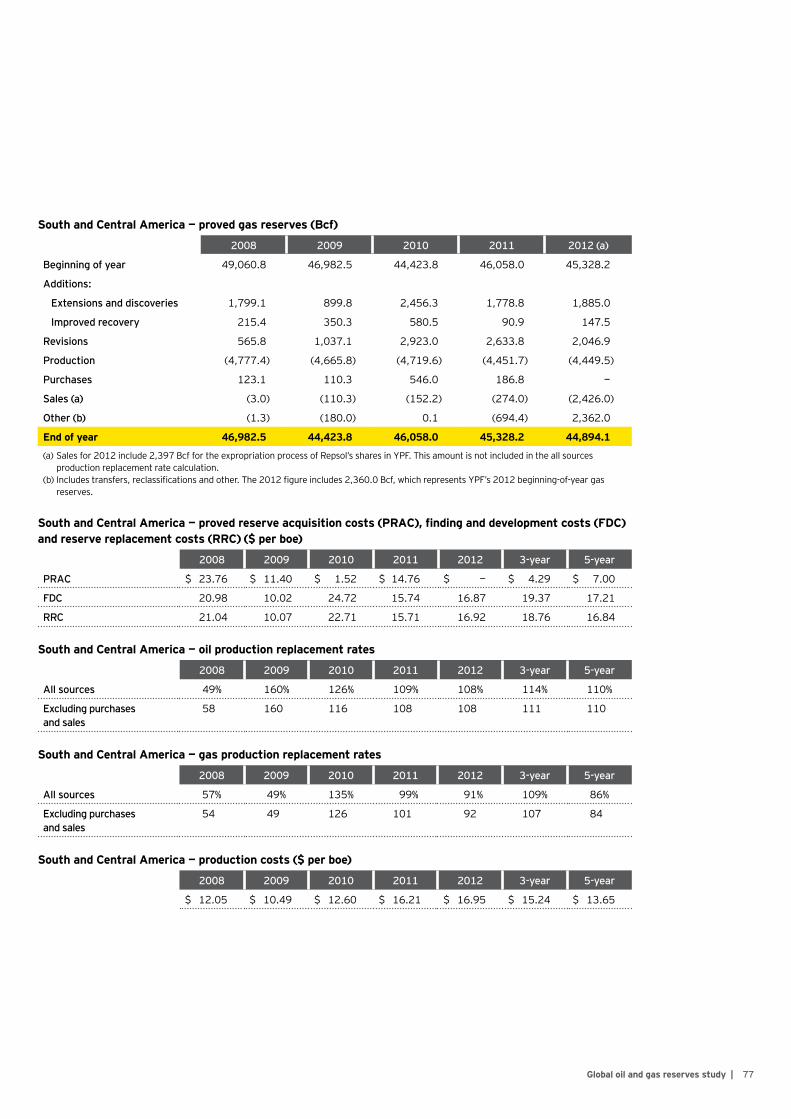
77Global oil and gas reserves study |
2008 2009 2010 2011 2012 (a)
Beginning of year 49,060.8 46,982.5 44,423.8 46,058.0 45,328.2
Additions:
Extensions and discoveries 1,799.1 899.8 2,456.3 1,778.8 1,885.0
Improved recovery 215.4 350.3 580.5 90.9 147.5
Revisions 565.8 1,037.1 2,923.0 2,633.8 2,046.9
Production (4,777.4) (4,665.8) (4,719.6) (4,451.7) (4,449.5)
Purchases 123.1 110.3 546.0 186.8 —
Sales (a) (3.0) (110.3) (152.2) (274.0) (2,426.0)
Other (b) (1.3) (180.0) 0.1 (694.4) 2,362.0
End of year 46,982.5 44,423.8 46,058.0 45,328.2 44,894.1
(a) Sales for 2012 include 2,397 Bcf for the expropriation process of Repsol’s shares in YPF. This amount is not included in the all sources production replacement rate calculation.
(b) Includes transfers, reclassifications and other. The 2012 figure includes 2,360.0 Bcf, which represents YPF’s 2012 beginning-of-year gas reserves.
South and Central America — proved gas reserves (Bcf)
South and Central America — proved reserve acquisition costs (PRAC), finding and development costs (FDC) and reserve replacement costs (RRC) ($ per boe)
2008 2009 2010 2011 2012 3-year 5-year
PRAC $ 23.76 $ 11.40 $ 1.52 $ 14.76 $ — $ 4.29 $ 7.00
FDC 20.98 10.02 24.72 15.74 16.87 19.37 17.21
RRC 21.04 10.07 22.71 15.71 16.92 18.76 16.84
South and Central America — oil production replacement rates
2008 2009 2010 2011 2012 3-year 5-year
All sources 49% 160% 126% 109% 108% 114% 110%
Excluding purchases and sales
58 160 116 108 108 111 110
South and Central America — gas production replacement rates
2008 2009 2010 2011 2012 3-year 5-year
All sources 57% 49% 135% 99% 91% 109% 86%
Excluding purchases and sales
54 49 126 101 92 107 84
South and Central America — production costs ($ per boe)
2008 2009 2010 2011 2012 3-year 5-year
$ 12.05 $ 10.49 $ 12.60 $ 16.21 $ 16.95 $ 15.24 $ 13.65

78 | Global oil and gas reserves study
South and Central America — capital expenditures for the latest fiscal year
MillionsProved
properties acquired
Unproved properties acquired Exploration Development Other
Total capital expenditures
Apache Corporation $ — $ — $ 157.0 $ 161.0 $ — $ 318.0
BP p.l.c. 51.0 27.0 758.0 581.0 — 1,417.0
Ecopetrol S.A. — 37.3 932.3 5,117.8 — 6,087.3
EOG Resources, Inc. — 1.0 19.6 30.6 2.0 53.2
EP Energy LLC — — 7.0 3.0 13.0 23.0
Occidental Petroleum Corporation — — 1.0 304.0 — 305.0
Petroleo Brasileiro, S.A. (Petrobras) 118.0 — 5,952.0 16,976.0 — 23,046.0
Petroleos Mexicanos (PEMEX) — — 2,534.6 12,042.2 — 14,576.9
Repsol S.A. — — 416.7 1,031.4 — 1,448.0
Royal Dutch Shell plc — 152.0 479.0 354.0 — 985.0
Talisman Energy Inc. — — — — — —
YPF S.A. — — 361.2 1,993.5 — 2,354.7
All companies $ 169.0 $ 217.3 $ 11,618.4 $ 38,594.5 $15.0 $ 50,614.1
Integrateds $ 169.0 $ 216.3 $ 11,433.8 $ 38,095.9 $ — $ 49,915.0
Large independents — 1.0 177.6 495.6 2.0 676.2
Independents — — 7.0 3.0 13.0 23.0
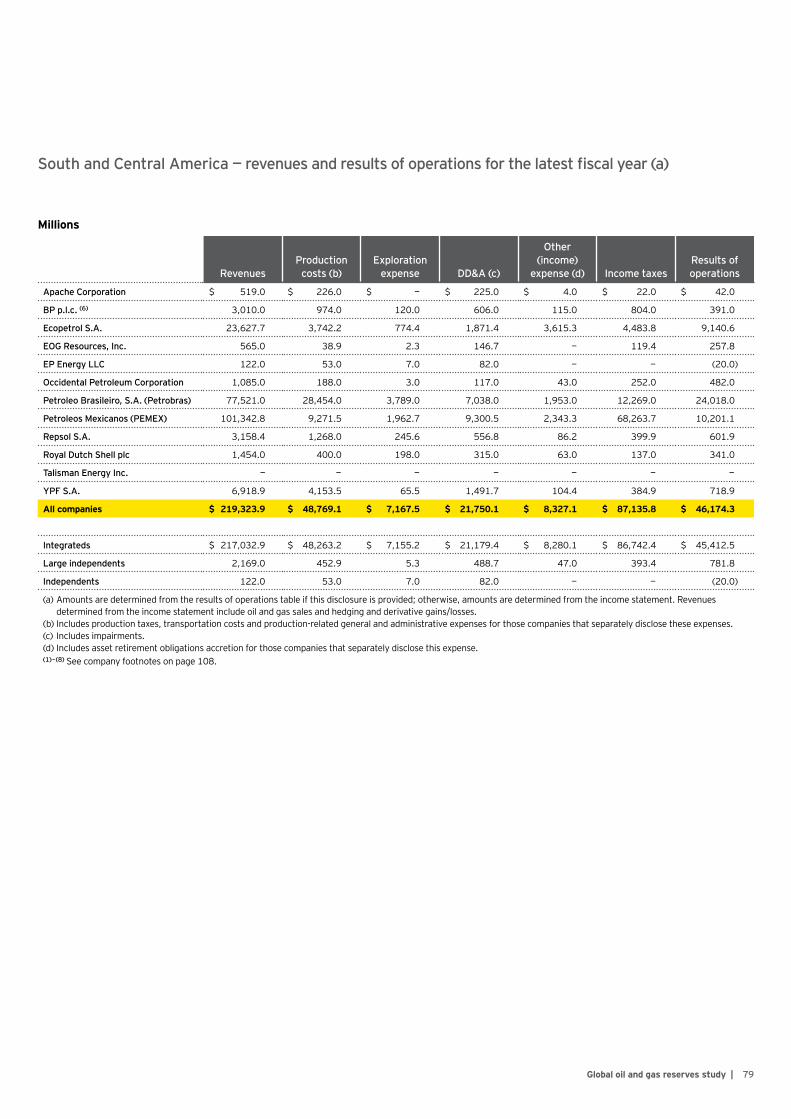
79Global oil and gas reserves study |
South and Central America — revenues and results of operations for the latest fiscal year (a)
Millions
RevenuesProduction
costs (b)Exploration
expense DD&A (c)
Other (income)
expense (d) Income taxesResults of operations
Apache Corporation $ 519.0 $ 226.0 $ — $ 225.0 $ 4.0 $ 22.0 $ 42.0
BP p.l.c. (6) 3,010.0 974.0 120.0 606.0 115.0 804.0 391.0
Ecopetrol S.A. 23,627.7 3,742.2 774.4 1,871.4 3,615.3 4,483.8 9,140.6
EOG Resources, Inc. 565.0 38.9 2.3 146.7 — 119.4 257.8
EP Energy LLC 122.0 53.0 7.0 82.0 — — (20.0)
Occidental Petroleum Corporation 1,085.0 188.0 3.0 117.0 43.0 252.0 482.0
Petroleo Brasileiro, S.A. (Petrobras) 77,521.0 28,454.0 3,789.0 7,038.0 1,953.0 12,269.0 24,018.0
Petroleos Mexicanos (PEMEX) 101,342.8 9,271.5 1,962.7 9,300.5 2,343.3 68,263.7 10,201.1
Repsol S.A. 3,158.4 1,268.0 245.6 556.8 86.2 399.9 601.9
Royal Dutch Shell plc 1,454.0 400.0 198.0 315.0 63.0 137.0 341.0
Talisman Energy Inc. — — — — — — —
YPF S.A. 6,918.9 4,153.5 65.5 1,491.7 104.4 384.9 718.9
All companies $ 219,323.9 $ 48,769.1 $ 7,167.5 $ 21,750.1 $ 8,327.1 $ 87,135.8 $ 46,174.3
Integrateds $ 217,032.9 $ 48,263.2 $ 7,155.2 $ 21,179.4 $ 8,280.1 $ 86,742.4 $ 45,412.5
Large independents 2,169.0 452.9 5.3 488.7 47.0 393.4 781.8
Independents 122.0 53.0 7.0 82.0 — — (20.0)
(a) Amounts are determined from the results of operations table if this disclosure is provided; otherwise, amounts are determined from the income statement. Revenues determined from the income statement include oil and gas sales and hedging and derivative gains/losses.
(b) Includes production taxes, transportation costs and production-related general and administrative expenses for those companies that separately disclose these expenses.(c) Includes impairments.(d) Includes asset retirement obligations accretion for those companies that separately disclose this expense.(1) – (8) See company footnotes on page 108.

80 | Global oil and gas reserves study
South and Central America — oil reserves for the latest fiscal year (a)
Million barrels
Beginning
Extensions and
discoveriesImproved recovery Revisions Production Purchases Sales Other (b) Ending
Ending rank
Apache Corporation 27.7 1.1 — 0.5 (4.7) — — — 24.7 9
BP p.l.c. 75.0 — — (11.0) (10.0) — — — 54.0 8
Ecopetrol S.A. 1,371.0 90.4 65.3 42.7 (199.2) — — — 1,370.2 3
EOG Resources, Inc. 3.5 — — 0.1 (0.6) — — — 3.0 11
EP Energy LLC 2.3 — — 0.3 (0.4) — — — 2.2 12
Occidental Petroleum Corporation
96.0 — 7.0 4.0 (11.0) — — — 96.0 6
Petroleo Brasileiro, S.A. (Petrobras)
10,611.0 435.8 325.2 67.8 (716.9) — — — 10,722.9 2
Petroleos Mexicanos (PEMEX)
11,362.0 103.0 — 1,013.0 (1,053.0) — — (1.0) 11,424.0 1
Repsol S.A. 808.0 24.0 — 14.0 (24.0) — (594.0) 2.0 230.0 5
Royal Dutch Shell plc 63.0 7.0 — 12.0 (13.0) — — — 69.0 7
Talisman Energy Inc. 12.8 3.9 — 0.1 (3.3) — — — 13.5 10
YPF S.A. (10) — 18.0 6.0 81.0 (100.0) — — 584.0 589.0 4
All companies 24,432.3 683.2 403.5 1,224.5 (2,136.0) — (594.0) 585.0 24,598.5
Integrateds 24,290.0 678.2 396.5 1,219.5 (2,116.1) — (594.0) 585.0 24,459.1
Large independents 127.2 1.1 7.0 4.6 (16.2) — — — 123.7
Independents 15.1 3.9 — 0.4 (3.7) — — — 15.7
(a) Includes condensate, natural gas liquids and synthetic crude.(b) Includes transfers, reclassifications and other.

81Global oil and gas reserves study |
South and Central America — gas reserves for the latest fiscal year
Bcf
Beginning
Extensions and
discoveriesImproved recovery Revisions Production Purchases Sales Other (a) Ending
Ending rank
Apache Corporation 537.6 2.6 — 0.5 (78.1) — — — 462.6 8
BP p.l.c. 9,398.0 598.0 756.0 (116.0) (775.0) — (23.0) — 9,838.0 3
Ecopetrol S.A. 2,768.4 298.6 — 8.8 (189.3) — — — 2,886.5 5
EOG Resources, Inc. 750.7 — — (24.1) (138.4) — — — 588.2 7
EP Energy LLC 81.0 — — (3.0) (10.0) — — — 68.0 10
Occidental Petroleum Corporation
33.0 — 11.0 — (5.0) — — — 39.0 12
Petroleo Brasileiro, S.A. (Petrobras)
12,270.0 295.4 (623.5) 356.9 (857.2) — — — 11,441.6 2
Petroleos Mexicanos (PEMEX)
12,734.0 162.0 — 1,377.0 (1,560.0) — — — 12,713.0 1
Repsol S.A. 6,568.0 503.0 — 216.0 (373.0) — (2,403.0) 2.0 4,513.0 4
Royal Dutch Shell plc 104.0 4.0 — 8.0 (21.0) — — — 95.0 9
Talisman Energy Inc. 83.5 (9.6) — 3.8 (11.5) — — — 66.2 11
YPF S.A. (10) — 31.0 4.0 219.0 (431.0) — — 2,360.0 2,183.0 6
All companies 45,328.2 1,885.0 147.5 2,046.9 (4,449.5) — (2,426.0) 2,362.0 44,894.1
Integrateds 43,842.4 1,892.0 136.5 2,069.7 (4,206.5) — (2,426.0) 2,362.0 43,670.1
Large independents 1,321.3 2.6 11.0 (23.6) (221.5) — — — 1,089.8
Independents 164.5 (9.6) — 0.8 (21.5) — — — 134.2
(a) Includes transfers, reclassifications and other.

82 | Global oil and gas reserves study
South and Central America — performance measures (three-year averages) (a)
Costs in $ per boe, production replacement rates in %
Production replacement rates
Oil Gas
PRAC FDC RRCAll
sources
Excluding purchases and sales
All sources
Excluding purchases and sales
Production costs
Apache Corporation $ — $ 27.68 $ 27.68 55% 55% 71% 71% $ 10.91
BP p.l.c. 41.14 14.07 14.58 (21) 31 71 83 5.26
Ecopetrol S.A. 23.72 16.30 16.56 145 142 205 187 14.29
EOG Resources, Inc. — 273.09 273.09 31 31 0 0 2.04
EP Energy LLC — (61.94) (61.94) (79) (79) (23) (23) 26.37
Occidental Petroleum Corporation — 8.68 9.75 220 227 231 231 10.55
Petroleo Brasileiro, S.A. (Petrobras)
— 33.23 33.28 127 127 123 123 30.45
Petroleos Mexicanos (PEMEX) — 10.97 10.97 92 92 115 115 6.78
Repsol S.A. 9.20 10.06 10.02 (63) 137 (1) 121 14.62
Royal Dutch Shell plc — 33.68 33.68 162 162 (110) (107) 19.45
Talisman Energy Inc. — — — 341 71 405 (26) —
YPF S.A. — 15.98 15.98 105 105 59 59 24.17
All companies $ 4.29 $ 19.37 $ 18.76 114% 111% 109% 107% $ 15.24
Integrated $ 20.16 $ 19.44 $ 19.44 101% 110% 90% 111% $ 15.40
Large independents 0.45 14.84 5.48 439 165 113 33 7.96
Independents — 128.00 4.04 270 46 156 (24) 10.55
(a) Performance measures are based on less than three years of results for companies that have had operations for less than three years.

83Global oil and gas reserves study |
US

84 | Global oil and gas reserves study
US
2008 2009 2010 2011 2012
Proved properties acquired $ 20,384.0 $ 3,993.5 $ 42,749.7 $ 14,174.4 $ 22,836.1
Unproved properties acquired 33,962.1 9,711.3 59,369.2 33,673.1 34,058.6
Exploration 16,853.8 14,732.1 16,351.9 22,836.3 27,498.2
Development 68,362.5 46,692.6 63,467.6 86,312.8 104,734.0
Other 768.9 201.8 112.2 203.9 439.3
Total $ 140,331.3 $ 75,331.3 $ 182,050.6 $ 157,200.5 $ 189,566.2
US — capital expenditures (millions)
2008 2009 2010 2011 2012
Revenues $ 190,168.6 $ 125,652.2 $ 153,483.0 $ 187,631.1 $ 182,666.7
Production costs (a) 45,406.8 36,808.6 41,154.7 52,303.2 57,369.9
Exploration expense 5,140.4 5,024.4 4,954.0 5,818.5 7,140.4
DD&A (b) 71,140.9 75,471.2 45,536.6 52,795.8 86,882.2
Other expenses (c) 4,218.7 3,691.7 2,821.7 5,222.9 400.9
Pre-tax results of operations 64,261.8 4,656.3 59,016.1 71,490.7 30,873.3
Income taxes 23,866.6 1,409.0 20,314.5 24,555.3 11,427.5
Results of operations $ 40,395.2 $ 3,247.3 $ 38,701.6 $ 46,935.4 $ 19,445.8
(a) Includes production taxes, transportation costs and production-related general and administrative expenses for those companies that separately disclose these expenses.
(b) Includes impairments.(c) Includes asset retirement obligations accretion for those companies that separately disclose this expense.
US — revenues and results of operations (millions)
2008 2009 2010 (b) 2011 2012 (c)
Beginning of year 16,504.7 15,957.2 16,850.1 19,084.9 20,903.2
Additions:
Extensions and discoveries 758.6 934.7 1,686.1 2,536.7 3,795.5
Improved recovery 395.5 170.1 397.4 324.0 520.0
Revisions (1,233.9) 1,133.0 965.3 598.8 (95.7)
Production (1,188.6) (1,380.1) (1,429.9) (1,457.1) (1,640.2)
Purchases 298.2 200.8 1,146.0 312.7 906.0
Sales (159.9) (165.9) (730.5) (223.2) (865.9)
Other (d) 582.7 0.2 200.5 (273.6) 0.0
End of year 15,957.2 16,850.1 19,084.9 20,903.2 23,523.0
(a) Includes condensate, natural gas liquids, synthetic crude and bitumen. (b) Beginning-of-year reserves for 2010 include 387.6 billion barrels, which represent XTO Energy’s end-of-year 2009 gas reserves. Sales for
2010 include 387.6 billion barrels to reflect the sale of XTO Energy’s reserves to ExxonMobil. (c) Beginning-of-year reserves for 2012 include 114.8 million barrels, which represent Petrohawk Energy’s end-of-year 2011 oil reserves. Sales
for 2012 include 114.8 million barrels, to reflect the sale of Petrohawk Energy’s reserves to BHP Billiton. (d) Includes transfers, reclassifications and other.
US — proved oil reserves (million barrels) (a)
Includes the 75 largest companies based on 2012 end-of-year oil and gas reserve estimates. Activity related to acquired companies has also been reflected as described on page 1.
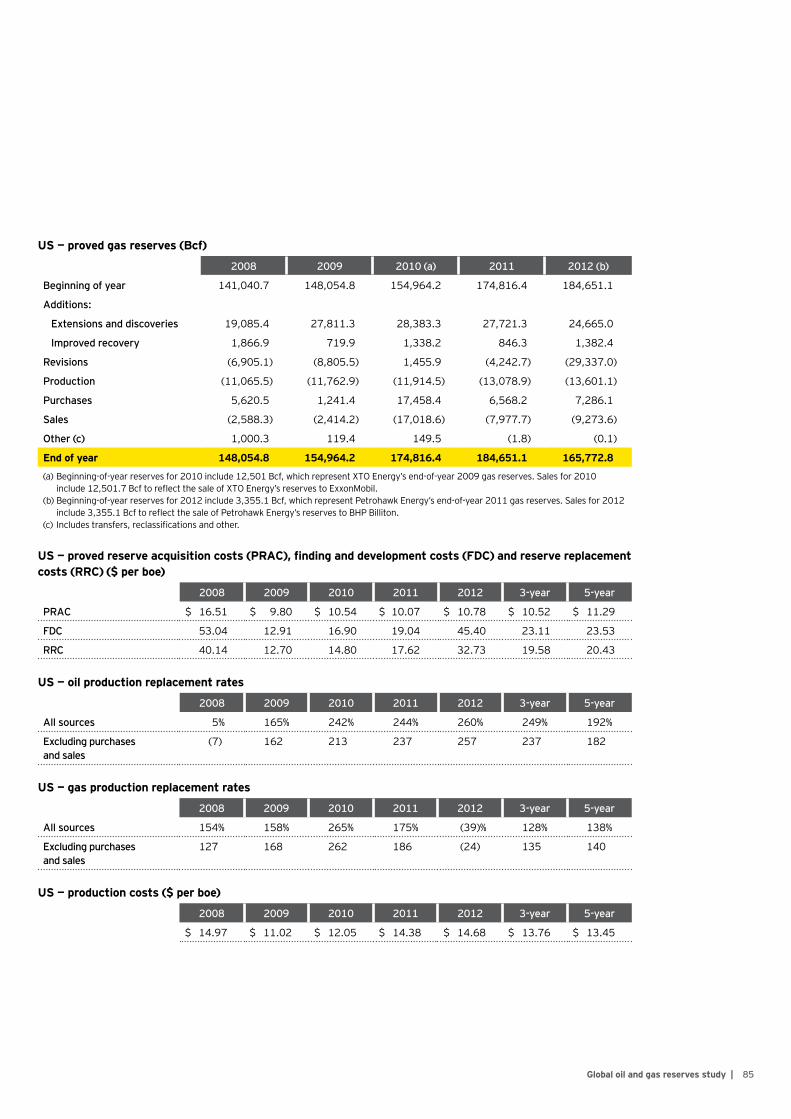
85Global oil and gas reserves study |
2008 2009 2010 (a) 2011 2012 (b)
Beginning of year 141,040.7 148,054.8 154,964.2 174,816.4 184,651.1
Additions:
Extensions and discoveries 19,085.4 27,811.3 28,383.3 27,721.3 24,665.0
Improved recovery 1,866.9 719.9 1,338.2 846.3 1,382.4
Revisions (6,905.1) (8,805.5) 1,455.9 (4,242.7) (29,337.0)
Production (11,065.5) (11,762.9) (11,914.5) (13,078.9) (13,601.1)
Purchases 5,620.5 1,241.4 17,458.4 6,568.2 7,286.1
Sales (2,588.3) (2,414.2) (17,018.6) (7,977.7) (9,273.6)
Other (c) 1,000.3 119.4 149.5 (1.8) (0.1)
End of year 148,054.8 154,964.2 174,816.4 184,651.1 165,772.8
(a) Beginning-of-year reserves for 2010 include 12,501 Bcf, which represent XTO Energy’s end-of-year 2009 gas reserves. Sales for 2010 include 12,501.7 Bcf to reflect the sale of XTO Energy’s reserves to ExxonMobil.
(b) Beginning-of-year reserves for 2012 include 3,355.1 Bcf, which represent Petrohawk Energy’s end-of-year 2011 gas reserves. Sales for 2012 include 3,355.1 Bcf to reflect the sale of Petrohawk Energy’s reserves to BHP Billiton.
(c) Includes transfers, reclassifications and other.
US — proved gas reserves (Bcf)
US — proved reserve acquisition costs (PRAC), finding and development costs (FDC) and reserve replacement costs (RRC) ($ per boe)
2008 2009 2010 2011 2012 3-year 5-year
PRAC $ 16.51 $ 9.80 $ 10.54 $ 10.07 $ 10.78 $ 10.52 $ 11.29
FDC 53.04 12.91 16.90 19.04 45.40 23.11 23.53
RRC 40.14 12.70 14.80 17.62 32.73 19.58 20.43
US — oil production replacement rates
2008 2009 2010 2011 2012 3-year 5-year
All sources 5% 165% 242% 244% 260% 249% 192%
Excluding purchases and sales
(7) 162 213 237 257 237 182
US — gas production replacement rates
2008 2009 2010 2011 2012 3-year 5-year
All sources 154% 158% 265% 175% (39)% 128% 138%
Excluding purchases and sales
127 168 262 186 (24) 135 140
US — production costs ($ per boe)
2008 2009 2010 2011 2012 3-year 5-year
$ 14.97 $ 11.02 $ 12.05 $ 14.38 $ 14.68 $ 13.76 $ 13.45

86 | Global oil and gas reserves study
US — capital expenditures for the latest fiscal year
Millions
Proved properties acquired
Unproved properties acquired Exploration Development Other
Total capital expenditures
Anadarko Petroleum Corporation $ — $ 224.0 $ 1,064.0 $ 3,592.0 $ — $ 4,880.0
Antero Resources LLC 10.3 687.4 — 839.2 9.4 1,546.2
Apache Corporation 1,076.0 2,329.0 1,369.0 4,465.0 — 9,239.0
Berry Petroleum Company 70.7 10.7 16.4 714.3 — 812.1
BHP Billiton Group 4,746.0 10,366.0 690.0 4,460.0 — 20,262.0
Bill Barrett Corporation 6.0 163.0 32.2 754.5 8.3 964.0
BP p.l.c. 256.0 1,111.0 1,069.0 3,866.0 — 6,302.0
Cabot Oil & Gas Corporation — 88.9 59.2 821.8 — 969.9
Chesapeake Energy Corporation 332.0 2,981.0 2,353.0 6,733.0 — 12,399.0
Chevron Corporation 248.0 1,150.0 511.0 6,597.0 — 8,506.0
Cimarex Energy Co. 2.6 117.7 109.2 1,426.9 12.5 1,669.0
Concho Resources Inc. 828.7 441.0 778.6 725.7 47.3 2,821.3
ConocoPhillips 33.0 564.0 1,376.0 4,561.0 — 6,534.0
CONSOL Energy, Inc. 50.0 28.6 130.3 339.6 — 548.6
Continental Resources, Inc. 738.4 745.6 854.4 1,975.7 3.3 4,317.4
Denbury Resources Inc. 491.0 115.3 12.0 1,111.3 — 1,729.6
Devon Energy Corporation 2.0 1,135.0 351.0 4,408.0 — 5,896.0
Encana Corporation 5.0 235.0 633.0 1,094.0 — 1,967.0
Energen Corporation 79.9 58.6 419.3 749.3 — 1,307.0
EOG Resources, Inc. 0.7 471.3 333.5 5,577.4 80.0 6,463.0
EP Energy LLC (1) — 51.0 199.0 1,295.0 49.0 1,594.0
EQT Corporation 17.0 117.7 4.8 850.9 — 990.3
EXCO Resources, Inc. — 47.9 57.3 346.0 1.0 452.2
Exxon Mobil Corporation (1) 192.0 1,731.0 646.0 7,676.0 — 10,245.0
Forest Oil Corporation — 64.1 268.2 398.9 — 731.2
Hess Corporation — 179.0 405.0 4,236.0 — 4,820.0
Laredo Petroleum Holdings, Inc. 16.9 3.7 93.3 831.7 7.4 953.0
Linn Energy, LLC 2,531.4 181.1 0.5 1,062.0 4.7 3,779.7
Marathon Oil Corporation 756.0 432.0 1,587.0 2,469.0 — 5,244.0
Murphy Oil Corporation 69.1 107.7 176.2 1,314.8 36.2 1,704.0
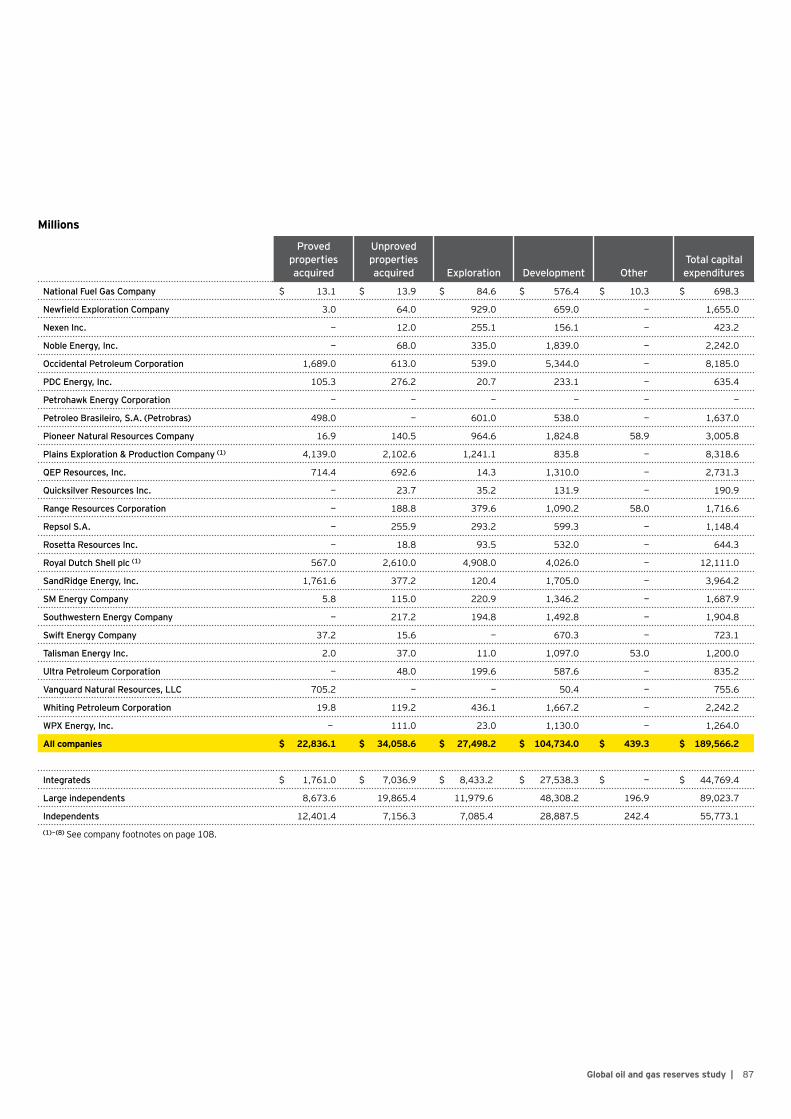
87Global oil and gas reserves study |
Millions
Proved properties acquired
Unproved properties acquired Exploration Development Other
Total capital expenditures
National Fuel Gas Company $ 13.1 $ 13.9 $ 84.6 $ 576.4 $ 10.3 $ 698.3
Newfield Exploration Company 3.0 64.0 929.0 659.0 — 1,655.0
Nexen Inc. — 12.0 255.1 156.1 — 423.2
Noble Energy, Inc. — 68.0 335.0 1,839.0 — 2,242.0
Occidental Petroleum Corporation 1,689.0 613.0 539.0 5,344.0 — 8,185.0
PDC Energy, Inc. 105.3 276.2 20.7 233.1 — 635.4
Petrohawk Energy Corporation — — — — — —
Petroleo Brasileiro, S.A. (Petrobras) 498.0 — 601.0 538.0 — 1,637.0
Pioneer Natural Resources Company 16.9 140.5 964.6 1,824.8 58.9 3,005.8
Plains Exploration & Production Company (1) 4,139.0 2,102.6 1,241.1 835.8 — 8,318.6
QEP Resources, Inc. 714.4 692.6 14.3 1,310.0 — 2,731.3
Quicksilver Resources Inc. — 23.7 35.2 131.9 — 190.9
Range Resources Corporation — 188.8 379.6 1,090.2 58.0 1,716.6
Repsol S.A. — 255.9 293.2 599.3 — 1,148.4
Rosetta Resources Inc. — 18.8 93.5 532.0 — 644.3
Royal Dutch Shell plc (1) 567.0 2,610.0 4,908.0 4,026.0 — 12,111.0
SandRidge Energy, Inc. 1,761.6 377.2 120.4 1,705.0 — 3,964.2
SM Energy Company 5.8 115.0 220.9 1,346.2 — 1,687.9
Southwestern Energy Company — 217.2 194.8 1,492.8 — 1,904.8
Swift Energy Company 37.2 15.6 — 670.3 — 723.1
Talisman Energy Inc. 2.0 37.0 11.0 1,097.0 53.0 1,200.0
Ultra Petroleum Corporation — 48.0 199.6 587.6 — 835.2
Vanguard Natural Resources, LLC 705.2 — — 50.4 — 755.6
Whiting Petroleum Corporation 19.8 119.2 436.1 1,667.2 — 2,242.2
WPX Energy, Inc. — 111.0 23.0 1,130.0 — 1,264.0
All companies $ 22,836.1 $ 34,058.6 $ 27,498.2 $ 104,734.0 $ 439.3 $ 189,566.2
Integrateds $ 1,761.0 $ 7,036.9 $ 8,433.2 $ 27,538.3 $ — $ 44,769.4
Large independents 8,673.6 19,865.4 11,979.6 48,308.2 196.9 89,023.7
Independents 12,401.4 7,156.3 7,085.4 28,887.5 242.4 55,773.1
(1) – (8) See company footnotes on page 108.

88 | Global oil and gas reserves study
US — revenues and results of operations for the latest fiscal year (a)
Millions
RevenuesProduction
costs (b)Exploration
expense DD&A (c)
Other (income)
expense (d) Income taxesResults of operations
Anadarko Petroleum Corporation (4) $ 9,000.0 $ 2,616.0 $ 1,484.0 $ 3,684.0 $ — $ 445.4 $ 770.6
Antero Resources LLC 390.4 185.5 15.3 194.7 — (2.0) (3.2)
Apache Corporation 6,226.0 1,734.0 — 1,984.0 112.0 851.0 1,545.0
Berry Petroleum Company 872.6 311.6 20.9 226.0 — 106.6 207.6
BHP Billiton Group 4,894.0 1,376.0 275.0 4,964.0 — (745.0) (976.0)
Bill Barrett Corporation 773.4 204.8 8.8 394.7 — 121.8 43.3
BP p.l.c. (3) 16,166.0 5,326.0 649.0 5,046.0 (1,930.0) 2,762.0 4,313.0
Cabot Oil & Gas Corporation 1,161.6 310.4 37.5 451.4 — 161.6 200.7
Chesapeake Energy Corporation 6,278.0 1,492.0 — 5,822.0 — (404.0) (632.0)
Chevron Corporation 16,954.0 4,663.0 244.0 3,589.0 59.0 3,043.0 5,356.0
Cimarex Energy Co. 1,581.7 402.9 — 484.5 13.0 251.2 430.0
Concho Resources Inc. 1,692.4 343.7 39.8 575.1 4.2 277.8 451.7
ConocoPhillips 15,108.0 6,606.0 377.0 3,174.0 390.0 1,438.0 3,123.0
CONSOL Energy, Inc. 709.8 337.9 — 203.0 39.0 49.6 80.4
Continental Resources, Inc. 2,379.4 423.9 23.5 805.5 — 428.1 698.5
Denbury Resources Inc. 2,414.7 682.3 — 490.5 52.8 457.8 731.3
Devon Energy Corporation 4,679.0 1,558.0 — 3,356.0 40.0 (99.0) (176.0)
Encana Corporation 3,365.0 1,142.0 — 3,944.0 — (623.0) (1,098.0)
Energen Corporation 1,167.2 306.4 19.4 394.7 7.5 157.7 281.6
EOG Resources, Inc. 7,089.4 1,856.2 163.9 2,931.7 — 761.5 1,376.1
EP Energy LLC (1) 1,587.0 455.0 45.0 578.0 — 43.0 466.0
EQT Corporation 793.8 96.2 10.4 409.6 — 109.7 168.0
EXCO Resources, Inc. 612.7 207.5 — 1,649.9 3.9 — (1,248.5)
Exxon Mobil Corporation (1) 16,365.0 6,516.0 400.0 5,038.0 — 1,561.0 2,850.0
Forest Oil Corporation 605.5 156.9 — 1,233.5 6.5 173.4 (964.8)
Hess Corporation 4,104.0 1,153.0 426.0 1,838.0 — 269.0 418.0
Laredo Petroleum Holdings, Inc. 583.6 105.0 — 237.1 1.2 83.7 156.6
Linn Energy, LLC 1,725.9 525.0 1.9 1,001.9 (1.4) — 198.5
Marathon Oil Corporation 3,871.0 1,277.0 564.0 1,793.0 — 86.0 151.0
Murphy Oil Corporation 1,038.0 305.1 51.9 401.8 11.4 99.8 168.0

89Global oil and gas reserves study |
Millions
RevenuesProduction
costs (b)Exploration
expense DD&A (c)
Other (income)
expense (d) Income taxesResults of operations
National Fuel Gas Company $ 488.6 $ 107.0 $ — $ 182.8 $ 3.1 $ 81.9 $ 113.8
Newfield Exploration Company 1,469.0 466.0 — 2,149.0 — (401.0) (745.0)
Nexen Inc. 303.1 100.0 204.1 269.1 111.0 (304.4) (76.7)
Noble Energy, Inc. 2,339.0 539.0 225.0 1,002.0 — 201.0 372.0
Occidental Petroleum Corporation 10,379.0 3,607.0 230.0 4,143.0 723.0 508.0 1,168.0
PDC Energy, Inc. 307.1 77.5 22.6 309.2 4.1 (40.4) (65.9)
Petrohawk Energy Corporation — — — — — — —
Petroleo Brasileiro, S.A. (Petrobras) 309.0 40.0 48.0 177.0 113.0 — (69.0)
Pioneer Natural Resources Company 3,141.9 823.4 206.3 1,342.8 9.9 250.5 509.1
Plains Exploration & Production Company (1)
2,679.7 681.3 40.3 1,152.0 (0.4) 312.5 493.9
QEP Resources, Inc. 1,393.4 501.1 11.2 971.4 — (33.6) (56.7)
Quicksilver Resources Inc. 538.9 226.5 — 2,268.1 — (684.5) (1,271.3)
Range Resources Corporation 1,393.1 375.5 69.8 606.1 — 164.4 177.4
Repsol S.A. 1,081.5 9.0 181.3 402.5 3.9 176.2 308.6
Rosetta Resources Inc. 573.0 111.0 — 154.2 — 115.7 192.0
Royal Dutch Shell plc (1) 10,194.0 3,135.0 811.0 4,106.0 576.0 531.0 1,035.0
SandRidge Energy, Inc. 1,759.3 524.4 — 568.0 29.0 (437.6) 1,075.5
SM Energy Company 1,533.4 391.9 90.2 953.1 — 34.4 63.7
Southwestern Energy Company 1,948.2 505.3 — 2,704.9 — (502.7) (759.3)
Swift Energy Company 554.2 164.3 — 247.2 5.1 58.8 78.7
Talisman Energy Inc. 654.0 280.0 12.0 610.0 — — (248.0)
Ultra Petroleum Corporation 810.0 268.7 — 3,361.4 — (679.7) (2,140.5)
Vanguard Natural Resources, LLC 311.3 103.7 — 350.2 — — (142.7)
Whiting Petroleum Corporation 2,226.0 548.0 59.1 792.6 — 309.4 516.8
WPX Energy, Inc. 2,091.0 1,109.0 72.0 1,164.0 14.0 (98.0) (170.0)
All companies $ 182,666.7 $ 57,369.9 $ 7,140.4 $ 86,882.2 $ 400.9 $ 11,427.5 $ 19,445.8
Integrateds $ 65,173.5 $ 20,842.0 $ 2,759.3 $ 20,196.5 $ (1,178.1) $ 8,342.2 $ 14,211.6
Large independents 78,557.2 25,098.2 3,605.4 39,156.1 1,274.9 2,944.4 6,478.1
Independents 38,936.0 11,429.7 775.7 27,529.5 304.1 140.9 (1,244.0)
(a) Amounts are determined from the results of operations table if this disclosure is provided; otherwise, amounts are determined from the income statement. Revenues determined from the income statement include oil and gas sales and hedging and derivative gains/losses.
(b) Includes production taxes, transportation costs and production-related general and administrative expenses for those companies that separately disclose these expenses.(c) Includes impairments.(d) Includes asset retirement obligations accretion for those companies that separately disclose this expense.(1) – (8) See company footnotes on page 108.

90 | Global oil and gas reserves study
US — oil reserves for the latest fiscal year (a)
Million barrels
Beginning
Extensions and
discoveriesImproved recovery Revisions Production Purchases Sales Other (b) Ending
Ending rank
Anadarko Petroleum Corporation
897.0 12.0 — 127.0 (84.0) — (48.0) — 904.0 7
Antero Resources LLC 181.0 118.0 — 4.0 — — (97.0) — 206.0 29
Apache Corporation 794.0 156.6 — (12.0) (61.4) 16.2 (0.1) — 893.3 9
Berry Petroleum Company 185.9 8.5 — 12.1 (10.0) 8.3 (0.6) — 204.2 30
BHP Billiton Group 267.4 5.0 34.1 170.3 (36.6) 73.9 — — 514.1 14
Bill Barrett Corporation 30.6 17.3 — 6.6 (2.7) 0.3 (1.3) — 50.8 44
BP p.l.c. 2,858.0 23.0 140.0 (280.0) (142.0) 21.0 (188.0) — 2,432.0 1
Cabot Oil & Gas Corporation 20.5 9.6 — (3.1) (2.4) — (0.2) — 24.4 48
Chesapeake Energy Corporation
545.5 513.4 — (114.8) (48.9) 4.8 (107.2) — 792.8 10
Chevron Corporation 1,311.0 77.0 24.0 104.0 (166.0) 10.0 (1.0) — 1,359.0 5
Cimarex Energy Co. 138.1 64.1 — (7.6) (18.5) 0.0 (8.4) — 167.8 32
Concho Resources Inc. 238.3 60.4 — (15.9) (18.0) 30.3 (21.5) — 273.5 24
ConocoPhillips 2,009.0 245.0 16.0 — (151.0) 1.0 — — 2,120.0 3
CONSOL Energy, Inc. — — — — — — — — — —
Continental Resources, Inc. 326.1 166.8 — 33.3 (25.1) 67.1 (7.2) — 561.2 13
Denbury Resources Inc. 357.7 14.9 69.5 (7.5) (24.5) 24.7 (105.8) — 329.1 21
Devon Energy Corporation 693.0 179.0 — (39.0) (57.0) — — — 776.0 11
Encana Corporation 38.2 39.2 — 38.9 (4.2) 0.1 (3.8) — 108.4 36
Energen Corporation 183.5 46.9 — (18.1) (11.3) 10.5 — — 211.5 28
EOG Resources, Inc. 721.9 312.6 — 51.4 (74.8) 1.6 (23.2) — 989.4 6
EP Energy LLC (1) 198.5 122.8 — (7.0) (11.8) 0.0 (3.9) — 298.7 22
EQT Corporation 2.9 0.3 — 0.3 (0.3) — — — 3.2 52
EXCO Resources, Inc. 6.4 0.9 — 6.2 (1.2) — — — 12.2 50
Exxon Mobil Corporation (1) 2,008.0 166.0 22.0 23.0 (122.0) 163.0 (15.0) — 2,245.0 2
Forest Oil Corporation 76.0 23.5 — (12.2) (6.6) — (5.8) — 75.0 40
Hess Corporation 373.0 108.0 7.0 32.0 (45.0) — (2.0) — 473.0 16
Laredo Petroleum Holdings, Inc.
56.3 57.4 — (12.4) (4.8) 1.7 — — 98.1 37
Linn Energy, LLC 282.5 50.3 — (40.6) (19.7) 98.4 — — 370.9 17
Marathon Oil Corporation 279.0 172.0 2.0 9.0 (39.0) 52.0 — — 475.0 15
Murphy Oil Corporation 55.3 77.3 — 13.0 (9.5) 6.5 — — 142.6 34
National Fuel Gas Company 43.3 1.3 — 1.1 (2.9) — — — 42.9 46
Newfield Exploration Company
220.0 55.0 — (4.0) (14.0) — (17.0) — 240.0 26
Nexen Inc. 14.0 — — — (2.0) — — — 12.0 51
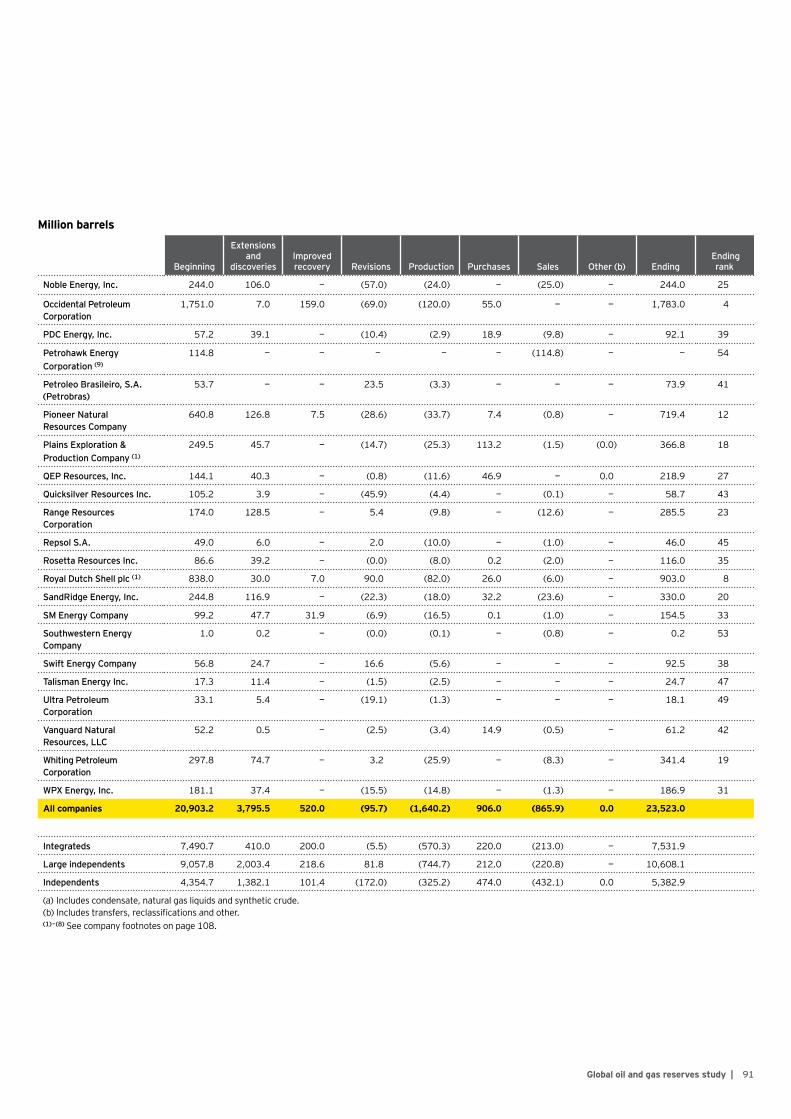
91Global oil and gas reserves study |
Million barrels
Beginning
Extensions and
discoveriesImproved recovery Revisions Production Purchases Sales Other (b) Ending
Ending rank
Noble Energy, Inc. 244.0 106.0 — (57.0) (24.0) — (25.0) — 244.0 25
Occidental Petroleum Corporation
1,751.0 7.0 159.0 (69.0) (120.0) 55.0 — — 1,783.0 4
PDC Energy, Inc. 57.2 39.1 — (10.4) (2.9) 18.9 (9.8) — 92.1 39
Petrohawk Energy Corporation (9)
114.8 — — — — — (114.8) — — 54
Petroleo Brasileiro, S.A. (Petrobras)
53.7 — — 23.5 (3.3) — — — 73.9 41
Pioneer Natural Resources Company
640.8 126.8 7.5 (28.6) (33.7) 7.4 (0.8) — 719.4 12
Plains Exploration & Production Company (1)
249.5 45.7 — (14.7) (25.3) 113.2 (1.5) (0.0) 366.8 18
QEP Resources, Inc. 144.1 40.3 — (0.8) (11.6) 46.9 — 0.0 218.9 27
Quicksilver Resources Inc. 105.2 3.9 — (45.9) (4.4) — (0.1) — 58.7 43
Range Resources Corporation
174.0 128.5 — 5.4 (9.8) — (12.6) — 285.5 23
Repsol S.A. 49.0 6.0 — 2.0 (10.0) — (1.0) — 46.0 45
Rosetta Resources Inc. 86.6 39.2 — (0.0) (8.0) 0.2 (2.0) — 116.0 35
Royal Dutch Shell plc (1) 838.0 30.0 7.0 90.0 (82.0) 26.0 (6.0) — 903.0 8
SandRidge Energy, Inc. 244.8 116.9 — (22.3) (18.0) 32.2 (23.6) — 330.0 20
SM Energy Company 99.2 47.7 31.9 (6.9) (16.5) 0.1 (1.0) — 154.5 33
Southwestern Energy Company
1.0 0.2 — (0.0) (0.1) — (0.8) — 0.2 53
Swift Energy Company 56.8 24.7 — 16.6 (5.6) — — — 92.5 38
Talisman Energy Inc. 17.3 11.4 — (1.5) (2.5) — — — 24.7 47
Ultra Petroleum Corporation
33.1 5.4 — (19.1) (1.3) — — — 18.1 49
Vanguard Natural Resources, LLC
52.2 0.5 — (2.5) (3.4) 14.9 (0.5) — 61.2 42
Whiting Petroleum Corporation
297.8 74.7 — 3.2 (25.9) — (8.3) — 341.4 19
WPX Energy, Inc. 181.1 37.4 — (15.5) (14.8) — (1.3) — 186.9 31
All companies 20,903.2 3,795.5 520.0 (95.7) (1,640.2) 906.0 (865.9) 0.0 23,523.0
Integrateds 7,490.7 410.0 200.0 (5.5) (570.3) 220.0 (213.0) — 7,531.9
Large independents 9,057.8 2,003.4 218.6 81.8 (744.7) 212.0 (220.8) — 10,608.1
Independents 4,354.7 1,382.1 101.4 (172.0) (325.2) 474.0 (432.1) 0.0 5,382.9
(a) Includes condensate, natural gas liquids and synthetic crude.(b) Includes transfers, reclassifications and other.(1) – (8) See company footnotes on page 108.

92 | Global oil and gas reserves study
US — gas reserves for the latest fiscal year
Bcf
Beginning
Extensions and
discoveriesImproved recovery Revisions Production Purchases Sales Other (a) Ending
Ending rank
Anadarko Petroleum Corporation
8,365.0 418.0 — 635.0 (916.0) 26.0 (199.0) — 8,329.0 6
Antero Resources LLC 3,931.0 1,242.0 — 198.0 (87.0) — (1,590.0) — 3,694.0 16
Apache Corporation 2,976.2 365.9 — (156.8) (312.6) 313.9 (0.6) — 3,185.9 18
Berry Petroleum Company 534.3 100.1 — (205.8) (19.8) 16.7 — — 425.5 48
BHP Billiton Group 2,729.8 128.3 3.3 328.1 (458.4) 3,297.3 — — 6,028.4 7
Bill Barrett Corporation 1,181.1 83.4 — (212.7) (101.5) 0.3 (211.5) — 739.1 40
BP p.l.c. 13,552.0 225.0 885.0 (1,853.0) (661.0) 232.0 (1,149.0) — 11,231.0 2
Cabot Oil & Gas Corporation 2,909.9 869.0 — 207.0 (253.0) — (37.0) 0.1 3,696.0 15
Chesapeake Energy Corporation
15,515.0 3,317.0 — (6,080.0) (1,129.0) 14.0 (704.0) — 10,933.0 3
Chevron Corporation 3,646.0 166.0 5.0 318.0 (440.0) 33.0 (6.0) — 3,722.0 14
Cimarex Energy Co. 1,216.4 372.5 — (211.4) (118.5) 0.1 (7.2) — 1,251.9 31
Concho Resources Inc. 889.3 189.4 — (40.5) (70.6) 157.3 (82.8) — 1,042.1 33
ConocoPhillips 10,148.0 451.0 27.0 (483.0) (685.0) 9.0 — — 9,467.0 4
CONSOL Energy, Inc. 3,480.0 954.4 — (284.6) (156.3) — — — 3,993.5 13
Continental Resources, Inc. 1,093.8 400.8 — (174.7) (63.9) 89.1 (4.0) — 1,341.1 29
Denbury Resources Inc. 625.2 10.0 — (54.7) (10.7) 20.6 (108.8) — 481.6 47
Devon Energy Corporation 9,507.0 1,124.0 — (1,118.0) (752.0) 2.0 (1.0) — 8,762.0 5
Encana Corporation 6,511.0 338.0 — (1,701.0) (593.0) 8.0 (321.0) — 4,242.0 10
Energen Corporation 957.4 61.2 — (143.7) (76.4) 10.7 — — 809.1 39
EOG Resources, Inc. 6,045.8 477.8 — (1,736.0) (380.2) 14.8 (386.2) — 4,036.0 11
EP Energy LLC (1) 2,701.0 144.0 — (657.0) (239.0) — (72.0) — 1,877.0 26
EQT Corporation 5,347.4 1,654.2 — (755.8) (259.4) — (0.7) — 5,985.8 8
EXCO Resources, Inc. 1,291.5 96.6 — (266.5) (182.7) — (2.8) — 936.1 35
Exxon Mobil Corporation (1) 26,366.0 4,045.0 — (2,839.0) (1,524.0) 503.0 (181.0) — 26,370.0 1
Forest Oil Corporation 1,396.5 93.6 — (479.0) (81.0) — (17.3) — 912.8 36
Hess Corporation 360.0 76.0 4.0 10.0 (50.0) — — — 400.0 49
Laredo Petroleum Holdings, Inc.
601.1 232.4 — (260.7) (39.1) 9.2 — — 542.9 44
Linn Energy, LLC 1,675.0 407.0 — (559.0) (128.0) 1,176.0 — — 2,571.0 22
Marathon Oil Corporation 872.0 224.0 — (29.0) (129.0) 105.0 — — 1,043.0 32
Murphy Oil Corporation 98.4 107.2 — 16.5 (19.4) 7.0 — — 209.7 51
National Fuel Gas Company 674.9 436.1 — (56.5) (66.1) — — — 988.4 34
Newfield Exploration Company
2,329.0 181.0 — (525.0) (151.0) 1.0 (80.0) — 1,755.0 27

93Global oil and gas reserves study |
Bcf
Beginning
Extensions and
discoveriesImproved recovery Revisions Production Purchases Sales Other (a) Ending
Ending rank
Nexen Inc. 91.0 — — (20.0) (15.0) — — — 56.0 53
Noble Energy, Inc. 1,976.0 601.0 — (266.0) (160.0) — (164.0) — 1,987.0 25
Occidental Petroleum Corporation
3,365.0 19.0 317.0 (748.0) (300.0) 236.0 — — 2,889.0 20
PDC Energy, Inc. 672.1 172.9 — (289.4) (32.4) 87.2 (6.4) — 604.0 41
Petrohawk Energy Corporation (9)
3,355.1 — — — — — (3,355.1) — — —
Petroleo Brasileiro, S.A. (Petrobras)
71.9 — — 2.7 (6.9) — — — 67.7 52
Pioneer Natural Resources Company
2,518.4 320.2 — (485.2) (157.4) 9.5 (8.0) — 2,197.5 24
Plains Exploration & Production Company (1)
1,049.4 83.5 — (591.4) (98.5) 79.4 (11.3) (0.2) 510.8 45
QEP Resources, Inc. 2,749.4 330.6 — (240.6) (249.3) 32.3 — — 2,622.4 21
Quicksilver Resources Inc. 1,828.9 25.9 — (910.4) (75.7) — (20.6) — 848.0 37
Range Resources Corporation
4,009.7 996.1 — 76.9 (216.6) — (73.4) — 4,792.7 9
Repsol S.A. 14.0 33.0 — — (5.0) — (2.0) — 40.0 54
Rosetta Resources Inc. 446.0 158.8 — (10.1) (33.9) 0.7 (52.1) (0.0) 509.5 46
Royal Dutch Shell plc (1) 3,259.0 393.0 16.0 (1,045.0) (404.0) 139.0 (6.0) — 2,352.0 23
SandRidge Energy, Inc. 1,355.1 489.3 — (538.2) (93.5) 203.0 (0.5) — 1,415.0 28
SM Energy Company 664.0 297.4 125.1 (123.3) (120.0) 1.2 (11.0) — 833.4 38
Southwestern Energy Company
5,887.2 918.6 — (2,088.0) (564.5) — (136.5) — 4,016.8 12
Swift Energy Company 616.8 114.5 — (97.3) (36.4) — — — 597.6 42
Talisman Energy Inc. 1,985.8 (550.0) — 66.0 (176.8) — — — 1,325.0 30
Ultra Petroleum Corporation
4,778.6 819.9 — (2,382.7) (249.3) — — — 2,966.4 19
Vanguard Natural Resources, LLC
162.8 0.3 — (9.5) (19.7) 446.1 (33.5) — 546.5 43
Whiting Petroleum Corporation
285.0 40.9 — (61.8) (25.8) — (14.0) — 224.3 50
WPX Energy, Inc. 3,982.9 409.2 — (404.8) (407.0) 5.8 (217.0) — 3,369.1 17
All companies 184,651.1 24,665.0 1,382.4 (29,337.0) (13,601.1) 7,286.1 (9,273.6) (0.1) 165,772.8
Integrateds 47,268.9 4,938.0 910.0 (5,406.3) (3,090.9) 907.0 (1,344.0) — 44,182.7
Large independents 79,886.2 10,434.5 347.3 (12,518.8) (6,448.5) 4,035.4 (1,857.9) — 73,878.2
Independents 57,495.9 9,292.6 125.1 (11,411.8) (4,061.7) 2,343.6 (6,071.7) (0.1) 47,711.9
(a) Includes transfers, reclassifications and other.(1) – (8) See company footnotes on page 108.

94 | Global oil and gas reserves study
US — performance measures (three-year averages) (a)
Costs in $ per boe, production replacement rates in %
Production replacement rates
Oil Gas
PRAC FDC RRCAll
sources
Excluding purchases and sales
All sources
Excluding purchases and sales
Production costs
Anadarko Petroleum Corporation $ 4.00 $ 12.49 $ 12.45 163% 192% 122% 132% $ 11.47
Antero Resources LLC 4.23 2.83 2.88 18,718 27,355 1,287 1,920 10.67
Apache Corporation 16.05 40.60 27.66 341 201 184 58 14.42
Berry Petroleum Company 10.02 69.25 27.59 375 203 (205) (280) 20.80
BHP Billiton Group 6.82 41.79 17.70 382 316 1,230 128 10.00
Bill Barrett Corporation 10.32 25.87 23.34 916 784 38 95 10.21
BP p.l.c. 19.46 112.14 72.03 (24) 34 (76) (9) 16.31
Cabot Oil & Gas Corporation 7.79 6.12 6.12 452 480 402 448 6.55
Chesapeake Energy Corporation 23.02 21.13 21.16 776 888 16 172 6.25
Chevron Corporation 6.48 37.43 30.07 100 99 174 90 17.20
Cimarex Energy Co. 6.23 15.97 15.74 326 344 118 172 10.90
Concho Resources Inc. 15.62 22.81 19.89 406 291 501 328 11.92
ConocoPhillips 19.95 16.82 16.84 150 156 41 49 23.20
CONSOL Energy, Inc. 9.72 10.28 10.11 — — 576 481 12.88
Continental Resources, Inc. 9.60 13.09 12.61 827 711 772 702 11.83
Denbury Resources Inc. 12.08 21.49 15.70 299 264 888 283 25.31
Devon Energy Corporation 9.29 17.78 17.71 244 272 113 127 8.32
Encana Corporation 5.22 17.55 16.98 700 783 25 96 11.46
Energen Corporation 8.52 29.10 21.11 485 297 60 36 12.44
EOG Resources, Inc. 1.07 20.37 20.26 541 563 (90) (30) 12.39
EP Energy LLC (1) 7.05 11.93 11.84 982 1,024 54 84 8.10
EQT Corporation 20.02 7.63 7.83 299 291 424 418 2.45
EXCO Resources, Inc. 11.04 25.07 23.18 353 370 102 114 7.01
Exxon Mobil Corporation (1) 7.88 40.12 18.37 238 112 451 132 16.37
Forest Oil Corporation 5.78 118.72 112.94 209 259 (86) (63) 7.25
Hess Corporation 24.49 34.73 34.23 302 289 168 158 19.80
Laredo Petroleum Holdings, Inc. 5.31 13.68 13.51 1,042 1,025 386 376 8.65
Linn Energy, LLC 10.25 26.27 12.70 647 165 843 65 13.69
Marathon Oil Corporation 14.14 34.96 27.49 435 279 159 105 20.49
Murphy Oil Corporation 9.01 17.49 17.10 601 573 315 303 20.81
National Fuel Gas Company 5.72 11.22 10.96 58 74 603 589 7.91
Newfield Exploration Company 12.00 44.56 41.66 378 414 (62) (33) 12.29

95Global oil and gas reserves study |
Production replacement rates
Oil Gas
PRAC FDC RRCAll
sources
Excluding purchases and sales
All sources
Excluding purchases and sales
Production costs
Nexen Inc. $ — $ (666.78) $ (666.78) 13% 13% (21)% (21)% $ 14.01
Noble Energy, Inc. 6.54 29.68 21.77 156 205 201 124 10.56
Occidental Petroleum Corporation 16.98 66.06 35.54 154 88 111 (27) 18.69
PDC Energy, Inc. 5.34 18.40 12.61 1,081 856 95 (4) 9.58
Petrohawk Energy Corporation — — — — — — — —
Petroleo Brasileiro, S.A. (Petrobras)
— 34.11 40.63 1,548 1,550 213 214 14.89
Pioneer Natural Resources Company
1.89 18.21 17.46 433 417 43 45 12.87
Plains Exploration & Production Company (1)
31.10 64.65 47.12 339 174 (25) 28 14.90
QEP Resources, Inc. 13.57 16.23 15.82 917 711 114 110 8.31
Quicksilver Resources Inc. 6.03 (9.05) (12.13) (209) (208) (186) (228) 12.04
Range Resources Corporation 6.30 5.14 5.16 939 1,126 522 687 7.31
Repsol S.A. — 120.05 120.05 33 36 281 296 3.89
Rosetta Resources Inc. 8.76 6.96 6.99 846 857 301 470 7.64
Royal Dutch Shell plc (1) 7.66 46.00 41.76 179 175 102 103 18.06
SandRidge Energy, Inc. 20.70 12.71 14.85 704 601 407 487 15.06
SM Energy Company 19.31 14.67 14.67 392 457 231 252 10.54
Southwestern Energy Company 7.85 16.32 16.32 (132) 91 125 141 5.52
Swift Energy Company — 12.79 13.81 276 309 449 523 14.71
Talisman Energy Inc. 66.43 21.73 22.75 897 855 296 292 7.44
Ultra Petroleum Corporation — (195.38) (195.38) (175) (175) (11) (11) 6.67
Vanguard Natural Resources, LLC 12.34 88.28 12.92 785 55 1,422 (51) 16.61
Whiting Petroleum Corporation 38.91 25.93 26.01 280 294 (4) 22 17.37
WPX Energy, Inc. 14.30 20.36 19.72 423 369 43 57 13.24
All companies $ 10.52 $ 23.11 $ 19.58 249% 237% 128% 135% $ 13.76
Integrateds $ 8.41 $ 43.46 $ 26.11 120% 108% 228% 87% $ 16.77
Large independents 11.16 20.81 18.85 271 276 55 125 13.28
Independents 13.12 16.61 15.83 494 441 159 190 10.93
(a) Performance measures are based on less than three years of results for companies that have had operations for less than three years.(1) – (8) See company footnotes on page 108.
96 | Global oil and gas reserves study

97Global oil and gas reserves study |
Other/unspecified
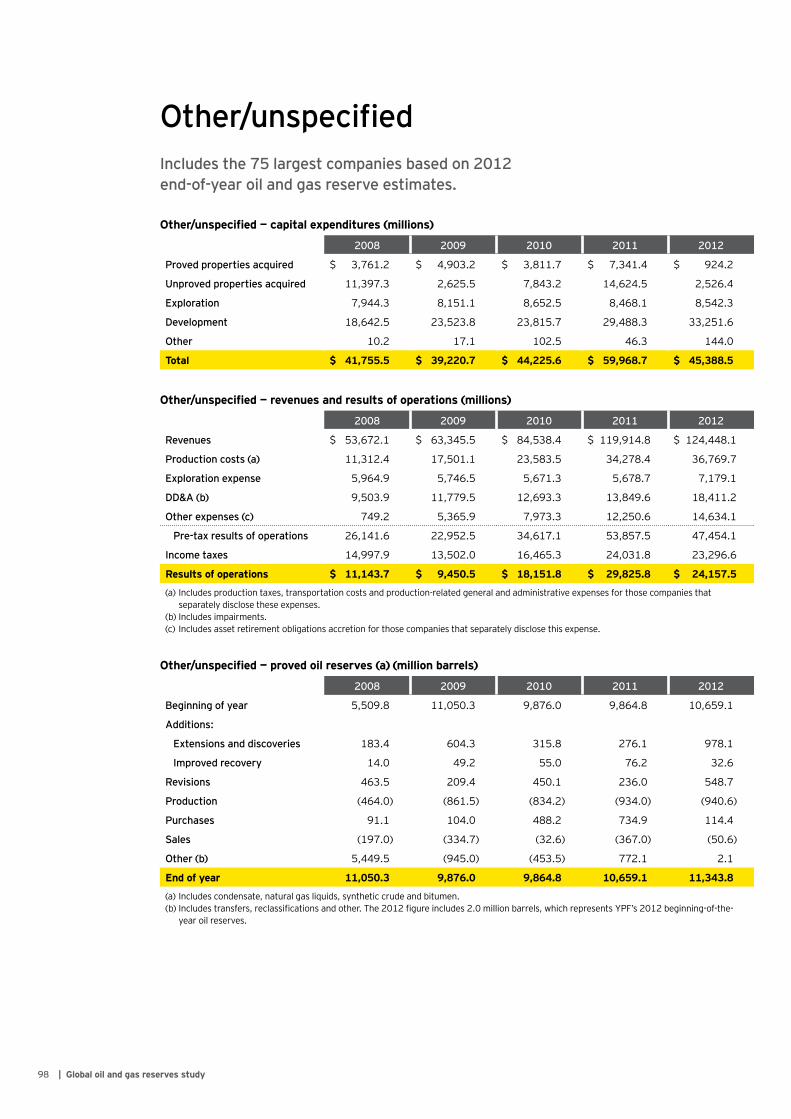
98 | Global oil and gas reserves study
Other/unspecifiedIncludes the 75 largest companies based on 2012 end-of-year oil and gas reserve estimates.
2008 2009 2010 2011 2012
Proved properties acquired $ 3,761.2 $ 4,903.2 $ 3,811.7 $ 7,341.4 $ 924.2
Unproved properties acquired 11,397.3 2,625.5 7,843.2 14,624.5 2,526.4
Exploration 7,944.3 8,151.1 8,652.5 8,468.1 8,542.3
Development 18,642.5 23,523.8 23,815.7 29,488.3 33,251.6
Other 10.2 17.1 102.5 46.3 144.0
Total $ 41,755.5 $ 39,220.7 $ 44,225.6 $ 59,968.7 $ 45,388.5
Other/unspecified — capital expenditures (millions)
2008 2009 2010 2011 2012
Revenues $ 53,672.1 $ 63,345.5 $ 84,538.4 $ 119,914.8 $ 124,448.1
Production costs (a) 11,312.4 17,501.1 23,583.5 34,278.4 36,769.7
Exploration expense 5,964.9 5,746.5 5,671.3 5,678.7 7,179.1
DD&A (b) 9,503.9 11,779.5 12,693.3 13,849.6 18,411.2
Other expenses (c) 749.2 5,365.9 7,973.3 12,250.6 14,634.1
Pre-tax results of operations 26,141.6 22,952.5 34,617.1 53,857.5 47,454.1
Income taxes 14,997.9 13,502.0 16,465.3 24,031.8 23,296.6
Results of operations $ 11,143.7 $ 9,450.5 $ 18,151.8 $ 29,825.8 $ 24,157.5
(a) Includes production taxes, transportation costs and production-related general and administrative expenses for those companies that separately disclose these expenses.
(b) Includes impairments.(c) Includes asset retirement obligations accretion for those companies that separately disclose this expense.
Other/unspecified — revenues and results of operations (millions)
2008 2009 2010 2011 2012
Beginning of year 5,509.8 11,050.3 9,876.0 9,864.8 10,659.1
Additions:
Extensions and discoveries 183.4 604.3 315.8 276.1 978.1
Improved recovery 14.0 49.2 55.0 76.2 32.6
Revisions 463.5 209.4 450.1 236.0 548.7
Production (464.0) (861.5) (834.2) (934.0) (940.6)
Purchases 91.1 104.0 488.2 734.9 114.4
Sales (197.0) (334.7) (32.6) (367.0) (50.6)
Other (b) 5,449.5 (945.0) (453.5) 772.1 2.1
End of year 11,050.3 9,876.0 9,864.8 10,659.1 11,343.8
(a) Includes condensate, natural gas liquids, synthetic crude and bitumen. (b) Includes transfers, reclassifications and other. The 2012 figure includes 2.0 million barrels, which represents YPF’s 2012 beginning-of-the-
year oil reserves.
Other/unspecified — proved oil reserves (a) (million barrels)
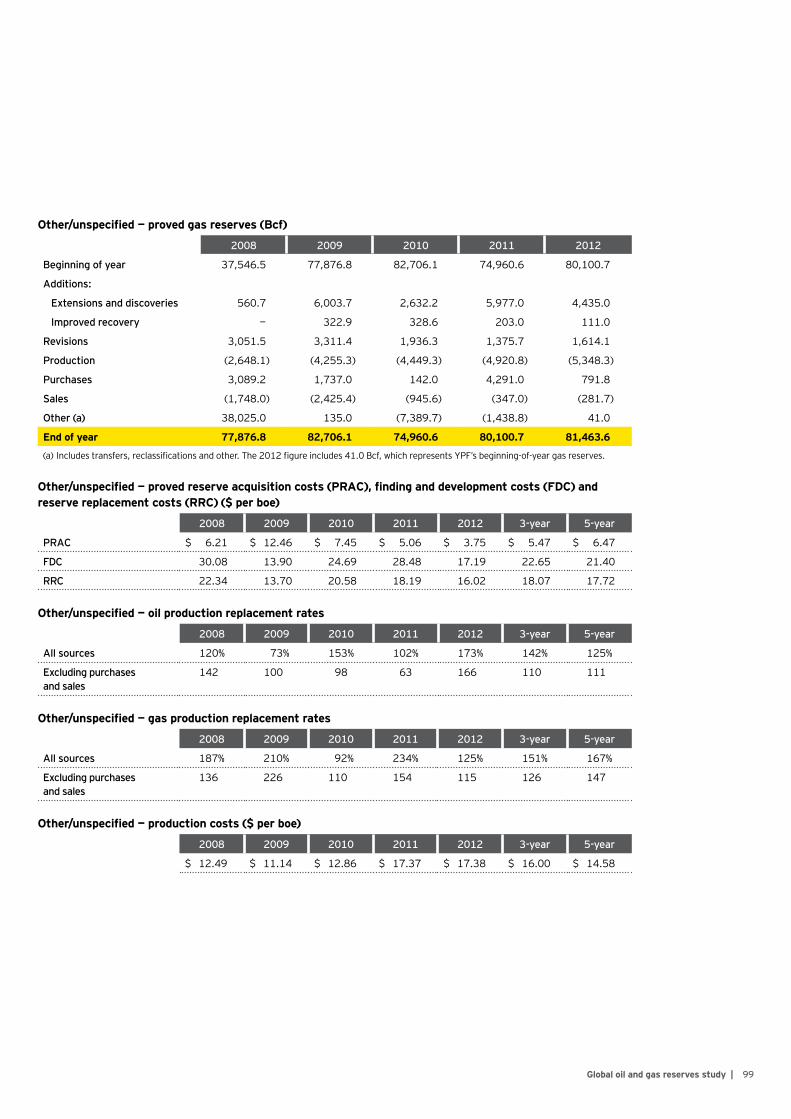
99Global oil and gas reserves study |
2008 2009 2010 2011 2012
Beginning of year 37,546.5 77,876.8 82,706.1 74,960.6 80,100.7
Additions:
Extensions and discoveries 560.7 6,003.7 2,632.2 5,977.0 4,435.0
Improved recovery — 322.9 328.6 203.0 111.0
Revisions 3,051.5 3,311.4 1,936.3 1,375.7 1,614.1
Production (2,648.1) (4,255.3) (4,449.3) (4,920.8) (5,348.3)
Purchases 3,089.2 1,737.0 142.0 4,291.0 791.8
Sales (1,748.0) (2,425.4) (945.6) (347.0) (281.7)
Other (a) 38,025.0 135.0 (7,389.7) (1,438.8) 41.0
End of year 77,876.8 82,706.1 74,960.6 80,100.7 81,463.6
(a) Includes transfers, reclassifications and other. The 2012 figure includes 41.0 Bcf, which represents YPF’s beginning-of-year gas reserves.
Other/unspecified — proved gas reserves (Bcf)
Other/unspecified — proved reserve acquisition costs (PRAC), finding and development costs (FDC) and reserve replacement costs (RRC) ($ per boe)
2008 2009 2010 2011 2012 3-year 5-year
PRAC $ 6.21 $ 12.46 $ 7.45 $ 5.06 $ 3.75 $ 5.47 $ 6.47
FDC 30.08 13.90 24.69 28.48 17.19 22.65 21.40
RRC 22.34 13.70 20.58 18.19 16.02 18.07 17.72
Other/unspecified — oil production replacement rates
2008 2009 2010 2011 2012 3-year 5-year
All sources 120% 73% 153% 102% 173% 142% 125%
Excluding purchases and sales
142 100 98 63 166 110 111
Other/unspecified — gas production replacement rates
2008 2009 2010 2011 2012 3-year 5-year
All sources 187% 210% 92% 234% 125% 151% 167%
Excluding purchases and sales
136 226 110 154 115 126 147
Other/unspecified — production costs ($ per boe)
2008 2009 2010 2011 2012 3-year 5-year
$ 12.49 $ 11.14 $ 12.86 $ 17.37 $ 17.38 $ 16.00 $ 14.58

100 | Global oil and gas reserves study
Other/unspecified — capital expenditures for the latest fiscal year
Millions
Proved properties acquired
Unproved properties acquired Exploration Development Other
Total capital expenditures
Anadarko Petroleum Corporation $ — $ 15.0 $ 1,000.0 $ 472.0 $ — $ 1,487.0
Apache Corporation — — 96.0 2.0 — 98.0
BG Group plc — 61.0 1,003.0 5,855.0 — 6,919.0
BHP Billiton Group — — 331.0 102.0 — 433.0
BP p.l.c. (1) — 439.0 38.0 1,155.0 — 1,632.0
Chevron Corporation (1) — 57.0 362.0 1,504.0 — 1,923.0
CNOOC Limited (1) — — 84.2 1,999.8 — 2,084.0
ConocoPhillips (1) — — 193.0 1,748.0 — 1,941.0
Eni SpA (1) 2.6 — 124.7 1,976.6 — 2,103.9
EOG Resources, Inc. — (0.6) 54.0 135.6 12.0 200.9
Exxon Mobil Corporation (1) — — — 651.0 — 651.0
Hess Corporation — 10.0 335.0 971.0 — 1,316.0
Husky Energy Inc. — — 25.0 834.3 — 859.3
INPEX CORPORATION — — 188.8 37.0 — 225.8
Marathon Oil Corporation — (13.0) 136.0 5.0 — 128.0
Mitsui & Co., Ltd. (1) 116.5 33.9 157.5 1,182.2 — 1,490.1
Murphy Oil Corporation — 10.2 97.6 1.6 — 109.4
Nexen Inc. — — 142.1 344.1 — 486.2
Noble Energy, Inc. — 28.0 173.0 70.0 — 271.0
OAO LUKOIL (1) 97.0 37.0 160.0 2,111.0 — 2,405.0
OMV Aktiengesellschaft 350.5 215.7 178.9 198.7 99.0 1,042.9
Petroleo Brasileiro, S.A. (Petrobras) (1) — — 1.0 79.0 — 80.0
Royal Dutch Shell plc (1) — — 426.0 2,800.0 — 3,226.0
Sasol Limited — 1.6 59.1 16.1 — 76.8
Statoil ASA 51.6 1,100.0 2,045.3 5,482.7 — 8,679.5
Talisman Energy Inc. — 66.0 351.0 105.0 33.0 555.0
Total S.A. (1) 306.1 465.5 697.0 3,353.9 — 4,822.5
WPX Energy, Inc. — — 31.0 35.0 — 66.0
YPF S.A. (1) — — 52.1 23.9 — 76.0
All companies $ 924.2 $ 2,526.4 $ 8,542.3 $ 33,251.6 $ 144.0 $ 45,388.5
Integrateds $ 924.2 $ 2,359.8 $ 4,636.7 $ 21,505.1 $ 99.0 $ 29,524.8
Large independents — 90.4 3,259.0 10,426.4 12.0 13,787.7
Independents — 76.2 646.7 1,320.1 33.0 2,075.9
(1) – (8) See company footnotes on page 108.

101Global oil and gas reserves study |
Other/unspecified — revenues and results of operations for the latest fiscal year (a)
Millions
RevenuesProduction
costs (b)Exploration
expense DD&A (c)
Other (income)
expense (d) Income taxesResults of operations
Anadarko Petroleum Corporation $ 3,396.0 $ 829.0 $ 462.0 $ 390.0 $ — $ 466.9 $ 1,248.1
Apache Corporation — — — 43.0 — — (43.0)
BG Group plc 8,493.0 1,232.0 598.0 1,837.0 1,489.0 1,642.0 1,695.0
BHP Billiton Group 1,580.0 387.0 304.0 218.0 — 534.0 137.0
BP p.l.c. (1) 6,533.0 5,054.0 32.0 866.0 (13.0) 348.0 246.0
Chevron Corporation (1) 5,509.0 2,405.0 145.0 793.0 177.0 609.0 1,380.0
CNOOC Limited (1) 1,390.7 849.7 265.3 589.4 6.2 12.5 (332.4)
ConocoPhillips (1) 3,553.0 1,597.0 231.0 896.0 92.0 131.0 606.0
Eni SpA (1) 2,865.2 700.9 210.9 1,732.3 42.4 111.9 66.9
EOG Resources, Inc. 23.2 13.0 19.4 18.0 — (21.9) (5.3)
Exxon Mobil Corporation (1) 25,710.0 7,142.0 — 676.0 — 8,234.0 9,658.0
Hess Corporation 1,784.0 431.0 489.0 484.0 — 156.0 224.0
Husky Energy Inc. 264.1 31.0 45.0 11.0 — 51.0 126.1
INPEX CORPORATION (7) 14,625.9 5,006.3 148.7 277.2 — 6,435.6 2,758.1
Marathon Oil Corporation (32.0) 19.0 73.0 — — (55.0) (69.0)
Mitsui & Co., Ltd. (1) 1,471.8 371.3 66.3 271.7 — 238.3 524.1
Murphy Oil Corporation 0.1 48.4 84.7 31.3 — (40.1) (124.2)
Nexen Inc. 703.3 134.1 28.0 371.1 51.0 95.1 24.0
Noble Energy, Inc. 384.0 105.0 210.0 75.0 — 74.0 (80.0)
OAO LUKOIL (1) 4,672.0 1,388.0 165.0 626.0 — 851.0 1,642.0
OMV Aktiengesellschaft 2,711.9 310.4 206.3 515.5 31.1 1,145.9 502.6
Petroleo Brasileiro, S.A. (Petrobras) (1) 186.0 154.0 56.0 80.0 42.0 (15.0) (131.0)
Royal Dutch Shell plc (1) 14,374.0 6,455.0 546.0 1,686.0 300.0 2,133.0 3,254.0
Sasol Limited 166.1 29.6 52.1 21.4 — 22.6 40.3
Statoil ASA 7,510.8 859.4 1,925.0 2,664.0 1,976.5 (189.1) 275.0
Talisman Energy Inc. 623.0 94.0 303.0 425.0 — 67.0 (266.0)
Total S.A. (1) 15,731.7 1,027.5 439.8 2,757.2 10,439.8 245.6 821.8
WPX Energy, Inc. 137.0 72.0 11.0 27.0 — 10.0 17.0
YPF S.A. (1) 81.3 24.2 62.4 29.0 — 3.3 (37.6)
All companies $ 124,448.1 $ 36,769.7 $ 7,179.1 $ 18,411.2 $ 14,634.1 $ 23,296.6 $ 24,157.5
Integrateds $ 89,306.8 $ 26,352.3 $ 4,395.9 $ 13,202.1 $ 12,995.9 $ 13,894.6 $ 18,466.0
Large independents 33,413.9 10,037.9 2,311.5 4,343.6 1,587.2 9,219.1 5,914.6
Independents 1,727.5 379.5 471.7 865.5 51.0 183.0 (223.2)
(a) Amounts are determined from the results of operations table if this disclosure is provided; otherwise, amounts are determined from the income statement. Revenues determined from the income statement include oil and gas sales and hedging and derivative gains/losses.
(b) Includes production taxes, transportation costs and production-related general and administrative expenses for those companies that separately disclose these expenses. (c) Includes impairments.(d) Includes asset retirement obligations accretion for those companies that separately disclose this expense.(1) – (8) See company footnotes on page 108.

102 | Global oil and gas reserves study
Other/unspecified — oil reserves for the latest fiscal year (a)
Million barrels
Beginning
Extensions and
discoveriesImproved recovery Revisions Production Purchases Sales Other (b) Ending
Ending rank
Anadarko Petroleum Corporation
248.0 — — 51.0 (31.0) — — — 268.0 11
Apache Corporation — — — — — — — — — —
BG Group plc 940.8 235.8 — 112.9 (42.5) — 0.8 — 1,247.8 3
BHP Billiton Group 41.5 — — 5.0 (9.6) — — — 36.9 16
BP p.l.c. (1) 1,025.0 — 24.0 (16.0) (109.0) — — — 924.0 4
Chevron Corporation (1) 514.0 102.0 8.0 38.0 (43.0) — — — 619.0 7
CNOOC Limited (1) 346.0 157.0 — 13.0 (17.0) — — — 499.0 9
ConocoPhillips (1) 256.0 — — — (9.0) — — — 247.0 12
Eni SpA (1) 432.0 12.0 — 41.0 (33.0) — (32.0) — 420.0 10
EOG Resources, Inc. 0.1 8.8 — 0.0 (0.0) — — — 8.9 23
Exxon Mobil Corporation (1) 2,643.0 164.0 — 149.0 (223.0) 36.0 (4.0) — 2,765.0 1
Hess Corporation 52.0 1.0 — 1.0 (6.0) — — — 48.0 14
Husky Energy Inc. 7.0 8.0 — 3.0 (2.0) — — — 16.0 19
INPEX CORPORATION — — — — — — — — — —
Marathon Oil Corporation — — — — — — — — — —
Mitsui & Co., Ltd. (1) 35.0 — — 2.0 (4.0) 9.0 (3.0) — 39.0 15
Murphy Oil Corporation — — — — — — — — — —
Nexen Inc. 36.0 3.0 — (1.0) (7.0) — — — 31.0 17
Noble Energy, Inc. 19.0 1.0 — — (3.0) — (4.0) — 13.0 20
OAO LUKOIL (1) 617.0 42.0 — (2.0) (46.0) 42.0 (2.0) — 651.0 5
OMV Aktiengesellschaft 150.8 0.3 — 6.6 (20.2) 15.4 (2.4) — 150.5 13
Petroleo Brasileiro, S.A. (Petrobras) (1)
29.6 — — (3.0) (2.3) — — — 24.3 18
Royal Dutch Shell plc (1) 613.0 2.0 — 82.0 (135.0) — (1.0) — 561.0 8
Sasol Limited 3.7 — 0.6 1.1 (1.5) — — 0.1 4.0 24
Statoil ASA 499.0 166.0 — 33.0 (63.0) 1.0 (1.0) — 635.0 6
Talisman Energy Inc. 15.5 (0.9) — 0.2 (1.9) — — — 12.9 21
Total S.A. (1) 2,123.0 74.0 — 32.0 (129.0) 11.0 (2.0) — 2,109.0 2
WPX Energy, Inc. 12.1 2.1 — (1.1) (1.6) — — — 11.5 22
YPF S.A. (1) (10) — — — 1.0 (1.0) — — 2.0 2.0 25
All companies 10,659.1 978.1 32.6 548.7 (940.6) 114.4 (50.6) 2.1 11,343.8
Integrateds 8,737.1 563.3 32.6 365.7 (816.0) 114.4 (47.4) 2.1 8,951.8
Large independents 1,851.4 402.6 — 181.9 (112.1) — (3.2) — 2,320.6
Independents 70.6 12.2 — 1.1 (12.5) — — — 71.4
(a) Includes condensate, natural gas liquids and synthetic crude.(b) Includes transfers, reclassifications and other.(1) – (8) See company footnotes on page 108.

103Global oil and gas reserves study |
Other/unspecified — gas reserves for the latest fiscal year
Bcf
Beginning
Extensions and
discoveriesImproved recovery Revisions Production Purchases Sales Other (a) Ending
Ending rank
Anadarko Petroleum Corporation
— — — — — — — — — —
Apache Corporation — — — — — — — — — —
BG Group plc 11,918.0 959.0 — (522.0) (976.0) — (22.0) — 11,357.0 3
BHP Billiton Group 735.6 — — 29.1 (122.6) — — — 642.1 14
BP p.l.c. (1) 2,500.0 3.0 111.0 255.0 (204.0) — — — 2,665.0 9
Chevron Corporation (1) 2,867.0 46.0 — (40.0) (156.0) — — — 2,717.0 8
CNOOC Limited (1) 593.0 176.0 — 149.0 (68.0) — — — 850.0 13
ConocoPhillips (1) 3,368.0 330.0 — (73.0) (182.0) — (127.0) — 3,316.0 7
Eni SpA (1) 5,288.0 798.0 — 1,301.0 (137.0) — (34.0) — 7,216.0 4
EOG Resources, Inc. 18.5 0.3 — 1.6 (3.4) — — — 17.0 21
Exxon Mobil Corporation (1) 20,566.0 — — 252.0 (1,148.0) — — — 19,670.0 1
Hess Corporation 1,500.0 171.0 — 42.0 (175.0) — — — 1,538.0 11
Husky Energy Inc. 108.0 271.0 — — — — — — 379.0 15
INPEX CORPORATION 162.0 — — 59.0 (26.0) — — — 195.0 17
Marathon Oil Corporation — — — — — — — — — —
Mitsui & Co., Ltd. (1) 1,043.0 143.0 — (65.0) (94.0) 30.0 — — 1,057.0 12
Murphy Oil Corporation — — — — — — — — — —
Nexen Inc. — — — — — — — — — —
Noble Energy, Inc. 12.0 — — — (1.0) — (2.0) — 9.0 22
OAO LUKOIL (1) 6,345.0 98.0 — (143.0) (274.0) 1.0 (17.0) — 6,010.0 6
OMV Aktiengesellschaft 183.1 — — 16.2 (27.8) 174.8 (9.7) — 336.6 16
Petroleo Brasileiro, S.A. (Petrobras) (1)
43.5 — — 5.2 (0.9) — — — 47.8 19
Royal Dutch Shell plc (1) 7,410.0 26.0 — 298.0 (579.0) — (21.0) — 7,134.0 5
Sasol Limited — — — — — — — — — —
Statoil ASA 1,560.0 352.0 — (10.0) (223.0) 18.0 (14.0) — 1,683.0 10
Talisman Energy Inc. — — — — — — — — — —
Total S.A. (1) 13,805.0 1,056.0 — 68.0 (931.0) 568.0 (35.0) — 14,531.0 2
WPX Energy, Inc. 75.0 5.7 — (18.0) (8.6) — — — 54.1 18
YPF S.A. (1) (10) — — — 9.0 (11.0) — — 41.0 39.0 20
All companies 80,100.7 4,435.0 111.0 1,614.1 (5,348.3) 791.8 (281.7) 41.0 81,463.6
Integrateds 63,110.6 2,693.0 111.0 1,988.4 (3,960.7) 791.8 (130.7) 41.0 64,644.4
Large independents 16,807.1 1,465.3 — (356.3) (1,379.0) — (151.0) — 16,386.1
Independents 183.0 276.7 — (18.0) (8.6) — — — 433.1
(a) Includes transfers, reclassifications and other.(1) – (8) See company footnotes on page 108.

104 | Global oil and gas reserves study
Other/unspecified — performance measures (three-year averages) (a)
Costs in $ per boe, production replacement rates in %
Production replacement rates
Oil Gas
PRAC FDC RRCAll
sources
Excluding purchases and sales
All sources
Excluding purchases and sales
Production costs
Anadarko Petroleum Corporation $ — $ 42.45 $ 42.45 121% 121% — % — % $ 28.95
Apache Corporation — — — — — — — —
BG Group plc 25.76 13.44 13.58 685 684 139 142 5.57
BHP Billiton Group — 68.45 68.45 42 42 15 15 10.56
BP p.l.c. (1) 0.39 17.72 11.38 (19) 26 125 123 27.37
Chevron Corporation (1) — 24.73 24.79 167 167 36 36 28.74
CNOOC Limited (1) 17.88 46.67 34.04 1,131 614 309 202 25.85
ConocoPhillips (1) — 18.97 20.31 283 283 258 323 34.65
Eni SpA (1) — 5.98 5.98 303 339 1,265 1,273 12.30
EOG Resources, Inc. — 33.54 33.54 9,709 9,709 133 133 15.53
Exxon Mobil Corporation (1) — 2.65 2.45 76 70 32 32 15.20
Hess Corporation — 95.58 95.58 (63) (31) 34 51 11.23
Husky Energy Inc. — 25.29 25.29 214 229 — — 12.20
INPEX CORPORATION — 19.95 19.95 (67) 33 140 140 —
Marathon Oil Corporation — — — — — — — —
Mitsui & Co., Ltd. (1) 7.50 38.87 31.48 52 71 157 136 16.95
Murphy Oil Corporation — — — — — — — —
Nexen Inc. — 628.00 628.00 12 12 — — 18.32
Noble Energy, Inc. — (92.05) (92.05) (69) (38) (1,236) (79) 21.00
OAO LUKOIL (1) 2.02 266.14 43.96 106 35 (29) (27) 14.29
OMV Aktiengesellschaft 19.75 34.80 28.55 83 53 170 98 17.45
Petroleo Brasileiro, S.A. (Petrobras) (1)
— (105.03) (109.44) (100) (100) (316) (316) 39.68
Royal Dutch Shell plc (1) — 20.14 19.84 72 76 49 83 23.87
Sasol Limited — 54.62 54.62 82 82 — — 15.10
Statoil ASA 10.82 47.35 39.87 254 225 285 257 13.87
Talisman Energy Inc. — (1,541.17) (2,162.99) (21) (13) — — 31.04
Total S.A. (1) 3.04 48.74 11.23 195 3 273 84 3.24
WPX Energy, Inc. — 45.69 45.69 87 87 (14) (14) 19.66
YPF S.A. (1) — 30.41 30.41 100 100 82 82 8.53
All companies $ 5.47 $ 22.65 $ 18.07 142% 110% 151% 126% $ 16.00
Integrated $ 3.76 $ 22.78 $ 16.24 107% 76% 151% 113% $ 16.69
Large independents 20.58 20.53 20.53 431 383 144 154 12.55
Independents — 67.67 74.05 47 51 1,399 1,514 22.02
(a) Performance measures are based on less than three years of results for companies that have had operations for less than three years.(1) – (8) See company footnotes on page 108.

105Global oil and gas reserves study |
Other information

106 | Global oil and gas reserves study
Study companies and their areas of operationsBased on companies’ disclosures in their annual reports for the most recent fiscal year.
Africa and Middle East Asia-Pacific Canada Europe
South and Central America US
Other/ unspecified
Anadarko Petroleum Corporation
Antero Resources LLC
Apache Corporation
Berry Petroleum Company
BG Group plc
BHP Billiton Group
Bill Barrett Corporation
BP p.l.c.
Cabot Oil & Gas Corporation
Canadian Natural Resources Limited
Chesapeake Energy Corporation
Chevron Corporation
China Petroleum & Chemical Corporation (Sinopec)
Cimarex Energy Co.
CNOOC Limited
Concho Resources Inc.
ConocoPhillips
CONSOL Energy, Inc.
Continental Resources, Inc.
Denbury Resources Inc.
Devon Energy Corporation
Ecopetrol S.A.
Encana Corporation
Energen Corporation
Eni SpA
EOG Resources, Inc.
EP Energy LLC
EQT Corporation
EXCO Resources, Inc.
Exxon Mobil Corporation
Forest Oil Corporation
Hess Corporation
Husky Energy Inc.
INPEX CORPORATION
Laredo Petroleum Holdings, Inc.
Linn Energy, LLC
Marathon Oil Corporation
Mitsui & Co., Ltd.

107Global oil and gas reserves study |
Africa and Middle East Asia-Pacific Canada Europe
South and Central America US
Other/unspecified
Murphy Oil Corporation
National Fuel Gas Company
Newfield Exploration Company
Nexen Inc.
Noble Energy, Inc.
OAO LUKOIL
OAO NOVATEK
Occidental Petroleum Corporation
OJSC Rosneft Oil Company
OMV Aktiengesellschaft
PDC Energy, Inc.
Pengrowth Energy Corporation
Penn West Petroleum Ltd.
PetroChina Company Limited
Petroleo Brasileiro, S.A. (Petrobras)
Petroleos Mexicanos (PEMEX)
Pioneer Natural Resources Company
Plains Exploration & Production Company
QEP Resources, Inc.
Quicksilver Resources Inc.
Range Resources Corporation
Repsol S.A.
Rosetta Resources Inc.
Royal Dutch Shell plc
SandRidge Energy, Inc.
Sasol Limited
SM Energy Company
Southwestern Energy Company
Statoil ASA
Swift Energy Company
Talisman Energy Inc.
Total S.A.
Ultra Petroleum Corporation
Vanguard Natural Resources, LLC
Whiting Petroleum Corporation
WPX Energy, Inc.
YPF S.A.

108 | Global oil and gas reserves study
Peer groupsIntegratedsBP p.l.c.Chevron CorporationChina Petroleum & Chemical Corporation
(Sinopec)Ecopetrol S.A.Eni SpAExxon Mobil CorporationHess Corporation Mitsui & Co., Ltd.OAO LUKOILOAO NOVATEKOJSC Rosneft Oil CompanyOMV AktiengesellschaftPetroChina Company LimitedPetroleo Brasileiro, S.A. (Petrobras)Petroleos Mexicanos (PEMEX)Repsol S.A. Royal Dutch Shell plcSasol LimitedStatoil ASA Total S.A. YPF S.A.
Large independentsAnadarko Petroleum CorporationApache CorporationBG Group plcBHP Billiton GroupCanadian Natural Resources LimitedChesapeake Energy CorporationCNOOC LimitedConocoPhillipsDevon Energy CorporationEncana CorporationEOG Resources, Inc.EQT Corporation INPEX CORPORATIONMarathon Oil CorporationNoble Energy, Inc.Occidental Petroleum CorporationPioneer Natural Resources CompanyRange Resources Corporation
IndependentsAntero Resources LLCBerry Petroleum CompanyBill Barrett CorporationCabot Oil & Gas CorporationCimarex Energy Co. Concho Resources Inc.CONSOL Energy, Inc.Continental Resources, Inc.Denbury Resources Inc.Energen CorporationEP Energy LLCEXCO Resources, Inc.Forest Oil CorporationHusky Energy Inc.Laredo Petroleum Holdings, Inc.Linn Energy, LLCMurphy Oil CorporationNational Fuel Gas CompanyNewfield Exploration CompanyNexen Inc.PDC Energy, Inc. Pengrowth Energy CorporationPenn West Petroleum Ltd. Plains Exploration & Production CompanyQEP Resources, Inc. Quicksilver Resources Inc.Rosetta Resources Inc.SandRidge Energy, Inc. SM Energy CompanySouthwestern Energy CompanySwift Energy CompanyTalisman Energy Inc.Ultra Petroleum CorporationVanguard Natural Resources, LLCWhiting Petroleum CorporationWPX Energy, Inc.
Company footnotes (1) Amounts presented for BP, Chevron,
CNOOC, ConocoPhillips, Eni, EP Energy, ExxonMobil, LUKOIL, Mitsui, Petrobras, Plains Exploration & Production, Royal Dutch Shell, Total and YPF include investments accounted for by the equity method.
(2) All of Rosneft’s oil and gas reserves are included as oil reserves as the company discloses its reserves on a boe basis only.
(3) Revenues and results of operations amounts presented for BP do not reflect any costs relating to the Gulf of Mexico oil spill.
(4) Revenues and results of operations amounts presented for Anadarko Petroleum exclude Deepwater Horizon settlement and related costs that were included by the company in its results of operations disclosure.
(5) Production taxes for Total are included in other (income) expense as the company does not separately disclose this expense.
(6) BP’s and Marathon’s results of operations disclosures contain impairments combined with other items. Impairments that were specifically identified in the footnotes have been presented as DD&A, while the remainder is presented consistent with the company’s disclosure.
(7) NPEX discloses its capital expenditures and oil and gas reserves by region, while its revenues and results of operations are disclosed for worldwide only. The company’s capital expenditures and oil and gas reserves are presented by region, while its revenues and results of operations are presented in worldwide and other/unspecified only. INPEX is not included in the production costs per boe calculations for Africa and Middle East, Asia-Pacific and other/unspecified.
(8) Amounts presented for NOVATEK’s oil and gas reserves include extensions and discoveries that were reported by the company as acquisitions and described as being related to the first time reserve estimation for certain fields acquired in late 2011 and additionally explored in 2012.
(9) As described on page 1, amounts equal to Petrohawk Energy’s beginning-of-year oil and gas reserves are included as sales to reflect the BHP Billiton transaction.
(10) As described on page 1, YPF’s beginning-of-year oil and gas reserves are presented in the other component of the reserves tables.

109Global oil and gas reserves study |

EY | Assurance | Tax | Transactions | Advisory
About EYEY is a global leader in assurance, tax, transaction and advisory services. The insights and quality services we deliver help build trust and confidence in the capital markets and in economies the world over. We develop outstanding leaders who team to deliver on our promises to all of our stakeholders. In so doing, we play a critical role in building a better working world for our people, for our clients and for our communities.
EY refers to the global organization, and may refer to one or more, of the member organizations of Ernst & Young Global Limited, each of which is a separate legal entity. Ernst & Young Global Limited, a UK company limited by guarantee, does not provide services to clients. For more information about our organization, please visit ey.com.
How EY’s Global Oil & Gas Center can help your businessThe oil and gas sector is constantly changing. Increasingly uncertain energy policies, geopolitical complexities, cost management and climate change all present significant challenges. EY’s Global Oil & Gas Center supports a global network of more than 9,600 oil and gas professionals with extensive experience in providing assurance, tax, transaction and advisory services across the upstream, midstream, downstream and oilfield service sub-sectors. The Center works to anticipate market trends, execute the mobility of our global resources and articulate points of view on relevant key sector issues. With our deep sector focus, we can help your organization drive down costs and compete more effectively.
© 2013 EYGM Limited. All Rights Reserved.
EYG No. DW0300CSG No. 1308-1125974ED None
This material has been prepared for general informational purposes only and is not intended to be relied upon as accounting, tax, or other professional advice. Please refer to your advisors for specific advice.
ey.com/oilandgas
EY’s Global Oil & Gas Center contacts
Allister Wilson Global Oil & Gas Assurance Leader London +44 20 7951 1443 [email protected]
Andy Brogan Global Oil & Gas Transactions Leader London +44 20 7951 7009 [email protected]
Alexey Kondrashov Global Oil & Gas Tax Leader Moscow +7 495 662 9394 [email protected]
Axel Preiss Global Oil & Gas Advisory Leader Frankfurt +49 619 699 96 17589 [email protected]
Dale Nijoka Global Oil & Gas Leader +1 713 750 1551 [email protected]
Alexandre Oliveira Global Oil & Gas Deputy Leader, Emerging Markets +971 4 7010750 [email protected]
Derek Leith Aberdeen +44 1224 653246 [email protected]
Thorsten Ploss Bahrain +97 3 5354 553 [email protected]
KC Yau Beijing +86 10 5815 3339 [email protected]
Mark Hayward Brisbane +61 7 3011 3385 [email protected]
Barry Munro Calgary +1 403 206 5017 [email protected]
Tabrez Khan Cape Town +020 7951 467 [email protected]
Deborah Byers Houston +1 713 750 8138 [email protected]
Jane Fitton Johannesburg +27 11 77 2 3736 [email protected]
Claire Lawrie Lagos +234 703 909 7963 [email protected]
Andy Brogan London +44 20 7951 7009 [email protected]
Alexey Loza Moscow +7 495 641 2945 [email protected]
Russell Curtin Perth +61 8 9429 2424 [email protected]
Carlos Assis Rio de Janeiro +55 21 3263 7212 [email protected]
Sanjeev Gupta Singapore +65 6309 8688 [email protected]
John Avaldsnes Stavanger +47 51 70 66 00 [email protected]
Connect with us
Follow us on Twitter @EY_OilGas
Visit us on LinkedIn
See us on YouTube