ary E Ambros - NMFS Scientific Publications...
4
, By Sammie Bethea and ary E Ambros * ABSTRACT ,.. pGIItbla lDdlcel of quaUty cIuriDg iced IIDrage, Ibady u m of bl ....... trbDetbylamble DltIDgeD CODteDt of raw beadl .. bIowD IbrbDp. compued witb tboee obtalDed fIom picric acid bubidity teIIa CODduc:I.d lilDult.l_..ty OD tbe lUDe Ibrimp ud prevloully repoltecl. The quality ratblgl of Ibrimp u de telll1lDed by a tute paDel weN .. d u It&DdaadI !or all teIIa. Oaaaga ill color ud COIity of Ibrimp homogeDat.el were abo obeerved !or poIIible ... u acce.ory of quality. The data IIbow tbat defillite pH valu .. could be .. lgDed !or dlffereDt quality uatioDi of baowD Ibrimp fIom a cutaill pl'OductloD area, ud tbua could "-lIb aD ob- Jective quality iDdex. TrilDetbylamUle DltrogeD valua weN of ... iD lag qual ty but oDiy after prime quaUty had disappeared ud off-flaYOll had become ID Ib tute panel. The picric acid tul'bidity tell gave lDdicatioDi of loll of qual ty Ie ralday. beJore the tute paDel could detect aay off-aavos. A chaoge iD Ibe color of Ibe bomo- geDaW fIom piDk ID blOwn ud aD mereue m vllOO8ity accompaaled Ibe deere ill quality. INTRODUCTIO Many objective tests for shrimp quality have been inveshgated, but non has b n in it- self completely satisfactory for evaluating the deterioration of quahty from prun condih n to spoiled. Bailey, Fieger, and Novak (1956) outlined three groups of t sts on 1C - tor d shrimp that indicate (1) changes in prime quality, (2) the onset of spoilag , and (3) chan in relative quality. Of the tests included in the third group, change in pH 1S th simpl st apply and indicates loss of prime quality and spoUage at definite pH r adings. t rmin - tions of trimethylamine nitrogen content is one of the tests used to md1cate th on t of age, although it gives no information of prespoUage changes (Fieger and FrUoux 1 5 ). A new test for evaluating shrimp quality, known as the p1cric aC1d turbidity t st been developed and tested at this Laboratory by Kurtzm an and Snyd r (1960). Th1S t dicates, by turbidity, loss of good quality of iced shrunp as m asur d by panel, although the mechanisms involved are not thoroughly understood. Th obJ t the work reported in this paper were therefore as follows: (1) to conduct lh c n nti n tests of pH and trimethylamine nitrogen determinations in conJunchon w1lh th P1Crl turbidity test to determine whether either the pH or th trunethylamm mtrog n c t the shrimp was possibly a contributing factor to the formahon or turbldity, (2) to d whether these determinations would be applicable to shrimp h Id in ic but 1 d veined before testing, and (3) to determine whether changes m color and vlscosity hrimp homogenates could possibly be used as accessory tests for qUal1ty. EXPERIME TAL -.-au 0._ } TediDOlO9 C&1 boratDlY. DivilioD of lDdUlttial ucla U. s. College Park, Md
Transcript of ary E Ambros - NMFS Scientific Publications...

,
By Sammie Bethea and ary E Ambros * ABSTRACT
,.. pGIItbla lDdlcel of quaUty cIuriDg iced IIDrage, Ibady u m of bl ....... trbDetbylamble DltIDgeD CODteDt of raw beadl .. bIowD IbrbDp. compued witb tboee obtalDed fIom picric acid bubidity teIIa CODduc:I.d lilDult.l_..ty OD tbe lUDe Ibrimp ud prevloully repoltecl. The quality ratblgl of Ibrimp u de telll1lDed by a tute paDel weN .. d u It&DdaadI !or all teIIa. Oaaaga ill color ud COIity of Ibrimp homogeDat.el were abo obeerved !or poIIible ... u acce.ory of quality.
The data IIbow tbat defillite pH valu .. could be .. lgDed !or dlffereDt quality uatioDi of baowD Ibrimp fIom a cutaill pl'OductloD area, ud tbua could "-lIb aD ob-Jective quality iDdex. TrilDetbylamUle DltrogeD valua weN of ... iD lag qual ty but oDiy after prime quaUty had disappeared ud off-flaYOll had become ID Ib tute panel. The picric acid tul'bidity tell gave lDdicatioDi of loll of qual ty Ie ralday. beJore the tute paDel could detect aay off-aavos. A chaoge iD Ibe color of Ibe bomo-geDaW fIom piDk ID blOwn ud aD mereue m vllOO8ity accompaaled Ibe deere ill quality.
INTRODUCTIO
Many objective tests for shrimp quality have been inveshgated, but non has b n in itself completely satisfactory for evaluating the deterioration of quahty from prun condih n to spoiled. Bailey, Fieger, and Novak (1956) outlined three groups of t sts on 1C - tor d shrimp that indicate (1) changes in prime quality, (2) the onset of spoilag , and (3) chan in relative quality. Of the tests included in the third group, change in pH 1S th simpl st apply and indicates loss of prime quality and spoUage at definite pH r adings. t rmin -tions of trimethylamine nitrogen content is one of the tests used to md1cate th on t of age, although it gives no information of prespoUage changes (Fieger and FrUoux 1 5 ).
A new test for evaluating shrimp quality, known as the p1cric aC1d turbidity t st been developed and tested at this Laboratory by Kurtzman and Snyd r (1960). Th1S t dicates, by increasin~ turbidity, loss of good quality of iced shrunp as m asur d by panel, although the mechanisms involved are not thoroughly understood. Th obJ t the work reported in this paper were therefore as follows: (1) to conduct lh c n nti n tests of pH and trimethylamine nitrogen determinations in conJunchon w1lh th P1Crl turbidity test to determine whether either the pH or th trunethylamm mtrog n c t the shrimp was possibly a contributing factor to the formahon or turbldity, (2) to d whether these determinations would be applicable to shrimp h Id in ic but 1 d veined before testing, and (3) to determine whether changes m color and vlscosity
hrimp homogenates could possibly be used as accessory tests for qUal1ty.
EXPERIME TAL
-.-au 0._ } TediDOlO9 C&1 boratDlY. DivilioD of lDdUlttial ucla U. s. College Park, Md

8 COMMERCIAL FISHERIES REVIEW Vol. 24, No.3
SENSORY TEST: The quality of both the frozen shrimp ami the iced shrimp was determined by a taste panel composed of five members. The panel graded the shrimp as high, good, fair, borderline, or inedible (Kurtzman and Snyder, 1960). Numerical values from 5 to 1 were assigned to these categories in the order of decreasing quality (figs. 1 to 3).
PHYSICAL AND CHEMICAL TESTS: Two 50-gram samples were taken daily from the frozen lot of shrimp and thawed, and two were taken from the iced lot. The four samples of shrimp were each peeled, deveined, and homogenized for 1 minute in a mechanical blender with 100 milliliters of demineralized water. Beginning on the 14th day of the experiment, 200 milliliters of water were used for each sample, and on the last two days 400 milliliters were used. These concentration changes were necessary in order to permit pipetting an aliquot of sample because of increased formation of gelatineous material.
The pH of the shrimp homogenates was then determined at room temperature.
The trimethylamine nitrogen content of the shrimp was determined by the method of Dyer (1945) as modified by Hoogland (1956).
The picric acid turbidity test was conducted on samples varying in size from individual shrimp to 100 grams .!./. The test consists of measuring by means of a Klett-Summerson photoelectric spectrophotometer the turbidity of filtrates obtained from slurries of shrimp macerated in 70-percent alcohol with saturated aqueous picric acid added. An increase in turbidity is indicative of loss of quality of the shrimp.
The color and viscosity of the homogenates were observed visually.
RESULTS AND DISCUSSION
ICED SHRIMP: Sensory Test Results: The taste panel considered the freshly-thawed shrimp to be high quality. On the 5th day, the panel still rated the shrimp as good quality. On the 8th and 10th days, the panel rated the shrimp as fair quality, on the 12th day, as borderline quality, and on the 15th day as inedible (figs. 1 to 3).
E.!! Readings: The pH of homogenates of the fresh shrimp was 7.24, and it increased to 7.80 on the 5th day. By the 8th day, the pH had risen to 8.20, and readings remained between 8.00 and 8.20 during the periods of fair and borderline quality. When spoilage occurred, the pH exceeded 8.20 (fig. 1).
pH reading. _ • Froten. ~ ~a"'l.ptlc rotlnoa - _ ... _-_ 1>---0
'" Ar :,rg'Y qU~rlh'ot'Il1l"
.0-4 .. ·Good a.O- ... · FaI' ~g: t: : f:ar~/!n. 0 __ ---..0----- 1.0
' "1
",1.0 <II ZU
~ 1. 0:
",,,,,,,;,;,"_/_'0--0-"'--
>-5.0 ~ .,
Z ... %U .. _---_-:14.0
fI)
u ............ i
~-:.---::!!:..-----------..---------------... -----......... -7lJ
U~~~~4~~.~~r-~,~~r-~r-~r-~~ TIME IN STOfiAGE (DAYS)
D.O
F;9. 1 - pH readings and sen s 0 ry quality of s h rim p during storage.
~o
~Ia ~IE ~14 .,; 012 !:! ",,10 ... ""a .,; !s
TMA-Ncont.nt ~ ~ ~ ~~gft~:'rit~~a~~'nr~~'ng,-, ---- 0----0
5.0 ' H19h 4.0-4.9 • Good 3 .0- 3.9 ' fol' 2.0- 2.9 • 8o<d .. 11.0 1.0- 1.9 · I.odlblo
2 4 6 a ~ ~ ~ TIME IN STORAGE (DAYS)'
16 la
<II z
2.0i= c c >-
3.0:!i
4.0
• z ... .,
Fig. 2 - Trimethylamine nitrogen and sensory qualityof shrirop during storag e •
Trimethylamine Nitrogen Content: The trimethylamine nitrogen content remained about 1 milligram per 100 grams of shrimp until the 8th day. It then started to increase, and rose rapidly from th e 12th to the 16th day, after which it leveled off (fig. 2). yTh pIcrIC aCId turbidity test was conducted simultaneously and independently by Kurtzman and Snyder (1960).

March 1962 COMMERCIAL FISHERIES REVIEW
Picric Acid Turbidity Test: samples are presented in figure
_n Icod Do ... of turbidity • __ Ort0nolOPtiC ,otlnoo .• ---_ 0--
2SO rbory ~I~ rotlngo'
.22!! z ~200 II! 17
~I!!O :! ~ 12:1 :. ii\100
~ 15 .. ;;1 !!O
4.0 - 4.9 . Good 3.0- 3.9 . Fol,
t8: ~.t : t::.;:~
The re~ults of the picric acid turbidity test from 50-gr m 3. All filtrates from the picric acid turbidity t st.. r
clear (readings of 30 or less) for til first 6 days of the experiment. On the 7th and 8th days, the filtrates were slightly turbtd
1.0
3.0 >-!i
.O~
(readings between 30 and 100), although clear filtrates were obtained on the 9th and 10th days , probably due to chanc s 1 ction of better quality shrimp. On the 11 th day, the filtrates b ecame very turbid (readings over 100) , a day before the taste panel rat d the shrimp as borderline quality. The filtrates remained very turbid throughout th' remainder of the experiment.
Color and Viscosity of Homogenates:
Fig. 3 -' Picric ac id ' turbidity and sensory qual ity of shrimp during storag e .
The homogenates of the fresh shrimp w r pinkish-white and of low viscosity. By th 6th day, they had changed to light brown and had become more viscous. Depth of color
and viscosity continued to increase until on the 13th day they were a brown semisolid mass, and by the 19th day, were a brown, thick, lumpy gel.
FROZEN SHRIMP: During the entire experiment, the t aste panel rated the frozen control shrimp as high or good quality, the pH of the homogenates remained within the range of 7.20 and 7.38, the trimethylamine nitrogen content averaged about 1 milligram per 100 grams of shrimp, filtrates of the picric acid turbidity test remained clear (figs. 1 to 3), and the homogenates did not change in color or viscosity.
CONCL USIONS
The pH of homogenized, peeled, and deveined brown shrimp appeared to be useful as an indication of quality. Since changes in pH were gradual, definite pH ranges could be determined to correspond to quality variations as determined by a taste panel, especially during the first 8 days of iced storage.
Increases in trimethylamine nitrogen content of the shrimp did not become measurable until the pH and sensory values indicated a change from good to fair quality, and thus were of little value for the determination of changes in prime quality.
The picric acid turbidity test indicated chemical changes in the shrimp several days before the taste panel detected an appreciable quality difference.
The occurrence of high turbidity readings for the picric acid turbidity test filtrates coincided with the beginning of measurable increases of trimethylamine nitrogen content of th shrimp. It is therefore possible that trimethylamine nitrogen is a contributing factor to th formation of turbidity. The changes in pH progressed gradually with loss of quality of the shrimp, with no acceleration in the rate of change at the time the picric acid turbiditi~s changed most rapidly. Because of the relatively high acidity of picric acid added to th slurry in the picric acid turbidity test, the contribution of pH of the shrimp to that of the filtrates is apparently negligible. It is quite possible, however, that the changes in pH occurring in the shrimp are essential to the formation of the substance(s) causing th turbidity.
The changes in pH and trimethylamine nitrogen content for peeled and deveined brown shrimp were of about the same magnitude as those reported in the literature for homogenates of shrimp in the shell. However, the leveling off of the trimethylamine llltrogen content after the 16th day may have been due to the removal of the shells and sand veins, andl r the removal of some of the decomposition products with the changing of the lce every oth r day.
10 COMMERCIAL FISHERIES REVIEW Vol. 24, No.3
Changes in color and viscosity of the shrimp homogenates were useful accessory tests of quality.
LITERATURE CITED
BAILEY, M. E. j FIEGER, E. A. j and NOVAK, A. F. HOOGLAND, P. L. 1956. Objective Tests Applicable to Quality Studies of Ice
Stored Shrimp. Food Research, vol. 21, pp. 611-620.
1956. A Convenient Arrangement for the Detennination of Trimethylamine in Fillets. Fisheries Research Board of Canada, Technological Station, Halifax, Nova Scotia, Circular No.3.
DYER, W. J. 1945. Amines in Fish Muscles. I - Colorimetric Detennina
tioDS of Trimethylamine as a Picrate Salt. lournal Fisheries Research Board of Canada, vol. 6, pp. 351-358.
KURTZMAN, C. H. and SNYDER, D. G. 1960. The Picric Acid Turbidity Test--A Possible Practical
Freshness Test for Iced Shrunp. Food Technology, vol. 3, p." 337.
FIEGER, E. A. and FRILOUX, J. J. 1954. A Comparison of Objective Tests for Quality of Gulf
Shrimp. Food Technology, vol. 8, pp. 35-38.
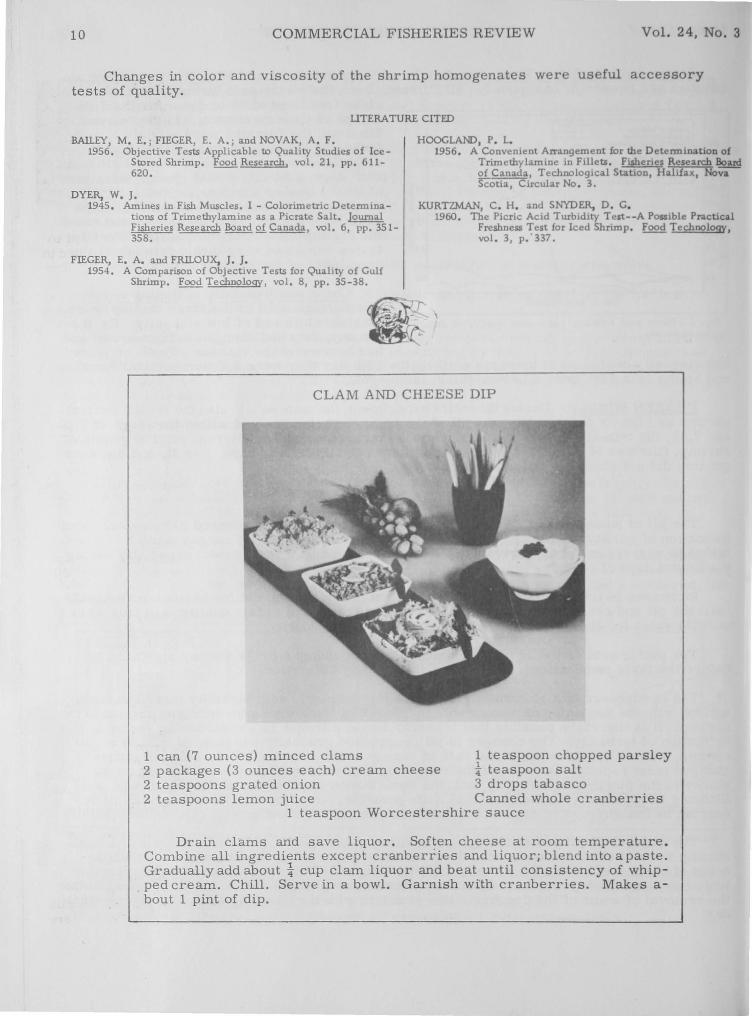
CLAM AND CHEESE DIP
1 can (7 ounces) minced clams 1 teaspoon chopped parsley 2 packages (3 ounces each) cream cheese t teaspoon salt 2 teaspoons grated onion 3 drops tabasco 2 teaspoons lemon juice Canned whole cranberries
1 teaspoon Worcestershire sauce
Drain clams and save liquor. Soften cheese at room temperature. Combine all ingredients except cranberries and liquor; blend into apaste. Gradually add about t cup clam liquor and beat until consistency of whipped cream. Chill. Serve in a bowl. Garnish wfth cranberries. Makes about 1 pint of dip.