arvinmeritor 2007ShareownersPresentation
32
1 Shareowners Meeting Chip McClure Chairman, CEO and President January 26, 2007
-
Upload
finance27 -
Category
Economy & Finance
-
view
131 -
download
0
Transcript of arvinmeritor 2007ShareownersPresentation

1
Shareowners Meeting
Chip McClureChairman, CEO and President
January 26, 2007
2
This presentation contains statements relating to future results of the company (including certain projections and business trends) that are “forward-looking statements” as defined in the Private Securities Litigation Reform Act of 1995. Forward-looking statements are typically identified by words or phrases such as “believe,” “expect,” “anticipate,” “estimate,”“should,” “are likely to be,” “will” and similar expressions. Actual results may differ materially from those projected as a result of certain risks and uncertainties, including but not limited to global economic and market cycles and conditions; the demand for commercial, specialty and light vehicles for which the company supplies products; risks inherent in operating abroad (including foreign currency exchange rates and potential disruption of production and supply due to terrorist attacks or acts of aggression); availability and cost of raw materials, including steel; OEM program delays; demand for and market acceptance of new and existing products; successful development of new products; reliance on major OEM customers; labor relations of the company, its suppliers and customers, including potential disruptions in supply of parts to our facilities or demand for our products due to work stoppages; the financial condition of the company’s suppliers and customers, including potential bankruptcies; possible adverse effects of any future suspension of normal trade credit terms by our suppliers; potential difficulties competing with companies that have avoided their existing contracts in bankruptcy and reorganization proceedings; successful integration of acquired or merged businesses; the ability to achieve the expected annual savings and synergies from past and future business combinations and the ability to achieve the expected benefits of restructuring actions; success and timing of potential divestitures; potential impairment of long-lived assets, including goodwill; competitive product and pricing pressures; the amount of the company’s debt; the ability of the company to continue to comply with covenants in its financing agreements; the ability of the company to access capital markets; credit ratings of the company’s debt; the outcome of existing and any future legal proceedings, including any litigation with respect to environmental or asbestos-related matters; rising costs of pension and other post-retirement benefits and possible changes in pension and other accounting rules; as well as other risks and uncertainties, including but not limited to those detailed herein and from time to time in other filings of the company with the SEC. These forward-looking statements are made only as of the date hereof, and the company undertakes no obligation to update or revise the forward-looking statements, whether as a result of new information, future events or otherwise, except as otherwise required by law.
Forward-Looking Statements
3
Agenda
• 2006 Highlights
• Industry Challenges and Opportunities
• Vision for Growth and Profitability
4
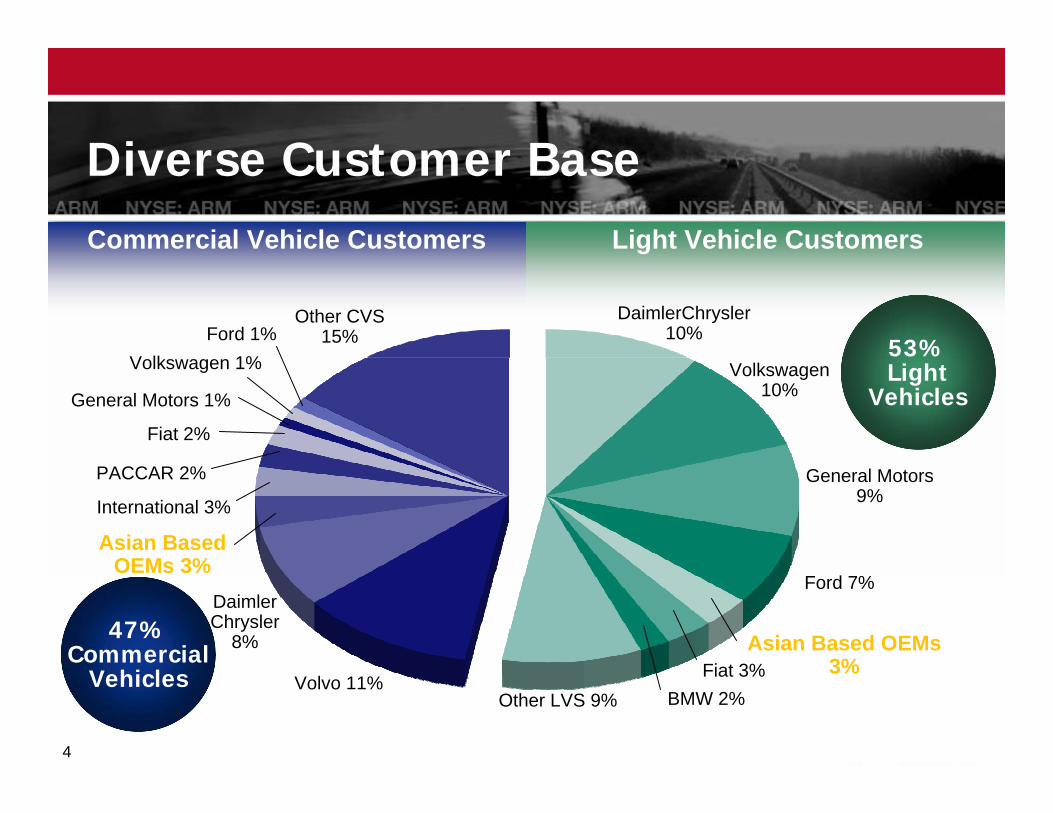
Diverse Customer BaseCommercial Vehicle Customers Light Vehicle Customers
DaimlerChrysler10%
General Motors9%
Volkswagen10%
Ford 7%
Asian Based OEMs 3%
BMW 2%Fiat 3%
Other LVS 9%
Other CVS15%
Fiat 2%
Asian Based OEMs 3%
Ford 1%Volkswagen 1%
General Motors 1%
PACCAR 2%
International 3%
Volvo 11%
Daimler Chrysler
8%47%Commercial
Vehicles
53%Light
Vehicles
5
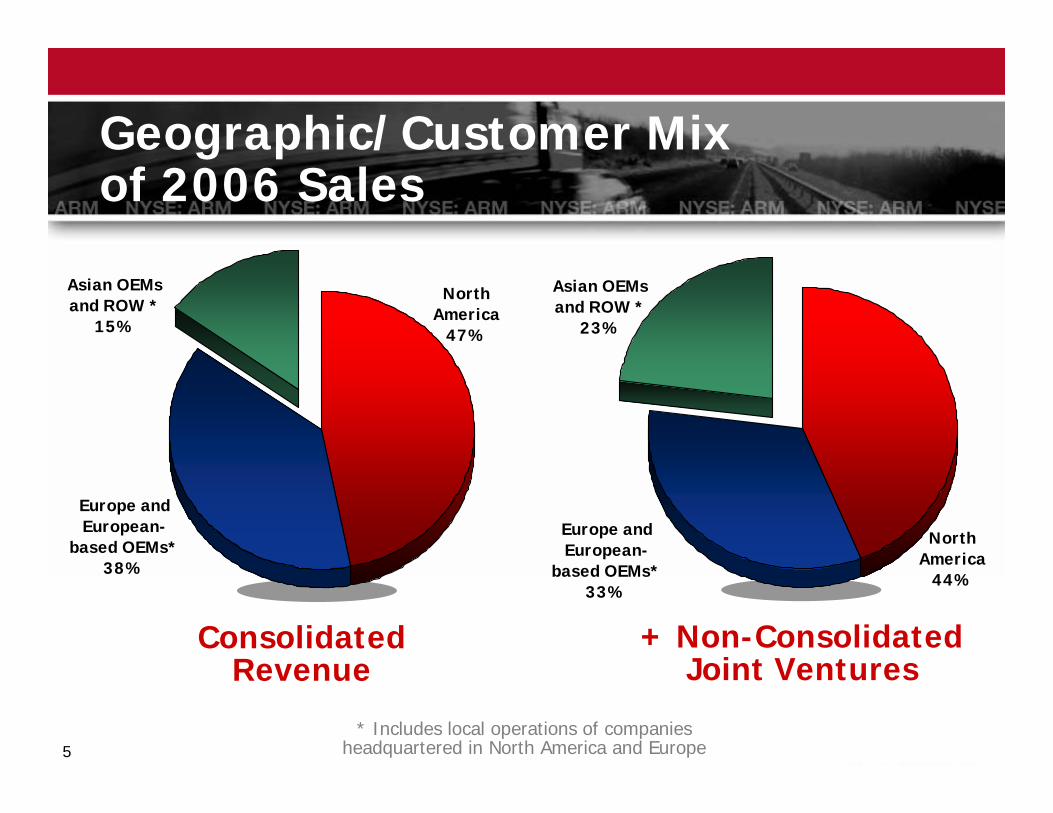
Consolidated Revenue
* Includes local operations of companiesheadquartered in North America and Europe
+ Non-ConsolidatedJoint Ventures
Asian OEMs and ROW *
23%
North America
44%
Europe and European-
based OEMs*33%
Geographic/Customer Mixof 2006 Sales
Asian OEMs and ROW *
15%
North America
47%
Europe and European-
based OEMs*38%
6
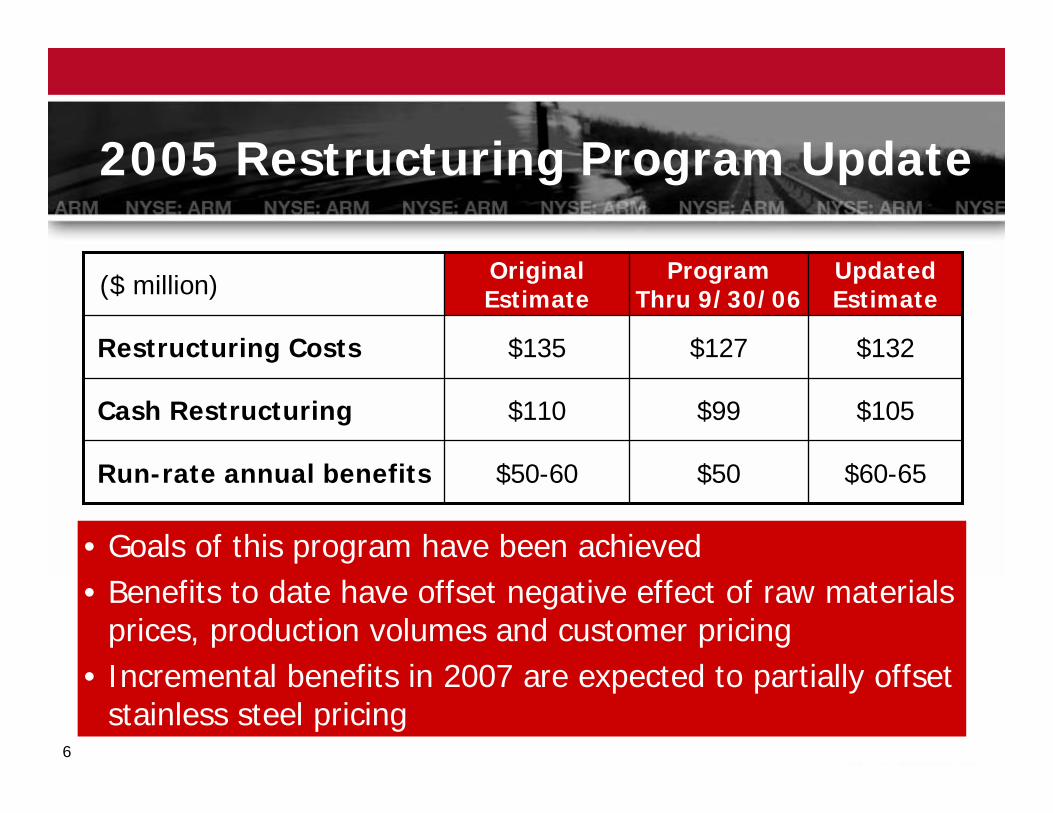
• Goals of this program have been achieved• Benefits to date have offset negative effect of raw materials
prices, production volumes and customer pricing• Incremental benefits in 2007 are expected to partially offset
stainless steel pricing
$60-65$50$50-60Run-rate annual benefits
$105$99$110Cash Restructuring
$132$127$135Restructuring Costs
UpdatedEstimate
ProgramThru 9/30/06
Original Estimate($ million)
2005 Restructuring Program Update
7
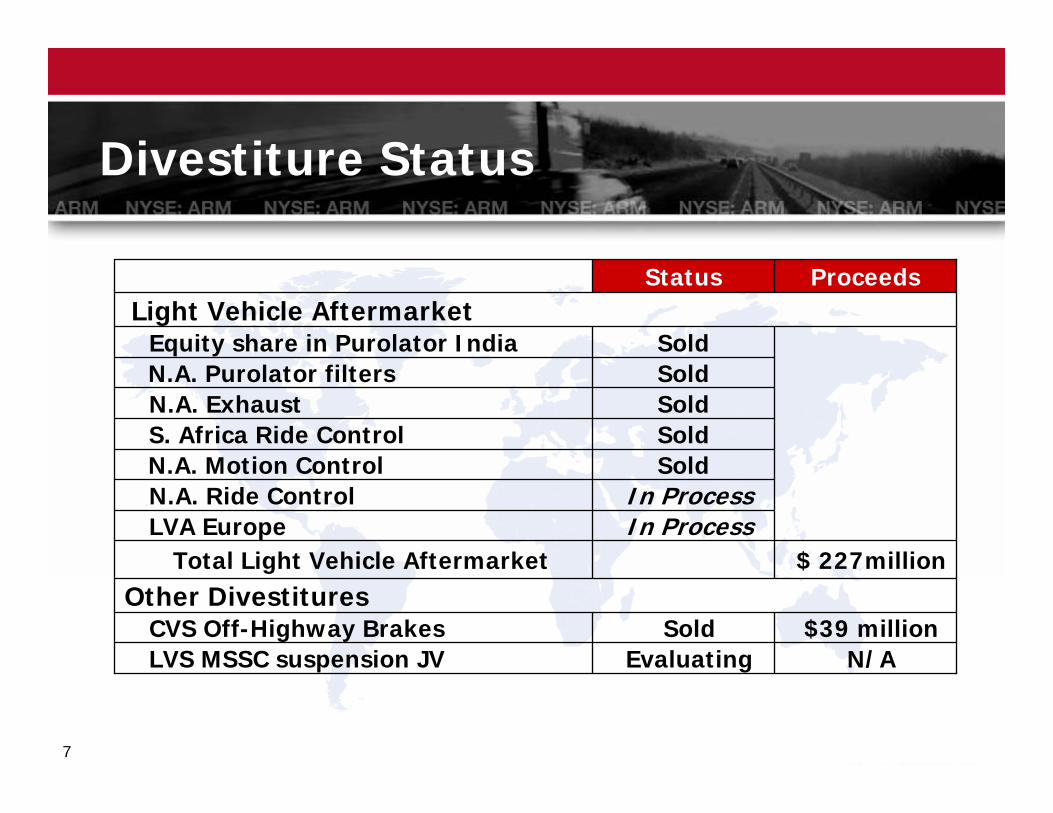
$39 millionSoldCVS Off-Highway Brakes
$ 227millionTotal Light Vehicle AftermarketOther Divestitures
Light Vehicle Aftermarket
N/AEvaluatingLVS MSSC suspension JV
SoldEquity share in Purolator India
In ProcessN.A. Ride Control
SoldS. Africa Ride Control
SoldN.A. Purolator filtersSoldN.A. Exhaust
In ProcessLVA Europe
SoldN.A. Motion Control
ProceedsStatus
Divestiture Status
8
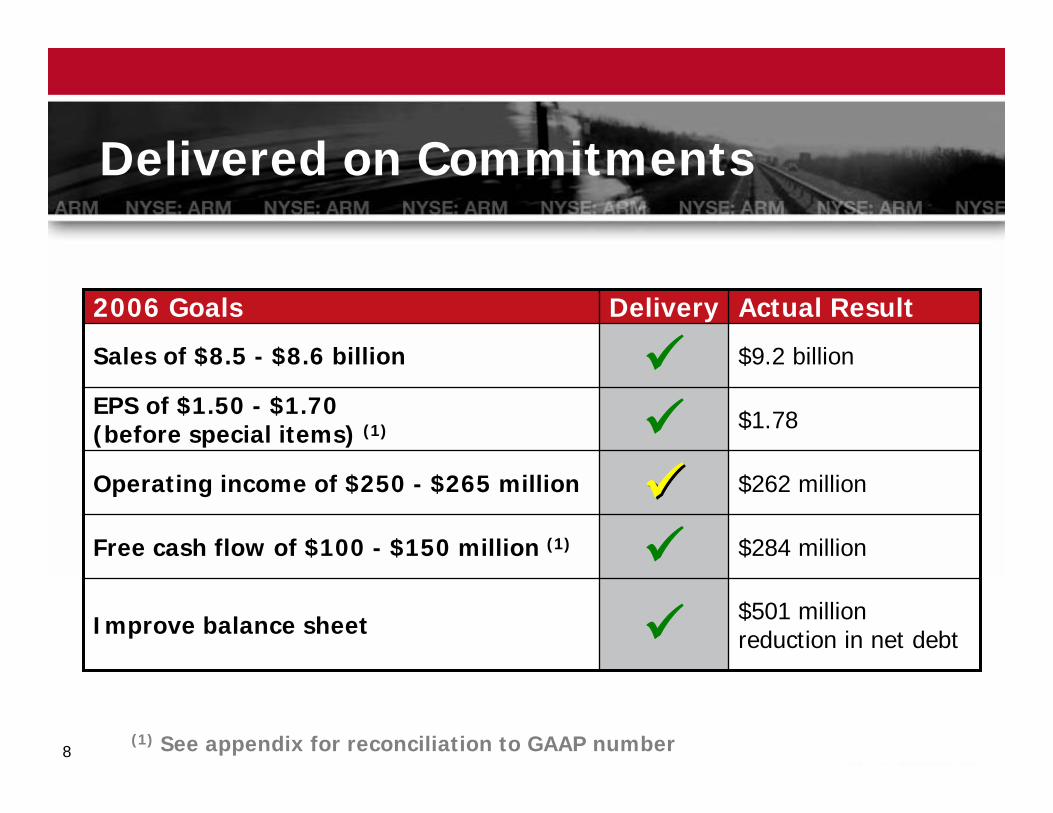
Delivered on Commitments
$262 millionOperating income of $250 - $265 million
$284 millionFree cash flow of $100 - $150 million (1)
$501 million reduction in net debtImprove balance sheet
Delivery
$1.78
$9.2 billion
EPS of $1.50 - $1.70(before special items) (1)
Sales of $8.5 - $8.6 billion
Actual Result2006 Goals
(1) See appendix for reconciliation to GAAP number
9
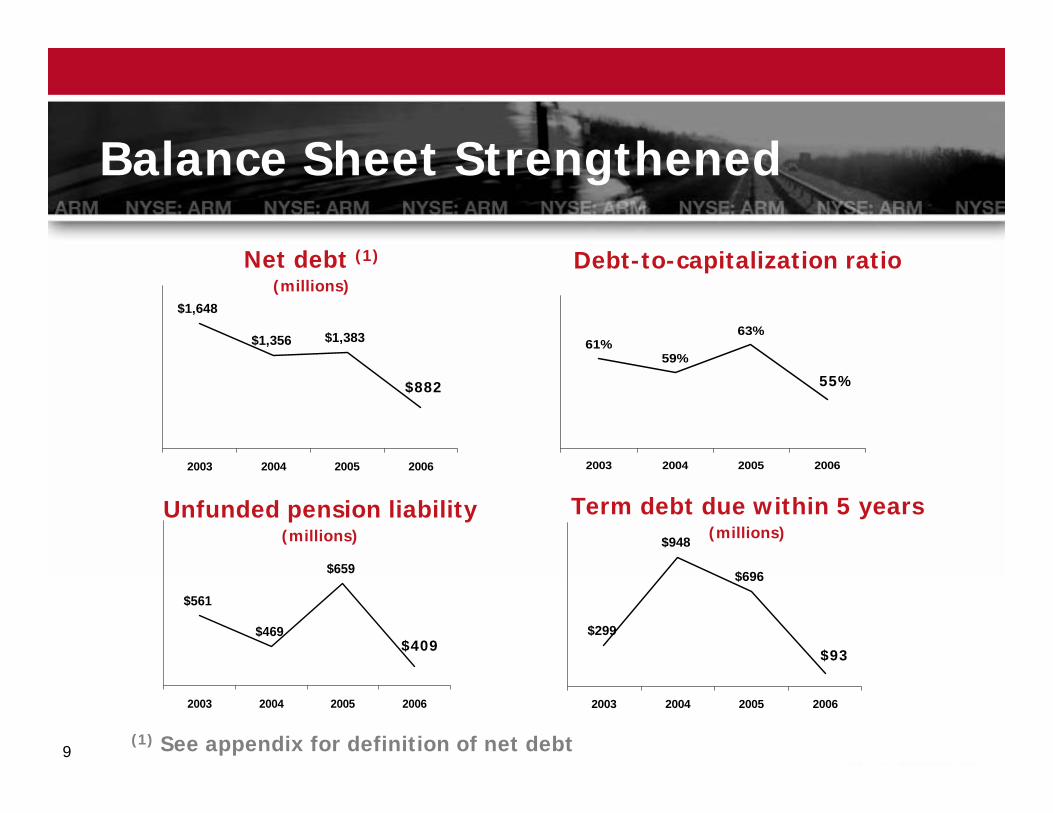
61%59%
63%
2003 2004 2005 2006
$561
$469
$659
2003 2004 2005 2006
$299
$948
$696
2003 2004 2005 2006
$1,648
$1,356 $1,383
2003 2004 2005 2006
Debt-to-capitalization ratio
Unfunded pension liability(millions)
Term debt due within 5 years(millions)
Net debt (1)
(millions)
$882 55%
$93$409
Balance Sheet Strengthened
(1) See appendix for definition of net debt
10
Challenges
• North America 2007 Class 8 truck downturn
• Light vehicle production cuts in North America
• Pricing pressures
• Increased material costs

11
Opportunities
• Booming growth in Asia
• Some competitors weakened
• Systems-based solutions
• Strong balance sheet and liquidity – a must during these turbulent times

12
Vision for Growth and Profitability
• Be a global systems leader in our target markets
• Develop scalable product technologies and capabilities, focusing on electronics and controls
• Accelerate growth in Asia and with Asian OEMs
• Accelerate growth in Commercial Vehicle Aftermarket
• Achieve top quartile financial performance among peer companies
Safety
Environment
Mobility
13
Medium-Term Goals
Growth with a Purpose
• 1/3 – 1/3 – 1/3 regional business mix
• Triple sales in Asia
• Triple the size of Aftermarket business
• Grow organically where margins are good
• Achieve ROIC of 13 – 15 percent
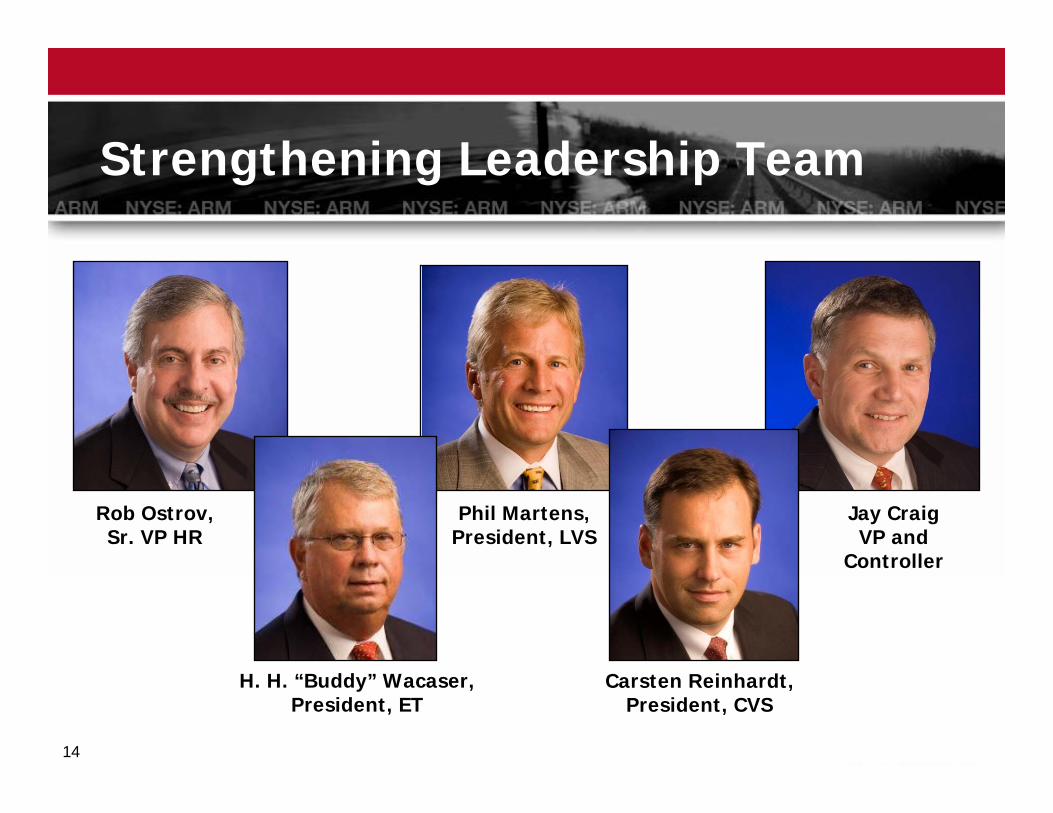
14
Phil Martens,President, LVS
H. H. “Buddy” Wacaser,President, ET
Rob Ostrov,Sr. VP HR
Jay CraigVP and
Controller
Carsten Reinhardt,President, CVS
Strengthening Leadership Team
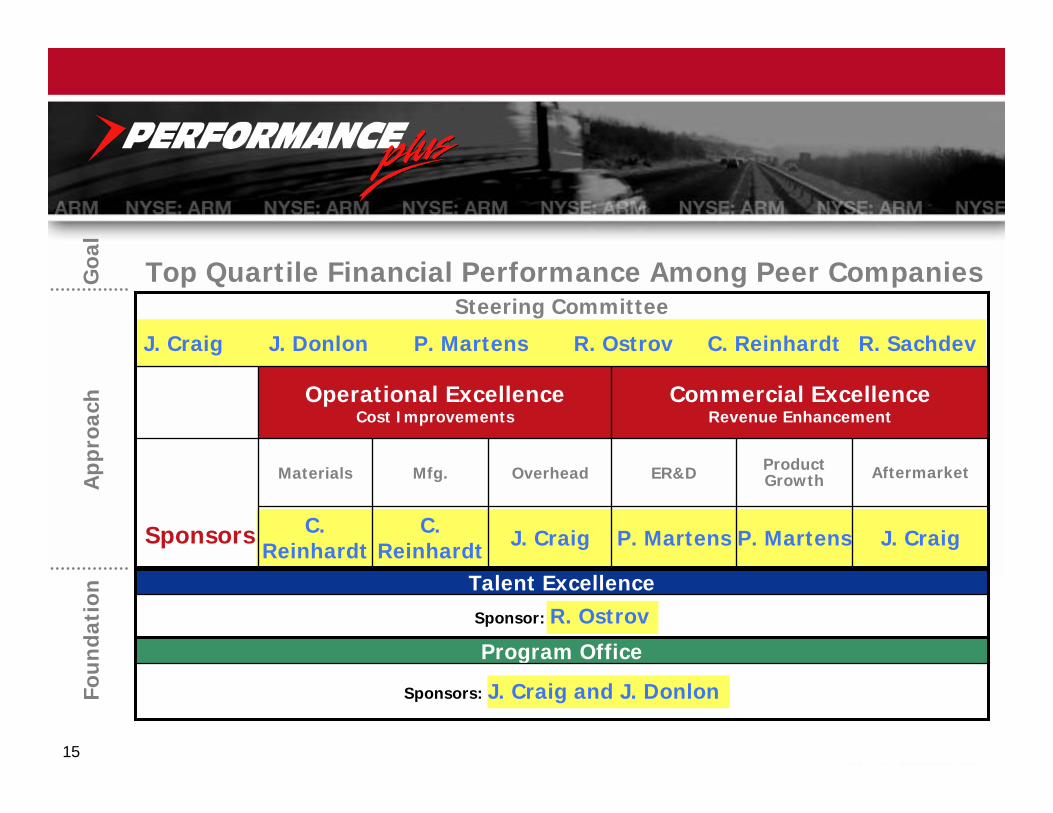
15
J. CraigP. MartensP. MartensJ. CraigC.Reinhardt
C. Reinhardt
AftermarketProduct GrowthOverheadMfg. ER&DMaterials
Commercial ExcellenceRevenue Enhancement
Operational ExcellenceCost Improvements
Steering Committee
J. Craig J. Donlon R. Ostrov C. ReinhardtP. Martens
Sponsor: R. OstrovTalent Excellence
App
roac
hFo
un
dati
on
Sponsors: J. Craig and J. Donlon
Program Office
R. Sachdev
Sponsors
Goa
l
Top Quartile Financial Performance Among Peer Companies
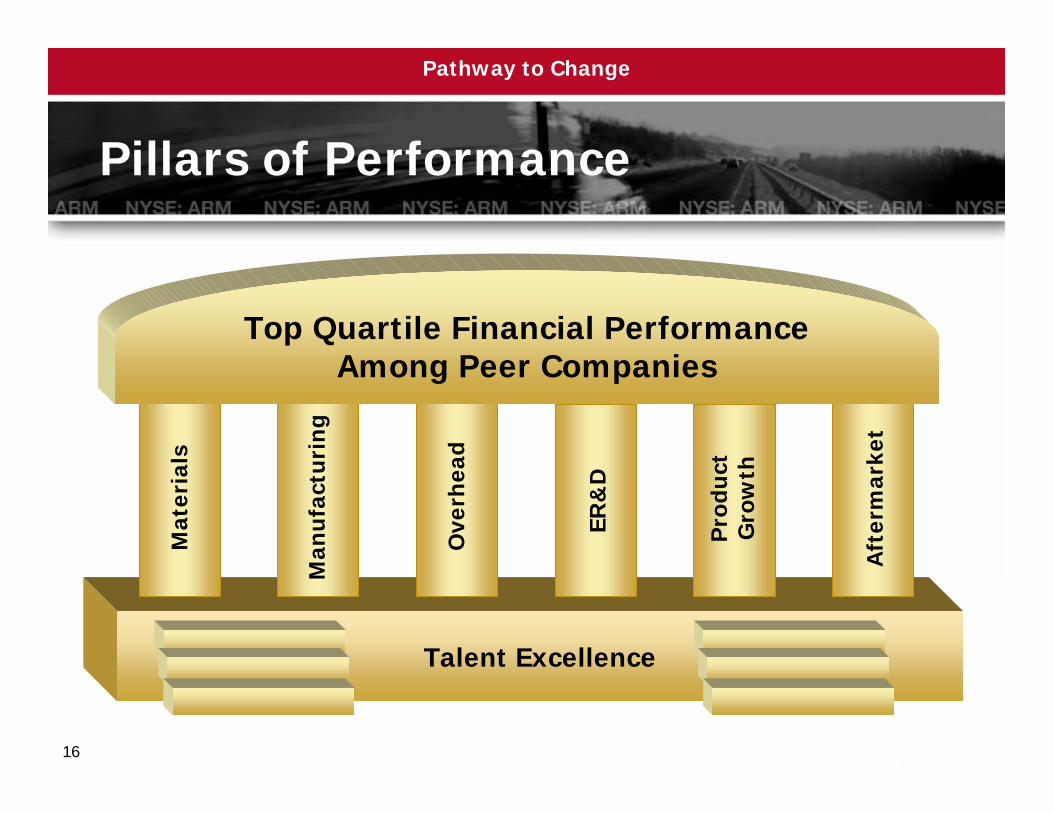
16
Talent Excellence
Pillars of PerformanceM
ater
ials
Man
ufa
ctu
rin
g
Ove
rhea
d
ER&
D
Pro
duct
Gro
wth
Aft
erm
arke
t
Top Quartile Financial PerformanceAmong Peer Companies
Pathway to Change

17
Actions Already Underway
• Expansion of shared services (improved cost and productivity)
• Reengineering projects for material savings
• Rationalization of engineering footprint
• Broadening of remanufacturing
• ET restructuring (not included in Performance Plus targets)
• Category crossover
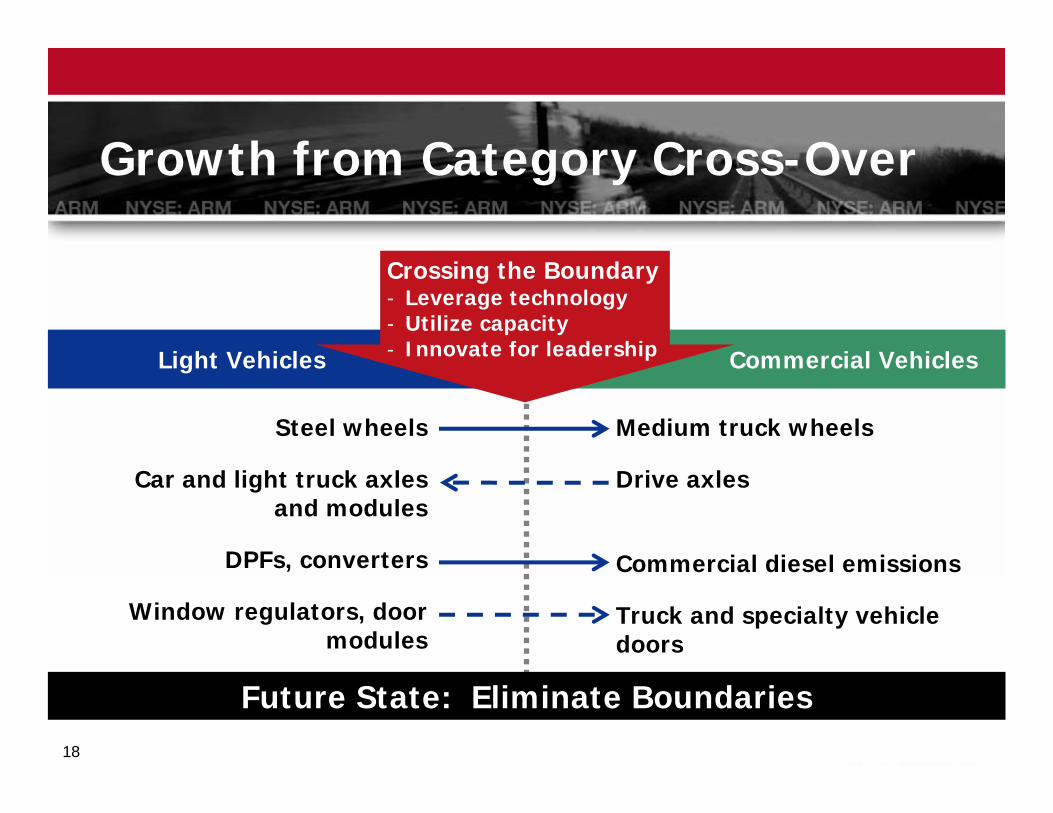
18
Light Vehicles Commercial Vehicles
Growth from Category Cross-Over
Crossing the Boundary- Leverage technology- Utilize capacity- Innovate for leadership
Future State: Eliminate Boundaries
Steel wheels
Car and light truck axles and modules
DPFs, converters
Window regulators, door modules
Medium truck wheels
Drive axles
Commercial diesel emissions
Truck and specialty vehicle doors
19
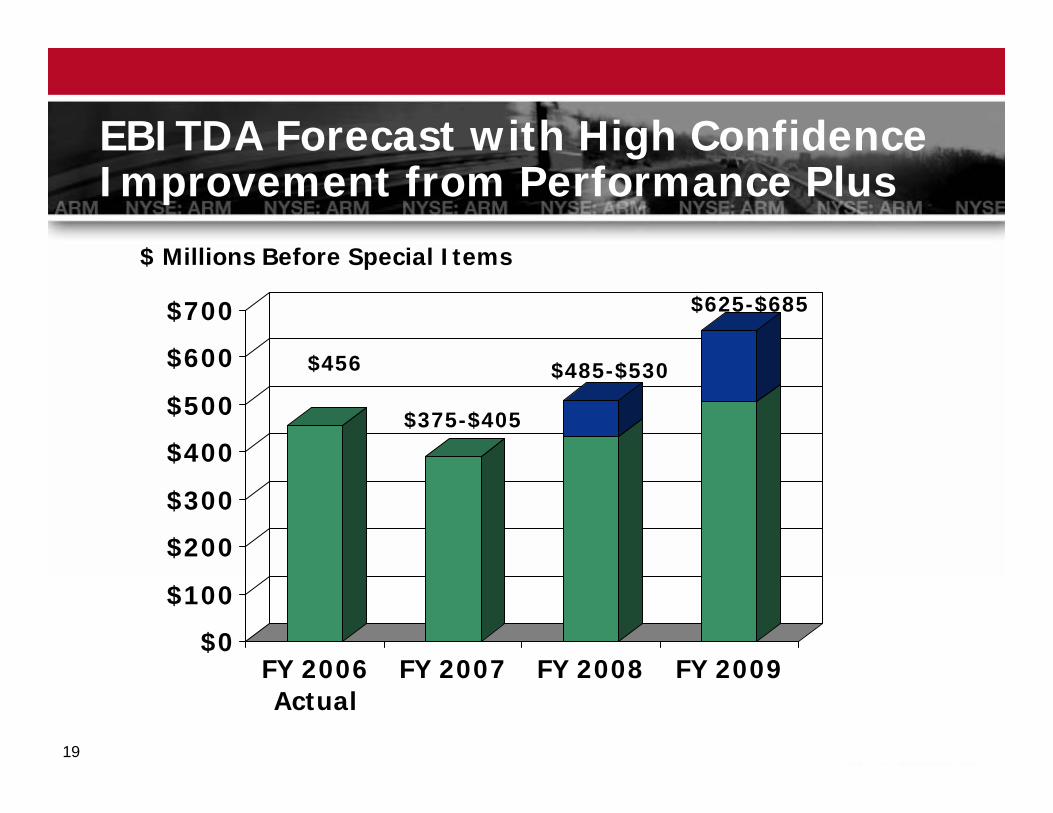
EBITDA Forecast with High Confidence Improvement from Performance Plus
$ Millions Before Special Items
$0
$100
$200
$300
$400
$500
$600
$700
FY 2006Actual
FY 2007 FY 2008 FY 2009
$456
$375-$405
$485-$530
$625-$685
20
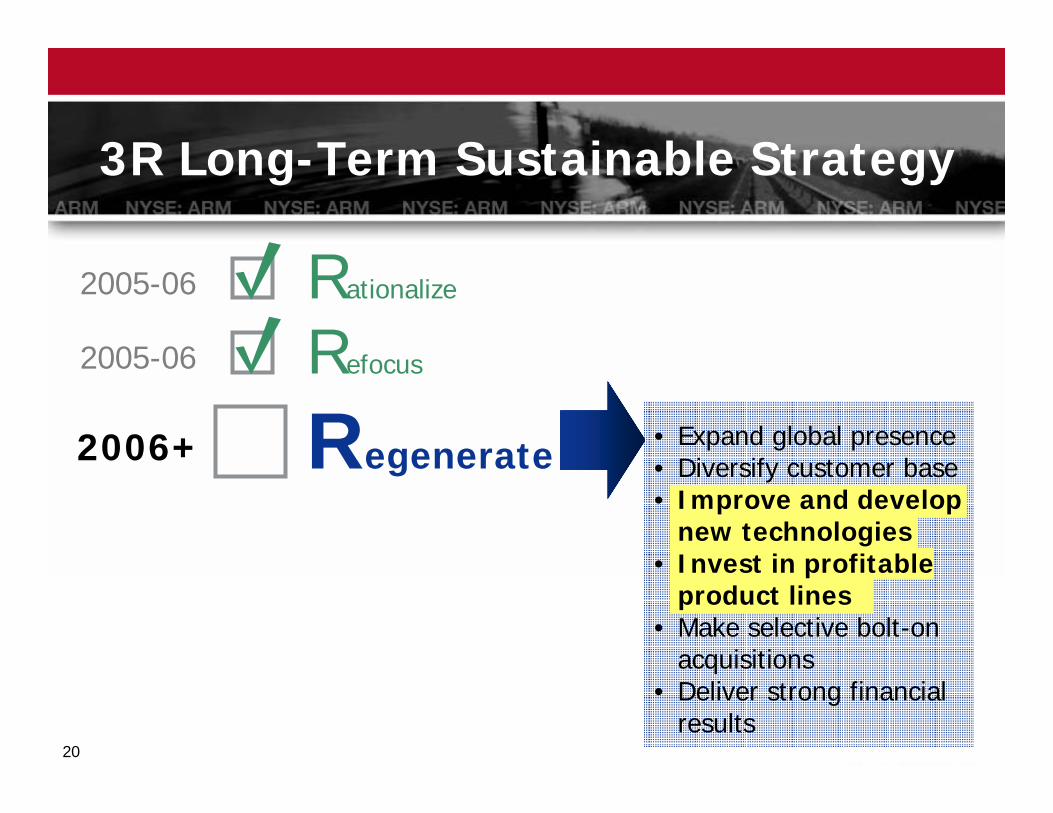
3R Long-Term Sustainable Strategy
Regenerate
Refocus
2005-06
2005-06
2006+
Rationalize
• Expand global presence• Diversify customer base• Improve and develop
new technologies• Invest in profitable
product lines• Make selective bolt-on
acquisitions• Deliver strong financial
results

21
Replace Current High Volume Mechanical Products With Electronic Margin Products
• All major OEM footprints addressed with 3 designs
• Step-change in cost and functionality
• Unprecedented customer interest
• Latch evolution continues…
• Extremely low release efforts (5%) compared to current technology
• Low noise• Engineered handle feel• Provides automatic
failsafe manual release
• Non-Contact switches
• Reduced size and improved water resistance
Low-Energy Release Latch
• Central lock• Superlock• Passive lock/unlock• Electric child safety
and power release• 25 million latches
produced annually
Production Mechanical
Patented Electro-Mechanical Competitive
Advantage Opportunity
22
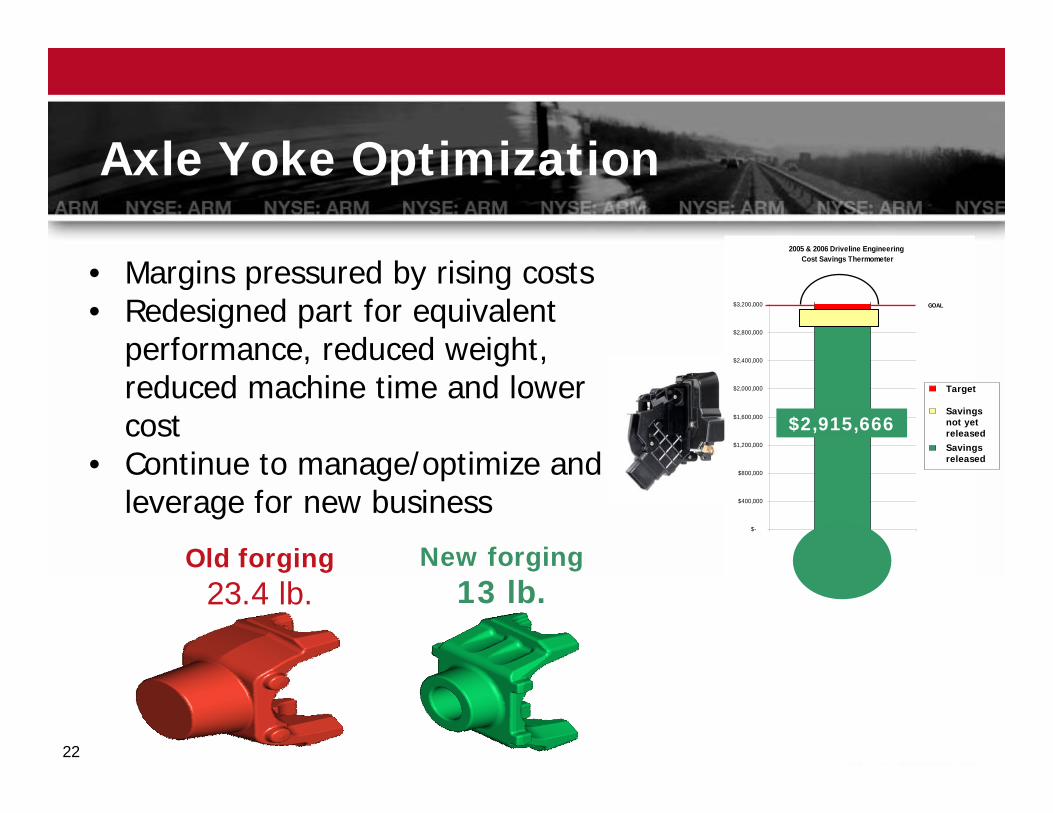
Axle Yoke Optimization
• Margins pressured by rising costs• Redesigned part for equivalent
performance, reduced weight, reduced machine time and lower cost
• Continue to manage/optimize and leverage for new business
2005 & 2006 Driveline Engineering Cost Savings Thermometer
$-
$400,000
$800,000
$1,200,000
$1,600,000
$2,000,000
$2,400,000
$2,800,000
$3,200,000
e
GOAL
Target
Savings not yetreleasedSavingsreleased
$2,915,666
Old forging23.4 lb.
New forging13 lb.
23
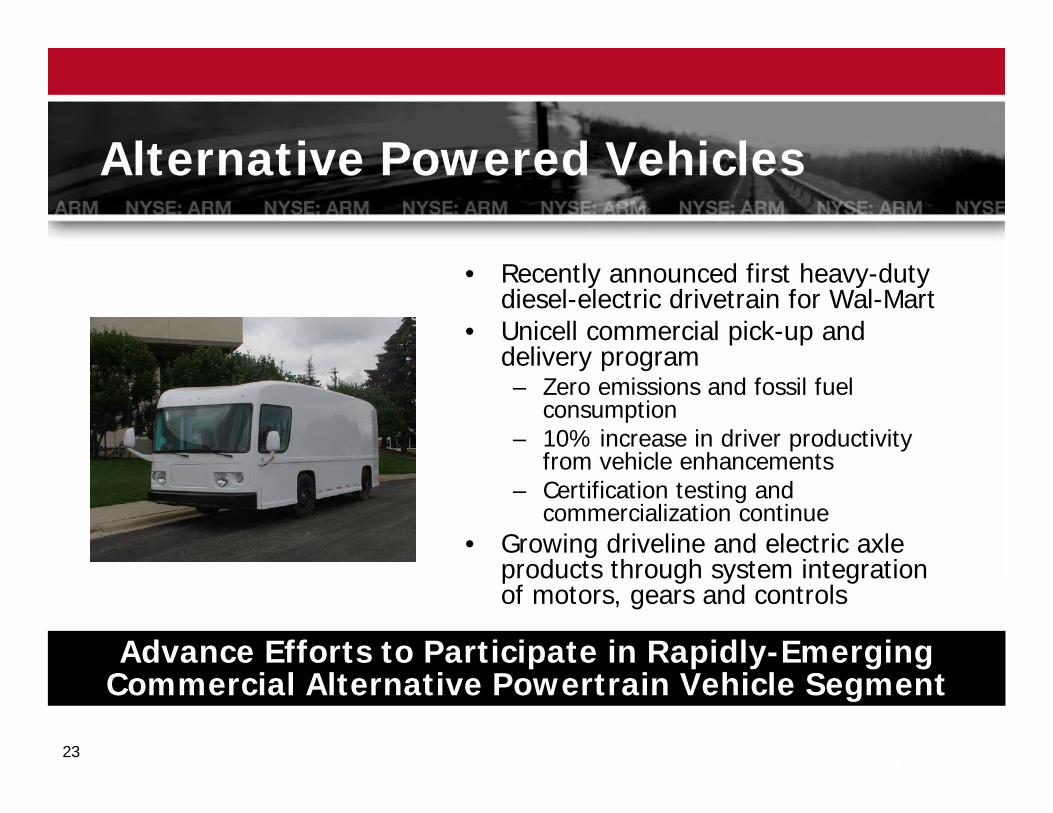
Alternative Powered Vehicles
• Recently announced first heavy-duty diesel-electric drivetrain for Wal-Mart
• Unicell commercial pick-up and delivery program– Zero emissions and fossil fuel
consumption – 10% increase in driver productivity
from vehicle enhancements– Certification testing and
commercialization continue• Growing driveline and electric axle
products through system integration of motors, gears and controls
Advance Efforts to Participate in Rapidly-Emerging Commercial Alternative Powertrain Vehicle Segment
24
Summary
• Strong portfolio of businesses
• Process to generate more high growth products
• Strong and unified leadership team
• Performance Plus will transform the company

25
Appendix
26
Use of Non-GAAP Financial Information
In addition to the results reported in accordance with accounting principles generally accepted in the United States (“GAAP”) included throughout this presentation, the company has provided information regarding income from continuing operations, diluted earnings per share and operating income and margins before special items, which are non-GAAP financial measures. These non-GAAP measures are defined as reported income or loss from continuing operations, reported diluted earnings or loss per share from continuing operations and operating income or loss plus or minus special items. Other non-GAAP financial measures include “EBITDA before special items” and “free cash flow”. EBITDA is defined as earnings before interest, income taxes, depreciation and amortization plus or minus special items. Free cash flow represents net cash provided by operating activities less capital expenditures.
Management believes that the non-GAAP financial measures used in this presentation are useful to both management and investors in their analysis of the Company’s financial position and results of operations. In particular, management believes EBITDA is a meaningful measure of performance as it is commonly utilized by management and investors to analyze operating performance and entity valuation. Management, the investment community and the banking institutions routinely use EBITDA, together with other measures, to measure operating performance in our industry. Management believes that free cash flow is useful in analyzing the Company’s ability to service and repay its debt. Further, management uses these non-GAAP measures for planning and forecasting in future periods.
These non-GAAP measures should not be considered a substitute for the reported results prepared in accordance with GAAP. EBITDA should not be considered as an alternative to net income as an indicator of our operating performance or to cash flows as a measure of liquidity. Free cash flow should not be considered a substitute for cash provided by operating activities or other cash flow statement data prepared in accordance with GAAP or as a measure of liquidity. In addition, the calculation of free cash flow does not reflect cash used to service debt and thus, does not reflect funds available for investment or other discretionary uses. These non-GAAP financial measures, as determined and presented by the company, may not be comparable to related or similarly titled measures reported by other companies.
Set forth on the following slides are reconciliations of these non-GAAP financial measures, if applicable, to the most directly comparable financial measures calculated and presented in accordance with GAAP.
27
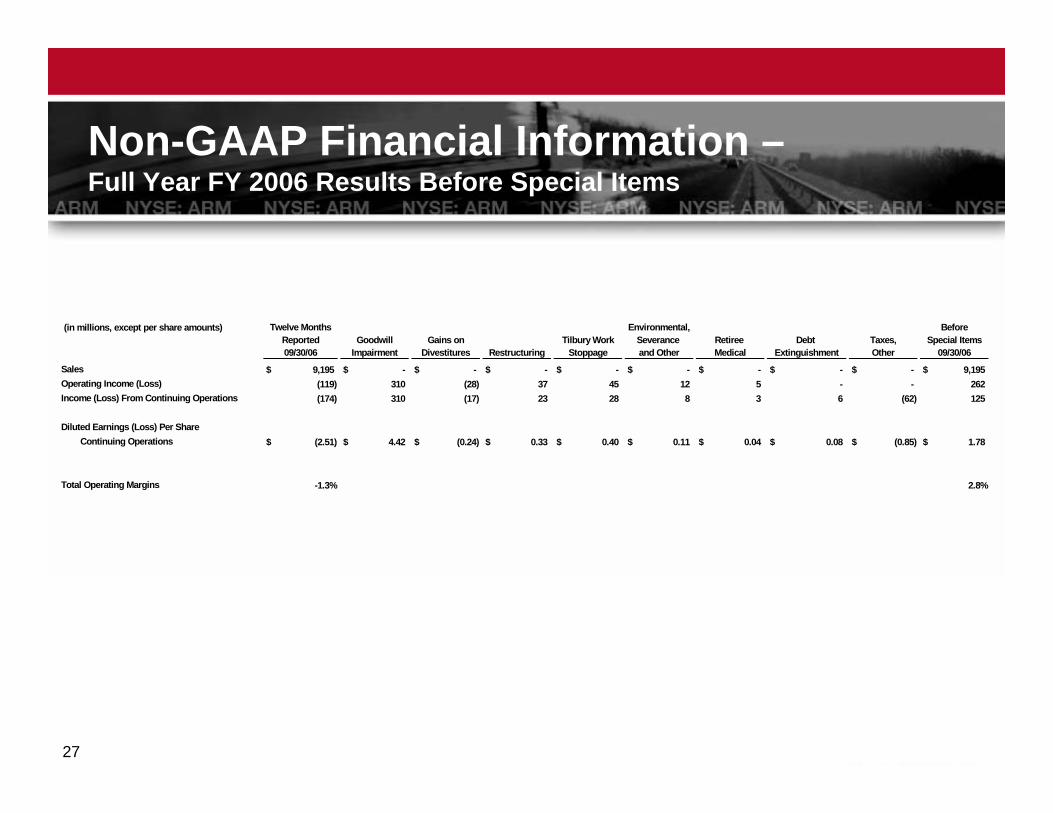
Non-GAAP Financial Information –Full Year FY 2006 Results Before Special Items
(in millions, except per share amounts) Twelve Months Environmental, BeforeReported Goodwill Gains on Tilbury Work Severance Retiree Debt Taxes, Special Items09/30/06 Impairment Divestitures Restructuring Stoppage and Other Medical Extinguishment Other 09/30/06
Sales 9,195$ -$ -$ -$ -$ -$ -$ -$ -$ 9,195$ Operating Income (Loss) (119) 310 (28) 37 45 12 5 - - 262 Income (Loss) From Continuing Operations (174) 310 (17) 23 28 8 3 6 (62) 125
Diluted Earnings (Loss) Per ShareContinuing Operations (2.51)$ 4.42$ (0.24)$ 0.33$ 0.40$ 0.11$ 0.04$ 0.08$ (0.85)$ 1.78$
Total Operating Margins -1.3% 2.8%
28
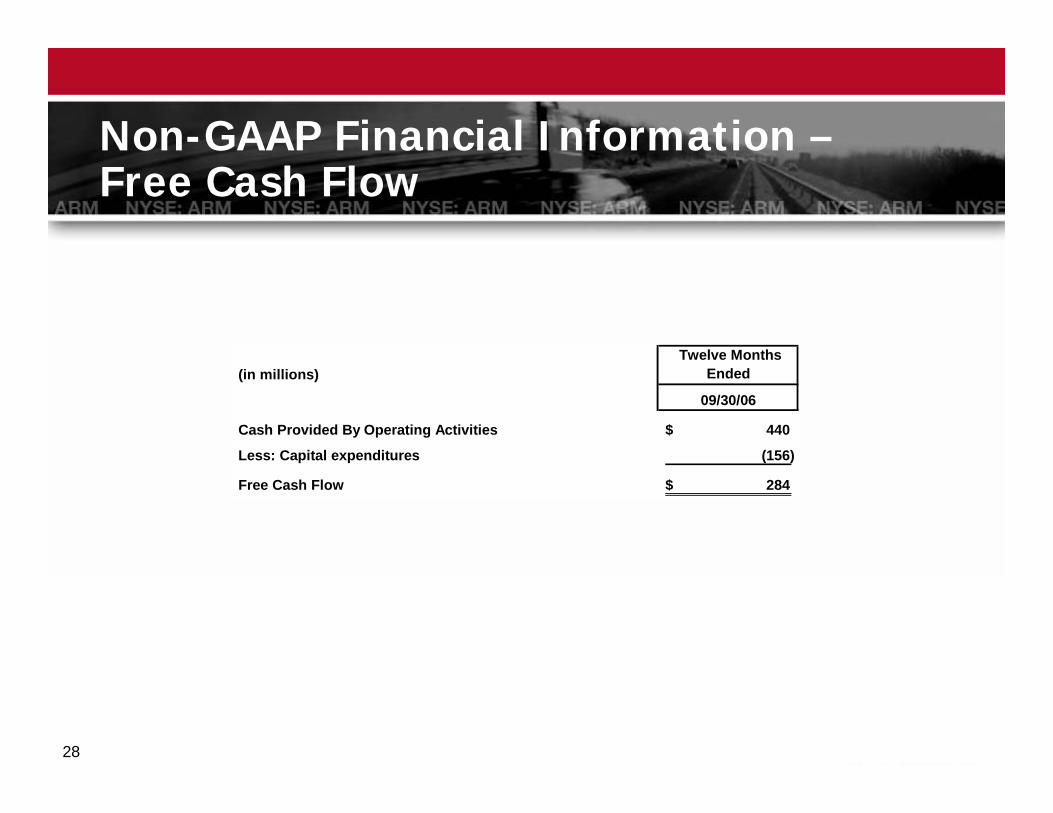
Non-GAAP Financial Information –Free Cash Flow
(in millions)Twelve Months
Ended
09/30/06
Cash Provided By Operating Activities 440$
Less: Capital expenditures (156)
Free Cash Flow 284$
29
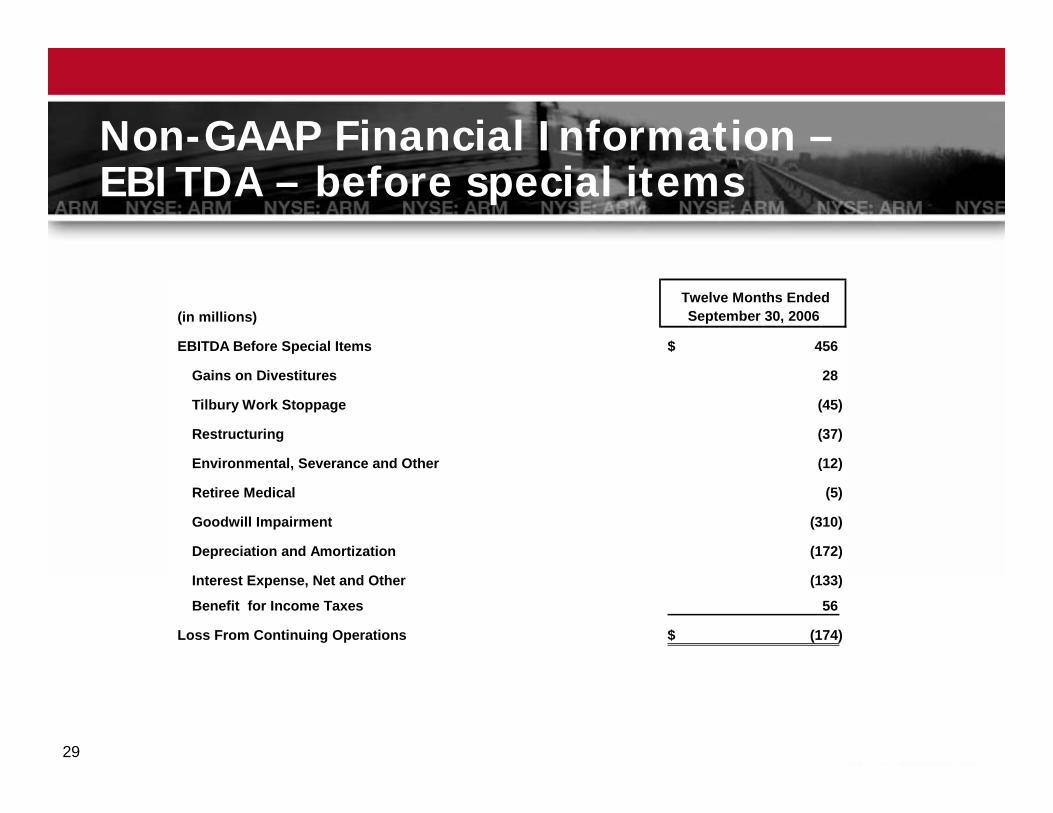
Non-GAAP Financial Information –EBITDA – before special items
(in millions) Twelve Months Ended
September 30, 2006
EBITDA Before Special Items 456$
Gains on Divestitures 28
Tilbury Work Stoppage (45)
Restructuring (37)
Environmental, Severance and Other (12)
Retiree Medical (5)
Goodwill Impairment (310)
Depreciation and Amortization (172)
Interest Expense, Net and Other (133)
Benefit for Income Taxes 56
Loss From Continuing Operations (174)$
30
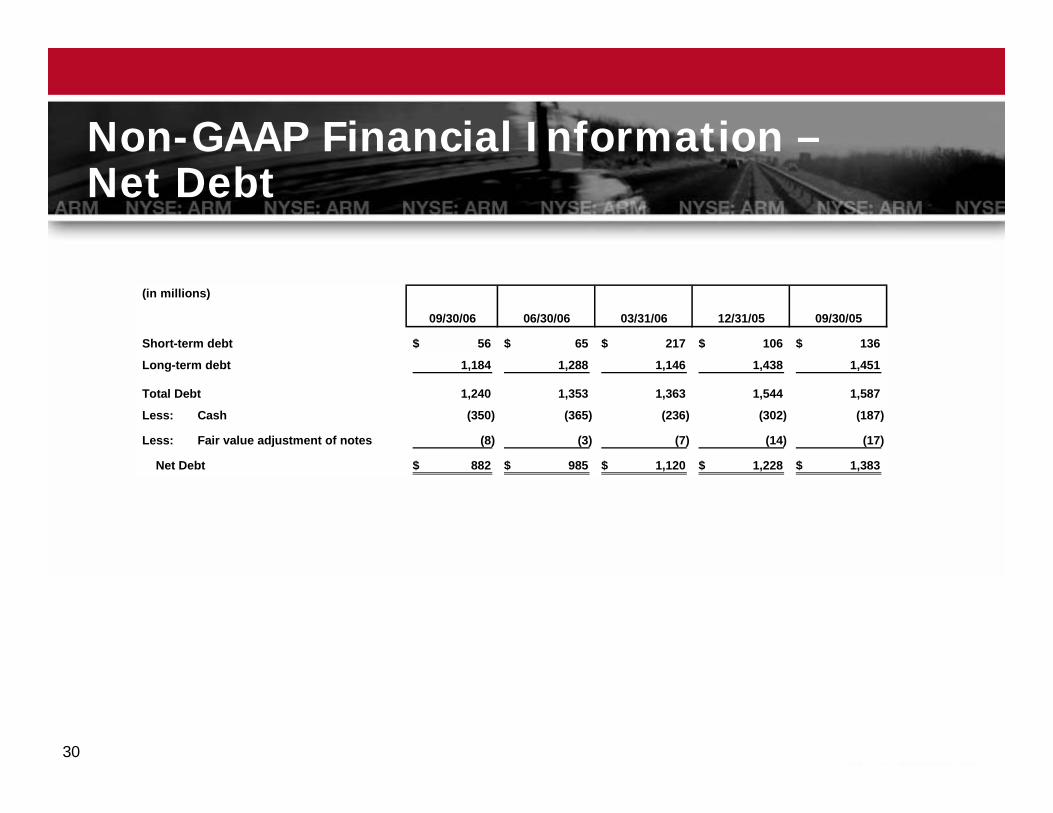
Non-GAAP Financial Information –Net Debt
(in millions)
09/30/06 06/30/06 03/31/06 12/31/05 09/30/05
Short-term debt 56$ 65$ 217$ 106$ 136$
Long-term debt 1,184 1,288 1,146 1,438 1,451
Total Debt 1,240 1,353 1,363 1,544 1,587
Less: Cash (350) (365) (236) (302) (187)
Less: Fair value adjustment of notes (8) (3) (7) (14) (17)
Net Debt 882$ 985$ 1,120$ 1,228$ 1,383$
31
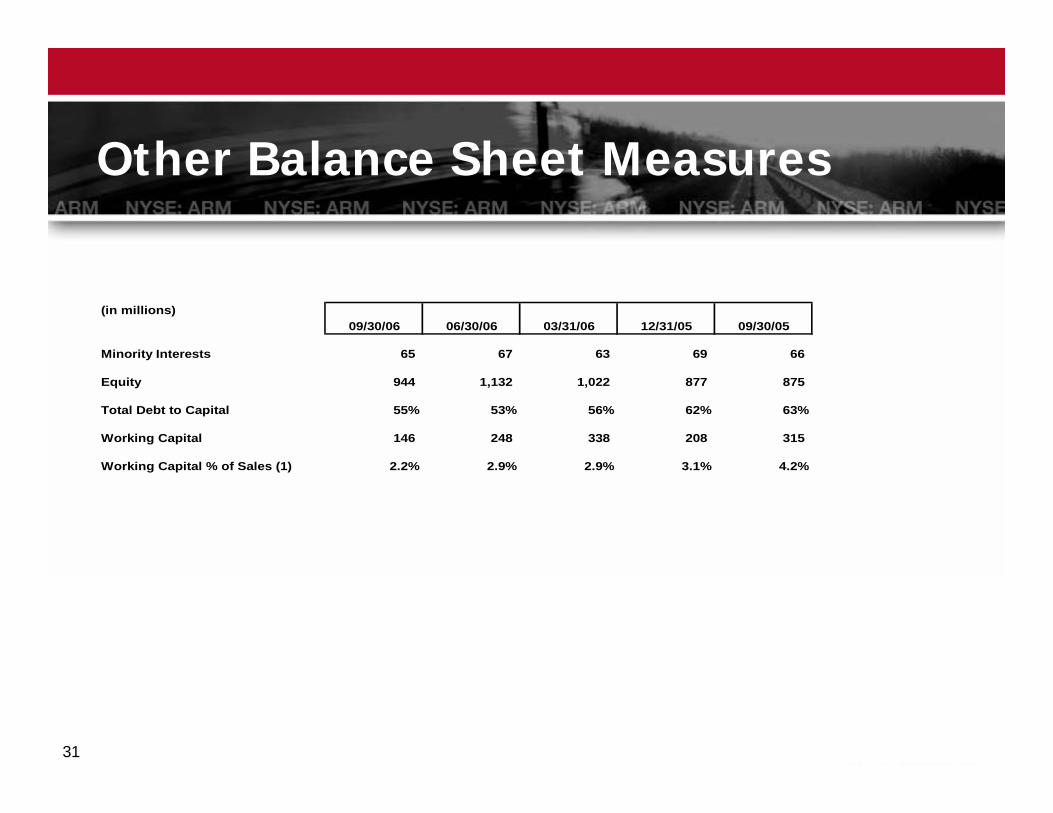
Other Balance Sheet Measures
(in millions)09/30/06 06/30/06 03/31/06 12/31/05 09/30/05
Minority Interests 65 67 63 69 66
Equity 944 1,132 1,022 877 875
Total Debt to Capital 55% 53% 56% 62% 63%
Working Capital 146 248 338 208 315
Working Capital % of Sales (1) 2.2% 2.9% 2.9% 3.1% 4.2%
32