Artigo cientifico
24
Phenotypic integration of skeletal traits during growth buffers genetic variants affecting the slenderness of femora in inbred mouse strains Karl J. Jepsen, Leni and Peter W. May Department of Orthopaedics, Mount Sinai School of Medicine, Box 1188, One Gustave L. Levy Place, New York, NY 10029, USA Bin Hu, Leni and Peter W. May Department of Orthopaedics, Mount Sinai School of Medicine, Box 1188, One Gustave L. Levy Place, New York, NY 10029, USA, e-mail: [email protected] Steven M. Tommasini, New York Center for Biomedical Engineering, CUNY Graduate School, Department of Biomedical Engineering, City College of New York, New York, NY 10031, USA e-mail: [email protected] Hayden-William Courtland, Leni and Peter W. May Department of Orthopaedics, Mount Sinai School of Medicine, Box 1188, One Gustave L. Levy Place, New York, NY 10029, USA, e-mail: hayden- [email protected] Christopher Price, Leni and Peter W. May Department of Orthopaedics, Mount Sinai School of Medicine, Box 1188, One Gustave L. Levy Place, New York, NY 10029, USA, e-mail: [email protected] Matthew Cordova, and Leni and Peter W. May Department of Orthopaedics, Mount Sinai School of Medicine, Box 1188, One Gustave L. Levy Place, New York, NY 10029, USA, e-mail: [email protected] Joseph H. Nadeau Department of Genetics, Case Western Reserve University School of Medicine, Cleveland, OH 44106, USA e-mail: [email protected] Abstract Compensatory interactions among adult skeletal traits are critical for establishing strength but complicate the search for fracture susceptibility genes by allowing many genetic variants to exist in a population without loss of function. A better understanding of how these interactions arise during growth will provide new insight into genotype-phenotype relationships and the biological controls that establish skeletal strength. We tested the hypothesis that genetic variants affecting growth in width relative to growth in length (slenderness) are coordinated with movement of the inner bone surface and matrix mineralization to match stiffness with weight-bearing loads during postnatal growth. Midshaft femoral morphology and tissue-mineral density were quantified at ages of 1 day and at 4, 8, and 16 weeks for a panel of 20 female AXB/BXA recombinant inbred mouse strains. Path Analyses revealed significant compensatory interactions among outer-surface expansion rate, inner-surface expansion rate, and tissue-mineral density during postnatal growth, indicating that e-mail: [email protected]. NIH Public Access Author Manuscript Mamm Genome. Author manuscript; available in PMC 2010 January 1. Published in final edited form as: Mamm Genome. 2009 January ; 20(1): 21–33. doi:10.1007/s00335-008-9158-1. NIH-PA Author Manuscript NIH-PA Author Manuscript NIH-PA Author Manuscript
-
Upload
medicalcenter -
Category
Documents
-
view
16 -
download
0
description
artigo cientifico
Transcript of Artigo cientifico

Phenotypic integration of skeletal traits during growth buffersgenetic variants affecting the slenderness of femora in inbredmouse strains
Karl J. Jepsen,Leni and Peter W. May Department of Orthopaedics, Mount Sinai School of Medicine, Box 1188,One Gustave L. Levy Place, New York, NY 10029, USA
Bin Hu,Leni and Peter W. May Department of Orthopaedics, Mount Sinai School of Medicine, Box 1188,One Gustave L. Levy Place, New York, NY 10029, USA, e-mail: [email protected]
Steven M. Tommasini,New York Center for Biomedical Engineering, CUNY Graduate School, Department of BiomedicalEngineering, City College of New York, New York, NY 10031, USA e-mail:[email protected]
Hayden-William Courtland,Leni and Peter W. May Department of Orthopaedics, Mount Sinai School of Medicine, Box 1188,One Gustave L. Levy Place, New York, NY 10029, USA, e-mail: [email protected]
Christopher Price,Leni and Peter W. May Department of Orthopaedics, Mount Sinai School of Medicine, Box 1188,One Gustave L. Levy Place, New York, NY 10029, USA, e-mail: [email protected]
Matthew Cordova, andLeni and Peter W. May Department of Orthopaedics, Mount Sinai School of Medicine, Box 1188,One Gustave L. Levy Place, New York, NY 10029, USA, e-mail: [email protected]
Joseph H. NadeauDepartment of Genetics, Case Western Reserve University School of Medicine, Cleveland, OH44106, USA e-mail: [email protected]
AbstractCompensatory interactions among adult skeletal traits are critical for establishing strength butcomplicate the search for fracture susceptibility genes by allowing many genetic variants to exist ina population without loss of function. A better understanding of how these interactions arise duringgrowth will provide new insight into genotype-phenotype relationships and the biological controlsthat establish skeletal strength. We tested the hypothesis that genetic variants affecting growth inwidth relative to growth in length (slenderness) are coordinated with movement of the inner bonesurface and matrix mineralization to match stiffness with weight-bearing loads during postnatalgrowth. Midshaft femoral morphology and tissue-mineral density were quantified at ages of 1 dayand at 4, 8, and 16 weeks for a panel of 20 female AXB/BXA recombinant inbred mouse strains.Path Analyses revealed significant compensatory interactions among outer-surface expansion rate,inner-surface expansion rate, and tissue-mineral density during postnatal growth, indicating that
e-mail: [email protected].
NIH Public AccessAuthor ManuscriptMamm Genome. Author manuscript; available in PMC 2010 January 1.
Published in final edited form as:Mamm Genome. 2009 January ; 20(1): 21–33. doi:10.1007/s00335-008-9158-1.
NIH
-PA Author Manuscript
NIH
-PA Author Manuscript
NIH
-PA Author Manuscript

genetic variants affecting bone slenderness were buffered mechanically by the precise regulation ofbone surface movements and matrix mineralization. Importantly, the covariation betweenmorphology and mineralization resulted from a heritable constraint limiting the amount of tissue thatcould be used to construct a functional femur. The functional interactions during growth explained56-99% of the variability in adult traits and mechanical properties. These functional interactionsprovide quantitative expectations of how genetic or environmental variants affecting one trait shouldbe compensated by changes in other traits. Variants that impair this process or that cannot be fullycompensated are expected to alter skeletal growth leading to underdesigned (weak) or overdesigned(bulky) structures.
IntroductionThere is tremendous interest in identifying disease susceptibility genes because geneticinformation holds great promise for identifying at-risk individuals early in life and fordiscovering novel biological pathways that can be used for personalized treatment. Manycomplex systems have developed robust, regulatory mechanisms to buffer themselves againstthe deleterious effects of genetic variants (Rutherford 2000). Function is maintained in thesesystemsbecause genetic variants affecting one trait are compensated by the covariation of othertraits. These buffering mechanisms, which are often not incorporated into genetic analyses,complicate the search for disease susceptibility genes because they allow many genetic variantsto exist in a population without loss of function (Csete and Doyle 2002). Genetic orenvironmental variants that alter buffering mechanisms can compromise system function(Nadeau and Topol 2006) and expose cryptic genetic variants (Rutherford and Lindquist1998). One approach to studying these buffering mechanisms is to examine how healthysystems establish function when faced with variants that could lead to dysfunction.
The skeleton is an example of a complex system that relies on buffering mechanisms toestablish and maintain mechanical function. Bone must be sufficiently stiff and strong tosupport the forces engendered during daily activities, otherwise the structure will be weak andsusceptible to fracture. The compensatory relationship among traits leading to functionality iscalled phenotypic integration (Olson and Miller 1958; Pigliucci and Preston 2004). Phenotypicintegration, which has been studied primarily in the context of evolutionary changes in bonesize and shape (Cheverud 1982, 1996; Klingenberg et al. 2003, 2004; Olson and Miller1958), has recently been described in a context that is relevant to skeletal fragility (Jepsen etal. 2007; Tommasini et al. 2008).
Genetic variation in bone width provides a model to study how the skeletal system utilizesbuffering mechanisms to establish and maintain mechanical function. Bone slenderness, ameasure of cross-sectional size (e.g., width, total area) relative to length (Fig. 1a), is a heritabletrait that results from variation in the biological processes regulating the relationship betweengrowth in width (subperiosteal expansion) and growth in length. Genetic variants that impairgrowth in width leading to a slender bone (narrow relative to length) threaten mechanicalfunction because small reductions in width could lead to disproportionately large reductionsin fracture resistance (strength) (van der Meulen et al. 2001). However, compensatory changesin morphology and mineralization strengthened slender long bones under daily load activities(Jepsen et al. 2007). Importantly, this buffering occurred at the expense of increased brittlenessunder extreme load conditions, indicating that fracture susceptibility may arise within thenormal range of functionally adapted structures. Finding that compensatory interactions amongtraits may be a source of fracture susceptibility is a departure from conventional reductionistapproaches which assume that individuals within a population are at risk of fracturing for thesame structural and thus biological reasons. However, an emergent property of compensatorytrait interactions is that individuals acquire a specific set of adult traits, a concept recently
Jepsen et al. Page 2
Mamm Genome. Author manuscript; available in PMC 2010 January 1.
NIH
-PA Author Manuscript
NIH
-PA Author Manuscript
NIH
-PA Author Manuscript
shown in the human femoral neck (Zebaze et al. 2007). Consequently, fracture susceptibilitymay depend on acquiring an “at-risk set of traits” or a set of traits that deviates from an ideal,perfectly adapted trait set. Thus, the genetic basis of fragility may be better examined in thecontext of sets of traits and the relationship among traits rather than individual traits.
Because prior work examined the adult skeleton (Jepsen et al. 2007; Tommasini et al. 2008),it was unclear how and when these functional interactions arose during growth (Cheverud1996). Studying phenotypic integration during growth will provide new insight into thebiological mechanisms that directly regulate the establishment of bone strength. Bone structureis adapted to forces during growth by the coordinated activities of bone-forming (osteoblasts)and bone-resorbing (osteoclasts) cells, suggesting that mechanical forces mediate thecompensatory relationship among traits (Forwood et al. 2004; Frost 1987; Moro et al. 1996;Ruff et al. 2006; Sumner and Andriacchi 1996; van der Meulen et al. 1996). This process offunctional adaptation is commonly referred to as Wolff’s Law (Ruff et al. 2006). Prior workexamining adult mouse strains showed a strong correlation between body weight and femoralstiffness (Jepsen et al. 2007). Because stiffness is inversely related to the amount of strain(deformation) a structure undergoes while loaded, the data suggested that femora werefunctionally adapted so peak tissue-level strains were similar across the panel, consistent withthe theory of elastic similarity (McMahon 1973). This theory provides an end point for thesystem (i.e., similar peak tissue-level strains) as well as a framework for hypothesizing abiomechanical mechanism explaining the genetically varying growth patterns (Fig. 1b). Underphysiologic bending and torsional loads, bone diameter defines the amount of strain that bonecells perceive and the contribution of each increment of bone apposition to overall stiffnessduring growth. Each increment of tissue deposited on the outer surface of a small-diameterbone will have a dramatically lower mechanical benefit to overall stiffness compared to thesame amount of tissue deposited on a large-diameter bone. To maintain elastic similarity,genetic variants that impair the expansion rate of the outer surface during growth and that leadto small-diameter femora are hypothesized to require (1) compensatory reductions in marrow(endosteal) expansion to increase bone mass and (2) compensatory increases in matrixmineralization to increase tissue stiffness. We tested this hypothesis by determining whethermatrix mineralization and the relative expansion of the outer and inner surfaces are functionallycoordinated during growth. Functional interactions among traits were examined using a panelof AXB/BXA recombinant inbred (RI) mouse strains, as described previously (Nadeau et al.2003). Genetic recombination and segregation during meiosis randomizes allelic segregation,thereby creating new and usually nonpathologic combinations of bone traits (Bailey 1986;Jepsen et al. 2007). The pattern of trait interactions during growth can be rigorously tested byexamining how traits covary or correlate across the RI panel.
MethodsInbred mouse strains
Female A/J, C57BL/6 J (B6), and 20 AXB/BXA RI mouse strains (n = 8-17/age/strain) wereobtained from the Jackson Laboratory (Bar Harbor, ME, USA) and examined at 1 day and 4,8, and 16 weeks of age. These ages were chosen based on prior work showing differences inthe rates of bone surface movements during early (birth to 4 weeks) and later (4 to 16 weeks)phases of growth (Price et al. 2005). The handling and treatment of mice was approved by theInstitutional Animal Care and Use Committee.
Bone morphologyFemoral length (Le) was measured from the proximal femoral head to the distal condyles usingdigital calipers (0.01-mm resolution). Midshaft (diaphyseal) cross-sectional morphology (Fig.1) for the 1-day, 4-week, and 8-week time points was determined from nondecalcified plastic
Jepsen et al. Page 3
Mamm Genome. Author manuscript; available in PMC 2010 January 1.
NIH
-PA Author Manuscript
NIH
-PA Author Manuscript
NIH
-PA Author Manuscript

embedded sections, as described previously (Jepsen et al. 2003). For the 16-week time point,midshaft cross-sectional morphology was measured at high resolution (8.7-μm voxel size)using an eXplore Locus SP Pre-Clinical Specimen Micro-computed Tomography system (GEHealthcare, London, Ontario, Canada). Data for 16-week-old mice were reported previously(Jepsen et al. 2007) and are included in the current study to relate skeletal growth patterns toadult traits and mechanical properties. For the histologic and tomographic images, themorphologic traits that were quantified included the amount of tissue (cortical area, Ct.Ar;marrow area, Ma.Ar; total area, Tt.Ar; cortical thickness, Ct.Th) and the spatial distribution oftissue (polar moment of inertia, Jo). Moment of inertia is a measure of the proximity of thetissue to the geometric centroid of the cross-section. Total area, which reflects the biologicalactivity on the outer surface, was defined as the sum of the cortical and marrow areas. Marrowarea was included as a measure of the biological activity on the inner surface. Traits werequantified for each cross-section and the values were averaged.
Measures of the age changes in bone size and shape were also calculated. For each RI strain,the rate of growth in width (dTt.Ar/dt0-4) was calculated as total area at 4 weeks (Tt.Ar4) minusthe average Tt.Ar at 1 day (Tt.Ar0) and normalized for the age interval (dt0-4). Marrowexpansion rate (dMa.Ar/dt0-4) used a similar formula but substituted Ma.Ar for Tt.Ar. Measuresrepresenting the relationship between traits included bone slenderness, the cortical area-bodyweight relationship, and the relative cortical area. Slenderness was calculated as total area/length (Tt.Ar/Le), where slender refers to bones with low values of Tt.Ar/Le and robust refersto bones with large values of Tt.Ar/Le. The relationship between cortical area (Ct.Ar) and bodyweight (BW) was determined from a linear regression of data from the 4-, 8-, and 16-weektime points. The relative cortical area (Ct.Ar/Tt.Ar) was calculated as the ratio of cortical areato total area, and is a measure of the relative expansion of the outer and inner surfaces.
Tissue-mineral densityMicro-computed tomography (microCT) was also used to quantify tissue-mineral density(TMDn) for femora at 4 and 16 weeks of age, as described previously (Jepsen et al. 2007).TMDn (mg/cc) was determined by converting gray-scale values to mineral density values usinga density calibration factor, and then averaging mineral content values over all thresholded“bone” voxels. The density calibration factor was determined for each scan using a phantomcontaining air, water, and a hydroxyapatite standard (SB3; Gammex RMI, Middleton, WI,USA). TMDn is a measure reflecting the amount of mineral incorporated within the bone matrixand should not be confused with bone-mineral density (BMD) which averages gray-scalevalues over total volume or projected bone areas.
Whole-bone mechanical propertiesMechanical properties of 16-week-old mice were reported previously (Jepsen et al. 2007) andare included here to show how variable growth patterns affect mechanical function (stiffness)of adult femora. Following microCT analysis, femora from 16-week-old mice were loaded tofailure in 4-point bending, as described previously (Jepsen et al. 2001). Stiffness was calculatedfrom a linear regression of the initial portion of the load deflection curve. Femora were testedat room temperature and kept moist with phosphate-buffered saline during all tests.
Narrow sense heritabilityThe narrow sense heritability, h2, which estimates the proportion of phenotypic variationattributable to additive genetic effects, was determined for each trait using the method describedby Belknap (1998). The value of h2 was estimated for the RI panel using the R2 value from aone-way analysis of variance (ANOVA). For the relationship between cortical area and bodyweight, a Ct.Ar/BW ratio was calculated for each sample in the 4-, 8-, and 16-week time groupsusing a linear regression-based method. Cortical area for each sample was calculated as
Jepsen et al. Page 4
Mamm Genome. Author manuscript; available in PMC 2010 January 1.
NIH
-PA Author Manuscript
NIH
-PA Author Manuscript
NIH
-PA Author Manuscript

(1)
where i is the sample number and j refers to the RI strain. xj and yj are the slope and intercept,respectively, calculated for each RI strain by regressing Ct.Ar and BW measured at 4, 8, and16 weeks. Normalizing for body weight gives
(2)
A Ct.Ar/BW ratio was calculated for each sample and h2 was determined for each time point.
Correlation analysisPearson correlation coefficients were calculated for all trait-trait comparisons to identify thebone traits that cosegregate after randomization of A/J and B6 genomes among the RI strains.A correlation matrix among traits was constructed at each age. Statistically significantcorrelations were identified by establishing a threshold correlation magnitude, which wasdetermined using permutation tests (Churchill and Doerge 1994).
Path analysisBecause complex systems comprise multiple traits, many of which interact, the overallorganization of these interactions in the context of function can be understood as a network.Networks of functional relationships can be examined using Path Analysis (Jepsen et al.2007; Sharkey and Lang 2007; Wright 1921), which is a well-established and widely usedmultivariate analysis technique (Grace 2006) that uses conditional covariances to test for causalrelationships among traits (Wright 1921). Because the relationship between two traits willchange in sign and in significance when placed in the context of function and when the effectsof confounding variables are taken into consideration (Jepsen et al. 2007), Path Analysisprovides a rigorous approach to understand how variability in one trait is compensated bydirected changes in other traits. Functional interactions are described in a statistical sense basedon the pattern of statistical dependency among the traits. Independent (x) and dependent (y)traits are selected based on a priori knowledge or hypotheses of how a system functions. Thehypothesized direction of the relationship specified between traits (i.e., a change in x causes achange in y) is critical as this dictates the computation of the covariance matrix and determinesthe overall goodness of fit for the model. The directionality between two traits within thenetwork provides the basis for implying functional relationships (Sieberts and Schadt 2007)and can be specified based on the postulated nature of causality. If causality is not known,directions can be specified based on the temporal sequence of events which would establishcausality. The causal nature of trait associations can be confirmed by conducting Path Analyseswith the directions reversed.
The data examined using Path Analysis were the mean values of each RI strain. All data wereZ-transformed relative to the overall mean and standard deviation of the RI panel, as describedpreviously (Jepsen et al. 2007). This was done for each age group separately. Z transformationstandardizes the variables so each trait at each age shows a mean of zero and a standarddeviation of one. The Z-transformed data make it easier to interpret the path coefficients derivedin the Path Analysis, as the coefficients represent how two traits relate in terms of the numberof standard deviation units. Three Path Analyses were conducted to test whether compensatoryinteractions among traits established during growth can be explained based on the hypothesizedbiomechanical mechanism (Fig. 1b).
Jepsen et al. Page 5
Mamm Genome. Author manuscript; available in PMC 2010 January 1.
NIH
-PA Author Manuscript
NIH
-PA Author Manuscript
NIH
-PA Author Manuscript

Path Model A—The first Path Model tested the hypothesis that genetic variants affecting theouter-surface expansion rate during growth are compensated by changes in the rate of marrowexpansion and the amount of mineral incorporated into the matrix. The independent variablesincluded the expansion rate of the outer surface during postnatal growth (dTt.Ar/dt0-4), bodyweight (BW4), and femoral length (Le4) at 4 weeks. Bone length was included to statisticallycontrol for variation in growth in width relative to growth in length (i.e., slenderness).Dependent variables included marrow expansion rate (dMa.Ar/dt0-4) and tissue-mineraldensity (TMDn4), a measure of matrix mineralization that correlates with tissue stiffness. Thesubscripts indicate the age of the mouse, where 0 refers to birth (1 day), 4 refers to 4 weeks,and 16 refers to 16 weeks. Directed paths from dTt.Ar/dt0-4 to dMa.Ar/dt0-4 and to TMDn4tested whether marrow expansion rate and matrix mineralization are functionally related toouter-surface expansion rate. A directed path from dMa.Ar/dt0-4 to TMDn4 tested if changesin morphology were further compensated by changes in mineralization. Nonsignificant pathswere removed to maximize the degrees of freedom.
Path Model B—The second Path Model tested whether genetic variants affecting bonegrowth patterns are deterministic of the set of acquired adult traits that are needed to establishfunction. We tested whether variation in slenderness relative to body weight during postnatalgrowth (4 weeks of age) resulted in compensatory changes in adult cortical thickness,Ct.Th16, and matrix mineralization, TMDn16. Ct.Th16 was incorporated as a measure of therelative expansions of the outer and inner surfaces. The number of traits used in the Path Modelwas minimized by merging bone length and outer-surface expansion rate into a singleslenderness variable, Tt.Ar/Le4. Paths between Tt.Ar/Le4 and TMDn16 and Ct.Th16 weredirected in accordance with those described in Path Model A. Adult cortical area (Ct.Ar16),moment of inertia (Jo16), and stiffness (Stiff16) were incorporated into the model to provide abiomechanical basis for how slender femora were strengthened by compensatory changes inmorphology and tissue quality. Directed paths from Tt.Ar/Le4 to Jo16 and to Ct.Ar16 testedwhether variation in outer-surface expansion during postnatal growth defined the set of adulttraits contributing to mechanical function (stiffness).
Path Model C—A third Path Model tested whether the functional interactions observed forthe AXB/BXA RI panel predict the set of traits for adult female A/J and B6 mice as well assix other inbred strains (C3H/HeJ, AKR/J, 129s1/SvImJ, DBA/2 J, BALB/cByJ, SM/J) thatwere reported previously (Jepsen et al. 2003). Ct.Th and TMDn were examined because thesetraits were coadapted to compensate for variability in bone slenderness. The Path Model wasmodified to allow for variable Ct.Ar-BW relationships by treating Ct.Ar as an independentvariable. This analysis used data for adult mice only. The direction of paths was based on thosedescribed in Path Model A.
All Path Models were compared to the measured data using maximum-likelihood estimationand overall fit was determined by a χ2 test (LISREL v. 8.8; Scientific Software International,Lincoln Park, IL, USA). Because Path Analysis favors the a priori, theory-based model, modelsare rejected if the observed data and the expectations derived from the model do not match(i.e., if p < 0.05). Thus, χ2 values with an associated p value greater than 0.05 means that themodel adequately fits the data. The root-mean-square error of approximation (RMSEA), whichtakes the number of degrees of freedom of the model into consideration, was included as anadditional fit index, with p < 0.05 indicating a close fit.
Engineering model of skeletal growthBeam theory was used to evaluate how compensatory changes in morphology andmineralization during growth contributed to mechanical function. For cylindrical structures ofsimilar length loaded in bending, whole-bone stiffness is proportional to the product of tissue
Jepsen et al. Page 6
Mamm Genome. Author manuscript; available in PMC 2010 January 1.
NIH
-PA Author Manuscript
NIH
-PA Author Manuscript
NIH
-PA Author Manuscript

stiffness (E) and the rectangular moment of inertia (I) (Sumner and Andriacchi 1996). Tissuestiffness was assumed to increase during growth proportional to the degree of mineralization(Price et al. 2005). Tissue-stiffness values were based on the tensile modulus measured for anindependent cohort of adult A/J and B6 mice (Courtland et al. 2008). Expansion of the outerand inner surfaces was modeled to fit the growth patterns leading to slender (A/J-like) androbust (B6-like) femora. The four models examined included a B6-like growth pattern coupledwith reduced mineralization, an A/J-like growth pattern coupled with increased mineralization(i.e., fully coadapted), an A/J-like growth pattern without the compensatory increase inmineralization, and an A/J-like growth pattern without compensatory changes in morphologyand mineralization (i.e., no coadaptation).
ResultsSlenderness is established during postnatal growth
Randomizing A/J and B6 genomes resulted in wide variation in diaphyseal size among the RIpanel throughout growth. RI femora ranged from robust (B6-like) to slender (A/J-like) (Fig.2a). Femoral slenderness (Tt.Ar/Le) showed a normal distribution for each age group, with anoverall mean value that was intermediate between A/J and B6. This variation was expected fora complex trait regulated by multiple genes. Slenderness measured at 4 weeks correlatedpositively with slenderness measured at 8 (R2 = 0.78, p < 0.001) and at 16 (R2 = 0.79, p <0.001) weeks of age (Fig. 2b), indicating that genetic variation in slenderness was establishedearly in life. Although RI mice that tended to be bigger (i.e., heavier) also tended to have biggerbones (i.e., larger Tt.Ar), Tt.Ar/Le correlated weakly with body weight at each age (Fig. 2c).
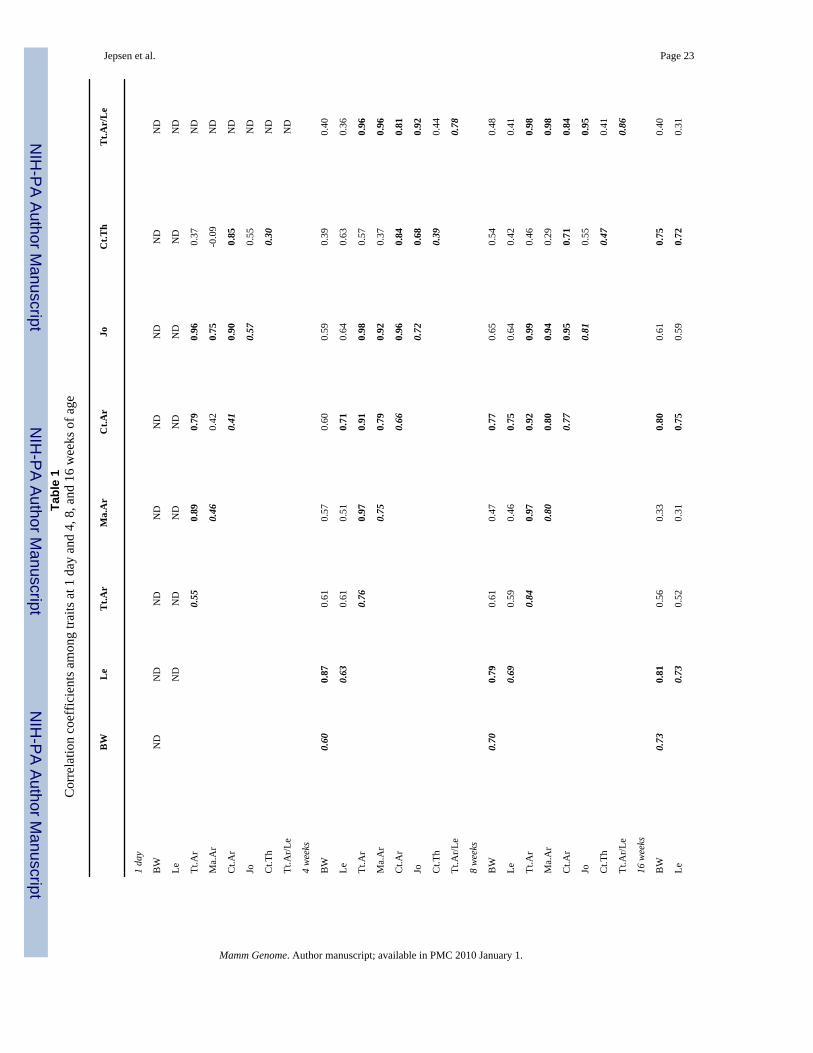
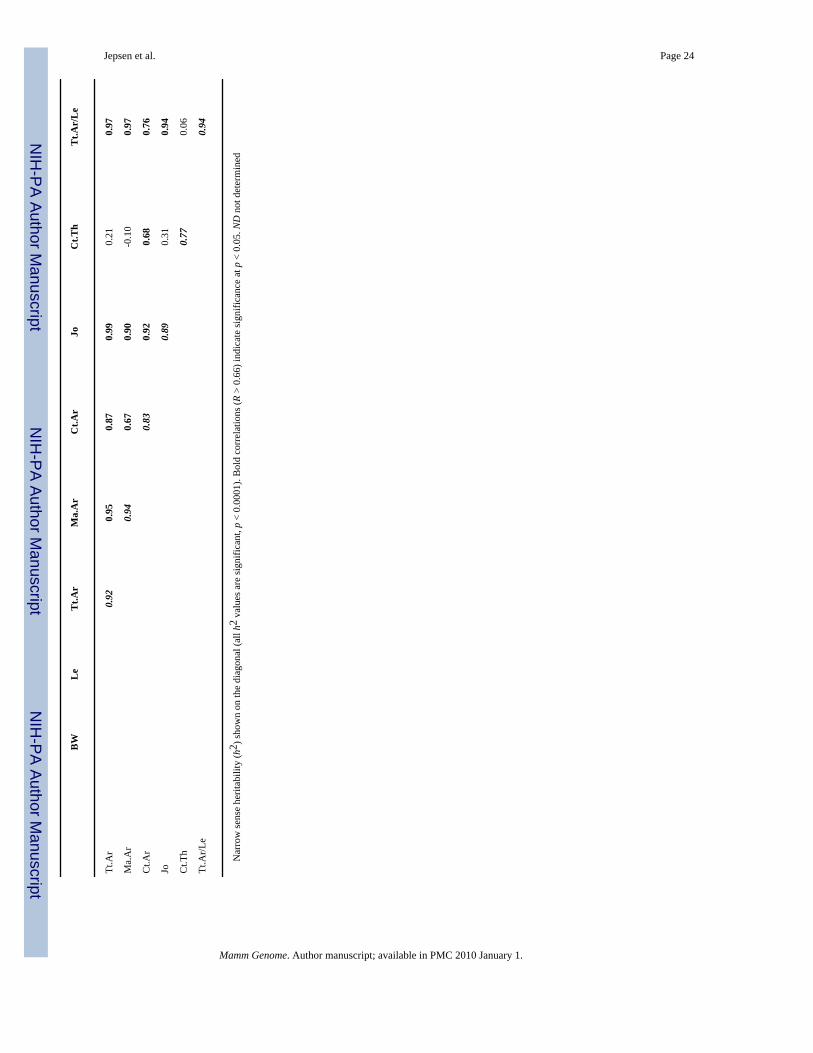
Functional interactions among traits are present during postnatal growthTraits that cosegregated after randomization were identified by correlation analysis (Table 1).A permutation test indicated that correlation coefficients greater than 0.66 were significant atthe p < 0.05 level. More than 81% of the significant correlations observed at 16 weeks of agewere also observed at 1 day, 4 weeks, and 8 weeks of age, indicating that the functionalrelationships observed among adult traits were present during postnatal growth. The narrowsense heritability (h2) increased with age to values greater than 0.72 for body weight and forall bone traits examined (diagonals in Table 1). The narrow sense heritability for slenderness,which increased from 0.78 at 4 weeks to 0.94 at 16 weeks of age, was one of the highestheritabilities for the traits examined in this study.
The amount of tissue used to establish functionality is genetically regulatedCortical area (Ct.Ar) was regressed against body weight (BW) for all age groups to determinewhether the RI strains used similar amounts of tissue to build mechanically functional femora.Mean Ct.Ar values for the RI panel increased significantly with BW across the 4-, 8-, and 16-week age groups (R2 = 0.81, p < 0.0001) (Fig. 3). The slope of each age group was notsignificantly different from the slope determined across all age groups (p > 0.3, ANCOVA).The narrow sense heritability for the Ct.Ar-BW relationship was 0.67 at 4 weeks, 0.68 at 8weeks, and 0.69 at 16 weeks of age, indicating that additive genetic effects explainedapproximately two-thirds of the variation in this relationship. Using data at 4, 8, and 16 weeks,B6 femora showed a significantly greater Ct.Ar-BW slope compared to A/J femora, which hada slope and y intercept similar to the mean values of the RI panel (Fig. 4a, b). Since body weightwas not measured at 1 day of age, the intercept was calculated at the average BW value for the4-week age group. The Ct.Ar-BW relationship varied among the RI strains such that nine RIstrains showed Ct.Ar-BW slopes and intercepts that were not different from the average curve(i.e., A/J-like) (Fig. 4c); four RI strains showed similar intercepts and either larger (n = 3) (B6-like) or smaller (n = 1) slopes (Fig. 4d); six RI strains showed slopes that were not different
Jepsen et al. Page 7
Mamm Genome. Author manuscript; available in PMC 2010 January 1.
NIH
-PA Author Manuscript
NIH
-PA Author Manuscript
NIH
-PA Author Manuscript
from the average curve but had larger (n = 2) or smaller (n = 4) intercepts (Fig. 4e); and oneRI strain showed a larger intercept and a reduced slope (Fig. 4f).
The outer-surface expansion rate relative to body size is functionally related to marrowexpansion rate and the degree of matrix mineralization
The near-perfect goodness of fit for the first Path Model and the large R2 values for the structuralequations (Fig. 5a) indicated that the functional relationships among the traits were consistentwith the hypothesized biomechanical mechanism (Fig. 1b). The strong, positive pathcoefficient (1.04) between dTt.Ar/dt0-4 and dMa.Ar/dt0-4 and the strong, negative pathcoefficient [-0.68 = -0.86 (direct) + 1.04 × 0.17 (indirect)] between dTt.Ar/dt0-4 and TMDn4indicated that when body weight and bone length were held fixed, a 1-SD (standard deviation)decrease in outer-surface expansion rate was associated with a 1.04-SD decrease in marrowexpansion rate and a 0.68-SD increase in mineralization. Thus, RI femora showing reducedouter-surface expansion rate relative to body weight during postnatal growth also showedreduced marrow expansion rate but increased matrix mineralization. At the other extreme, RIfemora showing greater outer-surface expansion rate relative to body weight during postnatalgrowth showed increased marrow expansion rate but reduced matrix mineralization. Thegoodness of fit was not affected when dTt.Ar/dt and dMa.Ar/dt were switched, indicating thatno clear causal association could be determined between the outer-surface and marrowexpansion rates.
Covariation during postnatal growth defines adult trait sets and mechanical functionThe second Path Model tested how precise control of postnatal skeletal growth patternsfacilitated the development of a femoral structure that was sufficiently stiff to support weight-bearing loads (Fig. 5b). Substituting Tt.Ar/Le4 for bone length and outer-surface expansionrate had no effect on the goodness of fit, confirming that Tt.Ar/Le4 was a valid trait substitutionto evaluate postnatal growth patterns using Path Analysis. The reduced form of the structuralequations showed that TMDn16 and Ct.Th16 were negatively related to Tt.Ar/Le4, consistentwith the relationships defined in the first Path Model. The structural equations showed thatvariation in slenderness relative to body weight during postnatal growth accounted for 56-63%of the variation in adult mineralization and cortical thickness. The use of Ct.Th16 as a measureof the relative expansion of the outer and inner surfaces was supported by observing significantpositive correlations between CtTh16 and the relative expansion of these two surfaces (dCtAr/dt) measured from 4 to 8 (R = 0.61, p < 0.005) and from 8 to 16 (R = 0.64, p < 0.002) weeksof age.
The strong, positive path coefficient between Tt.Ar/Le4 and Jo16 was expected because Jo andTt.Ar both correlate with bone diameter. Substituting Tt.Ar16 or the average outer bonediameter for Jo16 had no effect on the goodness of fit or the R2 values for the structuralequations, as expected (data not shown). The weak path coefficient between BW4 andCt.Ar16 was surprising given that the bivariate correlation analysis showed a strong linearrelationship between these two traits across growth (Fig. 3). The correlation between BW4 andCt.Ar16 showed a similarly strong bivariate regression (R2 = 0.70, p < 0.0001; data not shown).This analysis indicated that the relationship between Ct.Ar and BW was mediated through areciprocal relationship between tissue distribution (Jo) and cortical thickness. An advantagegained by using Path Analysis is that these complex relationships are generally hidden inbivariate regressions. Thus, Jo covaried with Ct.Th in a way that maintained a similar Ct.Ar-BW relationship across the RI panel, regardless of whether the genetic background resulted inrobust (large Jo, small Ct.Th) or slender (small Jo, large Ct.Th) femora. Finally, the variationin adult stiffness was nearly fully explained (R2 = 0.84) by Ct.Ar16 and TMDn16. Addingconnections from BW4, Ct.Th16, or Jo16 to Stiff16 did not change the goodness of fit or theR2 value of the structural equation. This analysis showed that genetic variation in bone
Jepsen et al. Page 8
Mamm Genome. Author manuscript; available in PMC 2010 January 1.
NIH
-PA Author Manuscript
NIH
-PA Author Manuscript
NIH
-PA Author Manuscript
slenderness during postnatal growth was associated with highly coordinated changes inmorphology and mineralization that resulted in the acquisition of sets of adult bone traits thatmatched whole-bone stiffness with body weight.
Functional interactions generalize to other inbred mouse strainsThe third Path Model tested whether the functional interactions observed for the AXB/BXARI panel predicted the set of traits for other inbred mouse strains. The modified Path Model(Fig. 6a) fit the data extremely well and the structural equations for Ct.Th and TMDn showedR2 values of 0.96 and 0.70, respectively, indicating that treating Ct.Ar as an independentvariable to allow for variable Ct.Ar-BW relationships had no effect on the model fit nor thefunctional interactions observed in Path Models A and B. The structural equations wererederived with nontransformed data using multivariate regression analysis because Ztransformation is specific to the AXB/BXA RI panel and the constant in the structural equationshad to be nonzero to extend the regressions to other strains. The structural equations predictedCt.Th (Fig. 6b) and TMDn (Fig. 6c) extremely well for the inbred mouse panel. No differencesin the slopes or intercepts (p > 0.2, ANCOVA) were observed for either Ct.Th or TMDn whencomparing the linear regressions for the RI panel with the inbred mouse panel, suggesting thatsimilar functional interactions exist across inbred mouse strains exhibiting a wide range in bonesizes and shapes.
Engineering model of skeletal growthThe engineering beam model revealed that without compensatory changes in cortical thicknessand matrix mineralization, the slender (A/J-like) femora showed 55% lower stiffness (EI) by112 days of age compared to the robust (B6-like) femora (Fig. 7). Compensatory increases incortical thickness and mineralization dramatically improved the stiffness of the slender femorato within 14% of the robust femora, which is well within the error associated with estimatingfemoral stiffness assuming a circular cross-section. Compensatory increases in corticalthickness alone, however, had only a small benefit to global stiffness, indicating that thecompensatory increase in mineralization was a critical factor contributing to the functionalityof a slender structure.
DiscussionOrigins of functionality during growth
A panel of AXB/BXA RI strains was examined to study how traits covary within the skeletalsystem during growth to buffer genetic variants affecting bone slenderness. The continuousvariation in trait values across the RI panel confirmed that genetic randomization perturbedbone in a natural, nonpathologic manner (Nadeau et al. 2003). The interstrain variationprovided a statistical advantage over single-gene and single environmental perturbationexperiments by allowing us to use regression analysis and multivariate models to rigorouslystudy how multiple traits vary simultaneously (i.e., covary) during growth after confoundingvariables like body size were taken into consideration. Our data showed that the compensatoryrelationships observed among adult bone traits (Jepsen et al. 2007) were established earlyduring postnatal growth. Precisely regulating skeletal growth patterns may be a critical functionof a complex system that builds mechanically functional structures using limited resources andto ensure that peak tissue-level strains fall within a narrow range (i.e., elastic similarity)(McMahon 1973). This level of biological organization has the benefit of allowing function tobe achieved by different sets of traits (Marder and Goaillard 2006; Nadeau et al. 2003).Observing a narrow range of trait sets across the RI panel is entirely consistent with the ideathat buffering defines the range of phenotypic variation expressed in a population (Rutherford2000). Prior theoretical studies attempted to find a set of genes leading to an “optimal” bonestructure, but found instead that multiple outcomes were supported by different gene sets
Jepsen et al. Page 9
Mamm Genome. Author manuscript; available in PMC 2010 January 1.
NIH
-PA Author Manuscript
NIH
-PA Author Manuscript
NIH
-PA Author Manuscript

(Nowlan and Prendergast 2005). These results are entirely consistent with our data, whichshowed that phenotypic integration during growth allowed for multiple functional outcomesand thus for many genetic variants to exist in a population without deleterious mechanicaleffects.
Functional adaptationThe results provided new insight into functional adaptation, which is a critical developmentalprocess that ensures a bone is sufficiently stiff and strong to support applied loads. Given thatwhole-bone stiffness correlated significantly with body weight across the RI panel (Jepsen etal. 2007), the results indicated that precise coordination of outer-surface expansion rate,marrow expansion rate, and matrix mineralization during postnatal growth was required tosuccessfully adapt sets of traits to match weight-bearing loads. Similar associations betweenbone size and the amount of cortical bone have been observed recently for the human femoralneck (Zebaze et al. 2007). The engineering model showed that regulating mineral contentduring postnatal growth was critical to fully compensate femora that were slender relative tobody weight (Fig. 7). Prior work rarely incorporated the contribution of tissue quality(mineralization) to functional adaptation (Brear et al. 1990; Carrier and Leon 1990; Heinrich1999; Sumner and Andriacchi 1996). Although bone morphology is the primary determinantof the development of bone stiffness and strength during growth for an individual (Sumner andAndriacchi 1996), our work suggested that regulation of matrix mineralization (and bycorrelation tissue-level stiffness) was the primary determinant explaining differences infunctional adaptation among individuals with variable slenderness. The relatively low R2 value(40%) for TMDn at 4 weeks of age (Fig. 5a) may result from partial volume effects associatedwith noninvasive imaging or it may reflect increased variation in the degree of mineralizationamong mice during a period of rapid growth.
Biological constraints defining phenotypic integrationComplex systems have to work within biological constraints. For skeletal structures there arelimits to the magnitude and speed in which bone can be formed, resorbed, and mineralized.Examination of data across growth provided new insight into an important biological constraintcontributing to phenotypic integration. The second Path Analysis indicated that the RI strainsinherited a constraint limiting the amount of tissue (i.e., Ct.Ar) that could be used to build afunctional structure during growth. This constraint has also been observed for human bone(Zebaze et al. 2007). Moment of inertia (a measure of the spatial distribution of tissue) covariedwith cortical thickness in such a way that all RI femora had the same Ct.Ar relative to bodyweight, regardless of slenderness. The Ct.Ar-BW relationship showed a large narrow senseheritability, indicating that this relationship was genetically regulated, consistent with priorwork (Klein et al. 2002). Heritability of the Ct.Ar-BW relationship explained why RI strainswith large-diameter femora tended to have thin cortices, thus avoiding excessive bulk.Furthermore, heritability of this relationship limited the amount of morphologic compensationfor RI strains with small-diameter femora, and thus may explain why femora that were slenderrelative to body weight also showed compensatory increases in matrix mineralization. Findingthat the amount of tissue used to establish mechanical functionality was highly regulated orconstrained (Frost 1987) is consistent with the theory that bone maximizes stiffness usingminimum mass (Currey and Alexander 1985).
Variation in the slopes and intercepts of the Ct.Ar-BW relationship among the RI strainsindicated that this relationship was established and sustained during growth in different ways.The biological factors regulating the Ct.Ar-BW relationship are not fully understood, butmutant mouse models suggested that this relationship is modified by many factors, such asserum IGF-1 levels (Rosen et al. 1997, 2004; Yakar et al. 2002) and mutations in the genecoding for LRP5 (Akhter et al. 2004). Genetic factors that regulate the Ct.Ar-BW relationship
Jepsen et al. Page 10
Mamm Genome. Author manuscript; available in PMC 2010 January 1.
NIH
-PA Author Manuscript
NIH
-PA Author Manuscript
NIH
-PA Author Manuscript
may be important for studies of skeletal fragility because this relationship may represent a set-point for the system (Frost 1987). Different inbred mouse strains show variable Ct.Ar-BWrelationships (Jepsen et al. 2003; Turner et al. 2000; Wergedal et al. 2005). When the Ct.Ar-BW relationship was treated as an independent variable in the Path Analysis, the structuralequations accurately predicted cortical thickness and TMDn for inbred mouse strains showingwide variability in bone size and shape. The data indicated that inheritance of a particular Ct.Ar-BW relationship was central to phenotypic integration and therefore to the set of traits acquiredas an adult. Although only one skeletal site was examined in this study, we expect that othersites, including corticocancellous structures, also rely on phenotypic integration to establishfunction. However, the nature of the relationships and the biological constraints will varydepending on the applied loads, the size and shape of the skeletal structure, and the temporalsequence of biological (modeling/remodeling) events occurring during growth (Tanck et al.2006).
Biological regulators of trait covariationThe Path Analyses provided important insight into the biological factors that are involved inregulating skeletal growth patterns to establish mechanical function. Growth in length, whichis an endochondral process, is regulated by mechanical and endocrine factors that overlap withgrowth in width (Rauch 2005). However, the factors that coordinate growth in width relativeto growth in length (i.e., slenderness) are not fully understood. Slenderness was established inRI femora as early as 4 weeks of age, indicating that genetic factors established the relationshipbetween growth in width and length early in life and maintained this relationship throughoutgrowth, despite dramatic temporal changes in hormone levels and mechanical forces duringthis postnatal time frame (Seeman 2004). The large narrow sense heritability (Table 1)combined with the weak correlation between slenderness and body weight (Fig. 2c) indicatedthat the relationship between transverse bone expansion and longitudinal growth was definedprimarily by genetic factors rather than mechanical factors.
The large path coefficient between the outer- and inner-surface expansion rates (Fig. 5a)suggested that a strong biological signal is conveyed across the cortex to precisely coordinatethe relative movement of these two surfaces during growth. The mid-diaphysis of the femurgrows by expanding and drifting in space (Enlow 1963), and consequently, movement of theouter and inner surfaces involves the coordination of the relative activities of osteoblastic boneformation and osteoclastic resorption. Although osteoblasts and osteoclasts communicate viaendocrine and cytokine factors, the processes that regulate this communication to preciselyexpand or contract these surfaces relative to weight-bearing loads are not understood fully. Ourdata showed that mineralization increases during growth, consistent with prior studies (Carrierand Leon 1990;Currey and Butler 1975;Heinrich 1999;Papadimitriou et al. 1996;Price et al.2005), and also showed that the degree of mineralization varied with the rate of outer-surfaceexpansion relative to body size. This suggested that osteoblasts (or osteocytes) preciselymodulate the degree of matrix mineralization during postnatal growth in concert withmechanical loading demands. The biological factors that are responsible for the overall degreeof coordination are expected to involve both global (e.g., hormones, mechanical forces) andlocal signals (e.g., tissue strain).
Hierarchically structured genetic buffering mechanismsPhenotypic integration may have evolved to buffer genetic or environmental variants thatwould otherwise threaten system function (Marder and Goaillard 2006) or to allow for plasticityin organ- or organismal-level design so fitness matches environmental demands (Pigliucci2001). The ability of a complex system to buffer itself against gene variants that threaten systemfunction has been studied primarily in the context of compensatory genetic factors such asmodifier genes (Nadeau and Topol 2006), epistasis (Cheverud et al. 2004), and modularity
Jepsen et al. Page 11
Mamm Genome. Author manuscript; available in PMC 2010 January 1.
NIH
-PA Author Manuscript
NIH
-PA Author Manuscript
NIH
-PA Author Manuscript

(Klingenberg et al. 2004). The mechanism responsible for integrating bone traits to establishmechanical function, however, may not be fully explained by compensation at the gene level.Genetic randomization reduced the likelihood that each RI strain inherited a common set ofgenes that coordinated skeletal traits in a consistent manner across the panel (Nadeau et al.2003). Thus, random sets of genes gave rise to nonrandom sets of traits. Furthermore, thecoordination of bone surface expansion and matrix mineralization required to establish functioninvolves the precise regulation of the activity of multiple cell populations working on differentbone surfaces. This level of coordination likely involves a feedback control mechanism (Cseteand Doyle 2002; Marder and Goaillard 2006), suggesting that organ-level bufferingmechanisms in bone may involve biological controls at multiple levels of structural hierarchy.Thus, the set of traits acquired by each RI mouse strain appears to result from an interplaybetween functional adaptation (Wolff’s Law) and genetic variants affecting growth in widthrelative to growth in length. We assumed that variation in growth in width relative to length(slenderness) was the primary variant driving the compensatory changes in other traits. Thiswas assumed based on the temporal sequence of surface movements and matrix deposition(i.e., Tt.Ar is established before Ma.Ar and TMDn) (Price et al. 2005). However, reversing thedirection of arrows in the Path Models had no effect on the goodness of fit, indicating that ourdata could not establish the causal nature of these interactions. This remains a limitation of thisstudy and indicates that the relative contributions of genetic and environmental factors toskeletal function are tightly coupled.
ConclusionsWe examined how the skeletal system compensates for genetic variants affecting boneslenderness as an experimental model to identify traits that covary during growth to establishfunction. Path Analyses showed that establishing mechanical function in a complex systemsubjected to genetic variations requires a tremendous amount of order in the way bone isconstructed during growth. Although variation in traits among inbred mouse strains has beenattributed largely to genetic factors, our data showed that trait values are also determined inlarge part by strong adaptive processes operating during growth. Thus, the relationship betweengenotype and phenotype is complicated by hierarchically structured buffering mechanisms.We showed that variation in bone size and shape arises during postnatal growth from geneticvariants affecting body weight, genetic variants affecting slenderness, constraints imposed onthe amount of tissue that can be used to construct a functional structure (i.e., the Ct.Ar-BWrelationship), and biological processes that covary morphologic and compositional traits.Genetic variants altering the biological processes that covary traits would be expected tocompromise bone stiffness and strength. Genetic variants that alter covariation and improvestiffness and strength, however, would be expected to have tremendous therapeutic value. Thus,a novel approach to identifying gene variants that impair or promote bone strength is to focuson the processes that regulate the relationship between traits, because it is the relationshipbetween traits that determines the set of traits which defines function. Understanding thebiological processes that coordinate these traits is critical for determining how geneticbackground contributes to fracture susceptibility.
AcknowledgmentsThis project was supported by grants AR44927 and RR12305 from the National Institutes of Health.
ReferencesAkhter MP, Wells DJ, Short SJ, Cullen DM, Johnson ML, et al. Bone biomechanical properties in LRP5
mutant mice. Bone 2004;35:162–169. [PubMed: 15207752]
Jepsen et al. Page 12
Mamm Genome. Author manuscript; available in PMC 2010 January 1.
NIH
-PA Author Manuscript
NIH
-PA Author Manuscript
NIH
-PA Author Manuscript

Bailey DW. Genes that affect morphogenesis of the murine mandible. Recombinant-inbred strainanalysis. J Hered 1986;77:17–25. [PubMed: 3958479]
Belknap JK. Effect of within-strain sample size on QTL detection and mapping using recombinant inbredmouse strains. Behav Genet 1998;28:29–38. [PubMed: 9573644]
Brear K, Currey JD, Pond CM. Ontogenetic changes in the mechanical properties of the femur of thepolar bear Ursus maritimus. J Zool Lond 1990;222:49–58.
Carrier D, Leon LR. Skeletal growth and function in the California gull (Larus californicus). J Zool Lond1990;222:375–389.
Cheverud JM. Phenotypic, genetic, and environmental morphological integration in the cranium.Evolution 1982;36:499–516.
Cheverud JM. Developmental integration and the evolution of pleiotropy. Am Zool 1996;36:44–50.Cheverud JM, Ehrich TH, Vaughn TT, Koreishi SF, Linsey RB, et al. Pleiotropic effects on mandibular
morphology II: differential epistasis and genetic variation in morphological integration. J Exp ZoologB Mol Dev Evol 2004;302:424–435. [PubMed: 15384169]
Churchill GA, Doerge RW. Empirical threshold values for quantitative trait mapping. Genetics1994;138:963–971. [PubMed: 7851788]
Courtland H-W, Nasser P, Goldstone AB, Spevak L, Boskey AL, et al. Fourier transform infrared imagingmicrospectroscopy and micromechanical testing reveal intra-species variation in mouse bone mineralcomposition and matrix maturity. Calcif Tissue Int 2008;83:342–353. [PubMed: 18855037]
Csete ME, Doyle JC. Reverse engineering of biological complexity. Science 2002;295:1664–1669.[PubMed: 11872830]
Currey JD, Alexander RM. The thickness of the walls of tubular bones. J Zool Lond 1985;206:453–468.Currey JD, Butler G. The mechanical properties of bone tissue in children. J Bone Joint Surg Am
1975;57:810–814. [PubMed: 1158919]Enlow, DH. Principles of bone remodeling; an account of postnatal growth and remodeling processes in
long bones and the mandible. Charles C. Thomas Publisher; Springfield, IL: 1963.Forwood MR, Bailey DA, Beck TJ, Mirwald RL, Baxter-Jones AD, et al. Sexual dimorphism of the
femoral neck during the adolescent growth spurt: a structural analysis. Bone 2004;35:973–981.[PubMed: 15454105]
Frost HM. Bone “mass” and the “mechanostat”: a proposal. Anat Rec 1987;219:1–9. [PubMed: 3688455]Grace, JB. Structural equation modeling and natural systems. Cambridge University Press; Cambridge:
2006.Heinrich R. Ontogenetic changes in mineralization and bone geometry in the femur of muskoxen (Ovibos
moschatus). J Zool Lond 1999;247:215–223.Jepsen KJ, Pennington DE, Lee YL, Warman M, Nadeau J. Bone brittleness varies with genetic
background in A/J and C57BL/6 J inbred mice. J Bone Miner Res 2001;16:1854–1862. [PubMed:11585350]
Jepsen KJ, Akkus OJ, Majeska RJ, Nadeau JH. Hierarchical relationship between bone traits andmechanical properties in inbred mice. Mamm Genome 2003;14:97–104. [PubMed: 12584605]
Jepsen KJ, Hu B, Tommasini SM, Courtland H-W, Price C, et al. Genetic randomization revealsfunctional relationships among morphologic and tissue-quality traits that contribute to bone strengthand fragility. Mamm Genome 2007;18:492–507. [PubMed: 17557179]
Klein RF, Turner RJ, Skinner LD, Vartanian KA, Serang M, et al. Mapping quantitative trait loci thatinfluence femoral cross-sectional area in mice. J Bone Miner Res 2002;17:1752–1760. [PubMed:12369778]
Klingenberg CP, Mebus K, Auffray JC. Developmental integration in a complex morphological structure:how distinct are the modules in the mouse mandible? Evol Dev 2003;5:522–531. [PubMed:12950630]
Klingenberg CP, Leamy LJ, Cheverud JM. Integration and modularity of quantitative trait locus effectson geometric shape in the mouse mandible. Genetics 2004;166:1909–1921. [PubMed: 15126408]
Marder E, Goaillard JM. Variability, compensation and homeostasis in neuron and network function. NatRev Neurosci 2006;7:563–574. [PubMed: 16791145]
McMahon T. Size and shape in biology. Science 1973;179:1201–1204. [PubMed: 4689015]
Jepsen et al. Page 13
Mamm Genome. Author manuscript; available in PMC 2010 January 1.
NIH
-PA Author Manuscript
NIH
-PA Author Manuscript
NIH
-PA Author Manuscript

Moro M, van der Meulen MC, Kiratli BJ, Marcus R, Bachrach LK, et al. Body mass is the primarydeterminant of midfemoral bone acquisition during adolescent growth. Bone 1996;19:519–526.[PubMed: 8922652]
Nadeau JH, Topol EJ. The genetics of health. Nat Genet 2006;38:1095–1098. [PubMed: 17006459]Nadeau JH, Burrage LC, Restivo J, Pao YH, Churchill G, et al. Pleiotropy, homeostasis, and functional
networks based on assays of cardiovascular traits in genetically randomized populations. GenomeRes 2003;13:2082–2091. [PubMed: 12952877]
Nowlan NC, Prendergast PJ. Evolution of mechanoregulation of bone growth will lead to non-optimalbone phenotypes. J Theor Biol 2005;235:408–418. [PubMed: 15882703]
Olson, EC.; Miller, RL. Morphological integration. The University of Chicago Press; Chicago: 1958.Papadimitriou HM, Swartz SM, Kunz TH. Ontogenetic and anatomic variation in mineralization of the
wing skeleton of the Mexican free-tailed bat, Tadarida brasiliensis. J Zool Lond 1996;240:411–426.Pigliucci, M. Phenotypic plasticity: beyond nature and nurture. Johns Hopkins University Press;
Baltimore, MD: 2001.Pigliucci, M.; Preston, K. Studying the ecology and evolution of complex phenotypes. Oxford University
Press; New York: 2004. Phenotypic integration.Price CP, Herman BC, Lufkin T, Goldman HM, Jepsen KJ. Genetic variation in bone growth patterns
defines adult mouse bone fragility. J Bone Miner Res 2005;20:1983–1991. [PubMed: 16234972]Rauch F. Bone growth in length and width: the Yin and Yang of bone stability. J Musculoskelet Neuronal
Interact 2005;5:194–201. [PubMed: 16172510]Rosen CJ, Dimai HP, Vereault D, Donahue LR, Beamer WG, et al. Circulating and skeletal insulin-like
growth factor-I (IGF-I) concentrations in two inbred strains of mice with different bone mineraldensities. Bone 1997;21:217–223. [PubMed: 9276086]
Rosen CJ, Ackert-Bicknell CL, Adamo ML, Shultz KL, Rubin J, et al. Congenic mice with low serumIGF-I have increased body fat, reduced bone mineral density, and an altered osteoblast differentiationprogram. Bone 2004;35:1046–1058. [PubMed: 15542029]
Ruff C, Holt B, Trinkaus E. Who’s afraid of the big bad Wolff? “Wolff’s law” and bone functionaladaptation. Am J Phys Anthropol 2006;129:484–498. [PubMed: 16425178]
Rutherford SL. From genotype to phenotype: buffering mechanisms and the storage of geneticinformation. Bioessays 2000;22:1095–1105. [PubMed: 11084625]
Rutherford SL, Lindquist S. Hsp90 as a capacitor for morphological evolution. Nature 1998;396:336–342. [PubMed: 9845070]
Seeman E. The growth and age-related origins of bone fragility in men. Calcif Tissue Int 2004;75:100–109. [PubMed: 15383923]
Sharkey NA, Lang DH. Genes in context: probing the genetics of fracture resistance. Exerc Sport SciRev 2007;35:86–96. [PubMed: 17620926]
Sieberts SK, Schadt EE. Moving toward a system genetics view of disease. Mamm Genome 2007;18:389–401. [PubMed: 17653589]
Sumner DR, Andriacchi TP. Adaptation to differential loading: comparison of growth-related changesin cross-sectional properties of the human femur and humerus. Bone 1996;19:121–126. [PubMed:8853855]
Tanck E, Hannink G, Ruimerman R, Buma P, Burger EH, et al. Cortical bone development under thegrowth plate is regulated by mechanical load transfer. J Anat 2006;208:73–79. [PubMed: 16420380]
Tommasini SM, Nasser P, Hu B, Jepsen KJ. Biological coadaptation of morphological and compositiontraits contributes to mechanical functionality and skeletal fragility. J Bone Miner Res 2008;23:236–246. [PubMed: 17922614]
Turner CH, Hsieh YF, Muller R, Bouxsein ML, Baylink DJ, et al. Genetic regulation of cortical andtrabecular bone strength and microstructure in inbred strains of mice. J Bone Miner Res2000;15:1126–1131. [PubMed: 10841181]
van der Meulen MC, Ashford MW Jr, Kiratli BJ, Bachrach LK, Carter DR. Determinants of femoralgeometry and structure during adolescent growth. J Orthop Res 1996;14:22–29. [PubMed: 8618162]
van der Meulen MC, Jepsen KJ, Mikic B. Understanding bone strength: size isn’t everything. Bone2001;29:101–104. [PubMed: 11502469]
Jepsen et al. Page 14
Mamm Genome. Author manuscript; available in PMC 2010 January 1.
NIH
-PA Author Manuscript
NIH
-PA Author Manuscript
NIH
-PA Author Manuscript

Wergedal JE, Sheng MH, Ackert-Bicknell CL, Beamer WG, Baylink DJ. Genetic variation in femurextrinsic strength in 29 different inbred strains of mice is dependent on variations in femur cross-sectional geometry and bone density. Bone 2005;36:111–122. [PubMed: 15664009]
Wright S. Correlation and causation. J Agric Res 1921;20:557–585.Yakar S, Rosen CJ, Beamer WG, Ackert-Bicknell CL, Wu Y, et al. Circulating levels of IGF-1 directly
regulate bone growth and density. J Clin Invest 2002;110:771–781. [PubMed: 12235108]Zebaze RM, Jones A, Knackstedt M, Maalouf G, Seeman E. Construction of the femoral neck during
growth determines its strength in old age. J Bone Miner Res 2007;22:1055–1061. [PubMed:17501625]
Jepsen et al. Page 15
Mamm Genome. Author manuscript; available in PMC 2010 January 1.
NIH
-PA Author Manuscript
NIH
-PA Author Manuscript
NIH
-PA Author Manuscript
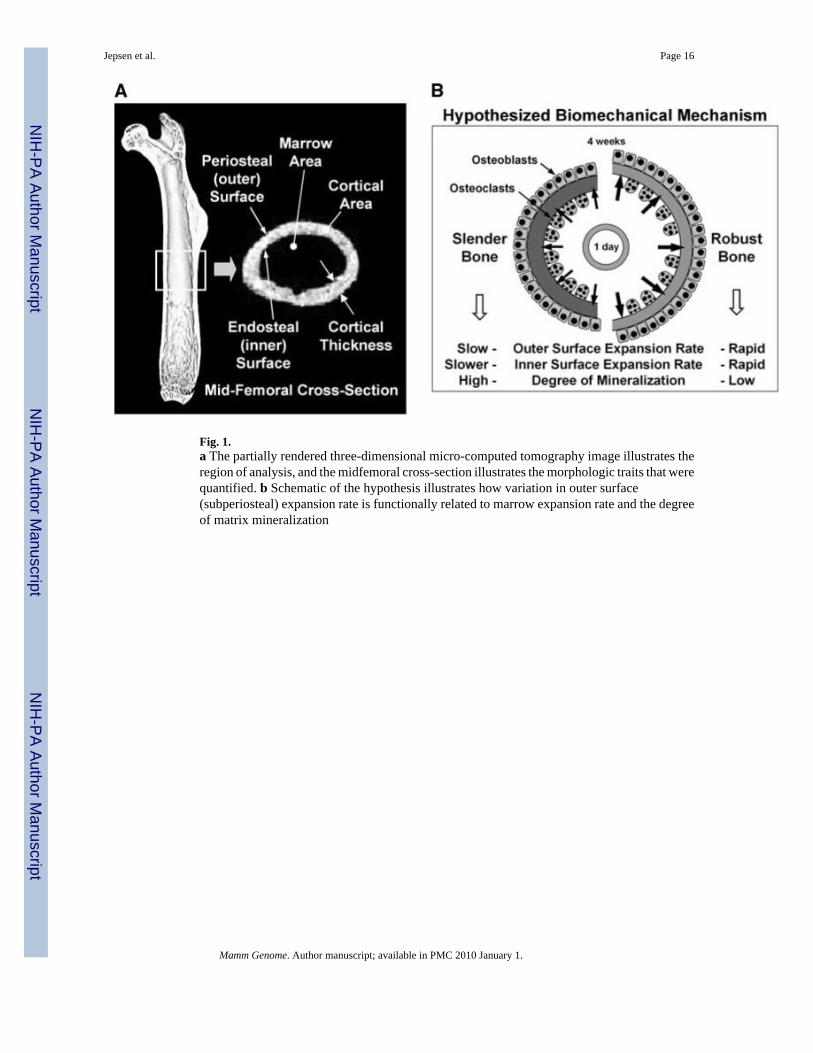
Fig. 1.a The partially rendered three-dimensional micro-computed tomography image illustrates theregion of analysis, and the midfemoral cross-section illustrates the morphologic traits that werequantified. b Schematic of the hypothesis illustrates how variation in outer surface(subperiosteal) expansion rate is functionally related to marrow expansion rate and the degreeof matrix mineralization
Jepsen et al. Page 16
Mamm Genome. Author manuscript; available in PMC 2010 January 1.
NIH
-PA Author Manuscript
NIH
-PA Author Manuscript
NIH
-PA Author Manuscript

Fig. 2.a Midfemoral cross-sections for representative members of the AXB/BXA RI panel are shownat four ages during growth. A/J and B6 are shown for comparison. b Slenderness measured at4 weeks of age correlated significantly with slenderness measured at 8 and 16 weeks of age.c Slenderness correlated weakly with body weight at all ages (16 weeks shown below)
Jepsen et al. Page 17
Mamm Genome. Author manuscript; available in PMC 2010 January 1.
NIH
-PA Author Manuscript
NIH
-PA Author Manuscript
NIH
-PA Author Manuscript

Fig. 3.Cortical bone area (Ct.Ar) increased linearly with body weight at 4, 8, and 16 weeks of age.Each data point represents the mean value for each RI strain
Jepsen et al. Page 18
Mamm Genome. Author manuscript; available in PMC 2010 January 1.
NIH
-PA Author Manuscript
NIH
-PA Author Manuscript
NIH
-PA Author Manuscript

Fig. 4.Variation in the relationship between cortical area and body weight (Ct.Ar-BW) for a A/J, bB6, and c-f representative RI strains. Individual strains are compared to the average curvederived using mean values for all RI strains. All curves include data at 4, 8, and 16 weeks ofage
Jepsen et al. Page 19
Mamm Genome. Author manuscript; available in PMC 2010 January 1.
NIH
-PA Author Manuscript
NIH
-PA Author Manuscript
NIH
-PA Author Manuscript

Fig. 5.a Path Model A tested for functional relationships between outer-surface expansion rate,marrow expansion rate, and mineralization from 0 (day 1) to 4 weeks of age. b Path Model Btested for functional relationships between variation in slenderness relative to body size at 4weeks of age and the set of adult traits (16 weeks) that contribute to whole-bone stiffness (Stiff)
Jepsen et al. Page 20
Mamm Genome. Author manuscript; available in PMC 2010 January 1.
NIH
-PA Author Manuscript
NIH
-PA Author Manuscript
NIH
-PA Author Manuscript
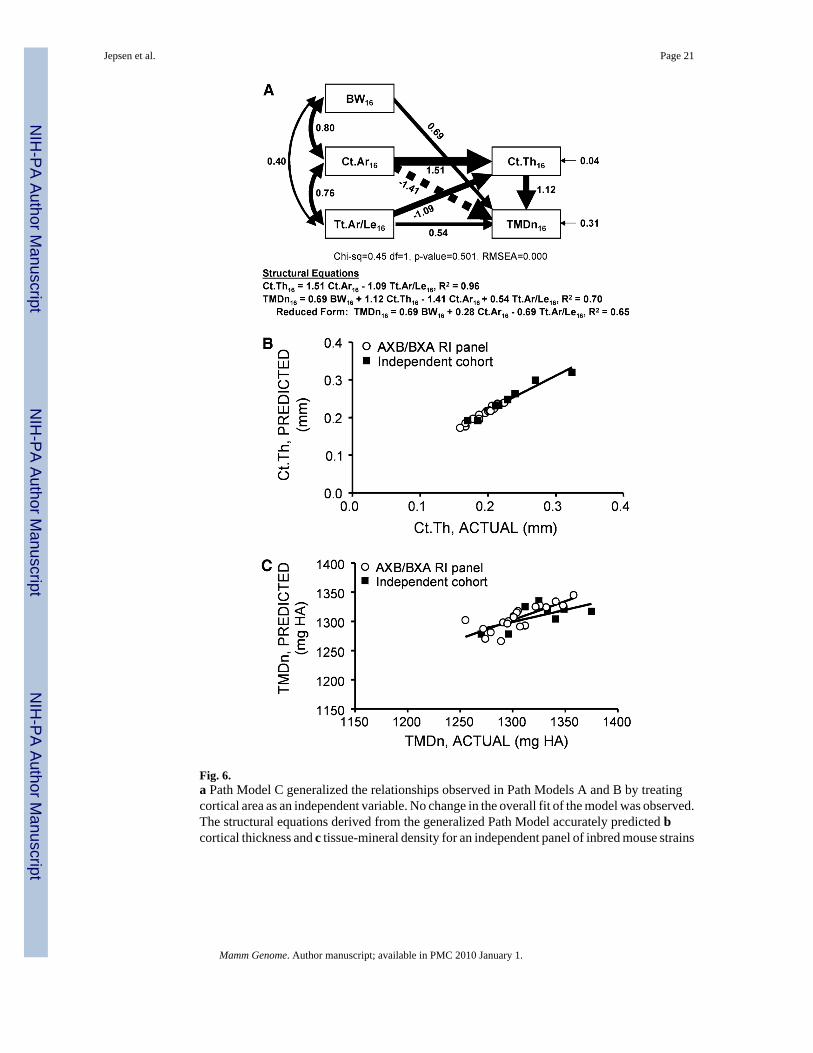
Fig. 6.a Path Model C generalized the relationships observed in Path Models A and B by treatingcortical area as an independent variable. No change in the overall fit of the model was observed.The structural equations derived from the generalized Path Model accurately predicted bcortical thickness and c tissue-mineral density for an independent panel of inbred mouse strains
Jepsen et al. Page 21
Mamm Genome. Author manuscript; available in PMC 2010 January 1.
NIH
-PA Author Manuscript
NIH
-PA Author Manuscript
NIH
-PA Author Manuscript
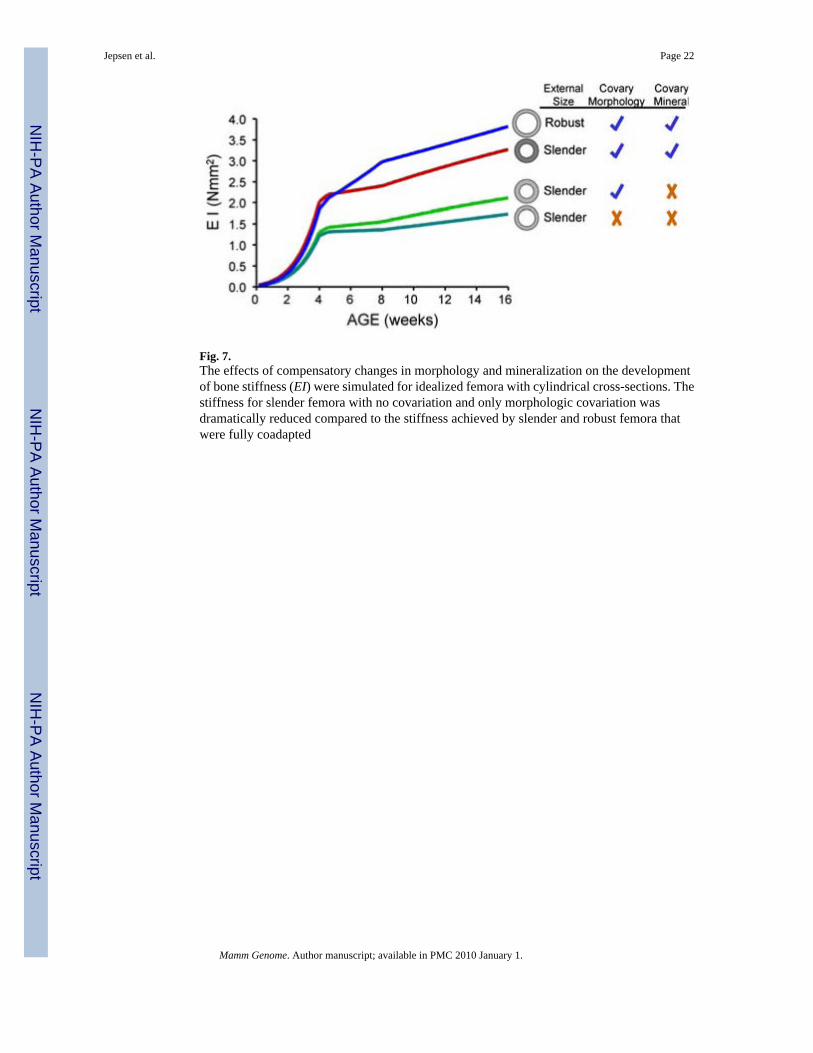
Fig. 7.The effects of compensatory changes in morphology and mineralization on the developmentof bone stiffness (EI) were simulated for idealized femora with cylindrical cross-sections. Thestiffness for slender femora with no covariation and only morphologic covariation wasdramatically reduced compared to the stiffness achieved by slender and robust femora thatwere fully coadapted
Jepsen et al. Page 22
Mamm Genome. Author manuscript; available in PMC 2010 January 1.
NIH
-PA Author Manuscript
NIH
-PA Author Manuscript
NIH
-PA Author Manuscript
NIH
-PA Author Manuscript
NIH
-PA Author Manuscript
NIH
-PA Author Manuscript
Jepsen et al. Page 23Ta
ble
1C
orre
latio
n co
effic
ient
s am
ong
traits
at 1
day
and
4, 8
, and
16
wee
ks o
f age
BW
Le
Tt.A
rM
a.A
rC
t.Ar
JoC
t.Th
Tt.A
r/L
e
1 da
y
BW
ND
ND
ND
ND
ND
ND
ND
ND
LeN
DN
DN
DN
DN
DN
DN
D
Tt.A
r0.
550.
890.
790.
960.
37N
D
Ma.
Ar
0.46
0.42
0.75
-0.0
9N
D
Ct.A
r0.
410.
900.
85N
D
Jo0.
570.
55N
D
Ct.T
h0.
30N
D
Tt.A
r/Le
ND
4 w
eeks
BW
0.60
0.87
0.61
0.57
0.60
0.59
0.39
0.40
Le0.
630.
610.
510.
710.
640.
630.
36
Tt.A
r0.
760.
970.
910.
980.
570.
96
Ma.
Ar
0.75
0.79
0.92
0.37
0.96
Ct.A
r0.
660.
960.
840.
81
Jo0.
720.
680.
92
Ct.T
h0.
390.
44
Tt.A
r/Le
0.78
8 w
eeks
BW
0.70
0.79
0.61
0.47
0.77
0.65
0.54
0.48
Le0.
690.
590.
460.
750.
640.
420.
41
Tt.A
r0.
840.
970.
920.
990.
460.
98
Ma.
Ar
0.80
0.80
0.94
0.29
0.98
Ct.A
r0.
770.
950.
710.
84
Jo0.
810.
550.
95
Ct.T
h0.
470.
41
Tt.A
r/Le
0.86
16 w
eeks
BW
0.73
0.81
0.56
0.33
0.80
0.61
0.75
0.40
Le0.
730.
520.
310.
750.
590.
720.
31
Mamm Genome. Author manuscript; available in PMC 2010 January 1.
NIH
-PA Author Manuscript
NIH
-PA Author Manuscript
NIH
-PA Author Manuscript
Jepsen et al. Page 24
BW
Le
Tt.A
rM
a.A
rC
t.Ar
JoC
t.Th
Tt.A
r/L
e
Tt.A
r0.
920.
950.
870.
990.
210.
97
Ma.
Ar
0.94
0.67
0.90
-0.1
00.
97
Ct.A
r0.
830.
920.
680.
76
Jo0.
890.
310.
94
Ct.T
h0.
770.
06
Tt.A
r/Le
0.94
Nar
row
sens
e he
ritab
ility
(h2 )
show
n on
the
diag
onal
(all
h2 v
alue
s are
sign
ifica
nt, p
< 0
.000
1). B
old
corr
elat
ions
(R >
0.6
6) in
dica
te si
gnifi
canc
e at
p <
0.0
5. N
D n
ot d
eter
min
ed
Mamm Genome. Author manuscript; available in PMC 2010 January 1.