
ARMY ENGINEER WATERWAYS EXPERIMENT STATION VtCKS8UG … · 9. A typical retaining wall of floodwall...
112
A-A113 629 ARMY ENGINEER WATERWAYS EXPERIMENT STATION VtCKS8UG-ETC F/G 13/13 X STRENGTN DESIGN OF REINFORCED CONCRETE HYDRAULIC STRUCTUREUP RE--ETC CU) UNCLASSIFIED WES/TR/SL8O-4 M
Transcript of ARMY ENGINEER WATERWAYS EXPERIMENT STATION VtCKS8UG … · 9. A typical retaining wall of floodwall...

A-A113 629 ARMY ENGINEER WATERWAYS EXPERIMENT STATION VtCKS8UG-ETC F/G 13/13 XSTRENGTN DESIGN OF REINFORCED CONCRETE HYDRAULIC STRUCTUREUP RE--ETC CU)
UNCLASSIFIED WES/TR/SL8O-4 M

3mmw -~TECHNICAL REPORT SL-80-4
A STRENGTH DESIGN OF REINFORCEDCONCRETE HYDRAULIC STRUCTURES
Report 3
T-WALL DE-SIGNby
Tony C. Liu
Structures LaboratoryU. S. Army Engineer Waterways Experiment Station
P. 0. Box 631, Vicksburg, Miss. 39180
January 1982Report 3 of a Series
Approved For Public Release; Distuibution Unlimited
Prepared for Office, Chief of Engineers, U. S. ArmyWashington, D. C. 20314
Under CWIS 31623 AI
'40 11 009

Destroy this report when no longer needed. Do not returnit to the originator.
The findings in this report are not to be construed as an officialDepartment of the Army position unless so designated.
by other authorized documents.
The contents of this report are not to be used foradvertising, publication, or promotional purposes.Citation of trade names does not constitute anofficial endorsement or approval of the use of
such commercial products.

UnclassitiedSECURITY CLASSIFICATION OF THIS PAGE (fWert Dct Entered)
READ DESTRUCnONSREPORT DOCUMENTATION PAGE BEFORE COMPLETING FORM
I. REPORT NUMBER 2 GOVT ACCESSION NO. 3. RECIPIENT'S CATALOG NUMBERTechnical Report SL-80-4 . /..
4. TITLE (and 5"btttle) S. TYPE OF REPORT & PERIOD COVERED
STRENGTH DESIGN OF REINFORCED CONCRETE Report 3 of a seriesHYDRAULIC STRUCTURES; Report 3,
T-WALL DESIGN 6. PERFORMING ORG. REPORT NUMBER
7. AUTHOR(q) 8. CONTRACT OR GRANT NUMBER(s)
Tony C. Liu
S. PERFORMING ORGANIZATION NAME AND ADDRESS 10. PROGRAM ELEMENT. PROJECT. TASK
U. S. Army Engineer Waterways Experiment Station AREA & WORK UNIT NUMBERS
Structures Laboratory
P. 0. Box 631, Vicksburg, Miss. 39180 CWIS 31623
II. CONTROLLING OFFICE NAME AND ADDRESS 12. REPORT DATE
Office, Chief of Engineers, U. S. Army January 1982
Washington, D. C. 20314 IS. NUMBEROF PAGES105
14. MONITORING AGENCY NAME & ADDRESS(If dilferent A. CofntollLM Office) 15. SECURITY CLASS. (of this report)
Unclassified
ISa. DECLASSIFICATION/DOWNGRADINGSCHEDULE
16. DISTRIBUTION STATEMENT (of thli Report)
Approved for public release; distribution unlimited.
17. DISTRIBUTION STATEMENT (of the abstract entered In Block 20, It different bohm Report) . 2,1
18. SUPPLEMENTARY NOTES
Available from National Technical Information Service, 5285 Port Royal Road,
Springfield, Va. 22151.
IS. KEY WORDS (Continue on reverse ide f neoo.er.y and Identify by block number)Design criteria
Flood wallsHydraulic structuresReinforced concrete
Retaining walls20. ABBTRACT C -m rev ers W nemm~eiy and Idenfly by block mmber)
'This report covers the specific strength design criteria and strength de-
sign procedures for inverted T-walls used as retaining walls or flood wallsfounded on earth or rock. Among the subjects covered are: applicable loads andforces; loading combinations; base reaction; design strength for reinforcement;
distribution of flexural reinforcement; control of deflections; shrinkage and
temperature reinforcement; concrete cover for reinforcement; details of
(Continued)
DD I 1473 EDITIONOF I OVSSISOBSOLETE Unclassified
SECUIhTY CLASSIFICATION OF THIS PAGE (When Dte Entered)
, - &7I-II--1-f-.bb

UnclassifiedSIECURITY CLASSIFICATION OP THIS PAOGtSIW. D. Rate,**
20. ABSTRACT (Continued).
reinforcement; maximum tension reinforcement; minimum reinforcement of flexuralmembers; combined flexure and axial loads; faceyhred shear force; shear strengthof walls; design of structural components; and design examples. A commentarydiscussing the considerations and background information used in developing thestrength design criteria is also included.
AC968sion For
STIS GQM&IDTIC TAB
Dist
DTIO15
INSPcTEDUnclassified
SECURtITY CLASSIFICATION OF THIS PAGE(UW,.n Data Entered)
PREFACE
The study reported herein was conducted in the Structures Labora-
tory (SL), U. S. Army Engineer Waterways Experiment Station (WES), under
the sponsorship of the Office, Chief of Engineers (OCE), U. S. Army, as
a part of Civil Works Investigation Work Unit 31623. Mr. Donald R.
Dressler of the Structures Branch, Engineering Division, OCE, served as
technical monitor.
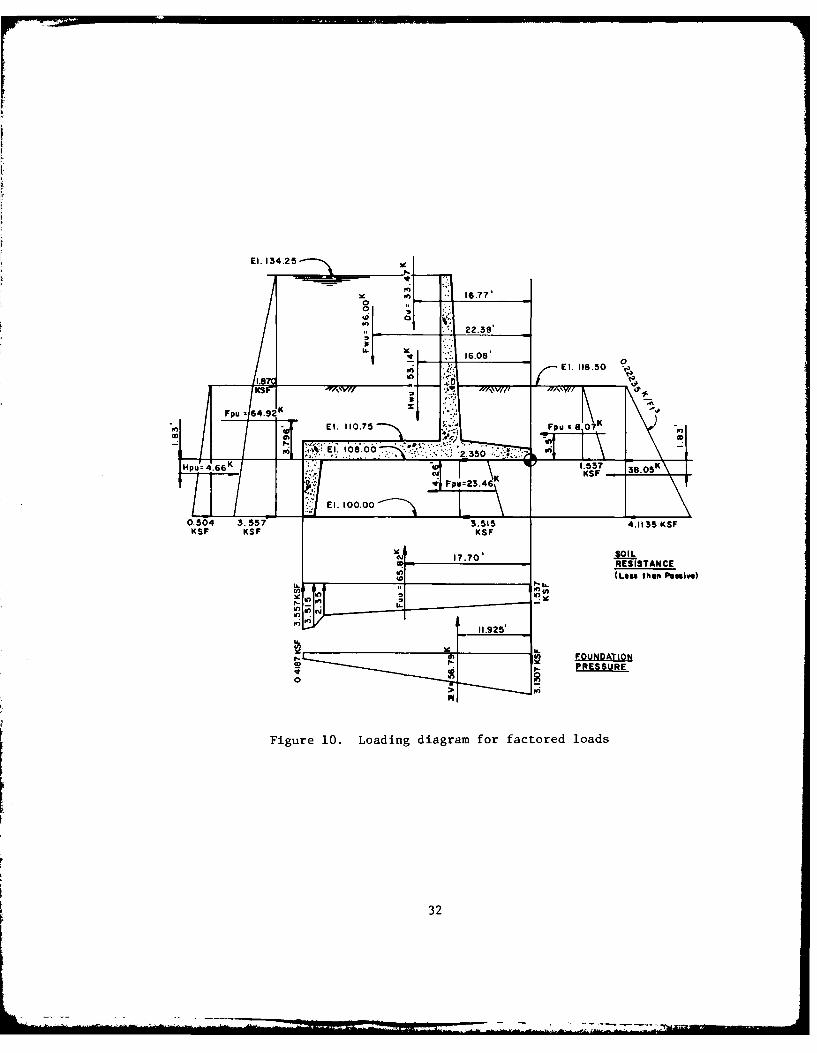
This study was conducted during the period October 1979 to Septem-
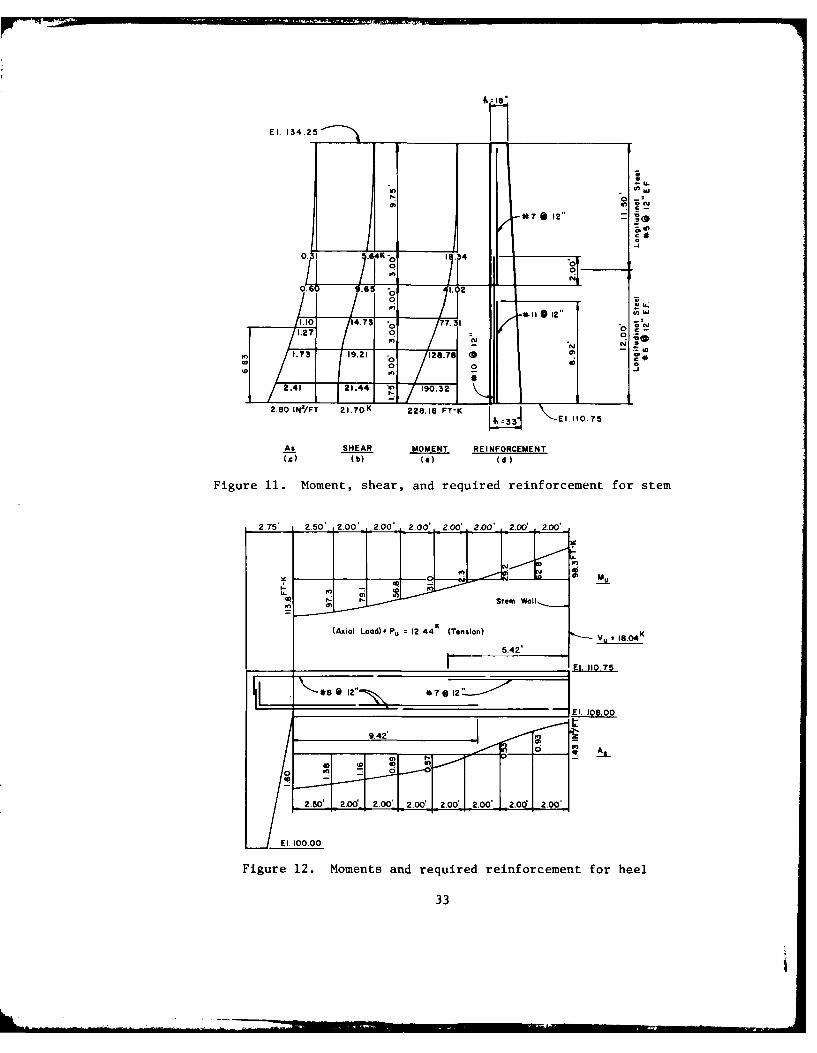
ber 1980 under the general supervision of Messrs. Bryant Hather, Chief,
SL, and John Scanlon, Chief, Concrete Technology Division, SL. This
study was conducted and the report was prepared by Dr. Tony C. Liu, SL.
The assistance and cooperation of many persons were instrumental
in the successful completion of this study. Particular thanks are due
Mr. Scott Gleason of the U. S. Army Engineer District, Tulsa, for prepar-
ing design examples presented in Part IV of this report. The author also
wishes to acknowledge Mr. Dressler, OCE; Professor Phil M. Ferguson,
University.of Texas at Austin; Mr. Ervell A. Staab, Missouri River Divi-
sion; Mr. Chester F. Berryhill, Southwestern Division; Mr. V. M.
Agostinelli, Lower Mississippi Valley Division; Mr. Garland E. Young,
Fort Worth District; Mr. Marion M. Harter, Kansas City District; and
Mr. William A. Price, Dr. Paul Mlakar, and Dr. N. Radhakrishnan, WES,
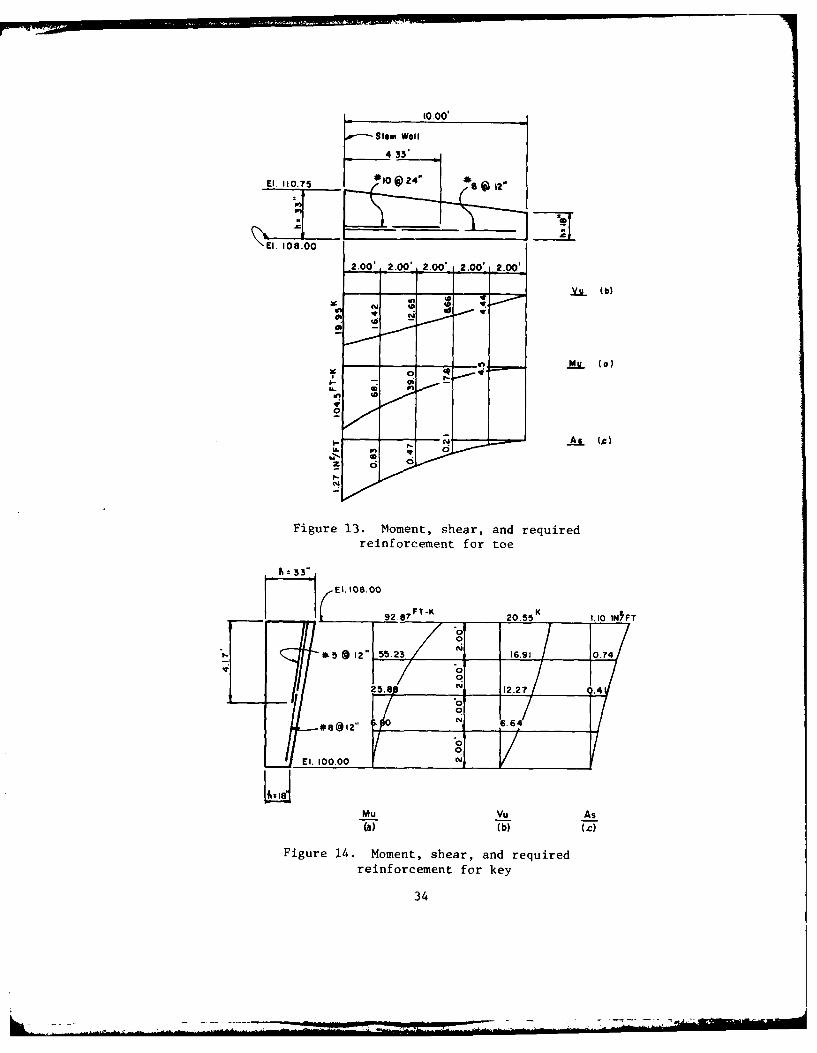
for their critical review of the manuscript.
The Commanders and Directors of WES during this study and the prepa-
ration and publication of this report were COL Nelson P. Conover, CE,
and COL Tilford C. Creel, CE. The Technical Director was Mr. F. R.
Brown.
1-
CONTENTS
Page
PREFACE................................1
CONVERSION FACTORS, INCH-POUND TO METRIC (SI)UNITS OF MEASUREMENT...........................4
PART I: INTRODUCTION............................5
Objective. .... ........................ 5Scope. .... .......................... 5
PART II: STRENGTH DESIGN CRITERIA ... ............... 7
Introduction ... ........................ 7General Design Criteria. .... ................ 7Loads and Forces ..... .................... 7Strength Requirement. ..................... 10Serviceability Requirement. .................. 12Flexure and Axial Loads .. ................... 13Shear Strength Requirements .. ................. 19
PART III: STRUCTURAL DESIGN. ..................... 20
General .. .................... ....... 20Design of Structural Components .. ............... 20
PART IV: DESIGN EXAMPLES .. ...................... 22
Retaining Wall Design .. ..................... 22Floodwall Design. ........................ 28
REFERENCES .. ............................ 42
APPENDIX A: COMMENTARY .. ....................... Al
Introduction. ...................... ... AlGeneral Design Criteria .. ................... AlLoads and Forces. ........................ AlStrength Requirements .. .................... A5Serviceability Requirement. .................. A8Flexure and Axial Load ..... ................ A10Shear Strength Requirement ..... ............. A21
TABLE Al
APPENDIX B: EFFECT OF FACTORED LOADS ON BASE REACTIONS ANDFORCES AT CRITICAL SECTIONS. .............. Bl
Structural Data .. ........................ BlLoad Cases. ...................... .... BIMethod of Analysis. ....................... B4Results. .... ........................ B5
TABLES Bl-B12
APPENDIX C: DESIGN METHODS FOR CRACK CONTROL .. ........... Cl
Introduction. ...................... ... ClCracking Mechanism. ....................... ClCrack Widths and Corrosion. ................... C6
2

Page
Current Design Methods for Crack Control .. .. ........ C13Conclusions. .. ............ ............ C22
E APPENDIX D: DERIVATION OF FACTOR aM...............................Dl
Derivation of General Equations .. ............... DlDerivation of OM for cM - 0.0015...............D4Derivation of 0 for f' > 4000 psi .. ............ D5Mc
3
..... .. .......

CONVERSION FACTORS, INCH-POUND TO METRIC (SI)UNITS OF MEASUREMENT
Inch-pound units of measurement used in this report can be converted
to metric (SI) units as follows:
Multiply By To Obtain
feet 0.3048 metres
inches 25.4 millimetres
kips (force) 4448.222 newtons
kips (force) per foot 1459.3904 newtons per metre
kips (force) per inch 175126.8 newtons per metre
kips (force) per square foot 47.88026 kilopascals
kips (force) per square inch 6.894757 megapascals
kips (force)-feet 1355.818 newton-metres
kips (force)-inches 112.9848 newton-metres
pounds (force) 4.448222 newtons
pounds (force) per square foot 47.88026 pascals
pounds (force) per square inch 0.006894757 megapascals
pounds (mass) per cubic foot 16.01846 kilograms per cubicmetre
square inches 6.4516 square centimetres
4
STRENGTH DESIGN OF REINFORCED CONCRETE
HYDRAULIC STRUCTURES
T-WALL DESIGN
PART I: INTRODUCTION
Objective
1. The development of strength design methods for reinforced con-
crete hydraulic structures was initiated in October 1978 at the U. S.
Army Engineer Waterways Experiment Station (WES). The overall objective
of this study is to develop a realistic strength design methodology for
reinforced concrete hydraulic structures and to devise an accurate and
efficient design procedure for implementing these strength design
methods.
2. The first phase of this study was to develop preliminary
strength design criteria that would yield designs (i.e., member dimen-
sions, reinforcements, etc.) that are equivalent to those designed by
the working-stress method for hydraulic structures. The results of this
first phase study were published in Report I (Liu 1980).
3. The second phase of this study is to develop strength design
methodology and practical design procedures that account for the special
loading and service characteristics of retaining walls and floodwalls.
The results of this phase are reported herein.
Scope
4. This report covers the specific strength design criteria and
strength design procedures for inverted T-walls used as reinforced con-
crete retaining walls or floodwalls founded on earth or rock. Various
types of inverted T-walls used as retaining walls and floodwalls are
shown in Figure 1.
5. This report does not establish the requirements of structural
5
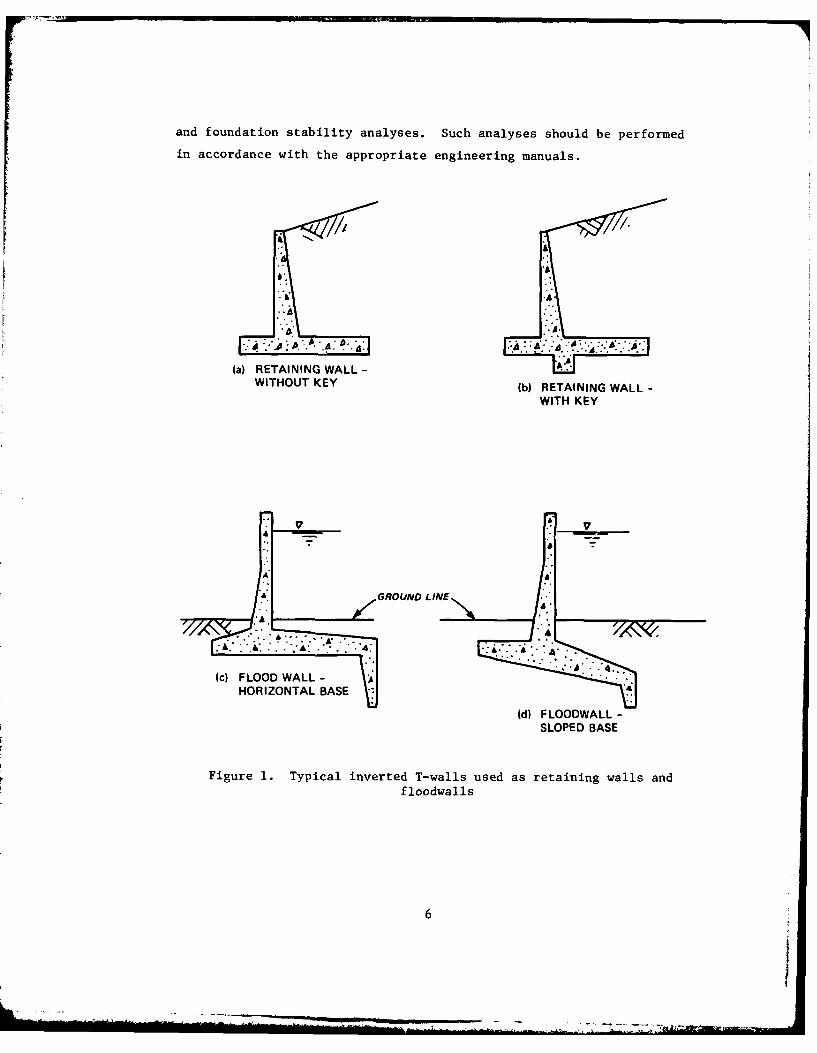
and foundation stability analyses. Such analyses should be performed
in accordance with the appropriate engineering manuals.
.C
F-77" A. *.'k .A: .,. A
(a) RETAINING WALL -
WITHOUT KEY (b) RETAINING WALL -
WITH KEY
A*
'A'
(c) FLOOD WALL -
HORIZONTAL BASE
(d) FLOODWALL-SLOPED BASE
Figure 1. Typical inverted T-walls used as retaining walls andfloodwalls
6=
PART II: STRENGTH DESIGN CRITERIA
Introduction
6. The strength design criteria for inverted T-walls used as re-
inforced concrete retaining walls or floodwalls are defined in the fol-
lowing paragraphs. The considerations and background information used
in developing these criteria are given in Appendix A.
General Design Criteria
7. The reinforced concrete inverted T-walls used as retaining
walls or floodwalls should be designed by the strength design method in
accordance with the current "Building Code Requirements for Reinforced
Concrete," ACI 318-77 (American Concrete Institute 1977) except as here-
inafter specified.
8. The notations used are the same as those used in ACI 318-77,
except those defined in this report.
Loads and Forces
9. A typical retaining wall of floodwall should be designed to
resist the following applicable loads and forces: dead load, vertical
earth pressure, lateral earth pressure, vertical water pressure, lateral
water and seepage pressure, uplift force, wind load, wave action, sur-
charge load, earthquake load, and other structural effects of differ-
ential settlement, creep, shrinkage, and temperature change.
Dead load (D)
10. The dead load should consist of the weight of the wall. The
resultant of this weight acts through the center of gravity of the
structure. The unit weight of reinforced concrete may be assumed to be
150 lb/ft 3 * in computing the dead load.
* A table of factors for converting inch-pound units of measurements to
metric (SI) units is presented on page 4.
7
Vertical earth pressure (HW)
11. The vertical earth pressure on a horizontal plane should be
considered to be equal to the depth of the plane below the ground sur-
face multiplied by the average unit weight of the soil. Because of
the buoyant effect of the water on the soil particles, the weight of the
submerged soil should be reduced by an amount equal to the weight of the
water displaced by the soil particles.
Lateral earth pressure (Hp )
12. Active earth pressure. Walls that will rotate or translate
outward during backfilling should be designed for active earth pressures.
In general, inverted T-walls used as retaining walls or floodwalls on
soil foundations can be designed for active pressures, whereas walls on
unyielding foundations such as rock or end-bearing piles should be de-
signed for at-rest earth pressures. However, the stem of a T-wall on an
unyielding foundation may have sufficient flexibility to allow the re-
quired wall movement to occur.
13. For the purposes of design, Coulomb's theory given in EM 1110-
2-2502 (U. S. Army, Office, Chief of Engineers 1961) should be used to
predict the active earth pressures that are likely to occur. For more
complicated multiple-layer soil systems, the incremental trial wedge
method (U. S. Army, Office, Chief of Engineers 1979) may be used.
14. At-rest earth pressure. Walls which cannot move sufficiently
to develop active earth pressures should be designed for at-rest earth
pressures. Because the at-rest pressures can often be 50 to 100 percent
greater than the corresponding active pressures for a given soil, it is
important to make the appropriate choice of type of pressure for design.
15. The design guidance given in EM 1110-2-2502 may be used for
estimating at-rest earth pressures for design purposes. Other methods
may also be used when appropriate.
16. Passive earth pressures. The passive earth pressures should
be calculated in accordance with EM 1110-2-2502. However, because of
its uncertain nature, passive earth pressures should be disregarded when
8

other more positive means of resistance are available.
17. Location of resultant lateral pressure. Unless special con-
ditions warrant a detailed and comprehensive analysis of the wall, the
locations of resultant lateral earth pressure specified in EM 1110-2-
2502 should be used.
Vertical water pressure (F )
18. The vertical water pressure on a horizontal plane should be
considered to be equal to the depth of the plane below the water sur-
face multiplied by 62.5 lb/ft3
Lateral water andseepage pressure (F )
19. For a retaining wall with a permeable backfill and no drain-
age system provided in the back of the wall, full hydrostatic pressure
should be used. In the case of a floodwall or a retaining wall with a
drainage system, the lateral water pressure should be determined by
either creep method or flow net method as described in EM 1110-2-2501
(U. S. Army, Office, Chief of Engineers 1948).
20. Water may enter cracks that develop in cohesive soil from
the surface downward due to skrinkage and stress conditions. Full hydro-
static pressure should be used if such water is adjacent to the back of
a wall.
Uplift (F )
21. The uplift should be assumed to act over 100 percent of the
base area. For walls on rock, the uplift should be assumed to vary uni-
formly from the water pressure at the heel to that at the toe of the
wall. Uplift pressures for walls resting on soil should be determined
by creep method or flow net method. Uplift pressure should be computed
assuming no creep loss for the portion of the foundation not in
compression.
Wind load (W)
22. When retaining walls are constructed in an exposed location,
wind loads should be considered during construction and prior to

backfill. For floodwalls, wind loads should be considered throughout
the entire life of the structure. The wind load forces per square foot
of the exposed area specified in EM 1110-2-2502 and EM 1110-2-2501
should be used for retaining walls and floodwalls, respectively.
Wave action (p)
23. Floodwalls that are subjected to the wave action should be
designed to resist the forces induced thereby. The wave forces on a
wall may be calculated in accordance with U. S. Army Coastal Engineer-
ing Research Center (1973).
Surcharge loads (SL)
24. A retaining wall may be required to carry additional loads
on the surface of~the backfill. The effect of these surcharge loads
should be taken into account in accordance with EM 1110-2-2502.
Earthquake loads (E)
25. When a wall is to be built in a region where an earthquake
may be anticipated, earthquake loads should be provided for in the de-
sign. The seismic coefficient method as described in EM 1110-2-2502
should generally be used for estimating earthquake forces.
26. When a wall is used as part of a dam and failure of the wall
could result in loss of life or extensive property damage, the earth-
quake forces should be determined in accordance with ER 1110-2-1806
(U. S. Army, Office, Chief of Engineers 1977).
Other structural effects (T)
27. When structural effects of differential settlement, creep,
shrinkage, or temperature change may be significant, they should be con-
sidered in the design. Estimations of differential settlement, creep,
shrinkage, or temperature change should be based on a realistic assess-
ment of such effect occurring in service.
Strength Requirement
Required strength
28. Reinforced concrete retaining walls or floodwalls should be
10

designed to have design strengths in all sections at least equal to the
required strengths calculated for the factored loads and forces in the
following combinations that are applicable:
U = 1.5D + 1.9(Hw + Hp + F + F + F + SL) (1)
U = 0.9D + 1.9(H w + H + F + F + F) (2)w p w p u
U = 0.9D + 1.9W (3)
U = 0.75[l.5D + 1.9(Hw + Hp + F + F + F + SL + W + P)] (4)w p w p u L
U = 0.75[l.5D + 1.9(Hw + H + F + F + F + SL + E)] (5)w p w p u L
U = 0.75[l.5(D + T) + 1.9(H w + Hp + F +u S (6)
Base reaction
29. For strength design of wall footings, the base reactions in-
duced by the applied "factored" loads should be used.
30. The stability analyses should be performed based on "unfac-
tored" loads.
Design strength for reinforcement
31. Except for calculating development length, design should be
based on yield strengths of reinforcement of 40,000 and 48,000 psi for
for ASTM Grade 40 and Grade 60 steels, respectively. The reinforcement
with yield strength in excess of Grade 60 should not be used, except for
prestressing tendons. The yield strength of reinforcement of 40,000 and
60,000 psi should be used for calculating development length for ASTM
Grade 40 and Grade 60 steels, respectively.
For a wall with a key, alternate earth pressure distributions as de-
fined in paragraph S-21 of EM 1110-2-2501 should be investigated forbase and key designs.
11
Serviceability Requirement
Distribution offlexural reinforcement
32. The spacing of flexural tension reinforcement generally
should not exceed 18 in. for Grade 40 steels. When design yield
strength for tension reinforcement exceeds 40,000 psi, the spacing
of flexural tension reinforcement generally should not exceed
12 in.
33. The spacing of flexural tension reinforcement exceeding
the limit specified in paragraph 32 may be used if it can be
justified in terms of flexural cracking and serviceability
requirements.
Control of deflections
34. Deflections at service loads need not be computed if
the limit of reinforcement ratio specified in paragraph 39 is not
exceeded.
35. For a reinforcement ratio exceeding the limit specified
in paragraph 39, deflections at service loads should be computed in
accordance with ACT 318-77, or other methods that predict deflec-
tions in substantial agreement with the results of comprehensive
tests.
Shrinkage and
temperature reinforcement
36. The area of shrinkage and temperature reinforcement in
each direction should not be less than 0.1 percent of the gross cross-
sectional area up to a maximum of No. 6 bars spaced 12 in. center-to-
center in the exposed face, and only horizontal spacer bars in the back-
filled face are required. Where temperature variations are extreme or
where there is unusual restraint of the wall against horizontal shrink-
age, the reinforcement requirement specified in EM 1110-2-2103 (U. S.
Army, Office, Chief of Engineers 1971) should be followed.
Concrete cover for reinforcement
37. The following minimum concrete clear cover should be provided
for principal reinforcement.
12

Minimum ClearLocation Cover, in.
Stem 3Base, top face 3Base, bottom face 4Key 3
Details of reinforcement
38. Bending and splicing of reinforcement and minimum reinforce-
ment spacing for walls should be in accordance with the requirements
specified in EM 1110-2-2103.
Flexure and Axial Loads
Maximum tension reinforcement
39. For flexural members, and for members subjected to combined
flexure and compressive axial load when the design axial load strength
CFP s lss tan .l~fA ,the ratio of tension reinforcement pnP i esta c.0'ggenerally should not exceed 0.25 pb 9 where pbis the reinforcement
ratio producing balanced strain conditions as specified in ACI 318-77.
40. Reinforcement ratios exceeding the limits specified in para-
graph 39 but less than 0.5 0p b may be used if deflections are shown not
to exceed the limit given in paragraph 35.
41. Reinforcement ratios in-excess of 0.50p shall not be used
unless a detailed investigation of serviceability requirements, includ-
ing computation of deflections, is conducted in consultation with higher
authority.
Minimum reinforce-
ment of flexural members
42. At any section of a wall where tension reinforcement is re-
quired by analysis, the minimum reinforcement requirements specified in
ACI 318-77 shall apply except that the f shall be in accordance withy
paragraph 31.
Combined flexure and axial loads
43. Stems subjected to small compressive loads caused by the
weight of the concrete may be designed for the maximum factored moment
13
disregarding the axial load. For a wall with a key, the base slab
generally is subjected to a combined flexure and axial load and should
be designed in accordance with the following:
a. Design assumptions and general requirements.
(1) Maximum usable strain EC at extreme concrete com-pression fiber is assumed equal to 0.003. The allow-able strain eM at extreme concrete compressionfiber should be limited to 0.5EC for hydraulic
structures.
(2) Balanced conditions exist at a cross section when thetension reinforcement reaches the strain correspond-ing to its specified yield strength fy just as con-crete in compression reaches its assumed allowablestrain M .
(3) Concrete stress of 0.85 f' should be assumed uni-
formly distributed over anCequivalent compressionzone bounded by edges of the cross section and astraight line located parallel to the neutral axisat a distance a = B C from the fiber of maximumcompressive strain. M
(4) Factor BM should be taken as 0.55 for concretestrengths fc up to and including 4000 psi. Forstrengths above 4000 psi, aM should be reduced con-tinuously at a rate of 0.05 for each 1000 psi ofstrength in excess of 4000 psi, but aM should notbe taken less than 0.50.
(5) The eccentricity ratio e'/d should be defined as
M
d d
where
e' is the eccentricity of axial load measuredfrom the centroid of the tensionreinforcement
P is considered positive for compression andu negative for tension
b. Flexural and compression capacity--tension reinforcementonly.
(1) The design axial load strength OPn of compressionmembers should not be taken greater than thefollowing:
14
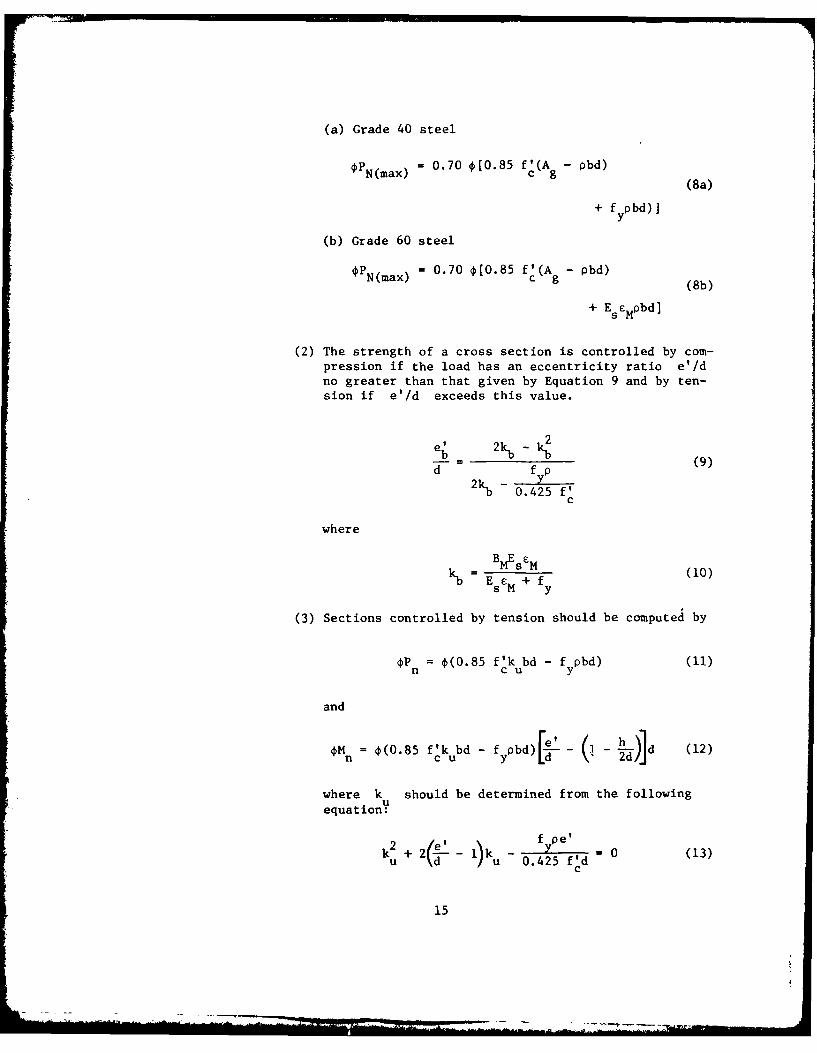
(a) Grade 40 steel
OP N(max) = 0.70 0[0.85 f'(A - pbd)
(8a)
+ f ypbd)]
(b) Grade 60 steel
PNtmax) i= 0.70 [0.85 f'c(Ag - pbd)~N~ma) ~ g(8b)
+ Es E Mpbd]
(2) The strength of a cross section is controlled by com-pression if the load has an eccentricity ratio e'/dno greater than that given by Equation 9 and by ten-sion if e'/d exceeds this value.
2d b ____f___(9)
dfyp2 kb - 0.425 f'
where
BMEstM
k BM~s'M(10)b E s;M + fy
(3) Sections controlled by tension should be computed by
P = *(0.85 f'k bd - f pbd) (11)n c u y
and
=M 0(0.85 f'k bd - fypbd)[- e- d (12)
where k should be determined from the following
equation:
2f pe'k + 2 T _ 1)k -i- - (130u + d - ,u 0.425 f'dc
15
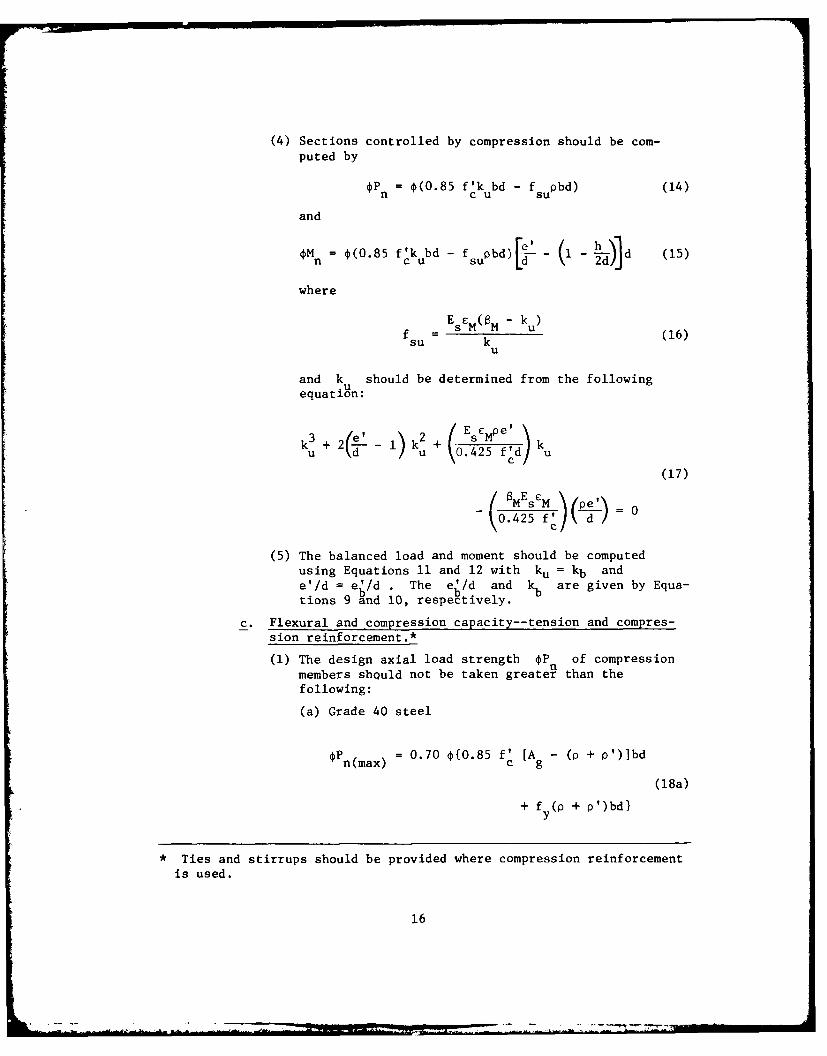
(4) Sections controlled by compression should be com-
puted by
Pn = 1(0.85 f'k ubd - fsupbd) (14)
and
Mn =(0.85 fk ubd - fsupbd) [ - i-)d (15)
where
EseM(BM - ku)
f s cM UM -ku (16)su k
U
and k should be determined from the following
equation:
3 2(!! 1)~ k' + s( EsMpe' k
U d u U0.425f'd(17)
' MEsCM p
(5) The balanced load and moment should be computed
using Equations 11 and 12 with ku = kb ande'/d = e'/d . The e,/d and k are given by Equa-tions 9 and 10, respectively.
C. Flexural and compression capacity--tension and compres-
sion reinforcement.*
(1) The design axial load strength OP of compressionmembers should not be taken greater than thefollowing:
(a) Grade 40 steel
OFnmax) = 0.70 0{0.85 f' [A - (p + p')]bd
(18a)
+ fy (p + p')bd}
* Ties and stirrups should be provided where compression reinforcement
is used.
16
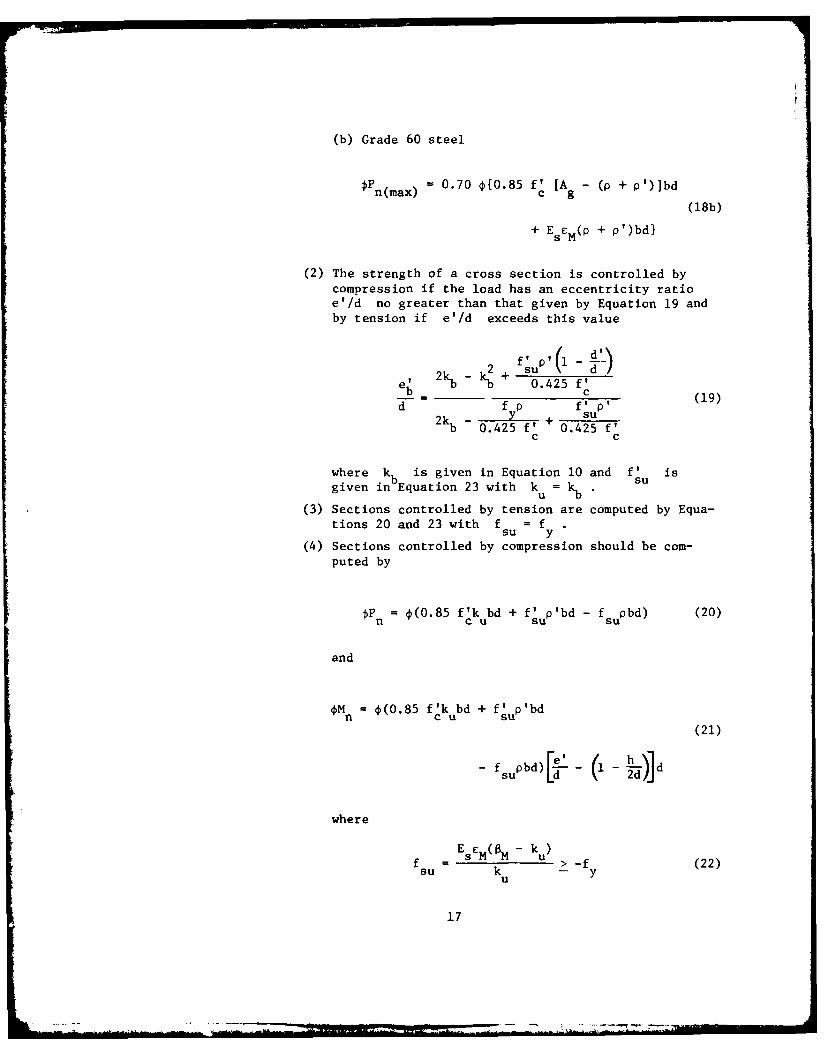
(b) Grade 60 steel
Pnmax) = 0.70 4{0.85 f' [A - (p + p')]bd
(18b)
+ E S M(p + p')bd}
(2) The strength of a cross section is controlled by
compression if the load has an eccentricity ratioe'/d no greater than that given by Equation 19 andby tension if e'/d exceeds this value
22 f up , (l i )
eb kb kb+ 0.425 f'b _ _ (19)
d f P f' p'2ky + sub 0.425 f' 0.425 f'
c c
where kb is given in Equation 10 and f' isgiven in Equation 23 with kk . su
(3) Sections controlled by tension are computed by Equa-tions 20 and 23 with f = f
su y(4) Sections controlled by compression should be com-
puted by
Pn = 0(0.85 f'kubd + f'up'bd - fsupbd) (20)
and
OM = 0(0.85 f'kubd + fsup'bdn cu SU
(21)
~f 1 Pbd)J~ el (d
where
Es£M( M - ku)f = > -f (22)su k - y
u
17
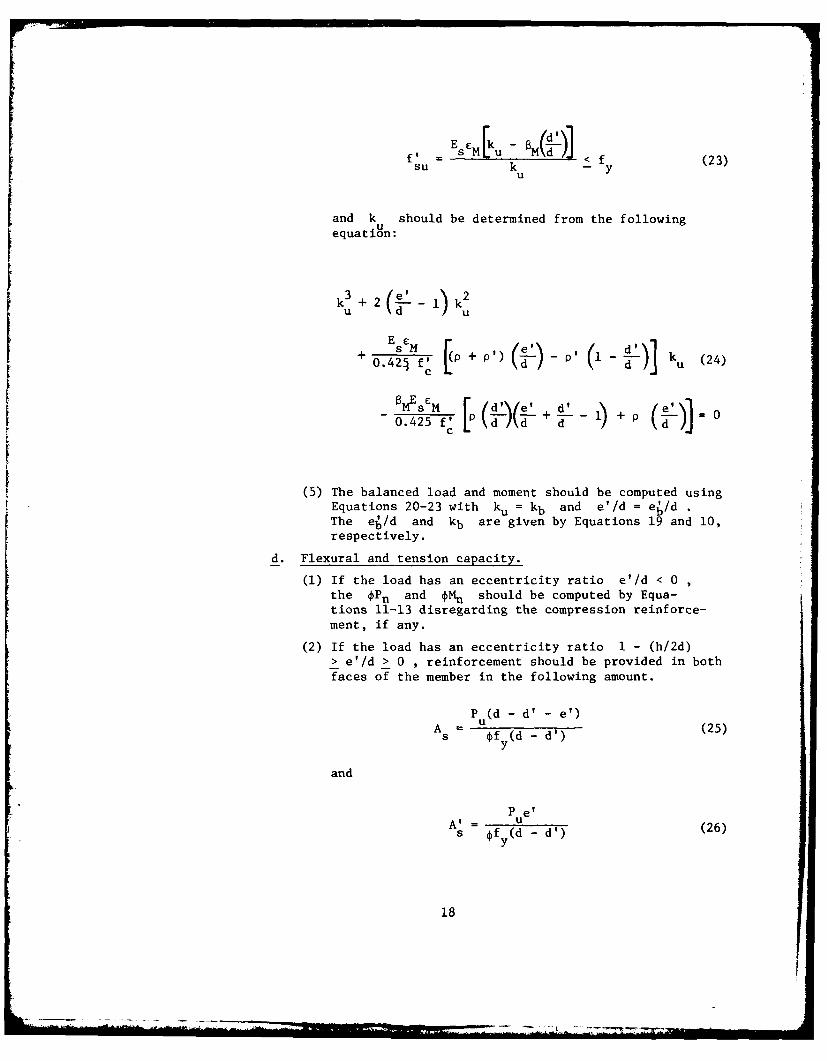
f1 = EsMu[k - 8M <f(l
su k (23)
and k should be determined from the followingUequation:
k 3+ 2 (e' 1 k 2u d u
+ 0.42 f'[PP + (p ) - p ' 1 - ku (24)
0.425 fV d--~- d- d
(5) The balanced load and moment should be computed usingEquations 20-23 with ku = kb and e'/d = eL/dThe e/d and kb are given by Equations 19 and 10,respectively.
d. Flexural and tension capacity.
(1) If the load has an eccentricity ratio e'/d < 0the *Pn and 4Mn should be computed by Equa-tions 11-13 disregarding the compression reinforce-ment, if any.
(2) If the load has an eccentricity ratio 1 - (h/2d)> e'/d > 0 , reinforcement should be provided in both
faces of the member in the following amount.
PuCd - d' - e')
A Us f y(d - d') (25)
and
P e'A' u(6
s f y(d - d') (26)
18
Shear Strength Requirements
Factored shear force
44. The maximum factored shear force should be computed at a dis-
tance d from the base of the stem for stem design, at a distance d
from the stem for toe design, at the face of the stem for heel design,
and at the base of the key for key design.
45. For L-walls without toes, the maximum factored shear force
should be computed at the base of the stem for stem design.
Shear strength of walls
46. The shear strength of walls should be designed in accordance
with ACI 318-77.
47. For keys or toes with a length-to-depth ratio of unit or less,
they should be designed as brackets. The special provisions for brackets
specified in ACI 318-77 should be followed.
19
PART III: STRUCTURAL DESIGN
General
48. After the tentative wall dimensions have been proved satis-
factory with respect to stability criteria specified in the appropriate
engineering manuals, the wall should be designed to provide adequate
structural strength using the strength design method specified in
Part II. For this purpose, the actual loads and pressures should be
multiplied by the appropriate load factors, and the resulting base reac-
tion and other resistances should be evaluated from these factored load-
ing conditions. After the factored loadings and corresponding reactions
have been determined, each component of the wall (i.e., stem, toe, heel,
or key) should be designed independently as a cantilever section carry-
ing all applied factored loads and reactions.
Design of Structural Components
Stem design
49. The stem should be designed as a vertical cantilever fixed at
the top of the base. The principal force acting on the stem is gener-
ally the lateral earth and water pressures. Thus, main reinforcement
should be placed at the back of the stem.
50. To facilitate concrete placement, the minimum top thickness
of the stem specified in EM 1110-2-2502 and EM 1110-2-2501 should be
followed for retaining walls and floodwalls, respectively.
Heel design
51. The heel should be designed as a cantilever fixed at the cen-
ter of the longitudinal stem reinforcement. The load on the heel is pre-
dominantly a downward load due to the weight of backfill or water on the
heel, and the reinforcement should be placed at the top of the heel
across the critical section. If the key is under the heel, the heel
should be designed for flexure, shear, and axial tension caused by pas-
sive pressure on the key.
20

Toe design
52. The toe should be designed as a cantilever fixed at the face
of the stem. The principal loading on the toe is the upward force due
to base reaction. The effect of axial compression due to horizontal
active earth pressure at the toe is generally small and may be neglected.
However, the horizontal passive earth pressure, if any, should not be
neglected.
Key design
53. A vertical key extending downward from the bottom of the heel
at the extreme end is generally required for floodwall design. It has
the dual function of reducing the uplift and increasing the resistance
against sliding. The key should be designed as a cantilever fixed at the
bottom of the base. The principal loading is the passive earth pressure
at the landside face of the key.
54. For retaining walls, a key should be required only if the
friction resistance between the bottom of the base and the soil is not
sufficient to prevent the wall from sliding. In general, only a limited
amount of depth into the soil is required.
Reinforcement in base and key
55. For a wall with a key, alternate loading criteria specified
in paragraph S-21 of EM 1110-2-2501 should be checked in determining
reinforcement in the base and key.
Stopping reinforcement in stem
56. The bending moment in the stem decreases rapidly with increas-
ing distance from the base. For this reason, only part of the main rein-
forcement is needed at higher elevations. The bar spacing and cutoff
points should be determined by using the design moment curve and in
accordance with the reinforcement development requirement of ACT 318-77.
Detailed procedure is given in the design examples presented in Part IV.
21

PART IV: DESIGN EXAMPLES
Retaining Wall Design
Design data
57. The retaining wall design data are:
Overall height = 25.00 ft
Unit weight of soil (moist) = 120 lb/ft3
Unit weight of soil (submerged) = 57.5 lb/ft3
Friction angle, soil-on-soil, 4 30'
Cohesion, C = 0
Backfill surface slope, B = +140
Saturation level (heel side), 13 ft above base
Top of ground and saturation (toe side), 5 ft above base
Specified concrete strength, f' = 3000 psiC
Specified steel yield strength, f = 40,000 psiY
Service loads and
structural dimensions
58. The service loads and structural dimensions resulting from
a stability analysis for one load case are shown in Figures 2 and 3,
respectively. The lateral earth pressure was determined by a wedge
analysis while lateral water pressure and uplift were determined by the
creep method. Lateral earth pressure on the toe side was assumed to be
at rest pressure. A coefficient of 0.4 was used for at rest pressure.
Factored loads
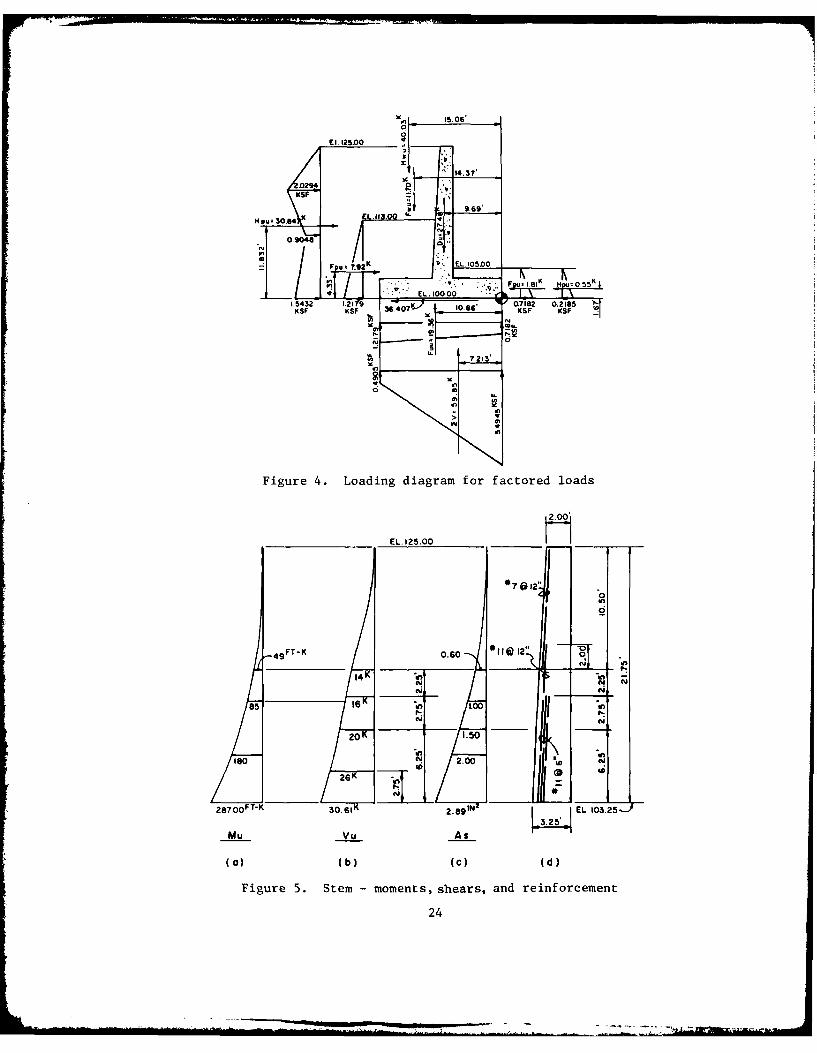
59. The loading diagrams and base reaction for the following
factored loads are shown in Figure 4.
U = 1.5D + 1.9(H W + Hp + FW + Fp + FU
The moments and shears used in the strength design were obtained from
these diagrams and are shown in Figures 5-7.
Stem design
60. The factored moments and shears for the stem are shown in
22

.08.00
0/680
K EL.113EL
Fq- 4 K E200 0 50
22
X IS 106,
E 1. 125.00
202944.37,
KSF
9,69'
HPu 30.64 K 1
0.19048u- .5
L 543 I :T . EL. 10000A
KSF KSF 36.407 10.6 KSF KSF5~
Figure 4. Loading diagram for factored loads
____________ EL. 125.00 M____
*7 0 12"
4 FT-K 116)1l2~<-
14 K 'i
85 16 LOO -o inN
20 1.50
-in 'inISO N4 2.00 N
26
287 .QQFTK 30-61 K 2.091N L EL. 103.2 5)
MU- Vu As ".5
(a) (b) (C) (d)
Figure 5. Stem -moments, shears, and reinforcement
24

CU
0 C
ww
0l-. E-
w 0$
o No
0 0 ) 4NL *6Z m
N= 0
a
@1 CU
0
255
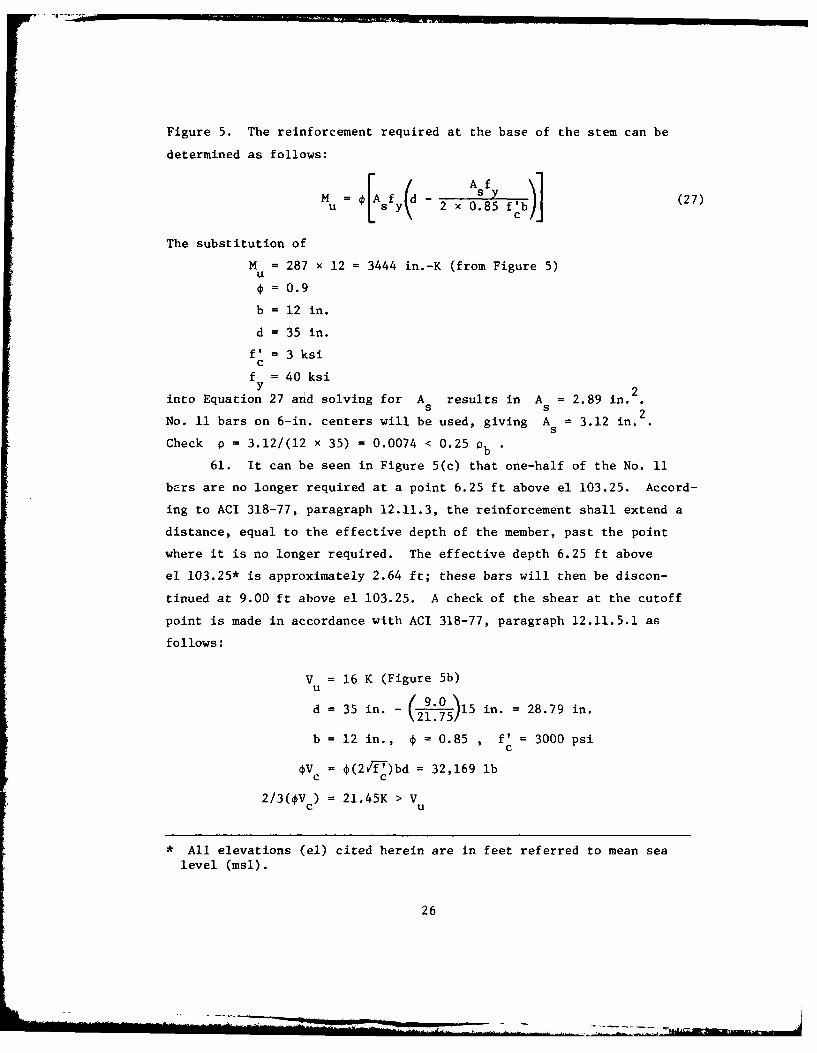
Figure 5. The reinforcement required at the base of the stem can be
determined as follows:
Af fdb)] (27)M sy( 2 x 0.85 V~
The substitution of
M = 287 x 12 3444 in.-K (from Figure 5)u0 = 0.9
b = 12 in.
d = 35 in.
V = 3 ksicf = 40 ksiY2
into Equation 27 and solving for A results in A = 2.89 in.2
No. 11 bars on 6-in. centers will be used, giving A = 3.12 in.
Check p = 3.12/(12 x 35) = 0.0074 < 0.25 b
61. It can be seen in Figure 5(c) that one-half of the No. 11
bars are no longer required at a point 6.25 ft above el 103.25. Accord-
ing to ACI 318-77, paragraph 12.11.3, the reinforcement shall extend a
distance, equal to the effective depth of the member, past the point
where it is no longer required. The effective depth 6.25 ft above
el 103.25* is approximately 2.64 ft; these bars will then be discon-
tinued at 9.00 ft above el 103.25. A check of the shear at the cutoff
point is made in accordance with ACI 318-77, paragraph 12.11.5.1 as
follows:
V = 16 K (Figure 5b)U
d = 35 in. - (2-.75)15 in. = 28.79 in.
b = 12 in., * = 0.85 , f' = 3000 psic
Vc = *(2IfT)bd = 32,169 lb
2/3(OV c ) = 21.45K > Vu
* All elevations (el) cited herein are in feet referred to mean sea
level (msl).
26

62. The required reinforcement and cutoffs for other points on
the stem are determined in the same manner.
63. No. 11 bars at 12 in. are no longer required at el 114.50.The distance these bars must extend above el 114.50 for proper lap with
No. 7 bars is determined according to ACI 318-77 as follows:
0.04 Aja. Basic Development Length = Y (paragraph 12.2.2)
c
- 0.04 x 0.6 x 40,000 = 17.53 in.
b. Modification Factor = 0.8 kd (paragraph 12.2.4)
= 0.8 x 17.53 = 14.02 in.c. Lap Length = 1.7 1d (paragraphs 12.16.1 and 12.16.2)
= 1.7 x 14.02 = 23.83 in. (24 in.)
64. The shear should be checked at a distance d = 2.75 ft above
el 103.25 as follows:
V = 2/f' bd = 2,73000 x 12 - 2.75 x 12 = 43,380 lbC c
V = 26 K (Figure 5b)U
OVc = 36.87 K > Vu
Heel design
65. The factored moments and shears for the heel are shown inFigure 6. The reinforcement in the top face of the stem should be de-
termined for the moment existing at the point where the reinforcement
in the back face of the stem intersects the base slab as follows:
b = 12 in., d = 35.5 in., Mu (at face of stem) = 142.74 ft-K(Figure 6)
V = 29.17 K (Figure 6b)u
MU (at design point) = 142.74 + 29.17( 2 ) 152.46 ft-K
= 1829.52 in.-K
f' = 3 KS , fy = 40 ksi, 4 = 0.9
27
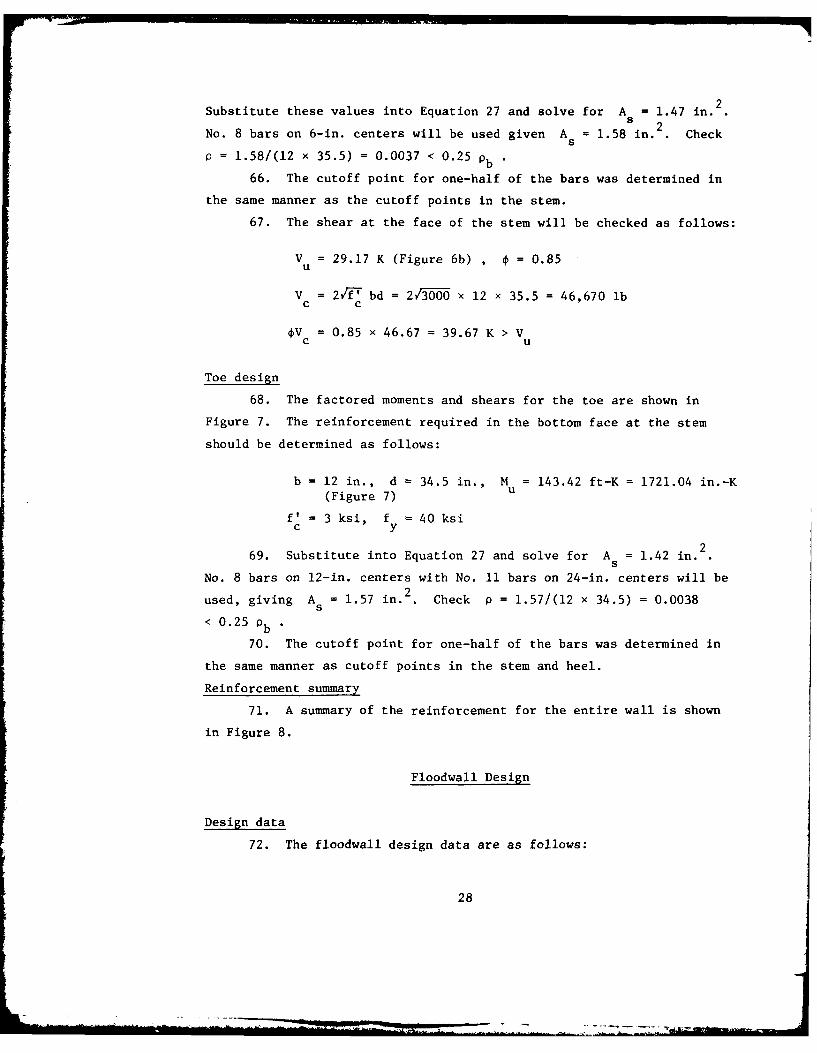
2Substitute these values into Equation 27 and solve for A =1.47 in.s
No. 8 bars on 6-in. centers will be used given A = 1.58 in. . Checks
P = 1.58/(12 x 35.5) = 0.0037 < 0.25 Pb
66. The cutoff point for one-half of the bars was determined in
the same manner as the cutoff points in the stem.
67. The shear at the face of the stem will be checked as follows:
V = 29.17 K (Figure 6b) , 0 = 0.85U
V = 2/f-' bd = 2,3000 × 12 x 35.5 = 46,670 lbc c
V = 0.85 x 46.67 = 39.67 K > Vc u
Toe design
68. The factored moments and shears for the toe are shown in
Figure 7. The reinforcement required in the bottom face at the stem
should be determined as follows:
b = 12 in., d = 34.5 in., M = 143.42 ft-K = 1721.04 in.-K(Figure 7) u
V = 3 ksi, f = 40 ksic y
269. Substitute into Equation 27 and solve for A = 1.42 in.S
No. 8 bars on 12-in. centers with No. 11 bars on 24-in. centers will be
used, giving A = 1.57 in. 2. Check p = 1.57/(12 x 34.5) = 0.0038S
< 0.25 pb *
70. The cutoff point for one-half of the bars was determined in
the same manner as cutoff points in the stem and heel.
Reinforcement summary
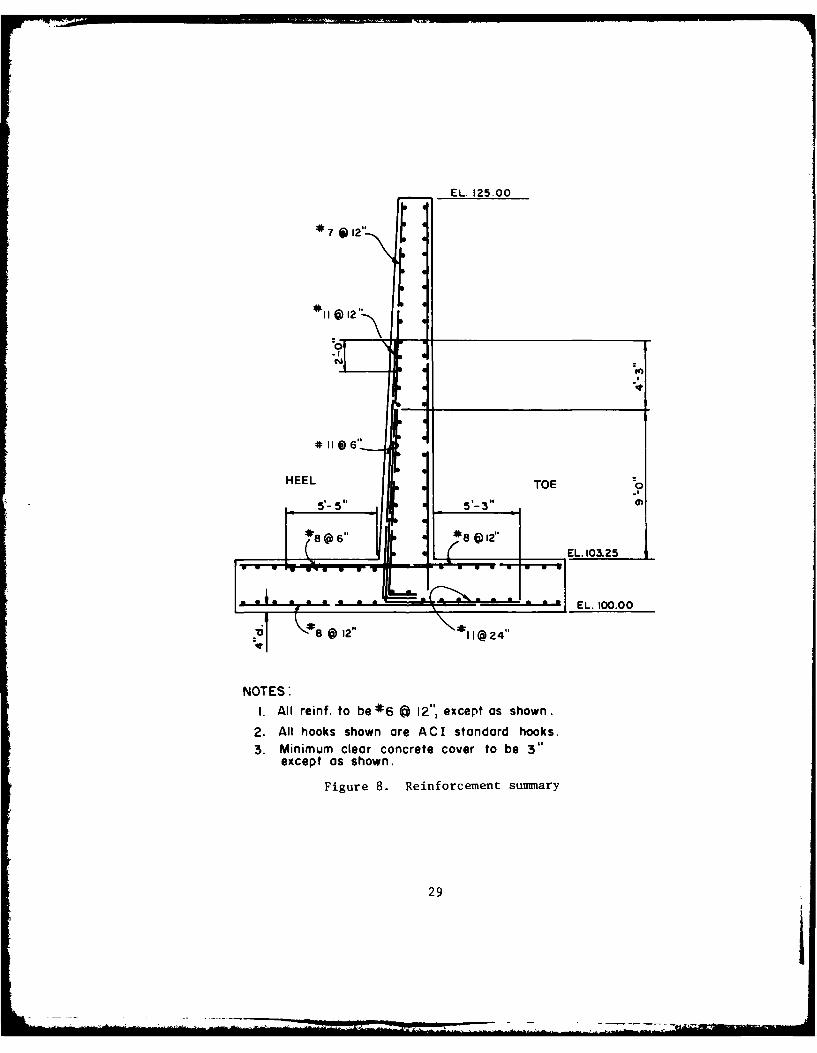
71. A summary of the reinforcement for the entire wall is shown
in Figure 8.
Floodwall Design
Design data
72. The floodwall design data are as follows:
28
EL. 125-00
*7 12"
i-10~
HEEL 16"TOE 0.
8*(D12"
EL. 103&25
- ~ EL. 100.00
4. ; e 122
NOTES:1. All reinf. to be *6 @12", except as shown.
2. All hooks shown are ACI standard hooks.3. Minimum clear concrete cover to be 3
except as shown.
Figure 8. Reinforcement suimmary
29
-0 W- I
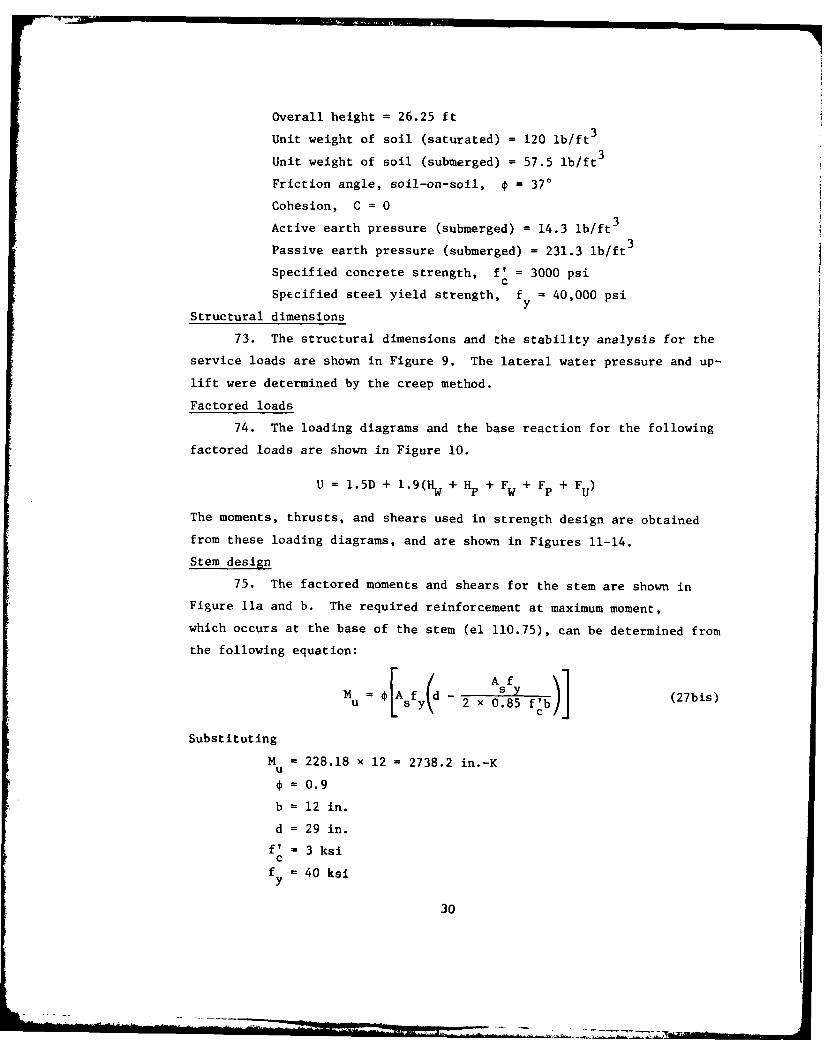
Overall height = 26.25 ft
Unit weight of soil (saturated) = 120 lb/ft 3
Unit weight of soil (submerged) = 57.5 lb/ft3
Friction angle, soil-on-soil, = 370
Cohesion, C = 0
Active earth pressure (submerged) = 14.3 lb/ft 3Passive earth pressure (submerged) = 231.3 lb/ft3
Specified concrete strength, f' = 3000 psic
Specified steel yield strength, f = 40,000 psi
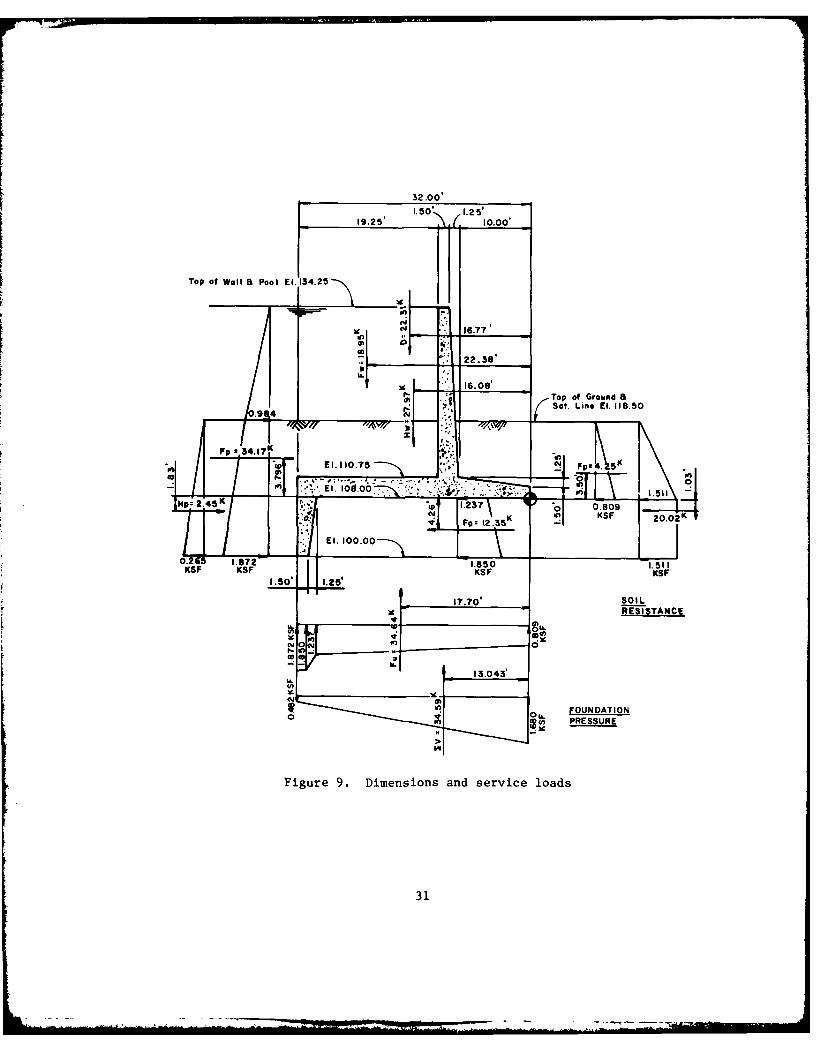
Structural dimensions
73. The structural dimensions and the stability analysis for the
service loads are shown in Figure 9. The lateral water pressure and up-
lift were determined by the creep method.
Factored loads
74. The loading diagrams and the base reaction for the following
factored loads are shown in Figure 10.
U = 1.5D + 1.9(HW + Hp + FW + Fp + FU)
The moments, thrusts, and shears used in strength design are obtained
from these loading diagrams, and are shown in Figures 11-14.
Stem design
75. The factored moments and shears for the stem are shown in
Figure lla and b. The required reinforcement at maximum moment,
which occurs at the base of the stem (el 110.75), can be determined from
the following equation:
M {Asfy(d s~ fi) (27bis)u sy 2 x 0.85 f~b(2bs
Substituting
M = 228.18 x 12 = 2738.2 in.-Ku
= 0.9
b = 12 in.
d = 29 in.
fV - 3 ksic
f = 40 ksiy
~30
32.00,.50' .25,
19.25' 10.(
Top of Wal I PoolI El. 134.25
x 16.77M
22.36.
Top of GodSot. Line El. 118.50
0/-
0.2 10d.0 1.511
3123
El. 134.25
16.77'
22.38'
16.08'
/1.87 I,-______'!__I_*A___
KS
Fpu 6 4 .9 2 K
El. 110.75 Fu80.
.,;El -0.0 2.350
HPu= 4.66 1.3KS
El. 100.00
0.504 3. 557 3.515 413 SKSF KSF KSF
RESISTANCE(Less than Passiv)
0 PRESSURE
o>
Figure 10. Loading diagram for factored loads
32
El. 34.25
#7 12"
0.0 6 0 "o,
.7 1N/T 2.0 28. aTK L '-1107
Co 00
As. SHEAR MOMENT REINFORCEMENT(. W (a) (d)
Figure 11. Moment, shear, and required reinforcement for stem
£ Stem Wall, -...
(Axial Load) Pu 12.44 K (Tension) Vu:180
S -542'.
2 .7 .2'% 1 120 0 0 20 o'
11 .000.00
Iii
.... I2 .42 it %n0.i
2.8 IN2
/F d 21 1 K -2,'28. FT-K
El 100.0.07
Figure 1. Momentser and required reinforcement for tem
2,5' 2 0' 2.0 .0 200 2.0 .0' .03200
0-Slem Woll
El. 110,75 0 21"
El. 108.00
re nfocmn o o
0
5 0. 12 .2 9 07
0
25.80 C 12.27 Q.4
0
0
El. 100.00
MU vu As(a) (b) (C)
Figure 14. Moment, shear, and requiredreinforcement for key
34

into Equation 27 and solving for A , the answer obtained is
A = 2.80 in.s
76. Alternating No. 10 and No. 11 bars on 6-in. centers gives
A = 1.27 + 1.56 = 2.83 in. 2/ft. Check p = 2.83/(12 x 29) = 0.0081
< 0.25 pb "
77. A for other points along the stem are determined in the5
same manner.
78. It can be seen from Figure llc that the No. 11 bars are not
required at a distance of 6.83 ft above the base of the stem. According
to ACI 318-77, paragraph 12.11.3, reinforcement shall extend a distance
of 12 bar diameters or the effective depth of the member (whichever is
greater) past the point where it is no longer required. Twelve bar
diameters for No. 11 bar is 16.92 in. Effective depth at 6.83 ft above
base is approximately 25 in., which is greater than 16.92 in. Thus, the
No. 11 bars can be discontinued at a point that is a distance of 8 ft
11 in. above the base. A check should be made in accordance with
ACI 318-77, paragraph 12.11.5.1, to make certain that shear at the cut-
off point does not exceed two-thirds of the permitted shear, as follows:
V (8 ft 11 in. above base) = 13,000 lb (Figure llb)U
d = 14 in. + (14.58) 15 in. = 23.31 in.23.5/
b = 12 in., V = 2fV = 110 psic C
pVc = 0.85 x 110 x 12 x 23.31 = 26,150 lb
2/3(OVc ) = 17,430 lb > 13,000 lb
79. It can be seen in Figure lid that No. 7 bars at 12 in. are
used for the top portion of the stem. From Figure lic, No. 10 bars are
no longer required at a point 10.75 ft above the base. Determine the
distance above this point that the No. 10 bars must extend for proper
lap with No. 7 bars, according to ACI 318-77, as follows:
35

0.04 Ab fa. Basic Development Length = (paragraph 12.2.2)
IfC
0.04 x 0.6 x 40,000== 17.53 in.
b. Modification Factor = 0.8 Zd (paragraph 12.2.4)
= 0.8 x 17.53 = 14.02 in.
C. Lap Length = 1.7 kd (paragraphs 12.16.1 and 12.16.2)
= 1.7 x 14.02 = 23.83 in. (24 in.)
80. The shear should be checked at a distance d = 2.29 ft above
the base of the stem as follows:
V = 2fT bd (ACI 318-77, Equation 11-3)C c
V = 23000 x 12 x 2.29 x 12 = 36,120 lbc
=Vc 0.85 x 36,120 = 30,700 lb
V = 21,210 lb (Figure llb)U
V > Vu
Heel design
81. The moment diagram for the heel is shown in Figure 12. In
addition to moment, the heel is subjected to a tensile load of 12.44 kips
resulting from lateral loads on the key. The heel should be designed in
accordance with the requirements of paragraph 43d.
82. The reinforcement in the top face should be designed for the
moment existing at the point where the reinforcement in the back face
of the stem intersects the base slab; as follows:
b = 12 in., h = 33 in., d = 29 in.
M (at face of stem) = 98.30 ft-KU
36
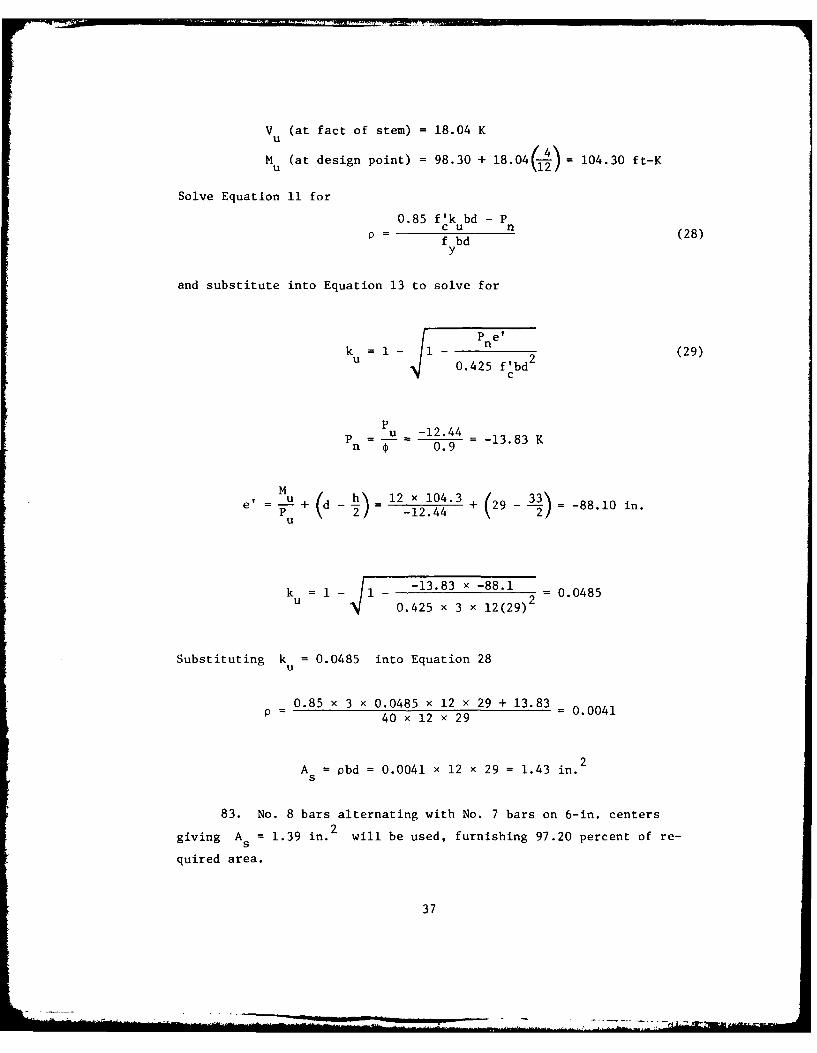
V (at fact of stem) = 18.04 KU
M (at design point) = 98.30 + 18.04( ) = 04.30 ft-K
Solve Equation 11 for0.85 f'k bd - P
C U nfbd (28)
y
and substitute into Equation 13 to solve for
P e'k =1I- - n9
u 0.425 f'bd 2
C
Pu -12.44P . .. - -13.83 Kn 0.9
e' =u (d- h)= 12 x 104.3 + (29 - =-88.10 in.
k = 1 - - -13.83 x -88.1Ji 0.425 x 3 x 12(29)2=0.0485
Substituting k = 0.0485 into Equation 28U
0.85 x 3 x 0.0485 x 12 x 29 + 13.83= 40 x 12 x 29 - 0.0041
A = pbd = 0.0041 x 12 x 29 = 1.43 in. 2s
83. No. 8 bars alternating with No. 7 bars on 6-in. centers2
giving A = 1.39 in. will be used, furnishing 97.20 percent of re-S
quired area.
37
... .. . . ......... .. .. .. ,- - . . -/i i ~ - ., ,_ .. .
84. The required reinforcement for other points along the heel
can be determined in the same manner, and are shown in Figure 12.
85. Check shear at the face of the stem as follows:
Vc = 2 _ f'bd (ACI 318-77, Equation 11-9)c500 Ag 9) '
= 5 12,440 ) 3000 (12 x 29) = 35,730 lbc 500 x 36
=Vc 0.85 x 35,730 = 30,370 lb
Vu = 18,040 lb < Vc
86. The No. 7 bar in the top face is no longer required at a
point 3 ft from the stem. The effective depth is 29 in., and 12 bar
diameters equals 9 in. The cutoff point is at 29 in. + 36 in. = 65 in.
= 5.42 ft from the stem. Check the shear at the cutoff in accordance
with ACI 318-77, paragraph 12.11.5.1 as follows:
V (at cutoff) = 15,489 lbU
SVc (computed above) = 30,370 lb
2/3 V c = 20,250 lb > 15,489 lb
87. The cutoff point for a No. 8 bar in the bottom face is deter-
mined in the same manner.
Toe design
88. The factored moments and shears for the toe are shown in
Figure 13a and b. The required reinforcement at the face of the stem
can be determined from Equation 27 by substituting
M = 104.5 x 12 = 1254 in.-KU
0 = 0.9
b = 12 in.
d = 33 - 5 = 28 in.
f' = 3 ksicf = 40 ksiy
38

2into Equation 27, and solving for A = 1.27 in.
s88. Use No. 10 bars on 24-in. centers with No. 8 bars on 12-in.
2centers giving A = 1.42 in. 2 Check p = 1.42/(12 x 28) = 0.0042
S
< 0.25 p
89. The shear should be checked at distance 2.07 ft from the face
of the stem, where the effective depth is 2.07 ft or 24.89 in., as
follows:
V = 16,287 lb, b = 12 in., d = 24.89 in., p = 0.00465u
M =66.94 x 12 = 803 in.-KU
V= 1.9Vf I + 2 u bd (ACI 318-77, Equation 11-6)
V 1.9/rb + 2500 x 0.00465 3 24.89(12 x 24.89)
= 32,836 lb
V c = 0.85 x 32,836 = 27,910 lb > Vu
90. The No. 7 bar is not required for flexure at a point 2.25 ft
from the stem, where the effective depth is 24.89 in. Twelve bar diam-
eters = 9.0 in. The cutoff point then is 24.89 in. + 27 in. = 51.89 in.
= 4.32 ft (use: 4.33 ft). Check the shear at the cutoff point in
accordance with ACI 318-77, paragraph 12.11.5.1 as follows:
V = 12,000 lb, b = 12 in., d = 21.50 in.U
V = 2,ff bd (ACI 318-77, Equation 11-3)c c
= 2V5000 (12 x 21.50) = 28,262 lb
2/3(V c ) = 2/3 x 0.85 x 28,262 = 16,015 lb > 12,000
39
Key design
91. Figure 14a and b show the factored moment and shear for the
key. The required reinforcement can be determined from Equation 27 and
is shown in Figure 14c. It can also be determined that the critical
shear at the bottom of the base is less than V cspecified in
ACI 318-77.
Longitudinal steel
92. Longitudinal bars are used to space the flexure bars and to
provide for shrinkage and temperature stresses. According to para-
graph 36, the area of shrinkage and temperature reinforcement in each
direction should not be less than 0.1 percent of the gross cross-
sectional area. At the base of the stem, the required A swould be:
0.001 x 12 x 33 = 0.396 in. 2
The steel used is, in part, a matter of judgment. The following steel
for the stem is chosen:
Longitudinal, upper 11.50 ft, No. 5 at 12 in., each face
A = 0.31 in. 2/ft
below 11.50 ft, No. 6 at 12 in., each face
A =0.44 in. 2/ft
Vertical at land face, No. 6 at 12 in.
A = 0.44 in. 2/ft
Longitudinal reinforcement in all other members (heel,toe, and key) are all No. 6 at 12 in.
A = 0.44 in. 2/ft
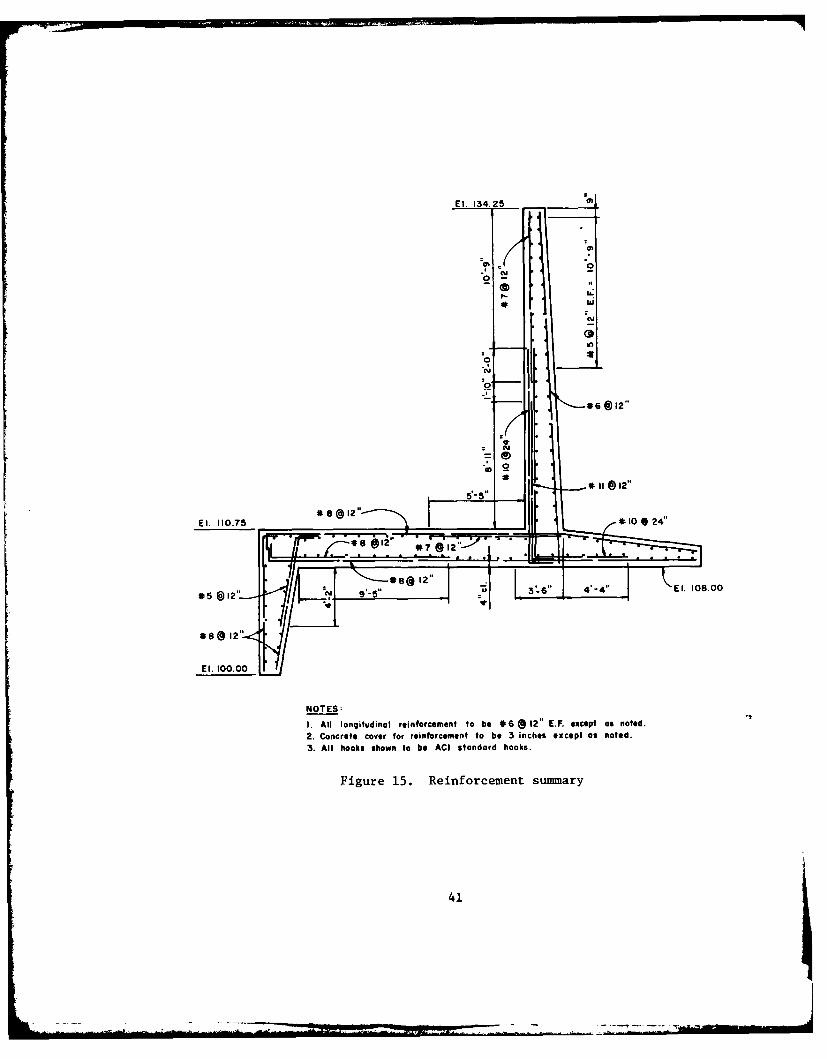
Reinforcement summary
93. The reinforcement summary is given in Figure 15.
40
El. 134.25
0_
N
00-q
116 @12"
CD 2
5*-s.. 011 @ 12"
El. 110.75 8 12 0 1 24'
E1500.[00. 4-"El 080
NOTES:
1. All longitudinal reinforcement to be *6 112" E.F. except as noted.2. Concrete cover for reinforcement to be 3 inches except os noted.3. All hooks shown to be ACI standard hooks.
Figure 15. Reinforcement summary
41
REFERENCES
Al-Hussaini, M. M., and Townsend, F. C. 1975 (Dec). "Investigation ofK Testing in Cohesionless Soils," Technical Report S-75-16, U. S. Army
Engineer Waterways Experiment Station, CE, Vicksburg, Miss.
American Concrete Institute. 1977. "Building Code Requirements forReinforced Concrete," ACI Manual of Concrete Practice, ACI 318-77,Detroit, Mich.
Atimay, E., and Ferguson, P. 1973 (Sep). "Early Chloride Corrosion of
Reinforced Concrete - A Test Report," ACI Journal, Detroit, Mich.
Beeby, A. W. 1978. "Concrete in the Oceans - Cracking and Corrosion,"Technical Report No. 1, Cement and Concrete Association, Wexham Springs,England.
Bowles, J. E. 1968. Foundation Analysis and Design, McGraw-Hill,New York.
British Standards Institution. 1972. "The Structural Use of Concrete;Part 1: Design Materials and Workmanship," CP 110.
Broms, B. B. 1965a (Oct). "Crack Width and Crack Spacing in ReinforcedConcrete Members," ACI Journal, Proceedings, Vol 62, No. 10, pp 1237-1256.
_ 1965b (Sep). "Stress Distribution in Reinforced ConcreteMembers with Tension Cracks," ACI Journal, Proceedings, Vol 62, No. 9,pp 1095-1108.
1965c (Jan). "Techniques for Investigation of InternalCracks in Reinforced Concrete Members," ACI Journal, Proceedings,Vol 62, No. 1, pp 35-44.
Clark, A. P. 1956 (Apr). "Cracking in Reinforced Concrete FlexuralMembers," ACI Journal, Proceedings, Vol 52, No. 8, pp 851-862.
Comite European-International du Beton. 1978 (Apr). "Code Modele CEB-
FIP pour les Structures en Beton," Bulletin d'Information No. 1240/125-F.
Concrete Reinforcing Steel Institute. 1978. CRSI Handbook, 3rd ed.
Federation Internationale de la Precontrainte (FIP). 1974. "Recommen-dations for the Design and Construction of Concrete Sea Structures,"2nd ed.
Gergely, P., and Lutz, L. A. 1968. "Maximum Crack Width in ReinforcedConcrete Flexural Members," Causes, Mechanism, and Control of Crackingin Concrete, SP-20, American Concrete Institute, Detroit, Mich.,pp 87-117.
Goto, Y. 1971 (Apr). "Cracks Formed in Concrete Around Deformed TensionBars," ACI Journal, Proceedings, Vol 68, No. 4, Detroit, Mich.
Hognestad, E. 1962 (Jan). "High Strength Bars as Concrete Reinforce-ment: Part 2 - Control of Cracking," Journal, PCA Research and Develop-ment Laboratories, Vol 4, No. 1, pp 46-62.
42
Huntington, W. C. 1957. Earth Pressures and Retaining Walls, JohnWiley and Sons, New York.
Husain, S. I., and Ferguson, P. M. 1968 (Jun). "Flexural Crack Widthat the Bars in Reinforced Concrete Beams," Research Report 102-IF,Center for Highway Research, The University of Texas, Austin, Tex.
Illston, J. M., and Stevens, R. F. 1972 (Dec). "Long-Term Cracking inReinforced Concrete Beams," Proceedings, the Institution of CivilEngineers, Part II, Research and Theory, Vol 53.
Kaar, P. H., and Hognestad, E. 1965 (Jan). "High Strength Bars as Con-crete Reinforcement: Part 7 - Control of Cracking in T-Beam Flanges,"Journal, PCA Research and Development Laboratories_ Vol 7, No. 1,pp 42-53.
Kaar, P. H., and Mattock, A. H. 1963 (Jan). "High Strength Bars asConcrete Reinforcement; Part 4, Control of Cracking," Journal, PCAResearch and Development Laboratories, Vol 5, No. 2, pp 15-38.
Kennedy, T. B. 1955 (Jul). "Tensile Crack Exposure Tests; CWI ItemNo. 026, Tensile Crack Exposure Tests for Reinforced Concrete Beams,"Technical Memorandum No. 6-412, Report 1, U. S. Army Engineer WaterwaysExperiment Station, CE, Vicksburg, Miss.
Klein, F., Hoffman, E. S., and Rice, P. 1979 (18-23 Mar). "ApplicationACI Committee 350 of Strength Design Methods to Sanitary Structures,"Paper presented at ACI Manual Convention at Milwaukee, Wis.
Liu, T. C. 1980 (Jul). "Strength Design of Reinforced Concrete Hydrau-lic Structures; Preliminary Strength Design Criteria," Technical ReportSL-80-4, Report 1, U. S. Army Engineer Waterways Experiment Station, CE,Vicksburg, Miss.
Miztin, H., and Schiessl, P. 1969a. "The Influence of Cracks on theCorrosion of Steel in Concrete," Preliminary Report of RILEM Interna-tional Symposium on the Durability of Concrete, Vol II, Prague,Czechoslovakia.
1969b. "The Influence of Time and Environmental Conditionson the Corrosion of Deformed Bars in Cracked Concrete," PreliminaryReport of RILEM International Symposium on the Durability of Concrete,Vol II, Prague, Czechoslovakia.
Okamoto, S. 1956. "Bearing Capacity of Sandy Soil and Lateral EarthPressure During Earthquakes," Proceedings, World Conference onEarthquake Engineering, Berkeley, Calif.
O'Neil, E. F. 1980 (Jan). "Tensile Crack Exposure Tests; LaboratoryEvaluation of Series 'A' Beams with Results from 1951 to 1975," TechnicalMemorandum No. 6-412, Report 3, U. S. Army Engineer Waterways ExperimentStation, CE, Vicksburg, Miss.
Quigley, D. W., and Duncan, J. M. 1978 (Sep). "Earth Pressure onConduits and Retaining Walls," Report No. U2B/GT/78-06, Department ofCivil Engineering, University of California, Berkeley, Calif.
43

Rangan, B. V., and Rajasekar, H. L. 1977 (30 Aug). "Serviceability and
Strength Design Provisions for Concrete Water-Retaining Structures,"Paper presented at Concrete Symposium, Brisbane, Australia.
Reis, E. E., et al. 1965. "Causes and Control of Cracking in ConcreteReinforced with High-Strength Steel Bars - A Review of Research,"Bulletin No. 479, Engineering Experiment Station, University of Illinois,Urbana, Ill.
RILEM. 1957. "Symposium on Bond and Crack Formation in ReinforcedConcrete; Vols I and II," Paris, France.
Roshore, E. C. 1964 (Nov). "Tensile Crack Exposure Tests; Results ofTests of Reinforced Concrete Beams, 1955-1963," Technical MemorandumNo. 6-412, Report 2, U. S. Army Engineer Waterways Experiment Station,CE, Vicksburg, Miss.
Rusch, H., and Rehm, G. 1963, 1964. "Versuche Mit Betonformstahlen,"Deutscher Ausschuss fur Stahlbeton, Bulletins, No. 140, Part 1, 1963;No. 160, Part 2, 1963; and No. 165, Part 3, 1964.
Seed, H. B., and Whitman, R. V. 1970. "Design of Earth RetainingStructures for Dynamic Loads," Proceedings, 1970 ASCE SpecialtyConference on Lateral Stresses in the Ground and Design of EarthRetaining Structures.
Spangler, M. G. 1961. Soil Engineering, 2nd ed., InternationalTextbook Company.
Teng, W. C. 1962. Foundation Design, Prentice-Hall, Inc., New Jersey.
Terzaghi, K., and Peck, R. B. 1948. Soil Mechanics in EngineeringPractice, John Wiley & Sons, New York.
Tremper, B. 1947 (Jun). "The Corrosion of Reinforcing Steel in CrackedConcrete," ACI Journal, Detroit, Mich.
U. S. Army Coastal Engineering Research Center, CE. 1973. Shore
Protection Manual, Vol II, Ft. Belvoir, Va.
U. S. Army, Office, Chief of Engineers. 1948 (Jan). "Wall Design FloodWalls," Engineer Manual EM 1110-2-2501, Washington, D. C.
1958 (Sep). "Gravity Dam Design," Engineer ManualEM 1110-2-2200, Washington, D. C.
1961 (29 May). "Engineering and Design; Retaining Walls,"
Engineer Manual EM 1110-2-2502, Washington, D. C.
1963. "Working Stresses for Structural Design," Engineer
Manual 1110-1-2101, Washington, D. C.
• 1971 (May). "Details of Reinforcement - HydraulicStructures," Engineer Manual EM 1110-2-2103, Washington, D. C.
• 1977 (Apr). "Earthquake Design and Analysis for Corps of
Engineers Dams," Engineer Regulation ER 1110-2-1806, Washington, D. C.
44
U. S. Army, Office, Chief of Engineers. 1979 (Mar). "Criteria Specifi-cations for Computer Program TWDA, T-Wall Design/Analysis for Analysisand/or Design of Inverted-T Retaining Walls and Flood Walls," LMVD CASDCommittee and the OCE CASE Project Task Group on T-Wall Design,Washington, D. C.
. 1980 (Mar). "User Reference Manual for Computer ProgramTWDA, T-Wall Design/Analysis for Analysis and/or Design of Inverted-TRetaining Walls and Flood Walls" (Working Draft), LMVD CASD Committeeand the OCE CASE Project, Task Group on T-Wall Design, Washington, D. C.
45
::_awn~
APPENDIX A: COMMENTARY
Introduction
1. This appendix discusses some of the considerations and back-
ground information used in developing the strength design criteria for
inverted T-walls used as reinforced concrete retaining walls or flood-
walls presented in Part II.
General Design Criteria
2. The design provisions of ACI 318-77 are generally applicable
for reinforced concrete retaining walls and floodwalls. However, be-
cause of the uncertainties of the loading conditions and serviceability
requirements of the retaining walls and floodwalls, some design criteria
of ACI 318-77 need to be modified. The specific design criteria that
are different from those of ACI 318-77 are given in Part II.
Loads and Forces
3. The following discussion describes the various forces that may
act on a wall. General procedures for computing their magnitudes are
also included. In considering walls in which the cross section remains
constant for a considerable distance, the computation is based on a
linear foot of wall.
Dead load (d)
4. The resultant of the weight of the wall acts through the cen-
ter of gravity of the portion above the horizontal section considered.
It is usually simpler to divide a cross section into triangles and
rectangles, whose areas and centroids can be determined easily, and
to deal with the corresponding forces separately rather than to com-
bine these into a single force.
Vertical earth pressure (Hw )
5. The vertical earth pressure is equal to the depth of the
Al
plane below the ground surface multiplied by the unit weight of the
soil.
6. The method for determining the unit weight of soil for use
in computation of earth pressure depends primarily upon the size and
economic importance of the wall. For small walls or for projects in-
volving relatively small expenditures, the cost of laboratory and field
tests is usually not justified. However, a simple exploratory program
should be carried out to determine the general character of the founda-
tion materials and to permit classification of the soils in the borrow
areas that will provide the backfill. The probable level of the water
table after construction should also be estimated on the basis of local
conditions. With this information, sufficiently reliable values of the
appropriate unit weights can usually be taken from Table Al.
7. In connection with high walls, or important projects involv-
ing large expenditures, a thorough study of available backfill materials
is advisable. Laboratory field tests should be made to determine the
saturated, drained, and dry weights of all materials that may be used,
and the design should be based on the test values.
Lateral earth pressure (H)
8. Active earth pressure. For all practical purposes, Coulomb's
theory can be used to predict the active earth pressures. The equation
for computing active pressure coefficient given in EM 1110-2-2502 is
convenient for homogeneous backf ills and simple geometric installations.
For a more complicated multiple-layer soil system, the incremental
trial wedge method presented in U. S. Army, Office, Chief of Engineers
(1979)* may be used.
9. For unusual wall conditions, the finite element method can
be a valuable tool for design. At the present time, the finite element
method is the only practical means by which quantitative analyses can
be made of soil-structure interaction problems.
*The references cited in this appendix are listed in the references
at the end of the main text.
A2

10. At-rest earth pressure. The at-rest earth pressures speci-
fied in EM 1110-2-2502 are estimated from empirical coefficients related
to soil type. The Jaky's equation and field or laboratory tests can
also yield a suitable value for at-rest earth pressure coefficients.
More detailed discussions of at-rest earth pressure can be found in
U. S. Army, Office, Chief of Engineers (1979) and Al-Hussaini and
Townsend (1975).
11. Passive earth pressure. The accuracy of predictions of
passive earth pressures which can be relied upon for resisting the
movement of retaining walls and floodwalls is considerably less than
the accuracy of predictions of active pressures. Because of the non-
linear relationship between passive resistance and wall movement, there
remains much uncertainty as to whether the desired resistance can in
fact be achieved within the wall movement allowed. Therefore, passive
earth pressures are often disregarded when other more positive means
of resistance are available (Quigley and Duncan 1978).
12. Location of resultant lateral pressure. The point of ap-
plication of the earth pressure resultant for a cohesionless material
is controlled largely by the amount of wall movement. The exact loca-
tion is generally indeterminate. However, it is sufficiently accurate
to use the locations of the earth pressure resultant specified in
EM 1110-2-2502.
Vertical water pressure (F )
13. The vertical water pressure is equal to the depth of the3water multiplied by 62.5 lb/ft
Lateral water andseepage pressure (F )
14. For a wall with a permeable backfill (assuming no seepage
under the wall) and no drainage system provided, the pressure on the
wall is due to the buoyant weight of the earth plus the full hydro-
static pressure of the water.
A3

15. When seepage is taking place in a floodwall or a retaining
wall provided with a drainage system, the pore pressure is reduced by
friction between the soil grains and the water. The most effective way
to determine the pore pressure is by means of the creep method or the
flow net method, as described in EM 1110-2-2501.
16. Water may accumulate in cracks that form in a backfill of
cohesive soil. The hydrostatic pressure due to this water may have sig-
nificant effect on the lateral pressure against a wall. Therefore,
full hydrostatic pressure should be used in the design, if such water
is adjacent to the back of a wall.
Uplift (F )u
17. The common procedure for computing uplift pressure on walls
resting on soil is the creep method, which is much simpler than using a
flow net.
18. When the resultant force falls outside the kern and the
assumed failure plane is along the interface between the base of the
wall and the soil, a crack at soil-structure interface will form for
the portion of the foundation not in compression, and therefore, no
creep loss should be assumed for this portion.
Wind load (W)
19. EM 1110-2-2502 specifies that a horizontal loading of 30 psf
should be used as wind load for retaining walls. For floodwall design,
EM 1110-2-2501 specifies that, in localities subject to hurricanes or
cyclones, a 50-psf wind load should be used; and for all other locali-
ties, a wind load of 20 psf should be used.
Wave action (p)
20. Wave pressures due to breaking and nonbreaking waves differ
widely. The first step in the evaluation of wave force on floodwalls
is to determine if the wall will be subjected to forces from nonbreaking
waves, breaking waves, or broken waves. The determination of wave
pressure on vertical walls is explained in Shore Protection Manual,
A4
Vol 11 (U. S. Army Coastal Engineering Research Center 1973).
Surcharge loads (S L )
21. The usual procedure in providing for uniform surcharge loads
is to apply to the ground surface an imaginary equivalent surcharge of
earth with the same unit weight as the backfill and with a height
sufficient to produce the same intensity of vertical pressure on the
ground surface as is applied by the actual load. However, the direct
methods (e.g., Boussinesq's equations (Terzaghi and Peck 1948, Spang-
ler 1961) or theory of elasticity (Bowles 1968)) are generally more
suitable for concentrated loads.
Earthquake loads (E)
22. The seismic coefficient method is generally used for com-
puting earthquake loads. The horizontal initial force can be, obtained
by multiplying a seismic coefficient, which represents the ratio of an
assumed acceleration of structure to the acceleration of gravity, and
the weight of the structures. The dynamic water loads on vertical or
near-vertical surfaces of the structure are usually determined by the
Westergaard formula (U. S. Army, Office, Chief of Engineers 1958)
using the selected seismic coefficient. The dynamic horizontal earth
pressure magnitude and resulting force can be approximated by the
Mononobe-Okabe method (Okamoto 1956, Seed and Whitman 1970).
23. In addition to a seismic coefficient analysis, the seismic
design of a wall that is used as part of a dam and when failure of the
wall could result in loss of life or extensive property damage, should
include dynamic methods as described in ER 1110-2-1806.
Other structural effect (T)
24. The effect of differential settlement, creep, shrinkage, and
temperature changes should be considered in T-wall design. In the
design, the most probable values rather than the upper bound values of
the variables should be used.
A5
Strength Requirements
Required strength
25. The required strength U is expressed in terms of factored
loads, which are the loads discussed in paragraphs 10-27 (main text),
multiplied by appropriate load factors. The factor assigned to each
load is influenced by the degree of accuracy to which the load effect
usually can be calculated and the variation that might be expected in
the load during the lifetime of the structure. In the T-wall design,
the load factor for dead load and the effects of differential settle-
ment, creep, shrinkage, and temperature change is 1.5. All other loads
have a load factor of 1.9. The basis for using these load factors is
given in Liu (1980).
26. Paragraph 28 (main text) gives load factors for specific
combinations of loads. While most of the usual combinations of load-
ings are included, the designer should not assumie that all cases are
covered. Consideration must be given to various combinations of load-
ing to determine the most critical design conditions. This is partic-
ularly true when strength is dependent on more than one load effect,
such as strength for combined flexure and axial load in the heel of
the floodwall.
27. The load combinations with 0.9D are included in Equations 2
and 3 for the case where a higher dead load reduces the effects of
other loads.
28. The reduction factor of 0.75 used in Equations 4-6 is con-
sistent with the provision of increasing the allowable stresses by
33-1/3 percent for Group II loadings (U. S. Army, Office, Chief of
Engineers 1963) for the working-stress design.
Base reaction
29. Paragraph 29 (main text) requires that the wall footings be
proportioned to sustain the applied factored loads and induced
reactions.
30. In general, the size of the T-wall base on soil is estab-
lished or the basis of service loads in whatever combination will
A6
govern the design and without applying any load factors. The extreme
soil pressure obtained from this loading must be within the permissible
values, and the overturning and sliding criteria should also be
satisfied.
31. To proportion a T-wall base for strength, the base reaction
due to the applied "factored" loading must be determined.
32. In the case of a T-wall, load factors will cause eccentrici-
ties and reactions that are different from those obtained by unfactored
loads. However, it is important to note that the base reaction is
only a calculated reaction to the factored loading used to produce,
in the base, the same required strength conditions regarding flexure
and shear as in the stem.
33. It will be shown in Appendix B that in the typical retaining
wall and floodwall designs, the factored loads will only cause slight
relocation of the resulting eccentricities from those obtained under
service load conditions, and the overall load factors for moment and
shear at critical sections due to the applied factored loads and induced
reactions are in the order of 1.9 for the loading combination given in
Equation 1 in paragraph 28 (main text).
Design strength for reinforcement
34. The basis for allowing the use of Grade 60 reinforcement for
T-walls is as follows:
a. A recent survey indicated that Grade 60 reinforcement iscurrently being specified for use in the vast majorityof reinforced concrete structures, and the ASTM is nowconsidering a proposal to delete bar size No. 7 andlarger in Grade 40.
b. Grade 40 reinforcement has been specified for T-walls.When Grade 40 reinforcement is not immediately available,it is not unusual to substitute standard Grade 60 rein-forcement for Grade 40 reinforcement on a bar-for-barbasis. However, a substitution without a redesign of thesplices and anchorages is not a sound practice. A sim-ple substitution can change the mode of failure of astructure under overload from ductile to brittle byincreasing the flexural strength safety factor withoutproportional changes in the safety factors for shear ordevelopment of reinforcement.
A7
La
c. All existing design codes and specifications, such as ACIBuilding Code (ACI 318-77), American Association of StateHighway and Transportation Officials (AASHTO) design spec-ifications, American Railway Engineering Association(AREA) design specifications, Uniform Building Code (UBC),and ACT Committee 350 recommendations on "Application ofStrength Design Methods to Sanitary Structures," allowthe use of Grade 60 reinforcement. In general, for work-ing stress design, the tensile stress of Grade 60 rein-forcement is limited to 24,000 psi, and for strengthdesign, a check of the crack width at service loads isrequired for design yield strength f exceeding40,000 psi. y
d. Grade 60 reinforcement has replaced Grade 40 reinforce-ment as the industry standard, and design aids based onGrade 40 reinforcement are now becoming obsolete. It isnoted that the CRSI Handbook's (Concrete Reinforcing SteelInstitute 1978) design aid tables utilize the Grade 60reinforcement only.
e. The use of Grade 60 reinforcement will generally resultin a more economical design without compromising ser-viceability and safety requirements. For a 1 percentsteel ratio, approximately 8 percent cost saving can berealized by using Grade 60 reinforcement (fy 48,000 psi)instead of Grade 40.y
Serviceability Requirement
ijP-itribution offlexural reinforcement
35. The subject of crack control and its relation to corrosion is
presented in Appendix C in that the general background information on
crack mechanism is reviewed, an appraisal of the available field exposure
test data relevant to crack widths and corrosion is made, and the exist-
ing design methods of controlling crack width are evaluated. Based on
the information gathered for Appexdix C, the following conclusions were
made:
a. Cracks in the width covered in exposure tests (up to0.06 in.) will be likely to induce corrosion where barsintersect them, but the amount of corrosion occurring atthe cracks over the design life of the structure will notbe significantly influenced by the width of the cracks.
A8
b. Most codes and regulations require either a direct orindirect check on crack width, but these checks, thoughintended to control possible corrosion, are based on nosound foundation of data relating crack width tocorrosion. Nor is there any general agreement as towhether crack widths should be checked or how this checkshould be carried out.
c. It appears that a design check on the crack widths,either at points directly over main bars or on the sur-face, is irrelevant from the point of view of corrosionprotection.
d. With the specified thick concrete cover, low steel stress,and small diameter bars and spacings for reinforced con-crete hydraulic structures, there is no reason to expectextensive corrosion problems during their design life,
regardless of cracking.
36. Since the tension zone is in the backfill face of a retaining
wall where cracks are not objectionable for appearance and where bitumi-
nous coatings can be employed if salt water or other corrosion-aggressive
solution is expected, the arbitrary maximum bar spacing requirements
specified in paragraph 32 (main text) are considered adequate.
Control of deflections
37. The provisions of paragraphs 34 and 35 (main text) are con-
cerned only with the deflections or deformations that may occur at
service load levels.
38. The walls designed by the working-stress method have low con-
crete and steel stresses and have served their intended functions with
very limited deflections. Paragraph 34 (main text) specifies that
deflections at service loads need not be checked when the reinforcement
ratio does not exceed 0.25 b .
39. The use of large steel ratios in the strength-design method
will generally result in more slender sections than those designed by
the working-stress design method. Be, use the deflection of slender
members may in some cases exceed desirable limits, paragraph 35 (main
text) specifies that deflection should be checked when the reinforce-
ment ratio exceeds 0.25 b
A9

Shrinkage andtemperature reinforcement
42. Shrinkage and temperature reinforcement is required at the
exposed faces to prevent excessive cracking. The amounts specified are
empirical but have been used satisfactorily for T-walls.
43. In the backfill face of a retaining wall, temperature and
shrinkage exposure is ordinarily less severe than for exposed face.
Appearance, watertightness, etc., are ordinarily not design requirements.
Longitudinal bars at spacings not to exceed approximately 4 ft are gen-
erally required as practical bar supports and spacers to hold the flex-
ural reinforcement in place during construction.
Concrete cover for reinforcement
44. Concrete cover as protection of reinforcement against weather
and other effects is measured from the concrete surface to the outermost
surface of the steel to which the cover requirement applies. The con-
crete covers specified in paragraph 37 (main text) are consistent with
the requirements for thick concrete sections (3 ft or more) not exposed
to action of water, alkali, other destructive agents, or severe impact
or abrasion given in EM 1110-2-2103 (U. S. Army, Office, Chief of
Engineers 1971).
Details of reinforcement
45. Good structural details are vital to the satisfactory per-
formance of reinforced concrete structures. The standard pr~actice for
reinforcement details for concrete hydraulic structures is given in
EM 1110-2-2103.
Flexure and Axial Load
Maximum tension reinforcement
46. The maximum amount of tension reinforcement in flexural mem-
bers is limited to ensure a level of ductile behavior. For T-walls,
the maximum tension reinforcement is limited to 0.25 p b The deriva-
tion of this limitation is given in Liu (1980).
47. For unusual situations when a larger amount of reinforcement
A10

is necessary because of physical constraints on member dimensions due to
functional or other requirements, paragraph 40 (main text) limits the
reinforcement ratio to 0.50 p b provided that the deflection criteria
specified in paragraph 35 (main text) are met.
Minimum reinforce-
ment of flexural member s
48. This provision applies to members that for functional or
other reasons are much larger in cross section than required by strength
consideration. The computed moment strength as a reinforced concrete
section with very little tensile reinforcement becomes less than that of
the corresponding plain concrete section computed from its modulus of
rupture. Failure in such a case could be quite sudden. A minimum per-
centage of reinforcement should be provided to prevent such a mode of
failure.
Combined flexure and axial load
49. Design assumptions and general requirements.
a. The allowable strain Em at extreme concrete compressionfiber is limited to 0.0015. This value is smaller than0.0030 assumed in the ACI 318-77. The bases for select-ing this lower value are as follows:
(1) It can be shown that the use of eM of 0.0015 willyield designs that are comparable to those designedby the working-stress method with allowable concretecompressive stress of 0.45 fc' . It is expected thatthe use of EM of 0.0015 will result in designssatisfying both the strength and serviceabilityrequirements of T-walls.
(2) Concrete strain at maximum stress has been observedin tests of various kinds to vary from 0.0015 to0.0020. The use of EM of 0.0015 recognizes thein elastic stress distribution of concrete at highstress.
(3) The use of higher EM value (say 0.003) will resultin a thinner section for some combinations of momentand thrust. While the thinner section may satisfythe strength requirement, the serviceability require-ment cannot be assured.
b. Balanced strain conditions for a cross section are definedas the conditions when the maximum strain at the extremecompression fiber just reaches 0.0015 simultaneously with
All
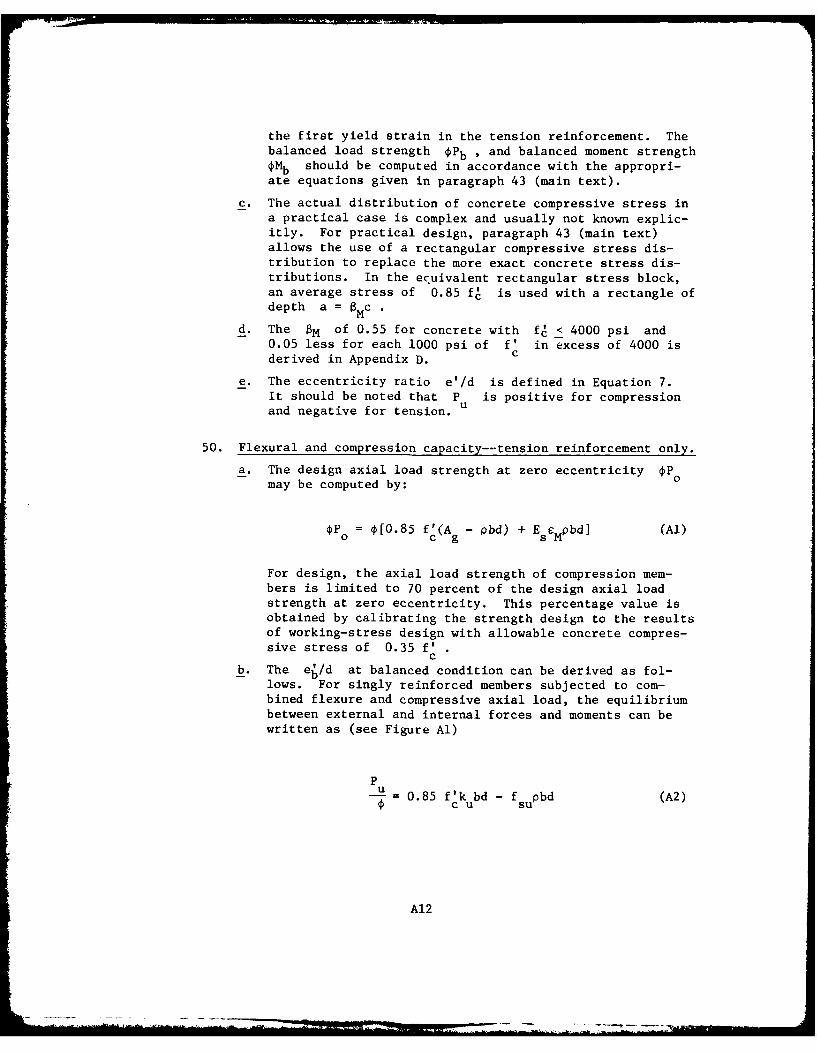
the first yield strain in the tension reinforcement. Thebalanced load strength OPb ' and balanced moment strengthOMb should be computed in accordance with the appropri-ate equations given in paragraph 43 (main text).
c. The actual distribution of concrete compressive stress ina practical case is complex and usually not known explic-itly. For practical design, paragraph 43 (main text)allows the use of a rectangular compressive stress dis-
tribution to replace the more exact concrete stress dis-tributions. In the ecuivalent rectangular stress block,an average stress of 0.85 fc! is used with a rectangle ofdepth a = 0MC .
d. The OM of 0.55 for concrete with f < 4000 psi and0.05 less for each 1000 psi of f' in excess of 4000 isderived in Appendix D. C
e. The eccentricity ratio e'/d is defined in Equation 7.It should be noted that P is positive for compressionand negative for tension. u
50. Flexural and compression capacity--tension reinforcement only.
a. The design axial load strength at zero eccentricity OPomay be computed by:
OPo = 0(0.85 f'(A - pbd) + EscMpbdl (Al)
For design, the axial load strength of compression mem-bers is limited to 70 percent of the design axial loadstrength at zero eccentricity. This percentage value isobtained by calibrating the strength design to the resultsof working-stress design with allowable concrete compres-sive stress of 0.35 f'
cb. The e'/d at balanced condition can be derived as fol-
lows. For singly reinforced members subjected to com-bined flexure and compressive axial load, the equilibriumbetween external and internal forces and moments can bewritten as (see Figure Al)
Pu = 0.85 f'k bd - f pbd (A2)
cu su
A12

b Pu/OdoO.85f EM
SfsuPbdES
Figure Al. Stresses and strains in membersubjected to combined flexure and axial
load--tension reinforcement only
and
P e'u = 0.85 f'k bdj d (A3)
c u u
Since
kju 2 -(A4)
Equation A3 can be rewritten as
P e' 2 2
=0.425 fc'i2ku - k bd (A5)c u U
The stress-strain distributions at balanced conditionare shown in Figure A2. From the strain diagram (Fig-ure A2c), it can be shown that
= I M 1l(A6)
1 k b k b
and
El = £M(I - 8M ) (A7)
A13
AI3 I
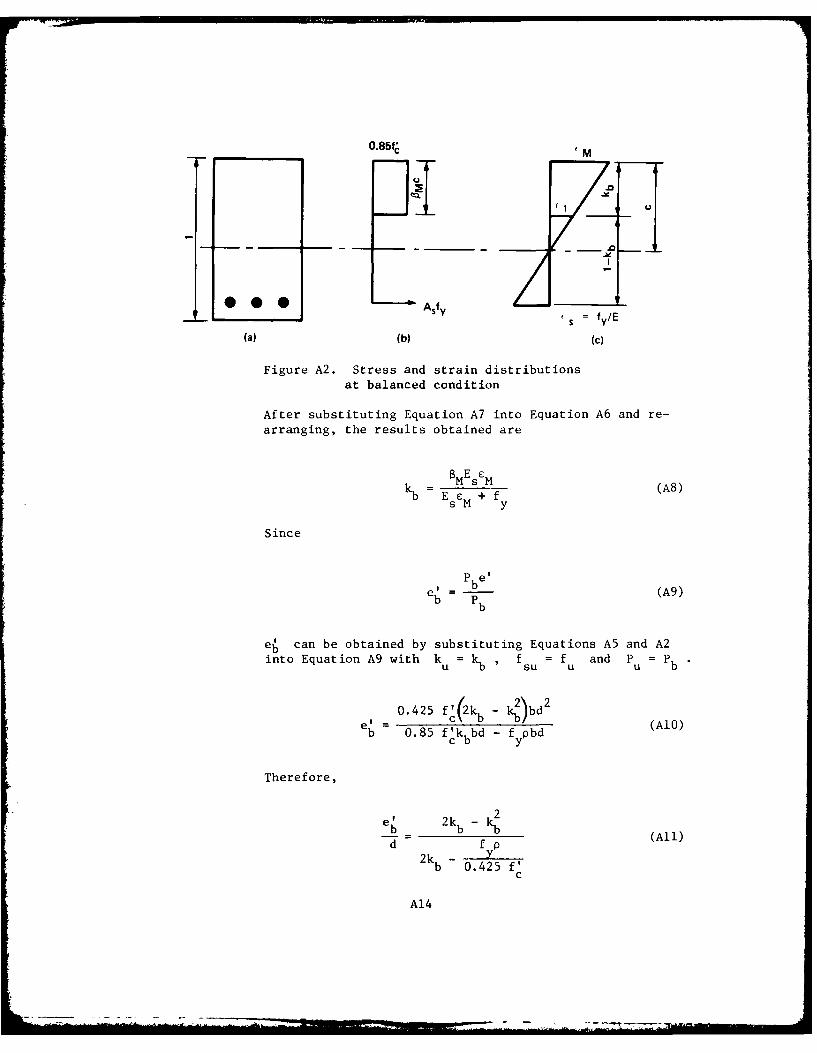
0.85f M
• • •--- Asfy
s = fy/E
(a) (b (C)
Figure A2. Stress and strain distributionsat balanced condition
After substituting Equation A7 into Equation A6 and re-
arranging, the results obtained are
k bE sM (A8)b EsM + fy
Since
P e'_b (A9)
e; can be obtained by substituting Equations A5 and A2
into Equation A9 with ku = kb fsu = fu and Pu =Pb
= 0.425 f'2kb - fy)bd0
e 0.5f'k bd -f pbd WAO)c b y
Therefore,
e' 2k 2
bb kb (All)d f p
2k - Yb 0.425 f'
c
A14

C. For sections controlled by tension, the P Pn can be
obtained from Equation A2 with fsu fy
Pn = p(0.85 f'kubd - fybd) (A12)
The design moment strength Mn can be expressed as
4M pP en n
(A13)
=Pn[d (1 2)d
Therefore,
4M = 4(0.85 f kubd - fypbd) -(1 -- )d (A14)
Substituting Equation A2 with f su f into Equation A5
gives
(0.85 f'k bd - f pbd)e' = 0.425 f'(2k - k2bd2 (A15)
c u y c u ub
Equation A15 can be reduced to
ku + 2 1u 0.425 f'dc
d. For sections controlled by compression, the Pn can be
obtained from Equation A2.
OP= (0.85 f'k ubd - fsupbd) (Al7)
The OM can be obtained by multipl ,ing Equation Al7 by
nn n
A15
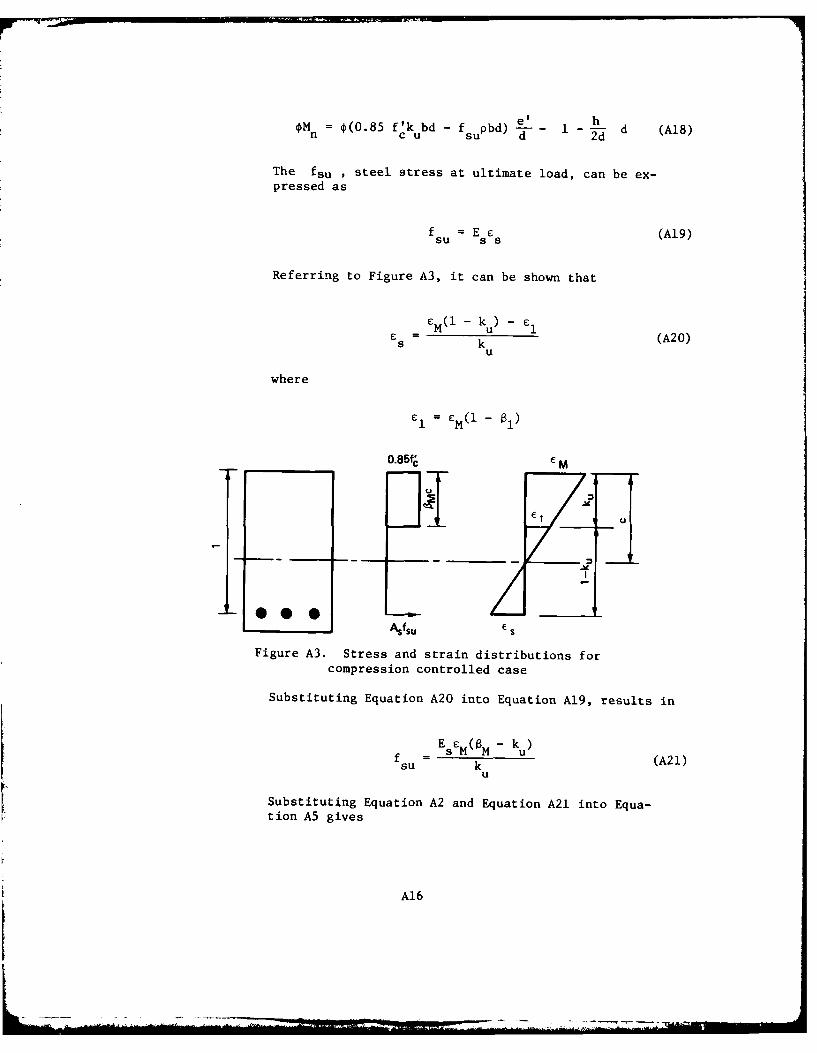
Mn = 0(0.85 fCk bd - f pbd) -- - 1 2d d (A18)n c u su d d
The fsu , steel stress at ultimate load, can be ex-pressed as
f = E e (A19)su S S
Referring to Figure A3, it can be shown that
SM(I - ku) - E1
s k (A20)u
where
E1 = M(l -1
0.85f E M
Asfsu E s
Figure A3. Stress and strain distributions forcompression controlled case
Substituting Equation A20 into Equation A19, results in
EseM(SM - ku)fsu M k u (A21)
u
Substituttng Equation A2 and Equation A21 into Equa-tion A5 gives
A16
0.85 f'k bde' - M u pbde'¢uu
(A22)
0,425 f'(2k- k2 )bd
2
Equation A22 can be rearranged to be:
3 /e 2 ______eu + + (E.- e1 kfU . d + .425f'd) u
(A23)
-. 425 f-Ji = 0
51. Flexural and compression capacity--tension and compression
reinforcement.
a. The design axial load strength OP is limited to 70~npercent of the axial load stength at zero eccentricity
and may be computed by
On = 0.70 O{0.85 f'[A - (p + p')bd
(A24)
+ E seM (p + p')bd}
b. For doubly reinforced members subjected to combined flex-ure and compressive axial load, the equilibrium betweenexternal and internal forces and moments can be writtenas
Pu = 0.85 f'k bd + f' p'bd - f pbd (A25)
c u su su
P e'0.425 (2k - k)bd2 p'bd(d - d') (A26)
The stress-strain distributions at balanced condition are
Al7

shown in Figure A4. From the strain diagram, it can beshown that
8E E
kbE +f(A27)sbEcM +y
and
EESM kb d (A28)]
su k kb(A8
E
**E;=f, ~/ d/
O.85f~kbE1
Figure A. Stress-strain distributions at balancedcondition--doubly reinforced member
The eb can be determined as follows.
eb b-
0.45 f(2k -2\ 2-d'0.42 f' k -kcbd + fup'bd(d-d'
0.85 f'k bd + f' p'bd - f; pbdc b ssu
- )d + 0.25f (d -d')
0.42 0.425 f'
c c
Al18
Therefore,
2kbk2 + sup' -kb 0)
eb b 0.425 f'c (A29)
d f p f' (y + su2kb - 0.425 f' 0.425 f'
C C
c. For sections controlled by tension, the stress in thecompression reinforcement is small and may be neglected;therefore, Equations 11-13 may also be used for doublyreinforced members.
d. For sections controlled by compression, the 4Pn can beobtained from Equation A25:
OP = 0(0.85 f'k bd + f' p'bd - f pbd) (A30)n c u su su
The OM n can be obtained by multiplying Equation A30
by e , i.e.,
Mn = P ne
= 0.85 f'k bd + f' p'bdn cku su
(A31)
- su d- ( I d-)]d
where fsu is given in Equation A21 and fsu is givenin Equation A28 with kb = ku . From Equations A25and A26, it can be shown that
0.85 f'bde'k + f ' p'bde' - f Pbde'c u 'SU su
(A32)
=0.425 (2 - k2 \bd 2 f' 'bd(d - d')0 4 5 fc 2 u - u J b + - )p
Substituting Equation A21 and Equation A28 with kb - ku
AI19
-I,.- M
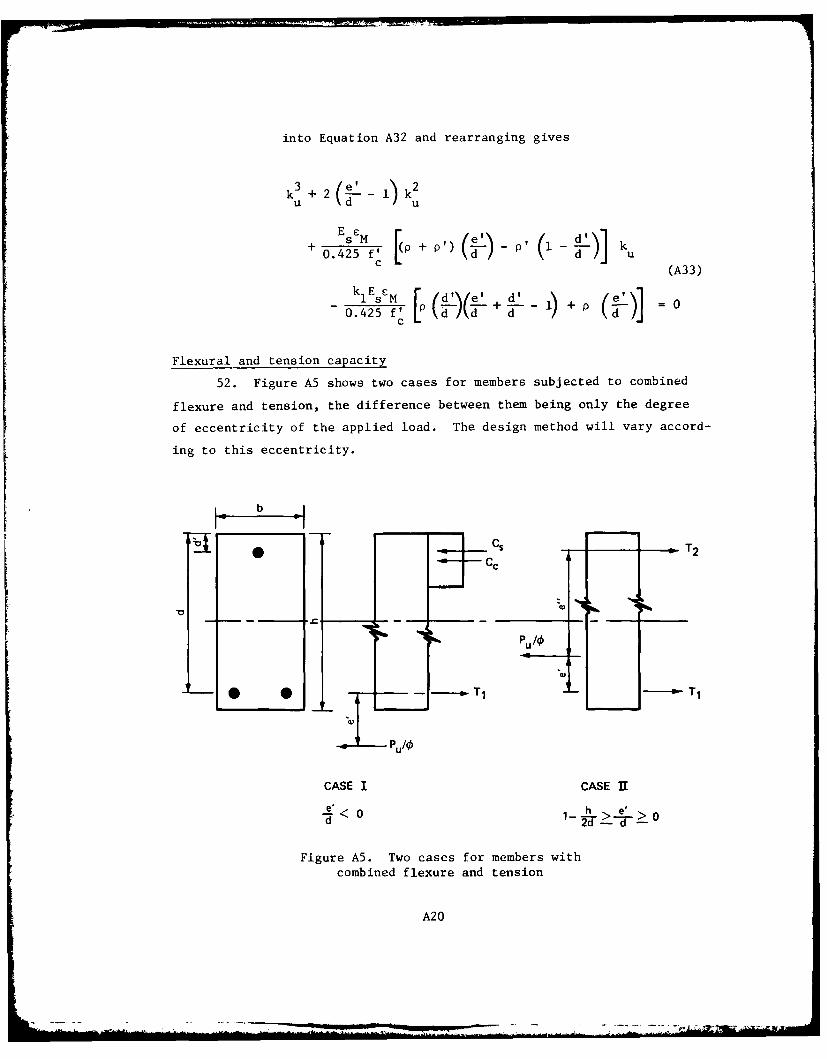
into Equation A32 and rearranging gives
k3+2 2 -1kU d u
+ [( E P + P') - p' i - k
c (A33)
i Es cM [P ( TO(2-i+i I) + =00.425 f' \d /d d d
c
Flexural and tension capacity
52. Figure A5 shows two cases for members subjected to combined
flexure and tension, the difference between them being only the degree
of eccentricity of the applied load. The design method will vary accord-
ing to this eccentricity.
CASE I CASE UI
dT1- -- ---->0
1- 2d - d
Figure A5. Two cases for members withcombined flexure and tension
A20
a. Case I. Case I has eccentricity ratio e'/d < 0 . Itcan be seen from Figure A5 that this case is similar tothat of the combined flexural and compression case.Therefore, Equations 11-13 are applicable.
b. Case II. In this case, the applied tensile resultantPu/O lies between the two layers of steel. The forcesin the two layers are unequal and are determined bystatics. The required steel areas are
P el'As= u (A34)
s f (d - d')
P e'A' = us f y(d - d') (A35)
Since e' = d - d' - e' , Equation A34 can be writtenas
P (d - d' - e')A=uA -' (A36)
s Of y(d - d')
Shear Strength Requirement
Factored shear force
53. Test results indicate that shear strength near supports is
increased if compression is introduced into tfie member. Accordingly,
for design stems and toes of T-walls, the critical shear is at a dis-
tance d from the support. Since the reaction is in tension in the
heels and keys of T-walls and in the stems of L-walls without toes, the
factored shear should be computed at the support.
Shear strength of walls
54. The shear provisions of Section 11.3 of ACI 318-77 are speci-
fied for T-wall designs. For short keys or toes with a length-to-depth
ratio of unit or less, the special provisions for brackets given in
Section 11.9 of ACI 318-77 should be followed.
A2 1
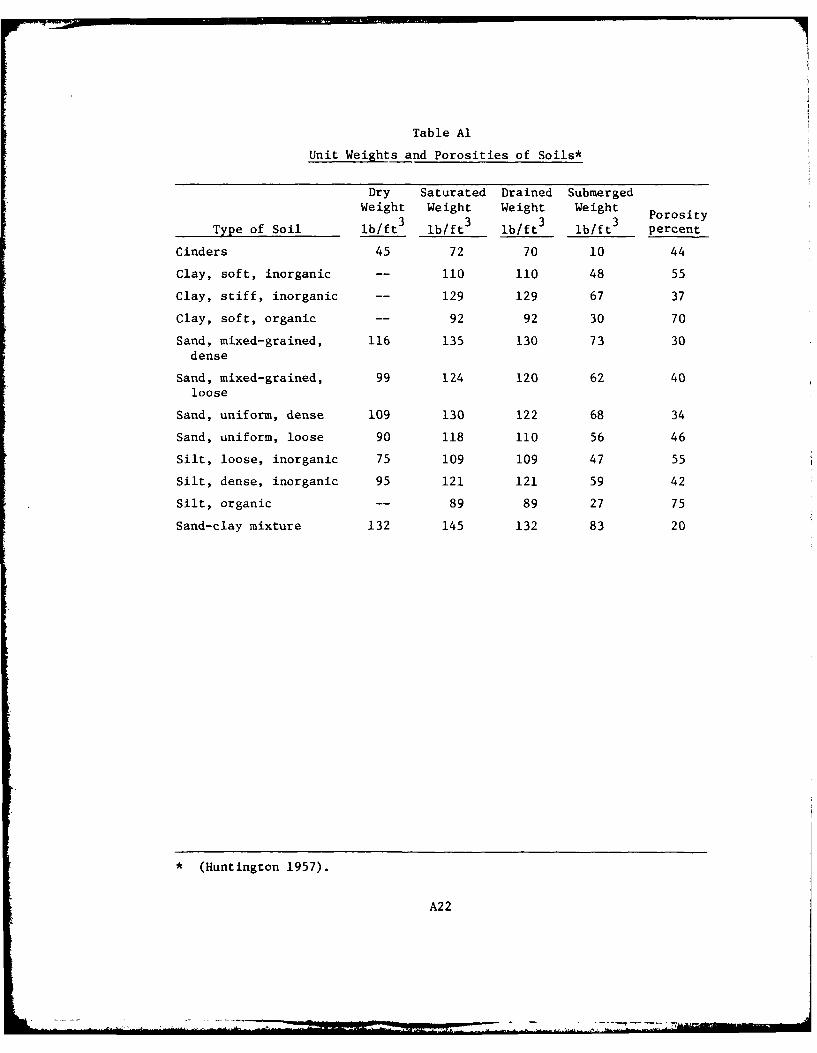
Table Al
Unit Weights and Porosities of Soils*
Dry Saturated Drained Submerged
Weight Weight Weight Weight3 3 3Porosity
Type of Soil lb/ft 3 lb/ft3 lb/ft 3 lb/ft 3 percent
Cinders 45 72 70 10 44
Clay, soft, inorganic -- 110 110 48 55
Clay, stiff, inorganic -- 129 129 67 37
Clay, soft, organic -- 92 92 30 70
Sand, mixed-grained, 116 135 130 73 30dense
Sand, mixed-grained, 99 124 120 62 40loose
Sand, uniform, dense 109 130 122 68 34
Sand, uniform, loose 90 118 110 56 46
Silt, loose, inorganic 75 109 109 47 55
Silt, dense, inorganic 95 121 121 59 42
Silt, organic -- 89 89 27 75
Sand-clay mixture 132 145 132 83 20
* (Huntington 1957).
A22
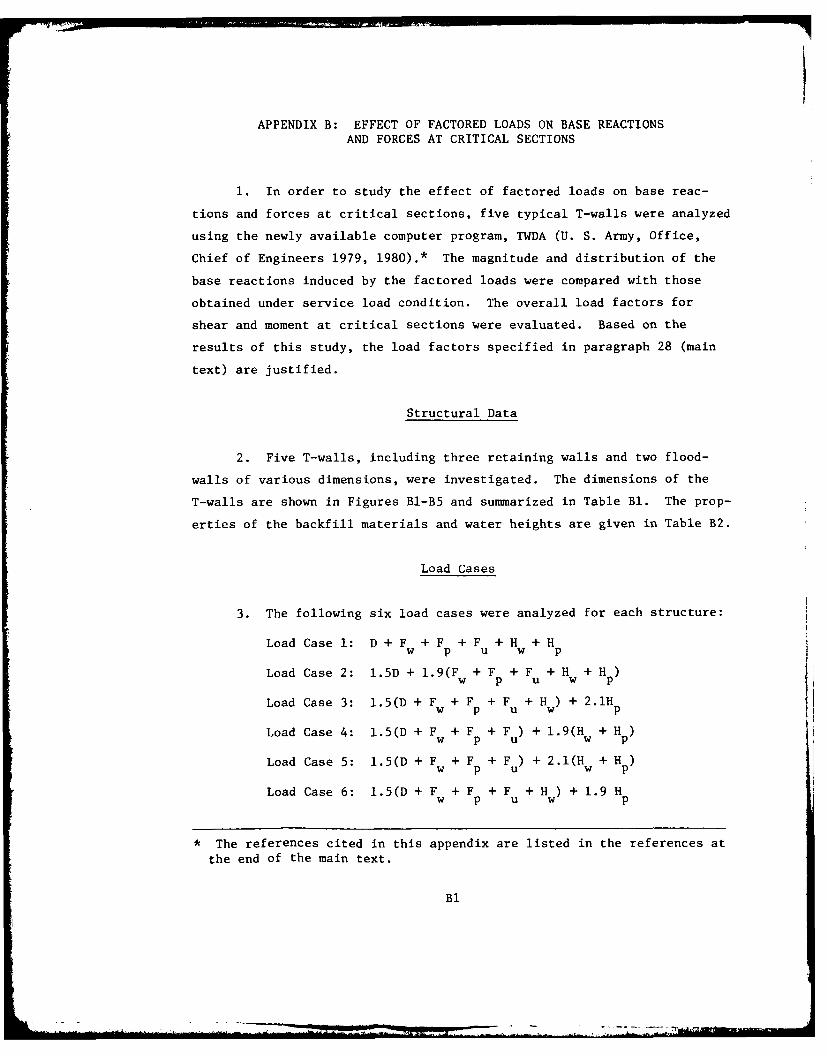
APPENDIX B: EFFECT OF FACTORED LOADS ON BASE REACTIONS
AND FORCES AT CRITICAL SECTIONS
1. In order to study the effect of factored loads on base reac-
tions and forces at critical sections, five typical T-walls were analyzed
using the newly available computer program, TWDA (U. S. Army, Office,
Chief of Engineers 1979, 1980).* The magnitude and distribution of the
base reactions induced by the factored loads were compared with those
obtained under service load condition. The overall load factors for
shear and moment at critical sections were evaluated. Based on the
results of this study, the load factors specified in paragraph 28 (main
text) are justified.
Structural Data
2. Five T-walls, including three retaining walls and two flood-
walls of various dimensions, were investigated. The dimensions of the
T-walls are shown in Figures Bl-B5 and summarized in Table Bl. The prop-
erties of the backfill materials and water heights are given in Table B2.
Load Cases
3. The following six load cases were analyzed for each structure:
Load Case 1: D + F + F + F + H + Hw p u w p
Load Case 2: .51D + 1.9(Fw + F + F + H + H )w p u w p
Load Case 3: 1.5(D + Fw +P u + H p) + 2.1Hw Fp u + 19 w + p)
Load Case 4: 1.5(D + Fw + F + F ) + 1.9(H + H )
Load Case 5: 1.5(D + Fw + Fp + F ) + 2.1(Hw + H )
Load Case 6: 1.5(D + F + F + F +H) + 1.9 Hw p u w-p
* The references cited in this appendix are listed in the references at
the end of the main text.
Bl
BII
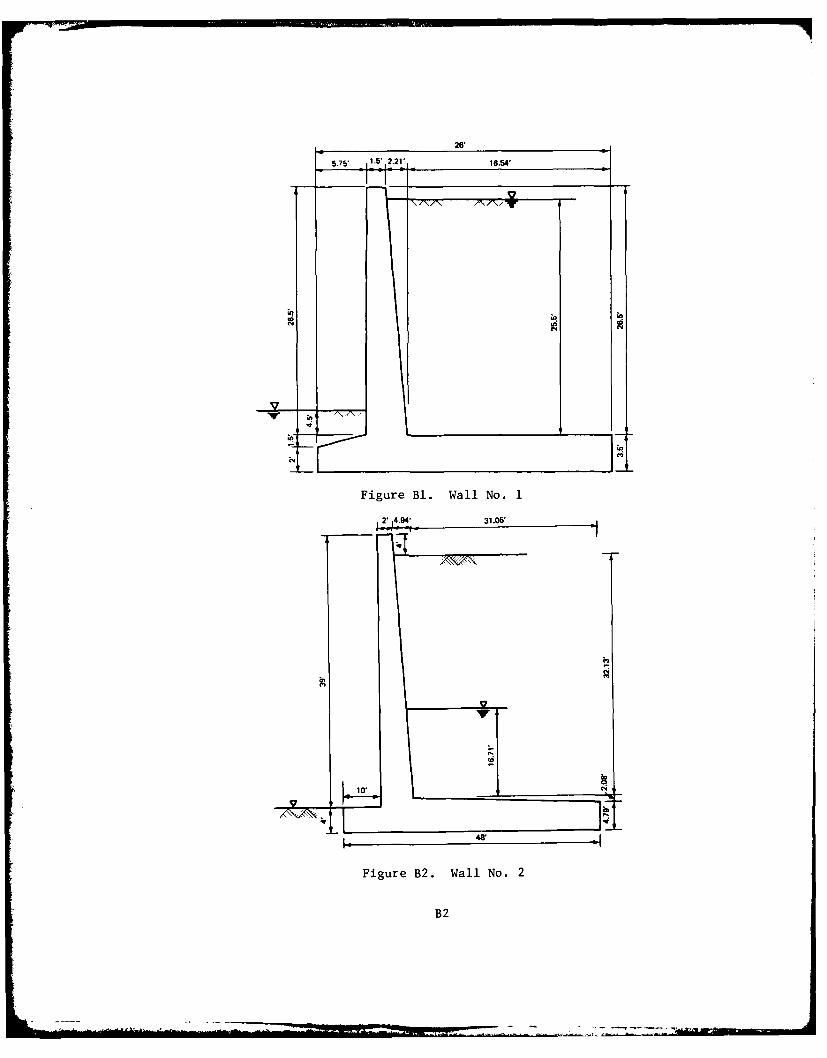
26'
5.75' 15'.221
Figure Bi. Wall No. 1
2' .t 31.05'
Iw'
Figure B2. Wall No. 2
B2
25'
Figure B3. Wall No. 3
10,0
1.2,
Figure B4. Wall No. 4
B3
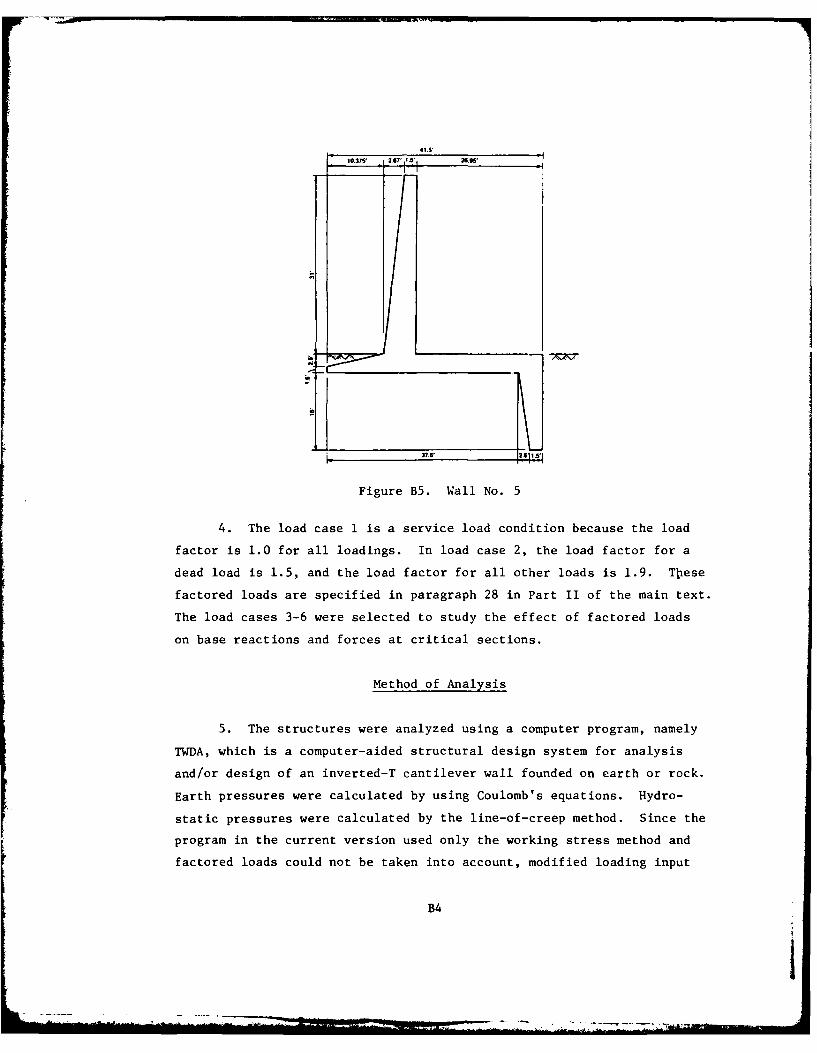
41VS
10.375 6 7 2
-. 37.5
Figure B5. Wall No. 5
4. The load case 1 is a service load condition because the load
factor is 1.0 for all loadings. In load case 2, the load factor for a
dead load is 1.5, and the load factor for all other loads is 1.9. These
factored loads are specified in paragraph 28 in Part II of the main text.
The load cases 3-6 were selected to study the effect of factored loads
on base reactions and forces at critical sections.
Method of Analysis
5. The structures were analyzed using a computer program, namely
TWDA, which is a computer-aided structural design system for analysis
and/or design of an inverted-T cantilever wall founded on earth or rock.
Earth pressures were calculated by using Coulomb's equations. Hydro-
static pressures were calculated by the line-of-creep method. Since the
program in the current version used only the working stress method and
factored loads could not be taken into account, modified loading input
B4
I
was required for factored loads. For example, in load case 2, the unit
weight of concrete was increased 1.5 times, and the unit weights of the
water and earth were increased 1.9 times to account for the factored
loads. In the load cases where the load factors for vertical earth pres-
sure and lateral earth pressure were different (load cases 3 and 6), the
K-value for lateral earth pressure was adjusted to account for the
difference.
Results
6. The magnitude and distribution of the base reactions induced
by the factored loads are summarized in Tables B3-B7. It can be seen
that the factored loads (load cases 2-6) only caused slight relocation
of the resultant eccentricities from that obtained under service load
condition (load case 1). Comparing the locations of the resultant
forces between load cases 1 and 2 (service load versus the factored
loads specified in paragraph 28 (main text), the deviations were gener-
ally less than I percent and 9 percent for retaining walls and flood-
walls, respectively.
7. Tables B8-B12 show the overall load factors for shear and
moment at critical sections. The overall load factors were obtained by
dividing the calculated shear and moment by the respective values ob-
tained from load case 1. For the walls investigated, the overall load
factors varied from 1.27 to 2.87. In general, higher load factors were
found in the heel than those in the toe. However, for the factored loads
specified in paragraph 23.of the main text (load case 2), a fairly uni-
form load factor for all structural elements of the wall was noticed.
For example, in load case 2, the average load factors were 1.9, 1.8,
2.4, and 1.9 for stem, toe, heel, and key, respectively.
8. Based on the above discussion, it can be concluded that the
factored loads specified in paragraph 28 (main text) will result in
designs comparable to those designed by the working stress method.
B5

Table BI
Pertinent Dimensions of Walls
Total Total
Wall Stem Base Heel Toe Key Stem Heel ToeWall Wall Height Height Length Length Length Depth Thickness Thickness ThicknessNo. Type ft ft ft ft ft ft ft ft ft
I Retaining 30 26.5 26 16.54 5.75 0 1.5/3.71 3.5 2/3.5wall
2 Retaining 43 39 48 31.05 10 0 2/6.94 4.79/6.87 4wall
3 Retaining 27 23.72 25 20.83 1 0 1.5/3.17 1.5/3.28 1.5wall
4 Flood- 34.25 23.5 29.25 16.5 10 10.75 1.5/2.75 2.75 1.5/2.75wall
5 Flood- 50 31 41.5 26.95 10.375 19 1.5/4.17 4.0 1.5/4.0wall
Table B2
Properties of Backfill Materials
Angle ofInternal Unit Backfill Water Backfill Water
Wall Friction Cohesive Weight Over Heel Over Heel Over Toe Over ToeNo. deg Strength pcf ft ft ft ft
1 30 0 128 25.5 25.5 4.5 4.5
2 28 0 125 32.13 16.71 0 0
3 32 0 130 17.72 17.72 0 0
4 21.8 0 120 5.75 23.5 5.75 5.75
5 30 0 125 0 31 0 0
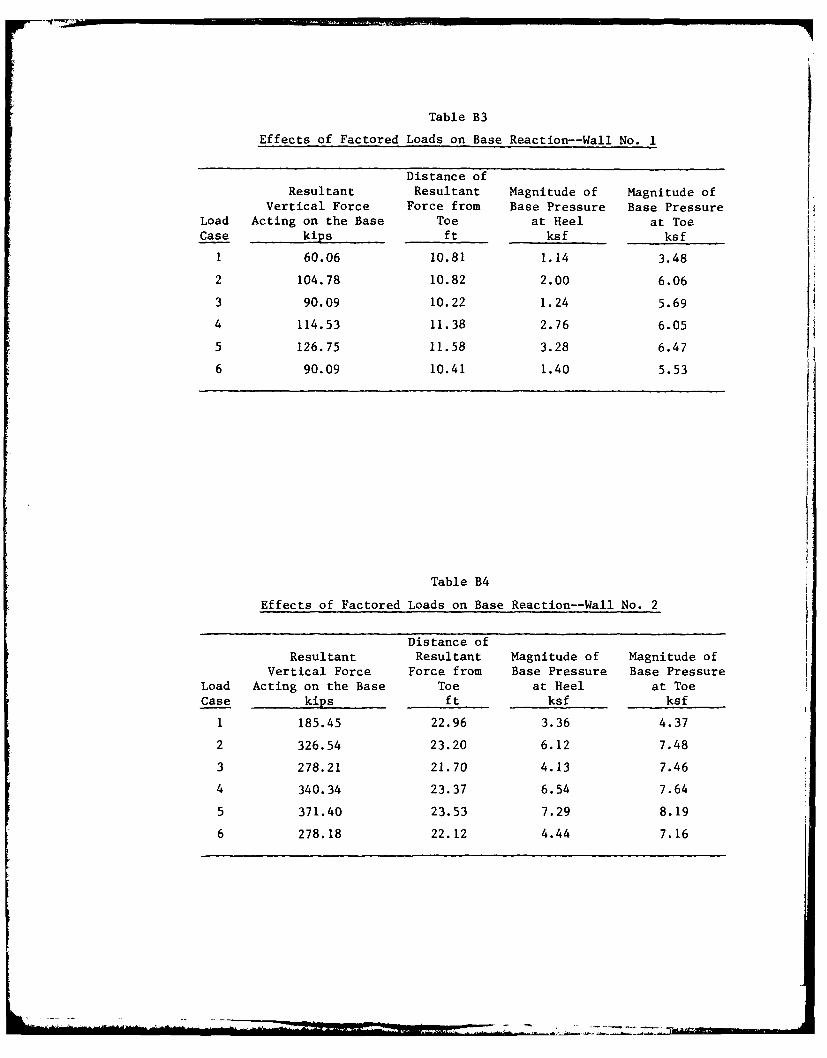
Table B3
Effects of Factored Loads on Base Reaction--Wall No. 1
Distance ofResultant Resultant Magnitude of Magnitude of
Vertical Force Force from Base Pressure Base PressureLoad Acting on the Base Toe at Heel at ToeCase kips ft ksf ksf
1 60.06 10.81 1.14 3.48
2 104.78 10.82 2.00 6.06
3 90.09 10.22 1.24 5.69
4 114.53 11.38 2.76 6.05
5 126.75 11.58 3.28 6.47
6 90.09 10.41 1.40 5.53
Table B4
Effects of Factored Loads on Base Reaction--Wall No. 2
Distance ofResultant Resultant Magnitude of Magnitude of
Vertical Force Force from Base Pressure Base PressureLoad Acting on the Base Toe at Heel at ToeCase kips ft ksf ksf
1 185.45 22.96 3.36 4.37
2 326.54 23.20 6.12 7.48
3 278.21 21.70 4.13 7.46
4 340.34 23.37 6.54 7.64
5 371.40 23.53 7.29 8.19
6 278.18 22.12 4.44 7.16
-O
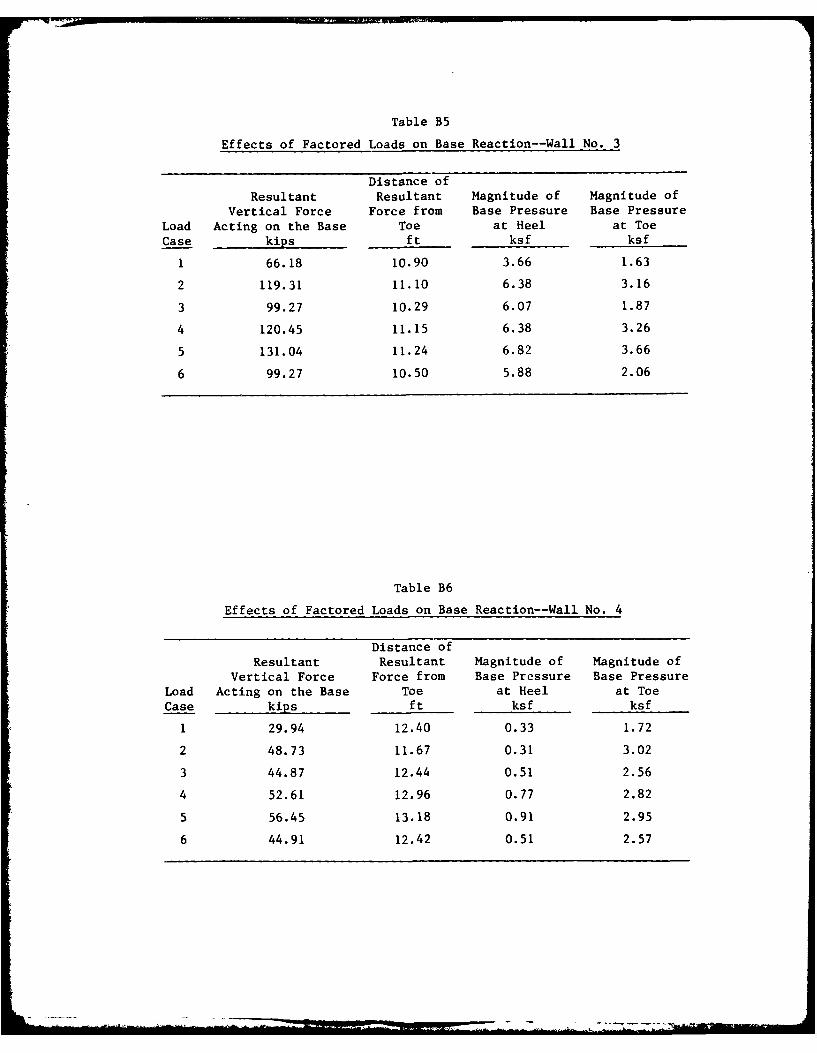
Table B5
Effects of Factored Loads on Base Reaction--Wall No. 3
Distance ofResultant Resultant Magnitude of Magnitude of
Vertical Force Force from Base Pressure Base Pressure
Load Acting on the Base Toe at Heel at Toe
Case kips ft ksf ksf
1 66.18 10.90 3.66 1.63
2 119.31 11.10 6.38 3.16
3 99.27 10.29 6.07 1.87
4 120.45 11.15 6.38 3.26
5 131.04 11.24 6.82 3.66
6 99.27 10.50 5.88 2.06
Table B6
Effects of Factored Loads on Base Reaction--Wall No. 4
Distance ofResultant Resultant Magnitude of Magnitude of
Vertical Force Force from Base Pressure Base Pressure
Load Acting on the Base Toe at Heel at Toe
Case kips ft ksf ksf
1 29.94 12.40 0.33 1.72
2 48.73 11.67 0.31 3.02
3 44.87 12.44 0.51 2.56
4 52.61 12.96 0.77 2.82
5 56.45 13.18 0.91 2.95
6 44.91 12.42 0.51 2.57

Table B7
Effects of Factored Loads on Base Reaction--Wall No. 5
Distance ofResultant Resultant Maximum X-Coordinate of
Vertical Force Force from Pressure Zero PressureLoad Acting on the Base Toe at Toe (Distance from Toe)Case kips ft ksf ft
1 59.40 13.23 3.00 39.67
2 95.94 11.69 5.48 35.01
3 89.11 13.26 4.49 39.73
4 89.76 13.20 4.54 39.52
5 90.08 13.18 4.56 39.53
6 89.11 13.25 4.49 39.73
Table B8
Load Factors for Shear and Moment at Critical Sections--Wall No. 1
Load Stem Toe HeelCase Shear Moment Shear Moment Shear Moment
1 1.00 1.00 1.00 1.00 1.00 1.00
2 1.90 1.89 1.77 1.78 2.00 1.94
3 1.71 1.70 1.64 1.63 1.72 1.80
4 1.78 1.77 1.70 1.70 1.91 1.83
5 1.91 1.90 1.79 1.80 2.12 2.00
6 1.64 1.64 1.59 1.59 1.64 1.70
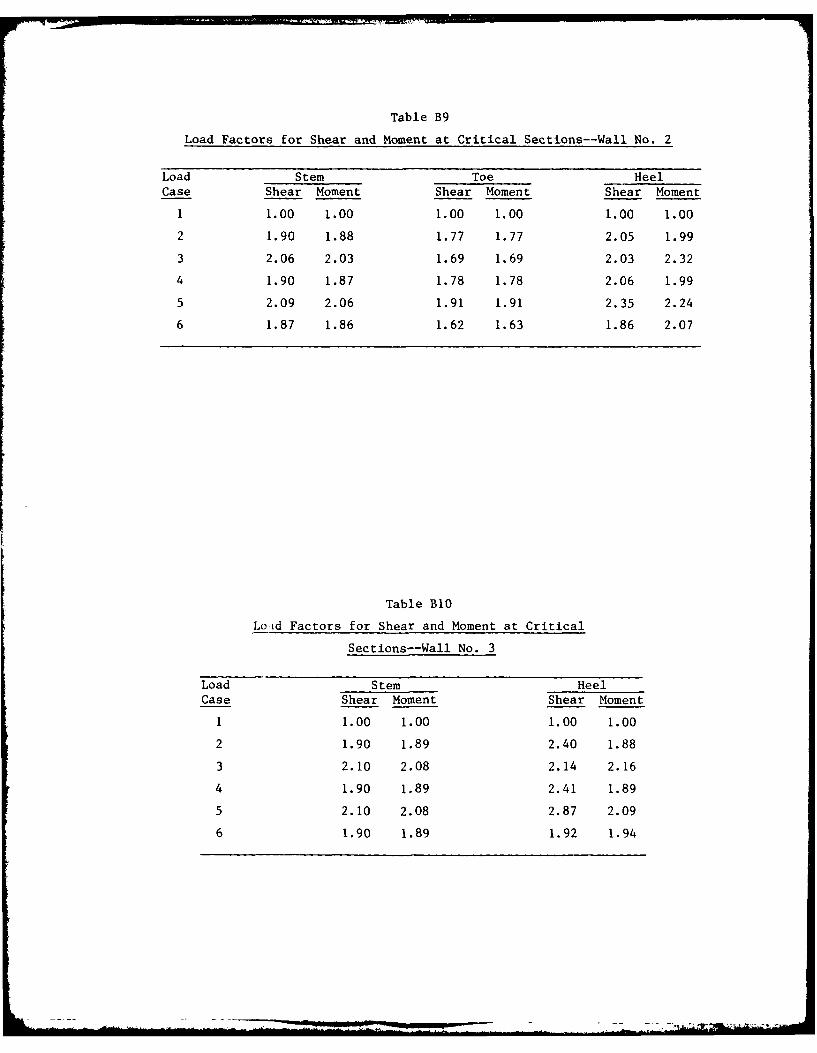
Table B9
Load Factors for Shear and Moment at Critical Sections--Wall No. 2
Load Stem Toe Heel
Case Shear Moment Shear Moment Shear Moment
1 1.00 1.00 1.00 1.00 1.00 1.00
2 1.90 1.88 1.77 1.77 2.05 1.99
3 2.06 2.03 1.69 1.69 2.03 2.32
4 1.90 1.87 1.78 1.78 2.06 1.99
5 2.09 2.06 1.91 1.91 2.35 2.24
6 1.87 1.86 1.62 1.63 1.86 2.07
Table B1O
Lo-id Factors for Shear and Moment at Critical
Sections--Wall No. 3
Load Stem Heel
Case Shear Moment Shear Moment
1 1.00 1.00 1.00 1.00
2 1.90 1.89 2.40 1.88
3 2.10 2.08 2.14 2.16
4 1.90 1.89 2.41 1.89
5 2.10 2.08 2.87 2.09
6 1.90 1.89 1.92 1.94

Table Bll
Load Factors for Shear and Moment at Critical Sections-Wall No. 4
Load Stem Toe Key Heel
Case Shear Moment Shear. Moment Shear Moment Shear Moment*
1 1.00 1.00 1.00 1.00 1.00 1.00 1.00 1.00
2 1.90 1.90 1.79 1.79 1.90 1.91 2.42 2.35
3 1.50 1.50 1.50 1.49 1.69 1.78 1.49 1.64
4 1.50 1.50 1.46 1.45 1.34 1.09 1.53 1.74
5 1.50 1.50 1.43 1.43 1.27 0.88 1.55 1.86
6 1.50 1.50 1.50 1.50 1.63 1.69 1.49 1.59
Alternate load case analysis without passive pressure.
Table B12
Load Factors for Shear and Moment at Critical Sections-Wall No. 5
Load Stem - Toe Key HeelCase Shear Moment Shear Moment Shear Moment Shear Moment*
1 1.00 1.00 1.00 1.00 1.00 1.00 1.00 1.00
2 1.90 1.90 1.86 1.85 1.90 1.91 2.30 2.06
3 1.50 1.50 1.50 1.50 1.50 1.49 1.49 1.52
.4 1.50 1.50 1.49 1.49 1.48 1.47 1.49 1.54
5 1.50 1.50 1.48 1.48 1.46 1.45 1.48 1.56
6 1.50 1.50 1.50 1.50 1.50 1.49 1.50 1.52
Alternate load case analysis without passive pressure.

APPENDIX C: DESIGN METHODS FOR CRACK CONTROL
Introduction
I In the past, flexural cracking in reinforced concrete hydrau-
lic structures has not been a serious practical problem since the
stresses in the steel under working loads have been fairly low. However,
with the use of higher strength steels, sone visible cracks night be ex-
pected even under service loads. The resulting cracks are not serious
from the point of view of safety; however, they may impair the appear-
ance of a member or increase the risk of corrosion of the reinforcement.
In order to avoid this, specific consideration must be given to control
of cracking in the design of reinforced concrete members.
2. The objective of this appendix is to review the subject of
crack control and its relation to corrosion, with particular reference
to the service conditions of concrete hydraulic structures.
3. Some general background information on crack mechanism will
first be reviewed. An appraisal of the available field exposure test
data relevant to crack widths and corrosion will..be made. The existing
design methods of controlling crack widths will be evaluated and a recomn-
mended method for crack control of reinforced concrete hydraulic struc-
tures will be formulated.
Cracking Mechanism
4. Most of the early studies on crack mechansim were based on
cracking patterns as observed at the surface of reinforced concrete mem-
bers and have proposed or implied a cracking mechanism on the assumption
thait the concrete tensile stress is uniformly distributed over an effec-
tive area of concrete (RILEM 1957, Reis et al. 1965),* and the cracks
are parallel-sided.
The references cited in this appendix are listed in the references atitiv end of the main text.
Cl

5. In 1965, Broms (1965a, b, and c) attempted to define the shape
of the internal cracking of reinforced concrete through the injection of
epoxy resin into the cracks that occur within loaded specimens. The
internal crack pattern of a 6- by 12-in. concrete cylinder reinforced
with a single No. 8, high strength bar that was loaded to a nominal
stress of 88,700 psi is shown in Figure Cl. Two cracks did not extend
22 * ".. 5 . : o
Figure Cl. Cracking pattern (Broms 1965c)
to the surface of the concrete cylinder. The maximum width of these in-
ternal cracks occurred near the reinforcement. Two other cracks origi-
nated near the reinforcement and extended to the surface. The maximum
width of these surface cracks occurred at the surface. Additional tests
on two rectangular sections with a single reinforcing bar indicated that
cracks that did not extend to the surface had a maximum width near the
reinforcement and tapered and closed within the concrete, while cracks
that reached the surface had a maximum width at the surface and de-
creased to one-third to one-fifth the maximum width at the level of the
reinforcement. Based on experimental studies (Broms 1965 a, b), Broms
proposed a cracking mechanism for reinforced concrete members that is
based on an elastic analysis of concrete stresses, which is a function
of lateral dimensions and crack spacing, and a redistribution of con-
crete stresses that occurs when a new crack formation alters the geom-
etry of the member.
6. Husain and Ferguson (1968) studied internal flexural cracks in
C2
reinforced concrete beams by filling them with resin while loaded and
the load being held constant until the resin had set and then the beam
sawed open. Figure C2 gives the crack profiles for various concrete
covers and steel stresses. It is interesting to see that though the sur-
face crack width increases with increasing cover, the crack widths at
the bar remain roughly constant for a given steel stress.
7. Illston and Steven's (1972) tests confirm the picture provided
by Husain and Ferguson but add an important bit of information, namely,
that the resin was found to penetrate along the surface of the bar for
a considerable distance on either side of the crack into which the resin
was injected, which indicates a degree of separation between concrete
and steel in this region.
8. Goto (1971) tested long, axially reinforced tension specimens
with narrow ducts formed parallel to the reinforcing bar. Ink run into
these ducts during loading penetrated all the cracks formed under load
so that they could then be located after the test by sectioning the
specimen. He noted that numerous internal cracks formed around the
deformed bars. These cracks form cones with the apexes near bar lugs
and with their bases generally directed towards the nearest primary
cracks. Goto also found that the ink penetrated along the bar-concrete
interface, indicating a loss of bond. Goto stated that the bond between
deformed bars and concrete must then depend on the mechanical resistance
of lugs and the frictional resistance between concrete and steel at the
bar surfaces between lugs. Based on these tests, Goto proposed an
idealized picture (Figure C3) of the forces and deformations around a
bar. This picture has been used with considerable success to describe
the characteristics of the behavior of deformed bars and to give a quali-
tative explanation of the splitting mode of bond failure.
9. From the various pieces of research mentioned above, the
cracking mechanism in reinforced concrete members under external load
can be summarized as follows (Beeby 1978).
10. When the tensile strength of the concrete in a flexural or
tensile member is exceeded, surface cracks will form. These cracks will
commonly extend to a considerable depth too close to the neutral
C3
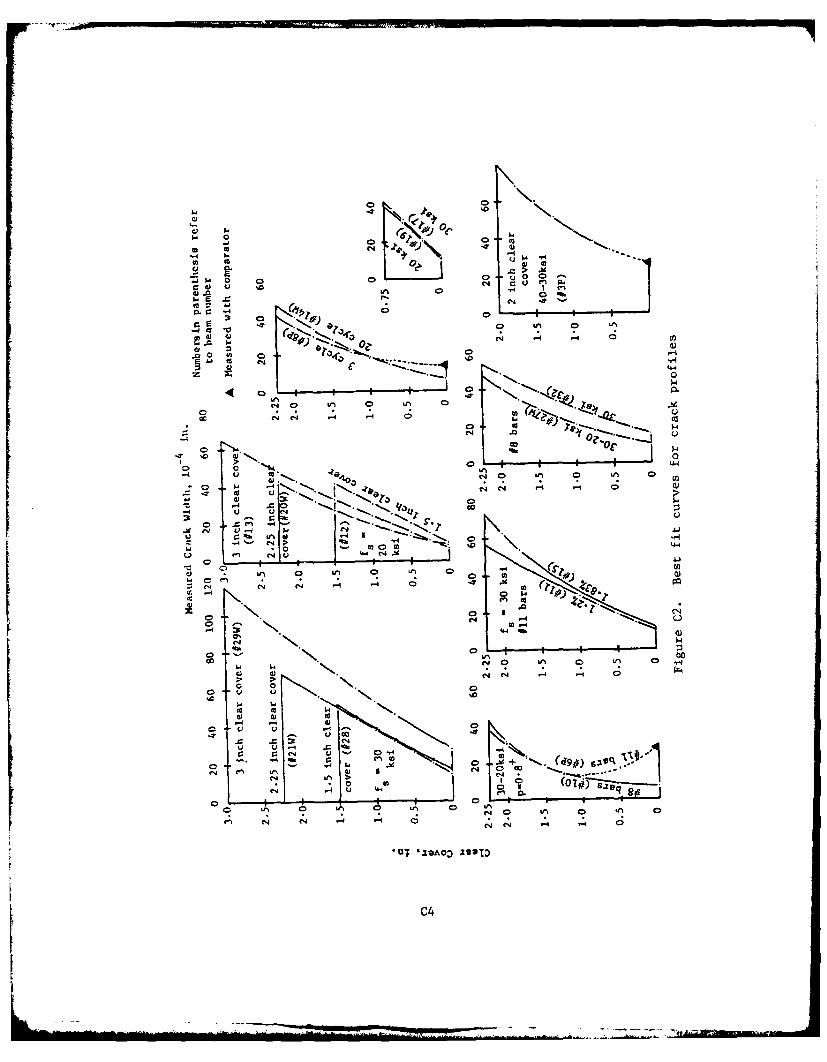
0 0ew
C4 0 u
0 0 '1
0. u --
0Z. r -4 0e
W 4r j eq J r4
0
X:~ 0
0- -4 .1 0 S. cd- c
vu or~
-<. C C.)
v U1
CI Rh. rA 0
- 0
0 4-40r~ 4-~ 44 NC 4 -4 0 1t~ 0 ~
~t. -4
0 F -I-3 "N. 4"C4 I0
co I?' C? .
Cl 0
* u -4 c
0 C4 ' '+. - (d9#)
C4 0
el N4 ;4
*U ZVOD ID
C4

Longitudinal section of axially loaded specimen Cross section
concrete Uncracked zone• ' ., iternally , " \
/ cracked zone "
def ormed bar (with lateral lugs) - .- bar
internal crack Torce on concrete tightening force on bar(due to wedge action anddeformation of teeth of
primary crack force components on bar comb-like concrete)
Figure C3. Deformation of concrete around reinforcing steel
after formation of internal cracks (schematic diagram)
axis for a flexural member or completely through a tension member. The
width of these cracks will be largest at the concrete surface and will,
initially, be very small at the bar-concrete interface. While, almost
certainly, clear passages will exist between the surface and the steel,
any particular section through the crack is likely to appear discontin-
uous, branched, and irregular. Further loading will cause loss of ad-
hesion along the surface of the bar between ribs, a transfer of force
to the ribs adjacent to the main crack, and the initiation of internal
cracking from these ribs. As an internal crack develops and extends,
the stiffness and hence the ability to carry the load of the 'tooth' or
'cone' of concrete acting on the rib is reduced and the load is trans-
ferred back to the next rib. With further loading, internal cracks
develop successively further and further from the main crack until the
midpoint between two main cracks is reached. Once formed, the main
cracks increase in width roughly in proportion to the strain. Even at
high strains, they remain irregular, forked, and discontinuous. Their
width at the bar surface will be defined by the strains in the bar and
C5
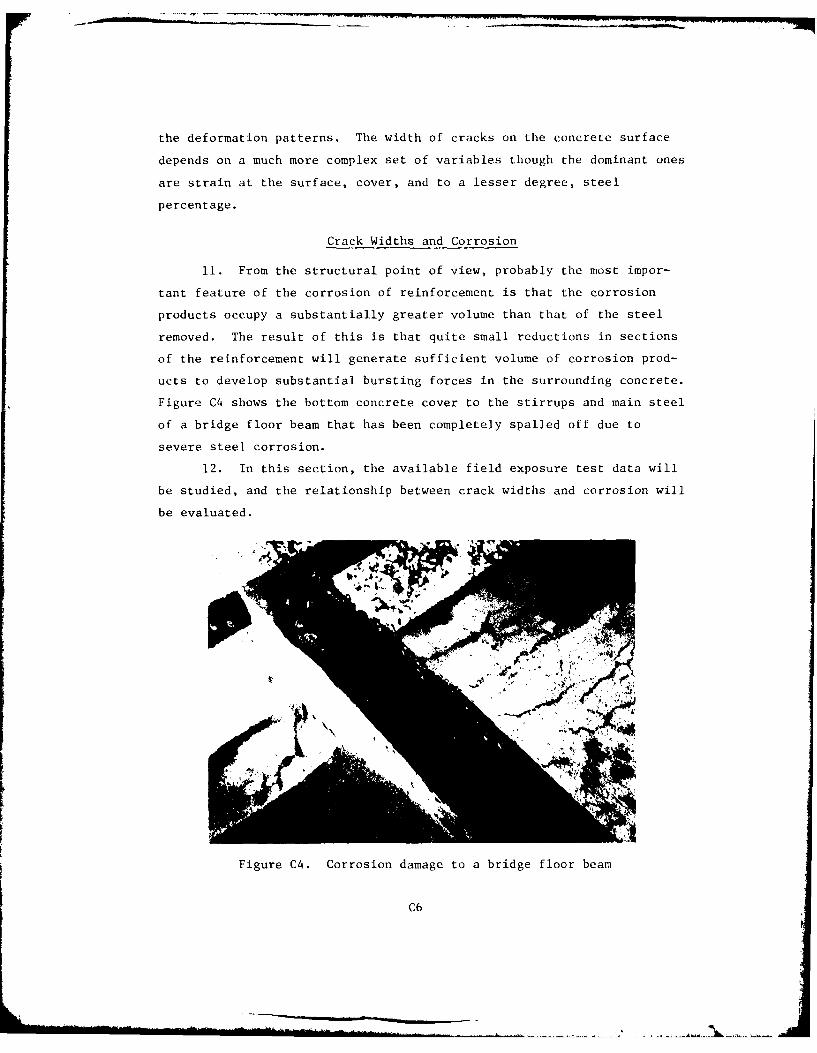
the deformation patterns. The width of cracks on the concrete surface
depends on a much more complex set of variables though the dominant ones
are strain at the surface, cover, and to a lesser degree, steel
percentage.
Crack Widths and Corrosion
11. From the structural point of view, probably the most impor-
tant feature of the corrosion of reinforcement is that the corrosion
products occupy a substantially greater volume than that of the steel
removed. The result of this is that quite small reductions in sections
of the reinforcement will generate sufficient volume of corrosion prod-
ucts to develop substantial bursting forces in the surrounding concrete.
Figure C4 shows the bottom concrete cover to the stirrups and main steel
of a bridge floor beam that has been completely spalled off due to
severe steel corrosion.
12. In this section, the available field exposure test data will
be studied, and the relationship between crack widths and corrosion will
be evaluated.
I
Figure C4. Corrosion damage to a bridge floor beam
C6
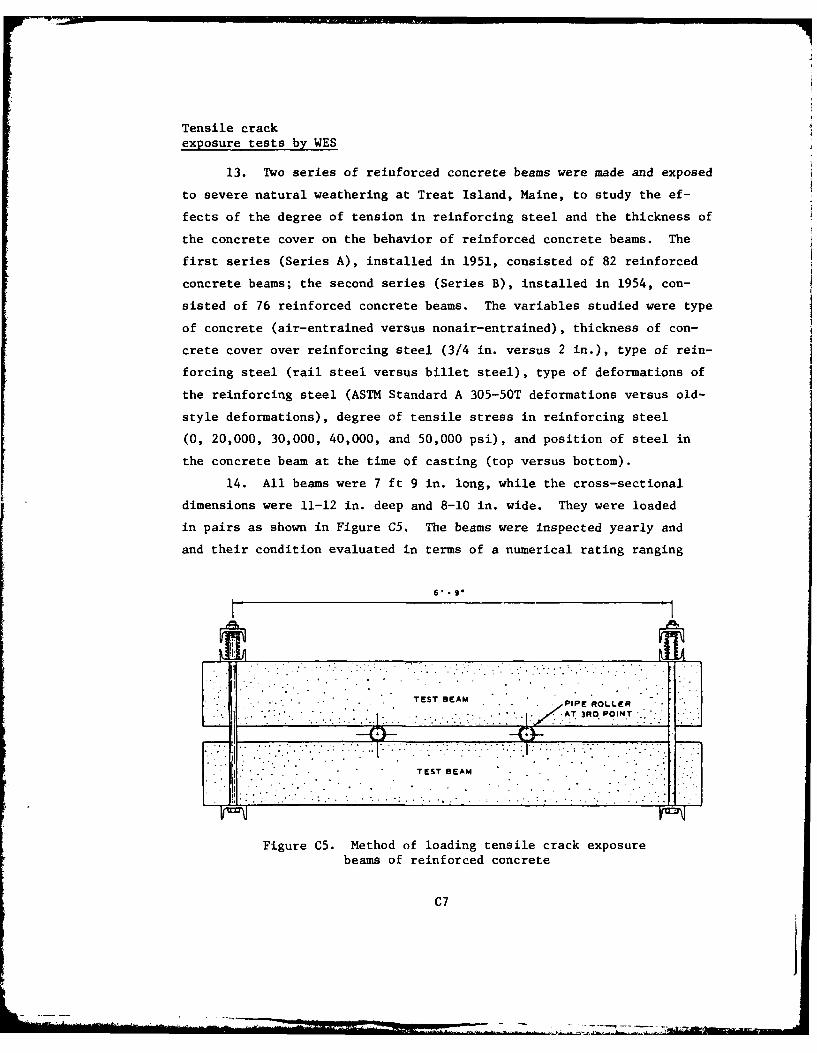
Tensile crackexposure tests by WES
13. Two series of reinforced concrete beams were made and exposed
to severe natural weathering at Treat Island, Maine, to study the ef-
fects of the degree of tension in reinforcing steel and the thickness of
the concrete cover on the behavior of reinforced concrete beams. The
first series (Series A), installed in 1951, consisted of 82 reinforced
concrete beams; the second series (Series B), installed in 1954, con-
sisted of 76 reinforced concrete beams. The variables studied were type
of concrete (air-entrained versus nonair-entrained), thickness of con-
crete cover over reinforcing steel (3/4 in. versus 2 in.), type of rein-
forcing steel (rail steel versus billet steel), type of deformations of
the reinforcing steel (ASTM Standard A 305-50T deformations versus old-
style deformations), degree of tensile stress in reinforcing steel
(0, 20,000, 30,000, 40,000, and 50,000 psi), and position of steel in
the concrete beam at the time of casting (top versus bottom).
14. All beams were 7 ft 9 in. long, while the cross-sectional
dimensions were 11-12 in. deep and 8-10 in. wide. They were loaded
in pairs as shown in Figure C5. The beams were inspected yearly and
and their condition evaluated in terms of a numerical rating ranging
S -9.
.' ... -. . . • . TEST BEAM . PIPE ROLLEfR "[
AT 3RO POINT , ." 2".
* ° ° °. . • -.. 1 1 .,
TEST BEAM . PP OLR .H" .-.,i-iiJ:. . . .......... ..... .. ... " .-.j • .. ................................................
Figure C5. Method of loading tensile crack exposurebeams of reinforced concrete
C7
from 100 (negligible deterioration) to 0 (complete loss of load-carrying
capacity).
15. The first report (Kennedy 1955) on the tests was published in
1955. It describes tests and results up to July 1955. Results after
three winters exposure indicated that no correlation was noted between
increasing stress and increasing deterioration in the beams of air-
entrained concrete. The second report (Roshore 1964) summarizes the
results of exposure tests from 1955 to 1963. Results after 12 winters
of exposure of the Series A beams indicated that the air-entrained con-
crete beams were significantly more resistant to weathering than the
nonair-entrained beams, and that the beams with reinforcing steel having
deformations conforming to ASTM Standard A 305 were more resistant to
weathering than those with reinforcing steel having old-style deforma-
tions. Test data concerning the other test variables are as yet
inconclusive.
16. Finally, O'Neil published a third report (O'Neil 1980) deal-
ing with the laboratory evaluation of the overall performance of the
Series A beams after 25 years exposure. The major conclusions were:
a. Crack widths increased with respect .to both time andstress level in the steel, and the resulting crack widthswere roughly proportional to the stress level of thesteel.
b. The percent of reduction in the cross-sectional area ofthe steel due to corrosion did not exhibit any relation-ship to the stress level during testing. The maximumareas of corrosion occurred at spalled areas, and noareas of maximum reduction of the cross-sectional areaoccurred at flexural cracks.
c. The steel was found to be heavily corroded at spalledareas and generally free from corrosion beneath the3/4-in, cover. Since corrosion could not be found at
any cracks in the beams stressed at the 20,000-psi level,it was concluded that crack widths greater than 0.015 in.were necessary to produce corrosion at flexural cracks.
d. Stressing the steel during the exposure period did notreduce the ultimate moment capacity of the beams belowacceptable levels.
C8

Tests by theInstitut fur Massivbau,Technische Universtat, Munchen
17. Two series of exposure tests have been carried out, each with
10 years duration. The first series was begun in 1957 and the second in
1961. In both series, pairs of identical beams were loaded, as shown
in Figure C6, to a level that induced surface crack widths of 0.01-0.02
in. in the central constant moment zone.
18. Sets of specimens were exposed in four different environments:
a. Normal urban environment (Munich).
b. Heavily polluted industrial atmosphere.
c. Tidal zone, North Sea.
d. Marine atmosphere (above tidal zone).
Some of the specimens were broken open to see how much the bars had cor-
roded after 1, 2, 4, and 10 years. The average depth of corrosion was
measured at each crack, the width of which was recorded at the start of
5.9'
I! LI'
" L4. .A
9.8"
SECTION A-A
Figure C6. Arrangement of Munich tests
C9

the test and again when the beam was broken open.
19. In 1969, Martin and Schiessl (1969 a, b) published two papers
on the tests. These dealt with the results for Series I up to 10 years
and Series II up to 4 years. The basic conclusions stated in these
papers were:
a. There is a linear increase, with increase in crack width,in the maximum amounts of corrosion recorded at cracks of
a particular size.
b. For a given crack width, increase in cover gives a sub-
stantial decrease in corrosion.
c. Environment had no significant influence on corrosion.
d. For equal crack widths, plain bars corroded slightly morethan deformed bars.
Tests by Tremper
20. Tremper (1947) tested 64 small specimens each containing a
single crack of specified size. These specimens were exposed for
10 years: 2 years on the shore of Puget Sound and 8 in the laboratory
yard. Tremper stated that the proximity of the specimens to salt water
probably did not contribute significantly to the corrosiveness of the
environment. Figure C7 illustrates the specimens used; each contained
three bars placed centrally within the blocks. The cracks were produced
by flexure.
Figure C7. Test specimen used by Tremper (1947)
ClO
21. The following variables were investigated:
a. Type of reinforcement. Three types were used; 16-gaugeannealed wire, 7-gauge, cold-drawn wire, 1/4-in. squaredeformed bar.
b. Aggregate grading. A well graded and a poorly gradedaggregate were compared.
c. Mixture proportions. Six mixture proportions were used.
d. Crack widths. Specimens were made with cracks of 0.005,0.0098, 0.02, and 0.049 in.
22. At the end of the test period the specimens were broken open
and the depth of corrosion and the corroded length measured at each
crack. In all cases, corrosion was found to be limited to a small area
around the crack. The 16-gauge annealed wires were found to be corroded
deeply, the 7-gauge cold-drawn, wires were rusted slightly with occa-
sional pits, and the 1/4-in, square deformed bars showed only light rust
with no measurable pitting.
23. Tremper found that the average depth of corrosion increases
marginally with crack width, though this increase did not appear to be
statistically significant, nor did there appear to be any statistical
influence of mixture proportions. There were, however, clearly signifi-
cant differences between the corrosion behavior of the three types of
steel used.
Tests by Atimtay and Ferguson
24. Atimtay and Ferguson (1973) report tests on beams and
slabs subjected to daily spraying with 3-percent salt solution for
up to 2 years. The types of specimen used are illustrated in
Figure C8.
25. The variables considered were:
a. Cover. This was varied from 0.79-1.97 in.
b. Steel stress and cracking. Unstressed specimens togetherwith beams loaded to give steel stresses of 18.8, 30.0,
36.0 ksi were tested.
c. Mixture proportions. Concrete strengths were nominally5.08 ksi, but mixtures were used with water/cement ratios
of 0.49, 0.55, and 0.62.
CIl
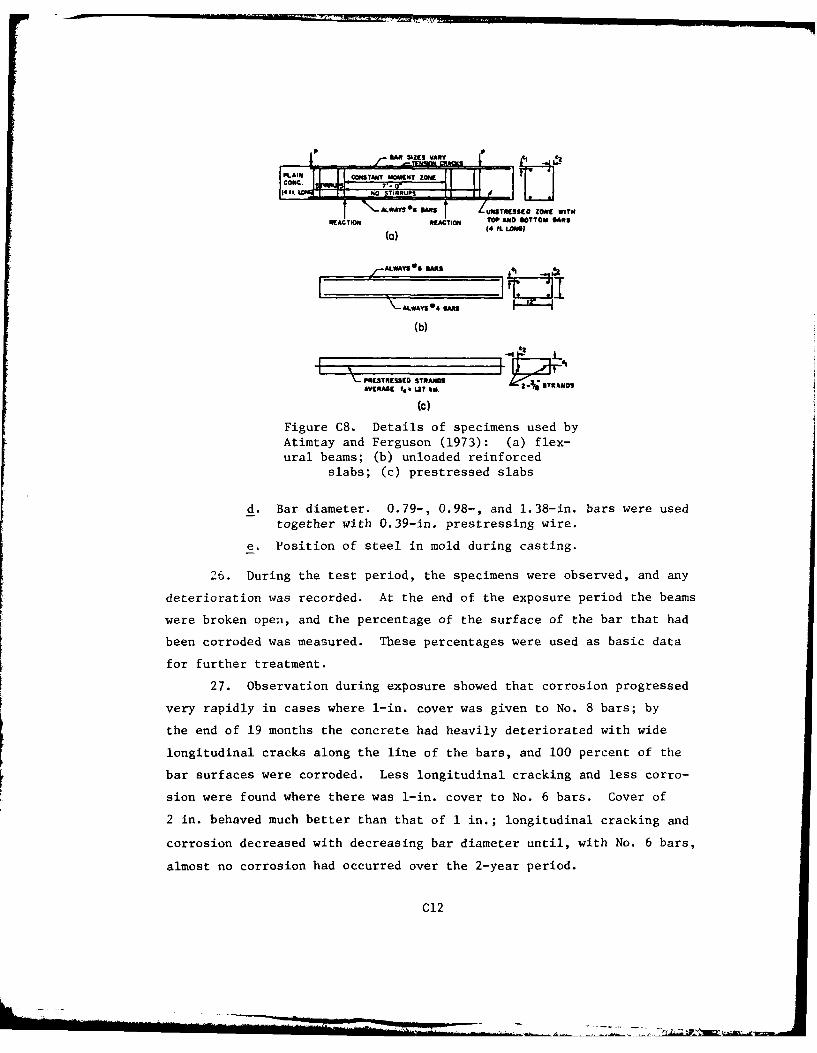
@AR - V C II
0'U l I No STRRUPS r
'\-A*AYS$ SMS USTRESEDZONE WITMRIACTI" RACTION TOP AND BOTTOM BARS
(a) 4LOB
-AcRALWYS . B AR II
'AIWAYS 4 SAN
(b)
PRESTRESSED STRANDS Ta.AVERME 1C . Lai UL.
(C)
Figure C8. Details of specimens used byAtimtay and Ferguson (1973): (a) flex-ural beams; (b) unloaded reinforced
slabs; (c) prestressed slabs
d. Bar diameter. 0.79-, 0.98-, and 1.38-in. bars were usedtogether with 0.39-in. prestressing wire.
e. Position of steel in mold during casting.
26. During the test period, the specimens were observed, and anydeterioration was recorded. At the end of the exposure period the beams
were broken open, and the percentage of the surface of the bar that had
been corroded was measured. These percentages were used as basic data
for further treatment.
27. Observation during exposure showed that corrosion progressed
very rapidly in cases where 1-in. cover was given to No. 8 bars; by
the end of 19 months the concrete had heavily deteriorated with wide
longitudinal cracks along the line of the bars, and 100 percent of the
bar surfaces were corroded. Less longitudinal cracking and less corro-
sion were found where there was 1-in. cover to No. 6 bars. Cover of
2 in. behaved much better than that of 1 in.; longitudinal cracking and
corrosion decreased with decreasing bar diameter until, with No. 6 bars,
almost no corrosion had occurred over the 2-year period.
C12
28. The dominant variables found to influence the percentage of
corrosion were the water-cement ratio and the ratio of cover-to-bar
diameter. Stress level and cracking were found to have only a minimal
influence.
Discussion
29. Based on the available exposure test data, a qualitative de-
scription of the relation between cracking and corrosion can be hypothe-
sized as follows:
a. Cracks permit penetration of carbon dioxide, or chlorides,or both locally into the member; the rate of penetrationbeing a function of crack width.
b. Corrosion will start at the cracks and spread for somedistance on either side of the cracks. If the cover issufficiently thick and of adequate quality, corrosion maynever occur in areas other than adjacent to the cracks.However, with thin cover or more porous concretes thecorrosion will become generalized.
c. The rate of corrosion will not depend upon the crackwidth but rather upon the ability of oxygen to diffusethrough the concrete to the cathodic regions of the barand upon the electrical resistance of the path through theconcrete between anode and cathode.
d. The corrosion products are highly expansive and willgenerate bursting forces within the concrete dependingupon the depth of corrosion, the length of the corrodedregion, and the bar diameter. If the concrete surroundingthe bar is unable to withstand these forces, the coverwill split, producing longitudinal cracks along the lineof the bar. With thick covers and small bar diameters,it is possible for very extensive corrosion to occur with-out the concrete splitting.
Current Design Methods for Crack Control
30. The discussion of the exposure test data suggests that the
control of crack widths may not, in fact, have a very significant influ-
ence on the durability of a reinforced concrete structure. This does
not necessarily imply that the limitation of crack widths in structures
is a totally useless exercise, as there may be reasons other than corro-
sion protection for this limitation. For example, in building
C13
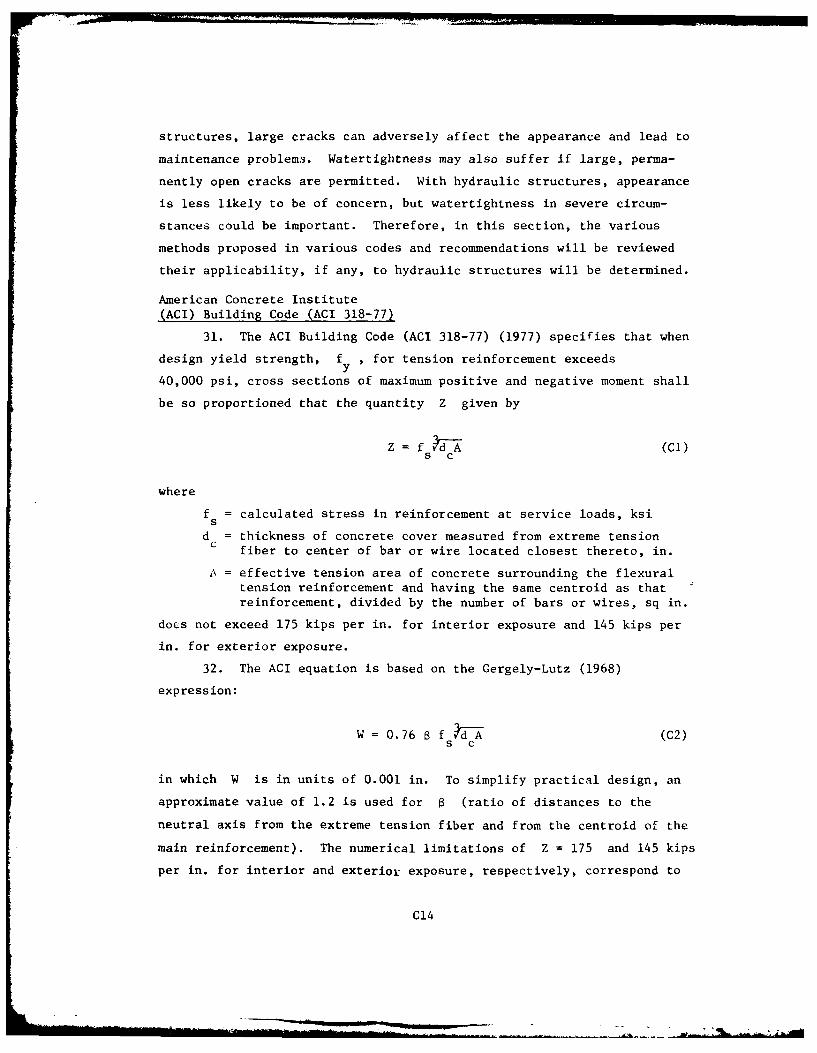
structures, large cracks can adversely affect the appearance and lead to
maintenance problems. Watertightness may also suffer if large, perma-
nently open cracks are permitted. With hydraulic structures, appearance
is less likely to be of concern, but watertightness in severe circum-
stances could be important. Therefore, in this section, the various
methods proposed in various codes and recommendations will be reviewed
their applicability, if any, to hydraulic structures will be determined.
American Concrete Institute
(ACI) Building Code (ACI 318-77)
31. The ACI Building Code (ACI 318-77) (1977) specifies that when
design yield strength, fy , for tension reinforcement exceeds
40,000 psi, cross sections of maximum positive and negative moment shall
be so proportioned that the quantity Z given by
Z = f h (Cl)s c
where
f = calculated stress in reinforcement at service loads, ksis
d = thickness of concrete cover measured from extreme tensionc fiber to center of bar or wire located closest thereto, in.
A = effective tension area of concrete surrounding the flexuraltension reinforcement and having the same centroid as thatreinforcement, divided by the number of bars or wires, sq in.
does not exceed 175 kips per in. for interior exposure and 145 kips per
in. for exterior exposure.
32. The ACI equation is based on the Gergely-Lutz (1968)
expression:
W = 0.76 B f K (C2)s c
in which W is in units of 0.001 in. To simplify practical design, an
approximate value of 1.2 is used for 8 (ratio of distances to the
neutral axis from the extreme tension fiber and from the centroid of the
main reinforcement). The numerical limitations of Z = 175 and 145 kips
per in. for interior and exterior exposure, respectively, correspond to
C14

STRENGTH DESIGN OF REINFORCED CONCRETE HYDRAULIC STRUCTURESI RE--ETC(U)JAN SE T C LIUUNCLASSIFIED W[S/TR/StL-180"4-4 N!.*llllllll*****nll

limiting crack widths of 0.016 and 0.013 in.
33. Equation C2 is a totally empirical formula that was obtained
by fitting various combinations of parameters to experimental data on
maximum crack width (Broms 1956a, Clark 1956, Hognestad 1962, Kaar and
Hognestad 1965, Kaar and Mattock 1963, Rusch and Rehm 1963, 1964).
The danger with empirical formulas is that it is highly likely they will
predict misleading results in situations outside the limits of the data
used to develop the formula. Since the member dimensions, reinforcement
arrangement, and thickness of concrete coversused in the hydraulic
structures are generally beyond the limited range of the data from which
the Gergely-Lutz equation was derived, the use of this equation for hy-
draulic structures cannot be justified.
European ConcreteCommittee (CEB) recommendations
34. Crack control recommendations proposed in the European Model
Code for Concrete Structures (Comite European-International du Beton
1978) apply to prestressed as well as reinforced concrete and can be
summarized as follows.
35. The mean crack width, wm , in beams is expressed in terms of
the mean crack spacing, srm , such that
w = m s (C3)
where
f I f\ f
e = E i - k < 0.4 E: (C4)
and represents the average strain in the steel.
f = steel stress at the cracksk = bond coefficient, 1.0 for ribbed bars, reflecting influence
of load repetitions and load duration
f = steel stress at the crack due to forces causing crackingsr at the tensile strength of concrete
C15
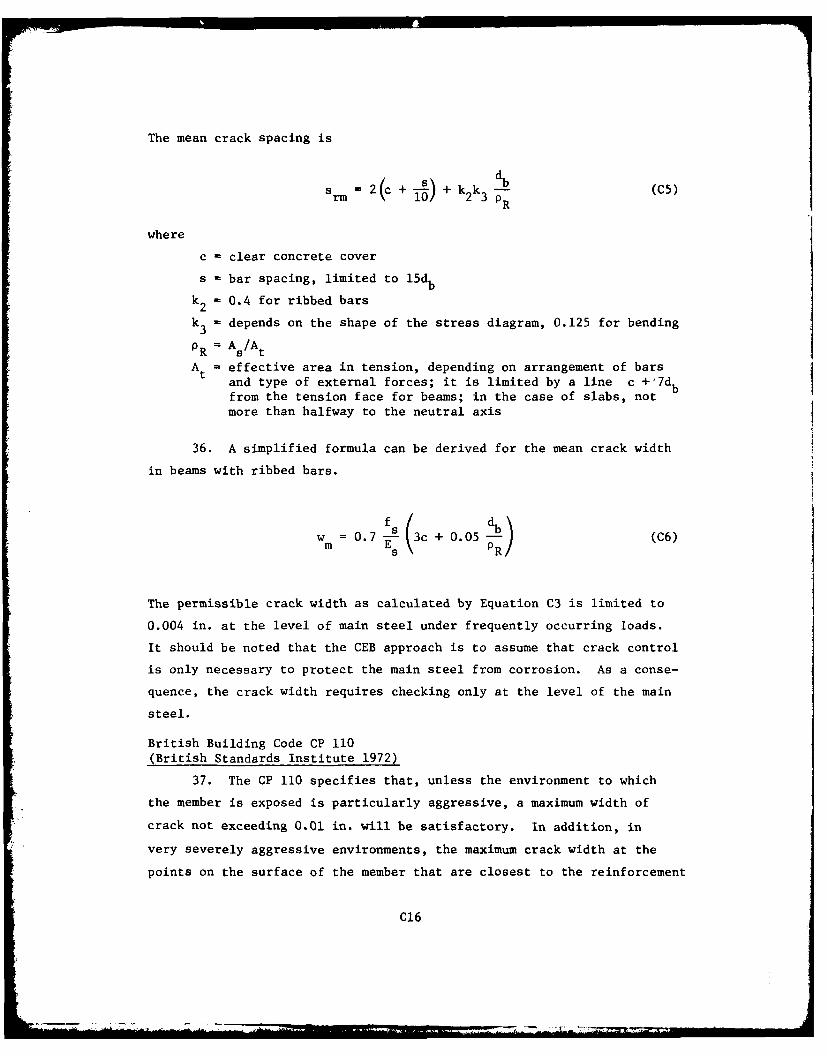
The mean crack spacing is
Srm 2 +- + k k - (C5)
where
c - clear concrete cover
s = bar spacing, limited to 15db
k2 = 0.4 for ribbed bars
k3 = depends on the shape of the stress diagram, 0.125 for bending
PR = As/At
A = effective area in tension, depending on arrangement of barsand type of external forces; it is limited by a line c +'7dbfrom the tension face for beams; in the case of slabs, not
more than halfway to the neutral axis
36. A simplified formula can be derived for the mean crack width
in beams with ribbed bars.
w= 0.7-(3c + 0.05 d (C6)m ES P
The permissible crack width as calculated by Equation C3 is limited to
0.004 in. at the level of main steel under frequently occurring loads.
It should be noted that the CEB approach is to assume that crack control
is only necessary to protect the main steel from corrosion. As a conse-
quence, the crack width requires checking only at the level of the main
steel.
British Building Code CP 110(British Standards Institute 1972)
37. The CP 110 specifies that, unless the environment to which
the member is exposed is particularly aggressive, a maximum width of
crack not exceeding 0.01 in. will be satisfactory. In addition, in
very severely aggressive environments, the maximum crack width at the
points on the surface of the member that are closest to the reinforcement
C16
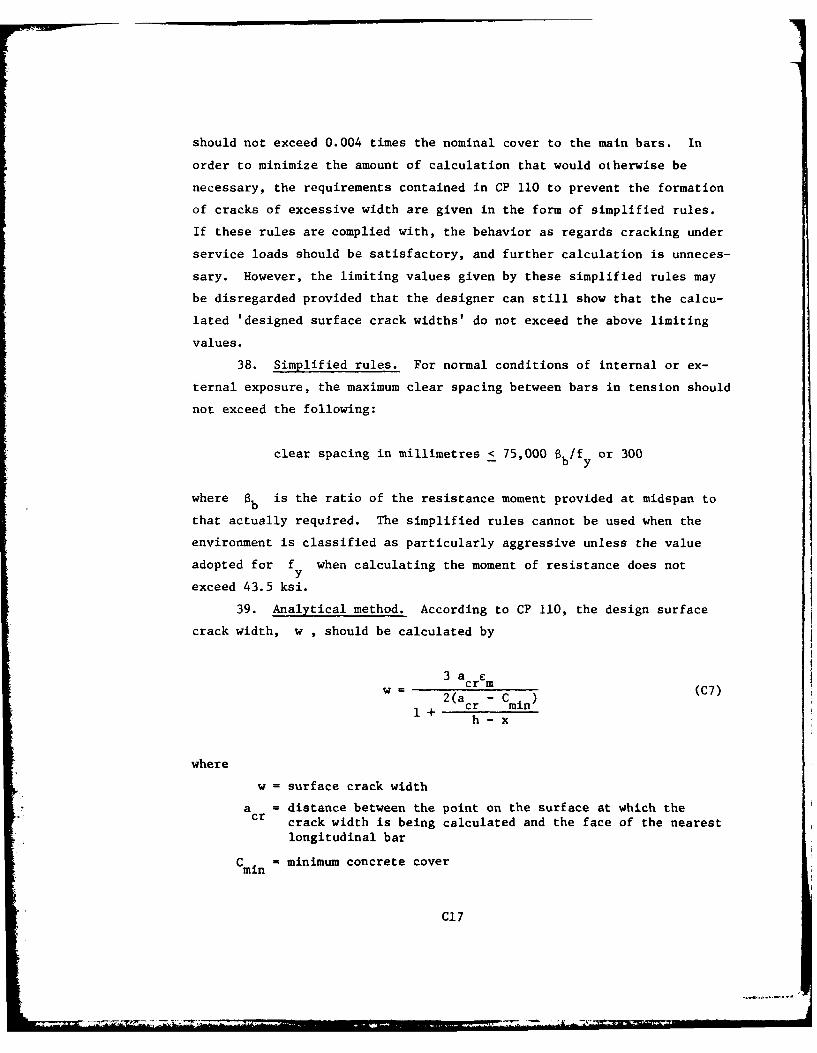
should not exceed 0.004 times the nominal cover to the main bars. In
order to minimize the amount of calculation that would otherwise be
necessary, the requirements contained in CP 110 to prevent the formation
of cracks of excessive width are given in the form of simplified rules.
If these rules are complied with, the behavior as regards cracking under
service loads should be satisfactory, and further calculation is unneces-
sary. However, the limiting values given by these simplified rules may
be disregarded provided that the designer can still show that the calcu-
lated 'designed surface crack widths' do not exceed the above limiting
values.
38. Simplified rules. For normal conditions of internal or ex-
ternal exposure, the maximum clear spacing between bars in tension should
not exceed the following:
clear spacing in millimetres < 75,000 b /f y or 300
where 0b is the ratio of the resistance moment provided at midspan to
that actually required. The simplified rules cannot be used when the
environment is classified as particularly aggressive unless the value
adopted for f when calculating the moment of resistance does notYexceed 43.5 ksi.
39. Analytical method. According to CP 110, the design surface
crack width, w , should be calculated by
3 acw= 2(a (C7)
1+ cr-mih -x
where
w = surface crack width
a = distance between the point on the surface at which thecr crack width is being calculated and the face of the nearest
longitudinal bar
C min minimum concrete cover
C17

h = overall depth
x - depth to the neutral axis obtained when calculating E1
Em = average strain in the member at the level at which thecrack width is being calculated, taking into account thestiffening effect of concrete in tension zone
0.0012 b th(a' - x)
C =E -m 1 Af st(h -x)
C1 =average strain in the member at the level at which thecrack width is being calculated
b = width of the membert
a'= distance from the compressive face to the point beingconsidered
A = steel areas
fst= steel stress
40. Comparing the experimental results and the calculated crack
width using Equation C7 for a series of beams and slabs, Beeby (1978)
concluded that the CP 110 equation predicts the design width with ade-
quate precision (+ 20 percent) for flexural members.
British code forliquid-retaining structures
41. The maximum calculated surface crack widths for liquid-
retaining structures are specified as follows.
Max. Calculated
Exposure Condition Surface Crack Width
Exposed to wetting and drying 0.004 in.
Continuous contact with water 0.008 in.
Others 0.012 in.
42. The crack widths may be calculated according to the follow-
ing formula:
4.5 a eW a cr m (C8)
acr - min1+2.5 h-h -x
where
C18
0.7 b th(a' - x)e X 10-3m 1 Ax(h -x)f st
and all other notations are defined in Equation C7.
43. In addition, the code also specifies that the crack widths
may be deemed to be satisfactory if the steel stress under service con-
ditions does not exceed the appropriate value as shown below.
Steel StressUnder Service
Exposure Condition Conditions
Exposure to wetting 14.5 ksiand drying
Continuous contact 18.9 ksiwith water
44. The provisions given in the British Code for liquid-retaining
structures are more stringent than those given in CP 110 because crack
control is more important in water-retaining structures.
FIP Recommendations forthe design and construc-tion of concrete sea structures
45. The permissible surface crack width is limited to 0.012 in.
In addition, the assessed surface widths of cracks at points nearest the
main reinforcement should not, in general, exceed 0.004 times the nominal
cover to the main reinforcement. No formula for calculating the surface
crack width is given in the FIP Recommendations.
46. Recognizing the fact that thick concrete cover is important
for corrosion protection of steel reinforcement, the FIP Recommendations
(1974) specify that the concrete cover should not be less than 3 in. for
concrete structures in the splash zone.
ACI 350, Sanitary Structures
47. ACI Committee 350 on Sanitary Structures (Klein, Hoffman,
and Rice 1979) recommends that the "Z" factors (see Equation Cl) given
in ACI 318-77 be limited to 115 and 95 kips/in. for normal and severe
sanitary exposure, respectively, corresponding to limiting crack widths
C19
Ali __j

of 0.010 and 0.008 in. ACI 350 further recommends that a maximum of
2 in. for clear cover (Figure C9) be used in the ACI 318-77 equation for
"Z," whenever specified cover is greater. The increase in computed
values of "Z" with added cover simply reflects a trigonometric projection
of the surface crack width, with no particular significance upon durabil-
ity. Added cover in excess of 2 in. has proven its value for long-term
protection, and it may be helpful to consider the excess cover simply as
w
z
CL
Figure C9. Relationship between crack width
and concrete cover
C20
"sacrificial" protection against erosion of the concrete to the depth of
the steel.
48. In addition to checking the "Z" factor, the maximum bar spac-
ing is limited to 12 in., and the maximum bar size is limited to No. 11.
Australia practice onwater-retaining structures(Rangan and Rajasekar 1977)
49. Surface cracks in reinforced concrete structures are limited
to a maximum width of 0.004 in. in the case of members exposed to a
moist or corrosive atmosphere or where watertightness is essential, and
0.008 in. when members are exposed to continuous or almost continuous
contact with liquid. The width of flexure cracks in beams and one-way
slabs is controlled by limiting the diameter of reinforcing bars accord-
ing to the following equation.
2 / Wlim
db 1.47 (1 + < - (C9)[I- _pEst
where
db = diameter of bar
p = steel ratio
C . = concrete coverminWlim = allowable maximum crack width
£st = steel strain at service load
50. Equation C9 is derived from Gergely-Lutz (1968) expression
(Equation C2) assuming 8 of 1.2. As discussed before, the Equation C2
is an empirical formula, and its applicability is limited.
Discussion
51. Probably the major difference between the various crack con-
trol methods is philosophical. The CEB recommendations require a check
on cracking only close to main bars. Cracks elsewhere are not controlled
since it is argued that they will not pose a corrosion problem. The
British codes for building and water-retaining structures and the FIP
C21
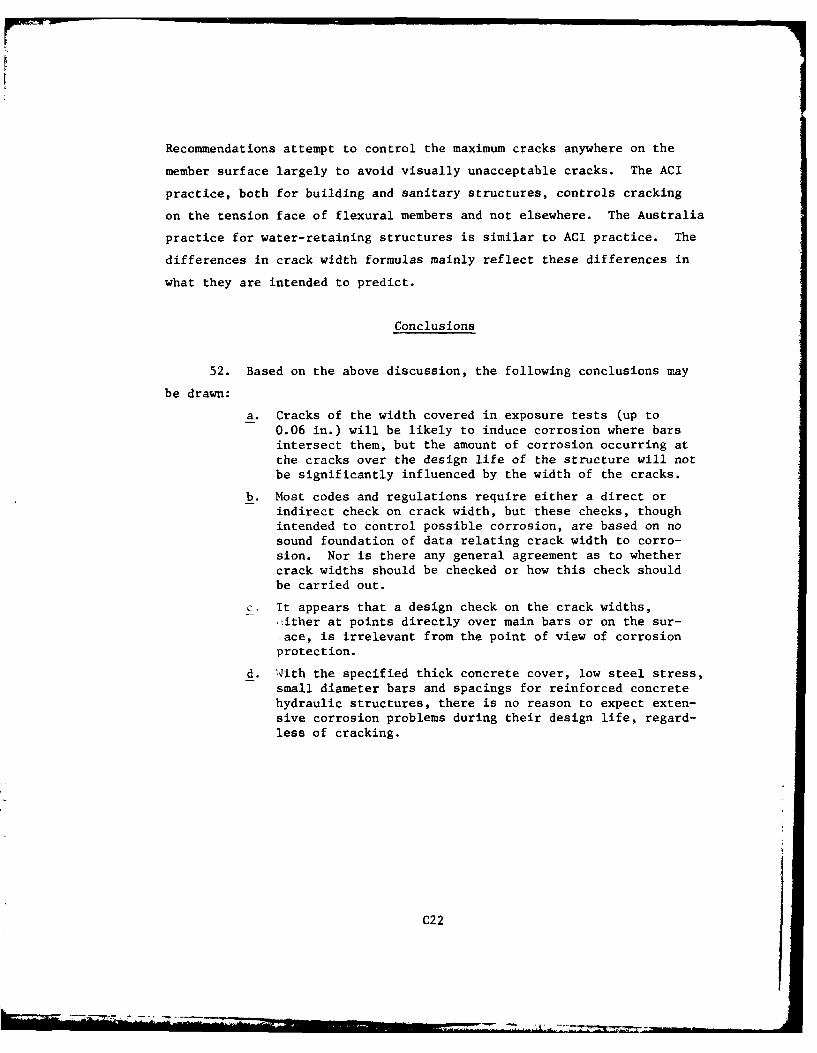
Recommendations attempt to control the maximum cracks anywhere on the
member surface largely to avoid visually unacceptable cracks. The ACI
practice, both for building and sanitary structures, controls cracking
on the tension face of flexural members and not elsewhere. The Australia
practice for water-retaining structures is similar to ACI practice. The
differences in crack width formulas mainly reflect these differences in
what they are intended to predict.
Conclusions
52. Based on the above discussion, the following conclusions may
be drawn:
a. Cracks of the width covered in exposure tests (up to0.06 in.) will be likely to induce corrosion where barsintersect them, but the amount of corrosion occurring atthe cracks over the design life of the structure will notbe significantly influenced by the width of the cracks.
b. Most codes and regulations require either a direct orindirect check on crack width, but these checks, thoughintended to control possible corrosion, are based on nosound foundation of data relating crack width to corro-sion. Nor is there any general agreement as to whether
crack widths should be checked or how this check shouldbe carried out.
c. It appears that a design check on the crack widths,, ither at points directly over main bars or on the sur-,ace, is irrelevant from the point of view of corrosionprotection.
d. With the specified thick concrete cover, low steel stress,small diameter bars and spacings for reinforced concretehydraulic structures, there is no reason to expect exten-sive corrosion problems during their design life, regard-less of cracking.
C22
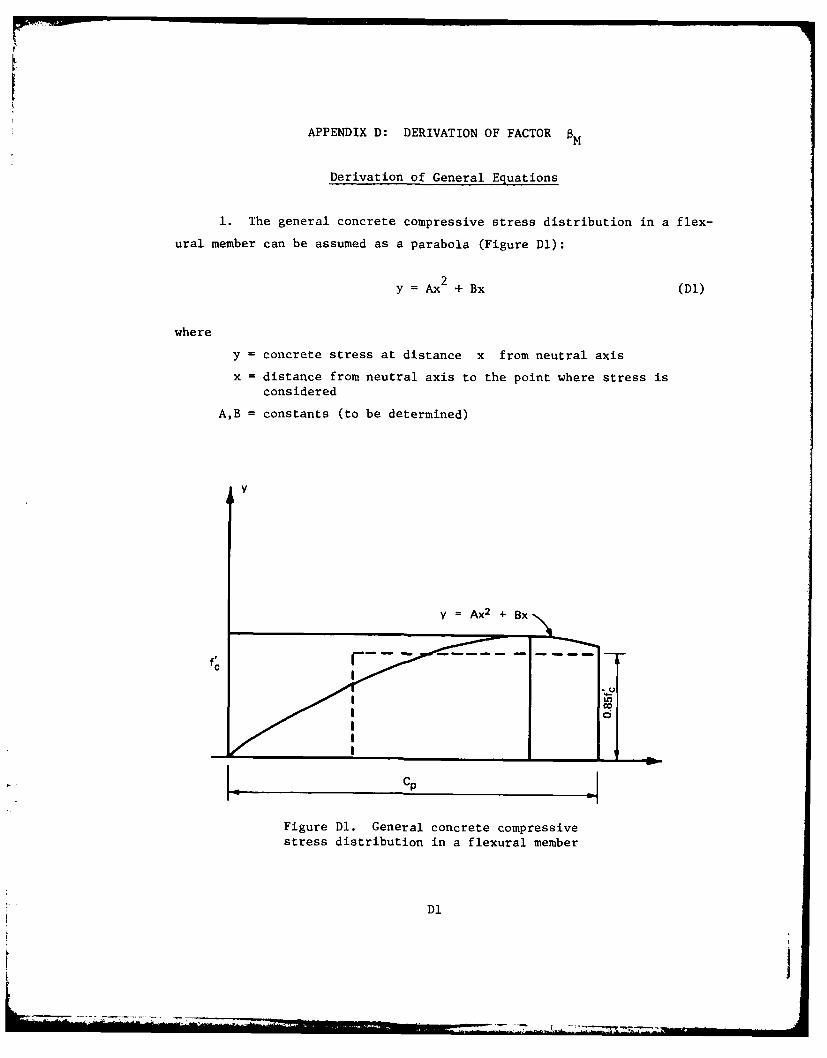
APPENDIX D: DERIVATION OF FACTOR $M
Derivation of General Equations
1. The general concrete compressive stress distribution in a flex-
ural member can be assumed as a parabola (Figure Dl):
y = Ax2 + Bx (Dl)
where
y = concrete stress at distance x from neutral axis
x = distance from neutral axis to the point where stress isconsidered
A,B = constants (to be determined)
y
Y = Ax2 + Bx
I c0
CP
Figure Dl. General concrete compressivestress distribution in a flexural member
Dl
I

The area under the parabola, A , can be determined as:
C
A = ydx
f~d
C p (D2)
=f(Ax2 + Bx)dx
0
A C3 + B C23p 2p
According to ACI 318-77, the actual concrete stress distributions can
be approximated by a rectangular stress block. In the equivalent rectan-
gular stress block, an average stress of 0.85 f' is used with a 'rectan-c
gle of depth a = iC . The ACI 318-77 also specifies that the
shall be taken as 0.85 for concrete strengths f' up to and includingc
4000 psi. Thus, A can be expressed asP
A = 0.85 f' x 0.85 C
p c p
(D3)
= 0.7225 f'Ccp
for f' < 4000 psiC -
Substituting Equation D3 into Equation D2, gives the following
f'C A C 3 + B C2 (N)
0.7225 cP 3 p 2 Cp
Differentiating Equation Dl with respect to x gives
dy = 2Ax + B (D5)dx
Since there is an extremum point at f' , i.e.,c
D2
= 0 at y = f'dx c
This condition can be satisfied if
B
2Ax + B = 0 or x=- 2- (D6)
Substituting y = f' and Equation D6 into Equation Dl givesc
c \2A \2A
B2 (D7)
4A
Solving Equations D4 and D7 results in
2.4255 f'B= c (D8)
p
1.4708 f'A=- c (D9)
p
A general parabolic concrete stress distribution can be obtained by sub-
stituting Equations D8 and D9 into Equation Dl:
1.4708 f' / 2\
= c 49 x - (D10)
The area under the parabola at any point x can be shown to be
A 3 B 2(l)A = A x + - x (DII)p 3 2
After substituting Equations D8 and D9 into Equation Dll, the result
obtained is a generalized equation for area under the parabola.
D3
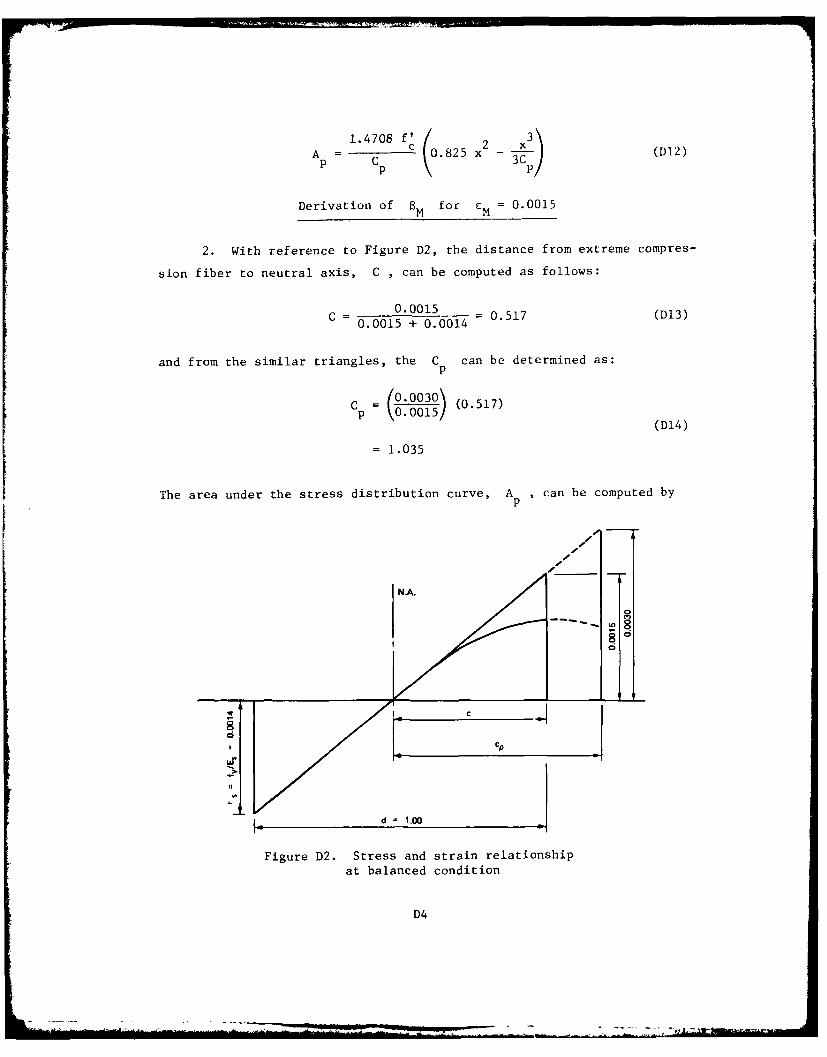
1.4708 f /A(= . 8 2 5 x - (D2)
Derivation of BM for EM = 0.0015
2. With reference to Figure D2, the distance from extreme compres-
sion fiber to neutral axis, C , can be computed as follows:
C = 0.0015 = 0.517 (D13)0.0015 + 0.0014
and from the similar triangles, the C can be determined as:
Cp =15__ (0.517)
(D14)
= 1.035
The area under the stress distribution curve, A , can be computed by
N.A.
0
Cp
ur
is d - 1.00
Figure D2. Stress and strain relationshipat balanced condition
D4
_ rn7i
substituting Equations D13 and D14 into Equation D12.
1.4708 f' r 3]
Ap 1.0 I5 (0.825) (0.517)2 - (0.517)p 1.035 3 (1.035)
= 0.25 f'C
The depth of equivalent rectangular stress block, a , can be determined
as
A 0.25 f'
p c = 0.294 (D15)0.85 f' 0.85 f'c C
By definition,
8M :C
0.2940- = 0.5690.517
For design purpose, M = 0.55 will be used.
Derivation of M for f' > 4000 psic
3. The derivations presented in paragraphs 1 and 2 are based on
f' < 4000 psi. According to ACI 318-77, for strength above 4000 psi,C -
M shall be reduced from 0.85 continuously" at a rate of 0.05 for eachM1000 psi of strength in excess of 4000 psi. Therefore, for f'
c> 4000 psi, Equation D3 should be modified. Using the same procedure
given in paragraphs 1 and 2, it can be shown that the factor aM is
0.50 for f' = 5000 psi.c
D5 I
In accordance with letter from DAEN-RDC, DAEN-ASI dated
22 July 1977, Subject: Facsimile Catalog Cards for
Laboratory Technical Publications, a facsimile catalog
card in Library of Congress MARC format is reproducedbelow.
Liu, Tony C.Strength design of reinforced concrete hydraulic
structures : Report 3 : T-wall design / by Tony C. Liu(Structures Laboratory, U.S. Army Engineer WaterwaysExperiment Station). -- Vicksburg, Miss. : The Station
Springfield, Va. : available from NTIS, 1982.10S p. in various pagings : ill. ; 27 cm. -- (Technical
report ; SL-80-4, Report 3)Cover title."January 1982.""Prepared for Office, Chief of Engineers, U.S. Army
under CWIS 31623."Bibliography: p. 42-45.
1. Flood control. 2. Hydraulic structures. 3. Reinforced
concrete. 4. Retaining walls. I. United States. Army.
Corps of Engineers. Office of the Chief of Engineers.
II. U.S. Army Engineer Waterways Experiment Station.Structures Laboratory. III. Title IV. Series:
Liu, Tony C.Strength design of reinforced concrete hydraulic : ... 1982.
(Card 2)
Technical report (U.S. Army Engineer Waterways Experiment
Station) ; SL-80-4, Report 3.TA7.W34 no.SL-80-4 Report 3
LI