Arkansas Water Resources Center Water Resources Center ... with 24 1 liter bottles controlled by a...
12
Arkansas Water Resources Center WATER QUALITY SAMPLING, ANALYSIS AND ANNUAL LOAD DETERMINATIONS FOR TSS, NITROGEN AND PHOSPHORUS AT THE WASHINGTON COUNTY ROAD 76 BRIDGE ON BALLARD CREEK Submitted to the Arkansas Soil and Water Conservation Commission By Marc A. Nelson, Ph.D., P.E. L. Wade Cash, Research Specialist G. Keith Trost, Research Associate Arkansas Water Resource Center Water Quality Lab University of Arkansas Fayetteville, Arkansas September 2004 Publication No. MSC-317 Arkansas Water Resources Center 112 Ozark Hall University of Arkansas Fayetteville, Arkansas 72701
Transcript of Arkansas Water Resources Center Water Resources Center ... with 24 1 liter bottles controlled by a...

Arkansas Water Resources Center
WATER QUALITY SAMPLING, ANALYSIS AND ANNUAL
LOAD DETERMINATIONS FOR TSS, NITROGEN AND PHOSPHORUS AT THE WASHINGTON COUNTY ROAD
76 BRIDGE ON BALLARD CREEK
Submitted to the Arkansas Soil and Water Conservation Commission
By Marc A. Nelson, Ph.D., P.E.
L. Wade Cash, Research Specialist G. Keith Trost, Research Associate Arkansas Water Resource Center
Water Quality Lab University of Arkansas Fayetteville, Arkansas
September 2004
Publication No. MSC-317
Arkansas Water Resources Center 112 Ozark Hall
University of Arkansas Fayetteville, Arkansas 72701
WATER QUALITY SAMPLING, ANALYSIS AND ANNUAL LOAD
DETERMINATIONS FOR TSS, NITROGEN AND PHOSPHORUS AT THE WASHINGTON COUNTY ROAD 76 BRIDGE ON BALLARD CREEK
Marc Nelson Arkansas Water Resources Center
Water Quality Lab University of Arkansas
L. Wade Cash
Arkansas Water Resources Center Water Quality Lab
University of Arkansas
G. Keith Trost Arkansas Water Resources Center
Water Quality Lab University of Arkansas
September 2004

INTRODUCTION The Illinois River Basin has experienced water quality impairment from non-point source pollution for many years. This fact was well documented in the State of Arkansas' Water Quality Assessment report, the Soil Conservation Service River Basin Study, and several University of Arkansas studies. Thirty-seven sub-watersheds have been identified by the SCS in the Arkansas portion of the Illinois River basin. In the Arkansas portion of the Basin, the Illinois River, Evansville Creek, Baron Fork, Cincinnati Creek, Muddy Fork, Moores Creek, Clear Creek, Osage Creek and Flint Creek were all classified as not supporting their designated use as primary contact recreation streams. The identified causes of the impairment were: sediment, bacteria and nutrients. In 1997, the University of Arkansas completed a project that estimated the phosphorus loading from each of the thirty-seven sub-watersheds. This project also prioritized watersheds for implementation work based on phosphorus loads, nitrogen loads and total suspended solids loads per unit area. The thirty-seven sub-watersheds were grouped into Low (16), Medium (10) and High (11) categories based on phosphorus loadings. If all the sub-watersheds above the median value for on phosphorus loading in the Illinois River basin were brought down to the current median value for phosphorus loading, this reduction would result in the agreed to 40% reduction of phosphorus at the state line. The selection of a sub-watershed for targeted intensive voluntary BMP implementation was based on the following criteria: a) the sub-watershed had to be above the current median value for phosphorus loading, b) there would be no sewage treatment plant in the sub-watershed, and c) land user interest. The Upper Ballard Creek watershed met all these requirements. The watershed covers 6700 hectares. The creek is listed in the High category with a unit area loading of 1.75 kg. per hectare per year. The median value for the thirty-seven watersheds is 0.73 kg. per hectare per year. HISTORY A water quality sampling station was installed at the Washington County Road 76 Bridge over Ballard Creek just before the creek leaves the state of Arkansas and enters into Oklahoma. The station was initially funded under an ASWCC 319 h grant FY99-100 to collect two storm event samples, four base flow grab samples and four periphyton growth samples per year. During the period of time from July 1, 2000 to September, 2001 the sampling station was being installed and no stage or water quality information was collected. Quarterly water quality and periphyton samples were collected in the last quarter of 2001 and during the first two quarters of 2002. However, due to datalogger failure, no stage information was collected until February 15, 2002. Beginning July 1, 2002 the funding was supplemented at this site so that all storms were sampled and grab samples and periphyton samples were collected and analyzed every two weeks. This report details the results from January 1, 2003 to December 31, 2003.
2

METHODS The automatic storm water monitoring station consisted of a Sigma 900 max sampler with 24 1 liter bottles controlled by a Campbell Scientific (CSI) CR10X programmable datalogger. The sampler and data logger were enclosed in a steel gauge house located next to the Washington county road 76 bridge over Ballard Creek. Water stage was measured using a Campbell Scientific ultrasonic distance sensor mounted underneath the bridge. A rating curve was developed by the USGS at the site to convert stage to discharge. The datalogger was programmed to trigger the sampler using either flow or time based intervals. Initially the sampler was operated in a discrete mode taking samples at thirty-minute intervals for the first twenty-four samples and sixty-minute intervals for the next twenty-four samples. The sampler was set to begin taking samples when the stage rose to ten percent over the prior base flow. Trigger levels were evaluated and modified based on load calculation optimization techniques. Discrete samples were collected when all twenty-four bottles were filled or within forty-eight hours after the first sample. Grab samples were taken often enough to have three samples between each storm. The sampler was operated using this protocol until three storms were adequately sampled. The results from this initial sampling phase were used to determine the sampling start (trigger) and frequency for flow-weighted composite sampling. In addition, the results were used to develop rating curves to predict pollutant concentrations as a function of discharge in order to calculate loads for inadequately sampled storm events. After the initial phase, the sampler was reconfigured to take flow-weighted composite samples. The sampler began sampling after the stage exceeded a set trigger level of two feet. It took a discrete sample after a fixed volume of water has passed. The volume of water used for the flow weighted composite samples, i.e. sampling frequency, was 1 million cubic feet, as determined from the initial sampling phase. The discrete samples were composited by combining equal volumes of each into a single sample for analysis. Discrete samples were collected for compositing when all twenty-four bottles were filled or within forty-eight hours after the first sample. Storms were sampled in this manner for the period when the river stage was above the trigger level. Grab samples were taken every two weeks after the initial sampling phase. All samples were collected by AWRC Field Services Personnel and transported to the AWRC Water quality Laboratory for analysis. All samples were analyzed for nitrate-nitrogen, ammonia-nitrogen, total Kjeldahl nitrogen, total phosphorus, dissolved reactive phosphorus and total suspended solids. In addition to chemical water quality sampling, periphyton sampling was done to assess the productivity of the stream. Periphyton sampling for determination of primary productivity followed method number 10300 in Standard Methods 20th edition. Standard microscope slides were used as a substrate for periphyton growth. Slides were placed in holders designed to hold eight pairs of slides vertically, perpendicular to the flow, near the surface of the stream. Slide holders were placed in the stream at two sites near the
3
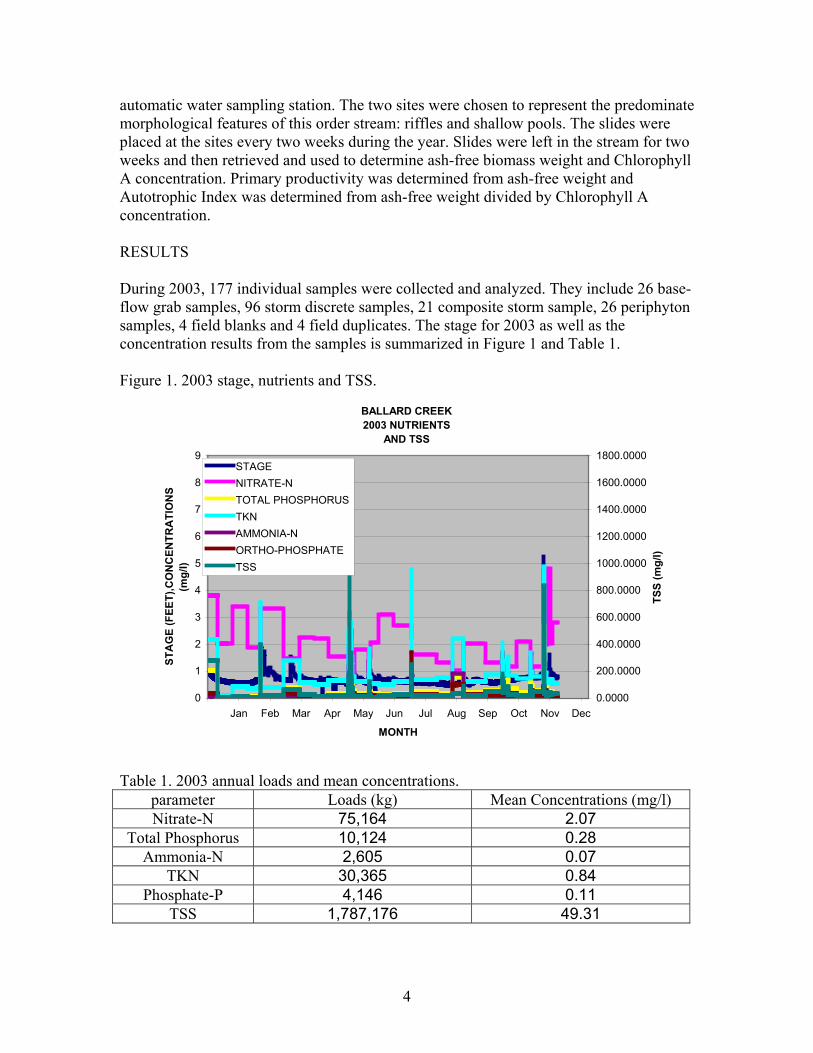
automatic water sampling station. The two sites were chosen to represent the predominate morphological features of this order stream: riffles and shallow pools. The slides were placed at the sites every two weeks during the year. Slides were left in the stream for two weeks and then retrieved and used to determine ash-free biomass weight and Chlorophyll A concentration. Primary productivity was determined from ash-free weight and Autotrophic Index was determined from ash-free weight divided by Chlorophyll A concentration. RESULTS During 2003, 177 individual samples were collected and analyzed. They include 26 base-flow grab samples, 96 storm discrete samples, 21 composite storm sample, 26 periphyton samples, 4 field blanks and 4 field duplicates. The stage for 2003 as well as the concentration results from the samples is summarized in Figure 1 and Table 1. Figure 1. 2003 stage, nutrients and TSS.
BALLARD CREEK2003 NUTRIENTS
AND TSS
0
1
2
3
4
5
6
7
8
9
Jan Feb Mar Apr May Jun Jul Aug Sep Oct Nov Dec
MONTH
STA
GE
(FEE
T),C
ON
CEN
TRA
TIO
NS
(mg/
l)
0.0000
200.0000
400.0000
600.0000
800.0000
1000.0000
1200.0000
1400.0000
1600.0000
1800.0000
TSS
(mg/
l)
STAGENITRATE-NTOTAL PHOSPHORUSTKNAMMONIA-NORTHO-PHOSPHATETSS
Table 1. 2003 annual loads and mean concentrations.
parameter Loads (kg) Mean Concentrations (mg/l) Nitrate-N 75,164 2.07
Total Phosphorus 10,124 0.28 Ammonia-N 2,605 0.07
TKN 30,365 0.84 Phosphate-P 4,146 0.11
TSS 1,787,176 49.31
4

The loads and mean concentrations can be segregated into storm-flow and base-flow using the trigger level as an arbitrary distinction between flow regimes. Using the trigger level value of 1 foot, the segregated loads and mean concentrations for 2003 are shown in Table 2. Table 2. Storm-flow and Base-flow loads and Mean Concentrations 2003.
Storm Loads (kg)
Base Loads (kg)
Storm Concentrations (mg/l)
Base Concentrations (mg/l)
VOLUME (M3) 6,303,299 29,972,775 NO3-N 12,353 62,911 1.96 2.10 T-P 3,878 6,254 0.62 0.21 NH4 386 2,220 0.06 0.07 TKN 9,208 21,180 1.46 0.71 PO4 1,267 2,882 0.20 0.10 TSS 948,111 840,366 150.42 28.04 Discrete storm samples were collected on 2 storms in 2003 using 96 individual samples. These results were modeled using least-squares linear regressions to determine a relationship between concentrations and stage. These relationships can be used to predict concentrations of the different constituents as a function of stage during storm events if actual measured values are unavailable due to equipment failure. The relationships determined are summarized in Table 3. Table 3. Regression equations determined from discrete storm samples 2003.
parameter Regression equation Regression coefficient Nitrate-N y = -0.168x + 1.2083 R2 = 0.0951
Total Phosphorus y = 0.4244x – 0.0534 R2 = 0.3589 Ammonia-N y = 0.0054x + 0.1397 R2 = 0.0005
TKN y = 1.1733x + 0.0598 R2 = 0.2774 Phosphate-P y = 0.0437x+0.1943 R2= 0.03
TSS y =107.27x R2 = 0.2372 Periphyton samples were collected 22 separate times in 2003. Samples were collected by retrieving glass slides that had been placed two weeks previously at a pool and a riffle just upstream from the sampling station. The slides were analyzed for Chlorophyll A and ash-free dry weight. Primary Productivity was determined from the average accumulated mass on each set of nine slides as measured by ash-free dry weight. Autotrophic Index was determined by dividing ash-free dry weight by the average Chlorophyll A determined from each set of nine slides. The results are summarized in figures 2 and 3.
5

Figure 2 Primary productivity 2003.
PRIMARY PRODUCTIVITY
0500
1000150020002500300035004000
12/10/02 1/29/03 3/20/03 5/9/03 6/28/03 8/17/03 10/6/03 11/25/03 1/14/04
DATE
PP (m
g/m
2) mg/m2 ashfree Poolmg/m2 ashfree Riffle
Figure 3 Autotrophic Index 2003
AUTOTROPHIC INDEX
0
2000
4000
6000
8000
10000
12000
14000
12/10/02 1/29/03 3/20/03 5/9/03 6/28/03 8/17/03 10/6/03 11/25/03 1/14/04
DATE
AI
AI pool
AI riffle
DISCUSSION The results for this Ballard Creek site during 2003 can be compared to results from other Northwest Arkansas watersheds that were investigated using the same sampling and load calculation protocols. Table 3 lists the results for TSS, phosphorus and discharge from 7 Northwest Arkansas watersheds. TSS and phosphorus are shown as total annual loads per acre, annual storm loads per acre, and annual mean base-flow concentrations. The total loads indicate the mass of TSS or P that are being transported to a receiving water body. Storm loads per acre may be used to represent relative impacts from non-point sources The base-flow concentrations show relative levels of TSS and P that are impacting in-
6

stream biological activity during most of the year. These are the values that are of greatest interest for determining impacts to in-stream macro invertebrate habitat and nuisance algae production. These values do not necessarily represent actual base and storm flows, but rather represent comparable values for determining the relative impacts in similar watersheds. The table4 and figure4 show TSS and phosphorus as total annual loads per watershed acre, as storm loads per watershed acre and as base-flow concentrations. Normalizing total and storm loads to a per acre basis allows comparison between watersheds of differing sizes. The total loads indicate the mass of TSS or P that are being transported to a receiving water body. Storm loads per acre may be used to represent relative impacts from non-point sources. In Figure 5, a red line represents the total loads and blue diamonds represents the storm loads. Table 4. Results from six other Northwest Arkansas Watersheds.
Ballard Creek
West Fork
Osage Creek@
112 Illinois
River@59
Kings River@
143 White @ Wyman Moores Creek
Hectares 6,742 29,964 10,095 167,273 153,309 116,364 1,000 YEARS of
data 1 2 2 7 5 2 4 tss load (kg/ha) 265 450 501 302 299 586 381 tss load storm
(kg/ha) 141 430 442 274 273 528 355 tss conc.
base (mg/l) 28.03 18 39 20 19 40 18 p load (kg/ha) 1.50 0.94 1.16 1.24 0.76 1.66 1.27
p storm load (kg/ha) 0.58 0.92 0.70 0.86 0.53 1.26 1.01
p base conc. (mg/l) 0.21 0.02 0.21 0.25 0.18 0.27 0.17
DISCHARGE (m3)
36,251,012
106,081,072
38,827,312
545,516,682
378,398,602
243,428,688 3,011,285
DISCHARGE/AC (m3/ha) 5,377 3,540 3,846 3,261 2,468 3,540 3,011
7

Figure 4 Comparisons of 7 Northwest Arkansas Watersheds
TSS Total and Storm Loads per Hectare
0100200300400500600700
Ballard
Cree
k
Wes
t Fork
Osage
Cree
k@11
2
Illino
is Rive
r@59
Kings R
iver@
143
Whit
e @ W
yman
Moores
Cree
k
Loa
ds (k
g/ha
)
TSS mean concentration Base-flow
0.005.00
10.0015.0020.0025.0030.0035.0040.0045.00
Ballard
Cree
k
Wes
t Fork
Osage
Cree
k@11
2
Illino
is Rive
r@59
Kings R
iver@
143
Whit
e @ W
yman
Moores
Cree
k
Bas
e flo
w c
once
ntra
tion
(mg/
l)
8

T-P Total and Storm Loads per Hectare
0.00.20.40.60.81.01.21.41.61.8
Ballard
Cree
k
Wes
t Fork
Osage
Cree
k@11
2
Illino
is Rive
r@59
Kings R
iver@
143
Whit
e @ W
yman
Moores
Cree
k
Loa
ds (k
g/ha
)
T-P mean concentration Base-flow
0.00.10.10.20.20.30.3
Ballard
Cree
k
Wes
t Fork
Osage
Cree
k@11
2
Illino
is Rive
r@59
Kings R
iver@
143
Whit
e @ W
yman
Moores
Cree
k
Bas
e flo
w c
once
ntra
tion
(mg/
l)
9

REFERENCES Nelson, M.A., T.S. Soerens, J. Spooner “Results of Investigation of Optimum Sample Interval for Determining Storm Water Pollutant Loads”, Proceedings of the Water Environment Federation WEFTEK Conference, New Orleans, LA, 1999. Nelson, M.A., T.S. Soerens “1997 Pollutant Loads At. Arkansas Highway 59 Bridge” Presented at Arkansas-Oklahoma Arkansas River Compact Commission Meeting, September 1998. Nelson, M.A., T.S. Soerens “1998 Pollutant Loads At. Arkansas Highway 59 Bridge” Arkansas Water resources Center Publication, 1999. Nelson, M.A., T.S. Soerens “1999 Pollutant Loads At. Arkansas Highway 59 Bridge” Arkansas Water resources Center Publication, 2000. Nelson, M.A., T.S. Soerens “2000 Pollutant Loads At. Arkansas Highway 59 Bridge” Arkansas Water resources Center Publication, 2001. Nelson, M.A., T.S. Soerens “2001 Pollutant Loads At. Arkansas Highway 59 Bridge” Arkansas Water resources Center Publication, 2002. Nelson, M.A., T.S. Soerens, J. Spooner “ Preliminary Results of Investigation of Optimum Sample Interval for Determining Storm Water Pollutant Loads”, Presented at ASCE Watershed Management Conference, Memphis, TN, 1998. Nelson, M.A., T.S. Soerens and D.G. Parker “Phosphorus Transport in the Illinois River: Preliminary Results of Intensive Sampling" Proceedings of the Arkansas Water Resource Center Annual Conference, 1998. Nelson, M.A., T.S. Soerens, J. Spooner “Investigation of Optimum Sample Number and Timing for Determining Storm Water Pollutant Loads Year [1998 and 1999}”, Arkansas Water Resources Center Annual Report 1999-2000, August 2001. Nelson, M.A., L.W. Cash “Water Quality Sampling, Analysis And Annual Load Determinations For TSS, Nitrogen And Phosphorus At The Wyman Road Bridge On The White River, Final Report” Arkansas Water Resources Center Publication, 2004. Nelson, M.A., L.W. Cash “Illinois River2002 Pollutant Loads at the Arkansas Highway 59 Bridge” Arkansas Water Resources Center Publication, 2003.
Nelson, M.A., L.W. Cash “Water Quality Sampling, Analysis And Annual Load Determinations For TSS, Nitrogen And Phosphorus At The 143 Bridge On The
10

11
Kings River, 2002 Annual Report” Arkansas Water Resources Center Publication, 2003. Nelson, M.A., S. L. Diffin “Water Quality Sampling, Analysis And Annual Load Determinations For TSS, Nitrogen And Phosphorus At The 112 Bridge On The Osage Creek, Final Report” Arkansas Water Resources Center Publication, 2003. Nelson, M.A., L.W. Cash “Water Quality Sampling, Analysis And Annual Load Determinations For TSS, Nitrogen And Phosphorus On Moores Creek, 2002 Annual Report” Arkansas Water Resources Center Publication, 2003. Parker, D. G, R. D. Williams, and H. D. Scott. 1996. Watershed Prioritization Publication No MSC-204 Arkansas Water Resources Center. University of Arkansas. Fayetteville, Arkansas. Parker, D.G., R. Williams and E. Teague “Illinois River Water Quality Automatic Sampler Installation” Arkansas Water Resource Center Miscellaneous Publication 0227, 1997. Nelson, M.A., L.W. Cash “Illinois River 2003 Pollutant Loads at the Arkansas Highway 59 Bridge” Arkansas Water Resources Center Publication, 2004. Nelson, M.A., L.W. Cash “Water Quality Sampling, Analysis And Annual Load Determinations For TSS, Nitrogen And Phosphorus At The 143 Bridge On The Kings River, 2003 Annual Report” Arkansas Water Resources Center Publication, 2004. Nelson, M.A., L.W. Cash “Water Quality Sampling, Analysis And Annual Load Determinations For TSS, Nitrogen And Phosphorus On Moores Creek, 2003 Annual Report” Arkansas Water Resources Center Publication, 2004. Nelson, M.A., L.W. Cash “Water Quality Sampling, Analysis And Annual Load Determinations For TSS, Nitrogen And Phosphorus on Ballard Creek, 2003 Annual Report” Arkansas Water Resources Center Publication, 2004. Nelson, M.A., L.W. Cash “Water Quality Sampling, Analysis And Annual Load Determinations For TSS, Nitrogen And Phosphorus on the West Fork, 2003 Annual Report” Arkansas Water Resources Center Publication, 2004. Nelson, M.A., L.W. Cash “Water Quality Sampling, Analysis And Annual Load Determinations For TSS, Nitrogen And Phosphorus on the White River at the 45 Bridge, 2003 Annual Report” Arkansas Water Resources Center Publication, 2004.