Water Resources Research Center Annual Technical Report … · Water Resources Research Center...
41
Water Resources Research Center Annual Technical Report FY 1999 Introduction WATER PROBLEMS AND ISSUES OF MASSACHUSETTS The development of new watershed management by partnership techniques continues to evolve in Massachusetts. Increasingly, the role of universities and citizen groups expands. The success of enhanced cooperation between state agencies, federal agencies, citizen groups, and university researchers has been underscored by the success of the cooperative lake monitoring program of the past three years, a program that has demonstrated the interests of citizen volunteers, the ability to generate quality data, and the potential to combine simple monitoring techniques with complementary high-tech, remote sensing techniques. The sum has been more than the parts. But this partnership simply doesn't happen. All those involved must find better and more cost-effective ways to harness the power of individual citizens in constructive and rewarding ways. They must find ways to make citizen participation more than a passing fancy and ways to move beyond basic monitoring to ways to more broadly address solutions and preventions. As part of the new interest in citizen participation, previously neglected water resources are taking a more prominent role in policy and management. Within the last few years, the badly neglected task of preventing and mitigatinglake eutrophication and the especially troublesome problem of invasive plant and animal introductions have gathered attention. For rivers, the attention paid to resolving the difficult problem of remaining combined sewer overflows has come to the forefront. New techniques are being developed that may yield alternatives to costly oversizing of sewage treatment plant capacity or resewering cities. These solutions may also help resolve the problem of urban runoff. The public response has been highly encouraging. As rivers improve in water quality and people begin to appreciate the recreational benefits, the demand for further improvements and imaginative land use planning for greenways and protected riparian areas increases. Most notable has been the planning process for the Connecticut River Conte refuge, a refuge unlike others because its protection is a patchwork quilt of sensitive resources throughout a major river watershed. Success will rely on the principle that increased protection of these areas and increased efforts to remediate others will result in a mixture of natural and cultural diversity throughout the basin. Inner cities that border a river are the major beneficiaries as environmental benefit also creates economic benefit. The universities have an important role to play in helping to find innovative ways to reduce the cost of improving previously degraded systems, in seeking creative ways to make greenways economically attractive, and in helping to educate all citizens on the importance of these changes in their personal lives. Some issues have largely disappeared from the public perception but are still serious threats. Recently, mercury bioaccumulation in aquatic species has received considerable attention. The source of the problem, however, is tied to the emission of mercury from electric-generating and trash incineration facilities combined with lakes that have a relatively high acidity as a result of acid deposition. The full scope of the problem in Massachusetts is not known. Acidification still exists as a significant concern for the water resources of the state. Although work by the Center showed a small but significant improvement in some lakes and streams as of 1993, a substantial number in the southeastern corner of the state are becoming more acidic while the vast majority have not changed or their status is not known. Much of the observed mercury bioaccumulation may be found in the same areas where acidification continues to be a major problem. Provisions of the Federal Clean Air revisions permitting trading of pollution reduction credits has created concern for public health in areas near grandfathered or dirtier emission sources maintained by purchase of credits. The deregulation of the electric utility industry, allowing users to choose their electricity provider, raises a new
Transcript of Water Resources Research Center Annual Technical Report … · Water Resources Research Center...

Water Resources Research Center
Annual Technical Report
FY 1999Introduction
WATER PROBLEMS AND ISSUES OF MASSACHUSETTS The development of new watershed management by partnership techniques continues to evolve in Massachusetts. Increasingly, the role of universities and citizen groups expands. The success of enhanced cooperation between state agencies, federal agencies, citizen groups, and university researchers has been underscored by the success of the cooperative lake monitoring program of the past three years, a program that has demonstrated the interests of citizen volunteers, the ability to generate quality data, and the potential to combine simple monitoring techniques with complementary high-tech, remote sensing techniques. The sum has been more than the parts. But this partnership simply doesn't happen. All those involved must find better and more cost-effective ways to harness the power of individual citizens in constructive and rewarding ways. They must find ways to make citizen participation more than a passing fancy and ways to move beyond basic monitoring to ways to more broadly address solutions and preventions. As part of the new interest in citizen participation, previously neglected water resources are taking a more prominent role in policy and management. Within the last few years, the badly neglected task of preventing and mitigatinglake eutrophication and the especially troublesome problem of invasive plant and animal introductions have gathered attention. For rivers, the attention paid to resolving the difficult problem of remaining combined sewer overflows has come to the forefront. New techniques are being developed that may yield alternatives to costly oversizing of sewage treatment plant capacity or resewering cities. These solutions may also help resolve the problem of urban runoff. The public response has been highly encouraging. As rivers improve in water quality and people begin to appreciate the recreational benefits, the demand for further improvements and imaginative land use planning for greenways and protected riparian areas increases. Most notable has been the planning process for the Connecticut River Conte refuge, a refuge unlike others because its protection is a patchwork quilt of sensitive resources throughout a major river watershed. Success will rely on the principle that increased protection of these areas and increased efforts to remediate others will result in a mixture of natural and cultural diversity throughout the basin. Inner cities that border a river are the major beneficiaries as environmental benefit also creates economic benefit. The universities have an important role to play in helping to find innovative ways to reduce the cost of improving previously degraded systems, in seeking creative ways to make greenways economically attractive, and in helping to educate all citizens on the importance of these changes in their personal lives. Some issues have largely disappeared from the public perception but are still serious threats. Recently, mercury bioaccumulation in aquatic species has received considerable attention. The source of the problem, however, is tied to the emission of mercury from electric-generating and trash incineration facilities combined with lakes that have a relatively high acidity as a result of acid deposition. The full scope of the problem in Massachusetts is not known. Acidification still exists as a significant concern for the water resources of the state. Although work by the Center showed a small but significant improvement in some lakes and streams as of 1993, a substantial number in the southeastern corner of the state are becoming more acidic while the vast majority have not changed or their status is not known. Much of the observed mercury bioaccumulation may be found in the same areas where acidification continues to be a major problem. Provisions of the Federal Clean Air revisions permitting trading of pollution reduction credits has created concern for public health in areas near grandfathered or dirtier emission sources maintained by purchase of credits. The deregulation of the electric utility industry, allowing users to choose their electricity provider, raises a new
threat that costly efforts to reduce emissions will create a competitive disadvantage against more polluted sources. Non-point source pollution continues to be a major challenge for water resources protection. In the sole source aquifer of Cape Cod, non-point pollution from private septic systems and inter-related water conservation questions continues to threaten the drinking water. In the more western parts of the state, urban runoff and atmospheric deposition impede water quality improvements. Demand for groundwater has drastically reduced stream flows in some areas of the state and underscored the need for new policy regarding in-stream flow maintenance and mechanisms to encourage water conservation. THE MASSACHUSETTS WATER RESOURCES RESEARCH CENTER: AN OVERVIEW It is the long-term goal of the Massachusetts Water Resources Research Center to continue as a major participant in a redefinition of the basic approach to environmental problems in the state. Through the Acid Rain Monitoring Project and the Massachusetts Water Watch Partnership, the Center has already helped to define a new direction, but the details are not fully resolved. The principal objective for the next several years will be to integrate the needs of the state, the efforts of citizen volunteers and the research and training capabilities of the University of Massachusetts system to make significant advances in the solution of existing and new water resources problems. Most important will be the development of new approaches that reinforce the integration of grass roots, agency and university capabilities. The long-term research plan of the Center reflects this combined need to include a broader array of participants in the discovery, understanding and resolution of environmental problems and to provide research in areas where problems are most severe and answers are in shortest supply. For the full 1999-2000 annual report of the Center in pdf format for downloading and printing, visit: www.umass.edu/tei/wrrc. SECTION 104 OBJECTIVES For the period 1996-2001, the Center's priority research interests were: 1. Exploration of ways to enhance the environmental partnership between universities, government, and citizens. 2. Protection and improvement of surface and groundwater resources impacted by non-point source contamination; 3. Acid deposition and its effects; 4. Water supply system improvement; 5. Resolution of conflicting demands for water resources; 6. Pathways of metal release and bioaccumulation in aquatic systems; and 7. Effects of global warming on the freshwater resources of Massachusetts and New England. The Massachusetts Water Resources Research Center receives program support from federal, state, university, and private sources. For state fiscal year 2000 (federal fiscal year 1999), 19.6% of program support was derived from the federal Water Resources Institute Program grant; 34.0% from state contracts; 4.2% from the direct support by the University; 7.9% from private sources; and 34.3% contributed as matching funds by the universities participating in the Center's research program. Within the Institute Program's Section FY99 104 grant, 77% of the funds were used for research, 17% for coordination and 6% for administration. Eighty percent of the Center's total support is from non-Federal sources; none can be considered non-discretionary. Thus, the Center leverages each Institute Program Federal dollar, that creates the core of the Center's program, four-fold into a $397,485 program. The national average for institute revenues is 6% from Institute Program funds, 34% from other Federal funds, and 60% from non-Federal sources. The Center expends 39.6% of its total revenues on its research program. Administrative costs represent 3.1% of the total; 12.7% is expended on coordination, 34.1% on outreach (training, education and information transfer); and 10.5% on laboratory services. The national average for all water resources research institutes in FY1999 was 8% for administration, 6% for development and coordination, 8% for training and education, 5% for information transfer, and 73% for research (including laboratory services).
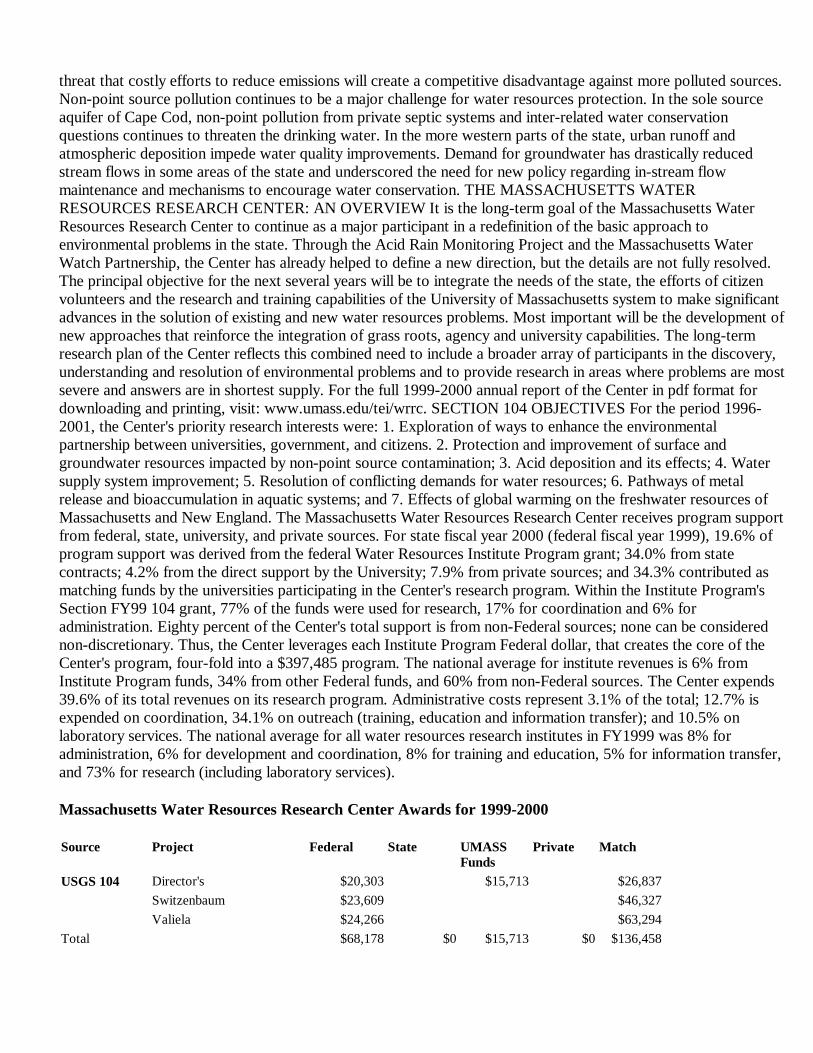
Massachusetts Water Resources Research Center Awards for 1999-2000
Source Project Federal State UMASS Funds
Private Match
USGS 104 Director's $20,303 $15,713 $26,837 Switzenbaum $23,609 $46,327 Valiela $24,266 $63,294
Total $68,178 $0 $15,713 $0 $136,458
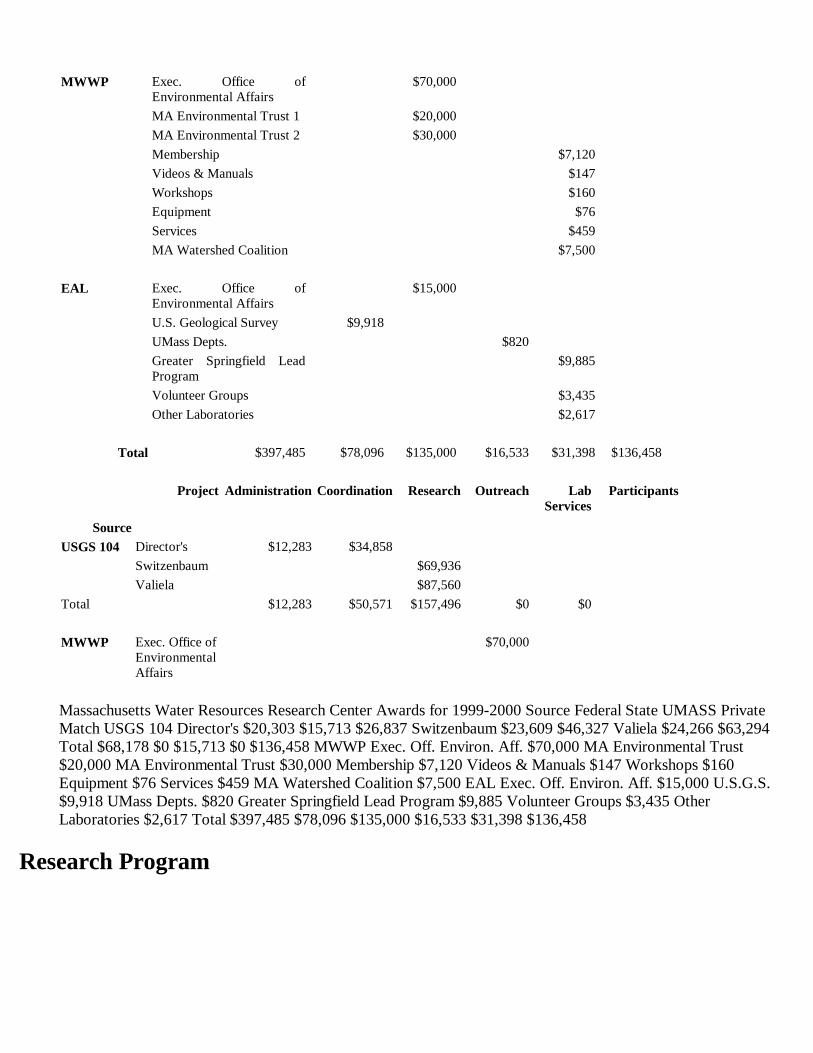
Massachusetts Water Resources Research Center Awards for 1999-2000 Source Federal State UMASS Private Match USGS 104 Director's $20,303 $15,713 $26,837 Switzenbaum $23,609 $46,327 Valiela $24,266 $63,294 Total $68,178 $0 $15,713 $0 $136,458 MWWP Exec. Off. Environ. Aff. $70,000 MA Environmental Trust $20,000 MA Environmental Trust $30,000 Membership $7,120 Videos & Manuals $147 Workshops $160 Equipment $76 Services $459 MA Watershed Coalition $7,500 EAL Exec. Off. Environ. Aff. $15,000 U.S.G.S. $9,918 UMass Depts. $820 Greater Springfield Lead Program $9,885 Volunteer Groups $3,435 Other Laboratories $2,617 Total $397,485 $78,096 $135,000 $16,533 $31,398 $136,458
Research Program
MWWP Exec. Office of Environmental Affairs
$70,000
MA Environmental Trust 1 $20,000 MA Environmental Trust 2 $30,000 Membership $7,120 Videos & Manuals $147 Workshops $160 Equipment $76 Services $459 MA Watershed Coalition $7,500
EAL Exec. Office of Environmental Affairs
$15,000
U.S. Geological Survey $9,918 UMass Depts. $820 Greater Springfield Lead Program
$9,885
Volunteer Groups $3,435 Other Laboratories $2,617
Total $397,485 $78,096 $135,000 $16,533 $31,398 $136,458
Source
Project Administration Coordination Research Outreach Lab Services
Participants
USGS 104 Director's $12,283 $34,858 Switzenbaum $69,936 Valiela $87,560
Total $12,283 $50,571 $157,496 $0 $0
MWWP Exec. Office of Environmental Affairs
$70,000
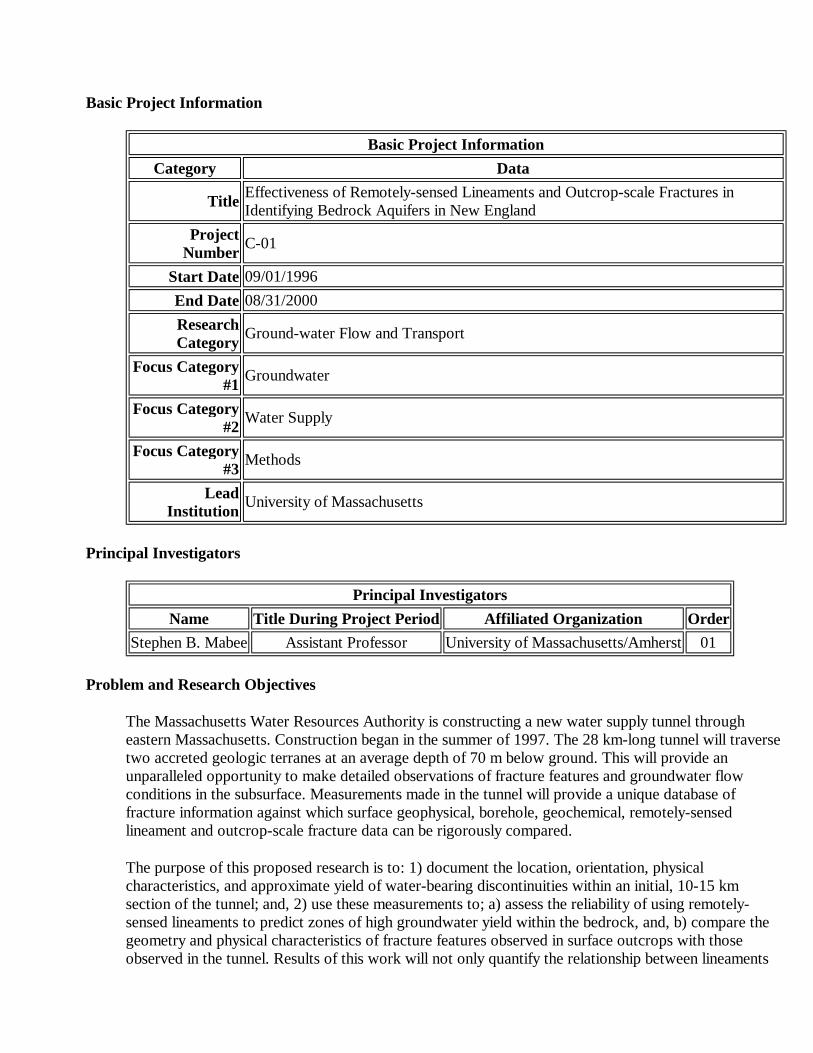
Basic Project Information
Principal Investigators
Problem and Research Objectives
The Massachusetts Water Resources Authority is constructing a new water supply tunnel through eastern Massachusetts. Construction began in the summer of 1997. The 28 km-long tunnel will traverse two accreted geologic terranes at an average depth of 70 m below ground. This will provide an unparalleled opportunity to make detailed observations of fracture features and groundwater flow conditions in the subsurface. Measurements made in the tunnel will provide a unique database of fracture information against which surface geophysical, borehole, geochemical, remotely-sensed lineament and outcrop-scale fracture data can be rigorously compared.
The purpose of this proposed research is to: 1) document the location, orientation, physical characteristics, and approximate yield of water-bearing discontinuities within an initial, 10-15 km section of the tunnel; and, 2) use these measurements to; a) assess the reliability of using remotely-sensed lineaments to predict zones of high groundwater yield within the bedrock, and, b) compare the geometry and physical characteristics of fracture features observed in surface outcrops with those observed in the tunnel. Results of this work will not only quantify the relationship between lineaments
Basic Project InformationCategory Data
Title Effectiveness of Remotely-sensed Lineaments and Outcrop-scale Fractures in Identifying Bedrock Aquifers in New England
Project Number C-01
Start Date 09/01/1996End Date 08/31/2000Research Category Ground-water Flow and Transport
Focus Category #1 Groundwater
Focus Category #2 Water Supply
Focus Category #3 Methods
Lead Institution University of Massachusetts
Principal InvestigatorsName Title During Project Period Affiliated Organization Order
Stephen B. Mabee Assistant Professor University of Massachusetts/Amherst 01

and subsurface fractures but will also evaluate whether or not fracture characteristics observed in surface outcrops can be extrapolated into the third dimension with any degree of certainty.
Methodology
The project consists of seven tasks as follows: 1) Map the tunnel exposure and document the rock types, lithologic contacts, and structural elements (folds, faults, foliations, and fractures; emphasis will be placed on describing the physical characteristics of fractures), and note all water-bearing features and their approximate yield; 2) Map lineaments along the entire length of the tunnel using a variety of scales and types of imagery (color infrared and black and white aerial photography, topographic maps, and SLAR imagery); 3) Gather existing borehole data, available surficial geologic mapping, and topographic maps showing the type and extent of surficial deposits, location of wetlands, ponds, lakes, streams, and rivers along the trace of the tunnel; 4) Map all bedrock exposures within 1 km of the tunnel (focusing on the initial 10-15 km section) and record the same features as described in item 1 above (i.e., rock type, structural features, fracture characteristics, etc.); 5) Compare lineaments with subsurface water-bearing features by& a) quantifying the number of lineaments that actually correspond to highly productive zones in the tunnel; and, b) examining other geologic factors that may influence the association between lineaments and yield such as bedrock type, topographic setting, the type and thickness of the overburden, proximity to surface water bodies or structural setting; 6) Compare the orientations and physical characteristics of fracture features observed in surface outcrops with the orientations and physical characteristics of water-bearing features observed in the subsurface; and, 7) Prepare summary maps and journal articles to disseminate the findings of the project.
Principal Findings and Significance
From September 1999 to September 2000, most of the work involved completing MS theses and commencing the preparation of manuscripts for publication. No additional mapping of the tunnel was undertaken. One student from Amherst College did perform a geochemistry project in the tunnel during the 99/00 academic year. To summarize, a total of 413 fracture features, including faults, have been characterized in the tunnel to determine the orientation of major sets and the extent of subsurface fracture domains. A subset of 156 fracture features was used to evaluate fracture characteristics such as planarity, trace length and spacing. In addition, every feature in the tunnel exhibiting flow was identified and characterized. An estimate of their yield was also provided. A total of 65 water samples were obtained in the fall 1998, winter 1999 and fall 1999 from flowing structures within the tunnel. Ten water samples were obtained from surface water bodies above the tunnel. At the surface, 1513 fracture measurements were made at 21 outcrops located within 3 km of the trace of the tunnel to determine major fracture sets and surface fracture domains. Spacing, trace length and planarity were determined from scanline measurements (n=899) at each outcrop. Lineaments were drawn on three platforms: 1:250,000 Side-Looking Airborne Radar (SLAR) images, 1:58,000 Color Infrared (CIR) and 1:80,000 Black and White (BW) aerial photographs. Lineaments were drawn by three observers during two independent trials producing 18 sets of lineaments (n=9137). Three or more overlapping lineaments (azimuths within ±5° and within 1 mm at the scale of the imagery) define a single coincident lineament. This generated three sets of coincident lineaments (n=794), of these 35 cross the 9 km section of tunnel. Major findings to date are as follows: 1. Lineaments can identify high-yield flow zones in the bedrock but this finding can not be substantiated statistically. Flow rate plotted as a function of tunnel location revealed several discrete peaks of high flow separated by sections of the tunnel exhibiting very little to no flow at all. These well-defined peaks, herein referred to as "flow zones" are defined as a section of the tunnel that exceeds a flow of 19 liters/min (5 gpm). Nineteen discrete flow zones were identified in the tunnel. Thirteen (68%) of the flow zones correlate with coincident lineaments, 6 zones correlate
with more than one image type, and 1 zone correlates with all 3 image types. Median discharge observed in the flow zones that were captured by coincident lineaments were not significantly higher (at the 95% confidence level) than the flows observed in the zones located outside of the lineament buffer zones. 2. In addition, the 35 coincident lineaments were compared with 99 individual, through-going water-bearing structures within the 9 km tunnel section. Flowing structures that parallel coincident lineaments (all platforms) and occur within the lineament buffer zones (±1 mm at the scale of the imagery) have higher median yield (10,500 l/day) than those structures outside the buffer zones (6,600 l/day). However, this difference is significant at the 70% confidence level. The BW aerial photographs were the best at detecting individual through-going flowing structures. There is a 90% level of confidence that the median yields of through-going flowing structures in the lineament buffer zones are higher than the median yields of those located outside the buffer zones. 3. While some lineaments can identify high-yield water-bearing zones in the bedrock, it is difficult to distinguish the successful lineaments from the unsuccessful ones without additional information. For example, 15 of the 35 coincident lineaments actually correlate with the flow zones. This means that the remaining 20 coincident lineaments do not correlate with features producing more than 19 liters/min. Therefore, less than half of the coincident lineaments are associated with high-yield water-bearing zones. Other factors can help reduce the uncertainty in deciding which coincident lineaments do or do not correlate with water-bearing zones in the tunnel. Lineaments which align with topographic valleys and bedrock lows correlate with higher flows in the tunnel than those that fall on topographic flats or slopes (1,800 liters/min versus 950 liters/min and 820 liters/min, respectively). The zones of highest flow within the tunnel are generally associated with permeable overburden such as sand and gravel rather than less permeable glacial till and, thus, lineaments corresponding with conductive overburden tend to correlate with higher flows. Finally, high groundwater inflows are generally located near surface water bodies. Groundwater inflows are highest where there is a greater fracture frequency and a higher density of surface water bodies in close proximity to the tunnel. Flow zones 8 and 9 are close to the Sudbury River and northwest of Lake Cochituate. These findings are consistent with the results of other investigators and confirm that interpretations made from lineament analyses can be improved if other factors such as topographic position, type and thickness of overburden, proximity to surface water bodies, or bedrock type are considered in the selection of well sites. 4. Fracture-supported coincident lineaments do not necessarily improve the ability of lineaments to discriminate high flow zones in the bedrock. Fracture-supported coincident lineaments are those lineaments which parallel nearby surface fracture sets, mapped faults, lithologic contacts, and/or primary ductile structures. There were two occurrences where fracture-supported coincident lineaments from all three scales overlapped and were parallel. One occurrence mapped the zone of greatest fracture density in the tunnel and highest groundwater inflow (>560 l/min). The other occurrence mapped an area of high fracture density and significant subsurface flow (95 l/min). When considering all fracture-supported coincident lineaments and parallel subsurface structures, the median flow (13,600 l/day) for the mapped structures is greater than the unmapped structures (6,800 l/day). However, this difference is significant at the 60% confidence level. 5. The trends of major fracture sets in the tunnel do not show a one to one correlation with the trends of major fracture sets identified in surface outcrops. Five fracture sets were observed in the surface outcrops (14, 38, 86, 117 and 171) and seven fracture sets (13, 29, 41, 62, 132, 159 and 175) in the tunnel. The 14 and 171 fracture sets in the surface outcrops correspond well with the 13 and 175 sets in the tunnel. These are the dominant fracture sets observed both at the surface and in the tunnel. The 38 set observed at the surface includes parts of the 29 and 41 sets in the tunnel. The 86 set does occur in the tunnel but is undersampled because it is aligned with the tunnel. The 62 and 159 sets occur in the tunnel but are not seen at the surface. 6. The geographic distributions (domains) of the surface and subsurface fracture sets do not show a one to one correlation. Only the dominant fracture set domains (14 and 171 in the surface and 13 and 175 in the tunnel) show a reasonable spatial overlap. All the other sets show only a partial overlap or no overlap at all. Interestingly, the 13 and 175 fracture sets are the fractures generating most of the groundwater inflow into the tunnel. 7. Spacing and trace lengths distributions
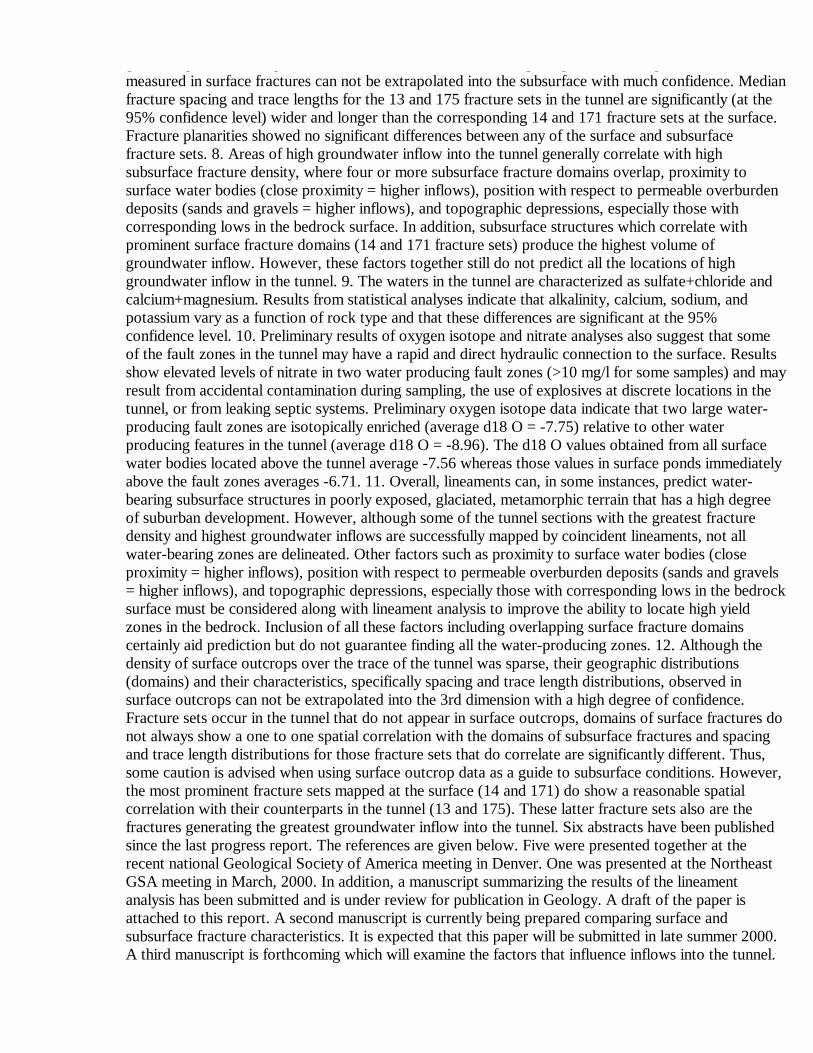
generating most of the groundwater inflow into the tunnel. 7. Spacing and trace lengths distributions measured in surface fractures can not be extrapolated into the subsurface with much confidence. Median fracture spacing and trace lengths for the 13 and 175 fracture sets in the tunnel are significantly (at the 95% confidence level) wider and longer than the corresponding 14 and 171 fracture sets at the surface. Fracture planarities showed no significant differences between any of the surface and subsurface fracture sets. 8. Areas of high groundwater inflow into the tunnel generally correlate with high subsurface fracture density, where four or more subsurface fracture domains overlap, proximity to surface water bodies (close proximity = higher inflows), position with respect to permeable overburden deposits (sands and gravels = higher inflows), and topographic depressions, especially those with corresponding lows in the bedrock surface. In addition, subsurface structures which correlate with prominent surface fracture domains (14 and 171 fracture sets) produce the highest volume of groundwater inflow. However, these factors together still do not predict all the locations of high groundwater inflow in the tunnel. 9. The waters in the tunnel are characterized as sulfate+chloride and calcium+magnesium. Results from statistical analyses indicate that alkalinity, calcium, sodium, and potassium vary as a function of rock type and that these differences are significant at the 95% confidence level. 10. Preliminary results of oxygen isotope and nitrate analyses also suggest that some of the fault zones in the tunnel may have a rapid and direct hydraulic connection to the surface. Results show elevated levels of nitrate in two water producing fault zones (>10 mg/l for some samples) and may result from accidental contamination during sampling, the use of explosives at discrete locations in the tunnel, or from leaking septic systems. Preliminary oxygen isotope data indicate that two large water-producing fault zones are isotopically enriched (average d18 O = -7.75) relative to other water producing features in the tunnel (average d18 O = -8.96). The d18 O values obtained from all surface water bodies located above the tunnel average -7.56 whereas those values in surface ponds immediately above the fault zones averages -6.71. 11. Overall, lineaments can, in some instances, predict water-bearing subsurface structures in poorly exposed, glaciated, metamorphic terrain that has a high degree of suburban development. However, although some of the tunnel sections with the greatest fracture density and highest groundwater inflows are successfully mapped by coincident lineaments, not all water-bearing zones are delineated. Other factors such as proximity to surface water bodies (close proximity = higher inflows), position with respect to permeable overburden deposits (sands and gravels = higher inflows), and topographic depressions, especially those with corresponding lows in the bedrock surface must be considered along with lineament analysis to improve the ability to locate high yield zones in the bedrock. Inclusion of all these factors including overlapping surface fracture domains certainly aid prediction but do not guarantee finding all the water-producing zones. 12. Although the density of surface outcrops over the trace of the tunnel was sparse, their geographic distributions (domains) and their characteristics, specifically spacing and trace length distributions, observed in surface outcrops can not be extrapolated into the 3rd dimension with a high degree of confidence. Fracture sets occur in the tunnel that do not appear in surface outcrops, domains of surface fractures do not always show a one to one spatial correlation with the domains of subsurface fractures and spacing and trace length distributions for those fracture sets that do correlate are significantly different. Thus, some caution is advised when using surface outcrop data as a guide to subsurface conditions. However, the most prominent fracture sets mapped at the surface (14 and 171) do show a reasonable spatial correlation with their counterparts in the tunnel (13 and 175). These latter fracture sets also are the fractures generating the greatest groundwater inflow into the tunnel. Six abstracts have been published since the last progress report. The references are given below. Five were presented together at the recent national Geological Society of America meeting in Denver. One was presented at the Northeast GSA meeting in March, 2000. In addition, a manuscript summarizing the results of the lineament analysis has been submitted and is under review for publication in Geology. A draft of the paper is attached to this report. A second manuscript is currently being prepared comparing surface and subsurface fracture characteristics. It is expected that this paper will be submitted in late summer 2000. A third manuscript is forthcoming which will examine the factors that influence inflows into the tunnel.
A proposal to continue mapping in the tunnel was submitted to the Hydrology Program at the National Science Foundation in December, 1999. Unfortunately, the proposal was not funded. Three students have completed their Master's degrees using data from this project. Patrick Curry performed the lineament analysis. His work is summarized in the manuscript under review with Geology. Katherine Williams studied the relationship between surface and subsurface fracture characteristics. A manuscript summarizing her work is in preparation. Rebecca Weaver examined the geochemistry of the tunnel inflows. A student at Amherst College continued the water quality investigation of the tunnel as part of an independent study during her senior year. FUTURE WORK Two additional projects are proposed that will augment the studies that have already been completed. Both of these projects are not funded. 1. Nitrate/Dudley Pond Investigation – Dudley Pond lies directly over the tunnel. In the two years since the tunnel passed beneath the pond, water levels in the pond have dropped steadily. Nitrate levels in the tunnel are also elevated in many of the high flow zones, particularly those in close proximity to Dudley Pond. We believe that these observations indicate a strong and possibly rapid hydraulic connection between the tunnel and surface waters. In this supplementary study, the fate and transport of nitrate through an unconsolidated/bedrock aquifer system will be examined with a particular focus on the effects of flow paths and residence times on nitrate levels in the tunnel. This work will be done in collaboration with Dr. Anna Martini at Amherst College. One graduate student from the University of Massachusetts will participate along with a senior thesis candidate at Amherst College. 2. Characterization of Water-bearing Features in the Bloody Bluff Fault Zone – One of the fundamental uses of vertical and horizontal boreholes is to provide contractors with an accurate representation of subsurface conditions prior to commencing with tunneling operations. The tunnel is about to cross the Bloody Bluff Fault Zone. This fault zone represents the boundary between two tectonic terranes. A series of vertical borings were constructed during the design phase of the tunnel project to estimate subsurface conditions. In addition, a horizontal borehole was also drilled through the Bloody Bluff Fault Zone. In this investigation, fracture characteristics and water-bearing features in the tunnel will be compared with fractures in the vertical and horizontal boreholes. The main issue that will be examined is the adequacy of borehole data in predicting water-bearing characteristics in the tunnel. The tunnel provides a unique opportunity to address this issue.
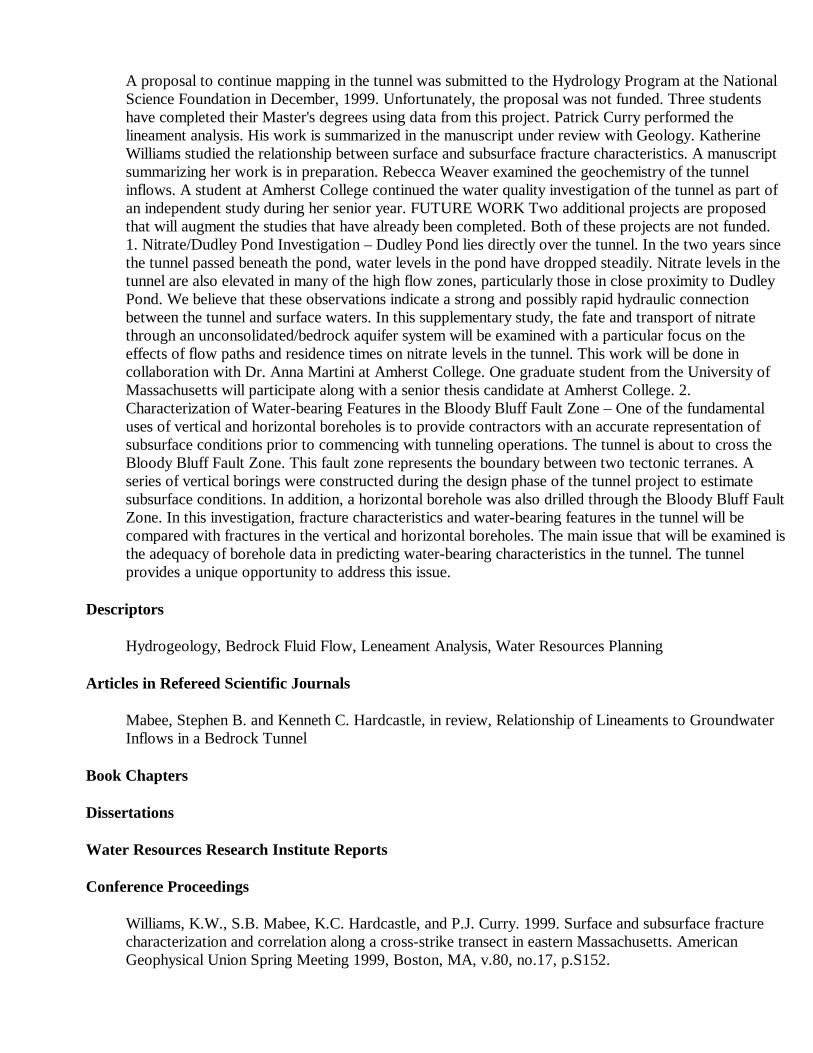
Descriptors
Hydrogeology, Bedrock Fluid Flow, Leneament Analysis, Water Resources Planning
Articles in Refereed Scientific Journals
Mabee, Stephen B. and Kenneth C. Hardcastle, in review, Relationship of Lineaments to Groundwater Inflows in a Bedrock Tunnel
Book Chapters
Dissertations
Water Resources Research Institute Reports
Conference Proceedings
Williams, K.W., S.B. Mabee, K.C. Hardcastle, and P.J. Curry. 1999. Surface and subsurface fracture characterization and correlation along a cross-strike transect in eastern Massachusetts. American Geophysical Union Spring Meeting 1999, Boston, MA, v.80, no.17, p.S152.
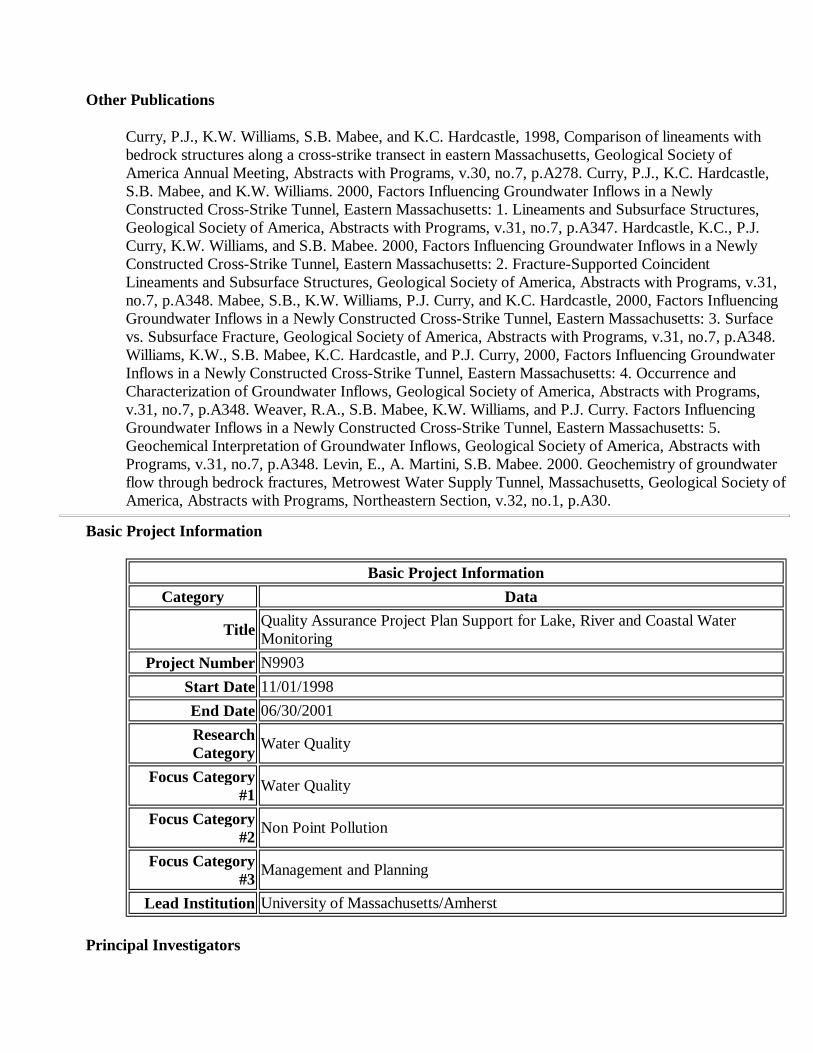
Other Publications
Curry, P.J., K.W. Williams, S.B. Mabee, and K.C. Hardcastle, 1998, Comparison of lineaments with bedrock structures along a cross-strike transect in eastern Massachusetts, Geological Society of America Annual Meeting, Abstracts with Programs, v.30, no.7, p.A278. Curry, P.J., K.C. Hardcastle, S.B. Mabee, and K.W. Williams. 2000, Factors Influencing Groundwater Inflows in a Newly Constructed Cross-Strike Tunnel, Eastern Massachusetts: 1. Lineaments and Subsurface Structures, Geological Society of America, Abstracts with Programs, v.31, no.7, p.A347. Hardcastle, K.C., P.J. Curry, K.W. Williams, and S.B. Mabee. 2000, Factors Influencing Groundwater Inflows in a Newly Constructed Cross-Strike Tunnel, Eastern Massachusetts: 2. Fracture-Supported Coincident Lineaments and Subsurface Structures, Geological Society of America, Abstracts with Programs, v.31, no.7, p.A348. Mabee, S.B., K.W. Williams, P.J. Curry, and K.C. Hardcastle, 2000, Factors Influencing Groundwater Inflows in a Newly Constructed Cross-Strike Tunnel, Eastern Massachusetts: 3. Surface vs. Subsurface Fracture, Geological Society of America, Abstracts with Programs, v.31, no.7, p.A348. Williams, K.W., S.B. Mabee, K.C. Hardcastle, and P.J. Curry, 2000, Factors Influencing Groundwater Inflows in a Newly Constructed Cross-Strike Tunnel, Eastern Massachusetts: 4. Occurrence and Characterization of Groundwater Inflows, Geological Society of America, Abstracts with Programs, v.31, no.7, p.A348. Weaver, R.A., S.B. Mabee, K.W. Williams, and P.J. Curry. Factors Influencing Groundwater Inflows in a Newly Constructed Cross-Strike Tunnel, Eastern Massachusetts: 5. Geochemical Interpretation of Groundwater Inflows, Geological Society of America, Abstracts with Programs, v.31, no.7, p.A348. Levin, E., A. Martini, S.B. Mabee. 2000. Geochemistry of groundwater flow through bedrock fractures, Metrowest Water Supply Tunnel, Massachusetts, Geological Society of America, Abstracts with Programs, Northeastern Section, v.32, no.1, p.A30.
Basic Project Information
Principal Investigators
Basic Project InformationCategory Data
Title Quality Assurance Project Plan Support for Lake, River and Coastal Water Monitoring
Project Number N9903Start Date 11/01/1998End Date 06/30/2001Research Category Water Quality
Focus Category #1 Water Quality
Focus Category #2 Non Point Pollution
Focus Category #3 Management and Planning
Lead Institution University of Massachusetts/Amherst
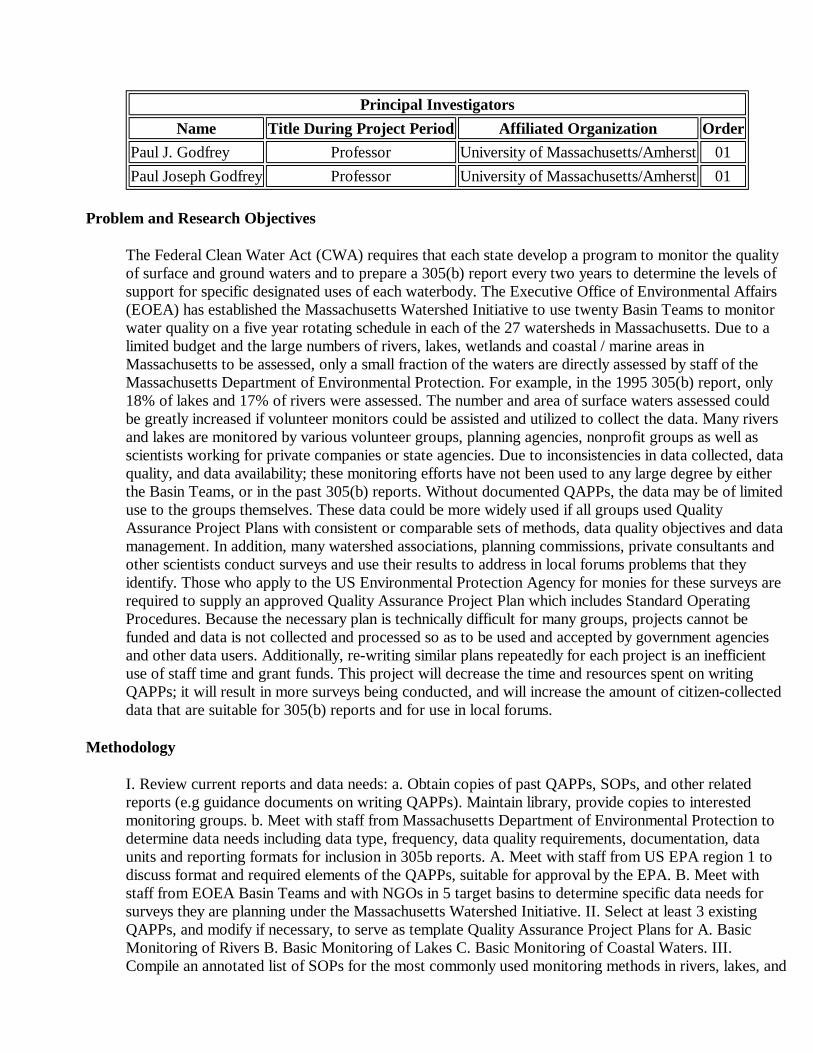
Problem and Research Objectives
The Federal Clean Water Act (CWA) requires that each state develop a program to monitor the quality of surface and ground waters and to prepare a 305(b) report every two years to determine the levels of support for specific designated uses of each waterbody. The Executive Office of Environmental Affairs (EOEA) has established the Massachusetts Watershed Initiative to use twenty Basin Teams to monitor water quality on a five year rotating schedule in each of the 27 watersheds in Massachusetts. Due to a limited budget and the large numbers of rivers, lakes, wetlands and coastal / marine areas in Massachusetts to be assessed, only a small fraction of the waters are directly assessed by staff of the Massachusetts Department of Environmental Protection. For example, in the 1995 305(b) report, only 18% of lakes and 17% of rivers were assessed. The number and area of surface waters assessed could be greatly increased if volunteer monitors could be assisted and utilized to collect the data. Many rivers and lakes are monitored by various volunteer groups, planning agencies, nonprofit groups as well as scientists working for private companies or state agencies. Due to inconsistencies in data collected, data quality, and data availability; these monitoring efforts have not been used to any large degree by either the Basin Teams, or in the past 305(b) reports. Without documented QAPPs, the data may be of limited use to the groups themselves. These data could be more widely used if all groups used Quality Assurance Project Plans with consistent or comparable sets of methods, data quality objectives and data management. In addition, many watershed associations, planning commissions, private consultants and other scientists conduct surveys and use their results to address in local forums problems that they identify. Those who apply to the US Environmental Protection Agency for monies for these surveys are required to supply an approved Quality Assurance Project Plan which includes Standard Operating Procedures. Because the necessary plan is technically difficult for many groups, projects cannot be funded and data is not collected and processed so as to be used and accepted by government agencies and other data users. Additionally, re-writing similar plans repeatedly for each project is an inefficient use of staff time and grant funds. This project will decrease the time and resources spent on writing QAPPs; it will result in more surveys being conducted, and will increase the amount of citizen-collected data that are suitable for 305(b) reports and for use in local forums.
Methodology
I. Review current reports and data needs: a. Obtain copies of past QAPPs, SOPs, and other related reports (e.g guidance documents on writing QAPPs). Maintain library, provide copies to interested monitoring groups. b. Meet with staff from Massachusetts Department of Environmental Protection to determine data needs including data type, frequency, data quality requirements, documentation, data units and reporting formats for inclusion in 305b reports. A. Meet with staff from US EPA region 1 to discuss format and required elements of the QAPPs, suitable for approval by the EPA. B. Meet with staff from EOEA Basin Teams and with NGOs in 5 target basins to determine specific data needs for surveys they are planning under the Massachusetts Watershed Initiative. II. Select at least 3 existing QAPPs, and modify if necessary, to serve as template Quality Assurance Project Plans for A. Basic Monitoring of Rivers B. Basic Monitoring of Lakes C. Basic Monitoring of Coastal Waters. III. Compile an annotated list of SOPs for the most commonly used monitoring methods in rivers, lakes, and
Principal InvestigatorsName Title During Project Period Affiliated Organization Order
Paul J. Godfrey Professor University of Massachusetts/Amherst 01Paul Joseph Godfrey Professor University of Massachusetts/Amherst 01
coastal waters, to be used as reference documents by groups preparing QAPPs. The list will include both rigorous and basic methods for some indicators and surveys. This will allow groups that are preparing QAPPs to reference the indicators and methods that match specific data quality objectives (DQOs) of the surveys they are planning. For instance, if a survey is intended to provide information for use a 305(b) report, the QAPP may refer to more rigorous methods, quality control measures, and frequency of sampling than would a QAPP for a similar survey that is intended purely as a public education tool. The list will be annotated to indicate what methods match which DQOs. The Standard Operating Procedures will follow established methods of Standard Methods or EPA methods and approved methods used by the River Watch Network and the Massachusetts Water Watch Partnership after consultation with DEP and EPA staff. Based on consultation with DEP and EPA staff, these may include: Physical elements such as flow rate monitoring, temperature, suspended solids, transparency (Secchi disk). Chemical elements such as dissolved oxygen, BOD, nutrients total Phosphorus, ammonia, nitrate+nitrite), pH. Biological elements such as Chlorophyll a, coliform bacteria (fecal coliform), benthic invertebrates (Rapid Bioassessment Protocols), macrophytes. IV. Write a guidebook that provides step by step assistance in adapting template QAPPs into Quality Assurance Project Plans for specific surveys (basic lake, river, or coastal) that will they plan to conduct, either to generate data suitable for inclusion in 305(b) reports or for more rudimentary, public education purposes. The guidebook will provide instructions in using the annotated SOP list to reference methods that will meet their data quality objectives. It will also contain worksheets that help groups determine and record survey-specific decisions such as location and number of sampling sites, frequency of sampling, number and type of quality control samples, etc. A reference section will provide guidance on where to obtain information and additional assistance (e.g. lists of certified laboratories, organizations that provide training in methods, methods manuals, etc.). V. Hold three workshops to explain the use of the template QAPPs and the guidebook. The "yellow" basins, where year 2 assessment work is scheduled for 1999 will be targeted for these workshops. These include: French & Quinebaug, Merrimack, Boston Harbor, Narragansett Bay & Mt. Hope Bay Shore, and Cape Cod. VI. Consult with groups and with their associated Basin Teams to help the groups write QAPPs for surveys that are consistent with the goals of the Massachusetts Watershed Initiative. At least 5 QAPPs will be written, by groups with our assistance. Recognizing the experimental nature of the MWI and the many unanswered questions about how best to implement it, we will explore, with these groups and Basin Teams, creative ways to deal with information needs and organizational and resource constraints. VII Write Semi-annual Progress Report. VIII Respond to comments on draft and write final versions and Final Project Report. This is a demonstration project that will attempt to determine what forms of assistance in developing QAPPs work best; what degree of direct assistance is necessary, in addition to the guidance documents and workshops, to enable groups to produce their own QAPPs. The report will contain recommendations on reproducing or modifying this system of collaboration among Basin Teams, monitoring groups, and service providers to facilitate development of QAPPs for volunteer environmental surveys in all basins.
Principal Findings and Significance
Task I Copies of existing QAPPs have been collected and compiled. Each has been reviewed for examples that may be used in the development of templates and to develop a sense of areas of difficulty. The research team has met with representatives from EPA and the Massachusetts Department of Environmental Protection to discuss the means of presenting guidance, selecting appropriate QAPP guidelines, and reviewing QAPP availability. Three meetings were held with members of the EOEA watershed teams and citizen monitoring groups to develop appropriate frameworks for the guidebook and templates. Task II All QAPPs have been reviewed and examples from sections excerpted to provide portions of the planned templates. Task III Standard Operating Procedures (SOPs) appropriate for providing data quality useable by federal and state agencies have been compiled and assembled on a web
site. Both field and laboratory SOPs are included. Until the site is reviewed by federal and state project officers, the site has restricted access. However, it will be linked to the Massachusetts Water Watch Partnership site when approved (www.umass.edu/tei/mwwp). Task IV A draft guidebook has been prepared. A preliminary draft was reviewed by state and federal QA staff and comments have been incorporated. The guidebook is currently undergoing internal review. A draft river template is complete and is in internal review. Lake and coastal templates are in rough draft form awaiting finalization of the river template. Task V Three workshops have been held to explain the use of the templates and guidebook and to receive further input on appropriate information to include. Task VI Groups that are required to provide QAPPs have been assisted in the development of their QAPPS as part of the learning process on how best to format the templates and guidebooks. The groups initially targetted because they were in watersheds undergoing intense monitoring activity by state or federal agencies have not always been active or ready to develop QAPPs. The project has been flexible in providing assistance where it is needed. Task VII Quarterly reports have been provided. Task VIII With one year to go on the project, this final stage is not complete.
Descriptors
Quality Assurance, Citizen Monitoring, Volunteer, Rivers, Lakes, Estuaries, Monitoring
Articles in Refereed Scientific Journals
Book Chapters
Dissertations
Water Resources Research Institute Reports
Conference Proceedings
Other Publications
Basic Project Information
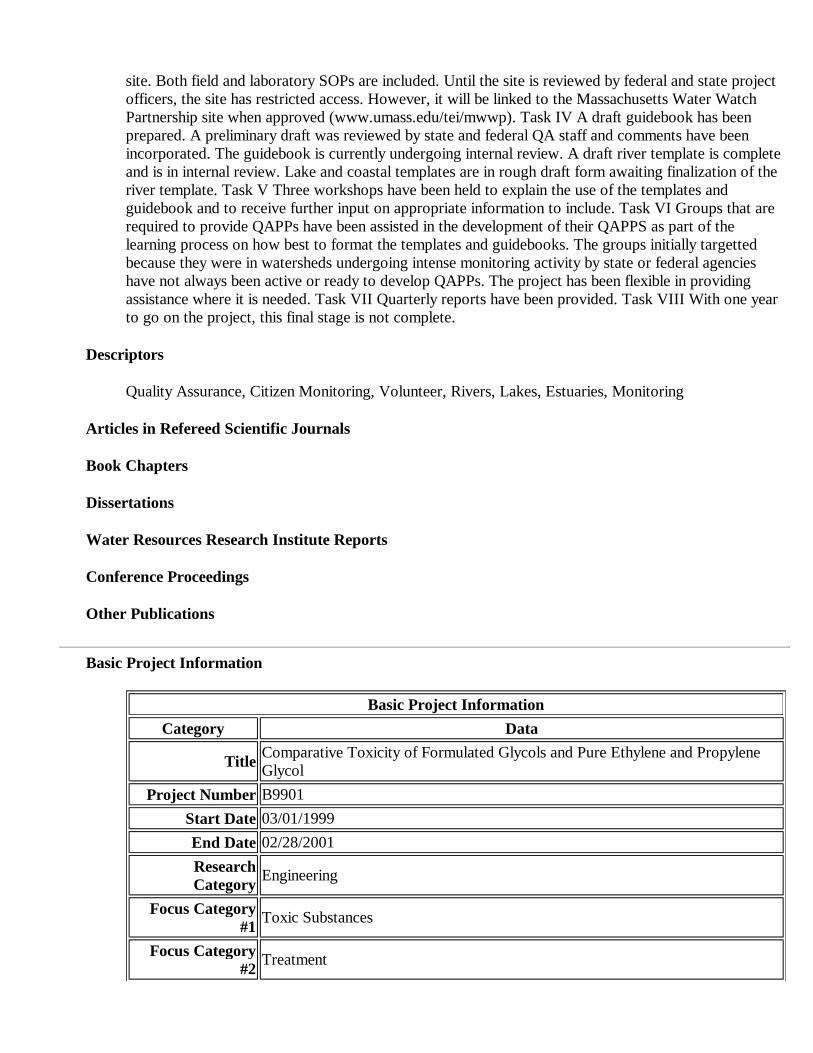
Basic Project InformationCategory Data
Title Comparative Toxicity of Formulated Glycols and Pure Ethylene and Propylene Glycol
Project Number B9901Start Date 03/01/1999End Date 02/28/2001Research Category Engineering
Focus Category #1 Toxic Substances
Focus Category #2 Treatment
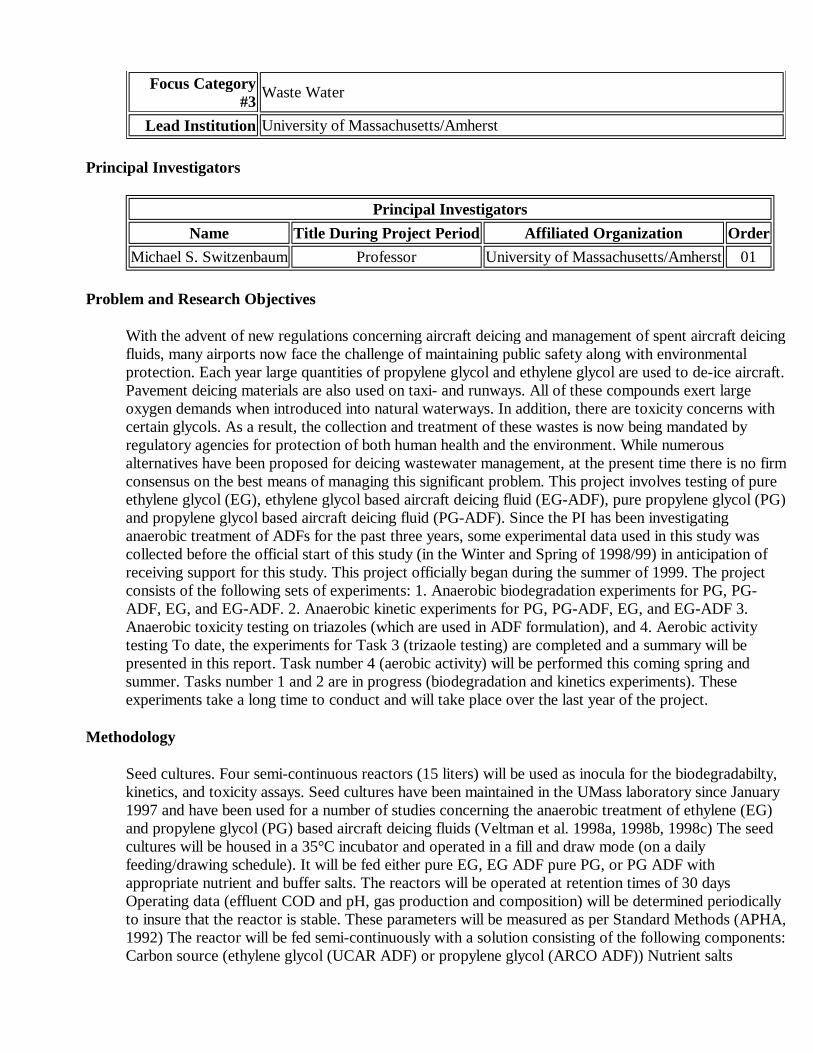
Principal Investigators
Problem and Research Objectives
With the advent of new regulations concerning aircraft deicing and management of spent aircraft deicing fluids, many airports now face the challenge of maintaining public safety along with environmental protection. Each year large quantities of propylene glycol and ethylene glycol are used to de-ice aircraft. Pavement deicing materials are also used on taxi- and runways. All of these compounds exert large oxygen demands when introduced into natural waterways. In addition, there are toxicity concerns with certain glycols. As a result, the collection and treatment of these wastes is now being mandated by regulatory agencies for protection of both human health and the environment. While numerous alternatives have been proposed for deicing wastewater management, at the present time there is no firm consensus on the best means of managing this significant problem. This project involves testing of pure ethylene glycol (EG), ethylene glycol based aircraft deicing fluid (EG-ADF), pure propylene glycol (PG) and propylene glycol based aircraft deicing fluid (PG-ADF). Since the PI has been investigating anaerobic treatment of ADFs for the past three years, some experimental data used in this study was collected before the official start of this study (in the Winter and Spring of 1998/99) in anticipation of receiving support for this study. This project officially began during the summer of 1999. The project consists of the following sets of experiments: 1. Anaerobic biodegradation experiments for PG, PG-ADF, EG, and EG-ADF. 2. Anaerobic kinetic experiments for PG, PG-ADF, EG, and EG-ADF 3. Anaerobic toxicity testing on triazoles (which are used in ADF formulation), and 4. Aerobic activity testing To date, the experiments for Task 3 (trizaole testing) are completed and a summary will be presented in this report. Task number 4 (aerobic activity) will be performed this coming spring and summer. Tasks number 1 and 2 are in progress (biodegradation and kinetics experiments). These experiments take a long time to conduct and will take place over the last year of the project.
Methodology
Seed cultures. Four semi-continuous reactors (15 liters) will be used as inocula for the biodegradabilty, kinetics, and toxicity assays. Seed cultures have been maintained in the UMass laboratory since January 1997 and have been used for a number of studies concerning the anaerobic treatment of ethylene (EG) and propylene glycol (PG) based aircraft deicing fluids (Veltman et al. 1998a, 1998b, 1998c) The seed cultures will be housed in a 35°C incubator and operated in a fill and draw mode (on a daily feeding/drawing schedule). It will be fed either pure EG, EG ADF pure PG, or PG ADF with appropriate nutrient and buffer salts. The reactors will be operated at retention times of 30 days Operating data (effluent COD and pH, gas production and composition) will be determined periodically to insure that the reactor is stable. These parameters will be measured as per Standard Methods (APHA, 1992) The reactor will be fed semi-continuously with a solution consisting of the following components: Carbon source (ethylene glycol (UCAR ADF) or propylene glycol (ARCO ADF)) Nutrient salts
Focus Category #3 Waste Water
Lead Institution University of Massachusetts/Amherst
Principal InvestigatorsName Title During Project Period Affiliated Organization Order
Michael S. Switzenbaum Professor University of Massachusetts/Amherst 01
(N,P,K,Mg,Fe,Co,Ni,Ca,Cu,Na,Zn) Buffer solution (NaHCO3) Cysteine solution Vitamin solution: Pyridoxine hydrochloride, biotin, folic acid, riboflavin, thiamin, nicotinic acid, pantothenic acid, P-aminobenzoic acid, thiotic acid, and B12). Tap water (to appropriate final volume) Each of the solutions will be made separately and then mixed. Analytical grade reagents will be used for all of the salt and vitamin solutions, and for the pure glycols (EG and PG). Union Carbide aircraft deicing fluid concentrate (UCAR ADF) will be used as the source for ethylene glycol based ADF and ARCO aircraft deicing fluid (ARCO ADF) concentrate will be used as the source for propylene glycol based ADF. Anaerobic biodegradabiltiy and kinetics Long term studies performed in the UMass laboratory have established the high degree of biodegradability of both EG and PG based ADFs. Further testing of pure EG and PG compared to the ADFs will show the influence of the additives used in the ADF formulations. To accomplish these goals, the following sets of experiments are planned: 1) Base line kinetic and steady state data (semi-continuous reactors) 2) Influence of initial concentration (semi-contiunous reactors) 3) Assessment of triazole effects on anaerobic glycol fermentation (serum bottle testing) 1). Base line kinetic data for the four acclimated cultures will be made by following the rate of removal of each glycol over the course of a 24 hour period after feeding the semi-continuous reactor (i.e. batch data). Initial kinetics data will be collected at 35°C at a 15 day residence time with an initial COD of 9000 mg/l. This concentration is typical for airport stormwater. The data will be fitted to an appropriate mechanistic model (either a zero or first order batch reactor equation), and then a kinetic rate constant (K) will be determined. In addition to COD, volatile acids and glycols will be tracked during the course of the batch kinetics experiment. Steady state performance data will be collected (in terms of COD removal). 2) Steady state performance data and kinetics data will be collected for other initial COD concentrations for each of the 4 reactors. The feed concentration to each of the four reactors will be increased to 12000 mg/l. After the reactor performance levels out (as determined by gas composition and COD removal) batch kinetic data will be determined for each reactor (measurement of COD, glycols and volatile acids with time). This procedure will be continued for feed COD concentrations of 15,000 mg/l, 20,000 mg/l and then 26,000 mg/l. These experiments are summarized as shown in Table 2. Table 2. Anaerobic biodegradabiltiy and kinetics Initial COD (mg/l) PG PG-ADF EG EG-ADF 9000 X X X X 12000 X X X X 15000 X X X X 20000 X X X X 26000 X X X X The calculated kinetic coefficients as well as COD removal percentages, will be analyzed be various statistical methods to determine if differences are significant. "t" tests will be used to analyze difference between pure glycols and ADFs. In addition, an analysis of variance (ANOVA) can be run to analyze the significance of initial COD vs. presence or absence of ADF formulations. Other testing is possible. 3) Additional experiments will be run using serum bottles to evaluate the influence triazoles directly on glycol fermentation. The procedure used is the anaerobic toxicity assay (ATA). Three different triazoles will be tested (benzotriazole, 5-methyl-1H-benzotriazole, and 5,6-dimethyl-1H-benzotriazole). These three triazoles are the most common triazoles reported to be found in ADFs (Cancilla et al. 1997). Each triazole will be tested at a range of concentrations for each pure glycol (EG and PG) using a single glycol concentration of 1000 mg/l COD. A range of triazole concentrations will be tested (from 1 to 100mg/l). Two bottles will be prepared for each concentration for each triazole. Several controls will also be used. Bottles will be feed only unamended glycol stock (for the purpose of inhibition comparison), and seed controls will also be prepared to factor out any gas made by the inoculum. In addition to testing each triazole separately, several tests will be conducted with all three triazoles together. All bottles are incubated in the dark at 35°C. ATA results are determined by comparing the amount of methane produced in the bottle with the suspected toxicant to the control bottle (in this case the unamended glycol bottle). Statistical analysis will be used to test if the differences are significant. Serum Bottle Testing. The serum bottle technique was originally developed by Miller and Wolin (1974) as a means to culture obligate anaerobic microorganisms, such as methane producing bacteria. Later, this technique was adapted by Owen et al. (1979) for an anaerobic biotransformation assay (Speece, 1996). This assay is called the biochemical methane potential (BMP) test. Serum bottles can also be used to evaluate the potential toxicity of a wastewater or a component by the anaerobic toxicity assay

used to evaluate the potential toxicity of a wastewater or a component by the anaerobic toxicity assay (ATA) (Owen et al., 1979). These tests (and modifications of these procedures) are commonly used in anaerobic wastewater treatment research (Hickey et al., 1987, 1989; Keenan et al., 1991; Fox and Ketha, 1996). The Environmental Engineering Laboratory at the University of Massachusetts/Amherst has used serum bottle testing for a variety of anaerobic wastewater treatment research projects over the past 17 years. The uses and protocols are well-developed. Table 3 lists several example projects. Note that serum bottle testing has been used recently in our lab for the evaluation of aircraft deicing wastewater (Veltman et al. (1998b,c) The procedure for the BMP test is described by Owen et al. (1979). Essentially, a sample of the wastewater or component of the wastewater is placed in a 160 ml serum bottle with an anaerobic inoculum. Usually an acclimated inoculum is used for this testing. In addition, appropriate nutrient and buffer salts are added to assure that proper conditions exist to measure the extent of biodegradation. For the ATA test, a series of bottles (with various levels of toxicants added along with a anaerobically degradable compound) are set up against the control which consists of the anaerobically degradable compound (without the toxic compound). Toxicity is determined by comparing the rates of methane gas production between the control and the bottles with the toxic. Table 3. Examples of Serum Bottle Testing at UMass/Amherst Project Use Reference Aircraft deicing wastewater BMP/ATA Veltman et al. (1998c) Propylene glycol Pathway intermediate tracking Veltman et al. (1998b) Heat dried sludge microbiology BMP Long et al. (1996) Leachate treatment Toxicity screening Keenan et al. (1993) Hydrogen monitoring Toxicity screening Hickey et al (1987, 1989) Microtox assessment Toxicity screening Atkinson and Switzenbaum (1987) Whey treatment BMP Switzenbaum and Danskin (1982) Kelly and Switzenbaum (1984) After addition of sample, inoculum and salts, the headspace of the serum bottle is purged with a CO2/N2 mixture (usually 30/70 %) for pH control. After capping the bottles with a septum, the serum bottles are incubated at 35 °C. The rate of gas production is measured by inserting a hypodermic needle connected to a syringe The composition of gas (percent methane) is determined by gas chromatography. Therefore the amount of methane produced can be calculated which is stoichiometically related to the amount of COD consumed, and hence the biodegradability of the wastewater or component sample. For the serum bottles, total gas productions is measured by syringe displacement. Methane composition is determined using thermal conductivity gas chromatography, GC/TCD Figure 3 shows an example ATA analysis for runoff from Bradley International Airport (Veltman et al. 1998c). In this test, various amounts of airport runoff are tested against an acetate control. As can be seen, some toxicity is seen for the highest volume tested (5.0ml) as less methane gas is made than the control (more is made in the other cases, which shows that the runoff is being fermented in the bottles). While toxicity can be seen, it is not clear if the toxicity is due to high glycol concentrations or due to the corrosion inhibitors. Figure 3. Anaerobic toxicity assay for a runoff sample from Bradley International Airport (winter 1997). Liquid Sample Preparation and Analysis. Kinectics reactors will be sampled using a 1-cc disposable tuberculin syringe (Becton-Dickinson Model 5602) fitted with a 19 mm, 23 gauge needle (Becton-Dickinson Precision GlideTM, Model 5156) and a 0.45 mM pore size disposable Corning 13 mm polypropylene syringe filter with cellulose acetate membrane. After shaking the reactor bottle, 490mL of filtered effluent is withdrawn and transferred into Target Micro-SertTM vial inserts placed in Target DPTM 12x32 mm vials (National Scientific Company). Samples will be refrigerated at 1.8°C until analysis. Samples will be analyzed for glycols and volatile acids. Using a 7000 Series Modified MicroliterTM syringe (Hamilton Company) fitted with a Chaney adapter, 2 mL will be withdrawn from sample vials and injected into a Varian 3300 gas chromatograph through a split/splitless injector (in splitless mode) fitted with a Varian unpacked split glass inlet sleeve. The injector temperature is 220oC. Zero-grade nitrogen (Merriam Graves Corp., West Springfield, MA) flowing at around 18 mL/min will carry the sample through a 15 m NukolTM capillary column (Supelco, Inc.) with 0.53 mm inside diameter and 0.50 mm film thickness. Compound elution is detected with a flame ionization detector (FID) set at 250oC. Data are plotted on a Spectra-Physics SP4270 integrator. Samples are analyzed for glycols before acidification out of concern that strong acid would chemically transform the hydroxyl-bearing compounds. The column
temperature is held at 40oC for one minute, then increased at 15oC/min to 145oC, at which point the analysis is complete. Samples are then acidified to ensure that volatile fatty acids are predominantly in their protonated form. To analyze for VFAs (specifically, acetate, propionate, and butyrate), an initial column temperature of 90oC is increased immediately at 7.5oC/min to 105oC, held for one minute, then increased at 10oC until all compounds eluted, at which point the run is manually concluded. Standards will be run each time that samples are analyzed. Two sets of standards were used: one for VFAs, and one for glycols. Standards are run in duplicate and spanned the range of concentrations present in the samples. The concentration in a standard are plotted versus the average area of replicate runs for that concentration. Standard curves for each compound analyzed are produced. Curves are forced through the origin, which still allowed for good regression fits. Gas Analysis. Gas production in the serum bottles is measured periodically, usually every two to three days. Excess gas is extracted from the serum bottles and wasted using a Perfectumâ fitted glass hypodermic syringe with a 19 mm, 23 gauge needle (Becton-Dickinson Precision Glideä, Model 5156). The syringe is lubricated with distilled water prior to analysis to provide a gas tight seal and permit free movement of the syringe plunger. Syringes are held horizontally and allowed to equilibrate with atmospheric pressure to determine gas volume. The total volume of methane produced by each serum bottle is computed from measurements of total gas volume and gas composition, and corrected for seed contribution. Gas analysis is completed immediately following gas volume determination to insure that the headspace pressure in the serum bottles is at atmospheric pressure. One milliliter of headspace gas is withdrawn using a 1-cc gastight syringe (Hamilton #1001) equipped with a 25.4 mm, 20 gauge needle and immediately injected into a GOW Mac Series 550 Gas Chromatograph for analysis. Separation and detection of the gas components are accomplished by using a 1.83 m x 6.35 mm Poropak Q column (Supelco, Inc.) and a thermal conductivity detector. Ultra-pure helium (Merriam Graves Corp.) is used as a carrier gas at a flowrate of 30 ml/min with an injector port temperature of 110°C, a column temperature of 80°C, and a detector temperature of 70°C. Methane content and CO2 content for the samples are determined by comparing the observed peak height response of the sample to calibration curves prepared during each run using methane and CO2 calibration gases of known purity (Merriam Graves Corp.). The relative standard deviation of the methane analysis of the headspace gas has been determined for our methodology, at 0.26% (Hickey, 1987). For serum bottles, samples are run in duplicate and controls in triplicate. Previous testing on total gas and methane production with serum bottle testing in our laboratory has found a relative standard deviation of 5.0% and 8.5% for total gas and methane production respectively for cumulative 24 hour results (Hickey, 1987). Respirometry testing. While anaerobic treatment shows promise for on-site treatment of airport deicing runoff, it will generally be used as a pretreatment process, and therefore further treatment will be needed before discharge. Further treatment might occur onsite or after discharge to a POTW. In this regard the fate of the triazoles in an aerobic environment should be of interest. We propose to evaluate the aerobic biotreatability of effluents from the anaerobic biotreatability and kinetics testing by aerobic respirometry. Oxygen uptake will be measured with a N-Con respirometer. Toxicity patterns can be determined with this data. For background information, biotreatability studies using the repirometer will be conducted on ethylene glycol, propylene glycol, and both glycol based ADFs. While both ethylene and propylene glycol are known to be biodegradable under aerobic conditions (Verschueren, 1996), few data have been reported on the degradation of the glycol based ADFs.
Principal Findings and Significance
Progress
Task 1 and 2.
Reactor Construction
We began operating reactors to characterize anaerobic treatment of glycol-based deicing fluids and pure glycols in October, 1999. Four continuous flow stirred tank reactors (CSTRs) were constructed for evaluating the treatment of the following:
CSTR 1: Propylene glycol-based Type I and Type IV aircraft deicing fluid
CSTR 2: Pure propylene glycol
CSTR 3: Ethylene glycol-based Type I and Type IV aircraft deicing fluid, and
CSTR 4: Pure ethylene glycol
The reactors were assembled out of Schedule 40 PVC plastic tubing and 3/8" plastic pieces cut to size, with appurtenances constructed and attached with suitable materials. The working contents of the reactors were taken from anaerobic fill-and-draw reserve digesters that were acclimated to PG-based aircraft deicing fluid (ADFs) for CSTRs 1 and 2, and EG-based ADFs for CSTRs 3 and 4. The contents are being continuously mixed using Talboys motorized stirrers bearing stainless steel shafts to which flat plastic paddles have been affixed. Masterflex peristaltic pumps are being used to draw solutions containing substrate (ADF or glycol), nutrients, and buffer. Two solutions are being prepared for each reactor: (1) a feed solution containing either ADF or glycol along with buffer and some nutrients, and (2) a nutrient solution containing several additional nutrients. The reactor volume is kept constant by using an overflow structure; thus as feed and nutrient solutions are pumped into the reactor, an equal volume overflows. The total flow rate (feed solution plus nutrient solution) sets the hydraulic residence time. Since these are suspended growth cultures, the hydraulic residence time is the same as the solids residence time. The total flow rate has been set to provide an approximately 15-day solids residence time.
The feed solutions are different for each reactor. Each reactor's feed solution contains ammonium phosphate dibasic (phosphorus), urea (nitrogen), and sodium bicarbonate (buffer). The feed solutions for each reactor differ in the substrate added. CSTR 1 feed solution contains ARCO Type I ADF and Octagon Maxflight Type IV ADF (both propylene glycol-based); CSTR feed contains pure propylene glycol; CSTR 3 feed contains UCAR Type I and UCAR Ultra+ Type IV ADFs (both ethylene glycol-based); and CSTR 4 feed contains pure ethylene glycol. The ADFs are composed primarily of glycol but also contain several types of additives that may affect the kinetics of degradation of the glycols in the ADFs.
The nutrient solutions for all four reactors are the same. The nutrient solutions are made separately from the feed solutions and are fed at the same time. The nutrient solutions provide magnesium, manganese, potassium, calcium, iron, cobalt, nickel, boron (boric acid), copper, zinc, and molybdenum to the reactors.
The combined flow (feed solution plus nutrient solution) into each reactor provides an overall influent feed concentration (from glycol-based ADFs or pure glycol) of 9000 mg COD/L. This was found to be an appropriate influent strength based on previous bench-scale investigations at University of Massachusetts/Amherst.
Reactor Performance
CSTRs 1 and 2. The reactors treating PG-based ADF (CSTR 1) and pure PG (CSTR 2) have not yet been successfully started up. It was discovered that the paddles placed on the ends of the stirrer shafts attached to the motorized stirrers had slipped off. These were pulled out, the paddles affixed with tension pins to assure they remained on the shafts, then the reactors were restarted. The shaft/paddle on CSTR 3 (EG-based ADF) was similarly modified; that for CSTR 4 had a different shaft and paddle which had been used previously without incident. The restarting of these reactors involved emptying their contents and adding new seed along with distilled water, nutrients, and a starting load of Type I ADF (CSTR 1) or pure glycol (CSTR 2). They are also being operated at a 30-day residence time to give them time to adjust. They are currently operating as follows (Table 1).
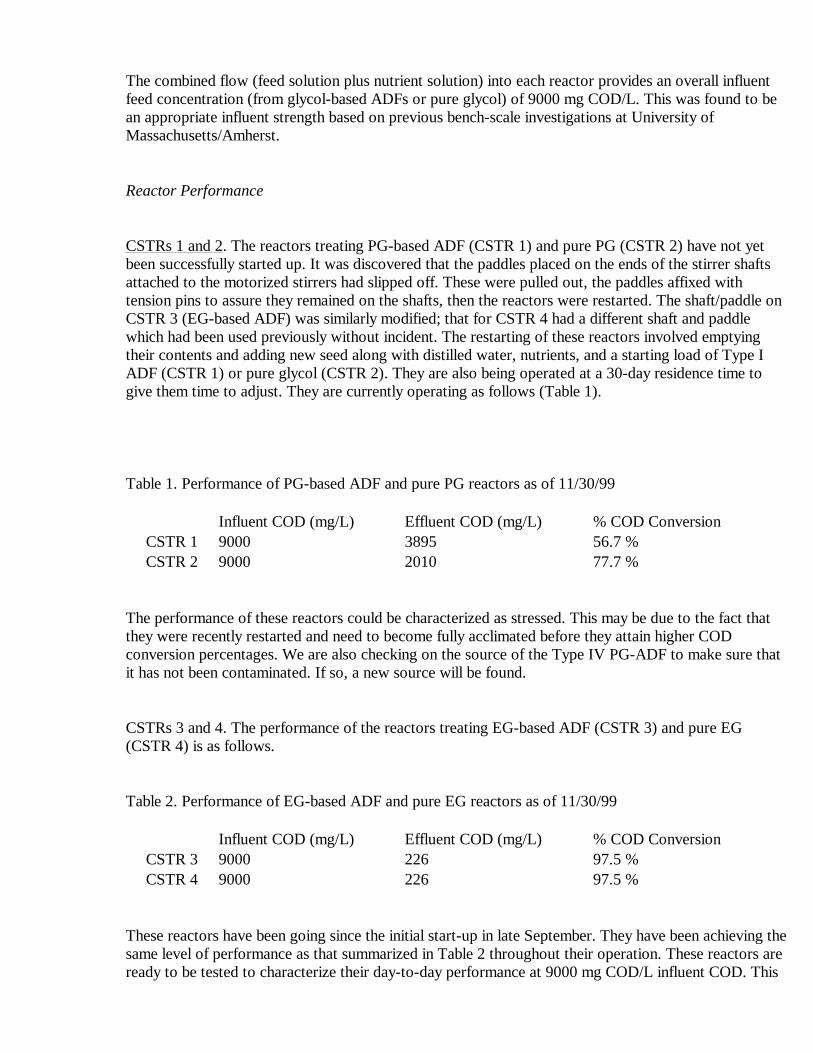
Table 1. Performance of PG-based ADF and pure PG reactors as of 11/30/99
The performance of these reactors could be characterized as stressed. This may be due to the fact that they were recently restarted and need to become fully acclimated before they attain higher COD conversion percentages. We are also checking on the source of the Type IV PG-ADF to make sure that it has not been contaminated. If so, a new source will be found.
CSTRs 3 and 4. The performance of the reactors treating EG-based ADF (CSTR 3) and pure EG (CSTR 4) is as follows.
Table 2. Performance of EG-based ADF and pure EG reactors as of 11/30/99
These reactors have been going since the initial start-up in late September. They have been achieving the same level of performance as that summarized in Table 2 throughout their operation. These reactors are ready to be tested to characterize their day-to-day performance at 9000 mg COD/L influent COD. This
Influent COD (mg/L) Effluent COD (mg/L) % COD Conversion CSTR 1 9000 3895 56.7 % CSTR 2 9000 2010 77.7 %
Influent COD (mg/L) Effluent COD (mg/L) % COD Conversion CSTR 3 9000 226 97.5 % CSTR 4 9000 226 97.5 %
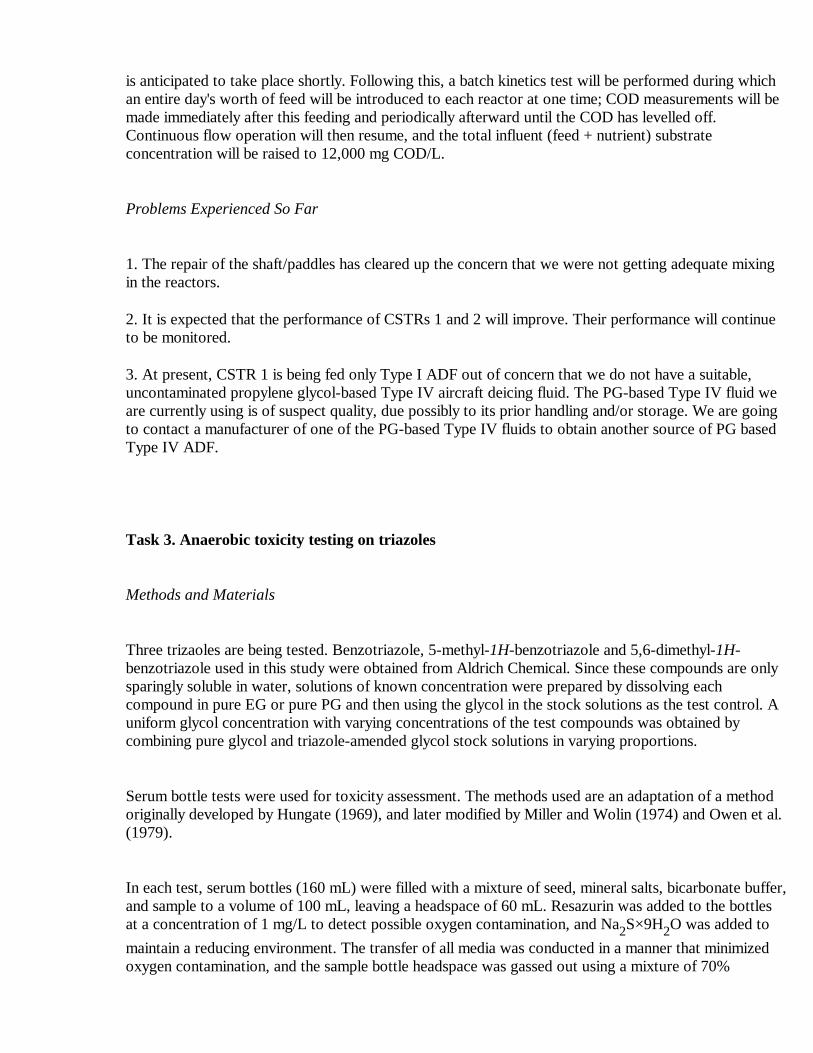
is anticipated to take place shortly. Following this, a batch kinetics test will be performed during which an entire day's worth of feed will be introduced to each reactor at one time; COD measurements will be made immediately after this feeding and periodically afterward until the COD has levelled off. Continuous flow operation will then resume, and the total influent (feed + nutrient) substrate concentration will be raised to 12,000 mg COD/L.
Problems Experienced So Far
1. The repair of the shaft/paddles has cleared up the concern that we were not getting adequate mixing in the reactors.
2. It is expected that the performance of CSTRs 1 and 2 will improve. Their performance will continue to be monitored.
3. At present, CSTR 1 is being fed only Type I ADF out of concern that we do not have a suitable, uncontaminated propylene glycol-based Type IV aircraft deicing fluid. The PG-based Type IV fluid we are currently using is of suspect quality, due possibly to its prior handling and/or storage. We are going to contact a manufacturer of one of the PG-based Type IV fluids to obtain another source of PG based Type IV ADF.
Task 3. Anaerobic toxicity testing on triazoles
Methods and Materials
Three trizaoles are being tested. Benzotriazole, 5-methyl-1H-benzotriazole and 5,6-dimethyl-1H-benzotriazole used in this study were obtained from Aldrich Chemical. Since these compounds are only sparingly soluble in water, solutions of known concentration were prepared by dissolving each compound in pure EG or pure PG and then using the glycol in the stock solutions as the test control. A uniform glycol concentration with varying concentrations of the test compounds was obtained by combining pure glycol and triazole-amended glycol stock solutions in varying proportions.
Serum bottle tests were used for toxicity assessment. The methods used are an adaptation of a method originally developed by Hungate (1969), and later modified by Miller and Wolin (1974) and Owen et al. (1979).
In each test, serum bottles (160 mL) were filled with a mixture of seed, mineral salts, bicarbonate buffer, and sample to a volume of 100 mL, leaving a headspace of 60 mL. Resazurin was added to the bottles at a concentration of 1 mg/L to detect possible oxygen contamination, and Na2S×9H2O was added to maintain a reducing environment. The transfer of all media was conducted in a manner that minimized oxygen contamination, and the sample bottle headspace was gassed out using a mixture of 70%
nitrogen/30% CO2 prior to sealing. Seals consisted of a butyl rubber septum (Wheaton 224100-193) with an aluminum crimp cap (Wheaton 224182-01).
All serum bottle incubations were carried out in the dark at a temperature of 35° C. Tests were conducted for a period of 15 days or until gas production ceased. During each test, a sample blank was run to correct for the degradable material introduced with the seed. In all cases the COD introduced with the seed was less than 1% of the total sample COD, thus seed corrections were small.
Samples and sample blanks were run in duplicate. Serum bottles containing nutrients and seed were initially inoculated with 500 mg/L glycol and varying volumes of the triazole under consideration. Methane production was monitored over time against a control containing 500 mg/L acetate and neither glycol nor ADF. Toxic or inhibitory effects were observed when samples produced less methane than the acetate control over a prescribed period of time.
In the first experiment glycol concentrations that provided 1000 mg COD/L were used. Triazole concentrations ranged from 5 to 100 mg/L (benzotriazole), 2.5 to 100 mg/L (5-methyl-1H-benzotriazole), and 0.5 to 20 mg/L (5,6-dimethyl-1H-benzotriazole). 20 mL of acclimated seed was used. A second test was conducted to test higher triazole concentrations. Twice as much triazole was dissolved in pure glycols, and glycol concentrations that provided 1500 mg COD/L were used. Benzotriazole and 5-methyl-1H-benzotriazole were tested from 60 to 300 mg/L; testing of 5,6-dimethyl-1H-benzotriazole was not repeated due to solubility limitations. 30 mL of seed was used in the second test to provide the same F/M ratio as in the first test.
Gas production in the serum bottles was measured periodically, usually every two to three days. Volumetric measurements were conducted in the 35° C incubation room. Excess gas was extracted from the serum bottles and wasted using a Perfectumâ fitted glass hypodermic syringe with a 19-mm, 23-gauge needle (Becton-Dickinson Precision Glideä, Model 5156). The syringe was lubricated with distilled water prior to analysis to provide a gas-tight seal and permit free movement of the syringe plunger. Syringes were held horizontally and allowed to equilibrate with atmospheric pressure to determine gas volume. The total volume of methane produced by each serum bottle was computed from measurements of total gas volume and gas composition, and corrected for seed contribution.
Gas analysis was completed immediately following gas volume determination to insure that the headspace pressure in the serum bottles was at atmospheric pressure. One milliliter of headspace gas was withdrawn using a 1-cc gas-tight syringe (Hamilton #1001) equipped with a 25.4-mm, 22-gauge needle and immediately injected into a GOW Mac Series 550 GC for analysis. Separation and detection of the gas components was accomplished by using a 1.83-m x 6.35-mm Poropak Q column (Supelco, Inc.) and a thermal conductivity detector. Ultra-pure helium (Merriam Graves Corporation) was used as a carrier gas at a flowrate of 30 mL/min with an injector port temperature of 110° C, a column temperature of 80° C, and a detector temperature of 70° C. Methane content and CO2 content for the samples were determined by comparing the observed peak height response of the sample to calibration curves prepared during each run, using methane and CO2 calibration gases of known purity (Merriam Graves Corporation). Replicate injections were made for each point on the calibration curve, and a regression line forced through the origin was used to calculate sample CH4 and CO2 values.
Inoculum used in the serum bottle tests was taken from two separate suspended-growth, semi-continuous flow, fill-and-draw seed reactors. Each reactor contained a mixed methanogenic culture that had been acclimated to the degradation of either an EG or PG-based Type I ADF. The EG reactor was fed Union Carbide ADF while the PG reactor was fed with ARCO Plus Dilute ADF. Seed was drawn prior to feeding to minimize the amount of degradable COD introduced to the serum bottles with the seed. A 20% or 30% by volume seed was used in the serum bottles, resulting in the addition of approximately 16-24 mg total suspended solids (TSS) to each serum bottle. EG degraders were used as the seed in the tests involving EG, and PG degraders were used in the tests involving PG. The seed for the reactors was originally derived from several municipal wastewater digesters and the organisms were slowly transitioned from a simple sugar source (sucrose) to the glycol. At the time of the study, the reactors were operating under steady-state conditions at an SRT of 30 days. The seed reactors were kept in the dark at a constant 35° C and had been in operation with ADF as the sole substrate for over one year before the start of testing.
Results and Discussion
Unsubstituted and mono- and dimethyl- substituted benzotriazole.
Although the exact formulations for the additive packages used in ADF are not known, tolytriazoles are known to be present in ADF. For this reason we tested the potential anaerobic toxicity of benzotriazole, 5-methyl-1H-benzotriazole, and 5,6-dimethyl-1H-benzotriazole against anaerobic cultures that had been acclimated to dilute Type I ADF solutions containing small quantities of these compounds. In this testing glycol (either EG or PG) was used as a control, and the concentration of each test compound varied. The maximum concentration of each compound tested was selected to correspond to the concentration of benzotriazole that might be found in diluted ADF released to the environment (approximately 300 ppm). Higher concentrations were not examined because they are not environmentally relevant and because of difficulty in getting the compounds into solution. ADF runoff with benzotriazole concentrations above 300 ppm would be greater than 5% ADF, concentrations not generally found in the environment.
The results of the tolytriazole testing are summarized in Table1, and Figures 1 to 6. These data lead to the following observations.
1. Benzotriazole appears to have only a minimal inhibitory effect on anaerobic biodegradation of ethylene glycol (Figure 1); the minimal inhibition observed increases gradually between 60 and 300 mg/L benzotriazole. Benzotriazole appears to have a more inhibitory effect on anaerobic propylene glycol biodegradation at the same triazole concentrations (Figure 2), but this effect is only slight and gradually increases as concentration increases from 60 to 300 mg/L.
2. 5-methyl-1H-benzotriazole has a noticeable inhibitory effect on anaerobic degradation of both EG and PG degradation (Figures 3,4); inhibition is slight up to 120 mg/L, moderate at 180 and 240 mg/L, and severe at 300 mg/L.
3. The low concentrations of 5,6-dimethyl-1H-benzotriazole tested on anaerobic EG degradation were
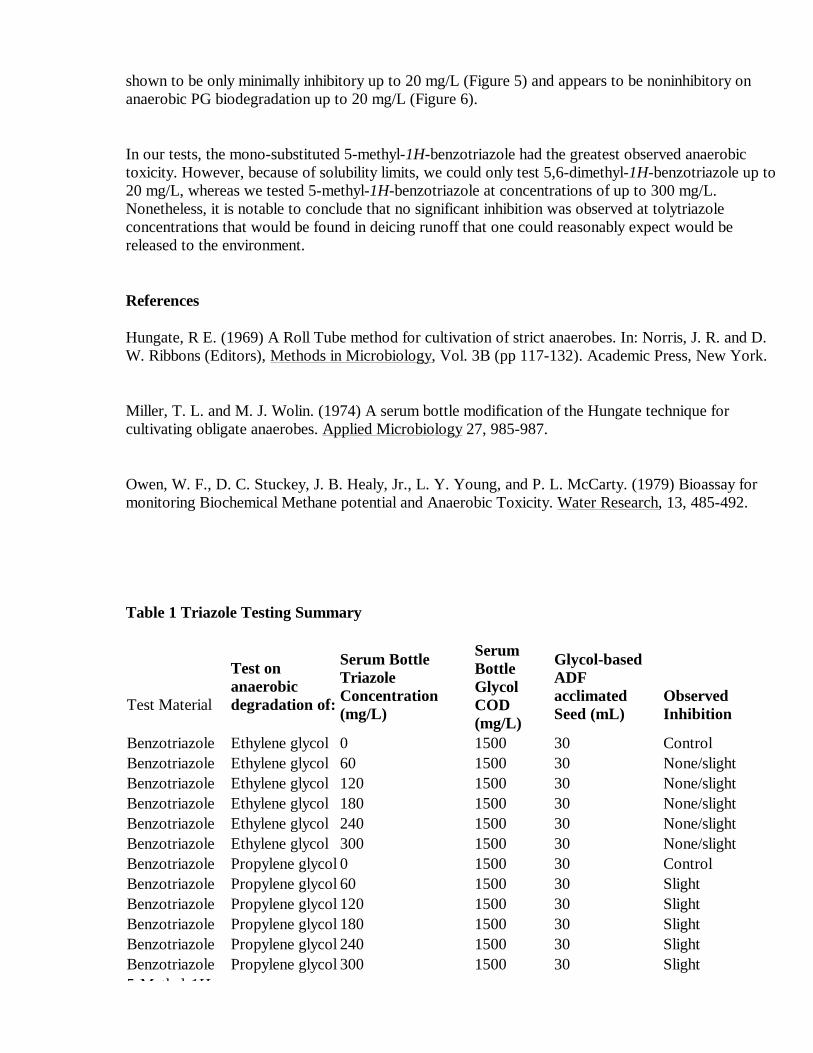
shown to be only minimally inhibitory up to 20 mg/L (Figure 5) and appears to be noninhibitory on anaerobic PG biodegradation up to 20 mg/L (Figure 6).
In our tests, the mono-substituted 5-methyl-1H-benzotriazole had the greatest observed anaerobic toxicity. However, because of solubility limits, we could only test 5,6-dimethyl-1H-benzotriazole up to 20 mg/L, whereas we tested 5-methyl-1H-benzotriazole at concentrations of up to 300 mg/L. Nonetheless, it is notable to conclude that no significant inhibition was observed at tolytriazole concentrations that would be found in deicing runoff that one could reasonably expect would be released to the environment.
References
Hungate, R E. (1969) A Roll Tube method for cultivation of strict anaerobes. In: Norris, J. R. and D. W. Ribbons (Editors), Methods in Microbiology, Vol. 3B (pp 117-132). Academic Press, New York.
Miller, T. L. and M. J. Wolin. (1974) A serum bottle modification of the Hungate technique for cultivating obligate anaerobes. Applied Microbiology 27, 985-987.
Owen, W. F., D. C. Stuckey, J. B. Healy, Jr., L. Y. Young, and P. L. McCarty. (1979) Bioassay for monitoring Biochemical Methane potential and Anaerobic Toxicity. Water Research, 13, 485-492.
Table 1 Triazole Testing Summary
Test Material
Test on anaerobic degradation of:
Serum Bottle Triazole Concentration (mg/L)
Serum Bottle Glycol COD (mg/L)
Glycol-based ADF acclimated Seed (mL)
Observed Inhibition
Benzotriazole Ethylene glycol 0 1500 30 ControlBenzotriazole Ethylene glycol 60 1500 30 None/slightBenzotriazole Ethylene glycol 120 1500 30 None/slightBenzotriazole Ethylene glycol 180 1500 30 None/slightBenzotriazole Ethylene glycol 240 1500 30 None/slightBenzotriazole Ethylene glycol 300 1500 30 None/slightBenzotriazole Propylene glycol 0 1500 30 ControlBenzotriazole Propylene glycol 60 1500 30 SlightBenzotriazole Propylene glycol 120 1500 30 SlightBenzotriazole Propylene glycol 180 1500 30 SlightBenzotriazole Propylene glycol 240 1500 30 SlightBenzotriazole Propylene glycol 300 1500 30 Slight5-Methyl-1H-
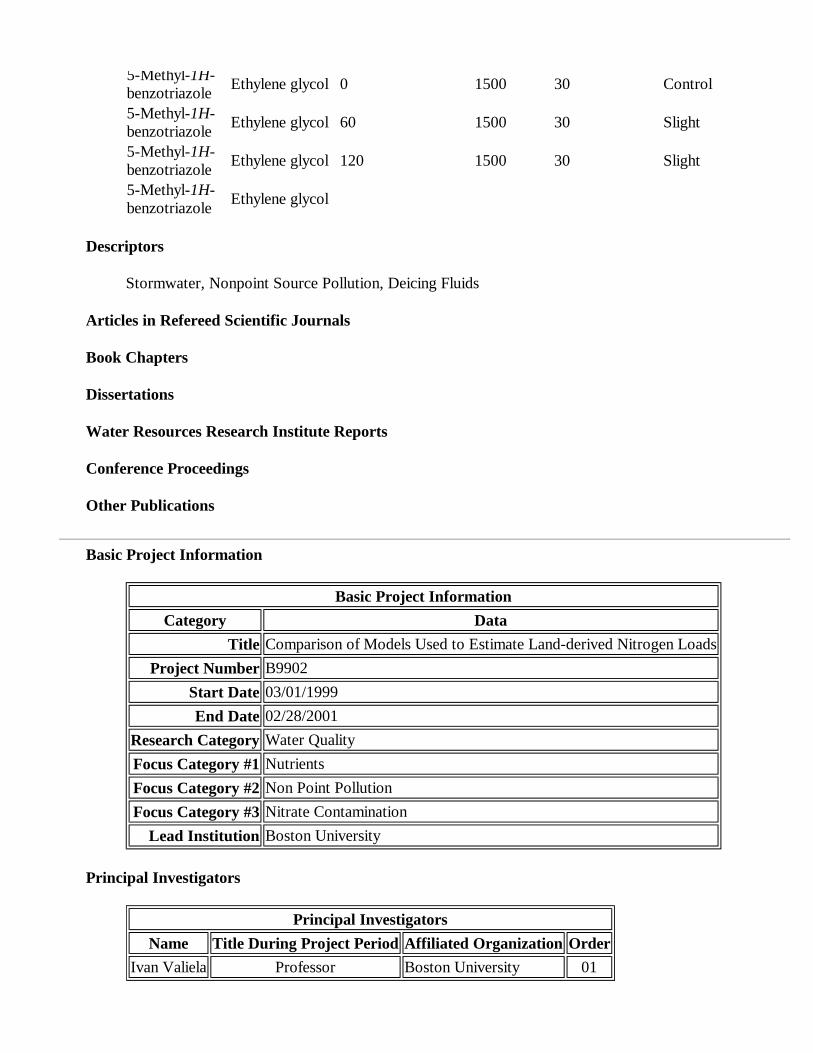
Descriptors
Stormwater, Nonpoint Source Pollution, Deicing Fluids
Articles in Refereed Scientific Journals
Book Chapters
Dissertations
Water Resources Research Institute Reports
Conference Proceedings
Other Publications
5-Methyl-1H-benzotriazole Ethylene glycol 0 1500 30 Control
5-Methyl-1H-benzotriazole Ethylene glycol 60 1500 30 Slight
5-Methyl-1H-benzotriazole Ethylene glycol 120 1500 30 Slight
5-Methyl-1H-benzotriazole Ethylene glycol
Basic Project Information
Principal Investigators
Basic Project InformationCategory Data
Title Comparison of Models Used to Estimate Land-derived Nitrogen LoadsProject Number B9902
Start Date 03/01/1999End Date 02/28/2001
Research Category Water QualityFocus Category #1 NutrientsFocus Category #2 Non Point PollutionFocus Category #3 Nitrate Contamination
Lead Institution Boston University
Principal InvestigatorsName Title During Project Period Affiliated Organization Order
Ivan Valiela Professor Boston University 01
Problem and Research Objectives
The core goal of this proposal was to address the issue of the many untested and quite different models and protocols used in nitrogen loading estimates. We proposed to 1) compare the performance of selected model types versus actual measurements of nitrogen loads from watersheds to receiving estuaries; 2) compare the different models as to components and processes and relative ability to predict measured loads; and 3) present the comparisons and descriptions of the models in a format accessible to stakeholders and other potential users.
Methodology
We started our work by detailed examination of published descriptions of perhaps two dozen models designed to calculate land-derived nitrogen loads to estuaries. We selected to work on a narrower list, based on the following criteria: 1. Availability of clearly stated procedures and data requirements 2. Range of scale of area to which the models were applicable (from single parcel to entire watersheds 3. Range of structure from relatively simple to more complex 4. Inclusion of surface runoff and groundwater as the freshwater delivery mechanism 5. Prediction of either annual nitrogen loads or mean annual dissolved inorganic nitrogen in the water of the receiving estuaries. We made detailed readings of the published sources for each model, to keep track of the components included in each model, and worked out the protocols needed to use the models to predict either loads or concentrations in a set of Cape Cod estuaries from which we had a substantial data set. These measurements were to be used as the "measured" against which to compare "predictions" made by the various models. We obtained measured estimates of both loads and concentrations. Before using the "measured" values of either loads or concentrations, we carried out a detailed analysis of the way we calculated "measured loads. To do this, we planned to multiply the average nitrogen concentration found in hundreds of groundwater samples, times the annual recharge of freshwater. The validity of this approach was established by comparing the rates of annual recharge versus freshwater flow rates measured in sets of 9 seepage meters deployed through the seepage face. We established the dimensions of the seepage face by measurements of salinity in the groundwater about to flow through the seepage face. If we found fresh water, we were confident we were within the seepage face.
Principal Findings and Significance
In terms of the verification of the measured estimates of loads, we found remarkably good agreement between the recharge-based values and the seepage meter-derived freshwater flow rates. In fact, there was, on average, only a 9% difference, which we took to mean that there were some flows through channels that took small portions of the freshwater under the seepage face and delivered some freshwater into the estuary floor. These flows were inconsequential relative to the much larger flow of freshwater through the seepage face. It is evident from these results that recharge-based measurement estimates capture over 90% of the freshwater flow, and thus furnished an excellent way to obtain measured nitrogen loads. These data are all worked up, and ready for publication. We also had a large data set of monthly surface and near-bottom samples of water collected across four years of work in each estuary. The concentrations of nitrate, ammonium, and dissolved organic nitrogen in these samples were to calculate mean annual values for each estuary and nitrogen species. Having established that the measured values of loads and concentrations were reasonable, we proceeded to compare the predictions of the selected models to measured values. The initial selection of models included 9 models; more will be added as we proceed. Some initial results are appended in attached figures: the basic approach is to plot the model prediction against the measured values for as many estuaries as we can (the points in the
Information Transfer Program
appended figs. are for Waquoit Bay; we are preparing data from other estuaries to add more points to the comparisons). The first step in the comparison is to calculate a regression to assess the precision of the model predictions. Then to evaluate the accuracy of the model predictions, we examined the significance of the statistical difference between the calculated regression and the 1:1 line of perfect fit. Our initial analyses were done with Model I regression, under the assumption of the Berkson case. Since we did the initial comparisons, we developed spreadsheet calculations with which to do Model II regressions, which we prefer to use from now on. In any case, the performances of the various models differ quite markedly, and our procedure seems quite robust. We anticipate that we will be able to quantify the differences among the models, and what is more, to develop inter-calibration coefficients so that users may choose the model they might find most convenient, yet apply correction factors that will produce reasonable predictions. In addition, the examination of the different models will provide insight as to what simplifications of model structure might be possible while still managing to capture the magnitude of the loading from land. We also plan to evaluate the relative potential of each model to serve management purposes by examining the ability of the models to partition loads as derived from specific sources of nitrogen, and identify key land use types amenable to management options. We will finish this work during the second year of this grant. We will not need to change the budget allocations. The existing budget arrangement will do quite well to allow us to carry out the remaining work. The following students participated in this work: Jennifer Bowen (Masters candidate), who applied the models tested to the Waquoit Bay estuaries, and performed many of the statistical analyses; Marci Cole (PhD candidate) who tabulated all of the land uses to apply the models to non-Waquoit estuaries, and Gabrielle Tomasky (Research Assistant) who collected and analyzed the nutrient samples necessary for the verification. We are nearly finished preparing one manuscript detailing the work above.
Descriptors
Model, Nitrogen Loading, Watershed, Land Use, Estuary, Groundwater
Articles in Refereed Scientific Journals
Book Chapters
Dissertations
Water Resources Research Institute Reports
Conference Proceedings
Other Publications
Basic Project Information

Principal Investigators
Problem and Research Objectives
The Massachusetts Water Watch Partnership (MassWWP) was formed in 1990 to empower citizens to collect, evaluate, and act on scientifically credible water quality information for the Commonwealth's surface waters. To accomplish this task, we rely on building a partnership with government, industry, educators, conservation organizations and the general public, who lend their respective talents to this effort to achieve practical solutions to water quality problems. The program has grown from working with 15 groups in 1990 to over 80 today. Funded principally through grants from foundations and industry and membership fees until 1999, the program is currently principally funded through contracts with the Massachusetts Executive Office of Environmental Affairs (EOEA) and grants from the Massachusetts Environmental Trust Fund (MET).
Methodology
MassWWP services fall into several broad categories: 1) Workshop and conference series, which trains volunteers and promotes information sharing on the major aspects of planning and running a monitoring program, from program planning to field and laboratory methods to data management and presentation. 2) Technical services, including laboratory analyses of some parameters and a quality control program for other analyses which volunteers perform themselves. 3) Partnership and network building to foster productive relationships among volunteer groups and between volunteer programs and governments, business, and other interests. 4) Special projects on specific issues, such as satellite imagery and a nationwide Secchi disk survey. 5) Research on topics that have potential to enhance the utility of volunteer monitoring programs. 6) Consultation and advice, loan of sampling equipment, and other direct services. 7) Conferences. MassWWP regularly presents papers and workshops or helps plan water monitoring related conferences around New England and the nation. 8) Publications.
Basic Project InformationCategory Data
Title Monitoring Assistance for Volunteer Water Quality MonitoringDescription Workshops and technical advice to volunteer water quality monitoring groupsStart Date 01/01/1990End Date 06/30/2001
Type ConferencesLead Institution University of Massachusetts/Amherst
Principal InvestigatorsName Title During Project Period Affiliated Organization Order
Jerome R. Schoen Professional Staff University of Massachusetts/Amherst 01Paul J. Godfrey Professor University of Massachusetts/Amherst 02Paul Joseph Godfrey Professor University of Massachusetts/Amherst 02Marie-Francoise Walk Professional Staff University of Massachusetts/Amherst 03
Development and/or distribution of documents of use to volunteer monitors. 9) Statewide Coordinator and Western Massachusetts Service Provider. A principal task of the EOEA support is to provide statewide coordination of citizen water quality monitoring and guide the four current regional service providers. The Water Watch Partnership is also one of the designated regional service providers, covering western Massachusetts.
Principal Findings and Significance
Project One: Support to Volunteer Monitoring Network Task 1: Coordination between Monitoring Support Centers: 1. Identify skill strengths, as identified by the Support Centers, of the Support Centers contracted by EOEA. 1. Sponsor meetings of Support Centers to share strengths between service centers. Distribute to the Support Centers and EOEA a matrix identifying key skills of each Support Center. 2. Summarize information compiled through the FY 1999 Volunteer Monitoring Group Survey and make a presentation to the Support Center liaisons on those skills most sought after by local monitoring groups. We used the 1999 monitoring group needs survey and an earlier Volunteer Environmental Monitoring Network (VEMN) document titled "Characteristics of a Successful Volunteer Water Quality Monitoring Program" to develop a questionnaire for Monitoring Support Centers (MSCs). We discussed and distributed this at an April 3 meeting. Based on the written responses of the MSCs, we have produced a table listing the respective needs and services. See file mscservice2000.doc. Another file, trainingaids.doc lists the manuals and other materials MSCs use in their assistance programs. Earlier drafts of these files were distributed to the MSCs. The issue discussed at the April 3 MSC meeting, and as part of wide-ranging discussions at the May 9 and June 14 CAC meetings. In addition, we wrote a brief report discussing MSC services and products. See file mscdiscuss.doc A minimum of four (4) workshops are required. The Data Presentation Manual published by MWWP in 1999 is one topic that must be presented during a workshop We held the following workshops from December 15 1999 – June 30 2000: - January 8 and 29. Study Designs and Quality Assurance Project Plans (QAPPs). Lawrence, MA. Co-presented with Merrimack River Watershed Council.* - January 22. How to start a monitoring program. Leicester MA. Co-sponsored by Massachusetts Congress of Lakes and Ponds. - February 5. Study designs / QAPPs. Amherst MA.* - February 9. Study designs / QAPPs. Falmouth MA. Co-sponsored by Waquoit Bay National Estuarine Research Reserve (WBNERR).* - We also presented at and facilitated a discussion at a Suasco water quality monitoring forum, March 4 in Sudbury. - Data presentation. March 29 at Waquoit Bay National Estuarine Research Reserve (co-sponsored by WBNERR) - Field sampling techniques for lake groups. May 6. Southwick MA. - Data Presentation. June 3, Sudbury MA. With Anna Hicks, UMass Extension NREC. - Watershed survey and weed mapping. June 10 Fort Meadow Reservoir, Hudson MA. - Macroinvertebrate and habitat sampling. June 17, Williamstown MA. * these workshops were part of an ongoing project with MA DEP to provide assistance in writing QAPPs. One other way we assisted Monitoring Support Centers was to maintain a listserve of approximately 100 individuals (which includes volunteer monitors, agency representatives and service providers), and use this listserv to communicate with the volunteer monitoring community and get their feedback and questions. We also continued the 1999 survey of monitoring groups. We conducted a March 3 mailing to volunteer monitoring groups asking for updated information on their program activities. Using the responses and information collected at workshops, we added numerous entries to a slightly modified version of the 1999 MS-Access group profile database. The database, which had approximately 30 group entries last year, now lists approximately 80 groups conducting 150 surveys. We are currently writing a brief user's guide to the database; when complete, we will mail the guide to EOEA and make both the database and the guide available to other MSCs for their use in tracking group activities. We are willing to serve as the main repository for data on group activities, until such time as a new data management system is developed. Thus, when we distribute the Access database, we will ask all MSCs to distribute a related

questionnaire to any groups they are working with, and to forward any responses to MassWWP for entry into the database. Promote presentations of Technical Support Centers with Geographic Centers and individual monitoring groups. We created a web page that lists services, area of activity, upcoming events, and contact information of the MSCs, and added it to the WWP web site: http://www.umass.edu/tei/mwwp/msc.html. We have had frequent phone, email and in-person contact (usually at workshops or conferences) in which we answered questions or distributed information about the services of the UMass Environmental Analytical Laboratory and to a lesser extent NREC's macroinvertebrate workshops. We printed a brochure "Did you know?" presenting the concept of the MSC network and showcasing each MSC , their services and how to contact them. The brochure was mailed to 106 people (who don't have email) on 5/16. Task 2: Coordinate Activities of the Volunteer Monitoring Citizen Advisory Committee Continue to serve as administrator/Executive Director of the Volunteer Monitoring Citizen Advisory Committee (CAC). A minimum of three meetings of the CAC are required under this task as well as ongoing communication and distribution of information. A minimum of two presentations to the WISC on CAC findings for the purpose of developing consensus are required. We convened three meetings of the CAC: April 3, May 9 and June 14. Meeting notes for the meetings were disseminated electronically, and a paper copy mailed to one CAC member without Internet access. We made presentations about the CAC to the WISC at its March 15 and May 17 meetings. A summary of the River Network report was distributed at the May 17 meeting. WISC has scheduled a longer discussion of the report and CAC recommendations regarding the report for an upcoming meeting. The major work of the CAC this fiscal year (FY 2000) involved reviewing, discussing, modifying and adopting the recommendations of the River Network's report on volunteer monitoring. This was done at CAC meetings and by using phone and email to communicate CAC member comments. In fiscal year 2001, the CAC's work will shift to more in-depth analysis of several of the recommendations, as we endeavor to implement them. This will require more active participation by CAC members than we received this year. Attendance at CAC meetings was low – apart from MSC representatives, few people showed up. See file cacattendance2000.doc. In particular, key players from some state agencies and from volunteer monitoring programs were largely or entirely absent. It might be wise for the CAC to tackle, as a first priority, the River Network's recommendations on committee structure. The current committee structure, with a core of approximately 15 members and a broader committee of approximately 12 more, hasn't worked particularly well. The core committee may be too large, some ‘broader' committee members attend more than some core members, and other members, core or broad, don't attend at all. We might want to consider either: 1. reducing the core committee size, to 7-10 members. Committee might obtain general guidance from an annual or semi-annual Citizen's Advisory Congress; 2. have the large committee meet regularly, but spend the bulk of its meetings in breakout committees, who are each tasked to work on a particular topic or set of recommendations (e.g. on funding, or on developing standards for monitoring procedures, etc.) We welcome further discussion with EOEA on this issue. Task 3: Provide services statewide to foster the implementation of high quality citizen monitoring efforts. a. Publicize existence of training manuals, fact sheets, and training videos to volunteer monitoring groups statewide. We do this primarily through our web site ( http://www.umass.edu/tei/mwwp/). We also distribute such information and materials at workshops and other events we attend. b. Distribute one copy of each manual, fact sheet, training video, and similar materials at no cost to Support Service Centers and EOEA in a sample binder for their review and re-distribution. The following materials were sent to John Clarkeson and all the MSCs: 1. Mass WWP Lake Field Sampling Manual 2. Mass WWP Manual for Volunteer Water Quality Monitors 3. Mass WWP Watershed Survey Manual for Lakes and Rivers 4. Mass WWP Data Interpretation Manual 5. Mass WWP Data Management Manual for Volunteer Monitors 6. Mass WWP Data Presentation Manual: Ready, Set, Present 7. Fact Sheets 1. MWWP High pH 2. MWWP Chloride 3. MWWP Nitrogen 4. MWWP Total Phosphorus Videos 1. MWWP Lake Sampling Techniques 2. MWWP Lab Analysis Training c. Include Support Service Centers and EOEA on The Volunteer
Monitor Newsletter distribution list. In response to John Clarkeson's request, we have forwarded the addresses of all Watershed Team Leaders and four EOEA staff members (John Clarkeson, Robert O'Connor, Sharon McGregor, and Karl Honkonen) to the editor of the Volunteer Monitor with a request that they be placed on the mailing list. d. In accordance with current MWWP policy, continue distribution of training materials (see Task 3b above) to Massachusetts monitoring groups in response to their requests. We honored approximately 30 requests for equipment & materials loans, including items such as macroinvertebrate and chemical sampling equipment, the MassWWP bugquarium, and training manuals. The accompanying file helpfy2000.wpd lists assistance requests and how we handled them. In addition, we passed out 222 copies of our data presentation manual (including 50 at the national volunteer monitoring conference in Austin Texas), and continue to distribute copies of The Volunteer Monitor newsletter (several issues) at workshops, along with other materials such as the EPA's "Volunteer Stream Monitoring – A Methods Manual", MassWWP fact sheets, portions of our draft QAPP guidance document, and similar documents. e. Promote training sessions offered by a Support Service Center (open to participation by monitoring groups statewide), including a web link through the MassWWP Internet page. We have established the MSC web link, and have asked MSCs to send us calendar information, which we post on the MassWWP calendar (http://www.umass.edu/tei/mwwp/workshop.html), along with information we receive from other service providers. We also promote training sessions via listserv announcements. In June we added an "upcoming events" bullet for each MSC on the web page to reduce search time for web users. f. Assist Support Service Centers by developing for them and distributing to them an on-line workshop registration computer program. An on-line registration form for events was developed (see it at ) and was offered to the other MSCs. To date, no MSC has requested the form. g. Serve as a communications clearinghouse for volunteers through a web page and Internet list serve. Clearly identify EOEA as a partial sponsor of these services. We are providing these services. Web page services resources must include: listing of the QAPP library contents developed for the DEP/EPA QAPP contract (98-05/104); upon completion and DEP/EPA approval of QAPP templates these should be posted; upon completion and DEP/EPA approval of template guidance this should be posted; The MassWWP web page and listserv currently serve these functions. EOEA is listed as a sponsor on our web pages and on the listserv page on our web site: . QAPP materials will be presented on the web site when they are completed and approved by DEP. With regards to posting existing QAPPs written by volunteer monitors on the web, we received this email from Art Johnson of DEP on March 16: "After discussing this with several other staff members here, we feel that it would be premature and inappropriate to make the library available through the internet at this time. Let me try to explain further our concerns. First, from the existing listing it is not easy for us to tell what these are, or what is contained in them, so we cannot comment on the appropriateness of using many of them as models (if that is the intent). Perhaps if the QAPP were identified by the name of the preparer, rather than the waterbody or watershed, it would be clearer as to what particular QAPP is available in the library. Nonetheless, It would seem to me that it will be much more important to make the QAPP templates that are being developed as Task 2 of this project available through the internet. Then, at the same time, a few carefully selected model QAPP chosen from the library could be included as examples. Right now, I am concerned that end-users will mistake this library for the actual QAPP templates that are still in development. It is important to recognize that the current library contains many QAPP written for many different purposes, using guidelines that may differ significantly from those we are requiring today (e.g., EPA, 1996, etc.). For example, our own "DEP-Millers Watershed QAPP" from 1995 is still considered "Draft", and would not meet our present-day internal requirements for a QAPP. DEP, EPA, and EOEA continue to maintain that citizen groups must establish their individual missions, and goals and objectives for monitoring that will provide information for local decision-making. If desired by these groups, the data may be submitted to agencies responsible for preparing such Clean Water Act "deliverables" as the 305(b) report, 303(d) List, etc. Many of the QAPP in the library were developed to respond to specific data needs directed at answering specific questions as defined by those preparing the QAPP. Whether the
needs directed at answering specific questions as defined by those preparing the QAPP. Whether the data could be used for 305(b) assessment is secondary, and probably cannot be determined without reviewing each individual QAPP. As an example, the QAPP entitled "DEP Lake Study" (1999) was designed first and foremost to provide data for the derivation of Total Maximum Daily Loads (TMDL) for lakes on the 303(d) List. Reference to the term "Baseline Lake Survey" in the title in all likelihood, means different things to different people. The fact that there is interest and demand for the availability of the library through the internet suggests to me that we need to be very clear with respect to what it is we are posting, and for what purpose. Groups that are interested in preparing QAPP should continue to be directed to the Volunteer Monitor's QAPP Guidance (1996), supplemented by other guidance, as needed. The templates that are still in development will supplement, but not replace existing guidance. In summary, the Scope of Services for this contract does indeed call for the compilation of a library of QAPP, SOP, and related reports that will be distributed to interested monitoring groups; and it does make sense to ultimately make materials available through the internet. We simply don't believe that the appropriate documents are available yet, and that the library as it presently exists, could lead to more confusion than anything. Thank you for the opportunity to comment." Until further discussion with and approval from DEP, we will hold off on posting sample QAPPs on our web site. h. Serve as a referral center for those groups who have a Service Support Center. Provide ongoing service by phone, e-mail, and in-person to groups engaged in volunteer monitoring not supported by Service Support Centers. We do these services as part of our general assistance for groups who call, write or email requesting help; also via handouts, announcements and discussions at workshops. The file helpfy2000.wpd documents many of our contacts with groups seeking assistance. In addition to the above, we advised WBNERR on a project they are working on: developing a guidance document describing standard operating procedures for monitoring several water quality parameters common to coastal groups. We served on a panel that reviewed drafts of the document, now currently in a second editing phase. Task 4: Capacity Building for Volunteer Monitoring Organizations: In anticipation of a volunteer monitoring conference in the fall of 2000, MWWP shall prepare training workshop sessions for volunteer monitoring groups on developing sustainable fundraising skills, seeking 501(c)(3) status, effective public relations (i.e. data presentation, press relations, working with municipal boards), and other topics as requested by volunteer monitoring groups. Planning in progress. We have contacted 2 or 3 potential conference speakers, and will continue to confer with the CAC, MSCs and the WISC regarding conference objectives and content. We have sent messages through our listserv and to other groups through email to propose a date and to solicit topic suggestions. So far the best date looks like Saturday November 4th and topics include non-science subjects such as fundraising and how to establish 501(C) (3) status, and technical topics such as writing a QAPP and Understanding Pathogens. Task 5: Technical Skills Development for Volunteer Monitoring: 1. Assist the EOEA Geographic Support Centers in QAPP training in the Buzzards Bay, Islands, Ipswich, Shawsheen, and Deerfield watersheds. We are currently working with WBNERR and MRWC to provide followup assistance to workshop attendees on an individual basis. WBNERR's volunteer monitoring coordinator left to take an out-of-state job, so efforts in that area are slowed until the replacement begins work in early September. We have provided QAPP review / writing assistance to approximately 8 groups. We advised WBNERR on how to find a replacement for their departed WQ monitoring coordinator, posted the job announcement on our listserv, and served on a panel that interviewed applicants for the job. We participated in a data interpretation /study design session for the Ipswich River Watershed Association on March 8, and handed out several copies of our data presentation manual at that time. We have assisted DRWA in writing a QAPP for their volunteer monitoring program. 2. Identify a recommended Geographic Support Center Tool Kit of equipment that could be provided by support centers to volunteer monitoring groups on a lending basis. Include specific items and estimated costs of developing such a tool kit. A toolkit list was prepared and sent to the MSCs for their input. To date, we have only received a response from the Merrimack River Watershed Council. Estimated costs not included yet. We would like to take this issue up again with the MSCs in FY 2001. At present, this is just a list
recommended by MassWWP. We would like more feedback from MSCs, agencies, and others on how the list might be modified. It might then be useful for each MSC to compare this list with their own inventory, and either obtain additional material so they will have a complete set of "tools" on hand for loans, or identify and keep a list of where these things might be available in each region: e.g. if an MSC knows EPA loans a GPS or USGS a flow meter, keep this information on file and advertise it to groups, to complement loans of equipment that each MSC owns. MassWWP/WRRC staff attended the national water quality monitoring and the national volunteer monitoring conferences in Austin Texas, April 21 – 29. We presented or moderated at 5 sessions. Topics included data presentation, service providers, and quality assurance project plans. Highlights of the conference included sessions where we learned more about STORET / volunteer data interfaces and made contacts with EPA and our partners in NERMC, to explore possible collaboration with EPA on developing a system for use by NE volunteer groups. Projects Two and Three: Regional Support to Volunteer Monitoring Groups in the Deerfield, Westfield, Connecticut, Hudson, Housatonic, and Farmington Watersheds 1. Provide ongoing service by phone, e-mail, and in-person to volunteer monitoring groups on all aspects of volunteer monitoring. 2. Publicize existence of training manuals, fact sheets, and training videos to volunteer monitoring groups statewide. 3. Distribute manuals, fact sheets, training videos, The Volunteer Monitor Newsletter and similar materials at no cost to volunteer monitoring groups in response to their requests. 4. Assist in QAPP development 5. A minimum of 6 site visits to monitoring groups to provide technical and/or organizational assistance is required by this Project. An initial written survey of needs may be taken to prioritize training topics. On March 7 we mailed a letter to 30 organizations, outlining a proposed range of assistance to Western Massachusetts groups under this contract, and asking them to respond with their priority needs. Based on the responses, the following assistance has been provided: 1. April 12. Conducted a site visit of Bray Lake on Mt. Tom Reservation, with Karen Simon, Mt. Tom Citizen's advisory Committee. Provided advice on organization and study design for a monitoring program. Followed up with additional email advice. 2. May 6 lake sampling workshop at Lake Congamond. Attended by 8 representatives of 4 lake groups. 3. May 7 site visit on Green River, Williamstown, to help select sites for HooRWA macroinvertebrate sampling program. 4. Assistance to Deerfield River Watershed Association: moderated water quality and spills sessions at DRWA forum March 18; Led training session for sampling volunteers; session attended by Watershed Team Leader and Science teacher from Academy at Charlemont and a dozen volunteers. wrote a QAPP for DRWA's monitoring program in March; trained volunteer monitors April 8, 9, and 12; provided lab assistance April 6, April 11, April 16, May 25, June 16; Site visit with Team May 4 to South River. Attended several Deerfield River Team Monitoring Subcommittee meetings in Greenfield. Assisted in ordering bacteria analytical supplies. Provided some lab supplies. Loaned GPS unit for sampling site positioning and led a site tour. 5. June 13 site visit to Pittsfield MA for work session to assist Onota Lake association and Berkshire Regional Planning Commission in developing QAPPs. 6. June 17 site visit to Williamstown MA to offer training in macroinvertebrate and habitat sampling for HooRWA and Williams College volunteers. An additional training is scheduled for July. 7. Attended Connecticut River Team Meeting, June 20.
Articles in Refereed Scientific Journals
Book Chapters
Dissertations
Water Resources Research Institute Reports
Conference Proceedings
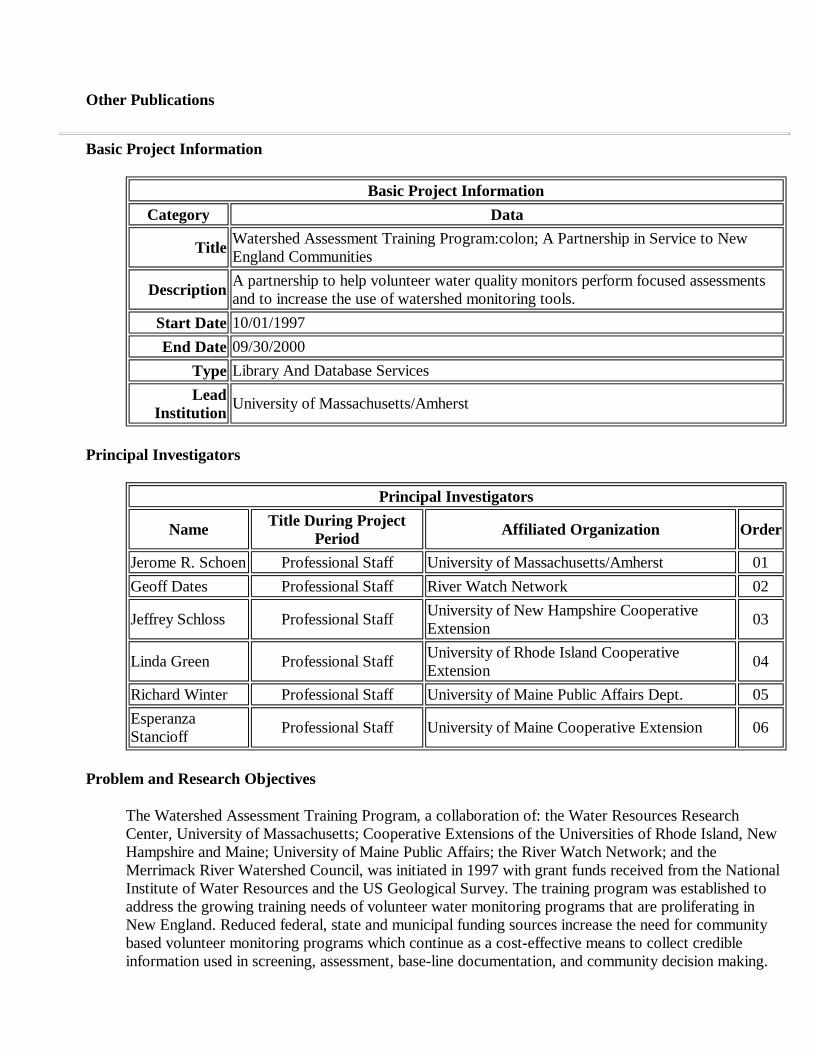
Other Publications
Basic Project Information
Principal Investigators
Problem and Research Objectives
The Watershed Assessment Training Program, a collaboration of: the Water Resources Research Center, University of Massachusetts; Cooperative Extensions of the Universities of Rhode Island, New Hampshire and Maine; University of Maine Public Affairs; the River Watch Network; and the Merrimack River Watershed Council, was initiated in 1997 with grant funds received from the National Institute of Water Resources and the US Geological Survey. The training program was established to address the growing training needs of volunteer water monitoring programs that are proliferating in New England. Reduced federal, state and municipal funding sources increase the need for community based volunteer monitoring programs which continue as a cost-effective means to collect credible information used in screening, assessment, base-line documentation, and community decision making.
Basic Project InformationCategory Data
Title Watershed Assessment Training Program:colon; A Partnership in Service to New England Communities
Description A partnership to help volunteer water quality monitors perform focused assessments and to increase the use of watershed monitoring tools.
Start Date 10/01/1997End Date 09/30/2000
Type Library And Database ServicesLead
Institution University of Massachusetts/Amherst
Principal Investigators
Name Title During Project Period Affiliated Organization Order
Jerome R. Schoen Professional Staff University of Massachusetts/Amherst 01Geoff Dates Professional Staff River Watch Network 02
Jeffrey Schloss Professional Staff University of New Hampshire Cooperative Extension 03
Linda Green Professional Staff University of Rhode Island Cooperative Extension 04
Richard Winter Professional Staff University of Maine Public Affairs Dept. 05Esperanza Stancioff Professional Staff University of Maine Cooperative Extension 06
Many volunteer programs have mastered basic sampling techniques and are now at the stage where they require assistance to go the next step. They are requesting guidance on how to expand their monitoring to tackle nonpoint source pollution at the source and how to better integrate their programs to address community concerns in the context of a watershed approach.
Project collaborators (collectively named the New England Regional Monitoring Collaborative, or NERMC) sought to help volunteer groups perform focused assessments that produce credible information relevant to important regional environmental problems; and to increase the use of relatively low cost and user-friendly watershed monitoring tools throughout New England by making training and related services more accessible.
Methodology
1) Produce a set of written and videotaped training materials for several different watershed assessment methods designed for New England volunteer environmental monitoring groups. The surveys are: * Macroinvertebrate sampling for river systems. * Habitat assessment for river systems. * "Following the Flow": a non-point source pollution site assessment method that uses an "expert system" approach to allow observers to determine the actual or potential extent of pollution generation and delivery from a site to a receiving water of some kind be it a wetland, lake, river stream shoreland or estuary. * Watershed Natural Resource Inventory Method: an extension of a currently used Community Natural Resource Inventory Guide which focuses more in-depth on the water resources aspects and bases the inventory unit on a watershed level. * An introductory videotape will describe the methods, to assist viewers in determining the types of surveys suitable for their programs.
2) Set up a delivery system to provide these materials and relevant training to groups throughout the region. This includes conducting a series of workshops that cover topics discussed in the videos and manuals.
3) Initiate a communications system and planning process among service organizations to provide comprehensive cost-effective assistance on an on-going basis to citizen monitoring programs.
Instructional materials and workshops were or will be developed with a focus on a "training the trainers" approach. The target audience includes program leaders, educators, and others who are or will themselves become trainers of volunteer watershed monitors.
Principal Findings and Significance
Training materials Written training materials in the form of manuals and protocols have been created and/or revised for this project. These include: * "Following the Flow" assessment manual and trainers packet materials have been completed These will be used at upcoming Watershed Academy, August 16 – 21, 1999. * Added material to final draft of Watershed Natural Resource Inventory guide – to be completed and produced by September GWPCC workshop * Benthic invertebrate and habitat assessment training materials have been completed.
Videos The Watershed Resource Inventory video will now be incorporated into the introductory video, which introduces the full NERMC video series. After some consideration, it was deemed inappropriate as a separate video, because it would contain too many static shots to suit the video format. Most of the filming has been completed for this video, but editing tasks remain.
The benthic macroinvertebrate training video is now complete. It is 24 minutes long and contains detailed explanations of how to carry out river and stream benthic monitoring, in step-by-step demonstrations. It shows both streamside and intensive sampling and analysis procedures.
The second video, Following the Flow, is nearing completion and will be ready for distribution by the third week in August. It is 17 minutes long, and also contains detailed advice and demonstrations not available on video before, on methods of tracking the flow of non-point source pollutants from a site to a water resource.
Filming on the habitat assessment video is nearly complete. Some shots which require specific climate conditions remain to be filmed. Some editing is will then be required to complete the video.
Three of the NERMC partners (UMaine Public Affairs, UNH Extension, and River Watch Network) spearheaded development of these videos. Additional assistance and participation was received from several students at UNH, from the Houlton Band of Maliseet Indians, several faculty members in biological sciences at the University of Maine, and from the North American Benthological Society.
Completion of all videos is not expected until fall of 1999. For this reason, a no-cost extension of the project is being requested. See attached letter.
Workshops, delivery system
NERMC partners have compiled lists of potential NERMC trainers, who receive invitations to NERMC workshops via mail, and email. Workshop schedules are also posted on the NERMC web site. Mailings include a NERMC fact sheet describing the project and a survey. The survey continues the program assessment completed in 1998 by asking potential trainers which workshops they are interested in attending, but are unable and why. It also asks what other types of training are wanted. Results indicate that the current set of workshops have broad appeal, but that summer is simply too busy a period for many people. Workshop schedules were revised to accommodate these preferences. Workshops conducted:
* NERMC introductory workshops were presented at the Volunteer Environmental Monitoring Conference, November 14, 1998 and at the New England Association of Environmental Biologists meeting in Ascutney VT March 10-12, 1999. Objective of workshops was to inform audiences of NERMC services available and to receive feedback on our plans for NERMC operations in the coming year. * A ½ day Following the Flow workshop was conducted in northern New England (Bonnyvale Environmental Education Center, Brattleboro VT; May 7, 1999) as part of a Project Wet facilitator training conference. * Streamside Benthic Macroinvertebrate workshop was presented at the Annual New England Lakes conference (sponsored by NE chapter of North American Lakes Management Society) held in Auburn Maine (June 19 –20, 1999).
Upcoming NERMC workshops (to be conducted within the grant period): * Streamside Benthic Assessment, South Kingstown, Rhode Island, August 14, 1999.
* NERMC is a co-sponsor of the "Watershed Academy- Working at a Watershed Level" 5 day workshop sponsored primarily by the USEPA and the Council of State Governments, August 15 - 21 in Durham NH. Presentations by NERMC cooperators will include: Watershed Assessment Approaches, A Following the Flow demonstration/field trip, and an Introduction to Watershed Natural Resources

Inventory Applications. Additionally, a NERMC Following the Flow trainers workshop will be conducted at this event August 20-21.
* Watershed Resource Inventory Approaches and Applications, September 21, 1999, Newport Rhode Island. This ½ day workshop will be held in conjunction with the Ground Water Protection Council's (GWPC) annual forum in Newport, Rhode Island September 19 - 22, 1999.
Planned for Spring 2000 (to be conducted after this grant period). * Intensive macroinvertebrate sampling and habitat assessment. Spring conditions are needed for the habitat workshop, and the intensive macroinvertebrate workshop requires participants to attend for 4 days. Earlier attempts to recruit participants for a commitment of this nature met with indifferent success, so NERMC partners will work on logistical planning and participant recruitment over the fall and winter of 1999 - 2000.
3) Communication system, planning process
A NERMC Web site has been developed: . It describes the NERMC project, the watershed assessment tools developed by NERMC partners, and lists scheduled workshops.
NERMC partners post NERMC information on their Web sites, as well, and use their own meetings and workshops as a means to distribute NERMC surveys, materials and workshop announcements. NERMC partners continue to meet and conduct monthly conference calls. Several new partners have joined these discussions, including representatives of UMass Extension and the USEPA. In early 1999, a grant application to the USEPA was approved, for $25,000, to continue long-range planning and service development. This will allow additional workshops to be produced in 2000, and to incorporate new tools and services into the NERMC repertoire. Under consideration (pending additional funding, which NERMC partners are pursuing):
- A macroinvertebrate monitoring protocol for wetlands, which has been developed by Anna Hicks of UMass Extension. This is being further tested and modified with support from Massachusetts Coastal Zone Management. NERMC plans to assist in adapting training materials for this tool, so that the format will be compatible with NERMC materials. In addition, we are exploring the possibility of producing a video and additional workshops on the topic.
- Guidance manuals and related workshops on writing Quality Assurance Project Plans, currently being developed by the UMass Water Resources Research Center, with support by the MA Department of Environmental Protection. NERMC may produce additional workshops outside of Massachusetts.
- A NPS Pollution in NE Watersheds video, adapted from UNH's FTF training slide set.
- A CD-ROM Demo of UNH's Watershed Natural Resources Inventory using GIS technology.
- A "Neighborhood Survey FTF Method" video, which would complement the NERMC FTF video now in production.
- A guidance manual and training workshops on Data Management, Interpretation and Reporting expanding upon materials prepared by RWN, UNH CE and UMaine CE for coastal monitoring groups.
In addition, NERMC assessment tools have been cited by the Massachusetts Executive Office of Environmental Affairs (EOEA) in its guidance to volunteer monitoring groups and Regional Service

Providers (RSPs) in a new program of support for volunteer monitoring, initiated in MA FY 1999. Grant programs for volunteer monitors and RSPs totaling $250,000 were approved in FY 1999, and an additional $300,000 is anticipated in FY 2000. The new RSP network encourages use of NERMC methods. Several NERMC partners (MassWWP, RWN, and MRWC) worked closely with EOEA to develop the current support system.
Articles in Refereed Scientific Journals
Book Chapters
Dissertations
Water Resources Research Institute Reports
Conference Proceedings
Schloss, J. 1999. "Applications of a Watershed Natural Resources Inventory in a Multi- jurisdictional Watershed" in NOAA publication: Proceedings of the Tijuana River Watershed Workshop. May 1999.
Other Publications
Schloss, J. and A. Ammann, 1999, "Following the Flow" Training Guide,UNH Cooperative Extension Publication, Durham, NH. Schloss, J., 1998, GIS Applications for Lake Management (Overview of Watershed Natural Resource Inventory Method) in Our New England Waters: Watershed Stewardship for the Next Millenium. June 26-28 1998 University of New Hampshire, Durham, NH. UNH Cooperative Extension. p 10. Schloss, J., 1999, GWPC conference in Newport RI- "Developing and Implementing a Watershed Natural Resources Inventory Sept 1999.
Basic Project Information
Principal Investigators
Problem and Research Objectives
Basic Project InformationCategory Data
Title Regional Service Provider NetworkDescription Support for water quality monitoring groups in western MassachusettsStart Date 07/01/1999End Date 06/01/2001
Type Library And Database ServicesLead Institution University of Massachusetts/Amherst
Principal InvestigatorsName Title During Project Period Affiliated Organization Order
Jerome R. Schoen Professional Staff University of Massachusetts/Amherst 01
- To advance the development of a regional service provider (RSP) network for Massachusetts volunteer monitors. - To help monitoring groups incorporate three critical elements into their programs: written study designs, annual program reviews, and (as needed), written Quality Assurance Project Plans. - To facilitate increased communication and collaboration among individual volunteer monitoring programs within a watershed. - To facilitate collaborations between volunteer monitoring groups and their associated EOEA-sponsored Watershed Teams, which are also planning and conducting watershed studies. These collaborations will help ensure a strong integration of volunteer surveys into decision making that occurs under the Massachusetts Watershed Initiative. As proposed in our grant application, we selected four watersheds to focus on in developing the products and communication networks important to achieving project objectives. The watersheds selected are the Deerfield and Housatonic (MassWWP), Suasco (MRWC), and Islands (Martha's Vineyard and Nantucket, selected by WBNERR). In addition, we continue to provide a variety of services that benefit groups from other watersheds in the state.
Methodology
Principal Findings and Significance
Develop a unified training / assistance program: We have compiled a list of manuals, fact sheets, and related guidance materials for monitoring programs. These have been posted on the MassWWP web site (http://www.umass.edu/tei/mwwp/). These include protocols developed or supported by MassWWP, along with some others, such as the Riverways program's shoreline survey or EPA's macroinvertebrate monitoring manual. Most of these contain full instructions in downloadable format; we are in the process of adding the others. In addition to instructions on sampling procedures, these materials include guidance on several aspects of volunteer monitoring, such as data interpretation and data presentation. We are currently working with several organizations and agencies to have these protocols and guidance documents undergo a thorough review to ensure that they meet the needs of the Massachusetts Watershed Initiative (MWI). We will use the Volunteer Monitoring Citizen's Advisory Committee (CAC) as the forum for this process. The CAC was established by the Executive Office of Environmental Affairs (EOEA) in 1999 as part of the MWI. Members include several agencies, academics, monitoring group representatives, and the Monitoring Service Centers (MSCs - formerly known as the Regional Service Providers) contracted by EOEA to support volunteer monitoring groups. MassWWP protocols are also undergoing review by the Department of Environmental Protection and the US EPA as part of a related project to provide assistance to volunteer groups in writing Quality Assurance Project Plans (QAPPs). In addition, WBNERR has begun drafting a set of standard operating procedures for tests commonly performed by coastal groups. This effort grew out of a series of meetings held on the Cape regarding volunteer monitoring, and has been endorsed by several groups and agencies. MassWWP will participate in the review of the guidance documents. These will also be reviewed by the CAC. We are coordinating communication among all parties to avoid duplication of effort. We anticipate that the review process may take some time, given the size and diverse makeup of the CAC and conflicting demands on committee members' time. In the interim, however, these guidance documents are being shared among the MSCs and with EOEA Watershed Teams, are widely used by Massachusetts monitoring groups, and serve as de facto standard methods. MassWWP has developed a web-based calendar containing information on workshops and conferences of interest to Massachusetts volunteer monitoring groups. The calendar can be found on the MassWWP web site. We are soliciting entries from all MSCs, agencies, and others who sponsor such events. Conduct training programs in each of 3 regions: Northeast, Southeast, and Western Massachusetts. Workshops held to date include: MassWWP: Field sampling methods for new lake groups: one in April,
one in May 1999; lab analysis techniques, May 1999; aquatic plant and watershed mapping techniques, one in June and one in July 1999; data management, October 1999; data interpretation, November 1999; How to start a monitoring program, January 2000; writing a QAPP, February 2000; Data presentation March 2000 (co-sponsored by WBNERR). MRWC: Several shoreline survey training sessions in July and August, 1999; Water quality monitoring methods, one in July and one in August 1999; Benthic Macroinvertebrate Streamside Rapid Assessment Training, September 1999; Study Designs and QAPPs – a 2 part workshop in January 2000. WBNERR: An informal information exchange event among local monitoring groups; an interactive workshop to educate volunteers about basic biology and ecology concepts; a Submerged Aquatic Vegetation Monitoring workshop; a QAPP writing workshop, February 2000; and a data presentation workshop March 2000. All project partners collaborated on the QAPP workshop series; we are currently engaged in followup consultations with groups to assist them applying their training to write QAPPs for their programs. Approximately 30 groups are involved in this project. Support development of a service infrastructure for volunteer monitors. On a statewide level, all three project partners have been active in the Volunteer Monitoring Program Development Process initiated by EOEA in spring of 1999, and which continues today. As part of this process, MassWWP recommended that the Regional Service Provider network begun in 1999 be expanded both geographically and in program scope, to include providers with specialized expertise that might be useful on a broader regional or even statewide level. EOEA adopted these recommendations for fiscal year 2000. As a result, two new Technical Service Centers were added: The UMass Environmental Analysis Lab (EAL) to provide lab analyses, quality control assistance and related training for groups across the state (and with an added focus on western Massachusetts); and the Natural Resources and Environmental Conservation (NREC) program of UMass Extension. NREC is providing training and related assistance in the area of biological monitoring. Otherwise, last year's RSPs were retained by EOEA for this year (MRWC, WBNERR, the Charles River Watershed Association and the Urban Harbors Institute of UMass Boston). MassWWP was also designated as the Monitoring Service Center for groups west of the Connecticut River. We developed informal surveys for both monitoring groups and laboratories, to gauge the need and the ability to fill the need for various kinds of lab analyses. This has been given to all the MSCs, to then deliver via phone or personal interview with groups and laboratories. It is anticipated that this will take some time to complete, because the process is time-consuming. So we agreed to concentrate on the monitoring groups first, especially in areas where historically the need has been greatest. We will then contact laboratories in those areas, and eventually move on to new areas to complete the survey. MassWWP assisted both the UMass Environmental Analytical Lab and the NREC program to apply for the EOEA grants they eventually received; both are now providing specialized assistance to monitoring groups. MRWC has assisted groups in the Merrimack and Shawsheen watersheds to secure analysis services from the State Water Analysis Lab in Lawrence, and has secured services from the Andover and Tewksbury wastewater treatment plants for coliform analysis for groups in these watersheds. WBNERR included $4000 in their current contract with EOEA for analyses to be performed by the Cape Cod National Seashore for volunteer groups; in addition, WBNERR continues to broker arrangements between monitoring groups and lab service providers such as UMass Dartmouth. All three organizations are active in promoting inter-group collaboration and partnerships between EOEA Watershed Team Leaders and volunteer monitoring groups. MRWC staff meets regularly with both the Suasco and Merrimack/Shawsheen watershed teams; WBNERR meets with the Cape and Islands teams; and WWP staff meets with the Deerfield team, and is a member of the Deerfield's subcommittee on monitoring. This subcommittee is at work integrating the efforts of DEP, EPA, Department of Environmental Management, the Deerfield Watershed Association, and Ashfield Lake Association. MassWWP has submitted a proposal to EOEA for a project to oversee a monitoring project in the watershed that would expand and further integrate these efforts. MRWC has drafted a set of guidelines for operating a watershed-wide Technical Advisory Committee that would assist multiple groups in a watershed to run effective monitoring programs that coordinate with one another. This concept is being tested in the
effective monitoring programs that coordinate with one another. This concept is being tested in the above-mentioned watersheds. MassWWP and MRWC helped to plan and facilitate a Suasco Water Monitoring Forum which took place in March 2000. Some 30 individuals representing over a dozen monitoring groups and related agencies and organizations participated; they agreed to pursue the collaboration further, with watershed-wide data interpretation sessions in the fall, among other steps. WBNERR, in collaboration with Coastal Zone Management (CZM) and the Community Foundation of Cape Cod, organized and held a Citizens' Monitoring Forum in June 1999. The goals of the Forum were to: get input from the community about what services citizen groups need (ultimately to find gaps in services provided and to find out what is and is not working for the groups); get buy-in and ownership for a Cape and Islands-wide network from the local groups and service providers; inform groups of the potential use of their data; validate (or not) the concept of a network. MassWWP assisted at this forum by facilitating one of the forum's breakout sessions. One recommendation that came out of the forum was to consolidate the various monitoring methods now in use, into a practical set of approved monitoring options. As mentioned above, WBNERR is now drafting these standard operating procedures for volunteer coastal monitoring, with input from MassWWP, CZM and others. MassWWP has developed a computer database that contains information on groups who are monitoring, type of studies they are conducting, whether or not they have written study designs or QAPPs, and whether the QAPPs have received EPA or DEP approval. This database is being shared with EOEA and MSCs, to use when groups are surveyed as to their existing and planned monitoring activities. MassWWP will maintain the database. MassWWP has begun to assist the western chapter of the Lakes and Ponds Association – West (LAPA West) to put together a care package for lake groups in the Housatonic, Hoosic, Deerfield, Westfield and Connecticut watersheds that are trying to form new lake and pond associations. MassWWP will help on monitoring issues, with a special focus on facilitating inter-group collaboration. This is an outgrowth of several of the workshops that were held in the spring of 1999. We have been offering study design assistance to several of the individual lake groups in the region as well as the Housatonic Valley Association, and encouraged them to work together on their study designs. These initial groups are serving as the model for an integrated region-wide monitoring effort. Challenges ahead: In our fiscal year 2000 grant application, we proposed to "work with EOEA and the MA DEP to develop generic plans for studies that integrate volunteer and agency monitoring within the 5-year cycle" that EOEA uses to schedule its activities in each basin, as part of the Watershed Initiative. We have been informed by DEP that they cannot spare the staff time to devote to such a planning effort. We have therefore shifted our plans, to focus on the Watershed Team Leaders as the primary agency contact in each basin. It is our hope that successful collaborations in individual basins will provide a foundation on which to build a statewide system that is accepted at all levels within all the EOEA agencies. We will also work with the volunteer monitoring CAC to secure their input on how best to proceed in advancing multi-year agency/volunteer monitoring partnerships. The ability of both the CAC and the MSCs to conduct their activities on a regular schedule is hampered by interruptions in funding from EOEA for volunteer monitoring. This year as last, contracts were not tendered to the MSCs until approximately 8 months into the fiscal year. As a result, the CAC has not yet evolved into a proactive working group – its function so far has been to review documents and participate in discussions at the 3 or 4 meetings held each spring, during the active contract periods. We will endeavor to keep the CAC functioning this year throughout the year. We have expressed these concerns to EOEA and have been assured that they will make every effort to avoid lengthy service disruptions in FY 2001. We intend to organize the CAC into subcommittees that follow through with more earnest investigations of important issues. Three issues that we will attempt to get the CAC to focus on this coming year are the uniform assistance program, advising on watershed team / volunteer partnerships, and developing a set of recommendations to EOEA for a statewide data reporting system. Followup assistance to groups who have taken our workshops continues to be a time consuming process – particularly for those who are writing QAPPs. We have found that groups do not enjoy this technical exercise, and therefore tend to place it "on the back burner". We have to keep reminding and encouraging them to follow through. The
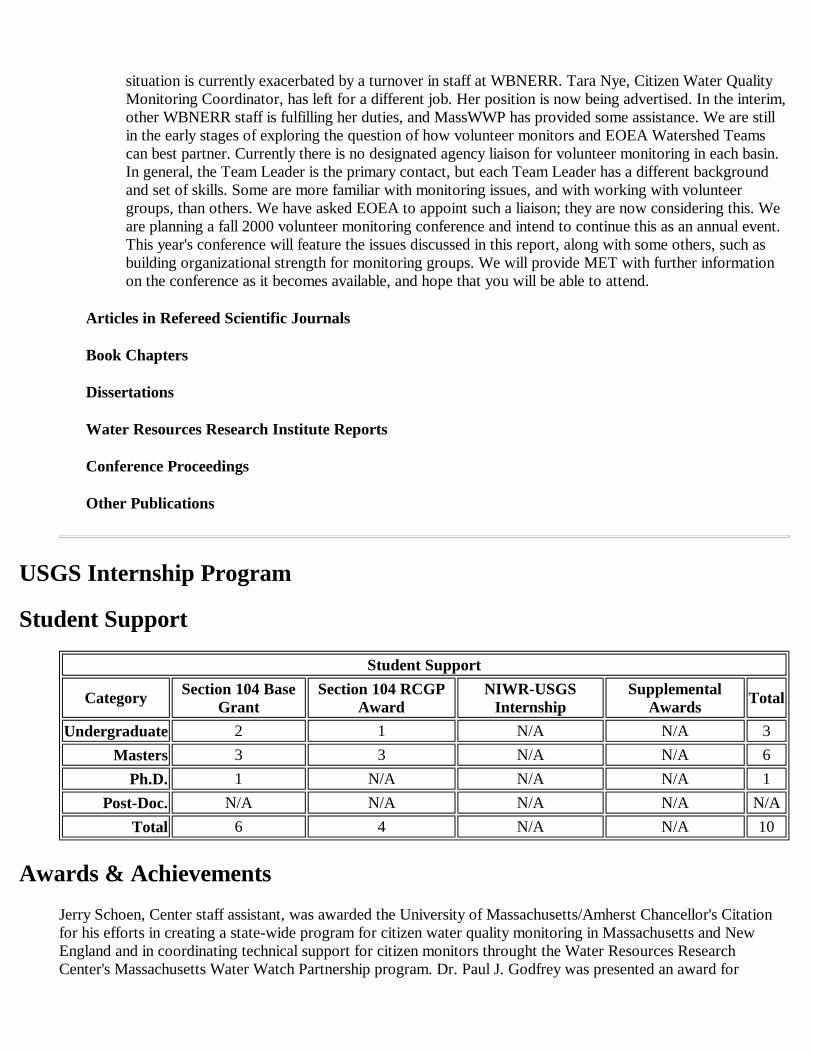
USGS Internship Program
Student Support
Awards & Achievements
Jerry Schoen, Center staff assistant, was awarded the University of Massachusetts/Amherst Chancellor's Citation for his efforts in creating a state-wide program for citizen water quality monitoring in Massachusetts and New England and in coordinating technical support for citizen monitors throught the Water Resources Research Center's Massachusetts Water Watch Partnership program. Dr. Paul J. Godfrey was presented an award for
situation is currently exacerbated by a turnover in staff at WBNERR. Tara Nye, Citizen Water Quality Monitoring Coordinator, has left for a different job. Her position is now being advertised. In the interim, other WBNERR staff is fulfilling her duties, and MassWWP has provided some assistance. We are still in the early stages of exploring the question of how volunteer monitors and EOEA Watershed Teams can best partner. Currently there is no designated agency liaison for volunteer monitoring in each basin. In general, the Team Leader is the primary contact, but each Team Leader has a different background and set of skills. Some are more familiar with monitoring issues, and with working with volunteer groups, than others. We have asked EOEA to appoint such a liaison; they are now considering this. We are planning a fall 2000 volunteer monitoring conference and intend to continue this as an annual event. This year's conference will feature the issues discussed in this report, along with some others, such as building organizational strength for monitoring groups. We will provide MET with further information on the conference as it becomes available, and hope that you will be able to attend.
Articles in Refereed Scientific Journals
Book Chapters
Dissertations
Water Resources Research Institute Reports
Conference Proceedings
Other Publications
Student Support
Category Section 104 Base Grant
Section 104 RCGP Award
NIWR-USGS Internship
Supplemental Awards Total
Undergraduate 2 1 N/A N/A 3 Masters 3 3 N/A N/A 6
Ph.D. 1 N/A N/A N/A 1 Post-Doc. N/A N/A N/A N/A N/A
Total 6 4 N/A N/A 10
"dedicated and outstanding service as Treasurer and on many special projects" by the National Institutes for Water Resources. The New England Regional Monitoring Collaboration is cited by the Massachusetts Executive Office of Environmental Affairs as providing the model for the operation of volunteer monitoring programs. Two products of efforts by Marie-Françoise Walk, a manual on data presentation "Ready, Set, Present!" and a video on lake sampling techniques, were nationally reviewed and highly recommended to monitoring groups.
Publications from Prior Projects
Articles in Refereed Scientific Journals
Switzenbaum, Michael S., Shawn Veltman, Dean Mericas, Bryan Wagoner and Theodore Schoenberg, in review, Best Management Practices for Airport Deicing Stormwater, Chemosphere
Book Chapters
Dissertations
Water Resources Research Institute Reports
Switzenbaum, Michael S., Shawn Veltman, Theodore Schoenberg, Carmen M. Durand, Dean Mericas, and Bryan Wagoner. 1999, Best Management Practices for Airport Deicing Stormwater, Water Resources Research Center Pub. No. 173, University of Massachusetts, Amherst, MA, 57 pp.
Conference Proceedings
Other Publications
Godfrey, Paul Jos., Katie Galluzzo, Neal Price, and John Portnoy, 1999, Water Resources Management Plan, Cape Cod National Seashore, Massachusetts, National Park Service, Denver CO, 251 pages