ARIZONA: HOUSING AND LABOR MARKET TRENDS - Federal
22
ARIZONA: HOUSING AND LABOR MARKET TRENDS Community Development Research Federal Reserve Bank of San Francisco June 2012
Transcript of ARIZONA: HOUSING AND LABOR MARKET TRENDS - Federal

ARIZONA: HOUSING AND LABOR MARKET TRENDS
Community Development Research Federal Reserve Bank of San Francisco
June 2012
National Trends
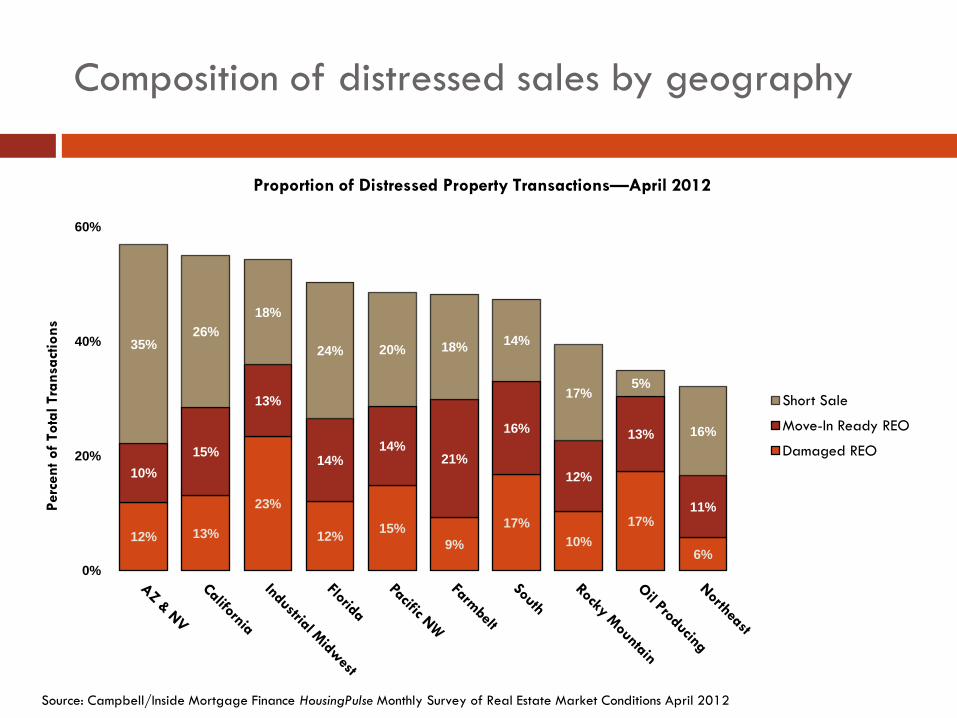
Composition of distressed sales by geography
12% 13%
23%
12% 15% 9%
17% 10%
17%
6%
10% 15%
13%
14% 14%
21%
16%
12%
13%
11%
35% 26%
18%
24% 20% 18% 14%
17% 5%
16%
0%
20%
40%
60%
Short Sale
Move-In Ready REO
Damaged REO
Proportion of Distressed Property Transactions—April 2012
Perc
ent o
f To
tal T
rans
actio
ns
Source: Campbell/Inside Mortgage Finance HousingPulse Monthly Survey of Real Estate Market Conditions April 2012
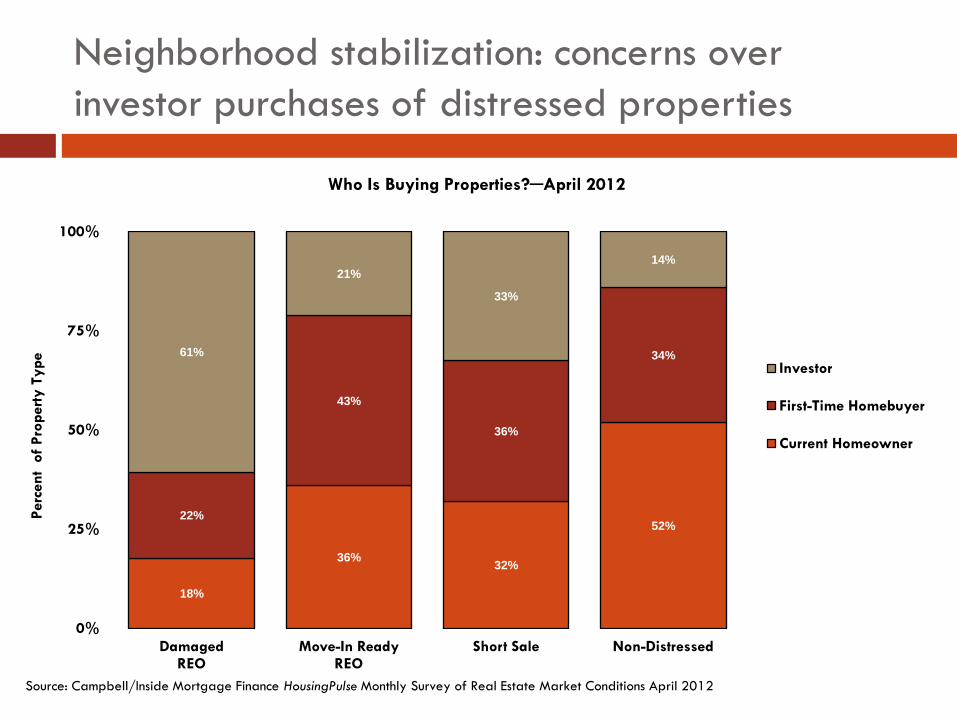
Neighborhood stabilization: concerns over investor purchases of distressed properties
18%
36% 32%
52% 22%
43%
36%
34% 61%
21%
33%
14%
0%
25%
50%
75%
100%
Damaged REO
Move-In Ready REO
Short Sale Non-Distressed
Investor
First-Time Homebuyer
Current Homeowner
Perc
ent
of P
rope
rty T
ype
Who Is Buying Properties?─April 2012
Source: Campbell/Inside Mortgage Finance HousingPulse Monthly Survey of Real Estate Market Conditions April 2012

Financing for home purchases
31%
10%
78% 19%
53%
3%
19%
13%
4%
5%
7%
26% 17% 15%
0%
25%
50%
75%
100%
Current Homeowners First-Time Homebuyers Investors
All Other Financing
VA
Fannie/Freddie
FHA
Cash
Perc
ent
of B
uyer
-Sid
e Tr
ansa
ctio
ns
Financing for Homebuyers─April 2012
Source: Campbell/Inside Mortgage Finance HousingPulse Monthly Survey of Real Estate Market Conditions April 2012

Arizona Trends
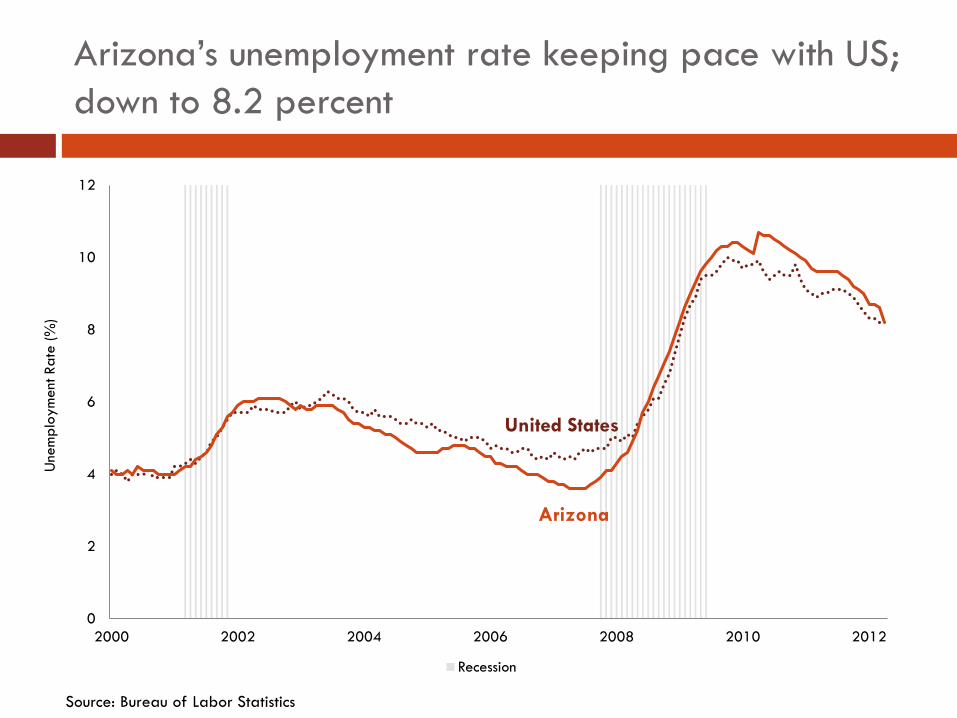
Arizona’s unemployment rate keeping pace with US; down to 8.2 percent
Source: Bureau of Labor Statistics
0
2
4
6
8
10
12
2000 2002 2004 2006 2008 2010 2012
Recession
Une
mpl
oym
ent R
ate
(%)
United States
Arizona

Arizona house prices down to 2003 levels
Source: Federal Housing Finance Agency (formerly OFHEO)
FHFA
Hou
se P
rice
Inde
x 20
00=
100
90
140
190
240
2000 2001 2002 2003 2004 2005 2006 2007 2008 2009 2010 2011 2012
FHFA (formerly OFHEO) House Price Index (2000=100, quarterly)
United States
Arizona
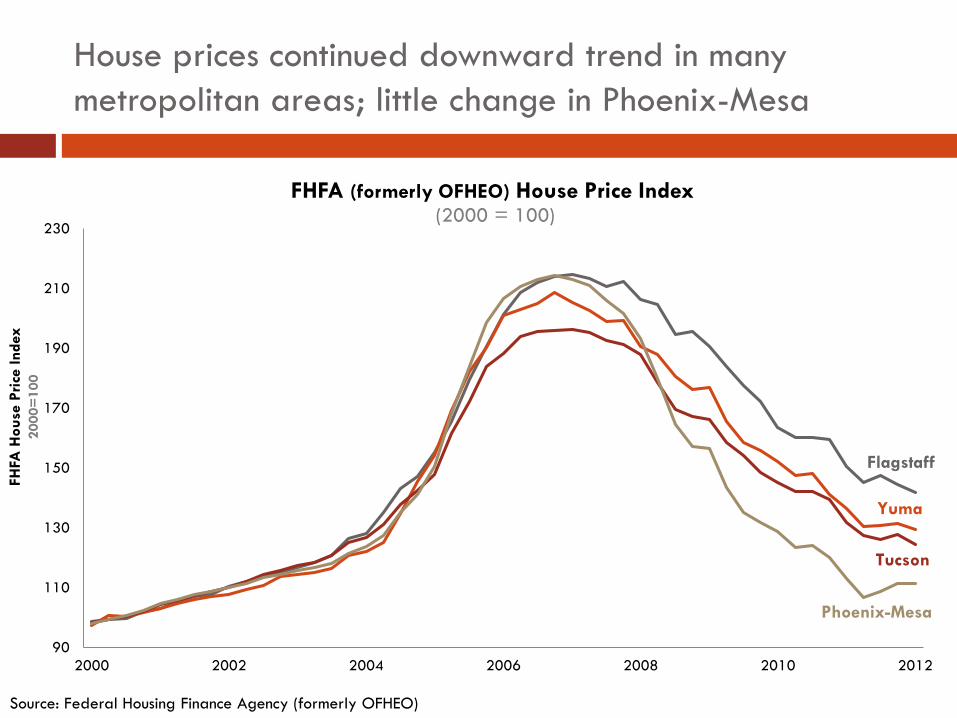
House prices continued downward trend in many metropolitan areas; little change in Phoenix-Mesa
Source: Federal Housing Finance Agency (formerly OFHEO)
FHFA
Hou
se P
rice
Inde
x 20
00=
100
90
110
130
150
170
190
210
230
2000 2002 2004 2006 2008 2010 2012
FHFA (formerly OFHEO) House Price Index (2000 = 100)
Tucson
Yuma
Flagstaff
Phoenix-Mesa

Number of delinquent mortgages and properties in foreclosure process continues to fall
Source: Mortgage Bankers Association, National Delinquency Survey
0
40,000
80,000
120,000
160,000
200,000
2005 2006 2007 2008 2009 2010 2011 2012
Num
ber o
f M
ortg
ages
Loans in Foreclosure All Mortgages Past Due
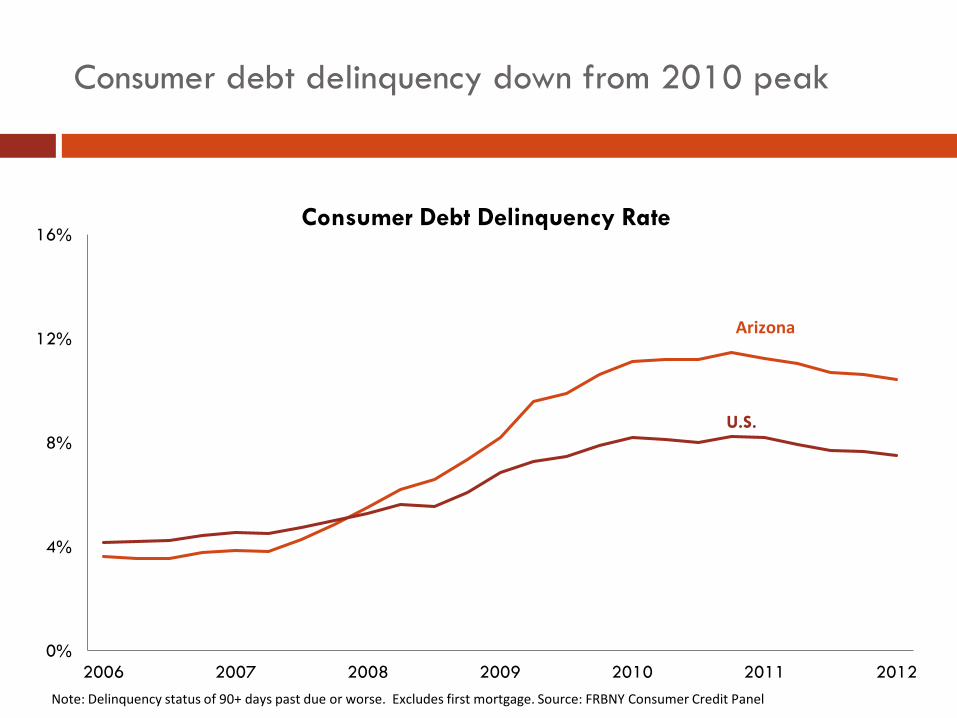
Consumer debt delinquency down from 2010 peak
0%
4%
8%
12%
16%
2006 2007 2008 2009 2010 2011 2012
Consumer Debt Delinquency Rate
U.S.
Arizona
Note: Delinquency status of 90+ days past due or worse. Excludes first mortgage. Source: FRBNY Consumer Credit Panel
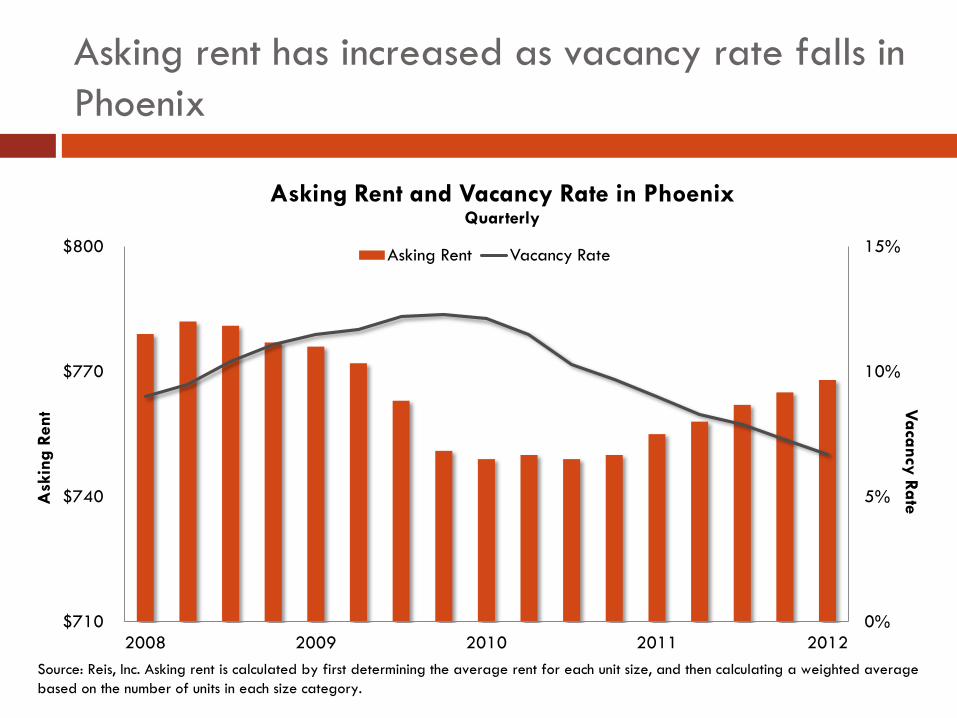
Asking rent has increased as vacancy rate falls in Phoenix
0%
5%
10%
15%
$710
$740
$770
$800
2008 2009 2010 2011 2012
Vacancy Rate A
skin
g Re
nt
Asking Rent and Vacancy Rate in Phoenix Quarterly
Asking Rent Vacancy Rate
Source: Reis, Inc. Asking rent is calculated by first determining the average rent for each unit size, and then calculating a weighted average based on the number of units in each size category.
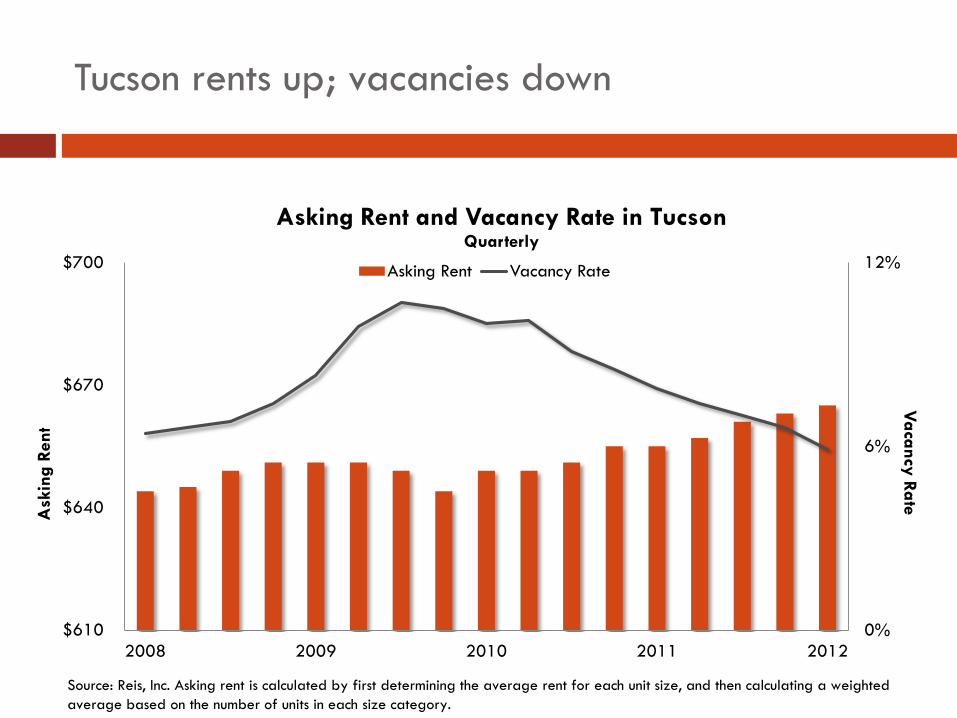
Tucson rents up; vacancies down
0%
6%
12%
$610
$640
$670
$700
2008 2009 2010 2011 2012
Vacancy Rate A
skin
g Re
nt
Asking Rent and Vacancy Rate in Tucson Quarterly
Asking Rent Vacancy Rate
Source: Reis, Inc. Asking rent is calculated by first determining the average rent for each unit size, and then calculating a weighted average based on the number of units in each size category.

Arizona Data Maps
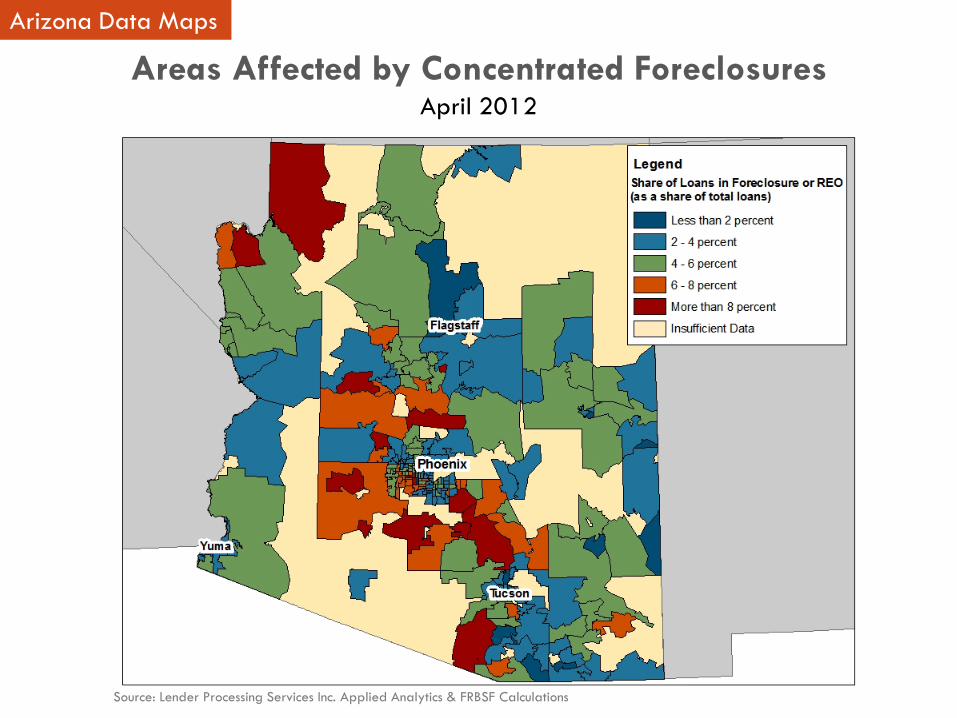
Areas Affected by Concentrated Foreclosures April 2012
Arizona Data Maps
Source: Lender Processing Services Inc. Applied Analytics & FRBSF Calculations

Areas At Risk Of Additional Foreclosures April 2012
Arizona Data Maps
Source: Lender Processing Services Inc. Applied Analytics & FRBSF Calculations

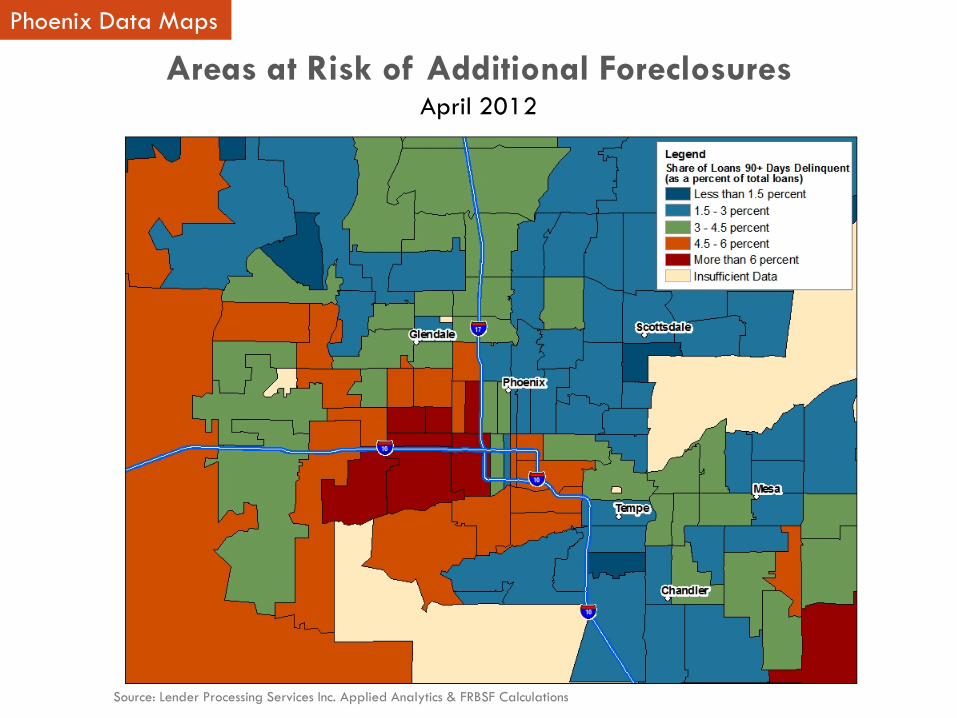
Phoenix Data Maps
Areas Affected by Concentrated Foreclosures April 2012
Source: Lender Processing Services Inc. Applied Analytics & FRBSF Calculations
Phoenix Data Maps
Areas at Risk of Additional Foreclosures April 2012
Source: Lender Processing Services Inc. Applied Analytics & FRBSF Calculations
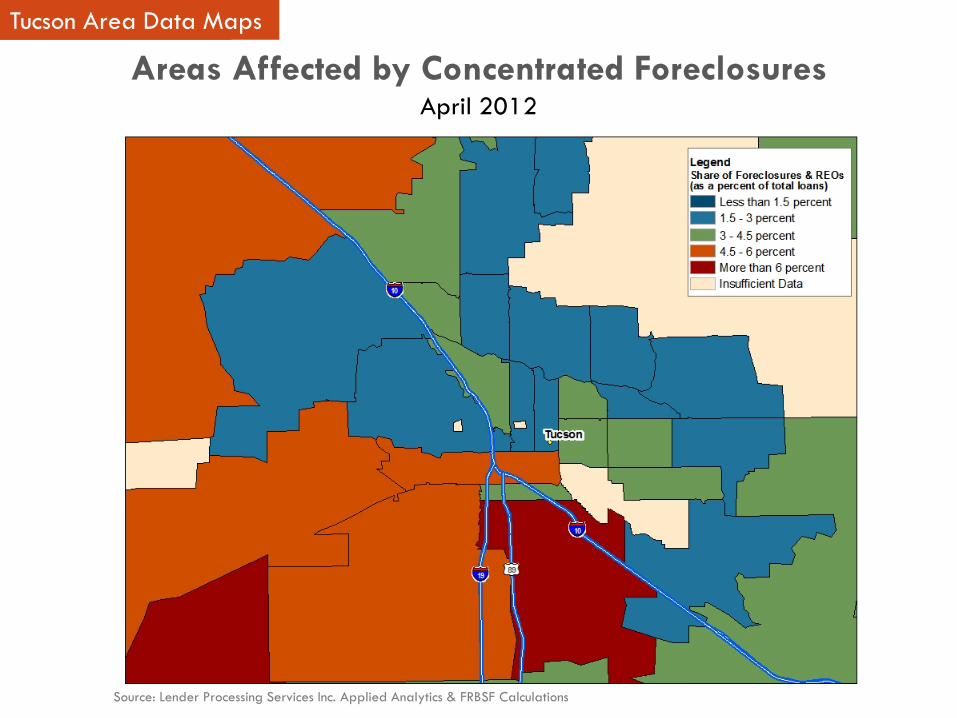
Oregon Data Maps Tucson Area Data Maps
Areas Affected by Concentrated Foreclosures April 2012
Source: Lender Processing Services Inc. Applied Analytics & FRBSF Calculations
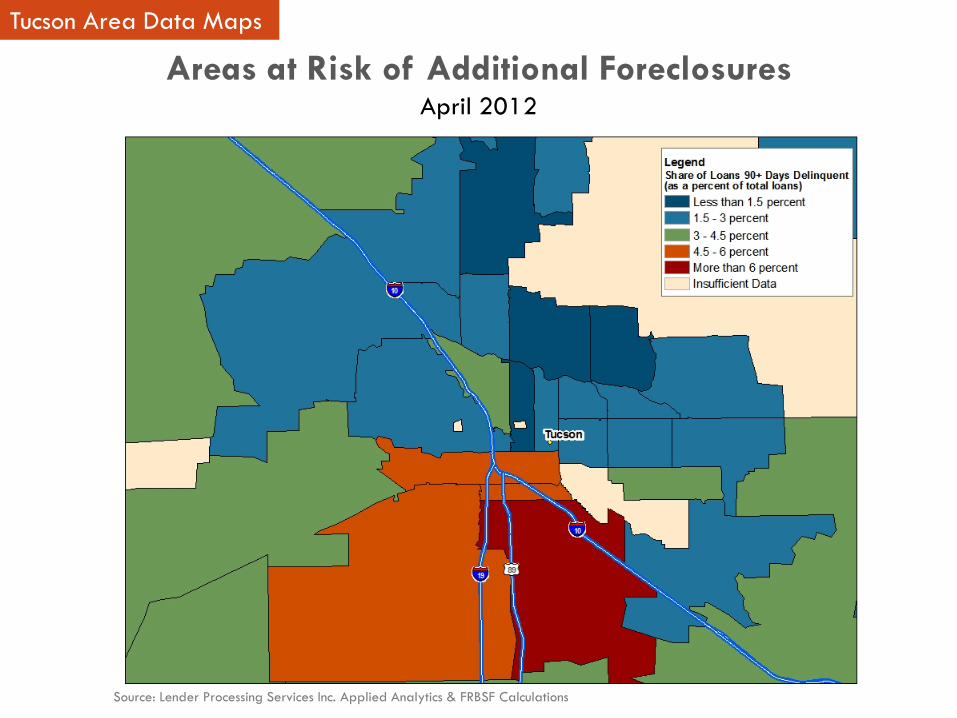
Areas at Risk of Additional Foreclosures April 2012
Tucson Area Data Maps
Source: Lender Processing Services Inc. Applied Analytics & FRBSF Calculations

Conclusions
For More Information: FRBSF Community Development Website
Links to other resources and research on foreclosure trends and mitigation strategies
All publications, presentations available on our website
Conference materials also posted shortly after events
http://www.frbsf.org/community/