Are “Better” Ideas More Likely to Succeed? An Empirical ...
49
Electronic copy available at: http://ssrn.com/abstract=2638367 Are “Better” Ideas More Likely to Succeed? An Empirical Analysis of Startup Evaluation Erin L. Scott Pian Shu Roman M. Lubynsky Working Paper 16-013
Transcript of Are “Better” Ideas More Likely to Succeed? An Empirical ...

Electronic copy available at: http://ssrn.com/abstract=2638367
Are “Better” Ideas More Likely to Succeed? An Empirical Analysis of Startup Evaluation
Erin L. Scott Pian Shu Roman M. Lubynsky
Working Paper 16-013

Electronic copy available at: http://ssrn.com/abstract=2638367
Working Paper 16-013
Copyright © 2015 by Erin L. Scott, Pian Shu, and Roman M. Lubynsky
Working papers are in draft form. This working paper is distributed for purposes of comment and discussion only. It may not be reproduced without permission of the copyright holder. Copies of working papers are available from the author.
Are “Better” Ideas More Likely to Succeed? An Empirical Analysis of Startup Evaluation
Erin L. Scott National University of Singapore
Pian Shu Harvard Business School
Roman M. Lubynsky Massachusetts Institute of Technology

Electronic copy available at: http://ssrn.com/abstract=2638367
Are “Better” Ideas More Likely to Succeed? An Empirical Analysis
of Startup Evaluation∗
Erin L. Scott
National University of Singapore
Pian Shu
Harvard University
Roman M. Lubynsky
MIT
July 2015
Abstract
Entrepreneurs face high uncertainty, and often make costly investments in new business ideas withoutknowing the expected payoff. This paper empirically examines whether ex-ante assessment of early-stage startup ideas can predict their subsequent commercialization. We leverage an entrepreneurshipprogram at the Massachusetts Institute of Technology in which early-stage venture ideas, presented inthe form of succinct standardized summaries, elicit subjective evaluations from a large set of experiencedentrepreneurs and executives. Using data on 652 ventures in multiple industry sectors, evaluated overan 8-year period, we find that ideas that elicit more positive evaluations are significantly more likely toultimately reach commercialization. We further show that these results are driven by venture ideas withdocumented intellectual capital in research-and-development-intensive sectors, such as life sciences andmedical devices. We find no evidence, by contrast, that experts can effectively assess the commercialpotential of venture ideas in non-R&D-intensive sectors such as consumer web and enterprise software.Finally, we find that industry-specific and scientific expertise is not critical to experts’ collective abilityto predict ventures’ commercial viability.
JEL Codes: L26, M13, O31, J24, G32
∗Scott: Department of Strategy and Policy, National University of Singapore Business School, [email protected]. Shu: Tech-nology and Operations Management, Harvard Business School, [email protected]. Lubynsky: Venture Mentoring Service, MIT,[email protected]. We are grateful to Tom Astebro, Gary Dushnitsky, Joshua Gans, Ben Golub, Shane Greenstein, Bill Kerr, KarimLakhani, Josh Lerner, Danielle Li, Will Mitchell, Ramana Nanda, Gary Pisano, Ivan Png, Timothy Simcoe, Jasjit Singh, KulwantSingh, Ariel Dora Stern, Scott Stern, Charles C.Y. Wang, and discussants and participants at the 2014 Academy of ManagementAnnual Meeting, the NBER Productivity Lunch, the NBER Entrepreneurship December Meeting, the Darden & Cambridge JudgeEntrepreneurship and Innovation Research Conference, and the NYU Stern Economics of Strategy Workshop for helpful comments.We thank Roberta McCarthy for help with data collection. Rohan Thavarajah provided excellent research assistance. We thankthe NBER Entrepreneurship Working Group, the Division of Research at Harvard Business School, and the Singapore Ministry ofEducation (AcRF Tier 1 Grant R-313-000-106-133) for financial support. All errors are our own.

1 Introduction
Young, high-growth businesses are critical to job creation and economic growth (Haltiwanger et al. , 2012;
Decker et al. , 2014); nevertheless, most entrepreneurial efforts fail (Hall & Woodward, 2010; Kerr et al.
, 2014b).1 Transforming a nascent idea into a viable business requires entrepreneurs to devote significant
time and resources to its development instead of pursuing conventional career paths. These commitments are
typically made with little information on whether the idea will succeed. Can new businesses be meaningfully
differentiated as early-stage ideas, before there is a legal entity or any funding? This paper empirically
examines whether ex-ante assessment of a start-up idea can predict its future commercial viability.
We study the assessment of startup ideas using data from the Massachusetts Institute of Technology. As
natural sources of talented entrepreneurs, universities are instrumental in fostering high-impact entrepreneur-
ship and stimulating local economic activity (Torrance, 2013; U.S. Department of Commerce, 2013). MIT
alumni have founded over 25,000 active companies that have collectively employed over 3 million people
and generated annual worldwide sales of $2 trillion (Roberts & Eesley, 2009). Our empirical setting, MIT’s
Venture Mentoring Service (VMS), is one of the university’s longest-running programs designed to pro-
mote entrepreneurship and innovation. Founded in 2000, it is a free educational service that helps aspiring
MIT-affiliated entrepreneurs develop their business ideas, usually at an early stage. As their ideas evolve,
entrepreneurs must inevitably decide whether to pursue a venture full-time, forgoing other venture ideas
and attractive job options.2 The feasibility of accurate early assessment of idea quality thus has important
implications for the allocation of human capital.
It is difficult to examine assessment of venture ideas in settings in which early-stage ventures are typi-
cally evaluated, such as venture-financing firms and government grant agencies. Theoretical work in these
contexts has assumed that returns to entrepreneurial ideas are ex-ante unknown and that uncertainty can
only be resolved via investment (Bergemann & Hege, 1998, 2005; Manso, 2011; Ewens et al. , 2015).3 This
assumption remains largely untested empirically, due to a fundamental identification challenge: evaluation
1Hall & Woodward (2010) find that only 2.3 percent of venture-backed entrepreneurs since 1987 received more than $100million in exit cash; nearly 75 percent received nothing. Kerr et al. (2014b) show that 55 percent of U.S. startups that receivedventure-capital (VC) financing between 1985 and 2009 were terminated at a loss, and the 6 percent of ventures with the highestreturns jointly accounted for half of the gross return generated by the entire sample.
2According to Hastings et al. (2010), average starting salaries for MIT graduates are around $60,000 per year for those withbachelor’s degrees and $70,000-$120,000 for those with graduate degrees.
3A related stream of theoretical work uses a similar approach (known as the bandit problem) to model innovation and researchand development (R&D)(Weitzman, 1979; Roberts & Weitzman, 1981; Jensen, 1983; Bhattacharya et al. , 1986; Moscarini &Smith, 2001).
1
by investors and grant reviewers has a direct impact on development of a venture idea via resource allocation
and signaling to key stakeholders. Ventures that elicit positive evaluations also receive additional resources
(investment and mentorship), which have been shown to have a positive impact on their outcomes.4 In re-
sponse to positive or negative evaluations, entrepreneurs may alter the amount of effort they expend on a
venture, resulting in a self-fulfilling prophecy. Furthermore, private investors and public agencies employ
complex evaluation mechanisms that take into account numerous factors in addition to the idea’s commercial
potential,5 making it more challenging to pinpoint the relationship between evaluators’ ex-ante assessments
of the underlying ideas and ventures’ ultimate outcomes.
The educational nature of our setting allows us to circumvent these empirical challenges. When an en-
trepreneur enrolls at VMS, all currently active mentors—a pool of over 100 experienced local entrepreneurs
and executives on average—receive an objective, standardized summary of the proposed venture, composed
by a VMS staff member.6 Each summary describes the venture idea—the proposed business model and tech-
nology, target customers, and current challenges—but provides limited information about the entrepreneur
and founding team; the summaries are consistent in form and tone. On the strength of the summary alone,
without meeting the entrepreneurs, mentors must decide whether they want to work with a venture, a de-
cision they do not make lightly.7 The aggregate number of mentors expressing interest in a given venture
provides us a measure of the ex-ante perceived quality of the venture in its earliest form.
Aggregate initial interest is unlikely to systematically influence ventures’ access to mentoring resources
or entrepreneurs’ effort levels, due to several institutional factors. First, to provide entrepreneurs with equal
access to their mentoring resources, VMS sets the initial mentor team to consist of two to four mentors,
which is usually fewer than the number of interested mentors—the median number of interested mentors in
our sample is six. VMS selects the initial mentor team from the interested mentors based on a variety of
factors including scheduling availability and load balancing. Second, entrepreneurs determine how much
mentoring they receive; they are not aware of the magnitude of initial mentor interest, nor do they have a
role in choosing the initial mentor team. Third, the composition of the mentor team often changes over
4A large body of literature describes various mechanisms whereby venture capitalists and angel investors professionalize ven-tures and improve their outcomes, such as active mentorship, network access, and control rights (Gorman & Sahlman, 1989;Sahlman, 1990; Lerner, 1995; Hellmann & Puri, 2002; Hsu, 2004; Kerr et al. , 2014a). See also Lerner (1999) and Howell (2014)on the impact of government grants, and Cohen & Hochberg (2014), Hallen et al. (2014), and Yu (2015) on accelerators.
5For instance, see Zacharakis & Meyer (2000), Baum & Silverman (2004), and Bernstein et al. (2014) on VC and angelinvestors’ selection criteria.
6VMS imposes minimal screening on venture ideas.7Mentors on average express interest in fewer than 5 percent of the ventures they review.
2
time as the venture develops and its needs evolve, and later-stage team members are not restricted to those
who initially expressed interest in the venture. Thus only a semi-random subset of the mentors who initially
express interest in a venture ultimately interact with it, and few if any become heavily involved.
We collect detailed data on the characteristics and subsequent outcomes of 652 ventures that joined VMS
between 2005 and 2012.8 The vast majority represent industries characterized by high-impact entrepreneur-
ship, including consumer web and mobile, enterprise software, hardware,9 and life sciences. Generally
speaking, the ventures in our sample are serious endeavors, not recreational pursuits; nearly half of the ideas
evolved into launched businesses led by at least one full-time entrepreneur. These ventures also had signif-
icant economic impact, raising nearly $800 million from venture financing, government grants, and other
sources.
Our study generated three key findings. First, venture ideas that elicit a high degree of initial mentor
interest are more likely to ultimately reach commercialization, defined as having recurring revenue and ex-
penses associated with the sale of products and/or services in keeping with the company’s business objective.
Conditional on a rich set of controls for venture characteristics observed at entry and for venture/mentor in-
teractions, we find that a one-standard deviation increase in the proportion or count of mentors who express
interest in a venture idea implies, on average, a 17-percent increase in the likelihood of commercialization
(or a 3.8-percentage-point increase over the baseline probability of 22.4 percent). The results are robust to
using alternative measures of mentor interest, to restricting the sample of analysis to ventures in which more
than four mentors express interest, and to restricting the sample to ventures that have limited interaction with
VMS mentors. Using data at the venture/mentor-pairing level to control for mentor fixed effects, we further
invalidate the hypothesis that our results are driven by variation in the quality of matching between mentors
and ventures. The relationship between mentor interest and ultimate commercialization remains strong for
the subsample of venture ideas that entrepreneurs decided to pursue full-time, which suggests that mentors
are not simply predicting the behavior of entrepreneurs or excluding obviously non-serious ideas.
Second, we document strong heterogeneity across industry sectors. Following the National Science
Foundation (2006), we define research-and-development (R&D)-intensive sectors to include hardware, en-
ergy, and life sciences and medical devices. We find that the relationship between initial mentor interest and
eventual commercialization is strong and significant for ventures in R&D-intensive sectors, and particularly
8Our sample includes all ventures that joined VMS between 2005 and 2012 except for 7 ventures that were already funded whenthey joined VMS and 10 ventures that were founded by MIT faculty.
9That is, products that require large-scale manufacturing processes.
3
for ventures with documented intellectual capital.10 In contrast, the relationship is weak and insignificant
among ventures in non-R&D-intensive sectors, including consumer web/mobile, enterprise software, and
consumer products. This finding is not attributable to a venture’s intellectual capital simply functioning as a
signal of its maturity; we find that mentor assessment is not effective for the most developed venture ideas
in our sample, namely those that have already formed a legal business entity when they join VMS.11
Third, we find that mentors’ industry-specific and scientific expertise is not a critical determinant of their
collective ability to assess commercial viability. For each venture, we calculate mentor interest separately for
mentors with and without in-depth experience in the venture’s sector. We trace much of the predictability
of commercial viability to interest expressed by mentors with limited or no experience in the venture’s
industry, not by industry experts. Similarly, we show that interest expressed by mentors without doctoral
degrees strongly predicts venture commercialization, but that of mentors with doctoral degrees does not.
These results do not imply, however, that industry or scientific expertise hinders an individual mentor’s
ability to assess a venture’s commercial potential. Given the diversity of mentors’ educational and career
backgrounds, only a small proportion of mentors have industry-specific or scientific expertise. We provide
suggestive evidence that the predictive power of mentors’ assessments arises from aggregating the subjective
evaluations of a large and diverse group of mentors.
Our findings make several contributions. Unlike the vast literature on the effectiveness of the peer-review
process in evaluating scientific ideas (Cole et al. , 1981; Chubin & Hackett, 1990; Lamont, 2009; Li & Agha,
2015), empirical evidence on evaluation of entrepreneurial ideas is scant and inconclusive.12 Using data
on Canadian inventions, Astebro & Elhedhli (2006) find a positive relationship between expert evaluation
of an invention and its likelihood of subsequent commercialization and financial returns. Fafchamps &
Woodruff (2014) report a positive correlation between small businesses’ scores in a Ghanaian business-plan
competition and their future growth. In both cases, however, the evaluation is revealed to the entrepreneurs,
and thus could influence subsequent outcomes via signaling. In contrast to these studies that find a positive
relationship, Kerr et al. (2014a) and Kerr et al. (2014b) find weak correlations between assessment by
venture capitalists and angel investors at the time of financing and a venture’s subsequent performance
10That is, ventures that are based on academic research or that have filed for intellectual property protection at the time ofevaluation.
11Around 17 percent of the ventures are incorporated at entry.12In other contexts involving innovative ideas, Kornish & Ulrich (2014) find that evaluation of raw ideas for household consumer
products by consumer panelists and expert evaluators positively predicts final product sales, and Goetzmann et al. (2012) and Luo(2014) find that the price of a movie script predicts the commercial performance of the final product.
4

conditional on receiving funding; however, the funded ventures are only a small subset of the full sample
of ventures evaluated by the investors, and thus do not shed light on the overall effectiveness of investors’
ability to differentiate early-stage venture ideas.13
The degree to which new ideas can be effectively differentiated affects entrepreneurs’ and innovators’
choices to engage in parallel search—to diversify across multiple ideas—or to focus resources on the most
promising ideas (Nelson, 1961). Innovative ideas are the fundamental engine of economic growth (Romer,
1990; Aghion & Howitt, 1992; Jones, 1995), but the nature of innovation also implies that the probability
distribution of future outcomes is often unknown (Knight, 1921; Rosenberg, 1996). Arrow (2012) draws a
parallel to evolutionary biology, pointing out that “it is precisely the way the new species (or the innovation)
differs from the present that is of interest, and that is what is difficult to predict.” Given limited empirical
evidence on the predictability of entrepreneurial outcomes, prior work has emphasized experimentation and
diversification as key ingredients of the entrepreneurial process (Stern, 2005; Kerr et al. , 2014b; Nanda
& Rhodes-Kropf, 2015).14 We contribute to this literature by demonstrating the predictability of ventures
in R&D-intensive sectors, which suggests in turn that the optimal level and form of experimentation vary
depending on the nature of the venture.
This paper also builds on the critical-resource literature (Wernerfelt, 1984; Zingales, 2000; Rajan &
Zingales, 2001a,b) by contributing evidence on the heterogeneity of the assets—physical, intellectual, or
human-capital assets—around which firms form at the earliest stages. Prior studies find that initial business
concepts often change and broaden during the idea-formation stage (Bhide, 2003) and that entrepreneurs’
human capital is a key differentiator of early-stage firms (Rajan, 2012; Bernstein et al. , 2014). This finding
appears to be at odds with Kaplan et al. (2009), which shows that a venture’s intellectual-property assets
are formed at the business-plan stage, and remain relatively stable between receiving venture financing and
going public, but that the management team changes. Our results on the heterogeneity of ventures suggest
that firms form around different critical resources even at very early stages, and that previous findings may
apply to the specific types of ventures that comprise the firm samples used in those studies.15
13Although Kerr et al. (2014a) also find that the aggregate interest level of the angel investors in their study positively predictsthe probability of raising VC funding for ventures that do not receive funding from these angel investors, the results could be drivenby shared preferences among angel and VC investors and thus provide only suggestive evidence on the efficacy of the evaluationmechanisms.
14See also Rosenberg (1992) and Qian & Xu (1998) on the importance of experimentation in market-based economies; Flem-ing (2001) and Fleming & Sorenson (2004) on experimentation in scientific inventions; and Shane (2000) on experimentation incommercial applications of new technologies.
15Of the 21 firms studied in Bernstein et al. (2014), 18 are in information technology. 72 of the 100 firms interviewed by Bhide(2003) are in computer-related industries, business services, or consumer goods; 25 of the 50 firms studied in Kaplan et al. (2009)
5

The next section describes the institutional setting of VMS in depth. Section 3 discusses our data and
summary statistics. Section 4 estimates the relationship between expert evaluation and likelihood of com-
mercialization and rules out alternative explanations. Sections 5 and 6 explore the heterogeneity of venture
types and mentor backgrounds. Section 7 concludes.
2 Empirical Setting
To fill a gap in MIT’s institutional support of emerging entrepreneurs, Professor David Staelin from the
Department of Electrical Engineering and Computer Science and alumnus Alexander Dingee, both highly
successful entrepreneurs, founded the MIT Venture Mentoring Service in 2000 with the support of Provost
Robert Brown. The program’s primary objective is to escalate the economic impact of MIT’s ecosystem via
entrepreneurship education. Entrepreneurs from the larger MIT community—students, staff, alumni, and
faculty—approach VMS with an idea, often in an early form, and receive customized advice from a team
of elite volunteer mentors. VMS thus uses very early-stage ideas as the context for providing prospective
entrepreneurs a hands-on, practical education. The service is confidential and free of charge.
In addition to volunteer mentors, VMS consists of a small team of full-time staff members, including
two mentors-in-residence. In keeping with the focus on entrepreneurial education, VMS staff members share
the outlook that their mission is, in the words of one staff member, “to build entrepreneurs, not businesses.
The businesses are simply case studies for learning entrepreneurship.” Success for VMS is not determined
by its ventures’ rate of commercialization or successful exit; it is captured in the learning opportunities
VMS provides. Positive progress is celebrated, but failure is also embraced. “We think it’s a success if the
prospective entrepreneur decides there isn’t a viable business,” remarked a VMS staff member, “or that they
really don’t want to be an entrepreneur now that they get what you really have to do [to be successful].”
Accordingly, a VMS entrepreneur who decided against pursuing a venture expresses gratitude “for [VMS
mentors’] insight and experience that helped drive us to this conclusion far faster than we could have reached
on our own.”
are in biotechnology, telecom, or healthcare. In our sample of 652 venture ideas, 221 are in hardware, life sciences and medicaldevices, and energy; 384 are in consumer web/mobile, enterprise software, and consumer products.
6

2.1 VMS Mentors
The volunteer mentors at VMS are experts in business formation and development who have typically ac-
quired entrepreneurial experience in one of three ways: by founding and growing a new company, by leading
a new business initiative at an established company, or by providing functional services (e.g. legal or finan-
cial) to startups. The majority of VMS mentors have either founded a company or joined a startup very
early on. A fair number of these mentors are serial entrepreneurs; others have stayed put and become senior
executives as a startup grew into a large company. Most of the remaining mentors have led new business
initiatives (e.g., new product lines, new divisions, new markets) at established firms and encountered many
of the same issues that entrepreneurs face. A few mentors specialize in particular functional areas, such as
law or finance; they may lack direct startup experience, but they have interacted extensively with startups.
Mentors are not compensated for their time, and are often referred by existing mentors, who thus pro-
vide an initial filter for the organization. Candidates are carefully screened by VMS staff. An in-depth
interview looks for a compelling focus and an interest in helping entrepreneurs; prospective mentors with
other personal or business agendas, including active professional investors, are not accepted. Every mentor
must sign an agreement that specifies rigorous guidelines and a code of ethics that encourages transparency
and limits conflicts of interest. VMS monitors mentor activity and promptly dismisses mentors who violate
these principles. On rare occasions, a venture will offer a member of its mentor team a more formal role,
such as CEO or board advisor. If the mentor accepts such a role, he or she must resign from the mentor team
for that venture; VMS reviews such situations on a case-by-case basis. Considerable care is taken to ensure
that the program remains focused on its educational aims and provides objective advice to entrepreneurs.
VMS estimates that active mentors average over 100 hours of volunteer time annually. Mentors report
that they do so for a variety of reasons. Among the most commonly articulated motivations are the intellec-
tual appeal of the work, continuing engagement in the Greater Boston entrepreneurship community, and the
satisfaction of promoting the development of new entrepreneurs. Mentors share a sense that, in the words of
one mentor, “mentoring entrepreneurs is a way to give back for all the help that I received in my career.”
2.2 Initial Screening of Venture Ideas
To be eligible for mentoring, an entrepreneur must be affiliated with MIT (e.g., students, alumni, faculty,
and staff) and based in the Greater Boston area. Given the educational nature of the program, VMS imposes
7

only minimal requirements on eligible entrepreneurs and their ideas: the only criteria are serious interest in
learning about entrepreneurship and an idea that will provide a context and focus for practical entrepreneur-
ship education. Entrepreneurs typically come to VMS very early. They may have conducted preliminary
research on the feasibility of the idea, but they usually do not have a business plan, a strategy and revenue
model, or a team. Few entrepreneurs are pursuing a venture idea full-time when they join VMS, and few of
their ventures are incorporated or funded.
2.3 Matching Venture Ideas with Mentors
VMS follows a standardized routine to match new ventures to their initial mentor teams. Here we describe
the matching procedures employed by VMS during our study period (2005–2012), which we also summarize
in Figure A.1 in the Appendix.
To receive mentoring from VMS, entrepreneurs must first complete a short enrollment form. Drawing
on the form and an initial consultation with the entrepreneur(s), a staff member distills the venture idea
into a concise standardized summary for purposes of dissemination to mentors; the same staff member
prepared almost all of these summaries throughout our sample period. The summary includes the following
information:
• a straightforward description of what the venture intends to do, free of buzzwords and technical jargon
• information on potential customers and products
• the type of help the venture needs, and any relevant challenges, problems, and/or known issues (e.g.,
intellectual-property and legal problems)
• brief information on the founding entrepreneur(s), including their MIT affiliations
Table A.1 in the Appendix provides sample anonymized written descriptions. Because the program focuses
on entrepreneurship education, VMS presents all ventures in positive terms. For ventures of a technological
nature, the feasibility of the underlying technology is rarely questioned. (Challenges and problems are not
ignored, however; they shed light on the assistance entrepreneurs will need.)
VMS regularly emails venture summaries, in batches, to all active VMS mentors; the summaries are
also delivered in printed form and orally at monthly meetings of mentors. Mentors then respond, indicating
8

interest in working with a given venture. Because mentors do so via email or on paper, they evaluate ventures
independently and only VMS is aware of the aggregate interest level.
An expression of interest indicates willingness to commit time to a venture, and mentors do not do so
lightly. On average, mentors express interest in fewer than 5 percent of the ventures to which they are
exposed. Interviews with mentors suggest that the appeal of the underlying technology and/or business
idea is the primary driver of interest. One mentor reports basing interest on the “novelty of the idea and
whether it offers some positive value to some group of people and/or the planet.” Another mentor concurs:
“I volunteer if the technology and/or the application is interesting to me.” Sometimes, mentors also consider
the relevance of their experience and knowledge. But not all mentors look for ventures that hew closely to
their own backgrounds. A mentor who reports being “most intrigued by the ventures that are the furthest
from my own professional experiences” speaks for many mentors.
Compared to contexts like venture financing, VMS mentors typically make their decisions far earlier in
a venture’s life cycle, often years before it will approach professional investors. VMS mentors also make
a single decision—whether to express interest in a venture—based solely on the summary of the business
proposition and without meeting the founding team, in contrast to the multistage investment decision pro-
cesses of professional investors, which rely on abundant information.16
It is important to note that mentor interest is not used as a metric in program evaluation. VMS uses
mentor-interest data only in the initial mentor venture pairing process and sets the initial mentor team size
to two to four volunteer mentors (excluding the professional VMS staff members). Because more mentors
typically express interest than can join the team, only a semi-random subset of mentors expressing interest
in a venture interacts with the venture. VMS assembles the mentor team in light of a set of factors that
include mutual scheduling constraints and load balancing. Entrepreneurs do not learn the aggregate mentor
interest they attract, nor do they select their initial mentor team.
2.4 Mentoring at VMS
VMS ensures that access to mentoring resources does not differ systematically across entrepreneurs and
ventures. After being paired with mentor teams, entrepreneurs largely determine the extent of mentoring
they receive. Meetings are initiated by the entrepreneurs; VMS attempts to accommodate all requests, and
16It is possible that venture capitalists’ ample information leads to more bias and inferior evaluations (Zacharakis & Shepherd,2000; Zacharakis & Meyer, 2000).
9

checks in regularly with ventures to assure that its records on their status are up to date.
VMS measures the effectiveness of mentoring primarily via the feedback from entrepreneurs; internal
evaluation of the program is largely qualitative. Objective metrics include the size of the program (the
number of active mentors and entrepreneurs), its rate of growth, mentors’ engagement (e.g., hours com-
mitted), and entrepreneurs’ evaluations. As of July 1, 2014, VMS was working with entrepreneurs on 200
ideas, enrolling over 20 new venture ideas per month, and using the services of around 150 active volunteer
mentors.
Assessment of the VMS program is beyond the scope of this paper, but the program is highly regarded
by the entrepreneurship community, individual entrepreneurs, and university educators alike.17 Over 40
institutions worldwide—including Harvard University, Yale University, Columbia University, and New York
University—have established mentoring programs based on the VMS model. At MIT, VMS complements a
rich array of other services, centers, programs, clubs, and initiatives, both academic and extracurricular, that
support innovation and entrepreneurship.18
We do not claim that the effect of mentoring on ventures is unvarying. Our identifying assumption is,
rather, that the level of mentor interest expressed at the time of venture enrollment does not systematically
cause the intensity of mentoring to differ. Generally speaking, a mentor is unlikely to become as heavily
involved as a typical investor. This is the case for two reasons. First, entrepreneurs request meetings based on
their own needs and not on mentors’ schedules. Given the ad hoc nature of these meetings, the entire mentor
team may not attend. Second, the mentor team may change over time as different kinds of knowledge, skills,
and experience become more useful. Later-stage mentors are not limited to those who initially expressed
interest in the venture. In many cases, in fact, later mentor venture pairings are based on the specific skills
of the mentor and/or facilitated by informal meetings at VMS events.
17For instance, the Ewing Marion Kauffman Foundation has identified VMS as a model program. One entrepreneur reportsthat VMS “provided the critical help when it was the most dangerous to make [the] decisions . . . that could make or break thecompany” and adds that she “never could have anticipated the depth and quality of support” provided.
18For example, the Martin Trust Center for Entrepreneurship is a hub for entrepreneurial courses and activities, and the Desh-pande Center for Technological Innovation helps researchers take new discoveries from the lab bench to commercialization.
10

3 Data and Descriptive Statistics
3.1 Venture Sample
Our sample for analysis consists of all ventures that joined VMS between 2005 and 2012. We exclude
the initial cohorts from VMS’s first five years of operation because both ventures and mentors were few in
number and may have been selected by virtue of connections with VMS’s founders. By late 2004, however,
VMS had grown substantially, increased awareness of its services in the larger MIT community, and intro-
duced systematic electronic record-keeping. Figure 1 plots the number of new ventures that joined VMS
during our sample period by starting year and month. We exclude seven ventures that had already been
funded before joining VMS since they had progressed further than the typical venture that affiliates with
VMS at the idea stage. Also, third-party validation by investors might have influenced the evaluations of
VMS mentors. We also exclude ten ventures founded by MIT faculty, which may have special standing in
the university ecosystem. Our resulting sample consists of 652 ventures.
Table 1 presents summary statistics on the observed characteristics of ventures upon joining VMS. The
most populous industry sectors are consumer web and mobile (27.9 percent), enterprise (or business-to-
business) software (17.8 percent), and hardware/large-scale manufacturing (14.7 percent). Other sectors
include life sciences and medical devices (13.3 percent), consumer products (13.2 percent), and energy (5.8
percent). The remaining set (7.2 percent) includes non-profit ventures, lifestyle businesses, and a few ven-
tures in consulting and finance. Given the affiliation with MIT, it is unsurprising that a fair proportion of
the ventures have a strong technological component. Around 23 percent already have filed for intellectual-
property (IP) protection when they join VMS, but only 16.9 percent have established formal business enti-
ties; of the total, 15.5 percent are based on academic research.
Table 2 summarizes venture characteristics by industry. Following the National Science Foundation
(2006), we designate life sciences and medical devices, hardware, and energy—which jointly account for
221 venture ideas—as sectors with high research-and-development intensities. Unsurprisingly, a large pro-
portion of these ideas draw on academic research or possess intellectual property when they join VMS;
many have also formed legal business entities. Ventures in other sectors, such as consumer web/mobile and
enterprise software, are much less likely to draw on research or to have IP at entry.
Students and alumni respectively generate around 38.3 percent and 36.7 percent of venture ideas. The
rest come from postdoctoral fellows, research associates, and staff. Around 7.7 percent of the venture ideas
11

in our sample belong to entrepreneurs previously mentored by VMS on a different project.
3.2 Mentor Sample
The sample of mentors consists of 251 volunteer mentors who have ever been active between 2005 and
2012. We exclude full-time VMS staff members from the active mentor pool because they are aware of the
aggregate mentor interest and interact with most ventures. The number of active mentors increases during
our sample period from 68 in 2005 to 181 in 2012.
We collect detailed data on mentors’ backgrounds and expertise by means of surveys and online searches.
Table 3 reports mentors’ mean characteristics. Around 85 percent of mentors are male; only a few (22.3 per-
cent) have a Ph.D. or M.D. Because many mentors have worked in multiple sectors, we categorize them in
two ways. First, we define a mentor’s primary sector as the industry in which he or she has worked longest
to date (as self-reported or extracted from online career histories). In this classification scheme each mentor
has a single primary sector. The three most populous primary sectors are hardware (24.7 percent), life sci-
ences and medical devices (21.5 percent), and enterprise software (21.1 percent). The sector most popular
with ventures, consumer web and mobile, is the primary sector of only 6.8 percent of mentors. Second, we
capture the breadth of a mentor’s experience via seven experience dummies; each dummy is designated as
1 if a mentor has had work experience in the corresponding industry sector. Again, the three most populous
sectors are hardware, enterprise software, and life sciences and medical devices. Mentors on average have
worked in 2.5 sectors.
3.3 Measuring Initial Mentor Interest
We use two variables to measure aggregate mentor interest: the percentage and the number of active mentors
who express interest in a venture shortly after the venture joins VMS.19 To accommodate delayed responses
from mentors and delayed recording of their responses, we include all indications of interest expressed
within two months of a venture’s eligibility for mentoring.20 It is not uncommon for a mentor initially
uninterested in a venture to become interested as the venture develops; we exclude such cases from our
calculations of initial interest because they may be driven by a venture’s positive progress, by information
provided by other mentors, and/or by other interactions and events sponsored by VMS.19The denominator in the percentage of mentors expressing interest is the number of mentors who were actively involved with
VMS at the time, excluding mentors who had not yet joined VMS or who had already left the program.20Our results are also robust to using a threshold of 1.5 months or three months.
12

On average, a new venture interests around 4.5 percent of active mentors, or 6.3 mentors.21 The median
number of interested mentors is 6. Figure 2 shows the kernel density of aggregate mentor interest measured
as a proportion, and a histogram of interest measured as a count.
3.4 Measuring Mentoring Intensity
As noted in Section 2, mentors’ initial evaluation of a venture is unlikely to systematically make for differen-
tial mentoring resources. The educational structure of the program is designed to maximize entrepreneurs’
access to mentoring resources regardless of the potential of their ideas. Nonetheless, we capture the degree
of mentoring intensity at the extensive margin using two variables: the number of mentors who have met
with the venture at least twice and the number of a venture’s meetings at VMS, both measured at the time of
data collection. The former measure controls for the relationships that entrepreneurs may have formed with
VMS mentors.22 The latter measure uses number of meetings instead of frequency of meetings to capture
VMS’s total impact on a venture.23 Though we do not observe all channels whereby mentors and ventures
could interact (such as email), we expect that, on average, ventures that have had more recorded interactions
with their mentor teams have received more mentoring. We use additional robustness checks to investigate
whether variations in the degree of mentoring at the intensive margin drive our key results.
The average venture in our sample meets with VMS mentors only around three times, and has repeated
interactions with fewer than two mentors (see Table 1). Around 36 percent of ventures never meet with VMS
mentors or do so only once; 40 percent never interact with any mentor more than once (see Table A.2). The
correlations between initial mentor interest and venture mentor interactions are weakly positive (see Figure
3).
3.5 Measuring Venture Outcomes and Milestones
Our primary outcome of interest is whether or not a venture successfully reaches the stage of commercializa-
tion, characterized by recurring revenue and expenses associated with sales of the products and/or services
that are the business objective of the company, and by a reasonable expectation of repeat business and new
21On average, a summary of a new venture is sent to 144 active mentors.22This measure excludes mentors who meet with the venture only once, since a mentor who is not a member of a venture’s team
may be invited to meet with the entrepreneur to address specialized needs. For instance, a lawyer may meet with the entrepreneursto discuss how to draft a founder’s agreement.
23It is also difficult to measure frequency without errors, especially in the case of failed venture ideas since it is hard to pinpointthe precise timing of a failure.
13

customers. We capture this outcome using public sources, including product listings on popular sites like
Amazon.com, news articles, and press releases. Our definition of commercialization excludes revenue from
one-off “consulting services” or “pilot-test fees,” which are often employed as bootstrap financing vehicles
but do not advance the business objective. In the rare cases of business models based on licensing, forging
technology-licensing deal(s) is considered commercialization. Commercialized ventures are those whose
products and/or services have received validation from customers.
We also collect data on two additional entrepreneurial milestones to measure the progress of each ven-
ture. We consider a venture to be launched if at least one of its founding entrepreneurs has ever pursued it
full-time. This definition excludes cases in which entrepreneurs pursue a venture part-time while attending
school or holding a job. We also measure whether a venture has ever received funding from angel investors
and/or venture capitalists. We exclude crowdfunding, government grants, and investments by friends and
family from our definition, since the criteria and purposes of such funding channels vary widely. Collec-
tively, these measures portray the growth and impact of a venture idea. VMS tracks ventures’ receipt of
funding; we hand-collected the other data using VMS’s archives and internet searches.
Because we aim to determine how far a venture has progressed to date, our outcomes do not necessarily
describe its current status. Instead, our outcomes are intended to capture a venture’s potential economic im-
pact. Survival metrics do not measure venture performance effectively, since they are apt to be driven by the
venture’s underlying technology or industry of the venture; for instance, life-science ventures tend to take
longer to fail than web-services ventures (Arora & Nandkumar, 2011). Some newer ventures were still pur-
suing intermediate milestones in summer 2014 when we collected outcome data. This censoring may cause
our data to underestimate the likelihood that ventures in our sample eventually reach commercialization,
biasing against finding a positive relationship between initial mentor interest and commercialization.
In our sample, 46.5 percent of ventures launched, 18.6 percent raised funding from professional in-
vestors, and 22.4 percent ultimately commercialized (see Table 1). The ventures have raised over $621
million in venture-capital financing and $84.8 million from angel investors. Notably, of the 144 ventures
that reached commercialization, 71 did so without funding from professional investors.24 Overall, these
numbers suggest that the venture ideas observed in our data are generally serious endeavors and not recre-
ational pursuits.
24Some ventures may not seek venture financing to avoid diluting equity. Instead, they rely on bootstrapping, personal finances,friends and family, small grants, one-off consulting services, and/or business-plan competitions.
14

4 Initial Mentor Interest and Subsequent Venture Commercialization
4.1 Regression Specification
Figure 2 shows that, without any controls, venture ideas that are eventually commercialized are likely to
elicit greater initial interest from mentors. To formally estimate the relationship, we use the following
specification:
Pr(COMMERCIALIZAT IONi) = α+βMENTOR_INT EREST i
+γ
{DMENTOR_RECUR
i ,DMEET INGSi
}+δ
{DSTART_Y EAR
i ,DSTART_MONT Hi ,Controlsi
}+ εi (1)
where i denotes a venture and MENTOR_INTEREST is either the proportion or the count of active mentors
who express initial interest in a venture idea as discussed in Sections 3.3.
To control for the effects of venture age and seasonality, we include dummies for the year and the month
that a venture joins VMS. Some venture characteristics, such as industry sector or underlying technological
intensity, could drive both mentor interest and commercial viability. We thus include a rich set of controls to
determine whether mentors can accurately evaluate a venture’s commercial viability beyond picking up on
these characteristics. We control for variables that reflect the underlying business proposition by including
whether the venture is based on academic research, whether it possesses intellectual property when it joins
VMS, and dummies for its industry sector. We control for the venture’s stage of development by including
a dummy on whether it has a legal business entity (that is, whether it is incorporated) at the time of entry.
We further control for the entrepreneur’s characteristics by including whether he or she is an MIT student or
alumnus and whether he or she has been previously mentored by VMS.25
The key coefficient of interest is β, which measures whether a venture idea that attracts more mentor
interest in its initial form is more likely to be commercialized in the future. The main identification concern
is whether aggregate mentor interest directly affects a venture’s growth and outcomes. It could theoretically
do so in two ways. First, mentor interest could affect the degree of mentoring that a venture receives from
VMS. As discussed in Section 2, this is unlikely given the educational focus and institutional structure of
VMS. Second, mentor interest could alter entrepreneurs’ and mentors’ behavior. This too is unlikely, since
25VMS does not systematically record further information about the entrepreneurs at the time of venture enrollment.
15

neither ventures nor mentors receive information on aggregate mentor interest. Nevertheless, we control
for venture mentor interactions as discussed in Section 3.4. To capture the possible nonlinear effect of
mentoring, we use tercile dummies for the number of mentors who have met with the venture at least twice
and for the number of meetings that a venture has had at VMS.26
4.2 Main Results
In Table 4, Columns (1)-(6) present the OLS estimates of Equation (1) with increasing levels of controls and
robust standard errors clustered by venture sector and year of affiliation with VMS.27 Column (1) shows that,
controlling only for the starting year and month, a venture that elicits more initial interest from mentors when
it first joins VMS is more likely to subsequently commercialize. The magnitude of the coefficient estimate is
economically important and statistically significant at the 1 percent level. A one-standard-deviation increase
in the proportion of active mentors expressing interest, which is 2.68 percentage points, implies on average
a 5.36-percentage-point increase in the probability of recurring revenue and expenses, or a 23.9 percent
increase over the baseline probability of 22.4 percent.
Columns (1) through (3) show how the estimated relationship between mentor interest and commercial-
ization changes with the inclusion of additional controls for observed venture and entrepreneur character-
istics at the time of enrollment. Column (2) controls for characteristics of the venture observed when it
joins VMS, including whether it is based on academic research, whether it possesses intellectual property,
whether it is a legal business entity, and its industry sector. The coefficient estimate on mentor interest
remains positive and significant, although the magnitude decreases from 0.020 to 0.015. Consistent with
our field interviews, this decrease in the coefficient estimate shows that mentors do not express interest
randomly. Their evaluations are based, at least in part, on observed venture characteristics that positively
predict commercial viability. Adding controls for characteristics of the entrepreneur in column (3) only
slightly decreases the magnitude of the coefficient estimate to 0.014, suggesting that mentors base their in-
terest more heavily on the underlying business idea than on the entrepreneur’s characteristics. This is inline
with mentors observing only limited information about the entrepreneur. Importantly, the magnitude of the
coefficient estimate remains economically important and is statistically significant at the 5 percent level.
26See Table A.2 on the breakdown of the variable values. The base group for the former includes ventures that have not hadrepeated interactions with any mentors and the base group for the latter includes ventures that have met with VMS mentors at mostonce.
27See Table A.3 in the Appendix for the estimates from probit and logit specifications, which are nearly identical.
16

Columns (4)-(6) include additional controls on venture mentor interactions. Columns (4) and (5) add
the controls linearly; column (6) uses dummy variables to capture nonlinear effects. Because the number
of mentors with whom a venture’s entrepreneur(s) have met at least twice and the number of meetings they
have had with VMS mentors have a high correlation of 0.76, columns (4) and (5) estimate their linear ef-
fects separately. Both variables have weak and insignificant relationships with the venture’s likelihood of
commercialization. Note that these results do not suggest that mentoring has no effect on a venture’s devel-
opment: entrepreneurs may be more likely to seek assistance both when the venture is struggling and when
it is growing rapidly. Consistent with the institutional setting, including the venture mentor interactions has
negligible impact on our key coefficient estimate on aggregate mentor interest, other coefficient estimates,
and R2.
Our preferred specification is column (6). After controlling for venture and entrepreneur characteristics
at entry and the degree of mentoring at the extensive margin, the proportion of active mentors expressing
initial interest in a venture has an economically meaningful, positive, and statistically significant relationship
with its likelihood of commercialization. All else equal, a venture that attracts a one-standard-deviation (or
2.68 percentage point) higher degree of interest is on average 3.75 percentage points (or 16.75 percent) more
likely to reach commercialization. The relationship is statistically significant at the 5-percent level.
To show that the outliers eliciting extremely high or low mentor interest are not driving our results,
column (7) excludes the venture ideas that attracted the top or bottom 5 percent in aggregate mentor interest;
and the estimated relationship between mentor interest and likelihood of commercialization becomes even
stronger. Column (8) uses the number of mentors expressing interest, instead of the proportion measure
used previously, and yields the same finding qualitatively and quantitatively as column (6). A one-standard-
deviation increase in the count of mentor interest implies on average a 3.83 percentage point (or 17.10
percent) increase in the likelihood of commercialization. Table A.3 in the Appendix shows that the OLS,
probit, and logit estimates of the preferred specification using both measures of aggregate mentor interest
are nearly identical.
4.3 Robustness Checks
Although our main specification controls for the frequency of venture mentor interactions, it does not control
for variations in mentor engagement or the quality of matching between ventures and mentors. This section
addresses this topic with several robustness checks.
17

4.3.1 Controlling for Variations in Mentor Engagement
Table 5 uses three tests to show that systematic variations in mentor engagement are unlikely to drive the
relationship between mentor interest and venture outcome. In columns (1) and (2), we measure aggregate
mentor interest as the proportion or count of mentors who express initial interest but never meet with the
venture. These mentors have thus not had a chance to directly influence the development of the venture.
Using more restrictive measures of aggregate mentor interest yields coefficient estimates and standard errors
almost identical to columns (6) and (8) in Table 4. Thus our key findings are not driven by mentors who
express interest, meet with the venture, and may thus be particularly engaged with it.
In columns (3) and (4), we investigate the role of mentor-team recruitment. When an insufficient number
of mentors expresses interest in working with a venture, VMS formally recruits another mentor and/or
member of the staff to complete the mentor team. Though contrary to VMS principles, it is conceivable
that recruited mentors are less engaged than those who expressed initial interest, and as a result discourage
entrepreneurs from engaging with VMS and/or pursuing the venture. We show that this is not the case: the
relationship between aggregate mentor interest and commercialization remains unchanged when we include
only the ventures that elicited initial interest from more than four mentors—the maximum initial mentor
team size—and therefore did not need recruited mentors.
Mentor engagement may vary for a variety of other reasons. Thus in columns (5) and (6) of Table 5
we restrict our empirical analysis to ventures that have had limited interactions with mentors—that is, those
that have had two or fewer meetings with mentors and no repeated interactions with an individual mentor.
Examining only these 259 ventures yields results similar to those generated by the full sample. Unreported
regressions show that the results in columns (3)-(6) of Table 5 also hold if we use the more restrictive
measures of aggregate mentor interest from columns (1) and (2)—that is, the proportion or count of mentors
who express initial interest but never meet with the venture.
4.3.2 Controlling for Variations in Mentor Matching
The quality of matching between the initial mentor team and the venture may also vary based on aggregate
mentor interest. Namely, ventures that elicit more interest may be matched to higher-quality mentors, given
more mentors to select among. This is unlikely to occur systematically because matching at VMS is de-
termined by many factors as discussed previously. Nevertheless, we rule out this explanation directly by
18

controlling for the heterogeneous effects that mentors may have on ventures’ development using data at the
venture mentor pairing level:
Pr(COMMERCIALIZAT IONi) = α+βINT EREST i,m +ξMi,m
+δ
{DSTART_Y EAR
i ,DSTART_MONT Hi ,Controlsi
}+ εi,m (2)
where i denotes a venture, m denotes a mentor, and each observation is a pairing between the two. For
each venture, we only include the pairings with mentors who were active at the time of venture entry.
INT EREST i,m is 1 if mentor m expresses interest in venture i, and Mi,m is a set of 251 (the number of
mentors ever active during our sample period) dummies that equal 1 if mentor m has met with venture i.
The mentor meeting dummies Mi,m control for the heterogeneous effects that meeting with a mentor could
have on a venture’s probability of commercialization. We include controls for venture and entrepreneur
characteristics and timing of entry to VMS as included in Equation (1) and defined previously. As in the
case of the main specification, the key coefficient of interest is β, which measures whether a venture idea
that attracts more initial mentor interest is more likely to be commercialized in the future.
Table 6 presents the OLS estimates of Equation (2) with different measures of mentor interest and various
degrees of controls. The standard errors are robust and clustered at the venture level. In columns (1)-(3), the
key independent variable is a dummy that equals 1 if an active mentor expresses initial interest in a venture,
regardless of whether they meet later. Column (1) does not control for any venture mentor interactions; the
specification is thus similar to column (3) in Table 4. Column (2) includes a dummy that equals 1 if the
mentor has met with the venture. The meeting dummy thus captures the average effect of meeting with a
mentor; the effect does not vary by mentor. Column (3) allows the mentors to have heterogeneous effects on
ventures by including the 251 mentor-meeting dummies. In all three specifications, the coefficient estimate
on mentor interest is positive and statistically significant. The estimates on mentor interest in column (2) and
(3) are identical, indicating that controlling for variations in mentor-meeting effects does not affect our main
results. In columns (4)-(6) of Table 6, we repeat the exercise using the more restrictive measure of mentor
interest, which is 1 if the mentor expresses interest in the venture and the pair never meet. The coefficient
estimate on mentor interest remains positive and statistically significant.
This approach does not fully capture the differential effects across mentors and ventures that may occur
due to venture-mentor match quality. A remaining concern is that a venture eliciting more mentor interest
19

may be matched to a mentor team whose skills are particularly well aligned with the venture’s needs, regard-
less of mentor quality. However, it is counter-intuitive to conclude that any remaining variations in venture
mentor fit drive our key results, given that the current controls for venture mentor interactions have a neg-
ligible effect on the relationship between mentor interest and subsequent commercialization. Furthermore,
our results are robust to restricting the sample of analysis to ventures that had only a few interactions with
mentors and where variations in the degree and/or quality of mentoring are more likely to be limited (see
columns (5) and (6) of Table 5).
4.4 Nonlinear Relationship between Mentor Interest and Commercialization
We find that aggregate mentor interest in early-stage venture ideas predicts the likelihood of subsequent
commercialization, and that the relationship is not driven by variations in the degree or quality of mentor-
ing. However, if mentors appear to evaluate the commercial potential of venture ideas simply because a
large quantity of these ideas were clearly not serious ventures, our findings would have little generalizabil-
ity. Because the entrepreneurs in our sample are highly educated and have high opportunity costs, they do
not lightly decide to pursue a venture full-time. We thus use this decision as a minimum threshold to show
that mentors can differentiate among serious entrepreneurial pursuits. Table 7 shows that the relationship
between mentor interest and venture commercialization is strongly positive and statistically significant for
the 303 ventures whose primary entrepreneur pursued the venture full-time.28 Furthermore, as noted previ-
ously, mentors are highly selective in their expressions of interest. If most of the ideas in our sample were
superficial, we would expect the distribution of mentor interest to exhibit a long left tail, signifying very low
interest in many of the ventures. We do not observe this configuration (see Figure 2).29
We next investigate whether mentors distinguish between ideas at the lower and higher ends of the qual-
ity distribution. To do so, we increase the flexibility of our main specification by using dummy variables
for the quintile of mentor interest relative to other ventures in the same sector and plot the coefficient es-
timates in Figure 4. Compared to ventures in the lowest quintile, being in the next two quintiles (between
the 20-percent and 60-percent percentiles) results in similar likelihoods of commercialization, even though
mentor interest varies considerably. (The 60-percent percentile in a given sector interests between 4 to 7
percent of mentors, or 7 to 12 mentors by count). In contrast, the likelihood of commercialization increases
28The entrepreneur’s full-time commitment to the venture usually occurs after joining VMS.29In comparison, Kerr et al. (2014a) find that 64 percent of ventures that sought funding from a group of over 300 angel investors
(Tech Coast Angels) elicited no interest.
20

markedly in the fourth quintile (the 60-80-percent percentiles) and even more in the top quintile. These
patterns suggest that the relationship between mentor interest and venture outcome is driven by ideas that
elicit above-median mentor interest. (Ventures in the top quintile interest on average 8 percent of mentors, or
11.9 mentors by count). Taken together, these findings strongly suggest that mentors recognize high-quality
ideas; they do not merely avoid non-serious ideas.
5 Heterogeneity across Venture Sectors
To this point we have assumed that the relationship between mentor interest and venture outcome is constant
across ventures even though the nature of the ventures’ underlying ideas may vary considerably, particularly
across sectors. Table 2 shows that, compared to other ventures, those in R&D-intensive sectors are more
likely to have documented intellectual capital—to be based on academic research and/or to possess IP at
entry—and to be incorporated when they join VMS. We explore heterogeneity across sectors and estimate:
Pr(Outcomei) = α+β1MENTOR_INT EREST i ∗ (RD_SECTORi = 1)
+β2MENTOR_INT EREST i ∗ (RD_SECTORi = 0)
+γ(Controls)i + εi (3)
where we use the same controls as in our preferred specification reported in column (6) of Table 4. Thus β1
measures the relationship between mentors’ initial interest and the venture’s outcome for ventures in sectors
characterized by intensive R&D, and β2 measures the same relationship for ventures in other sectors. The
R&D-intensive sectors in our sample are hardware, energy, and life sciences and medical devices. We report
the results using only the proportion of active mentors who express interest as the key variable; the results
using the count are nearly identical.
Column (1) in Table 8 reports that the relationship between initial mentor interest and subsequent com-
mercialization is particularly strong for ventures in R&D-intensive sectors. For ventures in other sectors, the
coefficient estimate for aggregate mentor interest is weak and insignificant. To investigate the significance
of documented intellectual capital and having a legal business entity, columns (2) to (4) restrict the analysis
to ventures in R&D-intensive sectors. Among such ventures, aggregate mentor interest has a stronger and
highly significant relationship for ventures that are based on academic research or possess IP at entry than
21

those without. In contrast, having a legal business entity at entry weakens the predictive power of mentor in-
terest. The results suggest that the predictive power of mentor interest is the strongest among unincorporated
venture ideas with documented intellectual capital in R&D-intensive sectors
One explanation for the divergence of our findings across sectors is that for ventures with clear intellec-
tual capital in R&D-intensive sectors, the initial idea is more likely to match the business proposition that
is eventually commercialized and thus mentors’ evaluation more consistently accords with the outcome.
Ventures that draw on specific intellectual capital are by their nature more limited in the range of experi-
mentation they can undertake. This observation is consistent with the finding of Kaplan et al. (2009) that
a venture’s intellectual assets (measured by patents and other types of intellectual property) stay relatively
stable between the business-plan stage and the eventual initial public offering. In contrast, entrepreneurs
in non-R&D-intensive sectors, such as consumer web and mobile, enjoy much lower costs of experimenta-
tion. They are more likely to conduct rapid repeated iterations of experiments to gather information and to
adapt accordingly, sometimes completely changing their focus (Kerr et al. , 2014b; Nanda & Rhodes-Kropf,
2015). Our findings highlight the differences between firms centered around different types of critical re-
sources (Rajan & Zingales, 2001a,b) and signify that intellectual capital is a critical resource for early-stage
ventures in R&D-intensive sectors.
That mentors can accurately evaluate the commercial potential of ventures with a strong technological
component is not at odds with the argument of Rosenberg (1996) that new technologies face a high degree
of uncertainty regarding the feasibility and applications of their technologies, as well as development of and
access to complementary technologies. Rosenberg’s discussion is particularly relevant to the rare revolu-
tionary technologies that have created new industries and changed the entire economy (e.g., telephone and
computer). The new technologies in our sample are typically less radical and thus characterized by a more
limited degree of uncertainty. This does not mean that the technological ventures in our sample are unrep-
resentative of technological ventures in other entrepreneurial settings, or that they promise only incremental
economic value. In Table 9, we consider raising a large sum in angel and/or VC financing as an alterna-
tive outcome. Columns (A1) and (A2) show that, among the ventures in R&D-intensive sectors, aggregate
mentor interest is positively and significantly correlated with the probabilities of raising over $1 million and
over $5 million in angel/VC funding. Thus, mentor interest also predicts a high valuation with professional
investors. Mentors and investors may apply similar criteria when identifying ideas with high commercial
potential, but it is not the case that mentors are simply predicting the preferences of investors. Columns
22

(A3) and (A4) in Table 9 show that aggregate mentor interest is positively and significantly correlated with
raising venture financing and becoming commercialized, but exhibits a weak and nonsignificant relationship
with raising venture financing without becoming commercialized.30 Panel B in Table 9 shows that the same
findings hold if we include only ventures in R&D-intensive sectors pursued by an entrepreneur full-time.
Beyond demonstrating the economic value of these ideas, Table 9 also provides suggestive evidence that
investors are allocating resources to venture ideas with greater likelihood of commercialization.31 However,
similar to Kerr et al. (2014a) and Kerr et al. (2014b), in unreported regressions we find no evidence that
the ex-ante assessment of venture ideas predicts commercial viability conditional on receiving angel or VC
funding.32 The funded ventures in our sample may have less variation in their potential for commercial-
ization than those pursued by an entrepreneur full-time. This could be due to decision makers’ effective
evaluation across their set of ventures and/or entrepreneurs’ selection into seeking venture financing,33 but
distinguishing between the two is beyond the scope of this paper.
6 Heterogeneity across Mentors
We show that it is possible to use succinct summaries of business ideas to predict the future commercial
viability of ventures with clear intellectual capital in R&D-intensive sectors (hardware, energy, and life
sciences). This section investigates why mentors are able to evaluate such venture ideas effectively. Given
the wide variety of mentors’ industry and educational backgrounds (Table 3), the majority of the mentors
who evaluate a given venture do not possess relevant industry expertise. Thus two types of mentors evaluate
a venture (a given mentor could belong to either type, depending on the nature of the venture): a small
group with considerable experience in the venture’s industry, and a large group without such experience
who possess general entrepreneurial skills and knowledge. To examine the degree to which each group
drives our main results, we estimate:
Pr(Outcomei, j) = α+β1MENTOR_INT EREST i, j +β2MENTOR_INT EREST i,− j
+γ(Controls)i + εi (4)
30Of the funded ventures in R&D-intensive sectors, 40 percent have not commercialized.31However, since we do not observe entrepreneurs’ choice to raise funding, the results are not conclusive evidence.32We estimate Equation (1) within the sample of ventures funded by professional investors; the coefficient estimate on mentor
interest is weak and insignificant.33For instance, the decision to raise external financing may be influenced by asymmetric information or perceptions of market
competition (Chan, 1983; Amit et al. , 1990; Eckhardt et al. , 2006).
23

where j is the venture’s sector, MENTOR_INT EREST i, j is the proportion of mentors from sector j ex-
pressing initial interest in venture i, and MENTOR_INT EREST i,− j is the proportion of mentors not from
sector j expressing initial interest. We use the same set of controls as in our preferred specification (column
(6) of Table 4). Based on Section 5, we restrict the sample of analysis to ventures in R&D-intensive sectors.
We first define MENTOR_INT EREST i, j to include mentors whose primary sector is j. Column (1) in
Table 10 reports the coefficient estimates. Interest on the part of mentors whose primary sector matches the
venture’s has a small, negative, and insignificant relationship with the likelihood of commercialization. In
contrast, interest from mentors in other sectors has a strong, positive, and highly significant relationship with
the likelihood of commercialization. An F-test rejects the null hypothesis that the two coefficients are the
same at the 1-percent level with an F-statistic of 12.43. On average, the ventures in the regression sample
are evaluated by 29.8 mentors in the same sector and 110.1 mentors in other sectors. The differences in
the coefficient estimates are thus consistent with two possible explanations: that mentors are more adept at
evaluating ventures in sectors outside their own primary areas of expertise, and that having a large number
of independent evaluators increases the efficacy of evaluation overall.
We next relax the definition of MENTOR_INT EREST i, j to include mentors with any experience at
all in sector j. Doing so results in more numerically balanced groups: the average number of mentors
with at least some relevant experience in a venture’s sector is 73.5; the average number without any relevant
experience is 66.4. Column (2) in Table 10 shows that interest from mentors without any relevant experience
still positively and significantly predicts venture commercialization, although the magnitude of the estimate
is smaller than in column (1). Unlike in column (1), interest from mentors with at least some relevant
experience has a small and positive relationship with venture outcome, and the F-test does not reject the null
hypothesis that the two coefficient estimates representing these balanced groups are the same.
Finally, we categorize mentors by whether or not they possess a doctoral degree (Ph.D. or M.D.). On
average, ventures in R&D-intensive sectors were evaluated by 30.5 mentors with doctoral degrees and 109.4
mentors without such a degree, although roughly half had obtained a masters degree. As in column (1), in
column (3) we find that the estimate on mentor interest is large, positive, and significant among mentors
without a doctoral degree and weak and insignificant among mentors with a doctoral degree.
Table 10 thus shows that expertise or experience in the industry of the venture being evaluated is not
a critical factor in mentors’ collective ability to differentiate venture ideas; neither is extensive specialized
training and knowledge in science and technology. These results do not imply that specialized expertise or
24

knowledge makes a mentor worse at evaluating entrepreneurial ideas. Instead the results provide suggestive
evidence that aggregating the evaluations of a large group reduces the noise and bias of individual evaluation.
This finding is consistent with prior studies on voting, committee decision making, and crowd funding
(Klevorick et al. , 1984; Sah & Stiglitz, 1988; Li et al. , 2001; Li & Suen, 2004; Mollick & Nanda, 2014).
7 Conclusion
Although early-stage business ideas are rudimentary in nature and incorporate many assumptions, we find
that they contain pertinent information on the ventures’ eventual commercial viability. In collaboration with
MIT’s Venture Mentoring Service, we collected and examined detailed data on 652 early-stage venture ideas
across a wide range of industry sectors. The venture ideas that elicited more positive evaluations from a large
number of skilled practitioners in the Greater Boston entrepreneurship and technology communities were
significantly more likely to ultimately reach commercialization. This relationship is strong for ventures
in industries requiring intensive research and development but weak for ventures in non-R&D-intensive
industries. We further show that this result is not driven by mentors’ industry-specific or scientific expertise,
but instead by aggregating the subjective evaluations of a large and diverse set of experienced entrepreneurs
and executives.
Our results suggest that firms in different sectors form around distinct critical resources at early stages.
Ventures in R&D-intensive sectors are more likely to form around intellectual capital than ventures in non-
R&D-intensive sectors. This may enable evaluators to assess the commercial potential of the underlying
business ideas at early stages because the venture idea is tied to relatively stable intellectual capital and
unlikely to change drastically. In contrast, ventures in non-R&D-intensive sectors may be more likely to
form around entrepreneurs’ human capital, giving entrepreneurs more freedom to adapt and change the
business ideas. In these sectors, it may be particularly prudent to carefully assess the capability of the
entrepreneurs in addition to the viability of the business propositions.
That business propositions in R&D-intensive sectors can be used to assess commercial viability does not
imply that entrepreneurs are inconsequential. On the contrary, because the knowledge required to innovate
has become more costly to obtain (Jones, 2009), eliciting useful information on the commercial viability
of early-stage venture ideas allows entrepreneurs in R&D-intensive sectors to better allocate their valuable
human capital. Such information may also be helpful because entrepreneurs tend not to make optimal
25
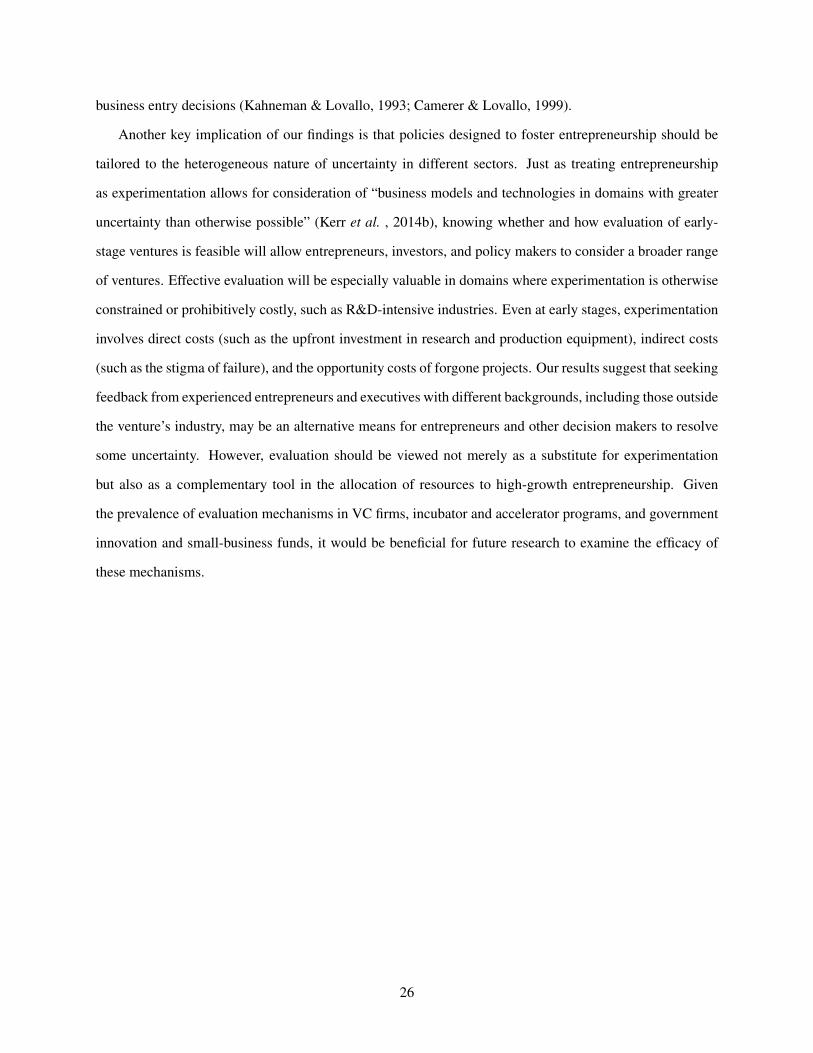
business entry decisions (Kahneman & Lovallo, 1993; Camerer & Lovallo, 1999).
Another key implication of our findings is that policies designed to foster entrepreneurship should be
tailored to the heterogeneous nature of uncertainty in different sectors. Just as treating entrepreneurship
as experimentation allows for consideration of “business models and technologies in domains with greater
uncertainty than otherwise possible” (Kerr et al. , 2014b), knowing whether and how evaluation of early-
stage ventures is feasible will allow entrepreneurs, investors, and policy makers to consider a broader range
of ventures. Effective evaluation will be especially valuable in domains where experimentation is otherwise
constrained or prohibitively costly, such as R&D-intensive industries. Even at early stages, experimentation
involves direct costs (such as the upfront investment in research and production equipment), indirect costs
(such as the stigma of failure), and the opportunity costs of forgone projects. Our results suggest that seeking
feedback from experienced entrepreneurs and executives with different backgrounds, including those outside
the venture’s industry, may be an alternative means for entrepreneurs and other decision makers to resolve
some uncertainty. However, evaluation should be viewed not merely as a substitute for experimentation
but also as a complementary tool in the allocation of resources to high-growth entrepreneurship. Given
the prevalence of evaluation mechanisms in VC firms, incubator and accelerator programs, and government
innovation and small-business funds, it would be beneficial for future research to examine the efficacy of
these mechanisms.
26

References
Aghion, Philippe, & Howitt, Peter. 1992. A Model of Growth Through Creative Destruction. Econometrica,60(2), 323–351.
Amit, Raphael, Glosten, Lawrence, & Muller, Eitan. 1990. Entrepreneurial Ability, Venture Investments,and Risk Sharing. Management Science, 36(10), 1232–1245.
Arora, Ashish, & Nandkumar, Anand. 2011. Cash-Out or Flameout! Opportunity Cost and EntrepreneurialStrategy: Theory, and Evidence from the Information Security Industry. Management Science, 57(10),1844–1860.
Arrow, Kenneth. 2012. The Economics of Inventive Activity over Fifty Years. Pages 43–48 of: The Rateand Direction of Inventive Activity Revisited. University of Chicago Press.
Astebro, Thomas, & Elhedhli, Samir. 2006. The Effectiveness of Simple Decision Heuristics: ForecastingCommercial Success for Early-Stage Ventures. Management Science, 52(3), 395–409.
Baum, Joel A. C., & Silverman, Brian S. 2004. Picking winners or building them? Alliance, intellectual,and human capital as selection criteria in venture financing and performance of biotechnology startups.Journal of Business Venturing, 19(3), 411–436.
Bergemann, Dirk, & Hege, Ulrich. 1998. Venture capital financing, moral hazard, and learning. Journal ofBanking & Finance, 22(6-8), 703–735.
Bergemann, Dirk, & Hege, Ulrich. 2005. The Financing of Innovation: Learning and Stopping. The RANDJournal of Economics, 36(4), 719–752.
Bernstein, Shai, Korteweg, Arthur, & Laws, Kevin. 2014. Attracting Early Stage Investors: Evidence froma Randomized Field Experiment. Working Paper.
Bhattacharya, Sudipto, Chatterjee, Kalyan, & Samuelson, Larry. 1986. Sequential Research and the Adop-tion of Innovations. Oxford Economic Papers, 38(Nov.), 219–243.
Bhide, Amar V. 2003. The Origin and Evolution of New Businesses. OUP USA.
Camerer, Colin, & Lovallo, Dan. 1999. Overconfidence and Excess Entry: An Experimental Approach.American Economic Review, 89(1), 306–318.
Chan, Yuk-Shee. 1983. On the Positive Role of Financial Intermediation in Allocation of Venture Capital ina Market with Imperfect Information. The Journal of Finance, 38(5), 1543–1568.
Chubin, Daryl E., & Hackett, Edward J. 1990. Peerless Science: Peer Review and U. S. Science Policy.SUNY Press.
Cohen, Susan, & Hochberg, Yael V. 2014. Accelerating Startups: The Seed Accelerator Phenomenon.
Cole, S., Cole, J. R., & Simon, G. A. 1981. Chance and consensus in peer review. Science (New York, N.Y.),214(4523), 881–886.
Decker, Ryan, Haltiwanger, John, Jarmin, Ron, & Miranda, Javier. 2014. The Role of Entrepreneurship inUS Job Creation and Economic Dynamism. The Journal of Economic Perspectives, 28(3), 3–24.
27

Eckhardt, Jonathan T., Shane, Scott, & Delmar, Frederic. 2006. Multistage Selection and the Financing ofNew Ventures. Management Science, 52(2), 220–232.
Ewens, Michael, Nanda, Ramana, & Rhodes-Kropf, Matthew. 2015. Entrepreneurship and the Cost ofExperimentation. Harvard Business School Working Paper, No. 15-070, July.
Fafchamps, Marcel, & Woodruff, Christopher. 2014 (Apr.). Identifying Gazelles: Expert panels vs. surveysas a Means to Identify Firms with Rapid Growth Potential.
Fleming, Lee. 2001. Recombinant Uncertainty in Technological Search. Management Science, 47(1), 117–132.
Fleming, Lee, & Sorenson, Olav. 2004. Science as a map in technological search. Strategic ManagementJournal, 25(8-9), 909–928.
Goetzmann, William N., Ravid, S. Abraham, & Sverdlove, Ronald. 2012. The pricing of soft and hardinformation: economic lessons from screenplay sales. Journal of Cultural Economics, 37(2), 271–307.
Gorman, Michael, & Sahlman, William. 1989. What Do Venture Capitalists Do? Journal of BusinessVenturing, 4(4), 231–248.
Hall, Robert E., & Woodward, Susan E. 2010. The Burden of the Nondiversifiable Risk of Entrepreneurship.The American Economic Review, 100(3), 1163–1194.
Hallen, Benjamin, Bingham, Chris, & Cohen, Susan. 2014. Do Accelerators Accelerate? A Study of VentureAccelerators as a Path to Success.
Haltiwanger, John, Jarmin, Ron S., & Miranda, Javier. 2012. Who Creates Jobs? Small versus Large versusYoung. Review of Economics and Statistics, 95(2), 347–361.
Hastings, Daniel, Lerman, Steven, & Parker, Melanie. 2010. The Demand for MIT Graduates. MIT FacultyNewsletter, XXII(3).
Hellmann, Thomas, & Puri, Manju. 2002. Venture Capital and the Professionalization of Start-Up Firms:Empirical Evidence. The Journal of Finance, 57(1), 169–197.
Howell, Sabrina. 2014. Financing Constraints as Barriers to Innovation: Evidence from R&D Grants toEnergy Startups.
Hsu, David H. 2004. What Do Entrepreneurs Pay for Venture Capital Affiliation? The Journal of Finance,59(4), 1805–1844.
Jensen, Richard. 1983. Innovation adoption and diffusion when there are competing innovations. Journalof Economic Theory, 29(1), 161–171.
Jones, Benjamin F. 2009. The Burden of Knowledge and the "Death of the Renaissance Man": Is InnovationGetting Harder? The Review of Economic Studies, 76(1), 283–317.
Jones, Charles I. 1995. R & D-Based Models of Economic Growth. Journal of Political Economy, 103(4),759–784.
Kahneman, Daniel, & Lovallo, Dan. 1993. Timid Choices and Bold Forecasts: A Cognitive Perspective onRisk Taking. Management Science, 39(1), 17–31.
28

Kaplan, Steven N, Sensoy, Berk A., & Stromberg, Per. 2009. Should investors bet on the jockey or thehorse? Evidence from the evolution of firms from early business plans to public companies. The Journalof Finance, 64(1), 75–115.
Kerr, William R., Lerner, Josh, & Schoar, Antoinette. 2014a. The Consequences of Entrepreneurial Finance:Evidence from Angel Financings. Review of Financial Studies, 27(1), 20–55.
Kerr, William R., Nanda, Ramana, & Rhodes-Kropf, Matthew. 2014b. Entrepreneurship as Experimentation.Journal of Economic Perspectives, 28(3), 25–48.
Klevorick, Alvin K., Rothschild, Michael, & Winship, Christopher. 1984. Information processing and jurydecisionmaking. Journal of Public Economics, 23(3), 245–278.
Knight, Frank H. 1921. Risk, uncertainty and profit. Boston, MA: Houghton Mifflin Company.
Kornish, Laura J., & Ulrich, Karl T. 2014. The Importance of the Raw Idea in Innovation: Testing the Sow’sEar Hypothesis. Journal of Marketing Research, 51(1), 14–26.
Lamont, MichÚle. 2009. How Professors Think. Harvard University Press.
Lerner, Josh. 1995. Venture Capitalists and the Oversight of Private Firms. Journal of Finance, 50(1),301–318.
Lerner, Josh. 1999. The Government as Venture Capitalist: The Long-Run Impact of the SBIR Program.The Journal of Business, 72(3), 285–318.
Li, Danielle, & Agha, Leila. 2015. Big names or big ideas: Do peer-review panels select the best scienceproposals? Science, 348(6233), 434–438.
Li, Hao, & Suen, Wing. 2004. Delegating Decisions to Experts. Journal of Political Economy, 112(S1),S311–S335.
Li, Hao, Rosen, Sherwin, & Suen, Wing. 2001. Conflicts and Common Interests in Committees. TheAmerican Economic Review, 91(5), 1478–1497.
Luo, Hong. 2014. When to Sell Your Idea: Theory and Evidence from the Movie Industry. ManagementScience, 60(12), 3067–3086.
Manso, Gustavo. 2011. Motivating Innovation. The Journal of Finance, 66(5), 1823–1860.
Mollick, Ethan, & Nanda, Ramana. 2014. Wisdom or Madness? Comparing Crowds with Expert Evaluationin Funding the Arts. Harvard Business School Working Paper, No. 14-116, June.
Moscarini, Giuseppe, & Smith, Lones. 2001. The Optimal Level of Experimentation. Econometrica, 69(6),1629–1644.
Nanda, Ramana, & Rhodes-Kropf, Matthew. 2015. Financing Entrepreneurial Experimentation. In: Inno-vation Policy and the Economy, Volume 16. University of Chicago Press.
National Science Foundation. 2006. Science and Engineering Indicators.
Nelson, Richard R. 1961. Uncertainty, Learning, and the Economics of Parallel Research and DevelopmentEfforts. The Review of Economics and Statistics, 43(4), 351–364.
29

Qian, Yingyi, & Xu, Chenggang. 1998. Innovation and Bureaucracy under Soft and Hard Budget Con-straints. The Review of Economic Studies, 65(1), 151–164.
Rajan, Raghuram G. 2012. Presidential Address: The Corporation in Finance. The Journal of Finance,67(4), 1173–1217.
Rajan, Raghuram G., & Zingales, Luigi. 2001a. The Firm As A Dedicated Hierarchy: A Theory Of TheOrigins And Growth Of Firms. The Quarterly Journal of Economics, 116(3), 805–851.
Rajan, Raghuram G., & Zingales, Luigi. 2001b. The Influence of the Financial Revolution on the Nature ofFirms. The American Economic Review, 91(2), 206–211.
Roberts, Edward B., & Eesley, Charles E. 2009. Entrepreneurial Impact: The Role of MIT. Report to theKauffman Foundation, Feb.
Roberts, Kevin, & Weitzman, Martin L. 1981. Funding Criteria for Research, Development, and ExplorationProjects. Econometrica, 49(5), 1261–1288.
Romer, Paul M. 1990. Endogenous Technological Change. Journal of Political Economy, 98(5), S71–S102.
Rosenberg, Nathan. 1992. Economic Experiments. Industrial and Corporate Change, 1(1), 181–203.
Rosenberg, Nathan. 1996. Uncertainty and technological change. In: The Mosaic of Economic Growth.Stanford University Press, Stanford, CA.
Sah, Raaj Kumar, & Stiglitz, Joseph E. 1988. Committees, Hierarchies and Polyarchies. The EconomicJournal, 98(391), 451–470.
Sahlman, William A. 1990. The structure and governance of venture-capital organizations. Journal ofFinancial Economics, 27(2), 473–521.
Shane, Scott. 2000. Prior Knowledge and the Discovery of Entrepreneurial Opportunities. OrganizationScience, 11(4), 448–469.
Stern, Scott. 2005. Economic Experiments: The Role of Entrepreneurship in Economic Prosperity. In:Kauffman Foundation ThoughtBook.
Torrance, Wendy E. F. 2013. Entrepreneurial Campuses: Action, Impact, and Lessons Learned from theKauffman Campuses Initiative. Ewing Marion Kauffman Foundation Research Paper, Aug.
U.S. Department of Commerce. 2013 (Oct.). The Innovative and Entrepreneurial University: Higher Edu-cation, Innovation and Entrepreneurship in Focus.
Weitzman, Martin L. 1979. Optimal Search for the Best Alternative. Econometrica, 47(3), 641–654.
Wernerfelt, Birger. 1984. A resource-based view of the firm. Strategic Management Journal, 5(2), 171–180.
Yu, Sandy. 2015. The Impact of Accelerators on High-Technology Ventures.
Zacharakis, Andrew, & Meyer, G. Dale. 2000. The potential of actuarial decision models: Can they improvethe venture capital investment decision? Journal of Business Venturing, 15(4), 323–346.
Zacharakis, Andrew, & Shepherd, Dean. 2000. The nature of information and overconfidence on venturecapitalists’ decision making. Journal of Business Venturing, 16(4), 311–332.
Zingales, Luigi. 2000. In Search of New Foundations. The Journal of Finance, 55(4), 1623–1653.
30

Tables and Figures
Table 1: Descriptive Statistics of Ventures (N = 652)Definition Mean Std. Dev. Min MaxYear the venture joined VMS 2009.9 1.959 2005 2012Month the venture joined VMS 6.469 3.400 1 12
Venture CharacteristicsSector: Consumer web/mobile 0.279 0.449 0 1Sector: Enterprise software 0.178 0.383 0 1Sector: Hardware 0.147 0.355 0 1Sector: Life sciences/medical devices 0.133 0.340 0 1Sector: Consumer products 0.132 0.339 0 1Sector: Energy 0.058 0.234 0 1Sector: Other 0.072 0.259 0 1Based on academic research 0.155 0.362 0 1Has intellectual property at entry 0.232 0.422 0 1Has a legal business entity at entry 0.169 0.375 0 1
Entrepreneur CharacteristicsPrimary entrepreneur: MIT student 0.383 0.487 0 1Primary entrepreneur: MIT alumnus 0.367 0.482 0 1Primary entrepreneur: MIT postdoc/staff 0.250 0.433 0 1Primary entrepreneur previously mentored by VMS 0.077 0.266 0 1
VMS-Related VariablesProportion of active mentors expressing initial interest (%) 4.447 2.683 0 16.44Number of active mentors expressing initial interest 6.265 3.828 0 20Number of meetings 3.212 3.100 0 21Number of mentors met at least twice 1.724 1.896 0 9
Venture Milestones and OutcomeFull-time entrepreneurial pursuit 0.465 0.499 0 1Receipt of angel/venture-capital funding 0.186 0.389 0 1Commercialization with recurring revenue and expenses 0.224 0.417 0 1
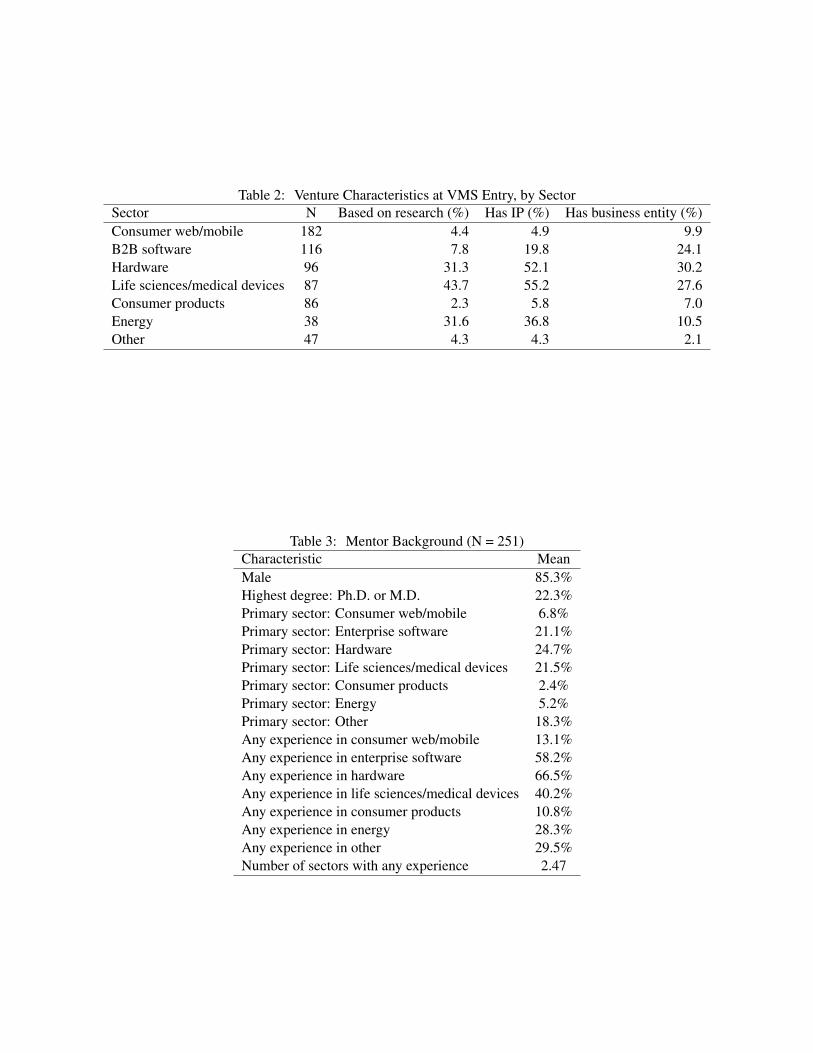
Table 2: Venture Characteristics at VMS Entry, by SectorSector N Based on research (%) Has IP (%) Has business entity (%)Consumer web/mobile 182 4.4 4.9 9.9B2B software 116 7.8 19.8 24.1Hardware 96 31.3 52.1 30.2Life sciences/medical devices 87 43.7 55.2 27.6Consumer products 86 2.3 5.8 7.0Energy 38 31.6 36.8 10.5Other 47 4.3 4.3 2.1
Table 3: Mentor Background (N = 251)Characteristic MeanMale 85.3%Highest degree: Ph.D. or M.D. 22.3%Primary sector: Consumer web/mobile 6.8%Primary sector: Enterprise software 21.1%Primary sector: Hardware 24.7%Primary sector: Life sciences/medical devices 21.5%Primary sector: Consumer products 2.4%Primary sector: Energy 5.2%Primary sector: Other 18.3%Any experience in consumer web/mobile 13.1%Any experience in enterprise software 58.2%Any experience in hardware 66.5%Any experience in life sciences/medical devices 40.2%Any experience in consumer products 10.8%Any experience in energy 28.3%Any experience in other 29.5%Number of sectors with any experience 2.47

Table 4: Estimated Relationships between Aggregate Mentor Interest and Likelihood of Commercialization(1) (2) (3) (4) (5) (6) (7) (8)
Sample Full Full Full Full Full Full Exclude top/bottom 5% FullProportion of active mentors expressing initial interest 0.020*** 0.015** 0.014** 0.014** 0.014** 0.014** 0.020**
(0.006) (0.007) (0.007) (0.007) (0.007) (0.007) (0.007)Number of active mentors expressing initial interest 0.010**
(0.004)Number of mentors met at least twice -0.002
(0.010)Number of meetings 0.003
(0.006)Based on academic research 0.114* 0.115* 0.118* 0.108* 0.110* 0.111 0.110*
(0.060) (0.061) (0.064) (0.064) (0.062) (0.069) (0.062)Intellectual property at entry 0.050 0.053 0.053 0.055 0.055 0.075 0.055
(0.047) (0.046) (0.047) (0.047) (0.049) (0.052) (0.049)Legal business entity at entry 0.324*** 0.320*** 0.322*** 0.316*** 0.318*** 0.347*** 0.318***
(0.054) (0.055) (0.055) (0.054) (0.053) (0.055) (0.053)Dummies for number of mentors met at least twice No No No No No Yes Yes Yes
Dummies for number of meetings No No No No No Yes Yes YesEntrepreneur controls No No Yes Yes Yes Yes Yes Yes
Dummies for sector No Yes Yes Yes Yes Yes Yes YesDummies for year joined VMS Yes Yes Yes Yes Yes Yes Yes Yes
Dummies for month joined VMS Yes Yes Yes Yes Yes Yes Yes YesN 652 652 652 652 652 652 590 652
R2 0.12 0.24 0.25 0.25 0.25 0.25 0.25 0.25
Notes: Coefficients estimated from Linear Probability Model. Standard errors are robust and clustered by venture sector and year of affiliation with VMS. *p < 0.10; **p < 0.05;***p < 0.01. Entrepreneur controls include dummies for the entrepreneur’s MIT affiliation (student or alumnus) and prior mentoring by VMS.

Table 5: Robustness Checks on Estimated Relationships between Aggregate Mentor Interest and Likelihood of Commercialization(1) (2) (3) (4) (5) (6)
Sample Full > 4 mentors expressing interest Limited interactionsProportion of active mentors expressing initial interest 0.018* 0.017*
(0.010) (0.010)Number of active mentors expressing initial interest 0.012* 0.010*
(0.006) (0.006)Proportion of mentors expressing interest & not interacting with the venture 0.015**
(0.007)Number of mentors expressing interest & not interacting with the venture 0.010**
(0.005)N 652 652 421 421 259 259
R2 0.25 0.25 0.24 0.24 0.35 0.35
Notes: Coefficients estimated from Linear Probability Model. Standard errors are robust and clustered by venture sector and year of affiliation with VMS. *p < 0.10; **p < 0.05;***p < 0.01. For columns (5) and (6), the sample consists of ventures that met with VMS mentors twice at most and had no repeat interactions with any mentors. All regressionsinclude whether the venture is based on academic research, whether the venture has intellectual property at entry, whether the venture has a legal business entity at entry, dummies fornumber of mentors met at least twice, dummies for number of meetings, dummies for sector, dummies for year and month of affiliation with VMS, and dummies for the entrepreneur’sMIT affiliation and prior mentoring by VMS.

Table 6: Estimated Relationships between Mentor Interest and Likelihood of Commercialization at theVenture*Mentor Level
(1) (2) (3) (4) (5) (6)Expression of initial interest 0.018** 0.020* 0.020*
(0.008) (0.012) (0.012)Expression of initial interest & no meeting 0.025** 0.025** 0.025**
(0.012) (0.012) (0.012)At least one meeting -0.003 0.013
(0.012) (0.008)Mentor meeting FE No No Yes No No Yes
N 93672 93672 93672 93672 93672 93672R2 0.22 0.22 0.22 0.22 0.22 0.22
Notes: Observation at the venture-mentor level. Coefficients estimated from Linear Probability Model. Standarderrors are robust and clustered by venture. *p < 0.10; **p < 0.05; ***p < 0.01. All regressions include whetherthe venture is based on academic research, whether the venture has intellectual property at entry, whether the venturehas a legal business entity at entry, dummies for sector, dummies for year and month of affiliation with VMS, anddummies for the entrepreneur’s MIT affiliation and prior mentoring by VMS.

Table 7: Estimated Relationships between Aggregate Mentor Interest and Likelihood of Commercialization Conditional on Full-time Entrepreneurs(1) (2) (3) (4)
Sample Entrepreneurs committing full-timeProportion of active mentors expressing initial interest 0.030**
(0.011)Number of active mentors expressing initial interest 0.023**
(0.009)Proportion of mentors expressing interest & not interacting with the venture 0.045***
(0.016)Number of mentors expressing interest & not interacting with the venture 0.032***
(0.011)N 303 303 303 303
R2 0.19 0.20 0.20 0.20
Notes: Coefficients estimated from Linear Probability Model. Standard errors are robust and clustered by venture sector and year of affiliation with VMS. *p < 0.10; **p < 0.05;***p < 0.01. The sample consists of ventures to which the entrepreneurs will commit full-time. All regressions include whether the venture is based on academic research, whetherthe venture has intellectual property at entry, whether the venture has a legal business entity at entry, dummies for number of mentors met at least twice, dummies for number ofmeetings, dummies for sector, dummies for year and month of affiliation with VMS, and dummies for the entrepreneur’s MIT affiliation and prior mentoring by VMS.

Table 8: Estimated Relationships between Aggregate Mentor Interest and Likelihood of Commercialization by Venture Characteristics(1) (2) (3) (4)
Sample Full In hardware/life sciences/energy sectorsMentor interest * in hardware/life sciences/energy sectors 0.021**
(0.010)Mentor interest * in other sectors 0.009
(0.009)
Mentor interest * (based on academic research = 1) 0.045***(0.010)
Mentor interest * (based on academic research = 0) 0.015(0.016)
Mentor interest * (IP at entry = 1) 0.036***(0.009)
Mentor interest * (IP at entry = 0) 0.014(0.018)
Mentor interest * (business entity at entry = 1) 0.010(0.017)
Mentor interest * (business entity at entry = 0) 0.034***(0.011)
N 652 221 221 221R2 0.26 0.26 0.26 0.26
Notes: Coefficients estimated from Linear Probability Model. Standard errors are robust and clustered by venture sector and year of affiliation with VMS. *p < 0.10;**p < 0.05; ***p < 0.01. Mentor interest is measured as the proportion of active mentors expressing initial interest in the venture. All regressions include whether theventure is based on academic research, whether the venture has intellectual property at entry, whether the venture has a legal business entity at entry, dummies for number ofmentors met at least twice, dummies for number of meetings, dummies for sector, dummies for year and month of affiliation with VMS, and dummies for the entrepreneur’sMIT affiliation and prior mentoring by VMS.

Table 9: Estimated Relationships between Aggregate Mentor Interest and Venture FinancingAngel/VC funding Angel/VC funding Angel/VC funding and Angel/VC funding and
Dependent Variable > $1 million > $5 million commercialized not commercializedPanel A: Ventures in hardware/life sciences/energy sectors (N=221)(A1) (A2) (A3) (A4)
Prop. of mentors expressing interest 0.0171* 0.0178* 0.0185* -0.0013(0.0090) (0.0088) (0.0100) (0.0061)
Panel B: Ventures in hardware/life sciences/energy sectors with full-time entrepreneurs (N=131)(B1) (B2) (B3) (B4)
Prop. of mentors expressing interest 0.0301** 0.0328** 0.0309** -0.0059(0.0120) (0.0134) (0.0142) (0.0111)
Notes: Coefficients estimated from Linear Probability Model. Standard errors are robust and clustered by venture sector and year of affiliation with VMS. *p < 0.10;**p < 0.05; ***p < 0.01. All regressions include whether the venture is based on academic research, whether the venture has intellectual property at entry, whether theventure has a legal business entity at entry, dummies for number of mentors met at least twice, dummies for number of meetings, dummies for sector, dummies for year andmonth of affiliation with VMS, and dummies for the entrepreneur’s MIT affiliation and prior mentoring by VMS.

Table 10: Estimated Relationships between Aggregate Mentor Interest and Likelihood of Commercialization by Mentor Expertise(1) (2) (3)
Sample In hardware/life sciences/energy sectorsProp. of interested mentors in the venture’s sector -0.004
(0.004)Prop. of interested mentors in other sectors 0.037***
(0.011)Prop. of interested mentors with some experience in the venture’s sector 0.007
(0.007)Prop. of interested mentors without experience in the venture’s sector 0.017*
(0.010)Prop. of interested mentors with a doctoral degree -0.003
(0.006)Prop. of interested mentors without a doctoral degree 0.031**
(0.012)F-statistic 12.43*** 0.60 4.36*
N 221 221 221R2 0.28 0.25 0.26
Notes: Coefficients estimated from Linear Probability Model. Standard errors are robust and clustered by venture sector and year of affiliation with VMS. *p< 0.10;**p < 0.05; ***p < 0.01. Sample includes ventures in hardware/life sciences/energy sectors. All regressions include whether the venture is based on academicresearch, whether the venture has intellectual property at entry, whether the venture has a legal business entity at entry, dummies for number of mentors met atleast twice, dummies for number of meetings, dummies for sector, dummies for year and month of affiliation with VMS, and dummies for the entrepreneur’s MITaffiliation and prior mentoring by VMS.

Figure 1: Number of Ventures by Year and Month of Joining VMS
03
06
09
01
20
15
01
80
Nu
mb
er
of
Ve
ntu
res
2005 2006 2007 2008 2009 2010 2011 2012Year joined VMS
02
04
06
08
0N
um
be
r o
f V
en
ture
s
1 2 3 4 5 6 7 8 9 10 11 12Month joined VMS

Figure 2: Distribution of Aggregate Mentor Interest
0.0
5.1
.15
Ke
rne
l D
en
sity
0 3 6 9 12 15 18Proportion of active mentors expressing initial interest
All Commercialized
Not commercialized
05
01
00
15
0N
um
be
r o
f V
en
ture
s
0−1 2−3 4−5 6−7 8−9 10−13 >= 14Number of mentors expressing initial interest
Not commercialized Commercialized
Notes: This figure plots the kernel density of the proportion of active mentors who express initial interest in a venture and a histogramof the number of mentors expressing interest.

Figure 3: Raw Relationships between Venture Mentor Interactions and Aggregate Mentor Interest
03
69
12
Num
ber
of m
ento
rs m
et at le
ast tw
ice
0 5 10 15 20Proportion of active mentors expressing initial interest
correlation 0.294
05
10
15
20
Num
ber
of m
eetings
0 5 10 15 20Proportion of active mentors expressing initial interest
correlation 0.164
03
69
12
Num
ber
of m
ento
rs m
et at le
ast tw
ice
0 5 10 15 20Number of active mentors expressing initial interest
correlation 0.210
05
10
15
20
Num
ber
of m
eetings
0 5 10 15 20Number of active mentors expressing initial interest
correlation 0.081
Notes: This figure presents scatter plots of the raw relationships between initial mentor interest and venture mentor interactions for all ventures. Both plotsinclude a linear line of best fit.

Figure 4: Estimated Relationships between Commercialization and Mentor Interest, by Percentiles−
.1−
.05
0.0
5.1
.15
.2.2
5
20−40% 40−60% 60−80% 80−100%By Sector: Percentile Range of Mentor Interest
Coefficient Estimate 95% C.I.
−.1
−.0
50
.05
.1.1
5.2
.25
20−40% 40−60% 60−80% 80−100%By Sector: Percentile Range of Mentor Interest (Count)
Coefficient Estimate 95% C.I.
Notes: This figure presents the parameter estimates and confidence intervals on percentile dummies of initial mentor interest (determined within eachsector).
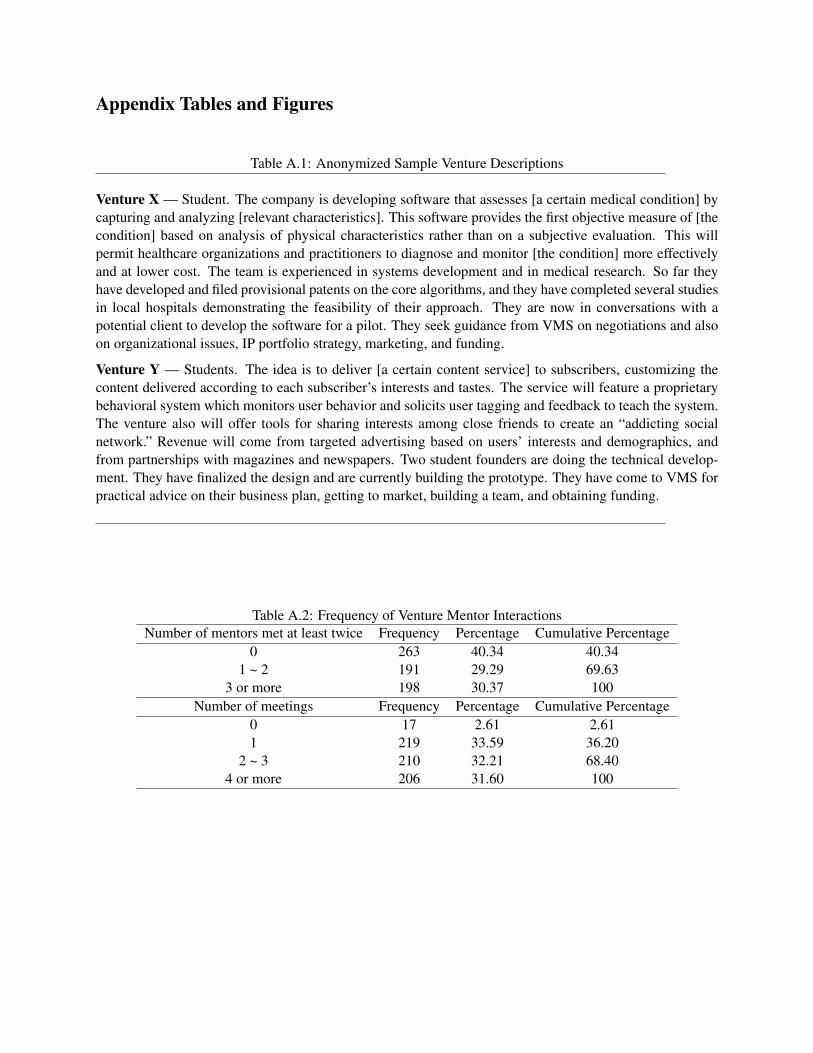
Appendix Tables and Figures
Table A.1: Anonymized Sample Venture Descriptions
Venture X — Student. The company is developing software that assesses [a certain medical condition] bycapturing and analyzing [relevant characteristics]. This software provides the first objective measure of [thecondition] based on analysis of physical characteristics rather than on a subjective evaluation. This willpermit healthcare organizations and practitioners to diagnose and monitor [the condition] more effectivelyand at lower cost. The team is experienced in systems development and in medical research. So far theyhave developed and filed provisional patents on the core algorithms, and they have completed several studiesin local hospitals demonstrating the feasibility of their approach. They are now in conversations with apotential client to develop the software for a pilot. They seek guidance from VMS on negotiations and alsoon organizational issues, IP portfolio strategy, marketing, and funding.
Venture Y — Students. The idea is to deliver [a certain content service] to subscribers, customizing thecontent delivered according to each subscriber’s interests and tastes. The service will feature a proprietarybehavioral system which monitors user behavior and solicits user tagging and feedback to teach the system.The venture also will offer tools for sharing interests among close friends to create an “addicting socialnetwork.” Revenue will come from targeted advertising based on users’ interests and demographics, andfrom partnerships with magazines and newspapers. Two student founders are doing the technical develop-ment. They have finalized the design and are currently building the prototype. They have come to VMS forpractical advice on their business plan, getting to market, building a team, and obtaining funding.
Table A.2: Frequency of Venture Mentor InteractionsNumber of mentors met at least twice Frequency Percentage Cumulative Percentage
0 263 40.34 40.341 ~ 2 191 29.29 69.63
3 or more 198 30.37 100Number of meetings Frequency Percentage Cumulative Percentage
0 17 2.61 2.611 219 33.59 36.20
2 ~ 3 210 32.21 68.404 or more 206 31.60 100

Table A.3: Estimated Relationships between Aggregate Mentor Interest and Likelihood of Commercialization ; LPM/Probit/Logit(1) (2) (3) (4) (5) (6)
LPM Probit Logit LPM Probit LogitProportion of active mentors expressing initial interest (%) 0.014** 0.014** 0.015**
(0.007) (0.006) (0.006)Num. of mentors expressing initial interest 0.010** 0.011*** 0.011***
(0.004) (0.004) (0.004)Based on academic research 0.110* 0.094* 0.091* 0.110* 0.094* 0.092*
(0.062) (0.051) (0.051) (0.062) (0.050) (0.050)Intellectual property at entry 0.055 0.040 0.041 0.055 0.040 0.040
(0.049) (0.040) (0.039) (0.049) (0.040) (0.039)Legal business entity at entry 0.318*** 0.223*** 0.210*** 0.318*** 0.223*** 0.210***
(0.053) (0.032) (0.030) (0.053) (0.032) (0.030)Controls Yes Yes Yes Yes Yes YesN 652 652 652 652 652 652Pseudo R2 0.25 0.23 0.23 0.25 0.23 0.23
Notes: Marginal effects reported. Standard errors are robust and clustered by venture sector and year of affiliation with VMS. *p < 0.10; **p < 0.05; ***p < 0.01. All regressionsinclude dummies for number of mentors met at least twice, dummies for number of meetings, dummies for sector, dummies for year and month of affiliation with VMS, and dummiesfor the entrepreneur’s MIT affiliation and prior mentoring by VMS.

Figure A.1: Overview of the Initial Venture Mentor Pairing Process