Aquifer Analysis Brasil98
49
Parameter Estimation: Aquifer Testing and Analysis Presented by: Nilson Guiguer, Ph.D., President, Waterloo Hydrogeologic, Inc. Prepared by: Gary D. Moore Training Co-ordinator, Waterloo Hydrogeologic, Inc.
-
Upload
gaby-velarde -
Category
Documents
-
view
3 -
download
0
description
Descripcion para analisis de aquifyer
Transcript of Aquifer Analysis Brasil98

Parameter Estimation: Aquifer Testing and Analysis
Presented by: Nilson Guiguer, Ph.D., President, Waterloo Hydrogeologic, Inc.
Prepared by: Gary D. Moore Training Co-ordinator, Waterloo Hydrogeologic, Inc.

© Waterloo Hydrogeologic, Inc. 1999
What is an Aquifer Test?
• A carefully planned and executed scientific field experiment;
• Performed to obtain estimates of aquifer hydraulic properties;
• Uses equations for porous flow and well hydraulics.

© Waterloo Hydrogeologic, Inc. 1999
Methods of Determining Values of Selected Hydraulic Parameters

© Waterloo Hydrogeologic, Inc. 1999
Importance of Correct Aquifer Testing and Analysis
• Data collected properly from a valid aquifer test has the potential to yield valuable information about the hydraulic properties of the aquifer;
• Aquifer properties calculated from valid data are prerequisite to any meaningful calculations involving
the flow system. • Example uses of valid aquifer properties:
– Groundwater supply studies
– Wellhead protection zone delineation
– Contaminant transport simulation
© Waterloo Hydrogeologic, Inc. 1999
Types and Limitations of Pumping Tests
• Tests exist for Unconfined, leaky confined, and confined aquifers conditions;
• Two very common types of tests are pumping tests and single well response tests (slug tests);
• Every aquifer test analysis method has inherent limiting assumptions that must be respected to produce valid results;
• Examples of limitations include: a constant pumping rate, fully penetrating wells, aquifer infinite in extent (no barrier boundaries) and so on.
© Waterloo Hydrogeologic, Inc. 1999
Fundamentals of Well Hydraulics: A Review
• Steady-state and transient flow conditions;– Theim equation (by Adolph Theim, 1887 for
steady-state flow conditions)– Theis equation (by Charles V. Theis, 1935 for
transient flow conditions)

© Waterloo Hydrogeologic, Inc. 1999
Aquifer Test Planning: Pre-test Calculations - Why Perform
them? • You must design a reasonable pumping rate and
(approximate) duration of the test;• You must specify the location and depth of the
pumping and observation wells;• Pre-test calculations can aide you in making
reasonable decisions on the design of your aquifer test;
• Begin with the end in mind.

© Waterloo Hydrogeologic, Inc. 1999
Aquifer Test Planning: Pre-test Calculations: Why Perform them?
(Continued)• Typically, pre-test calculations rely on best estimates
of the aquifer properties and geologic conditions;• These best estimates are used in simple analytical
equations to predict the radius of influence of the pumping well given a certain pumping rate and can yield important information on where to place observation wells to ensure a measurable response in the water level due to pumping.
© Waterloo Hydrogeologic, Inc. 1999
Importance of Pre-test, Water-level Trend Analysis
• What is water-level trend?• Unidirectional variation in water level;
• Due to recharge and discharge from the aquifer resulting in a rise and fall in hydraulic head.
• Collection of per-test, water-level trend data allows the background rise and fall of the water level to be determined;

© Waterloo Hydrogeologic, Inc. 1999
Importance of Pre-test, Water-level Trend Analysis
(Continued) • This information is then used to correct the
observed change in water level resulting from the pumping test using the following equations:
•with discharge S1 = S1-h1;
•with recharge S1 = S1 + h1,
where S1 is the observed water level, and h1 is the water level trend.

© Waterloo Hydrogeologic, Inc. 1999
Processing the Data
• Conversion of data to uniform units;• Correction of the data for unidirectional and
rhythmic fluctuations in water level trend.

© Waterloo Hydrogeologic, Inc. 1999
Aquifer Tests and Their Limitations
Pumping Tests
• Theis
• Cooper & Jacob 1, 2, and 3
• Theis & Jacob Recovery Test
• Neuman
• Hantush
• Well Performance Test
Single-Well Response TestsBouwer and RiceHvorslev

© Waterloo Hydrogeologic, Inc. 1999
Theis
•Confined Aquifer
•Transient Flow

© Waterloo Hydrogeologic, Inc. 1999
Theis (continued)
Limiting assumptions• Confined and infinite extent• Homogenous, isotropic, uniform thickness• Piezometric surface horizontal prior to pumping• Constant pumping rate• Instantaneous decline in head from pumping• Well bore storage negligible

© Waterloo Hydrogeologic, Inc. 1999
Theis(continued)
Data Requirements
• Water-level drawdown versus time data from at least one observation well;
• Distance from observation well to pumping well;
• Pumping well rate.

© Waterloo Hydrogeologic, Inc. 1999
Cooper-Jacob Methods 1, 2, and 3
•Confined aquifers
•Simplification of Theis method
© Waterloo Hydrogeologic, Inc. 1999
Cooper-Jacob Methods 1, 2, and 3
(continued)
Limiting assumptions• Confined and infinite extent• Homogenous, isotropic, uniform thickness• Piezometric surface horizontal prior to pumping• Constant pumping rate• Instantaneous decline in head from pumping• Well bore storage negligible• Values of u are small (<0.01)
© Waterloo Hydrogeologic, Inc. 1999
Cooper-Jacob Methods 1, 2, and 3 (continued)
Data Requirements • Drawdown versus time data from at least one
observation well (three wells for methods 2 and 3);
• Distance from the observation well (s) to the pumping well;
• Pumping rate.

© Waterloo Hydrogeologic, Inc. 1999
Theis & Jacob Recovery Method
•Confined Aquifers
•Recovery data analysis
© Waterloo Hydrogeologic, Inc. 1999
Theis & Jacob Recovery MethodLimiting Assumptions
• Confined and infinite extent;• Homogenous, isotropic, uniform thickness;• Piezometric surface horizontal prior to pumping;• Constant pumping rate;• The well is fully penetrating;• Instantaneous decline in head from pumping• Well bore storage negligible

© Waterloo Hydrogeologic, Inc. 1999
Theis & Jacob Recovery Method
Data Requirements • Recovery versus time data at a pumping well;• Distance from the observation well (s) to the
pumping well;• Pumping duration.
© Waterloo Hydrogeologic, Inc. 1999
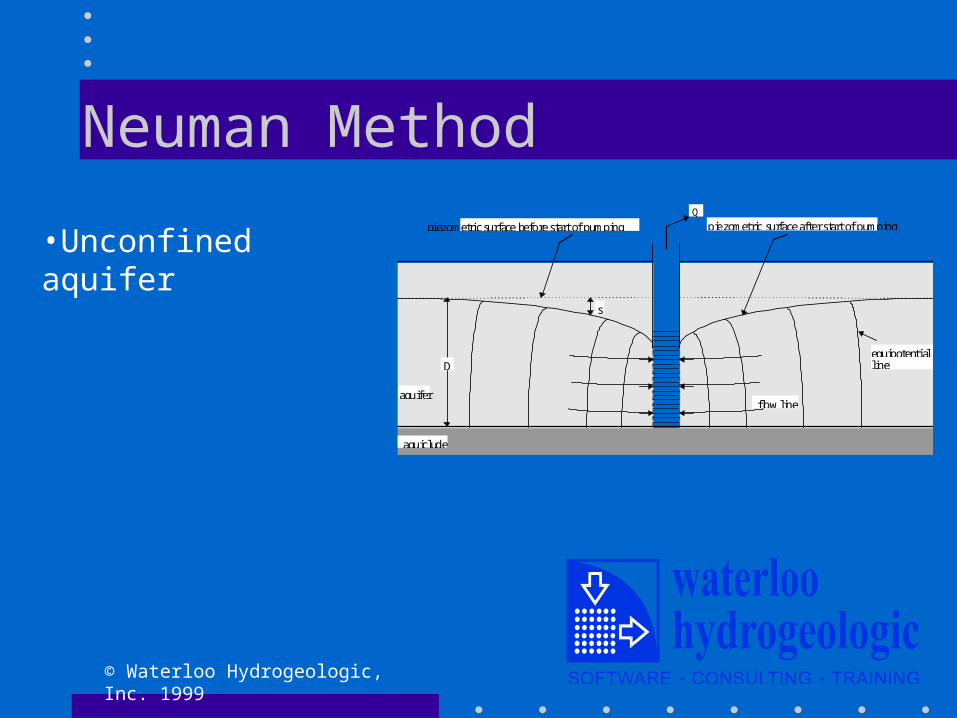
Neuman Method
D
s
aquiferflow line
piezometric surface before start of pumpingQ
piezometric surface after start of pumping
equipotentialline
aquiclude
•Unconfined aquifer
© Waterloo Hydrogeologic, Inc. 1999
Neuman MethodLimiting Assumptions
• Confined and infinite extent;• Homogenous, isotropic, uniform thickness;• Piezometric surface horizontal prior to pumping;• The well is pumped at an average rate;• The well is fully penetrating;• Instantaneous decline in head from pumping;• Well bore storage negligible;• Flow is unsteady.

© Waterloo Hydrogeologic, Inc. 1999
Neuman Method
Data Requirements • Recovery versus time data from one or more
pumping wells;• Distance from the observation well (s) to the
pumping well;• Pumping rate.
© Waterloo Hydrogeologic, Inc. 1999
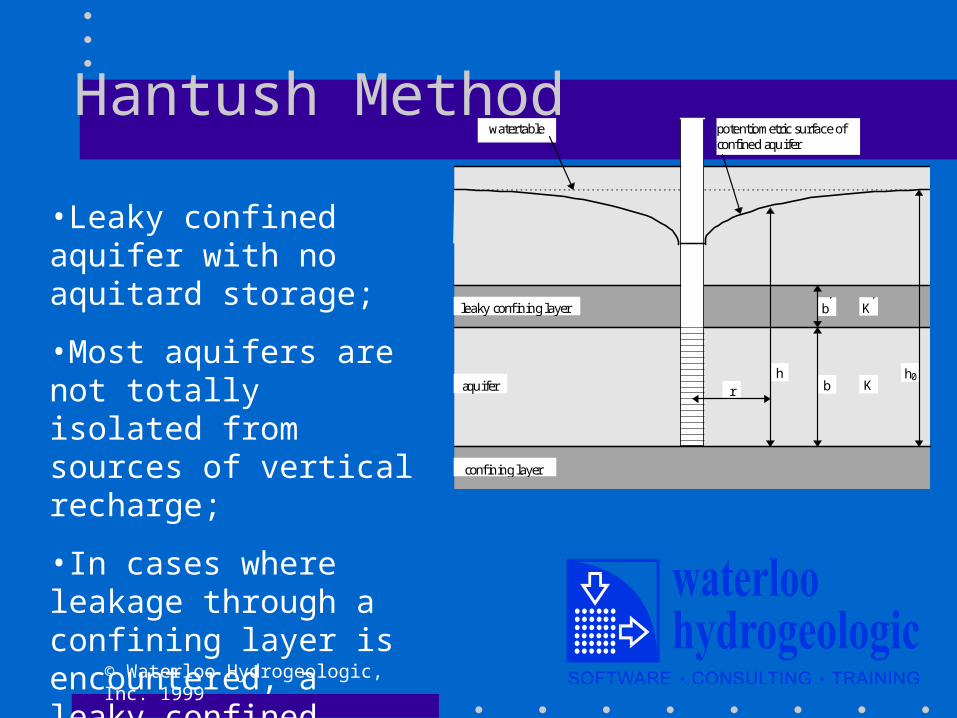
Hantush Method
confining layer
leaky confining layer
aquifer rh
bh0
b
watertable potentiometric surface ofconfined aquifer
K
K
•Leaky confined aquifer with no aquitard storage;
•Most aquifers are not totally isolated from sources of vertical recharge;
•In cases where leakage through a confining layer is encountered, a leaky confined aquifer analysis method should be applied.
© Waterloo Hydrogeologic, Inc. 1999
Hantush MethodLimiting Assumptions
• The aquifer is leaky and infinite extent;
• The aquifer and confining layer are homogenous, isotropic, uniform thickness;
• Piezometric surface horizontal prior to pumping;
• The well is pumped at a constant rate;
• The well is fully penetrating;
• Instantaneous decline in head from pumping;
• Well bore storage negligible;
• Leakage through the confining layer is vertical and proportional to the drawdown.
© Waterloo Hydrogeologic, Inc. 1999
Hantush Method
Data Requirements • Drawdown versus time data from one or more
observation wells;• Distance from the observation well (s) to the
pumping well;• Pumping rate.
© Waterloo Hydrogeologic, Inc. 1999
Well Performance test
•Evaluate the potential productivity of a well in terms of its specific capacity;
•Is calculated by dividing the pumping rate by the total drawdown in the well;
© Waterloo Hydrogeologic, Inc. 1999
Partially Penetrating Wells: An important consideration when
analyzing aquifer test data
General Guidelines:
•If an observation well completely penetrates an aquifer, or if a partially penetrating well observation well is located more than (1.5)(b)(Kr/Kz)1/2 distance units from the pumping well, the effect of partial penetration is negligible.
•If a well penetrates at least 85 percent of the aquifer, it can be treated as a fully penetrating well.

© Waterloo Hydrogeologic, Inc. 1999
Partially Penetrating Wells: An important consideration when
analyzing aquifer test data(Continued)
• If the pumping well is partially penetrating and the observation wells are also partially penetrating and located closer to the pumping well than (1.5)(b)(Kr/Kz)1/2 distance units, then the drawdown distribution is complex and cannot be described by well-hydraulics equations assuming full penetration.

© Waterloo Hydrogeologic, Inc. 1999
Introduction to Single Well Response Methods (Slug Tests):
Advantages
• Inexpensive and quick to perform;• Easy to analyze;• Does not require withdraw of contaminated water,
as a pumping test;• Many tests can be performed to estimate spatial
variations in hydraulic conductivity (k);
© Waterloo Hydrogeologic, Inc. 1999
Introduction to Single Well Response Methods (Slug Tests):
Advantages (Continued)
• Can be performed in water quality monitoring wells;
• Can be performed in low permeability rocks.
© Waterloo Hydrogeologic, Inc. 1999
Introduction to Single Well Response Methods (Slug Tests):
Disadvantages• Values of hydraulic conductivity (K) and transmissivity
(T) are approximate only;
• Values of K and T commonly underestimate representative values;
• Values only represent a very small volume of the aquifer being tested;
• Values can be easily misinterpreted and misapplied.

© Waterloo Hydrogeologic, Inc. 1999
Comparison of Single Well Response Methods

© Waterloo Hydrogeologic, Inc. 1999
Slug Tests in Unconfined Aquifer: Bouwer and Rice Method
•Most widely used method for evaluating slug tests;
•Accommodates a wide range of well geometries;
•Can used for to analyze slug tests in confined and unconfined aquifers.

© Waterloo Hydrogeologic, Inc. 1999
Hvorslev Method
•Yields approximate values for aquifer properties only;
•Can be used to analyze test results from confined and unconfined aquifers;
•Also supports fully and partially penetrating wells.
© Waterloo Hydrogeologic, Inc. 1999
10 Tips for Avoiding Common Problems in Aquifer Test Analysis

© Waterloo Hydrogeologic, Inc. 1999
Tip No. 1
• You need to produce a detectable drawdown of 0.01 feet no faster than 2 minutes after the pumping starts, otherwise the measured time-drawdown data will be on the flat part of the type curve (s) and computed S values will be uncertain.
© Waterloo Hydrogeologic, Inc. 1999
Tip No. 2
• Water levels in all wells should be collected with sufficient frequency that each log cycle on the time axis contains at least 10 data points spread through the cycle, e.g., measure drawdown at t = 1, 1.5, 2, 2.5, 3, 4, 5, 6, 7, and 8 minutes. Times of subsequent measurements for each log cycle can be multiples of 10 of these values, e.g., 10, 15, 20, 25, 30, 40, 50, 60, 70, and 80 minutes.

© Waterloo Hydrogeologic, Inc. 1999
Tip No. 3
• Measure discharge (Q) at least hourly after the first hour of the test and adjust Q if necessary. Keep records of the changes in Q so an average Q for the test can be computed (for constant rate tests). Measure Q every 15 minutes during the first hour of the test. Q should never be allowed to vary more than + 10 percent.
© Waterloo Hydrogeologic, Inc. 1999
Tip No. 4
• If Q varies so much that head changes in the aquifer occur as a result of the fluctuations, use the average Q to compute hydraulic parameters with the water-level recovery data.

© Waterloo Hydrogeologic, Inc. 1999
Tip No. 5
• If problems develop measuring water levels, Q, or maintaining a constant Q (for constant rate tests) in the first two hours of the test, shut the test down and start again after water-level recovery occurs.

© Waterloo Hydrogeologic, Inc. 1999
Tip No. 6
• Collect pre-stress, water-level trend data for a duration of twice the length of the pumping test.

© Waterloo Hydrogeologic, Inc. 1999
Tip No. 7
• Correct all drawdown data for trend and unidirectional fluctuations if necessary.

© Waterloo Hydrogeologic, Inc. 1999
Tip No. 8
• Plot all water level-data in the field on log-log and semi-log paper. Examine these plots for boundaries and decide on the duration of the test based on these data. Do not specify the length of the test in any contractual documents.

© Waterloo Hydrogeologic, Inc. 1999
Tip No. 9
• If possible align observation wells parallel to hydraulic and geologic boundaries. Doing so will minimize the potential negative effects from these conditions on the test data and facilitate more accurate analysis.

© Waterloo Hydrogeologic, Inc. 1999
Tip No. 10
• To avoid the effects of partial penetration locate observation wells 2, 3, 5, and 8 times the saturated thickness of the aquifer away from the pumped well.

© Waterloo Hydrogeologic, Inc. 1999
Type Curve Fitting of Data from Confined Aquifer Test:
© Waterloo Hydrogeologic, Inc. 1999
Automated Aquifer Test Analysis: Introduction to AquiferTest for Windows