AqUEDUCT METADATA DOCUMENT MEKONG RIVER BASIN STUDYpdf.wri.org/mekong_river_basin_study.pdf ·...
24
WORKING PAPER | December 2012 | 1 Working Paper CONTENTS Executive Summary........................................................1 Total water withdrawal.................................................... 2 Consumptive and Non-consumptive Use....................... 4 Total blue water (Bt)....................................................... 5 Available blue water (Ba).............................................. ..6 Baseline water stress......................................................7 Inter-annual variability................................................... 8 Seasonal variability........................................................ 9 Flood occurrence......................................................... 10 Drought severity........................................................... 11 Upstream storage......................................................... 12 Return flow ratio........................................................... 13 Ammonia nitrogen (NH3-N)......................................... 14 Electrical conductivity (EC).......................................... 16 Upstream protected land.............................................. 17 Chemical oxygen demand (COD)................................. 18 Media coverage............................................................ 20 Access to water............................................................ 21 Threatened amphibians................................................ 22 Endnotes...................................................................... 23 AQUEDUCT METADATA DOCUMENT MEKONG RIVER BASIN STUDY FRANCIS GASSERT, PRAGYAJAN RAI, PAUL REIG, AND MATT LUCK Disclaimer: Working Papers contain preliminary research, analysis, findings, and recommendations. They are circulated to stimulate timely discussion and critical feedback and to influence ongoing debate on emerging issues. Most working papers are eventually published in another form and their content may be revised. Suggested Citation: Gassert, F., P. Rai, P. Reig, and M. Luck. 2012. “Mekong River Basin Study.” Working Paper. Washington, DC: World Resources Institute. Available online at http://wri.org/ publication/aqueduct-metadata-mekong-river-basin. EXECUTIVE SUMMARY Prior to the creation of the global Aqueduct Water Risk Atlas, indicators (Table 1) were developed and tested in a number of river basins worldwide. The results of these Basin Studies helped inform and shape the global Aqueduct Water Risk Framework. Complete guidelines and processes for indicator selection, data collection, calculations, and mapping techniques are described fully in the Aqueduct Water Risk Framework. 1 This study focuses on the specific characteristics of the indicator data and calculation in the Mekong River Basin (MRB). The data selection and validation process for the Mekong River Basin Study involved three steps: (1) a literature review, (2) identification of data sources in the public domain, and (3) the compilation and expert review of selected data sources. Calculation of 6 of the 14 indicators required the creation of original datasets to estimate water availability and use at a subbasin scale. Baseline water stress Drought severity Upstream protected land Inter-annual variability Upstream storage Media coverage Seasonal variability Return flow ratio Access to water Flood occurrence Water quality (3 indicators) Threatened amphibians Table 1 | Aqueduct Indicators
Transcript of AqUEDUCT METADATA DOCUMENT MEKONG RIVER BASIN STUDYpdf.wri.org/mekong_river_basin_study.pdf ·...
WORKING PAPER | December 2012 | 1
Working Paper
CONTENTSExecutive Summary........................................................1
Total water withdrawal....................................................2
Consumptive and Non-consumptive Use....................... 4
Total blue water (Bt)....................................................... 5
Available blue water (Ba).............................................. ..6
Baseline water stress......................................................7
Inter-annual variability................................................... 8
Seasonal variability........................................................9
Flood occurrence......................................................... 10
Drought severity...........................................................11
Upstream storage.........................................................12
Return flow ratio...........................................................13
Ammonia nitrogen (NH3-N).........................................14
Electrical conductivity (EC).......................................... 16
Upstream protected land..............................................17
Chemical oxygen demand (COD).................................18
Media coverage............................................................20
Access to water............................................................ 21
Threatened amphibians................................................22
Endnotes......................................................................23
AqUEDUCT METADATA DOCUMENT
MEKONG RIVER BASIN STUDYFrancis Gassert, PraGyajan rai, Paul reiG, and Matt luck
Disclaimer: Working Papers contain preliminary research, analysis, findings, and recommendations. They are circulated to stimulate timely discussion and critical feedback and to influence ongoing debate on emerging issues. Most working papers are eventually published in another form and their content may be revised.
Suggested Citation: Gassert, F., P. Rai, P. Reig, and M. Luck. 2012. “Mekong River Basin Study.” Working Paper. Washington, DC: World Resources Institute. Available online at http://wri.org/publication/aqueduct-metadata-mekong-river-basin.
ExEcutivE Summary Prior to the creation of the global Aqueduct Water Risk Atlas, indicators (Table 1) were developed and tested in a number of river basins worldwide. The results of these Basin Studies helped inform and shape the global Aqueduct Water Risk Framework. Complete guidelines and processes for indicator selection, data collection, calculations, and mapping techniques are described fully in the Aqueduct Water Risk Framework.1 This study focuses on the specific characteristics of the indicator data and calculation in the Mekong River Basin (MRB).
The data selection and validation process for the Mekong River Basin Study involved three steps: (1) a literature review, (2) identification of data sources in the public domain, and (3) the compilation and expert review of selected data sources. Calculation of 6 of the 14 indicators required the creation of original datasets to estimate water availability and use at a subbasin scale.
Baseline water stress
Drought severityUpstream protected land
Inter-annual variability
Upstream storage Media coverage
Seasonal variability Return flow ratio Access to water
Flood occurrenceWater quality (3 indicators)
Threatened amphibians
Table 1 | aqueduct indicators
2 |
The hydrological catchments used in the exercise were extracted from the Global Drainage Basin Database developed by Masutomi et al.2 Computation of the original datasets was completed by ISciences, L.L.C.
Two measures of water use were used in this study: total withdrawal, the total amount of water abstracted from freshwater sources for human use, and consumptive use, the portion of withdrawn water that evaporates or is incorporated into a product thus is no longer available for further use. Withdrawals for the Lower Mekong Basin (LMB) countries (Lao People’s Democratic Republic, Thai-land, Cambodia and Vietnam) are from the Mekong River Commission’s (MRC) State of the Basin Report 2010. Withdrawals for the Upper Mekong Basin (UMB) (China and Myanmar) are extrapolated from the same data using a spatial regression based approach. Consumptive use is derived from total withdrawals based on consumptive use ratios by Shiklomanov and Rodda.3 Both total withdrawal and consumptive use were coded at the hydrological catchment scale.
Two metrics of water supply were computed: total blue water and available blue water. Total blue water approxi-mates natural river discharge and does not account for withdrawals or consumptive use. Available blue water is an estimate of surface water availability minus upstream consumptive use. Modeled estimates of water supply are calculated using a catchment-to-catchment flow accu-mulation approach developed by ISciences, L.L.C., which aggregates water by catchment and transports it to the next downstream catchment. Water supply is computed from runoff (R), the water available to flow across the landscape from a particular location, and is calculated as the remainder of precipitation (P) after evapotranspira-tion (ET) and change in soil moisture storage (∆S) are accounted for (i.e., R = P – ET – ∆S). The runoff data is courtesy of Sonessa et al.4 Runoff is the output from a rainfall-runoff calibration model, using observed rainfall, stream flow, and land use to calibrate parameters and simulate runoff records similar to the observed record in the MRB over a common time period. Rainfall and the calibrated parameters are used to generate runoff values for 1951 to 2006.
The remainder of this document contains definitions, for-mulas, and data sources for the Mekong River Basin Study.
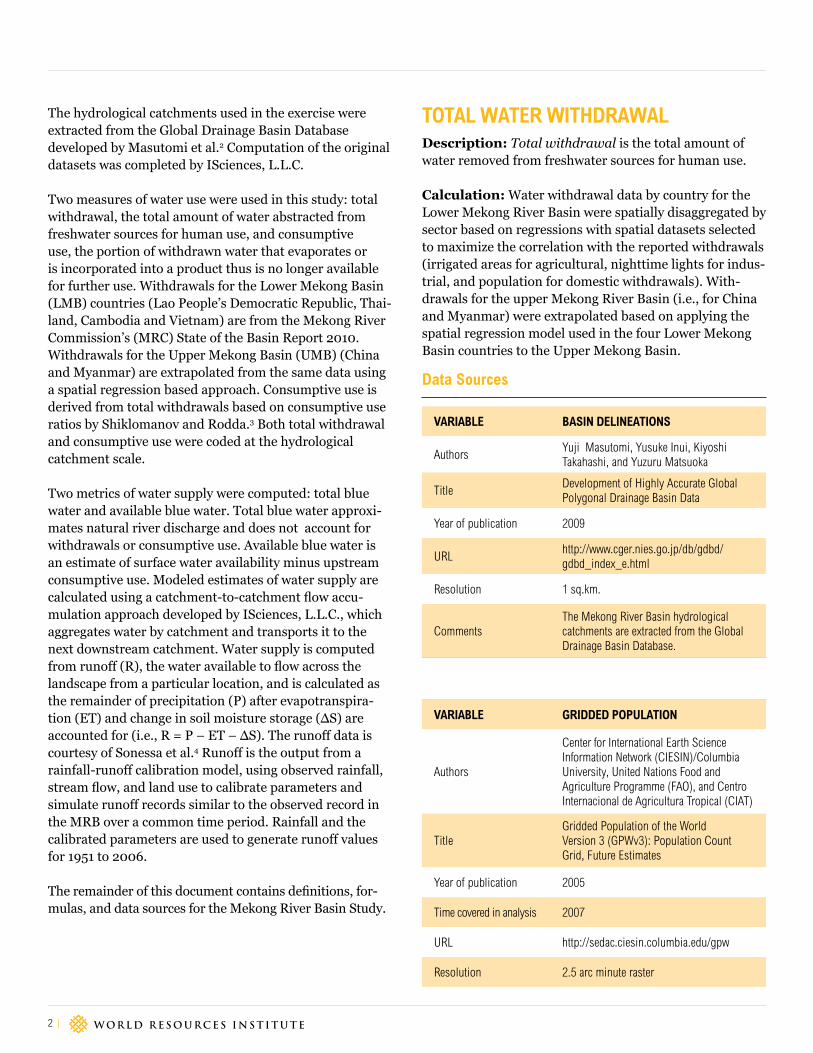
tOtaL watEr witHDrawaLDescription: Total withdrawal is the total amount of water removed from freshwater sources for human use.
Calculation: Water withdrawal data by country for the Lower Mekong River Basin were spatially disaggregated by sector based on regressions with spatial datasets selected to maximize the correlation with the reported withdrawals (irrigated areas for agricultural, nighttime lights for indus-trial, and population for domestic withdrawals). With-drawals for the upper Mekong River Basin (i.e., for China and Myanmar) were extrapolated based on applying the spatial regression model used in the four Lower Mekong Basin countries to the Upper Mekong Basin.
variabLE baSin DELinEatiOnS
Authors Yuji Masutomi, Yusuke Inui, Kiyoshi Takahashi, and Yuzuru Matsuoka
Title Development of Highly Accurate Global Polygonal Drainage Basin Data
Year of publication 2009
URLhttp://www.cger.nies.go.jp/db/gdbd/gdbd_index_e.html
Resolution 1 sq.km.
CommentsThe Mekong River Basin hydrological catchments are extracted from the Global Drainage Basin Database.
variabLE GriDDED pOpuLatiOn
Authors
Center for International Earth Science Information Network (CIESIN)/Columbia University, United Nations Food and Agriculture Programme (FAO), and Centro Internacional de Agricultura Tropical (CIAT)
Title Gridded Population of the World Version 3 (GPWv3): Population Count Grid, Future Estimates
Year of publication 2005
Time covered in analysis 2007
URL http://sedac.ciesin.columbia.edu/gpw
Resolution 2.5 arc minute raster
Data Sources

Mekong River Basin Study
WORKING PAPER | December 2012 | 3
variabLE niGHttimE LiGHtS
Author NOAA National Geophysical Data Center (NGDC)
Title Version 4 DMSP-OLS Nighttime Lights Time Series
Year of publication 2010
Time covered in analysis 2007
URLhttp://www.ngdc.noaa.gov/dmsp/down-loadV4composites.html
Resolution 30 arc second raster
variabLE GLObaL irriGatiOn arEaS
AuthorsS. Siebert, P. Döll, S. Feick, J. Hoogeveen, and K. Frenken
Title Global Map of Irrigation Areas Version 4.0.1
Year of publication 2007
Time covered in analysis 2000
URLhttp://www.fao.org/nr/water/aquastat/ir-rigationmap/index60.stm
Resolution 5 arc minute raster
variabLE witHDrawaLS by SEctOr
Author Mekong River Commission
Title State of the Basin Report 2010
Year of publication 2010
Time covered in analysis 2007
URLhttp://ns1.mrcmekong.org/free_download/State-of-the-Basin-Report.htm
Resolution Country
Data Sources total water withdrawal
4 |
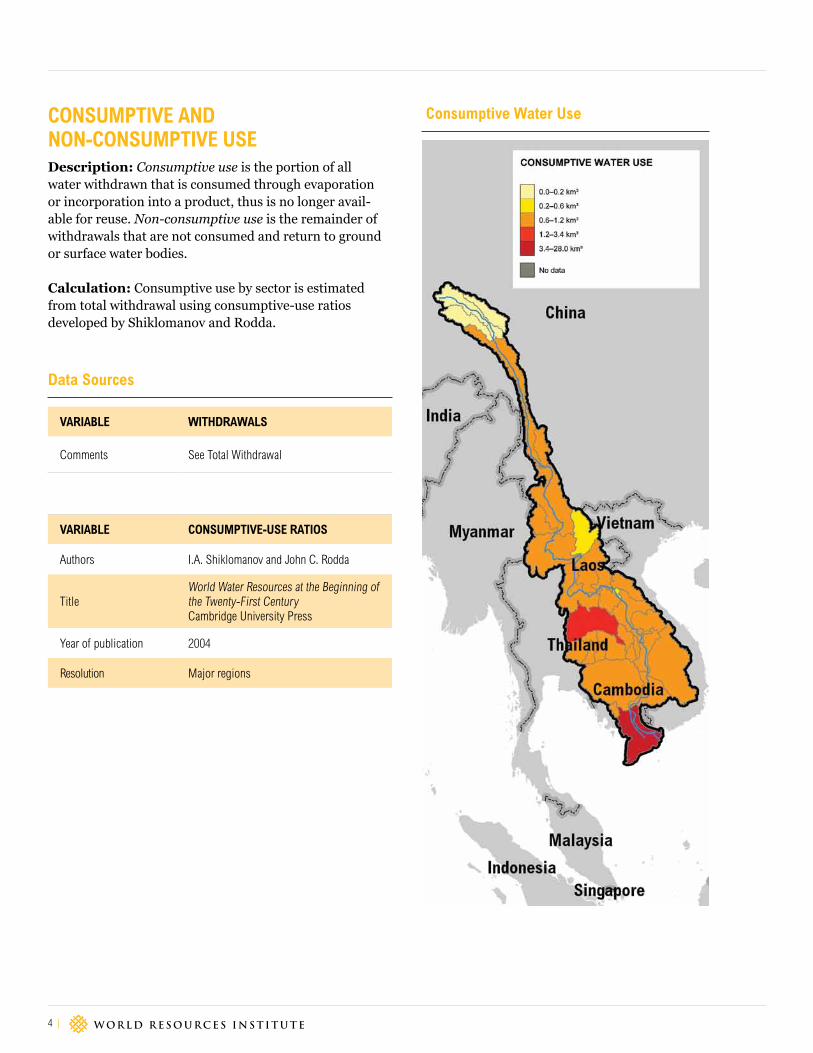
cOnSumptivE anD nOn-cOnSumptivE uSEDescription: Consumptive use is the portion of all water withdrawn that is consumed through evaporation or incorporation into a product, thus is no longer avail-able for reuse. Non-consumptive use is the remainder of withdrawals that are not consumed and return to ground or surface water bodies.
Calculation: Consumptive use by sector is estimated from total withdrawal using consumptive-use ratios developed by Shiklomanov and Rodda.
variabLE witHDrawaLS
Comments See Total Withdrawal
variabLE cOnSumptivE-uSE ratiOS
Authors I.A. Shiklomanov and John C. Rodda
Title World Water Resources at the Beginning of the Twenty-First Century Cambridge University Press
Year of publication 2004
Resolution Major regions
Data Sources
consumptive water use

Mekong River Basin Study
WORKING PAPER | December 2012 | 5
tOtaL bLuE watEr (bt) Description: Total blue water (Bt) for each catchment is the accumulated runoff upstream of the catchment plus the runoff in the catchment.
Calculation: Bt(i) = Rup(i) + R(i) where Rup(i) = ∑ Bt(iup), iup is the set of catchments immediately upstream of catchment i that flow into catchment i, and Rup(i) is the summed runoff in all upstream catchments. For first-order catchments (those without upstream catchments, e.g., headwater catchments), Rup(i) is zero, and total blue water is simply the volume of runoff in the catchment.
variabLE baSin DELinEatiOnS
Comments See Total Withdrawal
variabLE runOff
Authors M.Y. Sonessa, J.E. Richey, and D.P. Lettenmaier
Title Evaluation of Water Balance Terms of the SEA with a Land Surface Model and ERA Interim Reanalysis
Year of publication (In prep)
Time covered in analysis 1951–2006
Resolution ¼ degree raster
Data Sources
total blue water (bt)

6 |
avaiLabLE bLuE watEr (ba)Description: Available blue water (Ba) is the total amount of water available to a catchment before any uses are satisfied. It is calculated as all water flowing into the catchment from upstream catchments minus upstream consumptive use plus the runoff in the catchment.
Calculation: Ba(i) = R(i) + ∑ Qout(iup) where Qout is defined as the volume of water exiting a catchment to its downstream neighbor: Qout(i) = max(0, Ba(i) – Uc(i)), Uc(i) are the consumptive uses in from catchment i. Nega-tive values of Qout are set to zero. In first-order catch-ments ∑Qout(j) is zero, so available blue water is runoff plus imports.
variabLE runOff
Comments See Total Blue Water
variabLE cOnSumptivE uSE
Comments See Consumptive and Non-consumptive Use
Data Sources
available blue water
Mekong River Basin Study
WORKING PAPER | December 2012 | 7
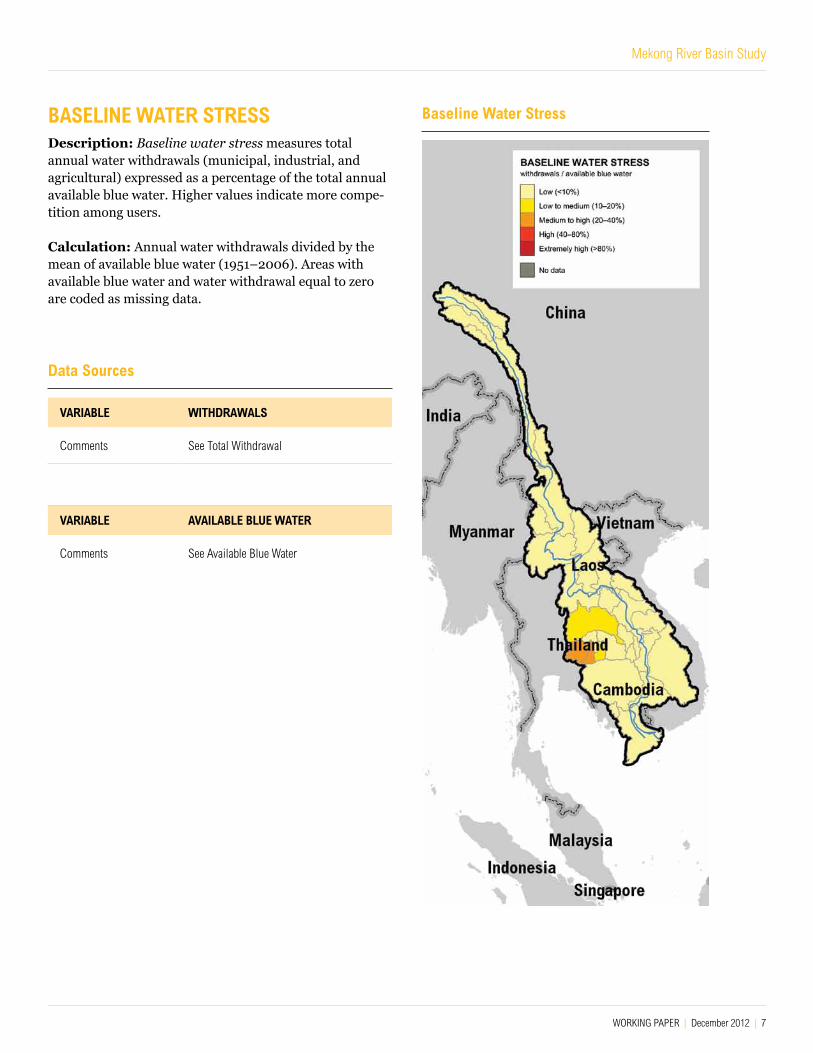
baSELinE watEr StrESSDescription: Baseline water stress measures total annual water withdrawals (municipal, industrial, and agricultural) expressed as a percentage of the total annual available blue water. Higher values indicate more compe-tition among users.
Calculation: Annual water withdrawals divided by the mean of available blue water (1951–2006). Areas with available blue water and water withdrawal equal to zero are coded as missing data.
variabLE witHDrawaLS
Comments See Total Withdrawal
variabLE avaiLabLE bLuE watEr
Comments See Available Blue Water
Data Sources
baseline water Stress

8 |
intEr-annuaL variabiLityDescription: Inter-annual variability measures the variation in water supply between years.
Calculation: Standard deviation divided by the mean of annual total blue water (1951–2006).
variabLE tOtaL bLuE watEr
Comments See Total Blue Water
Data Sources
inter-annual variability

Mekong River Basin Study
WORKING PAPER | December 2012 | 9
SEaSOnaL variabiLityDescription: Seasonal variability measures variation in water supply between months of the year.
Calculation: Standard deviation divided by the mean of monthly total blue water (1951–2006). The mean of monthly total blue water of each of the 12 months of the year is first calculated, then the variance is estimated between the mean monthly values.
variabLE tOtaL bLuE watEr
Comments See Total Blue Water
Data Sources
Seasonal variability
10 |
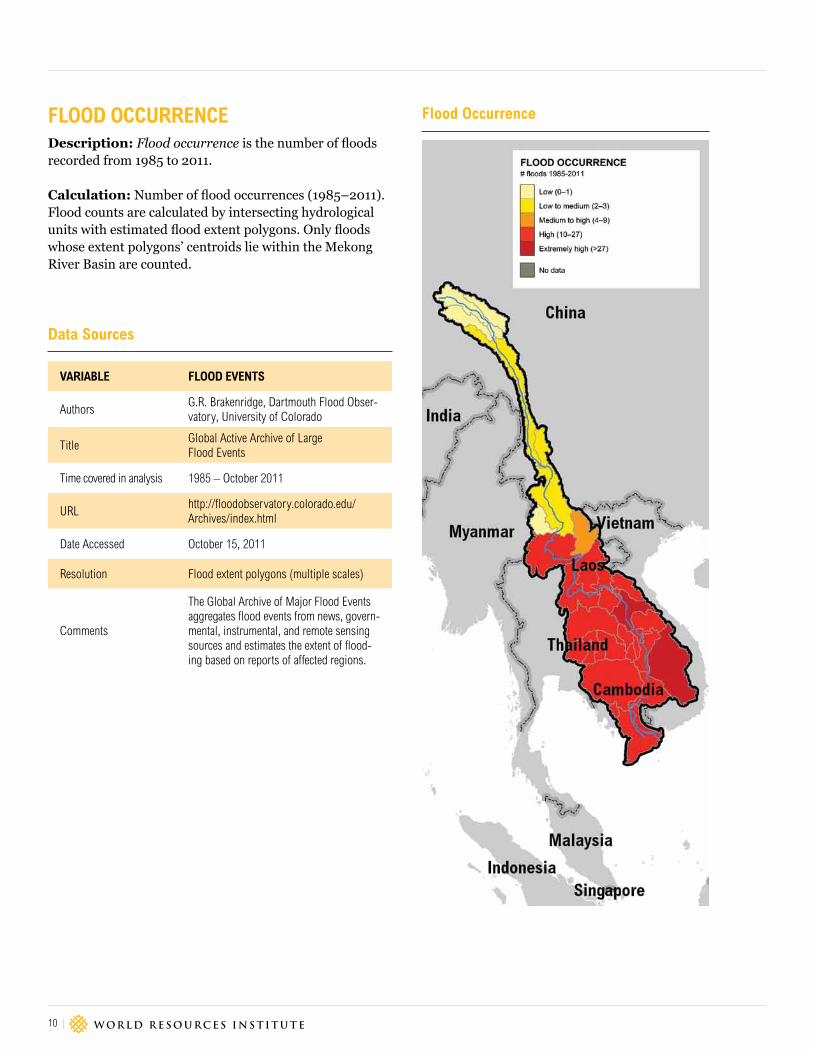
fLOOD OccurrEncEDescription: Flood occurrence is the number of floods recorded from 1985 to 2011.
Calculation: Number of flood occurrences (1985–2011). Flood counts are calculated by intersecting hydrological units with estimated flood extent polygons. Only floods whose extent polygons’ centroids lie within the Mekong River Basin are counted.
variabLE fLOOD EvEntS
Authors G.R. Brakenridge, Dartmouth Flood Obser-vatory, University of Colorado
Title Global Active Archive of Large Flood Events
Time covered in analysis 1985 – October 2011
URLhttp://floodobservatory.colorado.edu/Archives/index.html
Date Accessed October 15, 2011
Resolution Flood extent polygons (multiple scales)
Comments
The Global Archive of Major Flood Events aggregates flood events from news, govern-mental, instrumental, and remote sensing sources and estimates the extent of flood-ing based on reports of affected regions.
Data Sources
flood Occurrence
Mekong River Basin Study
WORKING PAPER | December 2012 | 11
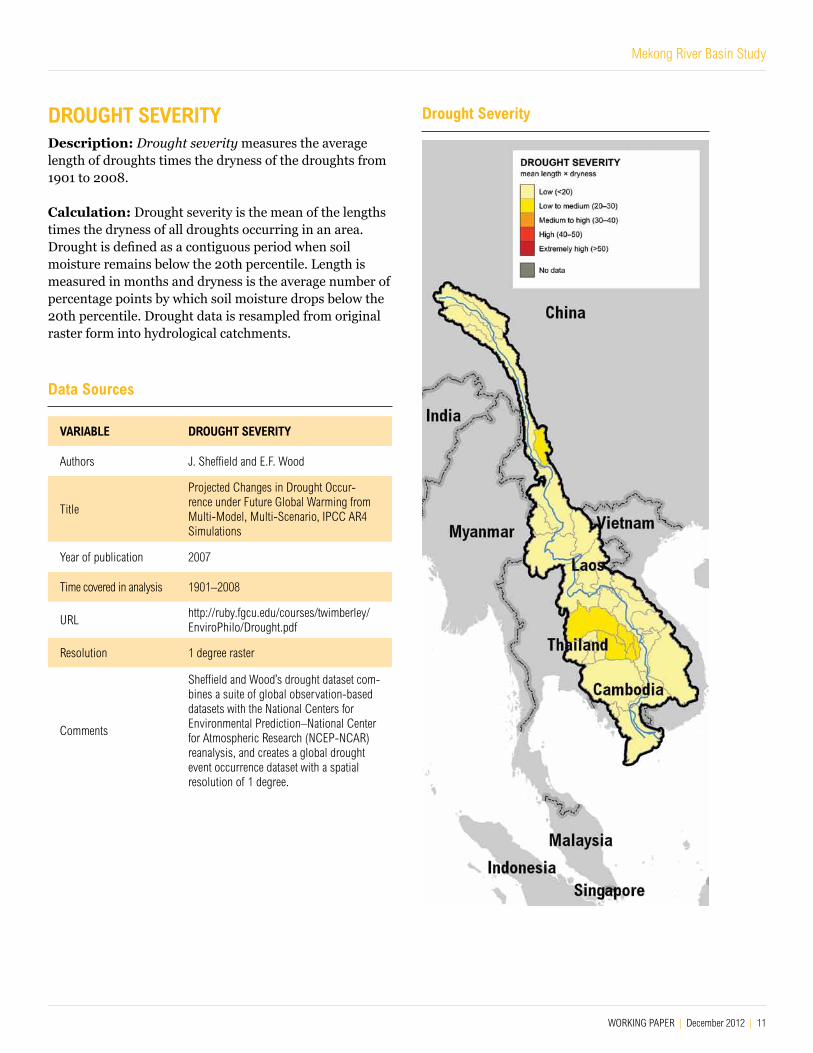
DrOuGHt SEvErityDescription: Drought severity measures the average length of droughts times the dryness of the droughts from 1901 to 2008.
Calculation: Drought severity is the mean of the lengths times the dryness of all droughts occurring in an area. Drought is defined as a contiguous period when soil moisture remains below the 20th percentile. Length is measured in months and dryness is the average number of percentage points by which soil moisture drops below the 20th percentile. Drought data is resampled from original raster form into hydrological catchments.
variabLE DrOuGHt SEvErity
Authors J. Sheffield and E.F. Wood
Title
Projected Changes in Drought Occur-rence under Future Global Warming from Multi-Model, Multi-Scenario, IPCC AR4 Simulations
Year of publication 2007
Time covered in analysis 1901–2008
URLhttp://ruby.fgcu.edu/courses/twimberley/EnviroPhilo/Drought.pdf
Resolution 1 degree raster
Comments
Sheffield and Wood’s drought dataset com-bines a suite of global observation-based datasets with the National Centers for Environmental Prediction–National Center for Atmospheric Research (NCEP-NCAR) reanalysis, and creates a global drought event occurrence dataset with a spatial resolution of 1 degree.
Data Sources
Drought Severity

12 |
upStrEam StOraGEDescription: Upstream storage measures the water-storage capacity available upstream of a location relative to the total water supply at that location. Higher values indicate areas more capable of buffering variations in water supply (i.e., droughts and floods) because they have more water storage capacity upstream.
Calculation: Upstream storage capacity divided by the mean total blue water (1951–2006). Multiple dam datasets were combined for more complete coverage.
upstream Storage
variabLE tOtaL bLuE watEr
Comments See Total Blue Water
variabLE majOr DamS anD rESErvOirS
AuthorsB. Lehner, C. R-Liermann, C. Revenga, C. Vörösmarty, B. Fekete, P. Crouzet, P. Döll, et al.
Title Global Reservoir and Dam (GRanD) Data-base Version 1.1
Year of publication 2011
Time covered in analysis 2010
URLhttp://atlas.gwsp.org/index.hp?option=com_content
Resolution Dams (point)
Comments GRanD database includes reservoirs with a storage capacity of more than 0.1 cubic km al-though many smaller reservoirs were included.
variabLEmajOr DamS in LOwEr mEkOnG baSin
Author Mekong River Commission
Title Lower Mekong Hydro Power Database (9506000003818_________E0100eij)
Year of publication 2009
Time covered in analysis 2009
URLhttp://portal.mrcmekong.org/master-catalogue/search?giai=9506000003818_________E0100eij
Resolution Dams (point)
Comments The MRC dam data includes existing hydropower dams in the LMB over 10MW installed capacity.
Data Sources
Mekong River Basin Study
WORKING PAPER | December 2012 | 13
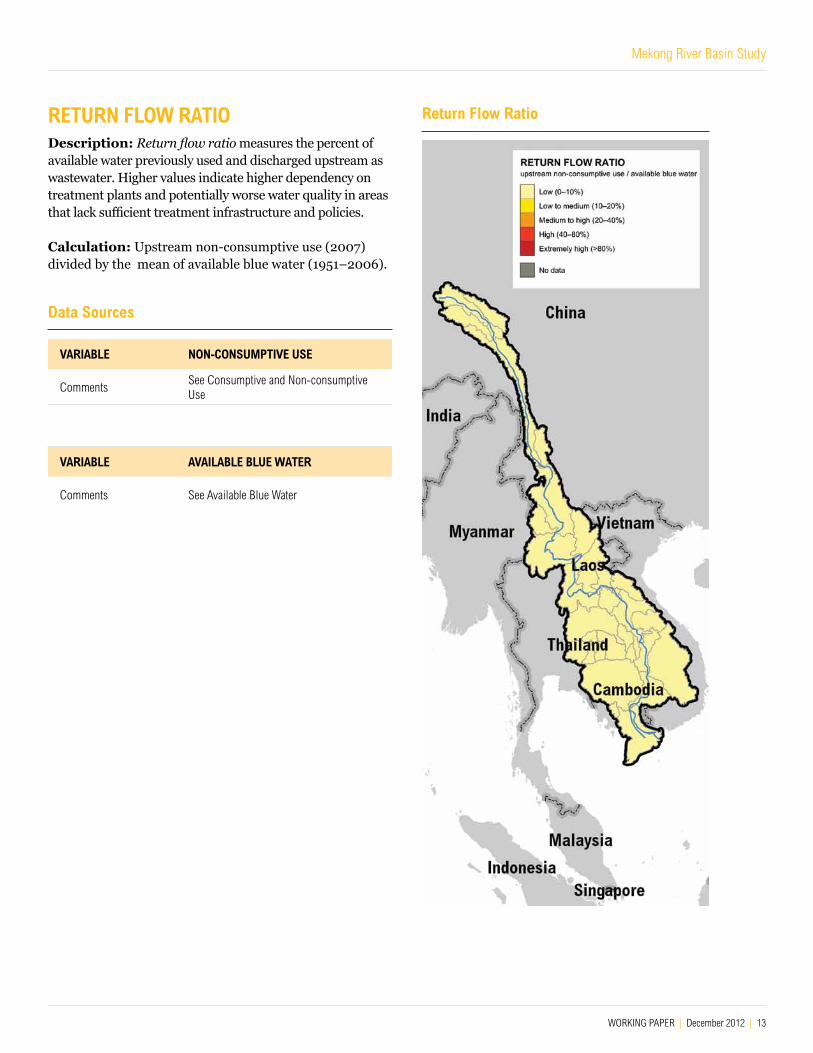
rEturn fLOw ratiODescription: Return flow ratio measures the percent of available water previously used and discharged upstream as wastewater. Higher values indicate higher dependency on treatment plants and potentially worse water quality in areas that lack sufficient treatment infrastructure and policies.
Calculation: Upstream non-consumptive use (2007) divided by the mean of available blue water (1951–2006).
return flow ratio
variabLE nOn-cOnSumptivE uSE
Comments See Consumptive and Non-consumptive Use
variabLE avaiLabLE bLuE watEr
Comments See Available Blue Water
Data Sources
14 |
watEr QuaLity - ammOnia nitrOGEnDescription: Ammonia nitrogen (NH3-N) is a measure of the level of nitrogen. Higher values, often driven by fer-tilizer use as well as by domestic and industrial discharges, may have a detrimental effect on water quality.
Calculation: NH3-N is reported using sampled data and averaged over a year. Catchments were assigned values equal to the average of all water-quality sample data within the polygon. Catchments that do not include sampled data for which a given parameter was measured were coded as missing data. The water-quality data for the Lower Mekong Basin were obtained from the Mekong River Commission and for the Upper Mekong Basin from the Ministry of Envi-ronment Projection of the People’s Republic of China.
variabLEammOnia nitrOGEn (nH3-n) – LOwEr mEkOnG baSin
Author Mekong River Commission
Title Water quality Monitoring Data in the Lower Mekong Basin
Year of publication 2012
Time covered in analysis 2011
URLhttp://portal.mrcmekong.org/master-catalogue/search?giai=9506000003818_________E0100eil
Resolution Sites (point)
variabLEammOnia nitrOGEn (nH3-n) – uppEr mEkOnG baSin
Author Ministry of Environmental Protection of the People’s Republic of China
Title 2010. 52 weeks in Xishuangbanna Xiao-ganlanba, Yunnan Section of Water(Record number: Beijing ICP 05009132)
Year of publication 2011
Time covered in analysis 2010 (52 weeks)
URL
http://datacenter.mep.gov.cn/report/water/report_52weeks_waterplace_new1.jsp?waterplace=%E4%BA%91%E5%8D%97%E8%A5%BF%E5%8F%8C%E7%89%88%E7%BA%B3%E6%A9%84%E6%A6%84%E5%9D%9D&year=2010&wissue=31
Resolution Sites (point)
Data Sources

Mekong River Basin Study
WORKING PAPER | December 2012 | 15
water Quality – ammonia nitrogenData Sources
variabLE LOcatiOnS Of watEr-QuaLity
Author Mekong River Commission
Title Water quality Stations within the Lower Mekong Basin
Year of publication 2003
URLhttp://portal.mrcmekong.org/master-cat-alogue/search?giai=9506000003818___wqstatE01009r9
Resolution Sites (point)
16 |
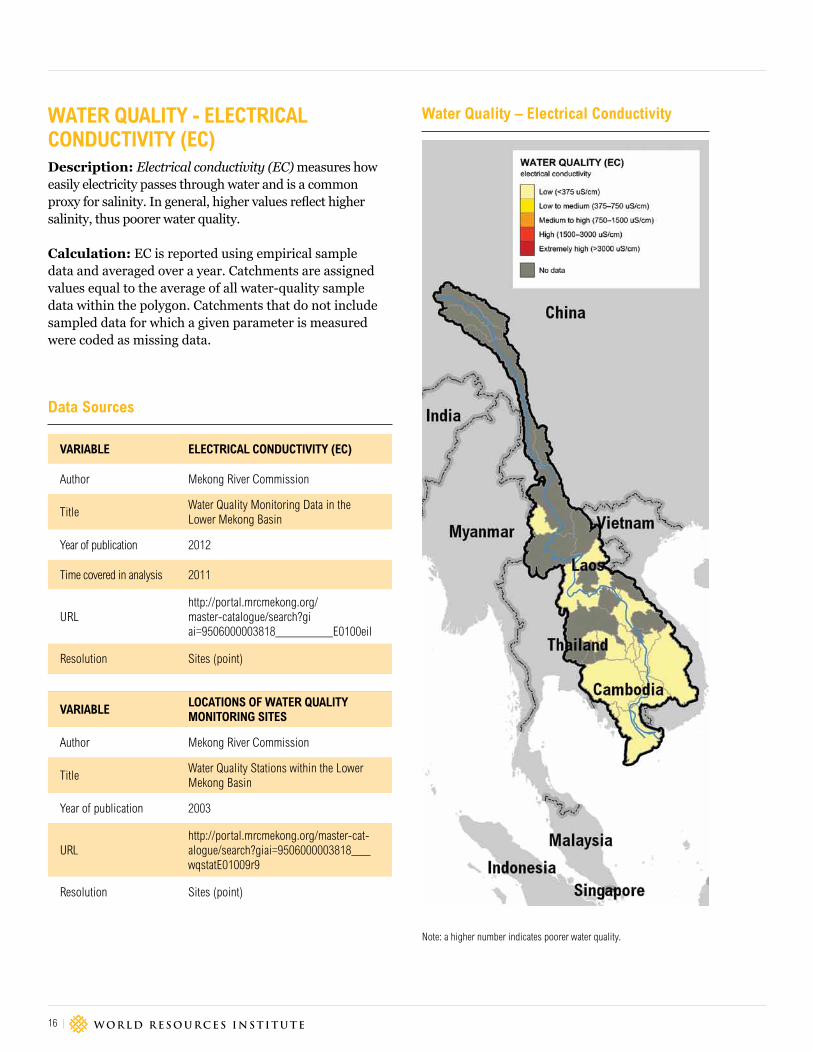
watEr QuaLity - ELEctricaL cOnDuctivity (Ec)Description: Electrical conductivity (EC) measures how easily electricity passes through water and is a common proxy for salinity. In general, higher values reflect higher salinity, thus poorer water quality.
Calculation: EC is reported using empirical sample data and averaged over a year. Catchments are assigned values equal to the average of all water-quality sample data within the polygon. Catchments that do not include sampled data for which a given parameter is measured were coded as missing data.
water Quality – Electrical conductivity
variabLE ELEctricaL cOnDuctivity (Ec)
Author Mekong River Commission
Title Water quality Monitoring Data in the Lower Mekong Basin
Year of publication 2012
Time covered in analysis 2011
URLhttp://portal.mrcmekong.org/master-catalogue/search?giai=9506000003818_________E0100eil
Resolution Sites (point)
variabLELOcatiOnS Of watEr QuaLity mOnitOrinG SitES
Author Mekong River Commission
Title Water quality Stations within the Lower Mekong Basin
Year of publication 2003
URLhttp://portal.mrcmekong.org/master-cat-alogue/search?giai=9506000003818___wqstatE01009r9
Resolution Sites (point)
Data Sources
Note: a higher number indicates poorer water quality.
Mekong River Basin Study
WORKING PAPER | December 2012 | 17
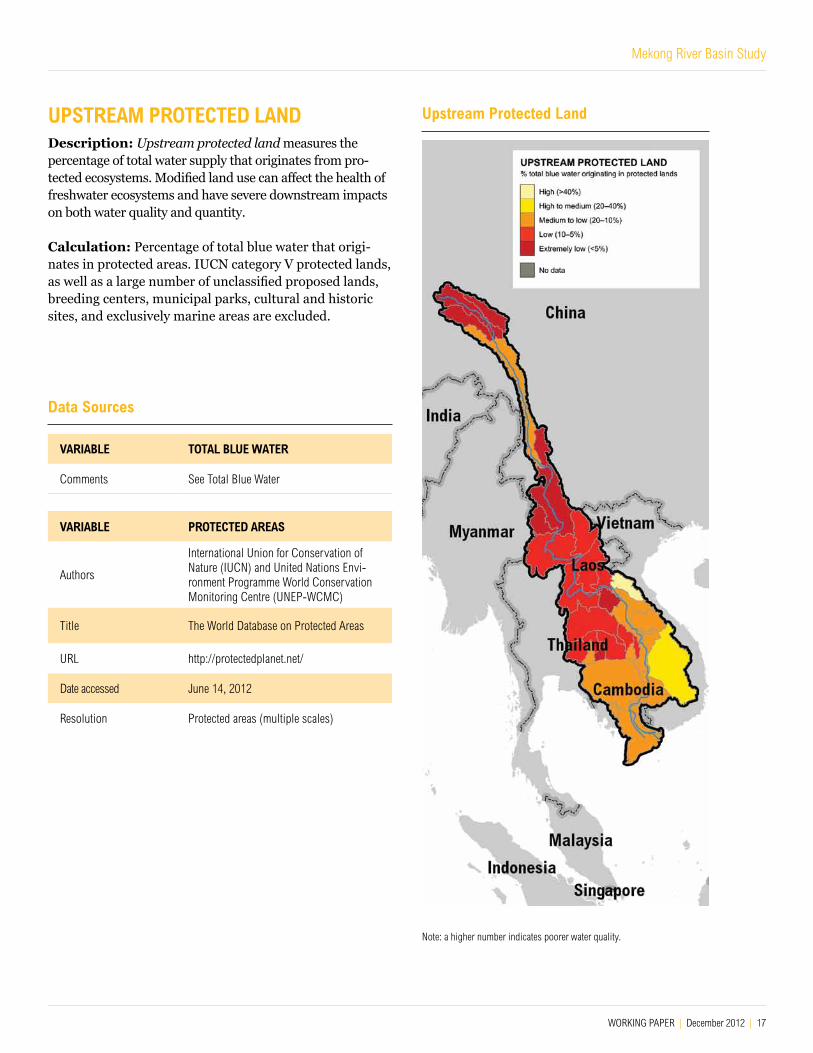
upStrEam prOtEctED LanDDescription: Upstream protected land measures the percentage of total water supply that originates from pro-tected ecosystems. Modified land use can affect the health of freshwater ecosystems and have severe downstream impacts on both water quality and quantity.
Calculation: Percentage of total blue water that origi-nates in protected areas. IUCN category V protected lands, as well as a large number of unclassified proposed lands, breeding centers, municipal parks, cultural and historic sites, and exclusively marine areas are excluded.
upstream protected Land
variabLE tOtaL bLuE watEr
Comments See Total Blue Water
variabLE prOtEctED arEaS
Authors
International Union for Conservation of Nature (IUCN) and United Nations Envi-ronment Programme World Conservation Monitoring Centre (UNEP-WCMC)
Title The World Database on Protected Areas
URL http://protectedplanet.net/
Date accessed June 14, 2012
Resolution Protected areas (multiple scales)
Data Sources
Note: a higher number indicates poorer water quality.

18 |
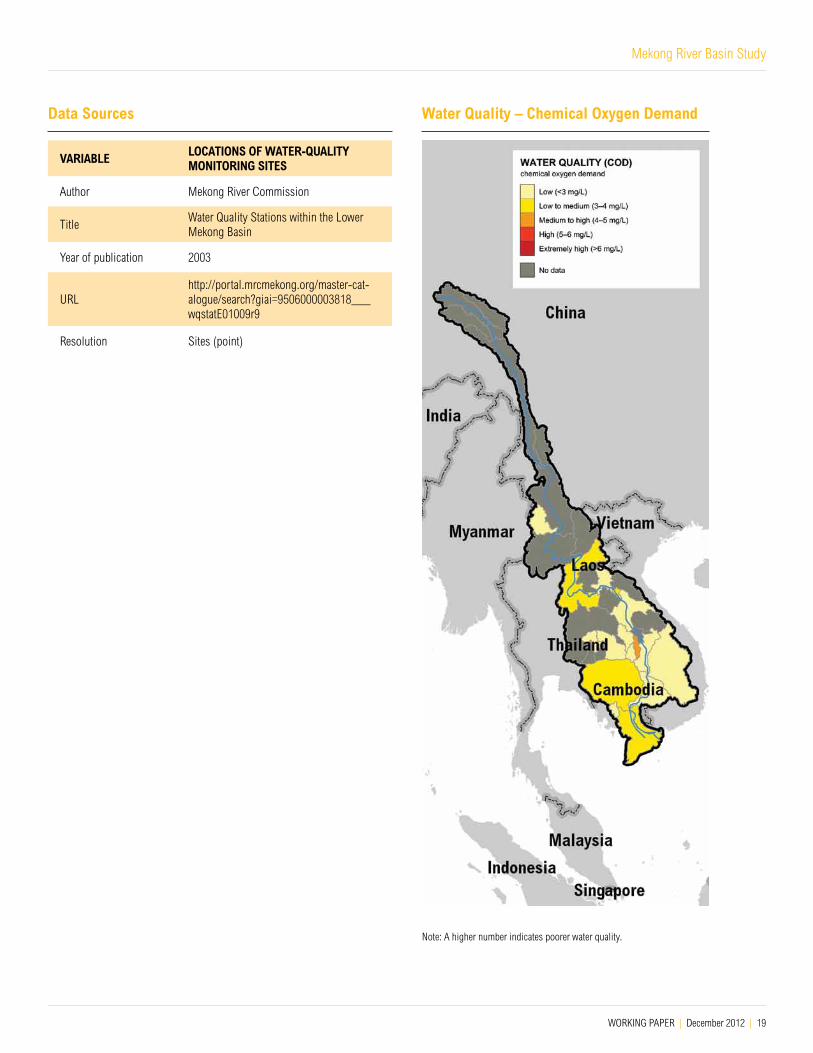
watEr QuaLity – cHEmicaL OxyGEn DEmanD (cOD)Description: Chemical oxygen demand (COD) measures the presence of organic pollutants in water. In general, higher values reflect poorer water quality.
Calculation: COD is reported using empirical sample data and averaged over a year. Catchments were assigned values equal to the average of all water-quality sample data within the polygon. Catchments that did not include sampled data for which a given parameter was measured were coded as missing data. The water quality data for the Lower Mekong Basin were obtained from the Mekong River Commission and for the Upper Mekong Basin from the Ministry of Envi-ronment Projection of the People’s Republic of China.
variabLEcHEmicaL OxyGEn DEmanD (cOD) – LOwEr mEkOnG baSin
Author Mekong River Commission
Title Water quality Monitoring Data in the Lower Mekong Basin
Year of publication 2012
Time covered in analysis 2011
URLhttp://portal.mrcmekong.org/master-catalogue/search?giai=9506000003818_________E0100eil
Resolution Sites (point)
variabLEcHEmicaL OxyGEn DEmanD (cOD) – uppEr mEkOnG baSin
Author Ministry of Environmental Protection of the People’s Republic of China
Title 52 weeks in Xishuangbanna Xiaoganlanba, Yunnan Section of Water (Record number: Beijing ICP 05009132)
Year of publication 2011
Time covered in analysis 2010
URL
http://datacenter.mep.gov.cn/report/water/report_52weeks_waterplace_new1.jsp?waterplace=%E4%BA%91%E5%8D%97%E8%A5%BF%E5%8F%8C%E7%89%88%E7%BA%B3%E6%A9%84%E6%A6%84%E5%9D%9D&year=2010&wissue=31
Resolution Sites (point)
variabLELOcatiOnS Of watEr-QuaLity mOnitOrinG SitES
Author Mekong River Commission
Title Water quality Stations within the Lower Mekong Basin
Year of publication 2003
URLhttp://portal.mrcmekong.org/master-cat-alogue/search?giai=9506000003818___wqstatE01009r9
Resolution Sites (point)
Data Sources
Mekong River Basin Study
WORKING PAPER | December 2012 | 19
variabLELOcatiOnS Of watEr-QuaLity mOnitOrinG SitES
Author Mekong River Commission
Title Water quality Stations within the Lower Mekong Basin
Year of publication 2003
URLhttp://portal.mrcmekong.org/master-cat-alogue/search?giai=9506000003818___wqstatE01009r9
Resolution Sites (point)
Data Sources water Quality – chemical Oxygen Demand
Note: A higher number indicates poorer water quality.

20 |
mEDia cOvEraGEDescription: Media coverage measures the percent-age of media articles in an area on water-related issues. Higher values indicate areas with higher public awareness of water issues, and consequently higher reputational risks to those not sustainably managing water.
Calculation: Percentage of all media articles on water scarcity and/or pollution in an administrative unit. Google Archives was used to search a string of keywords includ-ing river name, “water shortage” or “water pollution,” and administrative unit, e.g. “Mekong River+ water shortage + Cambodia.” The time frame was limited to the past 10 years from January 1, 2002 to December 31, 2011. For each country, the total number of articles for both water short-age and water pollution was summed and divided by the total number of articles on any topic found in a search of the administrative unit.
media coverage
variabLE mEDia cOvEraGE
Author Google
Title Google News
Time covered in analysis 2002–2011
URLhttp://news.google.com/news/advanced_news_search?as_drrb=a
Date accessed September 26, 2012
Resolution Country
Data Sources

Mekong River Basin Study
WORKING PAPER | December 2012 | 21
accESS tO watEr Description: Access to water measures the percentage of population without access to improved drinking water sources. Higher values indicate areas where people have less access to safe drinking water, and consequently high reputa-tional risks to those not using water in an equitable way.
Calculation: Percentage of population without access to improved drinking water sources. An improved drinking water source is defined as one that, by nature of its con-struction or through active intervention, is protected from outside contamination, in particular from contamination with fecal matter.
access to water
variabLE accESS tO watEr
Authors World Health Organizaiton (WHO) and the United Nations Children’s Fund (UNICEF)
Title WHO / UNICEF Joint Monitoring Programme (JMP) for Water Supply and Sanitation
Year of publication 2012
Time covered in analysis 2010
URL http://www.wssinfo.org/data-estimates/table/
Resolution Country
Data Sources

22 |
tHrEatEnED ampHibianSDescription: Threatened amphibians measures the percentage of freshwater amphibian species classified by IUCN as threatened. Higher values indicate more fragile freshwater ecosystems and thus areas more likely to be subject to water withdrawal and discharge regulations.
Calculation: The percentage of amphibian species clas-sified by IUCN as threatened in a particular area. For each catchment, the total number of threated freshwater amphib-ian species is counted and divided by the total number of species whose ranges overlap the catchment. Catchments with fewer than two amphibian species are excluded.
threatened amphibians
variabLE tHrEatEnED ampHibianS
Author International Union for Conservation of Nature (IUCN)
Title The IUCN Red List of Threatened Species
Year of publication October 2010
URLhttp://www.iucnredlist.org/technical-docu-ments/spatial-data#amphibians
Resolution Ranges (multiple scales)
Comments
Amphibian species status database is joined to the known species range spatial data. Several name corrections were made in joining the data.
Data Sources
Mekong River Basin Study
WORKING PAPER | December 2012 | 23
ENDNOTES 1. Paul Reig, Tien Shiao, and Francis Gassert. “Aqueduct Water Risk Frame-
work,” WRI Working Paper, Washington DC: World Resources Institute, forthcoming.
2. Yuji Masutomi, Yusuke Inui, Kiyoshi Takahashi, and Yuzuru Matsuoka. “Development of Highly Accurate Global Polygonal Drainage Basin Data,” Hydrological Processes 23: 572-84, DOI: 10.1002/hyp.7186, 2009.
3. I.A. Shiklomanov and John C. Rodda, eds. “World Water Resources at the Beginning of the Twenty-First Century,” International Hydrology Series, Cambridge University Press, 2004.
4. M.Y. Sonessa, J.E. Richey, and D.P. Lettenmaier. “Evaluation of Water Bal-ance Terms of the SEA with a Land Surface Model and ERA Interim Reanaly-sis,” River System Research Group, University of Washington (in prep).
ACKNOWLEDGMENTS This publication was made possible thanks to the ongoing support of the World Resources Institute Markets and Enterprise Program and the Aqueduct Alliance. The authors would like to thank the following people for providing invaluable insight and assistance: Charles Iceland, Robert Kimball, Kirsty Jenkinson, Betsy Otto, Tien Shiao, Vansa Chatikavanij, Tianyi Luo, Nicole Grohoski, and Thomas Parris, as well as Nick Price and Hyacinth Billings for graphic support and final editing. For their extensive technical guidance and feedback during the development of the Mekong River Basin study, the authors would also like to thank:
Mariza Costa-Cabral, Hydrology Futures, LLC
Mac Kirby, CSIRO Land and Water
Soukaseum Phichit, Mekong River Commission
Mergia Sonessa, University of Washington
Katsuhiko Yamauchi, Mekong River Commission
ABOUT WRI WRI focuses on the intersection of the environment and socio-economic development. We go beyond research to put ideas into action, working globally with governments, business, and civil society to build transformative solutions that protect the earth and improve people’s lives. Solutions to urgent Sustainability challenges WRI’s transformative ideas protect the earth, promote development, and advance social equity because sustainability is essential to meeting human needs today, and fulfilling human aspirations tomorrow. practical Strategies for change WRI spurs progress by providing practical strategies for change and effec-tive tools to implement them. We measure our success in the form of new policies, products, and practices that shift the ways governments work, busi-nesses operate, and people act. Global action We operate globally because today’s problems know no boundaries. We are avid communicators because people everywhere are inspired by ideas, empowered by knowledge, and moved to change by greater understanding. We provide innovative paths to a sustainable planet through work that is ac-curate, fair, and independent.
ABOUT THE AUTHORSfrancis Gassert is a research assistant with the Markets and Enterprise Program at WRI, where he manages the data collection and GIS analysis of the Aqueduct project. Contact: [email protected].
matt Luck is a research scientist at ISciences, L.L.C., where he develops and applies hydrological algorithms and models.
pragyajan rai is an intern with the Markets and Enterprise Program at WRI, where he helps develop the Aqueduct Water Risk Atlas.
paul reig is an associate with the Markets and Enterprise Program at WRI, where he leads the design and development of the Aqueduct project. Contact: [email protected].
Copyright 2012 World Resources Institute. This work is licensed under the Creative Commons Attribution 3.0 License. To view a copy of the license, visit http://creativecommons.org/licenses/by/3.0/
10 G Street, NE | Washington, DC 20002 | www.wri.org
WITH SUPPORT FROMthe aqueduct alliance:
Goldman Sachs
General Electric
Skoll Global Threats Fund
Bloomberg
Talisman Energy Inc.
Dow Chemical Company
Royal Dutch Shell
Dutch Government
United Technologies Corporation
DuPont
John Deere
Procter & Gamble Company