
Aquafi na When disaster strikes - · PDF fileProcess Cyan Process Magenta Process Yellow...
52
Can you find 26 plastic bottles in this picture? See page 18 Our commitment to making a difference 2007 PBG Corporate Responsibility Report Building stronger communities Page 38 Diversity with a difference Page 29 Using water wisely Page 8 Clean and green Page 16
Transcript of Aquafi na When disaster strikes - · PDF fileProcess Cyan Process Magenta Process Yellow...
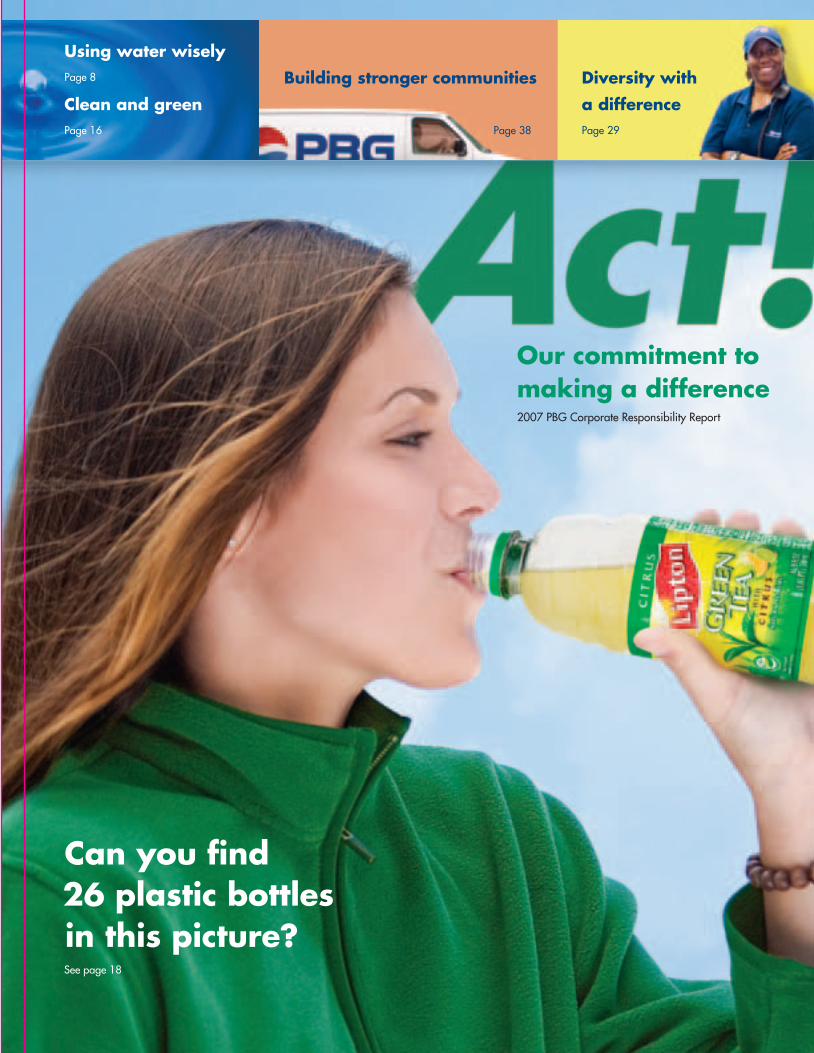
Can you fi nd 26 plastic bottles in this picture? See page 18
Our commitment tomaking a difference2007 PBG Corporate Responsibility Report
Building stronger communities
Page 38
Diversity with a differencePage 29
Using water wiselyPage 8
Clean and greenPage 16
1 Pepsi WaySomers, NY 10589www.pbg.com
Direct all inquiries to PBG Headquarters at: [email protected]
HurricaneAfter Hurricane Katrina tore through the Gulf Coast, PBG partnered with relief agencies to deliver 40 truckloads of Aquafi na and other Pepsi products to shelters and community centers. Without hesitation, our employees banded together to raise funds and collect trailers full of clothing and food. Some employees even opened their homes to displaced fl ood victims.
FloodLast fall, PBG got an urgent call from Feed America (formerly America’s Second Harvest) requesting bottled water for citizens affected by severe fl ooding in Seattle. Within 24 hours, PBG employees had sent out more than 1,000 cases of Aquafi na to insure residents had clean drinking water.
FireAs wildfi res engulfed the San Diego hills, PBG drivers – undeterred by encroaching fl ames – delivered truckload after truckload of Aquafi na to residents, relief workers and fi refi ghters on the front lines.
PBG employees take great
pride in providing millions
of people a year with quality
products. We are also proud
to give back in times of need.
When disaster strikes... ...our people and our trucks switch into high gear to get safe
drinking water to the victims, emergency response teams and
relief workers.
ACT! O
ur comm
itment to m
ak
ing a
difference
2007 PBG C
orporate Responsibility Report
bdl304169_COVERS_gr2.indd 1bdl304169_COVERS_gr2.indd 1 9/17/08 8:30:55 AM9/17/08 8:30:55 AMProcess CyanProcess Cyan Process MagentaProcess Magenta Process YellowProcess Yellow Process BlackProcess Black DieDie

Today, people want to know more about the
companies they buy from, work for and invest in.
They want to know more about how a company
operates –how it treats its employees, how it lives
up to its environmental responsibilities and how
it gives back to its communities.
CreditsCopy and designBrandLogic
PhotographyEd Carreón; Derek Dudek;Terrence Duffy; George Kamper; Chris Kokias; PBG
PrinterGHP
This report is printed on process chlorine-free, FSC-certifi ed Mohawk Via 100 percent PC Cool White, which is made with 100 percent post-consumer recycled fi ber. 100 percent of the electric-ity used to manufacture this paper is matched with credits from Green-e certi-fi ed windpower projects. This paper is also certifi ed by Green Seal.
TrademarksThis publication contains many of the valuable trademarks owned and used by PepsiCo, Inc. and its subsidiaries and affi liates in the United States and internationally.
GRI indicator ACT! page no.
Economic performance indicators
EC 1 Direct economic value generated and distributed. 2
EC 6 Policy, practices and proportion of spending on locally-based suppliers. 29-31
EC 7 Procedures for local hiring and proportion of senior management hired from the local community. 29-31
EC 8 Development and impact of infrastructure investments and services provided primarily for public benefi t through commercial, in kind or pro bono engagement. 36-43, Back cover
Environmental performance indicators
EN 2 Percentage of materials used that is recycled input materials. 18-19, 24-25
EN 5 Energy saved due to conservation and effi ciency improvements. 6, 12-15, 16-17, 20-23
EN 6 Initiatives to provide energy-effi cient or renewable energy based products and services, and reductions in energy 6, 11, 12-15, 16-17, requirements as a result of these initiatives. 20-23, 24-25, 26-27
EN 7 Initiatives to reduce indirect energy consumption and reductions achieved. 12-15, 20-23, 24-25, 26-27
EN 8 Total water withdrawal by source. 9
EN 9 Water sources signifi cantly affected by withdrawal of water. 9
EN 18 Initiatives to reduce greenhouse gas emissions and reductions achieved. 6, 11, 12-15, 16-17, 20-23, 24-25
EN 22 Total weight of waste by type and disposal method. 12-15, 26-27
EN 26 Initiatives to mitigate environmental impacts of products and services, and extent of impact mitigation. 6, 11, 12-15, 16-17, 20-23, 24-25, 26-27
EN 27 Percentage of products sold and their packaging materials that are reclaimed by category. 18-19, 24-25, 26-27
EN 29 Signifi cant environmental impacts of transporting products and other goods and materials. 6, 12-15, 20-23
Social performance indicators
LA 1 Total workforce by employment type, employment contract and region. 2, 29-31
LA 3 Benefi ts provided to full-time employees. 32, 34-35
LA 7 Rates of injury, occupational diseases, lost days, and absenteeism. 34-35
LA 8 Education, training, counseling, prevention, and risk control programs in place to assist workforce members, their families, or community members regarding serious diseases. 34-35
LA 10 Average hours of training per year per employee by employee category. 20-23, 28, 29-31, 32, 34-35, 44-45
LA 11 Programs for skills management and lifelong learning that support the continued employability of employees and assist them in managing career endings. 28, 29-31, 32, 34-35
LA 12 Percentage of employees receiving regular performance and career development reviews. 32
LA 13 Composition of governance bodies and breakdown of employees per category and other indicators of diversity. 29-31
Human rights performance indicators
HR 3 Total hours of employee training on human rights. 28, 29-31
Society performance indicators
SO 3 Percentage of employees trained in organization’s anti-corruption policies and procedures. 44-45
SO 4 Actions taken in response to incidents of corruption. 44-45
SO 5 Public policy positions and participation in public policy development and lobbying. 24-25
bdl304169_COVERS_gr1.indd 2bdl304169_COVERS_gr1.indd 2 9/10/08 6:05:01 PM9/10/08 6:05:01 PMProcess CyanProcess Cyan Process MagentaProcess Magenta Process YellowProcess Yellow Process BlackProcess Black DieDie
1
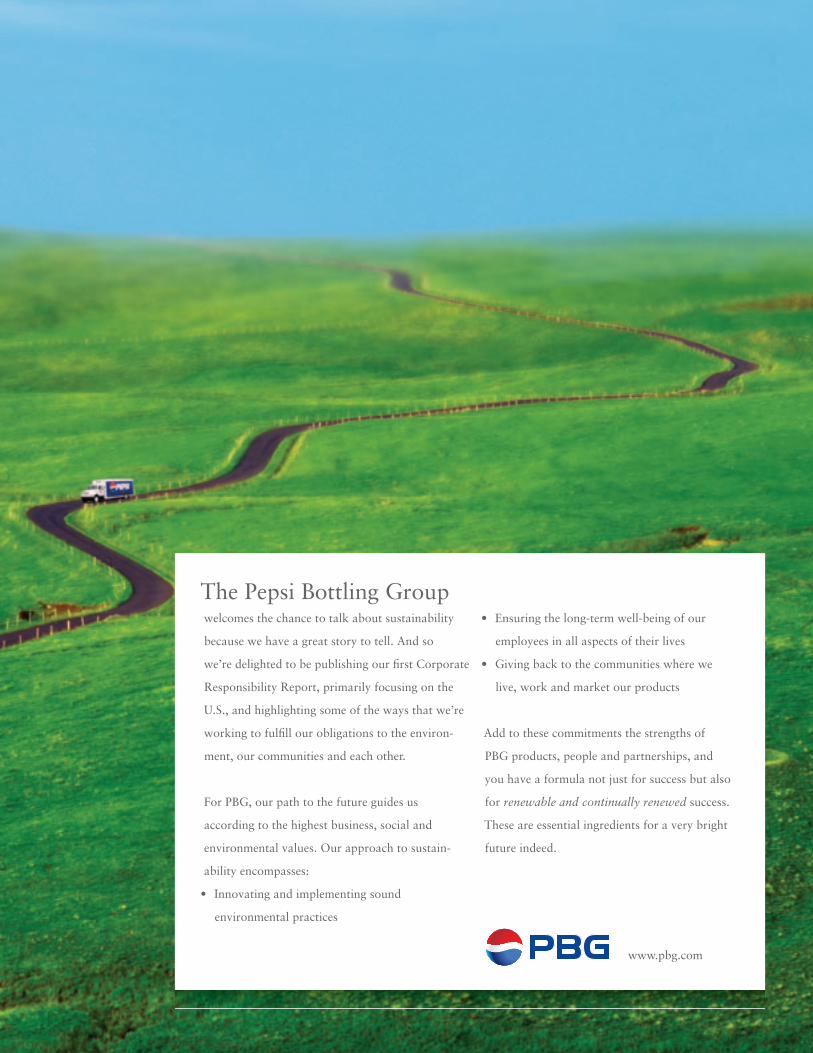
The Pepsi Bottling Groupwelcomes the chance to talk about sustainability
because we have a great story to tell. And so
we’re delighted to be publishing our fi rst Corporate
Responsibility Report, primarily focusing on the
U.S., and highlighting some of the ways that we’re
working to fulfi ll our obligations to the environ-
ment, our communities and each other.
For PBG, our path to the future guides us
according to the highest business, social and
environmental values. Our approach to sustain-
ability encompasses:
• Innovating and implementing sound
environmental practices
• Ensuring the long-term well-being of our
employees in all aspects of their lives
• Giving back to the communities where we
live, work and market our products
Add to these commitments the strengths of
PBG products, people and partnerships, and
you have a formula not just for success but also
for renewable and continually renewed success.
These are essential ingredients for a very bright
future indeed.
www.pbg.com
PBG_Print_Final_gr1.indd 1PBG_Print_Final_gr1.indd 1 9/10/08 6:09:42 PM9/10/08 6:09:42 PM
2
Lightweighting
Energy
Community
Solid Waste
Employee
Recycling
Water
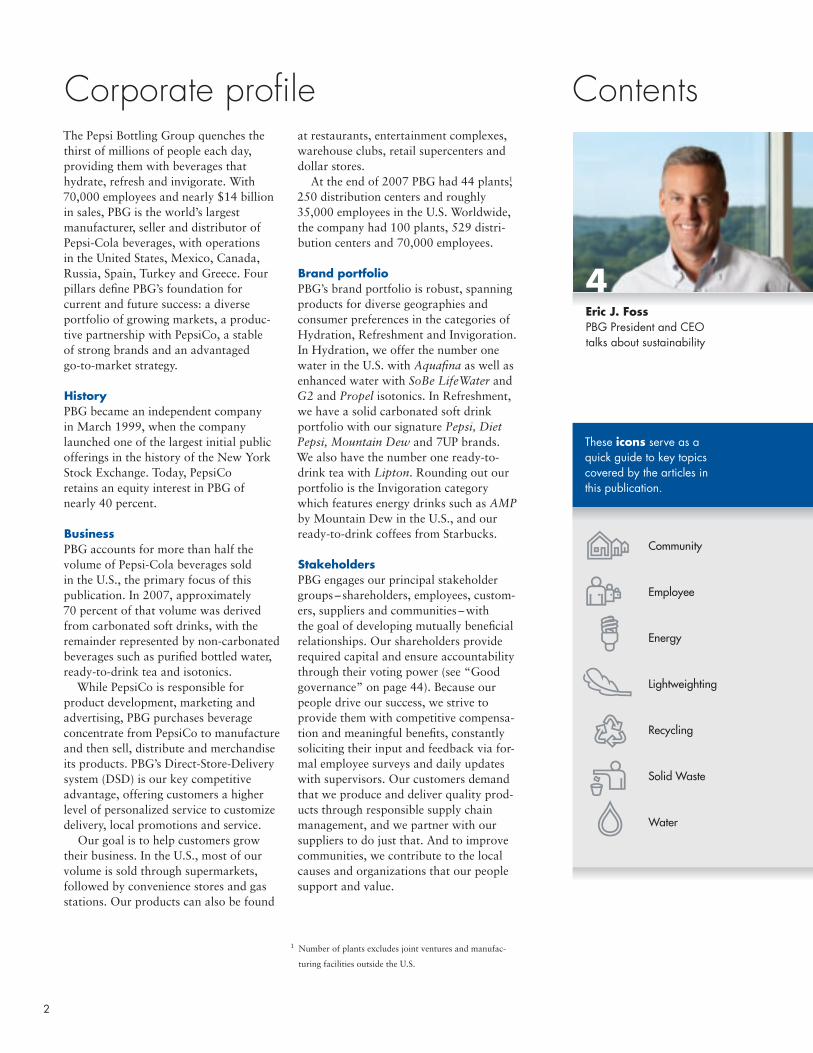
ContentsCorporate profi leThe Pepsi Bottling Group quenches the thirst of millions of people each day, providing them with beverages that hydrate, refresh and invigorate. With 70,000 employees and nearly $14 billion in sales, PBG is the world’s largest manufacturer, seller and distributor of Pepsi-Cola beverages, with operations in the United States, Mexico, Canada, Russia, Spain, Turkey and Greece. Four pillars defi ne PBG’s foundation for current and future success: a diverse portfolio of growing markets, a produc-tive partnership with PepsiCo, a stable of strong brands and an advantaged go-to-market strategy.
History PBG became an independent company in March 1999, when the company launched one of the largest initial public offerings in the history of the New York Stock Exchange. Today, PepsiCo retains an equity interest in PBG of nearly 40 percent.
BusinessPBG accounts for more than half the volume of Pepsi-Cola beverages sold in the U.S., the primary focus of this publication. In 2007, approximately 70 percent of that volume was derived from carbonated soft drinks, with the remainder represented by non-carbonated beverages such as purifi ed bottled water, ready-to-drink tea and isotonics.
While PepsiCo is responsible for product development, marketing and advertising, PBG purchases beverage concentrate from PepsiCo to manufacture and then sell, distribute and merchandise its products. PBG’s Direct-Store-Deliverysystem (DSD) is our key competitive advantage, offering customers a higher level of personalized service to customize delivery, local promotions and service.
Our goal is to help customers grow their business. In the U.S., most of our volume is sold through supermarkets, followed by convenience stores and gas stations. Our products can also be found
at restaurants, entertainment complexes, warehouse clubs, retail supercenters and dollar stores.
At the end of 2007 PBG had 44 plants,1 250 distribution centers and roughly 35,000 employees in the U.S. Worldwide, the company had 100 plants, 529 distri-bution centers and 70,000 employees.
Brand portfolioPBG’s brand portfolio is robust, spanningproducts for diverse geographies and consumer preferences in the categories of Hydration, Refreshment and Invigoration. In Hydration, we offer the number onewater in the U.S. with Aquafi na as well as enhanced water with SoBe LifeWater and G2 and Propel isotonics. In Refreshment, we have a solid carbonated soft drink portfolio with our signature Pepsi, Diet Pepsi, Mountain Dew and 7UP brands. We also have the number one ready-to-drink tea with Lipton. Rounding out our portfolio is the Invigoration category which features energy drinks such as AMP by Mountain Dew in the U.S., and our ready-to-drink coffees from Starbucks.
StakeholdersPBG engages our principal stakeholder groups – shareholders, employees, custom-ers, suppliers and communities – with the goal of developing mutually benefi cial relationships. Our shareholders provide required capital and ensure accountability through their voting power (see “Good governance” on page 44). Because our people drive our success, we strive to provide them with competitive compensa-tion and meaningful benefi ts, constantly soliciting their input and feedback via for-mal employee surveys and daily updates with supervisors. Our customers demand that we produce and deliver quality prod-ucts through responsible supply chain management, and we partner with our suppliers to do just that. And to improve communities, we contribute to the local causes and organizations that our people support and value.
4Eric J. FossPBG President and CEOtalks about sustainability
These icons serve as a quick guide to key topics covered by the articles in this publication.
1 Number of plants excludes joint ventures and manufac-
turing facilities outside the U.S.
PBG_Print_Final_gr5.indd 2PBG_Print_Final_gr5.indd 2 9/16/08 3:53:11 PM9/16/08 3:53:11 PM

3
8Using water wiselyGetting the drop on water conservation
6PBG and the environmentShrinking our footprint with new technologies and process improvements
10Pure effi ciencyHow to squeeze more hyper-purifi ed water out of every drop
12Winning by losingMaking big environmental gains by shedding bottle weight
20Lightening upFrom miles-per-gallon to gallons-per-gallon
29Diversity with a differenceBeyond representationto inclusion
34A holistic approach to employee healthBuilding physical and fi nancial well-being
32What does it take to be admired?Leadership programs and robust benefi ts earn widespread recognition
37Volunteer spotlight: West PhiladelphiaA safe and supportive haven for neighborhood kids
38Volunteer spotlight: Michigan and MinnesotaEmployees turn free time into free homes for neighbors in need
40Volunteer spotlight: Albany, NYA festive holiday for hospitalized veterans
42Corporate philanthropy with a personal touchEmployees set the giving agenda
44A roadmap to responsibilityGood governance sustains PBG’s drive for success
48GRI indexTracking the topics via the Global Reporting Initiative
24Packaging responsibilityCans and bottles take a circular journey
26The road to zeroTurning waste into a resource
46Green funEnvironmental maze and word search puzzle
16Clean and greenEnvironmental responsibility merges with product safety
PBG_Print_Final_gr8.indd 3PBG_Print_Final_gr8.indd 3 9/17/08 10:14:39 PM9/17/08 10:14:39 PM

4
What is PBG’s sustainability strategy?
We’ve developed a three-pronged sustain-ability strategy to help reinforce and advance our core business fundamentals. As always, we are focused on the areas where PBG, as a beverage company, can make the biggest difference; and then we measure that progress to ensure our efforts are both meaningful and successful.
Specifi cally, PBG’s sustainability strat-egy is structured around the environment, employees and communities.• Environment – We’re committed to
using natural resources responsibly and producing less waste, with a primary focus on water conservation, energy management, recycling, lightweighting and self-manufacturing.
• Employees – We’re dedicated to improving our employees’ health and wellness, developing effective leaders and fostering a workplace that is diverse and inclusive.
• Communities – PBG looks for and embraces opportunities to strengthen families and improve neighborhood family centers. Our employees set our giving agenda, helping us deter-mine where to commit our donations, volunteer outreach efforts and civic engagement.
Q&Awith Eric J. Foss
Why do you think it’s important to pursue sustainable practices?
Our approach to sustainability is an extension of our values: to respect the people around us – colleagues, customers and consumers; to operate with a sense of responsibility to those who work for, buy from and invest in our company; and to conduct our business in the right way. Sustainability makes our organiza-tion and communities stronger, and it makes our customers and consumers more loyal. It is a natural outgrowth of who we are, what we do and how we do it.
How do you implement your strategy?
Integration and measurement are key to executing our strategy. We make sustainability a part of who we are and what we do by baking it into our overall business strategy. This increases the likelihood of success because the organization sees that sustainability isn’t just the latest ad slogan. It’s here to stay so each of us needs to adopt more sustainable habits quickly to stay relevant and be effective in our jobs.
Second, we will measure our progress. It’s true that what gets measured gets done so we have to let employees know what the metrics and tangible goals are.
Communities
Connect to the community• The PBG Foundation• Financial support• Volunteerism and civic engagement
Three platforms of PBG’s sustainability strategyEnvironment
Use natural resources responsibly• Water conservation• Energy management• Self-manufacturing
Produce less waste• Recycling• Lightweighting
Employees
Build a better place to work • Health and fi nancial wellness• Diversity and inclusion• Leadership and values
Eric J. Foss, President and Chief Executive Offi cer, discusses the importance of communicating the company’s commitment to sustainability.
PBG_Print_Final_gr5.indd 4PBG_Print_Final_gr5.indd 4 9/16/08 3:55:37 PM9/16/08 3:55:37 PM

5
”Sustainability makes our organization and communities stronger, and it makes our customers and con-sumers more loyal.“ Eric J. FossPresident and Chief Executive Offi cer
How do you defi ne success in terms of your sustainability efforts?
Each year, we look to improve upon our past sustainability efforts. We defi ne success by how well we:• Improve our water and energy
conservation efforts• Utilize more recycled materials in
our bottles• Educate consumers to recycle more• Facilitate healthier lifestyles among
our employees• Strengthen the communities where
we work and live
What are some of the environmental advancements you’ve made?
I’m very proud of what we are doing and what we have already achieved at PBG, especially in the areas of water, energy and lightweighting.• Through the adoption of new water
sanitation technologies and air rinsing systems, we’re realizing signifi cant reductions in our water usage through-out our supply chain.
• In energy, we’ve made changes to our fl eet and transportation systems that have decreased fuel consumption and reduced our carbon footprint. A new initiative to retire and redeploy older full-service vending machines also has produced greater energy savings. And, in 2007, PBG was recognized by the U.S. Environmental Protection Agency for buying green power certifi cates equivalent to our entire U.S. electricity consumption.
• To reduce the amount of materials required to produce our packaging, PBG pursues bottle lightweighting, saving millions of pounds of plastic every year.
By focusing on areas that are relevant to PBG’s business, we are able to make signifi cant, continuous improve-ments. That’s a winning proposition for PBG and the community.
You also mentioned employees and communities as elements of your sustainability strategy. What prog-ress have you made in these areas?
We work hard to make PBG a great place to work. Through a range of traditional and progressive benefi ts, employees gain access to resources and programs that empower them to make informed decisions about their health, careers and fi nancial well-being. As a result of our efforts – and outcomes – PBG has earned recognition as a best place to work in DiversityInc, Black Enterprise and Hispanic Business magazines.
PBG is a global company but when it comes to community outreach, we take a very local approach. Our particular strategy is unique because our employees determine which causes and organizations we support. Through fi nancial contribu-tions, product donations and volunteer matching grants, we now contribute more than $16 million a year to local charities.
Why is PBG creating a report and why now?
As customers, consumers, recruits and shareholders become more educated about sustainability, they are increasingly conscious of a company’s track record when making their purchase, employment and investment decisions. Simply stated, communicating a company’s sustainability record matters. Therefore, it’s important for PBG to be a visible participant in this ongoing dialogue and to more regularly report back on our progress.
PBG_Print_Final_gr5.indd 5PBG_Print_Final_gr5.indd 5 9/16/08 3:56:25 PM9/16/08 3:56:25 PM
66
Lightweighting
Energy
Solid Waste
Recycling
Water
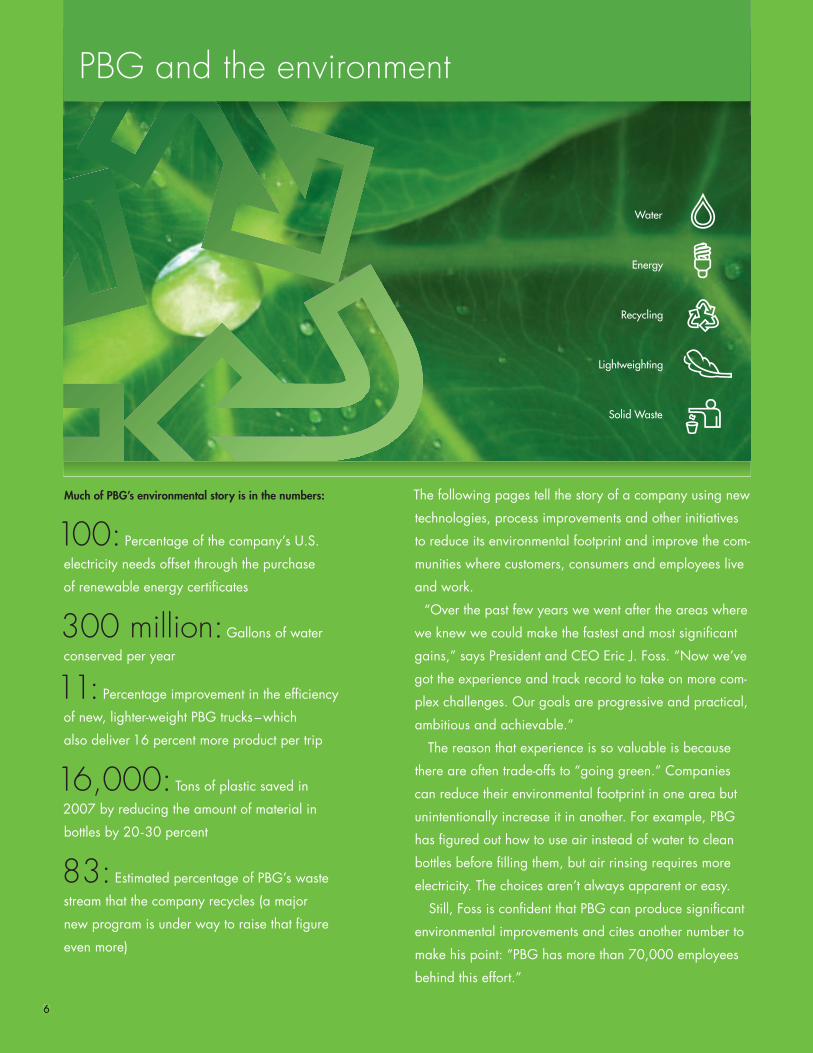
PBG and the environment
Much of PBG’s environmental story is in the numbers:
100: Percentage of the company’s U.S.
electricity needs offset through the purchase
of renewable energy certifi cates
300 million:Gallons of water
conserved per year
11: Percentage improvement in the effi ciency
of new, lighter-weight PBG trucks –which
also deliver 16 percent more product per trip
16,000: Tons of plastic saved in
2007 by reducing the amount of material in
bottles by 20-30 percent
83: Estimated percentage of PBG’s waste
stream that the company recycles (a major
new program is under way to raise that fi gure
even more)
The following pages tell the story of a company using new
technologies, process improvements and other initiatives
to reduce its environmental footprint and improve the com-
munities where customers, consumers and employees live
and work.
“Over the past few years we went after the areas where
we knew we could make the fastest and most signifi cant
gains,” says President and CEO Eric J. Foss. “Now we’ve
got the experience and track record to take on more com-
plex challenges. Our goals are progressive and practical,
ambitious and achievable.”
The reason that experience is so valuable is because
there are often trade-offs to “going green.” Companies
can reduce their environmental footprint in one area but
unintentionally increase it in another. For example, PBG
has fi gured out how to use air instead of water to clean
bottles before fi lling them, but air rinsing requires more
electricity. The choices aren’t always apparent or easy.
Still, Foss is confi dent that PBG can produce signifi cant
environmental improvements and cites another number to
make his point: “PBG has more than 70,000 employees
behind this effort.”
PBG_Print_Final_gr2.indd 6PBG_Print_Final_gr2.indd 6 9/10/08 7:41:36 PM9/10/08 7:41:36 PM
7
Environmental Policy Statement
The Pepsi Bottling Group recognizes the responsible management of the environment as one of our key corporate priorities and a signifi cant element in our business strategy. PBG is committed to implementing policies and procedures that ensure our operations are conducted in compliance with applicable laws, regu-lations and standards.
The Pepsi Bottling Group will achieve responsible environmental compliance through the following:• Minimizing the potential for adverse
impact on the environment by operat-ing our facilities safely and prudently; effi ciently using water, energy and other natural resources; seeking ways to minimize and reuse wastes; and otherwise complying with all applicable laws and regulations affecting the envi-ronment. In cases where no specifi c law or regulation exists, we will imple-ment measures that protect our employ-ees, neighbors, customers, the public and the environment.
• Integrating appropriate environmental policies and programs into each segment of our business and evaluating manage-ment on its performance in implement-ing these policies and programs.
• Striving to improve environmental performance as technical developments, scientifi c understanding, customer and community needs, and regulatory requirements evolve and change.
• Educating, training and incenting employees to ensure they conduct their environmental activities in a responsible manner.
• Communicating to our employees, neighbors, customers and the public on activities involving the environment.
• Measuring performance with regularly scheduled audits to ensure our opera-tions comply with this Policy.
The Pepsi Bottling Group takes responsibility for implementing the prin-ciples of this policy through the commit-ment and actions of each employee.
www.pbg.com/environmental
PBG_Print_Final_gr1.indd 7PBG_Print_Final_gr1.indd 7 9/10/08 6:19:04 PM9/10/08 6:19:04 PM

8
PBG gets the drop on water conservation.
For something as simple as a couple of hydrogen atoms stuck to an oxygen atom, water certainly makes a big splash.
8
PBG_Print_Final_gr1.indd 8PBG_Print_Final_gr1.indd 8 9/10/08 6:39:54 PM9/10/08 6:39:54 PM

9
in 2007 – is used primarily to clean, sanitize, heat and cool the company’s plants and equipment –much like other manufacturers use water.
A good analogy can be found in what happens when you take a glass of water from the faucet. First, you probably let the water run for a few seconds until it cools off. Then you fi ll the glass with water, drink some, dump the rest and use more water to wash and rinse the glass. By the time you’re done, you might have used 20 ounces of water but drank only 10.
In PBG terms, that would have given you a water usage ratio of 2.0, calculated by dividing 20 ounces
used by 10 ounces consumed. In the U.S., PBG’s water usage ratio for 2007 was 1.83, down a little more than one percent from 2006.
For PBG, the reduc-tion translates into a lot of water – 280 million liters, or 73.7 million gallons –which is why the company is working hard to maintain that trend. The following stories describe some of the ways PBG is using water as productively as possible.
ixty percent of our bodies is water. Seventy percent of the earth is covered with it.
Facts like these are driven deep into our brains – which, by the way, are between 77 and 78 percent water.
Water is equally vital to businesses. Manu-facturing and mining, paper and petroleum, electronics and electric power generation, com-puter chips and even potato chips – these and scores of other industries all use large quantities of water in their daily operations.
But PBG is a beverage company. And so, in a sense, PBG is all about water. So it’s natural that PBG cares a lot about it – where it comes from, how much we use, how it’s used and how it’s conserved.
A little more than half of the water that PBG uses is bottled as the beverages that hun-dreds of millions of consumers around the world drink each year –whether for refreshment, hydration, wellness or energy. The rest of the water – about 47 percent
What you can do to conserve water
• Fix leaky faucets.• Cut back on outside watering. Landscape
with grasses and plants that don’t require much watering.
• Install water-conserving toilets, washing machines and shower heads.
• Put a brick in the tank of old-style toilets (just be sure to place the brick where it won’t interfere with the fl ushing mechanisms).
• Don’t let the water run before or while brushing your teeth.
1 International Bottled Water Association
Did you know...
Forty-three of PBG’s 44 plants in the U.S. use water from a public supply–one uses private wells, and two use both water from private wells and public supply. Of the total withdrawals of fresh ground water in the U.S., how much is used in the production of bottled water?1
A 9%B 2%C 0.019%
Answer: (C) 0.019% is used
S
Product53%
Domestic5%
Process26%
Sanitation16%
PBG plant water usage
PBG’s 2007 water usage ratio was 1.83
PBG_Print_Final_gr9.indd 9PBG_Print_Final_gr9.indd 9 9/18/08 2:12:25 PM9/18/08 2:12:25 PM

10
Pure effi ciency Reverse osmosis enables PBG to squeeze more quality and consistency out of every drop of water.
Two of the most important things that people look for when making a purchase are quality and consistency. With beverages, they expect a favorite brand to taste as good and be as good as the one they had the day before, even if it was purchased on the other side of the world. Providing that qual-ity and consistency depends on the quality of the water used to make the beverages.
One of the major reasons that Aquafi na purifi ed water is consistent in taste and quality is the sophisticated, seven-step fi ltration process implemented at PBG. And the most powerful steps in that process involve a hyper-fi ltration technology called reverse osmosis, or RO.
Quality quaffi ngThe PBG RO process produces water with a quality level far above what’s required for drink-ing water by the U.S. Environmental Protection Agency. In fact, RO is so powerful it can strain individual molecules from water, turning salt water into fresh water and taking the color out of coffee. At PBG, RO is essential to fi ltering out salts, like sodium chloride, and other substances in water that can affect the purity, refreshment and taste of Aquafi na.
When PBG fi rst began using conventionally designed RO units some 20 to 25 percent of the water entering the units was sent down the drain. Recognizing an opportunity, PBG has since enhanced conventional RO design, making it more water-effi cient and enabling us to reduce the amount of water sent down the drain to only 15 percent. Based on current production, the company conserves 280 million gallons of water in the U.S. each year.
That’s no drop in the bucket. It’s a year’s supply of drinking water for a million people.
RO: The new MOToday, many PBG plants are equipped with these high-effi ciency RO units, resulting in dramatic improvements in water conservation. For example, our Denver plant updated its RO system and con-served seven million gallons of water annually.
“Quality and consistency will always be major drivers for our business,” says Gina McElgunn, PBG’s Vice President of Quality. “But effi ciency is another absolute, and reverse osmosis is one tech-nology that scores big on all counts.”
Compressors that conservePBG is a company that runs not only on water but also on air.
Many of PBG’s machines that are used to move, fi ll, cap and package bottles require compressed air from air compressors that need to stay cool. In the past, PBG piped cold water through the compressors to keep the temperature down. The water would then travel down into the drain.
Tim Matson, Vice President of Manufacturing for PBG’s Central Business Unit says, “We wanted to fi nd a way to cool the equipment without using water. So we teamed up with other PBG facilities in the region and invested in air-cooled replace-ment compressors that require no water at all. We saw a return on our investment immediately.”
In addition to decreasing water usage, the new compressors save about 56,000 kilowatt-hours of electricity a year –a six-percent reduction–which is enough to power fi ve average U.S. households.
PBG_Print_Final_gr1.IND_CS 10PBG_Print_Final_gr1.IND_CS 10 9/3/08 2:25:57 PM9/3/08 2:25:57 PMProcess CyanProcess Cyan Process MagentaProcess Magenta Process YellowProcess Yellow Process BlackProcess Black

1111
PBGWins EPAGreen PowerLeadershipAward
Thank you, EPA.In 2007, The Pepsi Bottling Group was one of seven companies to earn a Green Power Leadership award from the U.S. Environmental Protection Agency.
We won the award by buying green power certifi cates equivalent to our entire U.S. electricity consumption–nearly 458 million kilowatt hours of power. The certifi cates help pay for the development of more solar, wind and other sources of “green,” renewable power to combat climate change.
Best of all, this and other green initiatives we’ve undertaken are proving to be not only the right thing to do, but also the smart thing to do. That’s why we signed up for the EPA’s Fortune 500 Green Power Challenge program– to encourage other leading corporations to purchase green power certifi cates, and go for the green themselves.
www.pbg.com/environmental/
The Pepsi Bottling Group
PBG_Print_Final_gr1.IND_CS 11PBG_Print_Final_gr1.IND_CS 11 9/3/08 2:26:04 PM9/3/08 2:26:04 PMProcess CyanProcess Cyan Process MagentaProcess Magenta Process YellowProcess Yellow Process BlackProcess Black
12
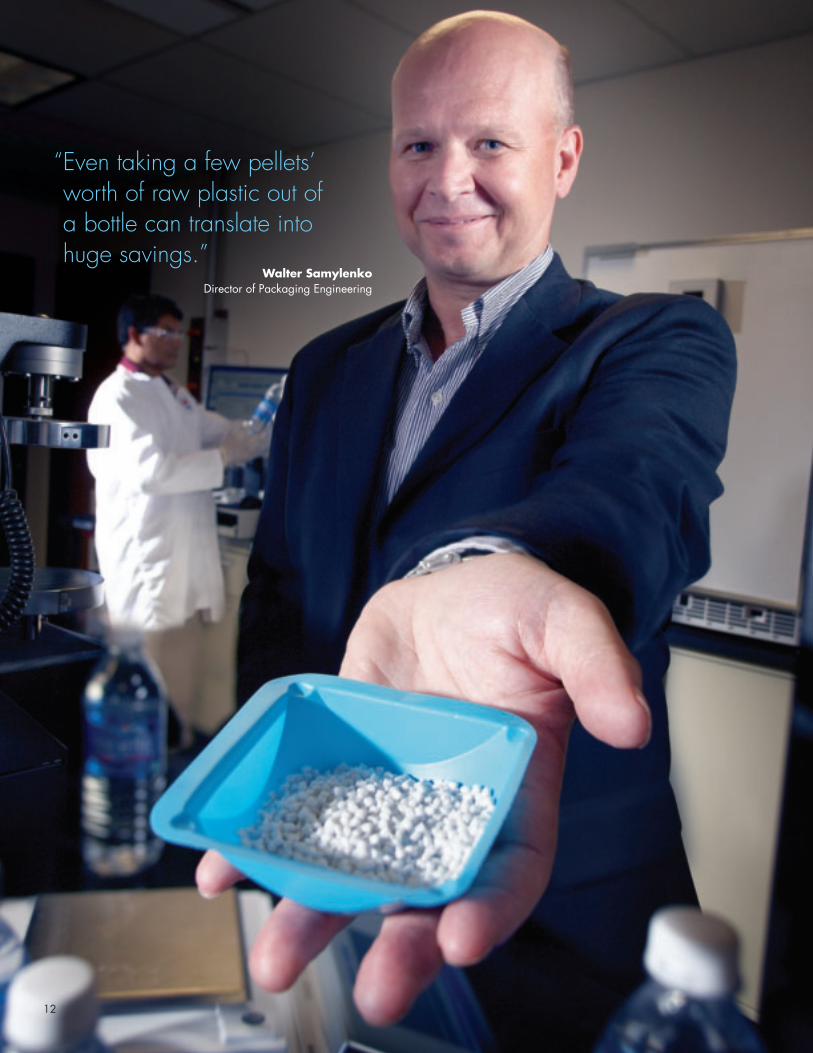
Walter SamylenkoDirector of Packaging Engineering
“ Even taking a few pellets’ worth of raw plastic out of a bottle can translate into huge savings.”
12
PBG_Print_Final_gr1.indd 12PBG_Print_Final_gr1.indd 12 9/10/08 6:25:07 PM9/10/08 6:25:07 PM
13
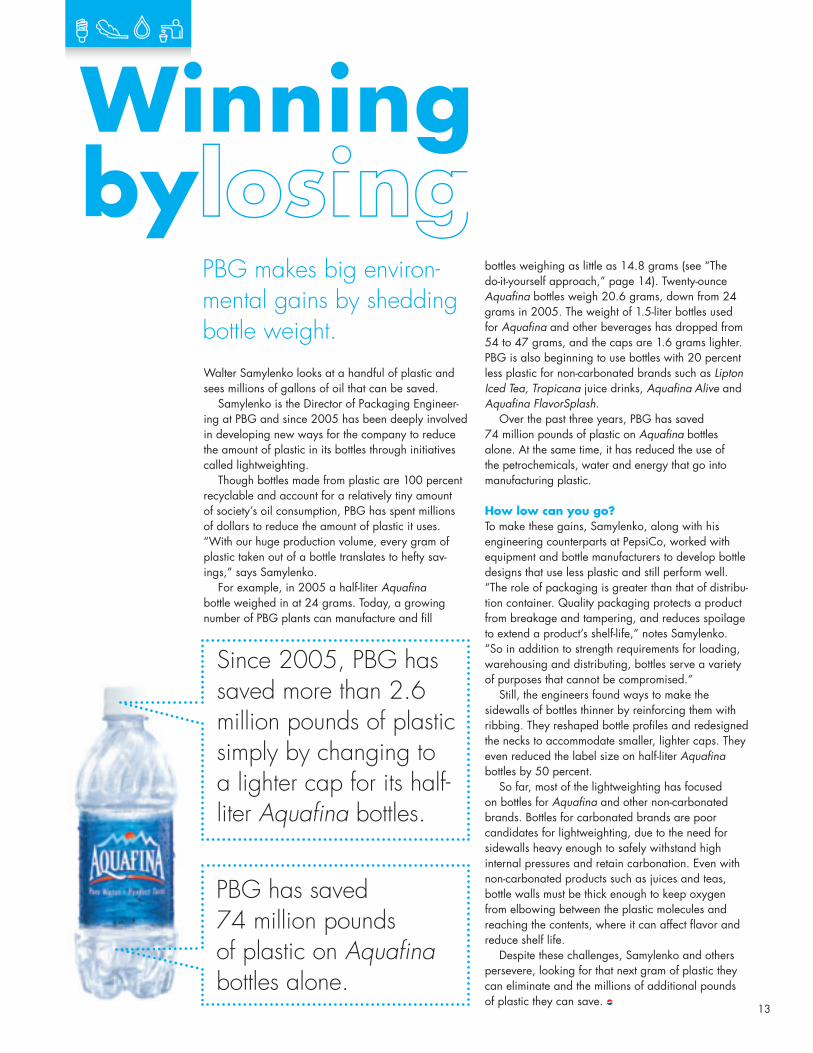
PBG makes big environ-mental gains by shedding bottle weight.
Winningbylosing
bottles weighing as little as 14.8 grams (see “The do-it-yourself approach,” page 14). Twenty-ounce Aquafi na bottles weigh 20.6 grams, down from 24 grams in 2005. The weight of 1.5-liter bottles used for Aquafi na and other beverages has dropped from 54 to 47 grams, and the caps are 1.6 grams lighter. PBG is also beginning to use bottles with 20 percent less plastic for non-carbonated brands such as Lipton Iced Tea, Tropicana juice drinks, Aquafi na Alive and Aquafi na FlavorSplash.
Over the past three years, PBG has saved 74 million pounds of plastic on Aquafi na bottles alone. At the same time, it has reduced the use of the petrochemicals, water and energy that go into manufacturing plastic.
How low can you go?To make these gains, Samylenko, along with his engineering counterparts at PepsiCo, worked with equipment and bottle manufacturers to develop bottle designs that use less plastic and still perform well. “The role of packaging is greater than that of distribu-tion container. Quality packaging protects a product from breakage and tampering, and reduces spoilage to extend a product’s shelf-life,” notes Samylenko. “So in addition to strength requirements for loading, warehousing and distributing, bottles serve a variety of purposes that cannot be compromised.”
Still, the engineers found ways to make the sidewalls of bottles thinner by reinforcing them with ribbing. They reshaped bottle profi les and redesigned the necks to accommodate smaller, lighter caps. They even reduced the label size on half-liter Aquafi na bottles by 50 percent.
So far, most of the lightweighting has focused on bottles for Aquafi na and other non-carbonated brands. Bottles for carbonated brands are poor candidates for lightweighting, due to the need for sidewalls heavy enough to safely withstand high internal pressures and retain carbonation. Even with non-carbonated products such as juices and teas, bottle walls must be thick enough to keep oxygen from elbowing between the plastic molecules and reaching the contents, where it can affect fl avor and reduce shelf life.
Despite these challenges, Samylenko and others persevere, looking for that next gram of plastic they can eliminate and the millions of additional pounds of plastic they can save.
Walter Samylenko looks at a handful of plastic and sees millions of gallons of oil that can be saved.
Samylenko is the Director of Packaging Engineer-ing at PBG and since 2005 has been deeply involved in developing new ways for the company to reduce the amount of plastic in its bottles through initiatives called lightweighting.
Though bottles made from plastic are 100 percent recyclable and account for a relatively tiny amount of society’s oil consumption, PBG has spent millions of dollars to reduce the amount of plastic it uses. “With our huge production volume, every gram of plastic taken out of a bottle translates to hefty sav-ings,” says Samylenko.
For example, in 2005 a half-liter Aquafi na bottle weighed in at 24 grams. Today, a growing number of PBG plants can manufacture and fi ll
PBG has saved 74 million pounds of plastic on Aquafi na bottles alone.
Since 2005, PBG has saved more than 2.6 million pounds of plastic simply by changing to a lighter cap for its half-liter Aquafi na bottles.
PBG_Print_Final_gr1.indd 13PBG_Print_Final_gr1.indd 13 9/10/08 6:40:13 PM9/10/08 6:40:13 PM

14
One of the biggest challenges in taking more weight out of plastic bottles is keeping empties strong enough to survive the trip from the bottle manufacturer to the bottling plant.
So what if there were no trip? What if PBG fed its bottling lines with bottles made just a few feet away?
Since 2004, PBG has been doing just that, generating key environmental effi ciencies in the process. In 2007, the company announced its biggest self-manufacturing initiative yet, a plan to equip its largest plant, in Toronto, with four bottle blowing production lines by the end of 2008.
A triple-play ROIAs with all major capital expenditure decisions, PBG studied both the economic and the environ-mental impacts of the proposed investment. The analysis showed the potential not only for major economic benefi ts but also for reducing the green-house gas emissions of the bottle manufacturing and transportation processes for the Toronto opera-tion by 35 percent.
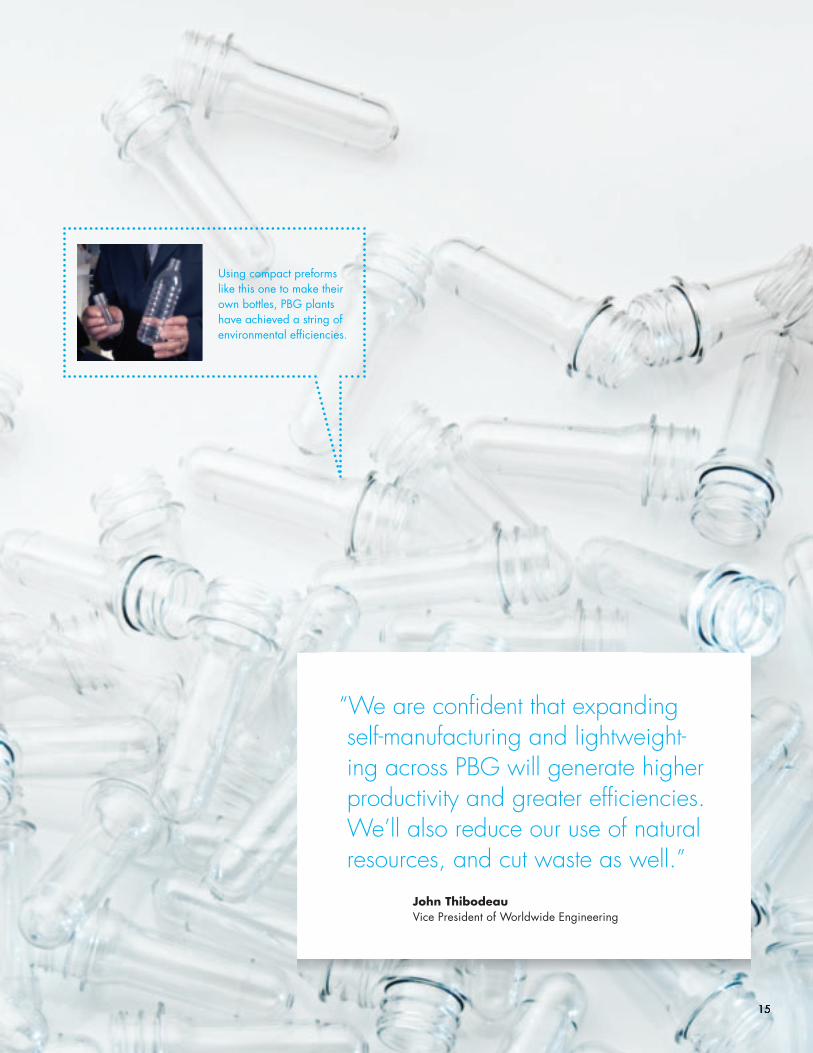
For example, trucks will deliver compact plastic preforms for the manufacturing equipment instead of full-size, empty bottles. That will reduce the number of deliveries by 90 percent, saving diesel fuel and cutting emissions.
Energy usage will drop as well. PBG’s state-of-the-art bottle forming equipment is more effi cient than the older equipment that many third-party bottle manufacturers still use.
What’s more, the PBG Toronto plant’s need to rinse trucked-in bottles before fi lling them will be eliminated because the bottle blowing and fi lling process will now be side-by-side, saving hundreds of thousands of gallons of water each year.
“We are confi dent that expanding self-manufactur-ing and lightweighting across PBG will generate higher productivity and greater effi ciencies,” says John Thibodeau, Vice President of Worldwide Engineering. “We’ll also reduce our use of natural resources, and cut waste as well. It’s hard to argue with that kind of triple-play return on investment.”
The do-it-yourself approachToronto self-manufacturing: Projected effi ciency improvements
Reductions related to the bottle manufacturing and transportation processes
Annual production volume 660 million bottles
Decrease in greenhouse gas emissions 35%Decrease in diesel fuel consumption 92%Decrease in electricity usage 29%
PBG shrinks its environ-mental footprint by making its own bottles.
PBG_Print_Final_gr1.indd 14PBG_Print_Final_gr1.indd 14 9/10/08 6:27:58 PM9/10/08 6:27:58 PM
15
Using compact preforms like this one to make their own bottles, PBG plants have achieved a string of environmental effi ciencies.
“We are confi dent that expanding self-manufacturing and lightweight-ing across PBG will generate higher productivity and greater effi ciencies. We’ll also reduce our use of natural resources, and cut waste as well.”
John ThibodeauVice President of Worldwide Engineering
PBG_Print_Final_gr1.indd 15PBG_Print_Final_gr1.indd 15 9/10/08 6:28:34 PM9/10/08 6:28:34 PM
16
BG has an excellent record for providing consumers with safe, reli-able and great-tasting beverages–
invigorating energy drinks, refreshing carbonated soft drinks and hydrating bever-ages that promote health and wellness. PBG attributes much of this success to its selection of high-quality ingredients and packaging. But that’s only part of the story.
The rest takes place in PBG plants, where the bottling process adheres to cleanliness standards that some might call extreme, but which the company and its workers see as required. The traditional methods of meeting such standards require thousands of gallons of water per plant, per day to rinse bottles and sanitize production lines. Recent breakthroughs, however, have
that, you’d give the spoon a fi nal rinse with room-temperature water until the spoon was cooled down.
There’s no question this method worked, but PBG’s quality team knew there had to be a way to achieve the same level of sanitization without using so much water and energy. So it challenged the suppliers of cleansing solutions to come up with a way that would eliminate the second, room-temperature rinse and reduce the amount of energy needed to reheat the water and equipment after the rinse. And they did, by developing products that allow sanitization to start directly after the cleaning cycle.
Today, PBG has converted about 78 percent of its bottling lines to the new pro-cess, reducing the process from fi ve steps
Clean and green
enabled the company to maintain its uncom-promising commitment to product quality and safety while also dramatically reducing water usage and energy consumption.
Beyond squeaky cleanImagine that you wanted to wash a mixing spoon using PBG methods. Under the original system, you’d start by rinsing the spoon with room-temperature water for 5 -10 minutes.
Then you’d spray it with a mixture of detergent and 140°F water for 20 minutes. After that, you’d rinse the spoon with room-temperature water until all residual detergent is gone.
Next, you’d heat that room-temperature water up to 180°F for 15 minutes. After
Every drop counts
As PBG Senior Vice President of Worldwide Operations, Victor Crawford is looking for ways to conserve water. He readily admits that the task is getting harder as the largest and most obvious improvements are made. But he knows more opportunities exist.
To help fi nd them, PBG has been dispatching a team of independent consultants to move into its plants for two weeks at a time, scrutinize every aspect of its operations and recom-mend water conservation methods.
“The key will be making incremental changes that eventually yield signifi cant impacts,” notes Crawford. “It may be as simple as installing a self-closing valve on a water faucet or fi nding faster ways to detect leaks.”
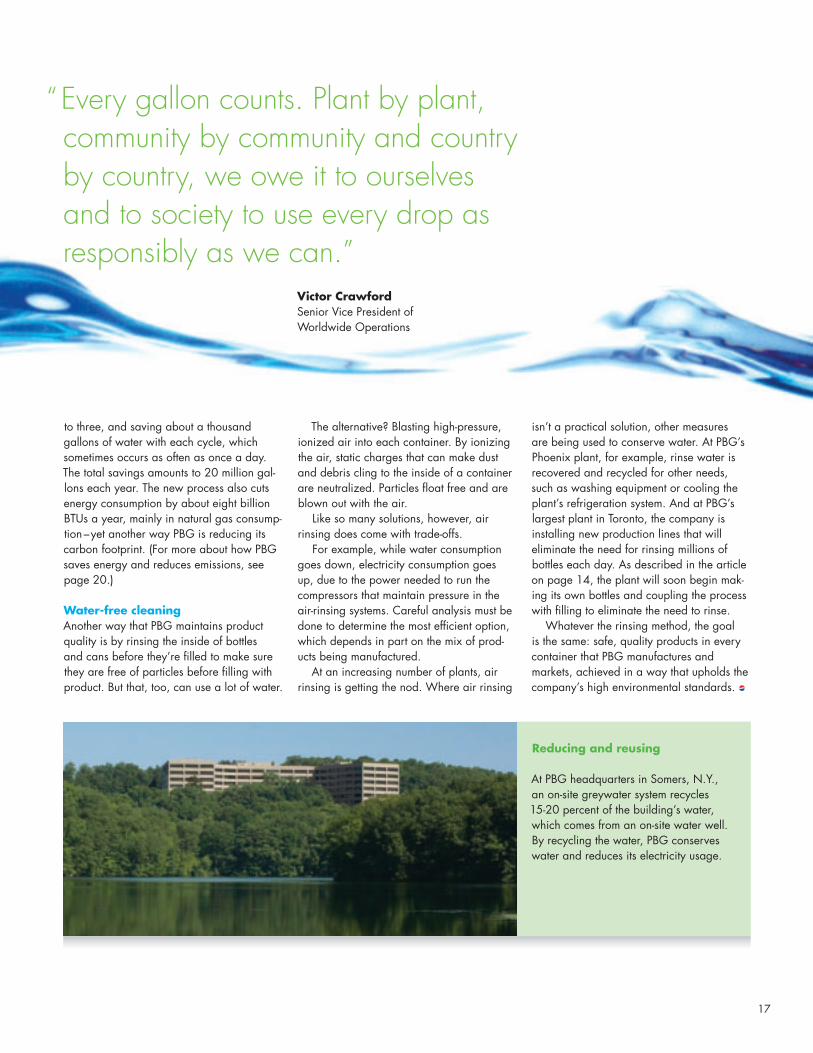
“Every gallon counts,” he adds. “Plant by plant, community by community and country by country, we owe it to ourselves and to society to use every drop as responsibly as we can.”
P
PBG_Print_Final_gr9.indd 16PBG_Print_Final_gr9.indd 16 9/18/08 2:17:19 PM9/18/08 2:17:19 PM
17
Reducing and reusing
At PBG headquarters in Somers, N.Y., an on-site greywater system recycles 15-20 percent of the building’s water, which comes from an on-site water well. By recycling the water, PBG conserves water and reduces its electricity usage.
to three, and saving about a thousand gallons of water with each cycle, which sometimes occurs as often as once a day. The total savings amounts to 20 million gal-lons each year. The new process also cuts energy consumption by about eight billion BTUs a year, mainly in natural gas consump-tion–yet another way PBG is reducing its carbon footprint. (For more about how PBG saves energy and reduces emissions, see page 20.)
Water-free cleaningAnother way that PBG maintains product quality is by rinsing the inside of bottles and cans before they’re fi lled to make sure they are free of particles before fi lling with product. But that, too, can use a lot of water.
The alternative? Blasting high-pressure, ionized air into each container. By ionizing the air, static charges that can make dust and debris cling to the inside of a container are neutralized. Particles fl oat free and are blown out with the air.
Like so many solutions, however, air rinsing does come with trade-offs.
For example, while water consumption goes down, electricity consumption goes up, due to the power needed to run the compressors that maintain pressure in the air-rinsing systems. Careful analysis must be done to determine the most effi cient option, which depends in part on the mix of prod-ucts being manufactured.
At an increasing number of plants, air rinsing is getting the nod. Where air rinsing
“Every gallon counts. Plant by plant, community by community and country by country, we owe it to ourselves and to society to use every drop as responsibly as we can.”
Victor Crawford Senior Vice President of
Worldwide Operations
isn’t a practical solution, other measures are being used to conserve water. At PBG’s Phoenix plant, for example, rinse water is recovered and recycled for other needs, such as washing equipment or cooling the plant’s refrigeration system. And at PBG’s largest plant in Toronto, the company is installing new production lines that will eliminate the need for rinsing millions of bottles each day. As described in the article on page 14, the plant will soon begin mak-ing its own bottles and coupling the process with fi lling to eliminate the need to rinse.
Whatever the rinsing method, the goal is the same: safe, quality products in every container that PBG manufactures and markets, achieved in a way that upholds the company’s high environmental standards.
PBG_Print_Final_gr1.indd 17PBG_Print_Final_gr1.indd 17 9/10/08 6:32:20 PM9/10/08 6:32:20 PM
1818
PBG_Print_Final_gr1.indd 18PBG_Print_Final_gr1.indd 18 9/10/08 6:33:29 PM9/10/08 6:33:29 PM

19
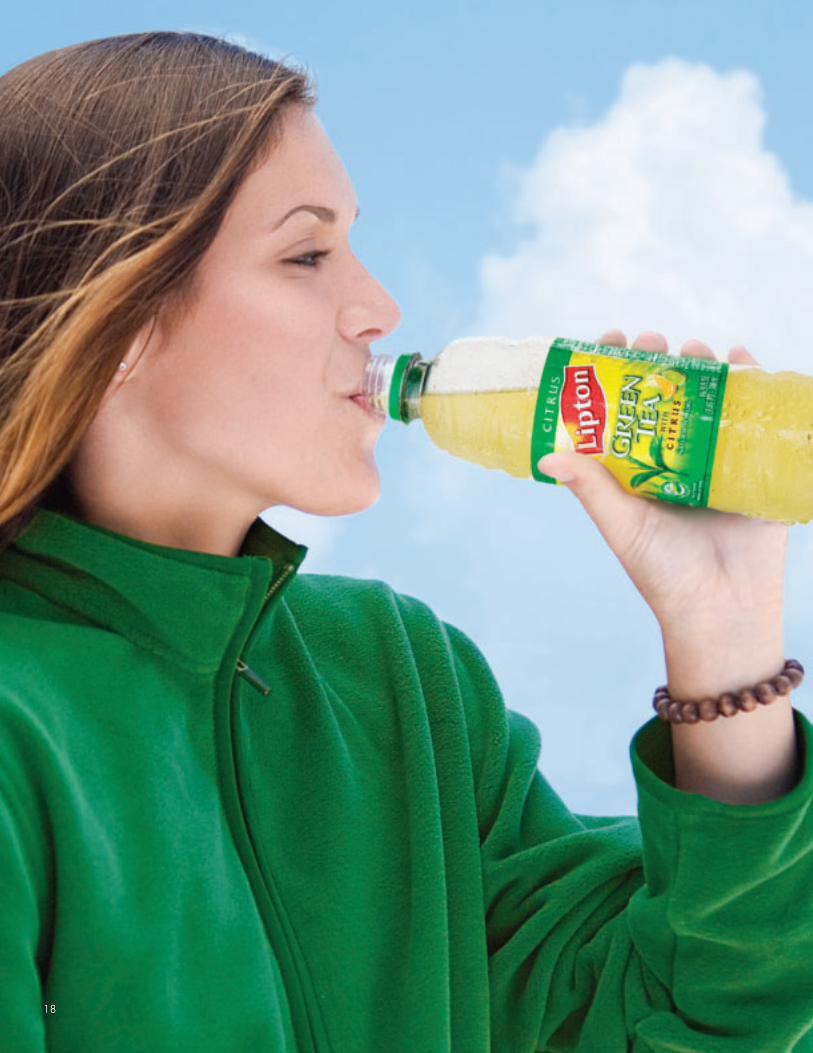
Put away the magnifying glass.This woman’s fl eece jacket is made from 25 recycled plastic soda and water bottles – the same kind that we use in bottling Pepsi-Cola, Aquafi na, Lipton Green Tea and other beverages.
In fact, all of PBG’s cans and bottles are recyclable, making them excellent candidates for transfor-mations–not only for clothing but also carpets, computer keyboards, auto parts and new bottles…
…including many of the new bottles we use, which contain 10 percent recycled plastic.
With our aluminum soda cans, the recycled content jumps to 41 percent. That’s especially important, because making cans from recycled aluminum requires just fi ve percent of the energy needed to make them from aluminum ore.
in this picture?
Can you fi nd the
Though plastic bottles and aluminum cans make up less than two percent of the total U.S. municipal waste stream, recycling them helps reduce oil consumption and greenhouse gas emissions.
That’s an idea we can all warm up to.www.pbg.com
The Pepsi Bottling Group
PBG_Print_Final_gr1.indd 19PBG_Print_Final_gr1.indd 19 9/10/08 6:33:50 PM9/10/08 6:33:50 PM
20
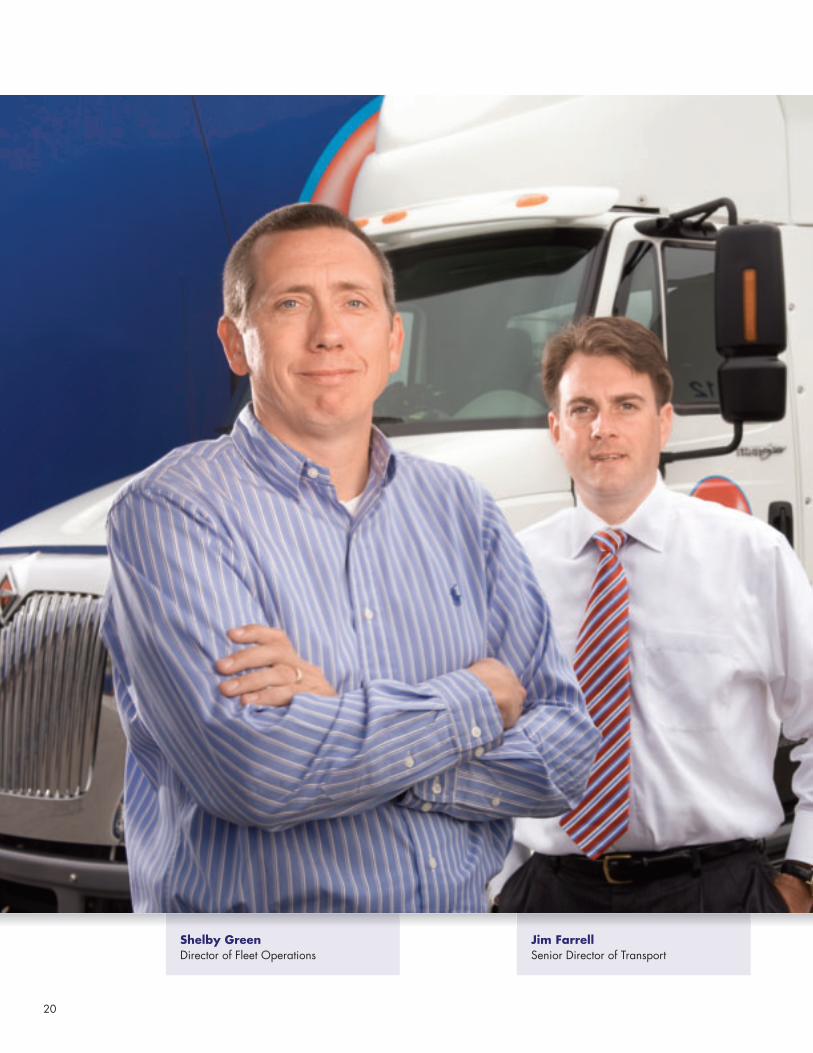
Shelby GreenDirector of Fleet Operations
Jim FarrellSenior Director of Transport
PBG_Print_Final_gr1.indd 20PBG_Print_Final_gr1.indd 20 9/10/08 6:38:31 PM9/10/08 6:38:31 PM

21
ne of the main focal points of PBG’s efforts to reduce its envi-
ronmental impact is the fuel consumption of its vehicles and the resulting green-house gas emissions. And no wonder.
Those vehicles – nearly 26,000 owned or leased by the company, plus more operated by third-party carriers – use about 41.4 million gallons of fuel each year. In doing so, they travel millions of miles, moving beverage ingredients, fi nished products, coolers, vending ma-chines, recyclable materials and more.
All told, PBG’s vehicles support a system that makes, sells and distributes just over 2.6 billion gallons of products a year. That works out to 0.016 gallons of fuel– about a quarter cup – consumed for each gallon of product that’s pro-duced. Nevertheless, PBG is out to trim that gallons-per-gallon (GPG) fi gure even more.
Lightening upWell before fuel prices shot into the stratosphere, PBG was working on ways to reduce its transport fl eet’s impact on the atmosphere.
Shelby Green is PBG’s Director of Fleet Operations. He credits his team for realizing that the route to reducing
Lightening up
Shelby Green and Jim Farrell have helped PBG make dramatic
improvements in fuel effi ciency.
From miles-per-gallon to gallons-per-gallon.
O
PBG_Print_Final_gr1.indd 21PBG_Print_Final_gr1.indd 21 9/10/08 6:39:08 PM9/10/08 6:39:08 PM
22
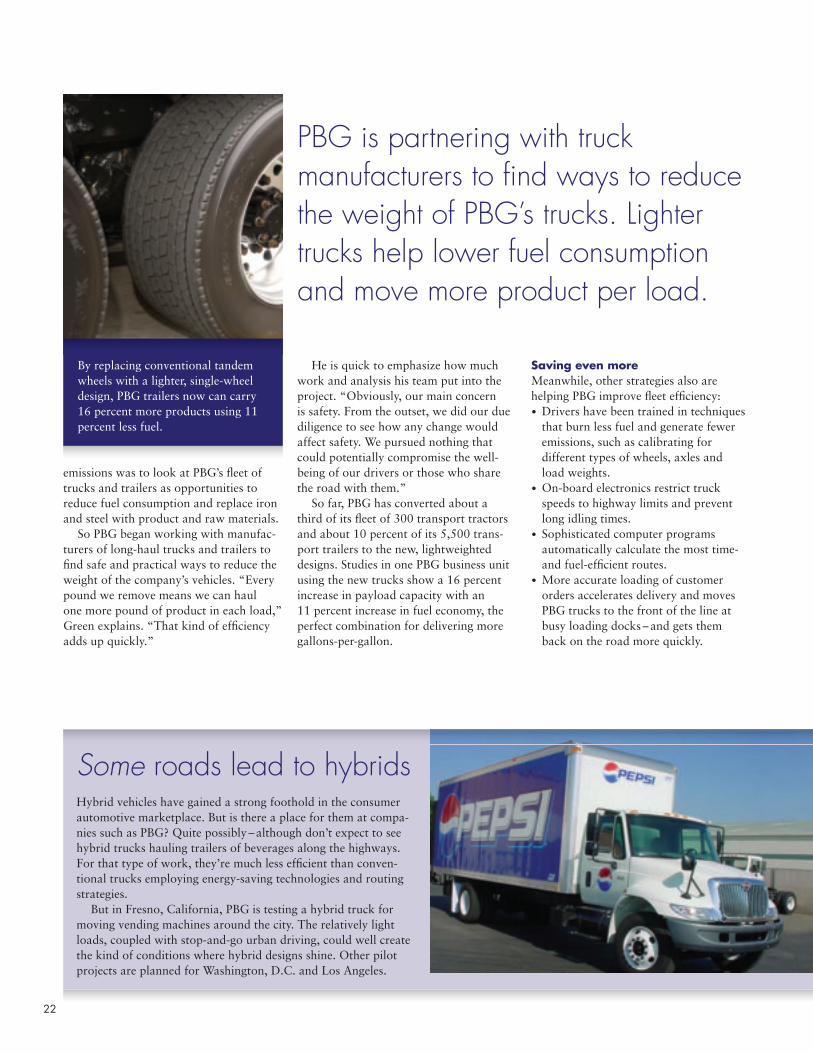
By replacing conventional tandem wheels with a lighter, single-wheel design, PBG trailers now can carry 16 percent more products using 11 percent less fuel.
PBG is partnering with truck manufacturers to fi nd ways to reduce the weight of PBG’s trucks. Lighter trucks help lower fuel consumption and move more product per load.
emissions was to look at PBG’s fl eet of trucks and trailers as opportunities to reduce fuel consumption and replace iron and steel with product and raw materials.
So PBG began working with manufac-turers of long-haul trucks and trailers to fi nd safe and practical ways to reduce the weight of the company’s vehicles. “Every pound we remove means we can haul one more pound of product in each load,” Green explains. “That kind of effi ciency adds up quickly.”
He is quick to emphasize how much work and analysis his team put into the project. “Obviously, our main concern is safety. From the outset, we did our due diligence to see how any change would affect safety. We pursued nothing that could potentially compromise the well-being of our drivers or those who share the road with them.”
So far, PBG has converted about a third of its fl eet of 300 transport tractors and about 10 percent of its 5,500 trans-port trailers to the new, lightweighted designs. Studies in one PBG business unit using the new trucks show a 16 percent increase in payload capacity with an 11 percent increase in fuel economy, the perfect combination for delivering more gallons-per-gallon.
Some roads lead to hybridsHybrid vehicles have gained a strong foothold in the consumer automotive marketplace. But is there a place for them at compa-nies such as PBG? Quite possibly – although don’t expect to see hybrid trucks hauling trailers of beverages along the highways. For that type of work, they’re much less effi cient than conven-tional trucks employing energy-saving technologies and routing strategies.
But in Fresno, California, PBG is testing a hybrid truck for moving vending machines around the city. The relatively light loads, coupled with stop-and-go urban driving, could well create the kind of conditions where hybrid designs shine. Other pilot projects are planned for Washington, D.C. and Los Angeles.
Saving even moreMeanwhile, other strategies also are helping PBG improve fl eet effi ciency:• Drivers have been trained in techniques
that burn less fuel and generate fewer emissions, such as calibrating for different types of wheels, axles and load weights.
• On-board electronics restrict truck speeds to highway limits and prevent long idling times.
• Sophisticated computer programs automatically calculate the most time- and fuel-effi cient routes.
• More accurate loading of customer orders accelerates delivery and moves PBG trucks to the front of the line at busy loading docks – and gets them back on the road more quickly.
PBG_Print_Final_gr1.indd 22PBG_Print_Final_gr1.indd 22 9/10/08 6:42:48 PM9/10/08 6:42:48 PM

2323
Off-the-roadeffi ciencies
Did you know...
By working with manufacturers to trim the weight of PBG’s trucks and trailers, the company has converted a sizable part of its transport fl eet to lightweight designs. According to one study, the lightweight trucks:
A Increase fuel economy at a slight decrease in payload capacityB Maintain the same fuel economy but allow for heavier loadsC Improve both fuel economy and payload capacity Answer: (C)
What you can do
• Save money by switching to light bulbs and appliances that carry the Energy Star logo.
• Insulate your home, and use energy- conserving doors and windows.
• Use a programmable thermostat set to 68 degrees in the winter and 78 degrees in summer.
• Look for ways to do more with fewer trips in your car.
• Accelerate slowly and steadily.• Maintain tire pressure at the
recommended level.• Walk, bike, car-pool or take public
transportation whenever possible.
PBG is testing hybrid trucks for deliveries in urban areas where the reliance on more battery power can yield higher energy effi ciency and lower emissions.
And fewer trucks are coming home empty. Under a new backhauling pro-gram, PBG employees across the company who’ve just delivered products are making an extra effort to pick up empty bottles, can lids, boxes, pallets and other materi-als that would otherwise require a special trip, and more fuel, to transport.
“When it makes sense, PBG trucks will backhaul freight for our raw material suppliers to increase the effi ciency of our transportation network while signifi -cantly reducing greenhouse gases and air pollution,” says Jim Farrell, PBG’s Senior Director of Transport.
While these successes are helping cut down on carbon emissions, Green, Farrell and thousands of others across PBG are looking for more ways to operate more effi ciently. Fortunately, the wheels of innovation are still turning.
Brilliant results
PBG is well into a program to standard-ize facility lighting from traditional bulbs to the preferred option of T8 high- effi ciency fl uorescent bulbs that are 40-50 percent more effi cient. With so many of its facilities operating during the night, PBG’s potential savings are enormous. The company has invested $6.5 million in the changeover so far, with another $3 million planned for 2008. On top of reducing greenhouse gas emissions by the equivalent of taking 17,000 cars off the road, the company is saving $1.5 million per year on elec-tricity costs. Another bonus: PBG plants and warehouses are brighter than ever, helping to keep its facilities safe and comfortable for employees.
Sustainable right-sizing
In 2007 PBG launched a new initiative to remove or redeploy underperforming full-service vending machines. This “Fix FSV” program helped retire 74,000 older and less energy-effi cient machines. By right-sizing its equipment inventory to refl ect sales volume, PBG not only makes its sup-ply chain more effi cient but also reduces electricity usage by approximately 798,000 kilowatt hours. In terms of greenhouse gas emissions, that’s equivalent to removing 36,000 passenger vehicles from the road.
PBG_Print_Final_gr6.indd 23PBG_Print_Final_gr6.indd 23 9/17/08 12:31:51 PM9/17/08 12:31:51 PM

24
Packaging responsibility
Natural resources obtained
“Using our packaging to promote recycling is an enormous undertaking and signifi cant investment, but we’re determined to get the word out and make recycling an everyday habit for more Americans.”Rob KingPresident of North America
Packaging is an important component of PBG’s business model. Our packaging has to be the same high quality as our products. In essence, packaging needs to be durable enough to preserve the quality of its contents while also protecting our beverages for the health and safety of consumers. So in addition to environmental implications, there are economic and public safety implications for packaging.
Recognizing its importance, PBG is working on a number of fronts to design, manufacture and use product packaging in environmentally responsible ways. We envision a world where all packaging is:• Sourced responsibly• Designed to be effective and safe throughout its life cycle• Engineered to meet market criteria for performance and cost• Recycled effi ciently to provide valuable resources and alternative products for subsequent generations
To achieve these goals, PBG is increasing the recycled content of our packaging, reducing waste and energy consumption during manufacturing and delivery, and promot-ing recycling through our marketing and communication materials. PBG already has made considerable progress: • PBG’s soda cans are composed of 41% recycled aluminum. • PBG’s glass bottles contain 25-35% post-consumer material.• PBG’s PET plastic bottles contain 10% post-consumer material.
With an eye on becoming best-in-class, PBG continues to explore new processes and materials that advance the sustain-ability of our operations and packaging.
A can-do approach to recycling
Wonder why that can of Pepsi you’re holding feels so familiar? It could be because it’s been in your hand before.
With 41 percent of the average aluminum can made from recycled material, PepsiCo, along with its bottlers like PBG, is promoting recycling on the seven billion cans of Pepsi and Diet Pepsi that will be sold this year. The company’s “Have we met before?” campaign devotes $35 million - $45 million worth of advertising space on its cans to promote recycling through messages such as:• “Recycling could save 95% of the energy used to
make this can.”• “Recycle this can and save enough energy to power a
100-watt light bulb for four hours.”• “The average person has the opportunity to recycle 25,000
cans in a lifetime.”
PBG_Print_Final_gr2.indd 24PBG_Print_Final_gr2.indd 24 9/10/08 8:42:07 PM9/10/08 8:42:07 PM

25
Raw material manufactured
Bottles and cansproduced
Bottles and cans fi lled and delivered
Beverages consumed
Beveragecontainers recycled to become new bottles, cans and other products
PBG_Print_Final_gr1.indd 25PBG_Print_Final_gr1.indd 25 9/10/08 6:50:43 PM9/10/08 6:50:43 PM

26
“Waste not” becomes the watchword
at California PBG plants.
A lot more goes out the door of a modern beverage plant than beverages.
There’s used paper plus cardboard, shrink-wrap, glass, pallet scraps and dam-aged cans, caps and bottles.
At PBG’s Torrance plant, for example, a waste hauler used to come every day to pick up compacted, mixed trash and haul it away to a landfi ll. And the next day, more material would come into the plant and more trash would head for the landfi ll.
That adds up to a lot of wasted energy and raw materials, and it caught the atten-tion of Pablo Cussatti.
At the time, Cussatti was Plant Manager of the Torrance facility. It was there that he decided to dry up the waste stream fl owing from his plant into the area’s landfi lls.
While the plant was already recycling much of its waste, by investing in new processes and equipment to sort, bale and compact recyclables, the plant was able to reduce what would have gone to the landfi ll by more than 50 percent. Torrance didn’t just cut its solid waste stream in half, it turned it into an income stream, helping to offset its investments in recycling.
When Cussatti was promoted to Vice President of Manufacturing, with responsi-bilities covering nine plants in California, Nevada and Hawaii, he was ready to see if what had been achieved in Torrance could be replicated at all of his operations. First to act was the Sacramento plant, which is more than twice the size of the Torrance facility. With enough space avail-able for a plant-wide recycling program,
THE ROAD TO ZERO
PBG_Print_Final_gr7.indd 26PBG_Print_Final_gr7.indd 26 9/17/08 6:12:29 PM9/17/08 6:12:29 PM

27
the Sacramento plant set a goal in 2007 of sending nothing to the landfi ll. In 2008 they expect to be at 90 percent of that goal.
Today, a truck comes only two or three times a week to cart away waste. Techni-cally speaking, it’s not waste, because everything from cardboard to glass to plastic goes to the recycling center and then to other plants to be turned into carpets, computer cases, copier paper and hundreds of other products.
“Our people feel good about this,” observes Cussatti. “They see the impact recycling can have on PBG and the envi-ronment. Now they understand fi rst-hand that recycling is a way to help make their community a better place to live and PBG a better place to work.”
Pablo CussattiVice President of Manufacturing for PBG, has set a goal of zero waste for the plants under his management.
Seeing waste as a resource
To ensure all manufacturing locations are optimizing recycle streams, PBG has hired a third-party consultant to analyze its entire waste stream, identify where materi-als are going and help us develop ways to avoid landfi lling and recycle more. “Ulti-mately, all organizations should set their sights on sending nothing to landfi lls,” says John Burns, PBG’s Director of Environmental Management. “At PBG, recycling already is a way of life at our facilities. And by improving the coordination of PBG’s recy-cling efforts, we are getting closer – faster –to becoming a zero landfi ll company.”
Answer: (C) 32.5%
Did you know...
About 80 percent of what Amer-icans throw away is recyclable. What is the U.S. recycling rate?1
A 74%B 45%C 32.5%
1 U.S. Environmental Protection Agency
www.epa.gov
PBG_Print_Final_gr1.indd 27PBG_Print_Final_gr1.indd 27 9/10/08 6:52:02 PM9/10/08 6:52:02 PM
2828
Employee
Working at PBG
and alignment with the United Nations International
Labor Organization’s core priorities for human rights in
the workplace with respect to freedom of association,
the elimination of all forms of forced or compulsory
labor, the elimination of discrimination and the effective
abolition of child labor. “PBG believes in the power
of individuals to do great things,” says Berisford.
PBG would not be the industry leader that it is without
the energy, commitment and diverse strengths of its
70,000 employees around the world. And to continue
attracting and developing the talent it needs to sustain suc-
cess, the company helps its people attain both their career
and personal goals.
Proof that this holistic approach is working can be
observed in the average number of years that many
employees stay with PBG. It is not uncommon for the
company to celebrate several 20-year anniversaries in
one day. “Someone may start at PBG for a job but they
stay for a career,” says John Berisford, Senior Vice Presi-
dent of Human Resources and Chief Personnel Offi cer.
Upon joining PBG, employees become familiar with
the company’s Code of Conduct that explains certain
“non-negotiables.” More than a document about compli-
ance, the Code serves to reinforce PBG’s values as well
as its expectations that all employees will be treated–
and will treat each other –ethically and respectfully.
Among the specifi c issues covered are equal employ-
ment opportunity, the prohibition of sexual harassment,
“We want our people to come to work feeling like they
can be themselves and use their individual perspectives
to be endlessly creative in developing business solutions.
For PBG, that’s the route to sustainable business success.”
More than a document about compliance, the Code serves to reinforce PBG’s values as well as its expectations that all employees will be treated–and will treat each other –ethically and respectfully.
PBG_Print_Final_gr1.IND_CS 28PBG_Print_Final_gr1.IND_CS 28 9/3/08 2:29:19 PM9/3/08 2:29:19 PMProcess CyanProcess Cyan Process MagentaProcess Magenta Process YellowProcess Yellow Process BlackProcess Black

29
Evolving from representation to inclusionThough based on the best of intentions, many corporate diversity programs focus on the numerical representation of certain groups of people, limiting the full potential of a diverse workforce.
At PBG, representation is important, but it’s not everything. For PBG, diversity is what makes a person unique–whether that involves gender, work experience, birthplace, national origin, sexual orientation, language or any other characteristic.
This innovative approach has helped PBG become a fi xture on the annual lists of companies with the best diversity policies and performance, putting it on a par with other companies many times its size. In 2007, for example, PBG made the list of “Top 50 Companies for Diversity” in DiversityInc magazine. It also earned spots on other “Top Companies” lists, including Black Enterprise, Asian Enterprise and Hispanic Business magazines, and the Human Rights Campaign.
Diversity witha difference
“We rely on the talents and skills of our people to differentiate PBG in the marketplace and make us stronger as an organization.... Unique perspectives and experiences have made PBG a success, and will determine our success in the future.”Eric J. FossPresident and Chief Executive Offi cer
PBG_Print_Final_gr5.indd 29PBG_Print_Final_gr5.indd 29 9/16/08 4:03:30 PM9/16/08 4:03:30 PM
30
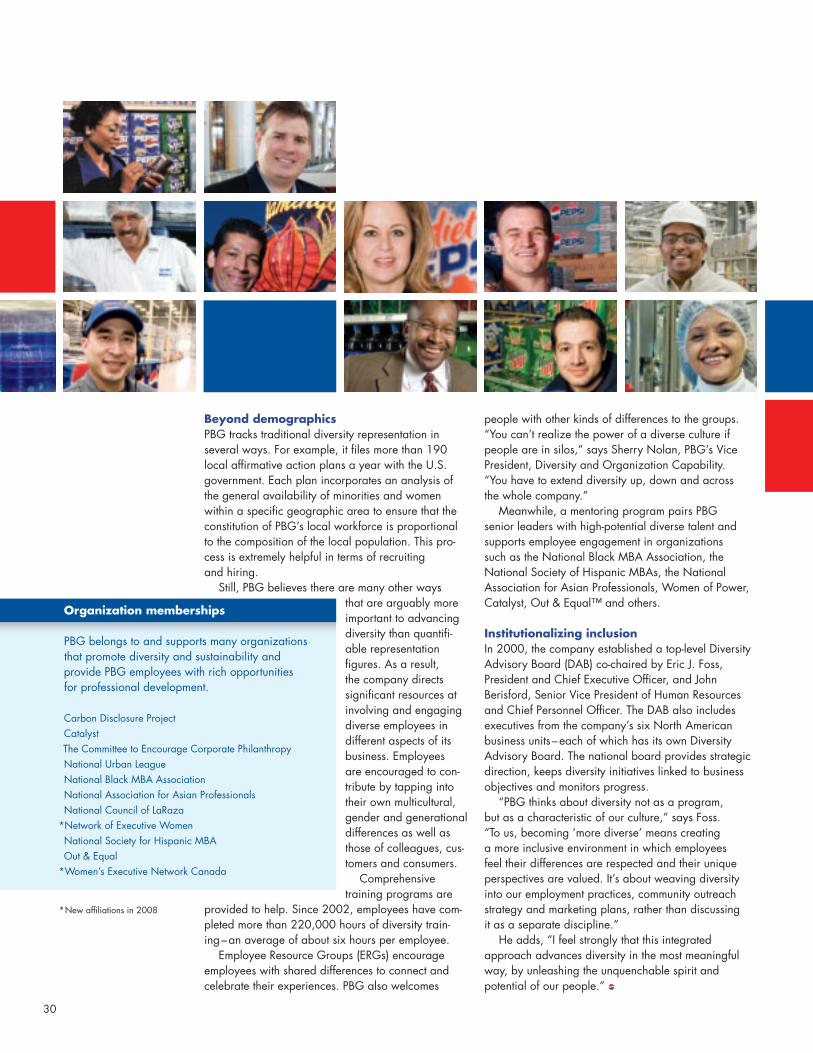
Beyond demographicsPBG tracks traditional diversity representation in several ways. For example, it fi les more than 190 local affi rmative action plans a year with the U.S. government. Each plan incorporates an analysis of the general availability of minorities and women within a specifi c geographic area to ensure that the constitution of PBG’s local workforce is proportional to the composition of the local population. This pro-cess is extremely helpful in terms of recruiting and hiring.
Still, PBG believes there are many other ways that are arguably more important to advancing diversity than quantifi -able representation fi gures. As a result, the company directs signifi cant resources at involving and engaging diverse employees in different aspects of its business. Employees are encouraged to con-tribute by tapping into their own multicultural, gender and generational differences as well as those of colleagues, cus-tomers and consumers.
Comprehensive training programs are
provided to help. Since 2002, employees have com-pleted more than 220,000 hours of diversity train-ing–an average of about six hours per employee.
Employee Resource Groups (ERGs) encourage employees with shared differences to connect and celebrate their experiences. PBG also welcomes
people with other kinds of differences to the groups. “You can’t realize the power of a diverse culture if people are in silos,” says Sherry Nolan, PBG’s Vice President, Diversity and Organization Capability. “You have to extend diversity up, down and across the whole company.”
Meanwhile, a mentoring program pairs PBG senior leaders with high-potential diverse talent and supports employee engagement in organizations such as the National Black MBA Association, the National Society of Hispanic MBAs, the National Association for Asian Professionals, Women of Power, Catalyst, Out & Equal™ and others.
Institutionalizing inclusionIn 2000, the company established a top-level Diversity Advisory Board (DAB) co-chaired by Eric J. Foss, President and Chief Executive Offi cer, and John Berisford, Senior Vice President of Human Resources and Chief Personnel Offi cer. The DAB also includes executives from the company’s six North American business units –each of which has its own Diversity Advisory Board. The national board provides strategic direction, keeps diversity initiatives linked to business objectives and monitors progress.
“PBG thinks about diversity not as a program, but as a characteristic of our culture,” says Foss. “To us, becoming ‘more diverse’ means creating a more inclusive environment in which employees feel their differences are respected and their unique perspectives are valued. It’s about weaving diversity into our employment practices, community outreach strategy and marketing plans, rather than discussing it as a separate discipline.”
He adds, “I feel strongly that this integrated approach advances diversity in the most meaningfulway, by unleashing the unquenchable spirit and potential of our people.”
Organization memberships
PBG belongs to and supports many organizationsthat promote diversity and sustainability and provide PBG employees with rich opportunities for professional development.
Carbon Disclosure ProjectCatalystThe Committee to Encourage Corporate PhilanthropyNational Urban LeagueNational Black MBA AssociationNational Association for Asian ProfessionalsNational Council of LaRaza
*Network of Executive WomenNational Society for Hispanic MBAOut & Equal
*Women’s Executive Network Canada
*New affi liations in 2008
PBG_Print_Final_gr1.indd 30PBG_Print_Final_gr1.indd 30 9/10/08 7:08:49 PM9/10/08 7:08:49 PM

31
Diversity statement
At PBG we encourage everyone to be true to who they are and what they value. Diversity is essential to our long-term business goals and critical to becoming the kind of organization we want to be.
Diversity includes all differences that make PBG employees unique individuals, such as race, religion, national origin, gender, gender identity or expres-sion, experience, work style, culture, age, language, disability, sexual orientation and any other unique attribute that exists within our workplace.
Our diversity framework is centered around our employees, customers, consumers, community and shareholders, and supports the following:• Look like the market• Build an inclusive culture• Connect with community• Capture the multicultural consumer
The key to success is creating an inclusive environ-ment where employees feel valued and encouraged to contribute to the business in a meaningful way.
Our expectations:• We seek fi rst to understand.• We treat everyone with respect.• We win as a team.
Today, more than ever, diversity plays a role in everything we do. Understanding the markets that we serve begins with our ability to attract and retain top talent with different skill sets and backgrounds. If we do that well, we will continue to be the employer, bottler, beverage and investment of choice.
Answer: (C) more than $240 million Did you know...
How much does PBG spend buying products and services from women- and minority-owned businesses each year?
A $80 millionB $106 millionC $240 million
PBG diversity stats at a glance PBG board of directors
2007 New hires %2007 Total % EthnicityGender
PBG_Print_Final_gr1.indd 31PBG_Print_Final_gr1.indd 31 9/10/08 7:09:29 PM9/10/08 7:09:29 PM

32
Each year since 2005, Fortune magazine has asked executives, directors and security analysts in the beverage industry to rank the companies they admire most. And every year, PBG has ranked in second place in its industry, ahead of its competitors and bested only by beer giant Anheuser-Busch.
“It’s one thing for us to point out to prospective employees that we’re a Fortune 500 company,” notes John Berisford, Senior Vice President of Human Resources and Chief Personnel Offi cer. “But when the goal is to attract top talent, consistently being at the top of our industry’s “Most Admired” list gives us an important edge in recruiting.”
Taking the broad viewPBG thinks about employee recruitment and development in terms of what is needed to develop a diverse team of self-motivated, entrepreneurial and well-rounded players. This requires:• Running a company that people are
proud to work for• Hiring local managers and employees• Offering guidance, training and opportu-
nities for career development• Providing generous, far-reaching and
meaningful benefi ts packages• Giving employees tools for reducing
health risks, and for gaining physical and fi nancial fi tness
Modeling leadershipAt the heart of PBG’s career development programs is the company’s Leadership Model that serves as both a blueprint and a scorecard for career development. The PBG Leadership Model guides employ-ees through four main dimensions of professional development anchored by a
fi fth values dimension, as described in more detail on page 45. First is Execution–knowing the business and being good at it. The second is People– learning how to motivate and develop others. The third is Infl uence, when a leader can create organizational impact through leveraged networks, effective communication and confi dence. Finally, the best leaders master the Idea stage in which they can develop long-term strategies based on rational analyses and innovative thinking. This leader fosters a creative environment by presenting breakthrough ideas and encour-aging others to develop their own ideas.
This Leadership Model ultimately becomes a part of PBG’s annual perfor-mance evaluation and succession plan-ning processes that keep the pipeline full of candidates for managerial and executive positions.
Are we there yet?PBG measures its success at developing employees and providing a compelling workplace through employee satisfaction surveys covering 13 broad topics and 100 specifi c points. The surveys enable management to assess what is and isn’t working, and how they can make changes to better attract, retain and develop employ-ees. They also show employees that their opinions matter, especially in the following year when management teams present how the information was used to develop action plans and improve the organization.
This process is extremely important to PBG. Given the fast pace of change in the workforce and marketplace, constant improvement is critical to ensuring that PBG remains on the “Most Admired” lists and a magnet to the best and brightest.
The PBG benefi ts programs
What does it take to be admired?Attracting top talent–and keeping it.
Core benefi ts• Medical• Dental• Vision• Pension• Group legal services• Life, accident, short-term and
long-term disability insurance• Same-sex domestic partner coverage• Health care and dependent care
reserve accounts
Other programs• 401(k) plan with PBG contributions • PBG stock purchase program• U.S. savings bond program• Adoption assistance program• Family leave program• Tuition reimbursement• Scholarship program• Educational loans• National merit program• Paid vacation• Matching gifts program
Eligibility may vary for some employees covered by other, similar plans.
Word gets around.
PBG_Print_Final_gr7.indd 32PBG_Print_Final_gr7.indd 32 9/17/08 6:26:52 PM9/17/08 6:26:52 PM
33
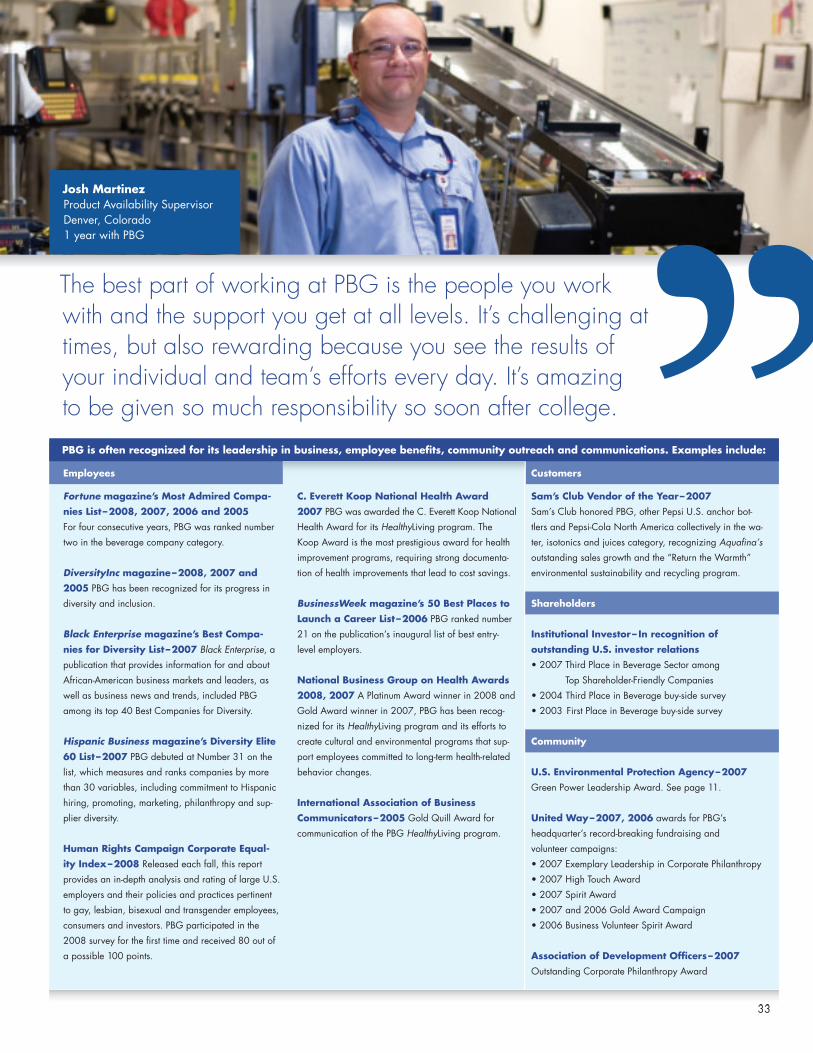
The best part of working at PBG is the people you work with and the support you get at all levels. It’s challenging at times, but also rewarding because you see the results of your individual and team’s efforts every day. It’s amazing to be given so much responsibility so soon after college.PBG is often recognized for its leadership in business, employee benefi ts, community outreach and communications. Examples include:
Employees
Fortune magazine’s Most Admired Compa-nies List –2008, 2007, 2006 and 2005For four consecutive years, PBG was ranked number two in the beverage company category.
DiversityInc magazine–2008, 2007 and 2005 PBG has been recognized for its progress in diversity and inclusion.
Black Enterprise magazine’s Best Compa-nies for Diversity List –2007 Black Enterprise, a publication that provides information for and about African-American business markets and leaders, as well as business news and trends, included PBG among its top 40 Best Companies for Diversity.
Hispanic Business magazine’s Diversity Elite 60 List –2007 PBG debuted at Number 31 on the list, which measures and ranks companies by more than 30 variables, including commitment to Hispanic hiring, promoting, marketing, philanthropy and sup-plier diversity.
Human Rights Campaign Corporate Equal-ity Index–2008 Released each fall, this report provides an in-depth analysis and rating of large U.S. employers and their policies and practices pertinent to gay, lesbian, bisexual and transgender employees, consumers and investors. PBG participated in the 2008 survey for the fi rst time and received 80 out of a possible 100 points.
C. Everett Koop National Health Award 2007 PBG was awarded the C. Everett Koop National Health Award for its HealthyLiving program. The Koop Award is the most prestigious award for health improvement programs, requiring strong documenta-tion of health improvements that lead to cost savings.
BusinessWeek magazine’s 50 Best Places to Launch a Career List –2006 PBG ranked number 21 on the publication’s inaugural list of best entry-level employers.
National Business Group on Health Awards 2008, 2007 A Platinum Award winner in 2008 and Gold Award winner in 2007, PBG has been recog-nized for its HealthyLiving program and its efforts to create cultural and environmental programs that sup-port employees committed to long-term health-related behavior changes.
International Association of Business Communicators–2005 Gold Quill Award for communication of the PBG HealthyLiving program.
Josh MartinezProduct Availability SupervisorDenver, Colorado1 year with PBG
Customers Sam’s Club Vendor of the Year–2007 Sam’s Club honored PBG, other Pepsi U.S. anchor bot-tlers and Pepsi-Cola North America collectively in the wa-ter, isotonics and juices category, recognizing Aquafi na’s outstanding sales growth and the “Return the Warmth” environmental sustainability and recycling program.
Shareholders
Institutional Investor– In recognition of outstanding U.S. investor relations• 2007 Third Place in Beverage Sector among
Top Shareholder-Friendly Companies• 2004 Third Place in Beverage buy-side survey• 2003 First Place in Beverage buy-side survey
Community
U.S. Environmental Protection Agency–2007 Green Power Leadership Award. See page 11.
United Way–2007, 2006 awards for PBG’s headquarter’s record-breaking fundraising and volunteer campaigns:• 2007 Exemplary Leadership in Corporate Philanthropy• 2007 High Touch Award• 2007 Spirit Award• 2007 and 2006 Gold Award Campaign• 2006 Business Volunteer Spirit Award
Association of Development Offi cers–2007 Outstanding Corporate Philanthropy Award
PBG_Print_Final_gr1.IND_CS 33PBG_Print_Final_gr1.IND_CS 33 9/3/08 2:30:34 PM9/3/08 2:30:34 PMProcess CyanProcess Cyan Process MagentaProcess Magenta Process YellowProcess Yellow Process BlackProcess Black
3434
A holistic approach to employee health makes a whole lot of sense.
n the world of PBG employee benefi t programs, health is a word that means a lot more than the objective of the company’s medical plans.
It’s a holistic term encompassing employee physical, mental and even fi nancial wellness, with a broad array of programs, tools and information sources backing it up.
Prevent and controlTo help employees maintain and improve their physical well-being, PBG introduced HealthyLiving, a program with a diverse menu of services such as annual health risk assessments, weight control and smoking cessation programs, stress management and a dedicated Nurseline. Currently, employees and their spouses can each earn $175 by taking a wellness assessment and participating in the company’s Healthy Changes Program.
“To integrate wellness into our culture, we create fun incentives that play off our competi-tive spirit,” says Mark Sullivan, Vice President of Health and Wellness at PBG. “By engaging em-ployees in a total wellness philosophy, we can pro-vide them – and their families – with opportunities to reduce the chance of illness, injury and disability and ultimately live healthier lives.”
PBG also has on-site health clinics at 25 of its facilities across the U.S. Each is part medical facility and part fi tness counseling center, staffed by nurses and physician assistants employed by a unit of Johns Hopkins University.
“Clinics produce a trifecta of results,” notes John Berisford, Senior Vice President of Human Resources and Chief Personnel Offi cer. “Costs decline, productivity rises and employee satisfac-tion increases.”
PBG hopes to have eight more clinics in operation by the end of 2008, bringing the total to 33 and giving 40 percent of its U.S. employees access to an on-site health and wellness center. To expand the reach of on-site wellness centers, the company will be piloting a mobile health clinic that provides access to medical professionals at some of our smaller locations. The company also plans to bolster mental health care services at four pilot locations.
The goal of all of these offerings is to keep health and wellness top-of-mind and make physical fi tness a part of employees’ daily lives at work and at home. In fact, employees also have access to discounts on health clubs and exercise equipment.
Fiscal fi tness, tooIn a 2007 USA TODAY poll, more than 65 percent of respondents said that their fi nances caused them the most anxiety. Financial issues can permeate all areas of a person’s or family’s life and cause signifi cant harm to their overall well-being.
Some of PBG’s free, on-site employee health and wellness services • Treatment for work-related and non-occupational illness and injuries• Prescriptions• Physicals• Free fl u shots• Department of Transportation physicals• ...and more
“Our goal is to build a culture of wellness at PBG because it’s the right thing to do for our employees and a smart thing to do for our business.”
John Berisford Senior Vice President of Human Resources and Chief Personnel Offi cer
PBG_Print_Final_gr7.indd 34PBG_Print_Final_gr7.indd 34 9/17/08 6:31:41 PM9/17/08 6:31:41 PM

3535
But say a PBG employee sees signifi cant fl uctuations in his or her 401(k) account. Instead of brooding about it, he or she can turn to the company’s HealthyMoney program. It offers a wide range of professional, independent resources ranging from planning workshops to mortgage discounts and scholarship advice. Whether an employee wants to create a retirement plan or get quick advice on a smaller matter, free fi nancial counseling service is available through HealthyMoney. The program also includes Web-based guides covering high-impact life events, reminders about key dates and links to a variety of valuable online fi nancial tools and reports.
Physical problems, personal demands and fi nancial volatility can bring pain and stress to anyone. But by taking a holistic approach to employee wellness and some of the primary forces that affect it, HealthyLiving and HealthyMoney help promote healthier futures for employees, their families and PBG as a whole.
National recognition
In 2007, PBG received two prestigious awards for its commitment to improving employee health and promoting healthy lifestyles.
First, PBG received the C. Everett Koop National Health Award for its HealthyLiving program. Named after the former U.S. Surgeon General, the Koop award is the most prestigious award honoring innovative health improvement programs. PBG’s was one of only two programs to win the award for 2007, which is based on extensive documentation that outlines an organiza-tion’s health improvement and cost savings. Past recipients include Motorola, Citibank, Union Pacifi c, Caterpillar, Daimler-Chrysler, CIGNA, Texas Instruments and Johnson & Johnson.
Also in 2007, PBG was among a select group of employers who received the Best Employers for Healthy Lifestyles Gold Award from the National Business Group on Health for its response to “the urgent need to improve their workers’ health, productivity and quality of life.” The national, nonprofi t organization of 266 large employers also honored PBG for its HealthyLiving program. In 2008, PBG won the organization’s Platinum Award– the highest honor it bestows.
Gift cards encourage employees to sign up for company-funded health
risk assessments.
Anything you can do…Part of PBG’s broad HealthyLiving program, Healthy Challenge expands PBG’s culture of health even further. Selected PBG locations compete for a trophy, celebrity appearance, funding for a charitable donation and other rewards and recognition. Now in its second year, locations running the program saw these improvements in participation in 2007:
increase in Health Risk Assessments (HRA)
increase in health screenings
increase in weight loss competitions
more participants in pedometer exercise programs
10 %21 %
6 %25 %
An ounce of preventionPBG works hard to promote safe work habits and prevent injuries among employees. Since 2005 it has run a safety awareness and education pro-gram called “360 Degrees of Safety” that reaches every facility.
PBG drivers undergo intensive training to ensure that they get to their destinations safely. Drivers with no preventable accidents for a year are recognized by top management, featured
on PBG’s Professional Driver Web site and given a special award and incentive. Those who go accident-free for fi ve years get even higher value awards. PBG recognizes approximately 5,500 drivers annually through this program.
If an employee is hurt on the job? PBG’s workers’ compensation program is designed to provide injured employees with proactively managed medical care so that they can return to work–and their regular paychecks–as soon as possible.
PBG_Print_Final_gr1.IND_CS 35PBG_Print_Final_gr1.IND_CS 35 9/3/08 2:30:51 PM9/3/08 2:30:51 PMProcess CyanProcess Cyan Process MagentaProcess Magenta Process YellowProcess Yellow Process BlackProcess Black
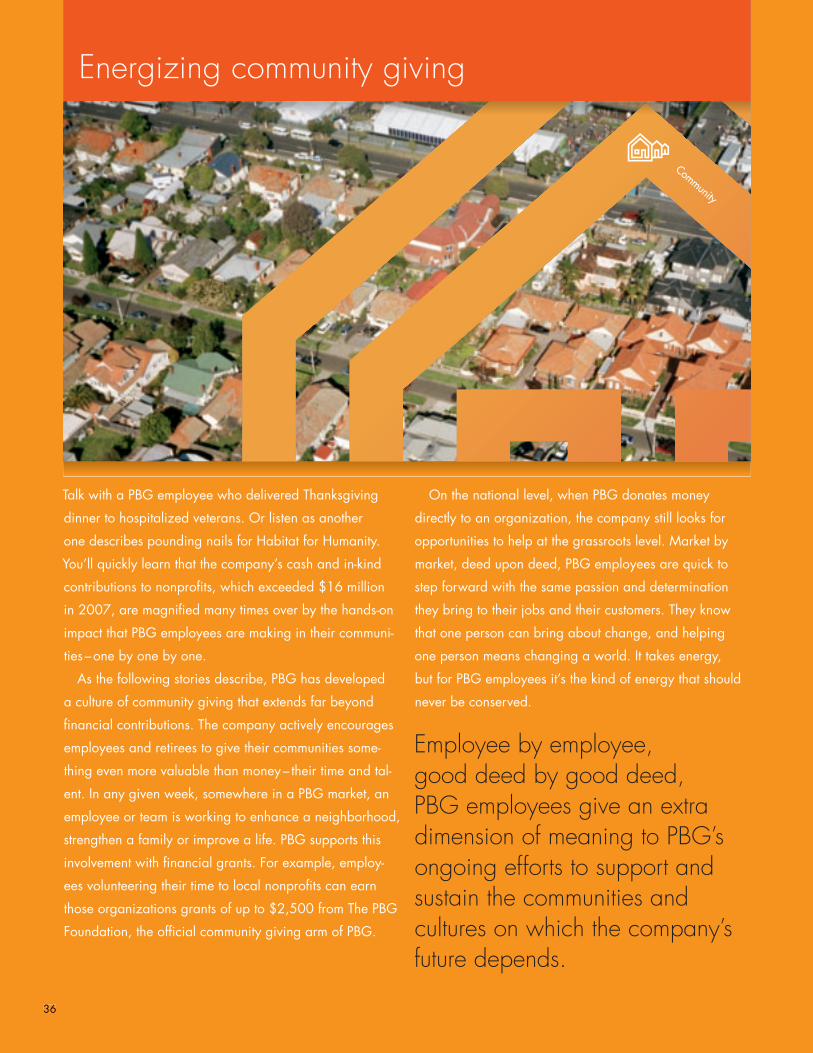
3636
Community
Energizing community giving
Talk with a PBG employee who delivered Thanksgiving
dinner to hospitalized veterans. Or listen as another
one describes pounding nails for Habitat for Humanity.
You’ll quickly learn that the company’s cash and in-kind
contributions to nonprofi ts, which exceeded $16 million
in 2007, are magnifi ed many times over by the hands-on
impact that PBG employees are making in their communi-
ties –one by one by one.
As the following stories describe, PBG has developed
a culture of community giving that extends far beyond
fi nancial contributions. The company actively encourages
employees and retirees to give their communities some-
thing even more valuable than money– their time and tal-
ent. In any given week, somewhere in a PBG market, an
employee or team is working to enhance a neighborhood,
strengthen a family or improve a life. PBG supports this
involvement with fi nancial grants. For example, employ-
ees volunteering their time to local nonprofi ts can earn
those organizations grants of up to $2,500 from The PBG
Foundation, the offi cial community giving arm of PBG.
On the national level, when PBG donates money
directly to an organization, the company still looks for
opportunities to help at the grassroots level. Market by
market, deed upon deed, PBG employees are quick to
step forward with the same passion and determination
they bring to their jobs and their customers. They know
that one person can bring about change, and helping
one person means changing a world. It takes energy,
but for PBG employees it’s the kind of energy that should
never be conserved.
Employee by employee, good deed by good deed, PBG employees give an extra dimension of meaning to PBG’s ongoing efforts to support and sustain the communities and cultures on which the company’s future depends.
PBG_Print_Final_gr1.indd 36PBG_Print_Final_gr1.indd 36 9/10/08 7:11:50 PM9/10/08 7:11:50 PM
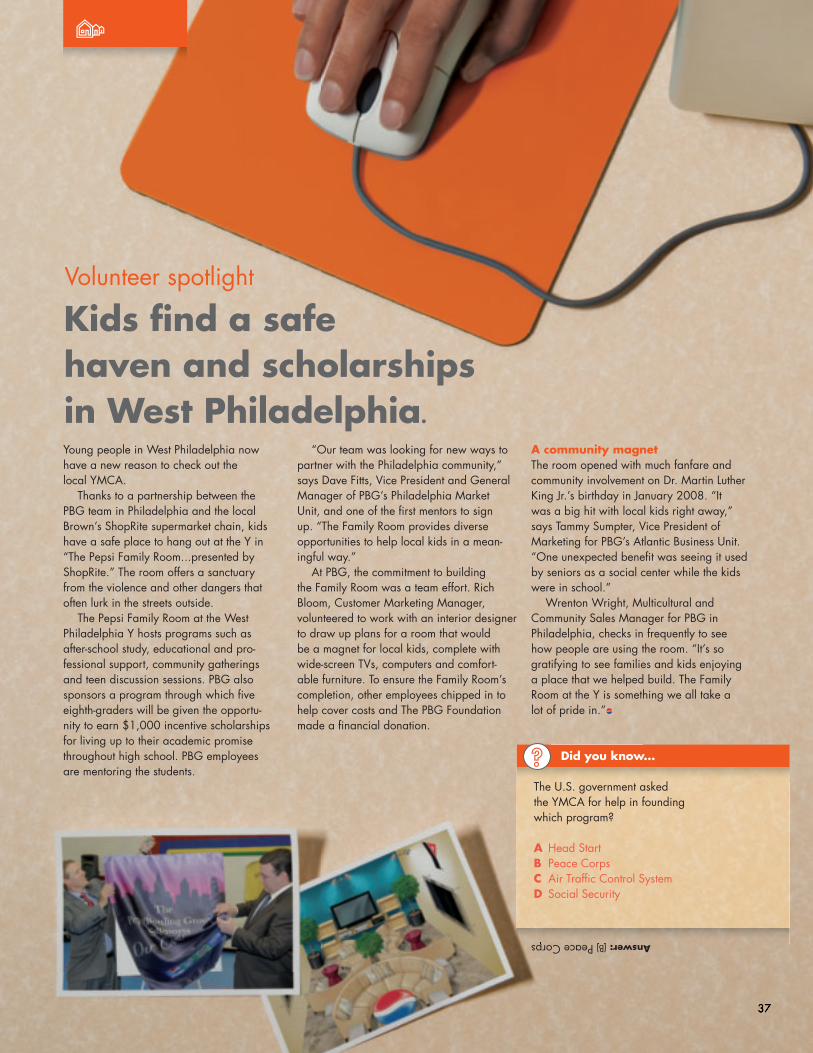
37
Answer: (B) Peace Corps
Did you know...
The U.S. government asked the YMCA for help in founding which program?
A Head StartB Peace CorpsC Air Traffi c Control SystemD Social Security
Kids fi nd a safehaven and scholarshipsin West Philadelphia.
Young people in West Philadelphia now have a new reason to check out the local YMCA.
Thanks to a partnership between the PBG team in Philadelphia and the local Brown’s ShopRite supermarket chain, kids have a safe place to hang out at the Y in “The Pepsi Family Room...presented by ShopRite.” The room offers a sanctuary from the violence and other dangers that often lurk in the streets outside.
The Pepsi Family Room at the West Philadelphia Y hosts programs such as after-school study, educational and pro-fessional support, community gatherings and teen discussion sessions. PBG also sponsors a program through which fi ve eighth-graders will be given the opportu-nity to earn $1,000 incentive scholarships for living up to their academic promise throughout high school. PBG employees are mentoring the students.
“Our team was looking for new ways to partner with the Philadelphia community,” says Dave Fitts, Vice President and General Manager of PBG’s Philadelphia Market Unit, and one of the fi rst mentors to sign up. “The Family Room provides diverse opportunities to help local kids in a mean-ingful way.”
At PBG, the commitment to building the Family Room was a team effort. Rich Bloom, Customer Marketing Manager, volunteered to work with an interior designer to draw up plans for a room that would be a magnet for local kids, complete with wide-screen TVs, computers and comfort-able furniture. To ensure the Family Room’s completion, other employees chipped in to help cover costs and The PBG Foundation made a fi nancial donation.
A community magnetThe room opened with much fanfare and community involvement on Dr. Martin Luther King Jr.’s birthday in January 2008. “It was a big hit with local kids right away,” says Tammy Sumpter, Vice President of Marketing for PBG’s Atlantic Business Unit. “One unexpected benefi t was seeing it used by seniors as a social center while the kids were in school.”
Wrenton Wright, Multicultural and Community Sales Manager for PBG in Philadelphia, checks in frequently to see how people are using the room. “It’s so gratifying to see families and kids enjoying a place that we helped build. The Family Room at the Y is something we all take a lot of pride in.”
Volunteer spotlight
PBG_Print_Final_gr5.indd 37PBG_Print_Final_gr5.indd 37 9/16/08 4:57:55 PM9/16/08 4:57:55 PM
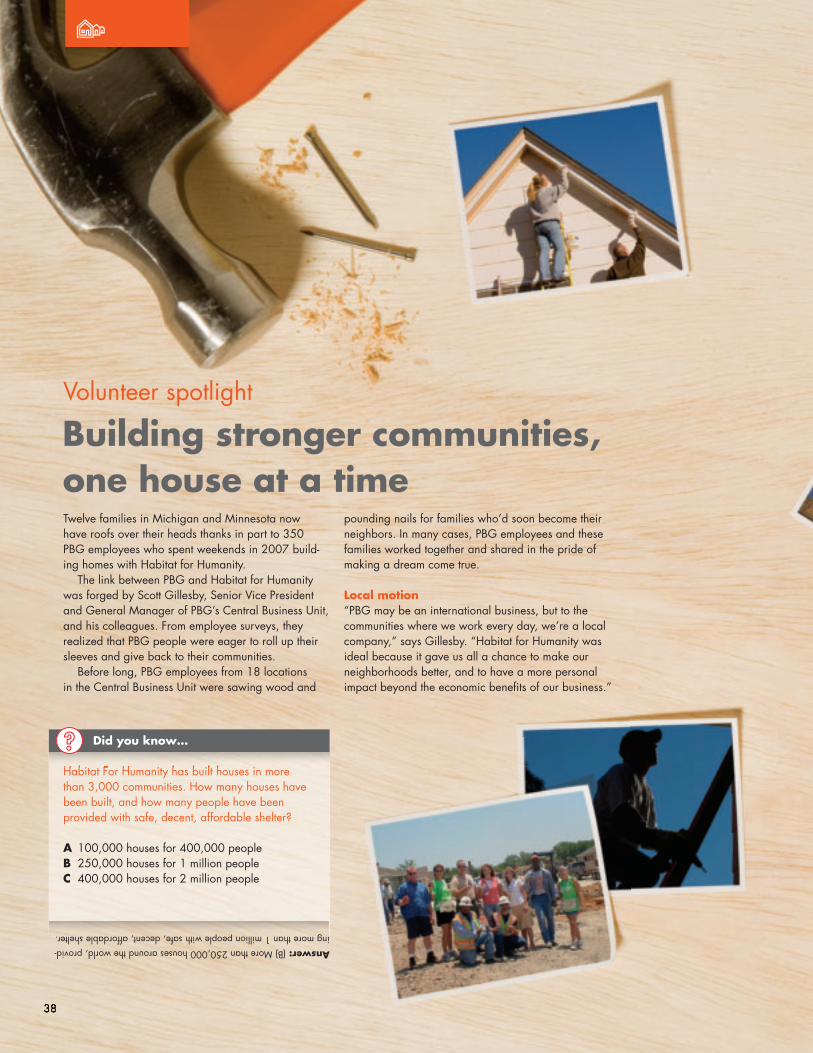
38
Building stronger communities, one house at a timeTwelve families in Michigan and Minnesota now have roofs over their heads thanks in part to 350 PBG employees who spent weekends in 2007 build-ing homes with Habitat for Humanity.
The link between PBG and Habitat for Humanity was forged by Scott Gillesby, Senior Vice President and General Manager of PBG’s Central Business Unit, and his colleagues. From employee surveys, they realized that PBG people were eager to roll up their sleeves and give back to their communities.
Before long, PBG employees from 18 locations in the Central Business Unit were sawing wood and
pounding nails for families who’d soon become their neighbors. In many cases, PBG employees and these families worked together and shared in the pride of making a dream come true.
Local motion“PBG may be an international business, but to the communities where we work every day, we’re a local company,” says Gillesby. “Habitat for Humanity was ideal because it gave us all a chance to make our neighborhoods better, and to have a more personal impact beyond the economic benefi ts of our business.”
Volunteer spotlight
Did you know…
Habitat For Humanity has built houses in more than 3,000 communities. How many houses have been built, and how many people have been provided with safe, decent, affordable shelter?
A 100,000 houses for 400,000 peopleB 250,000 houses for 1 million peopleC 400,000 houses for 2 million people
Answer: (B) More than 250,000 houses around the world, provid-ing more than 1 million people with safe, decent, affordable shelter.
PBG_Print_Final_gr2.indd 38PBG_Print_Final_gr2.indd 38 9/10/08 11:40:11 PM9/10/08 11:40:11 PM

39
One project that was especially meaningful to Gillesby and his team was organized for their former colleague who lost his home after an accident paralyzed him in 2006. “It was emotional for all of us,” says Gillesby. “But we were determined to do something extraordinary for our friend.”
The PBG team in Milan, Michigan, built and furnished a new, handicapped-accessible home for the man and his family. They also “adopted” the family as part of their annual “Adopt a Family” holi-day program.
Gillesby says that Habitat for Humanity gave his team a chance to show another side to its drive and determination. It also strengthened the organization by bringing together employees from different loca-tions, levels and functions.
The effort was such a resounding success among employees, communities and, most important, the new homeowners that plans are underway to expand the program to more locations and more employees in 2008. “We’re aiming for 22 Habitat builds this year,” says Gillesby. “What better way to celebrate our success?”
PBG_Print_Final_gr1.IND_CS 39PBG_Print_Final_gr1.IND_CS 39 9/4/08 8:34:59 AM9/4/08 8:34:59 AMProcess CyanProcess Cyan Process MagentaProcess Magenta Process YellowProcess Yellow Process BlackProcess Black
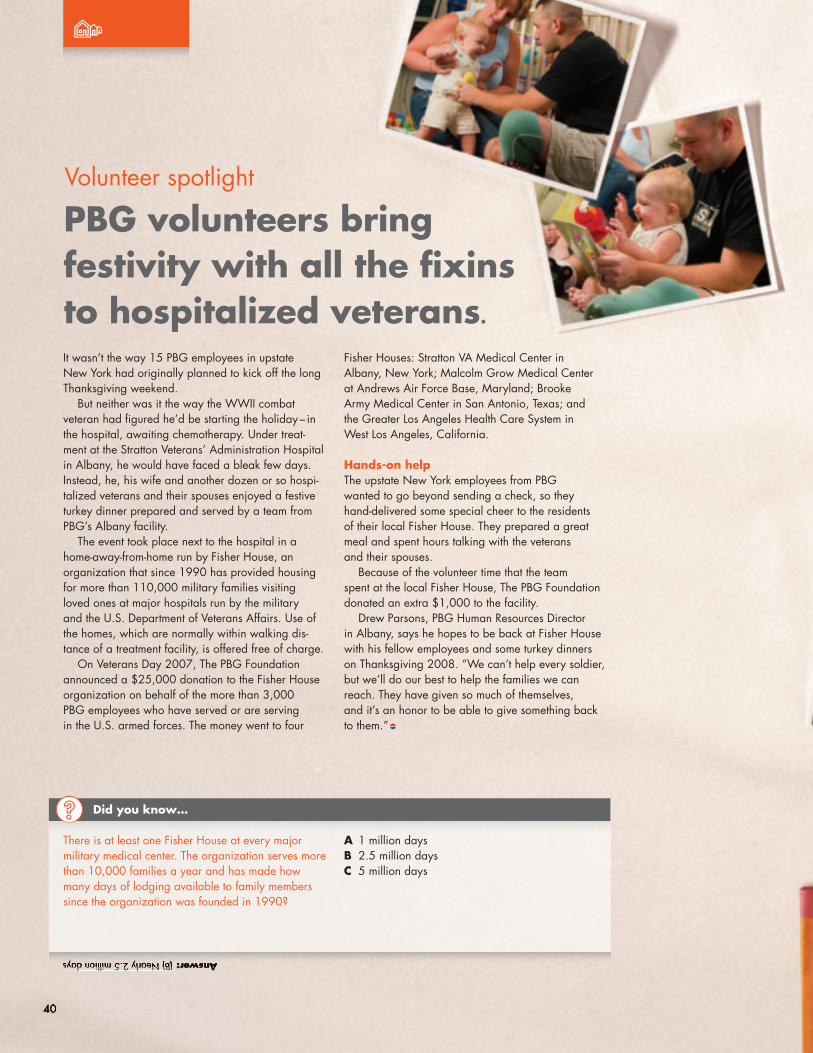
40
PBG volunteers bring festivity with all the fi xinsto hospitalized veterans.
It wasn’t the way 15 PBG employees in upstate New York had originally planned to kick off the long Thanksgiving weekend.
But neither was it the way the WWII combat veteran had fi gured he’d be starting the holiday– in the hospital, awaiting chemotherapy. Under treat-ment at the Stratton Veterans’ Administration Hospital in Albany, he would have faced a bleak few days. Instead, he, his wife and another dozen or so hospi-talized veterans and their spouses enjoyed a festive turkey dinner prepared and served by a team from PBG’s Albany facility.
The event took place next to the hospital in a home-away-from-home run by Fisher House, an organization that since 1990 has provided housing for more than 110,000 military families visiting loved ones at major hospitals run by the military and the U.S. Department of Veterans Affairs. Use of the homes, which are normally within walking dis-tance of a treatment facility, is offered free of charge.
On Veterans Day 2007, The PBG Foundation announced a $25,000 donation to the Fisher House organization on behalf of the more than 3,000 PBG employees who have served or are serving in the U.S. armed forces. The money went to four
Fisher Houses: Stratton VA Medical Center in Albany, New York; Malcolm Grow Medical Center at Andrews Air Force Base, Maryland; Brooke Army Medical Center in San Antonio, Texas; and the Greater Los Angeles Health Care System in West Los Angeles, California.
Hands-on helpThe upstate New York employees from PBG wanted to go beyond sending a check, so they hand-delivered some special cheer to the residents of their local Fisher House. They prepared a great meal and spent hours talking with the veterans and their spouses.
Because of the volunteer time that the team spent at the local Fisher House, The PBG Foundation donated an extra $1,000 to the facility.
Drew Parsons, PBG Human Resources Director in Albany, says he hopes to be back at Fisher House with his fellow employees and some turkey dinners on Thanksgiving 2008. “We can’t help every soldier, but we’ll do our best to help the families we can reach. They have given so much of themselves, and it’s an honor to be able to give something back to them.”
Volunteer spotlight
Answer: (B) Nearly 2.5 million days
A 1 million daysB 2.5 million daysC 5 million days
Did you know…
There is at least one Fisher House at every major military medical center. The organization serves more than 10,000 families a year and has made how many days of lodging available to family members since the organization was founded in 1990?
PBG_Print_Final_gr5.indd 40PBG_Print_Final_gr5.indd 40 9/16/08 4:25:35 PM9/16/08 4:25:35 PM

41
“Major contributors like The Pepsi Bottling Group greatly enhance our ability to meet the needs of service members, veterans and their families all across the country.”David A. CokerPresident, Fisher House Foundation
“Giving someone your time and consideration is the easiest way to feel good–and make a real difference.”Drew ParsonsHuman Resources Director, Albany, NY
41
PBG_Print_Final_gr1.IND_CS 41PBG_Print_Final_gr1.IND_CS 41 9/4/08 8:36:30 AM9/4/08 8:36:30 AMProcess CyanProcess Cyan Process MagentaProcess Magenta Process YellowProcess Yellow Process BlackProcess Black

42
Corporate philanthropy with a personaltouchEmployees set the giving agenda for The PBG Foundation.
An unquenchable spirit
The 70,000 employees of The Pepsi Bottling
Group have one thing in common: an
unquenchable spirit that motivates us to
constantly ask, “How can we do better?”
This spirit extends to PBG’s community
outreach efforts. Through volunteerism,
fi nancial support, product donations and
civic engagement, PBG strives to uplift
families and improve neighborhoods in need.
We come together to give back – one good
deed at a time.
And because we recognize the power that
even one person can have, PBG matches
every employee’s charitable donation. We also
recognize employee and retiree volunteerism
with fi nancial grants to the nonprofi ts they
care most about. By providing these grants,
we show that we also care about and respect
the causes that are important to our employees
and their families.
The PBG Foundationwww.pbg.com/foundation Did you know…
Based on grant applications alone since 2002, how many hours of their time have PBG employees volunteered?
A 22,000 hoursB 40,000 hoursC 66,000 hours
Answer: (B) More than 40,000, but since many employees volunteer without applying for grants, the actual fi gure is much higher.
PBG_Print_Final_gr3.indd 42PBG_Print_Final_gr3.indd 42 9/12/08 2:53:26 PM9/12/08 2:53:26 PM
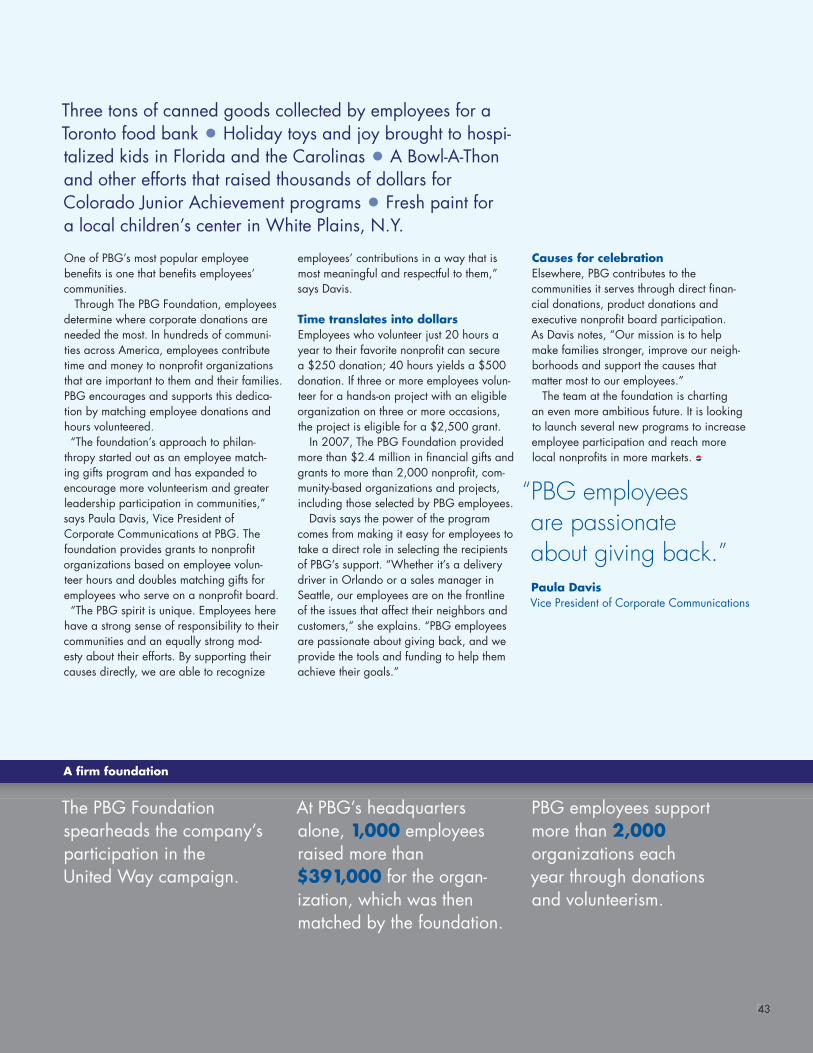
4343
employees’ contributions in a way that is most meaningful and respectful to them,” says Davis.
Time translates into dollarsEmployees who volunteer just 20 hours a year to their favorite nonprofi t can secure a $250 donation; 40 hours yields a $500 donation. If three or more employees volun-teer for a hands-on project with an eligible organization on three or more occasions, the project is eligible for a $2,500 grant.
In 2007, The PBG Foundation provided more than $2.4 million in fi nancial gifts and grants to more than 2,000 nonprofi t, com-munity-based organizations and projects, including those selected by PBG employees.
Davis says the power of the program comes from making it easy for employees to take a direct role in selecting the recipients of PBG’s support. “Whether it’s a delivery driver in Orlando or a sales manager in Seattle, our employees are on the frontline of the issues that affect their neighbors and customers,” she explains. “PBG employees are passionate about giving back, and we provide the tools and funding to help them achieve their goals.”
Causes for celebrationElsewhere, PBG contributes to the communities it serves through direct fi nan-cial donations, product donations and executive nonprofi t board participation. As Davis notes, “Our mission is to help make families stronger, improve our neigh-borhoods and support the causes that matter most to our employees.”
The team at the foundation is charting an even more ambitious future. It is looking to launch several new programs to increase employee participation and reach more local nonprofi ts in more markets.
A fi rm foundation
The PBG Foundation spearheads the company’s participation in the United Way campaign.
Three tons of canned goods collected by employees for aToronto food bank • Holiday toys and joy brought to hospi-talized kids in Florida and the Carolinas • A Bowl-A-Thonand other efforts that raised thousands of dollars for Colorado Junior Achievement programs • Fresh paint for a local children’s center in White Plains, N.Y.
One of PBG’s most popular employee benefi ts is one that benefi ts employees’ communities.
Through The PBG Foundation, employees determine where corporate donations are needed the most. In hundreds of communi-ties across America, employees contribute time and money to nonprofi t organizations that are important to them and their families. PBG encourages and supports this dedica-tion by matching employee donations and hours volunteered.“The foundation’s approach to philan-
thropy started out as an employee match-ing gifts program and has expanded to encourage more volunteerism and greater leadership participation in communities,”says Paula Davis, Vice President of Corporate Communications at PBG. The foundation provides grants to nonprofi t organizations based on employee volun-teer hours and doubles matching gifts for employees who serve on a nonprofi t board.“The PBG spirit is unique. Employees here
have a strong sense of responsibility to their communities and an equally strong mod-esty about their efforts. By supporting their causes directly, we are able to recognize
“PBG employees are passionate about giving back.”Paula DavisVice President of Corporate Communications
At PBG’s headquarters alone, 1,000 employeesraised more than $391,000 for the organ-ization, which was then matched by the foundation.
PBG employees support more than 2,000 organizations each year through donations and volunteerism.
PBG_Print_Final_gr1.IND_CS 43PBG_Print_Final_gr1.IND_CS 43 9/3/08 2:32:54 PM9/3/08 2:32:54 PMProcess CyanProcess Cyan Process MagentaProcess Magenta Process YellowProcess Yellow Process BlackProcess Black

44
orporate governance is all over the news these days as everyone from investors and regula-
tors to the media and employees scrutinizes the way companies operate. Accountability and trans-parency have never been more important – not only to practice, but also to communicate. PBG credits much of its strength and success to the way its governance structure puts accountability into every corner of the company whether it’s the warehouse break room, the facility manager’s offi ce or the executive suite.
For Steve Rapp, PBG’s Senior Vice President, General Counsel and Secretary, “Corporate governance provides the guardrails of transparency and accountability along the road toward sus-tainability.” Rapp also serves as PBG’s Chief Compliance Offi cer.
Laying out these guardrails are PBG sharehold-ers who elect the company’s Board of Directors. This is signifi cant because the board oversees the exercise of corporate powers, elects the chair-man, the CEO and other executive offi cers of the company, determines executive fi nancial and operational targets and compensation levels and ensures that the company is on track to meet its goals. Shareholders also vote on board proposals presented at PBG annual meetings and are invited to share comments, suggestions or even other proposals for an open discussion. Any stakeholder can – anonymously or not – provide PBG with feedback by simply writing a note to one or more board members.
Choosing the bestPBG works hard to maintain a predominantly independent board with selective representation from the company and PepsiCo, as called for in the company’s Director Independence Policy. Accordingly, seven of PBG’s 10 current directors are independent, including Barry H. Beracha, the board’s Non-Executive Chairman. Carefulscreening is done to make sure there aren’t any
confl icts of interest between an indepen-dent director’s respon-sibilities and his or her outside interests and commitments.
Intent on maintain-ing the highest quality members, candidates for PBG’s board must have a level of education, experience, sophistica-tion and expertise to understand the issues facing a company of
PBG’s size and scope. The board’s Nominating and Corporate Governance Committee also looks for a proven record of accomplishments that demon-strates the candidate’s business acumen. A third consideration is diversity, because, as Rapp notes, “We know that the diversity of our board makes our organization stronger and more competitive by providing a variety of perspectives and skills.”
One important role of PBG’s independent board members is serving on the three standing committees – Audit and Affi liated Transactions, Nominating and Corporate Governance, and Compensation and Management Development. Each consists entirely of independent board members. The Audit and Affi liated Transactions Committee is specifi cally charged with providing oversight of the company’s compliance with legal and regulatory requirements.
Good governance:
A roadmap to responsibility
“Corporate governance provides
the guardrails of transparency
and accountability along the road
toward sustainability.”
Steve Rapp Senior Vice President,
General Counsel and Secretaryand Chief Compliance Offi cer
C
PBG_Print_Final_gr2.indd 44PBG_Print_Final_gr2.indd 44 9/10/08 7:28:02 PM9/10/08 7:28:02 PM

45
Beyond the boardThe concept of personal excellence and account-ability extends throughout the company and into PBG’s high aspirations for its leaders, as set forth in a formal Leadership Model that guides managers to success.
PBG salaried employees receive training in the Leadership Model and understand that their performance will be evaluated against its tenets. While the structure revolves around four phases of leadership development, the model is grounded in three company values that managers must demon-strate and promote at all times:• Acts with Integrity – Delivers on commitments
without sacrifi cing personal or business ethics.• Respects & Values Differences – Strives to
be inclusive and shows sincere interest in others.• Operates with Justice – Consistently “does what
is right” both in good times and bad.
PBG also has a Worldwide Code of Conduct that defi nes the company’s ethical standards and explains the expectations for every employee. The document covers policies and positions related to workplace conduct, human rights, environmental protection, product quality, confl icts of interest, workplace safety, fair-trade practices and beyond.
In 2008, all PBG employees worldwide will receive Code of Conduct training. All salaried employees are required to certify that they have read and understood the Code of Conduct. In addition, PBG requires executives, managers and certain other employees to participate in a special compliance-training program. The courses in the program cover antitrust issues, fi nancial integrity, confl icts of interest and other topics particularly relevant to participants and their job functions.
Recognizing the inherent risks of being a multinational company, PBG has developed and communicated an International Anti-Bribery Compliance Policy, which outlines PBG’s commit-ment to comply with U.S. and local anti-bribery laws and details the provisions of the U.S. For-eign Corrupt Practices Act (FCPA). PBG provides
employee training on FCPA regulations and local anti-bribery laws. To ensure it is relevant and effective, each training curriculum is tailored to the local market’s culture and customs.
Eyes and earsAs spelled out in PBG’s Code of Conduct training, every employee has an obligation to report what they know about potential violations of the Code, company policy or the law. Employees can express concerns by writing to the Board of Directors as outlined above or by speaking directly to their supervisor or Human Resources manager. They can also express concerns – anonymously or not –by calling the PBG Business Ethics Line or contact-ing PBG’s Offi ce of Compliance, which provides oversight to the investigation of all reported con-cerns. PBG will not tolerate retaliation against any employee who reports a concern in good faith. Contact information for the PBG Business Ethics Line and Offi ce of Compliance is provided in the Code of Conduct.
PBG’s Internal Audit group conducts regular audits of the company’s operations and accounting processes to ensure compliance with company poli-cies and generally accepted accounting principles. The Audit and Affi liated Transactions Committee of the Board of Directors provides oversight to the Internal Audit group to ensure its independence and objectivity.
More informationPBG’s Internet site provides contact informa-tion for the board and details the company’s corporate governance policies and procedures at www.pbg.com, under Investor Relations –Company Information – Corporate Governance. Details of these policies and procedures will con-tinue to evolve; the central focus on leadership and accountability will never change.
The company’s radar
Preparing for problems is an essential component of any sustainable business strategy. Understanding the importance of contingency planning, PBG assembled a team of senior executives to oversee the company’s Enterprise Risk Management (ERM) process. With over-sight provided by the Audit and Affi liated Transactions Committee of the company’s Board of Directors, the ERM process involves functional and international leaders ensuring that risk identifi ca-tion and assessments are periodically updated and considered in strategy development. This compre-hensive approach requires a signifi cant investment of people, time and resources with the objective being to avoid the biggest risk of all –not being prepared.
PBG_Print_Final_gr7.indd 45PBG_Print_Final_gr7.indd 45 9/17/08 6:33:10 PM9/17/08 6:33:10 PM

46
Green
Recycle it!Beverage containers like the ones PBG uses are the most recycled consumer packaging in the U.S. But those billions of bottles and cans don’t fi nd their own way into recycling bins. See how long it takes you to get this bottle through the maze and into the collection bin.
46
Answer key on page 48
PBG_Print_Final_gr2.indd 46PBG_Print_Final_gr2.indd 46 9/10/08 7:29:47 PM9/10/08 7:29:47 PM
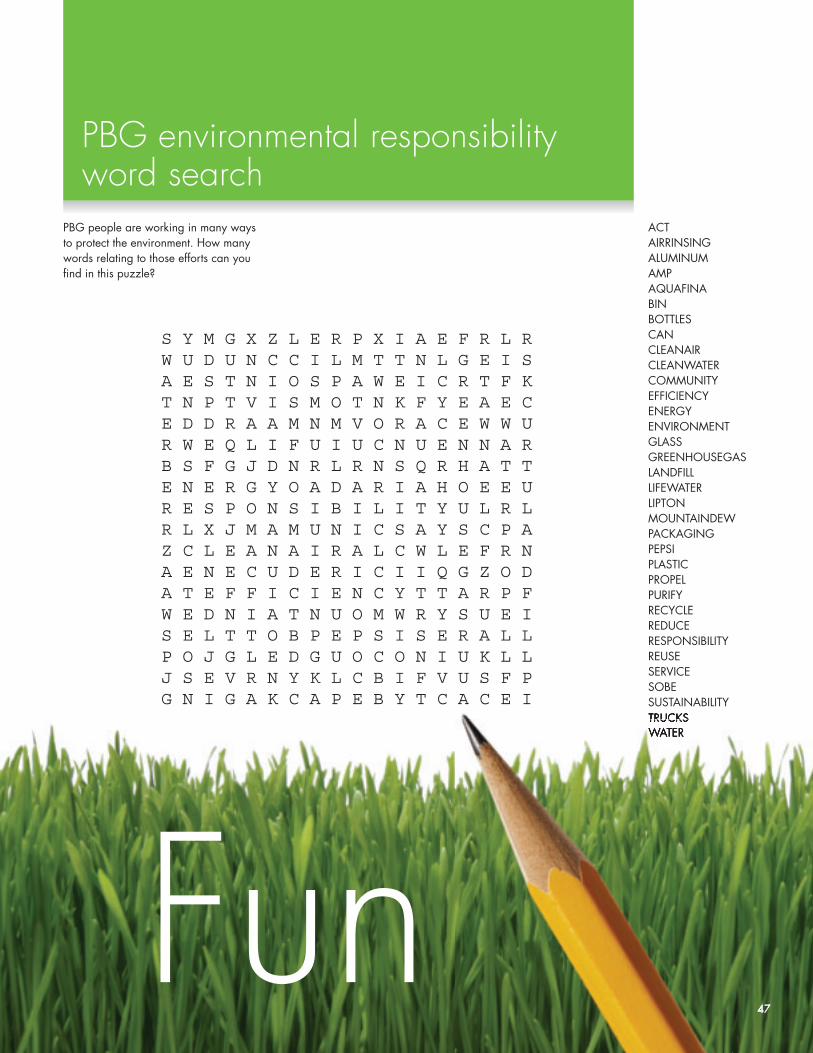
47
PBG people are working in many ways to protect the environment. How many words relating to those efforts can you fi nd in this puzzle?
Fun
PBG environmental responsibility word search
ACTAIRRINSINGALUMINUMAMPAQUAFINABINBOTTLESCANCLEANAIRCLEANWATERCOMMUNITYEFFICIENCYENERGYENVIRONMENTGLASSGREENHOUSEGASLANDFILLLIFEWATERLIPTONMOUNTAINDEWPACKAGINGPEPSIPLASTICPROPELPURIFYRECYCLEREDUCERESPONSIBILITYREUSESERVICESOBESUSTAINABILITYTRUCKSWATER
47
PBG_Print_Final_gr1.IND_CS 47PBG_Print_Final_gr1.IND_CS 47 9/3/08 2:33:19 PM9/3/08 2:33:19 PMProcess CyanProcess Cyan Process MagentaProcess Magenta Process YellowProcess Yellow Process BlackProcess Black

48
GRI index
Answer key for Green Fun puzzles on page 46 - 47.
In selecting topics for this, the premier issue of ACT! Our commitment to making a difference, we followed the structure of the Global Report-ing Initiative (GRI), the world’s most widely used sustainability reporting framework for describing economic, environmental and
social performance. This table shows how the pub-lication’s articles align with specifi c GRI principles and indicators. The data contained in this report was prepared following PBG established metrics and protocols and, where necessary, may include estimates based on representative samples.
GRI indicator ACT! page no.Strategy and analysis 1.1 Statement from CEO. 4-5 1.2 Description of key risks, opportunities, and impacts arising from sustainability trends. 1, 4-5, 44-45Organizational profi le 2.1 Name of the organization. 2 2.2 Primary brands, products and services. 2 2.3 Operational structure of the organizations, divisions, operating companies, subsidiaries and joint ventures. 2 2.4 Location of organization’s headquarters. Back cover 2.5 Number and names of countries where the organization operates. 2 2.6 Nature of ownership and legal form. 2 2.7 Markets served. 2 2.8 Scale of the reporting organization. 2 2.10 Awards received during the reporting period. 11, 32-33, 34-35Report profi le 3.1 Reporting period. Front cover 3.2 Date of most recent previous report. 1 3.4 Contact point for questions regarding the report or its contents. Back cover 3.5 Process for defi ning report content. 1, 2 3.6 Boundary of the report. 1, 2 3.7 State specifi c limitations on the scope of the boundary of the report. 1 3.9 Data measurement techniques and the bases of calculations. 48 3.12 Table identifying the location of Standard Disclosures in the report. 48Governance, commitments and engagement 4.1 Governance structure of the organization 44-45 4.2 Indicate whether the Chair of the highest governance body is also an executive offi cer. 44-45 4.3 The number of members of the highest governance body that are independent and/or non-executive members. 44-45 4.4 Mechanism for shareholders and employees to provide recommendations or direction to the highest governance body. 44-45 4.5 Linkage between compensation for members of the highest governance body, senior managers, and executives and the organization’s performance. 44-45
4.6 Process in place for the highest governance body to ensure confl icts of interest are avoided. 44-45 4.7 Process for determining the qualifi cations and expertise of the members of the highest governance body. 44-45 4.8 Internally developed statements of mission or values, codes of conduct, and principles relevant to economic, environmental and social performance. 28, 29-31, 44-45
4.9 Procedures of the highest governance body for overseeing the organization’s identifi cation and management of economic, environmental and social performance. 44-45
4.10 Processes for evaluating the highest governance body’s own performance. 44-45 4.12 Externally developed economic, environmental and social charters, principles or other initiatives to which the organization subscribes or endorses. 24-25
4.13 Memberships in associations and/or international advocacy organizations. 30 4.14 List of stakeholder groups engaged by the organizations. 2 4.15 Basis for identifi cation and selection of stakeholders with whom to engage. 2 4.16 Approaches to stakeholder engagement. 2 4.17 Key topics and concerns that have been raised through stakeholder engagement. 2
PBG_Print_Final_gr1.IND_CS 48PBG_Print_Final_gr1.IND_CS 48 9/3/08 2:33:28 PM9/3/08 2:33:28 PMProcess CyanProcess Cyan Process MagentaProcess Magenta Process YellowProcess Yellow Process BlackProcess Black
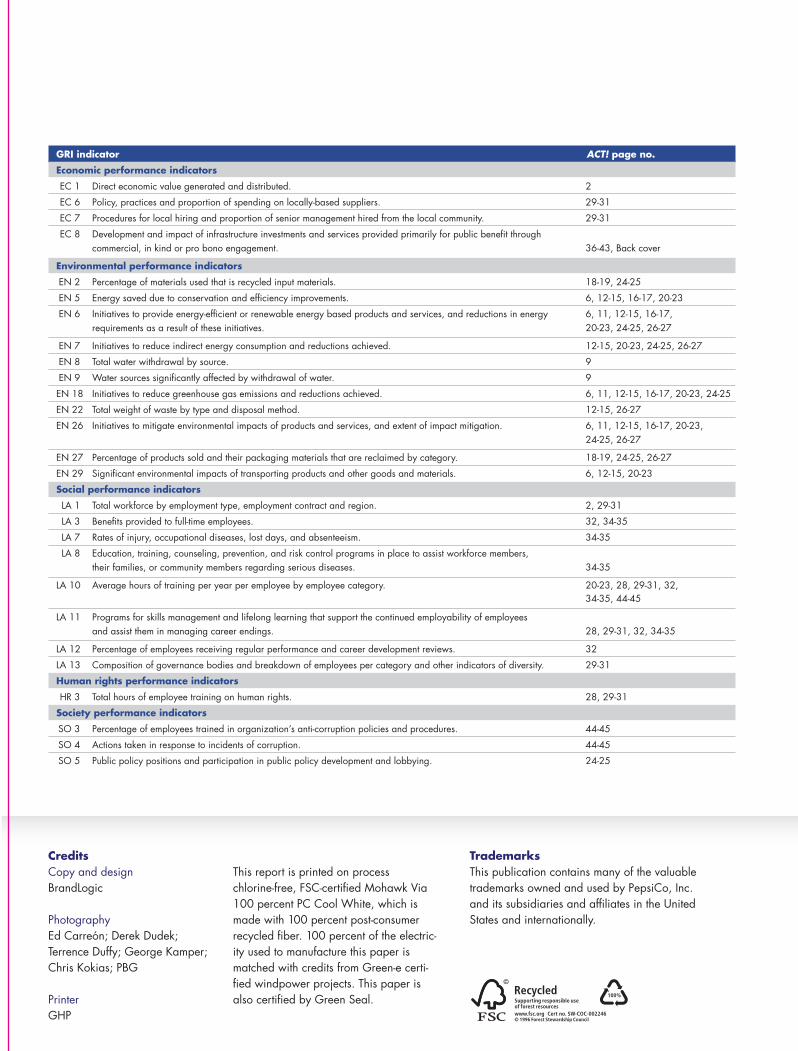
Today, people want to know more about the
companies they buy from, work for and invest in.
They want to know more about how a company
operates –how it treats its employees, how it lives
up to its environmental responsibilities and how
it gives back to its communities.
CreditsCopy and designBrandLogic
PhotographyEd Carreón; Derek Dudek;Terrence Duffy; George Kamper; Chris Kokias; PBG
PrinterGHP
This report is printed on process chlorine-free, FSC-certifi ed Mohawk Via 100 percent PC Cool White, which is made with 100 percent post-consumer recycled fi ber. 100 percent of the electric-ity used to manufacture this paper is matched with credits from Green-e certi-fi ed windpower projects. This paper is also certifi ed by Green Seal.
TrademarksThis publication contains many of the valuable trademarks owned and used by PepsiCo, Inc. and its subsidiaries and affi liates in the United States and internationally.
GRI indicator ACT! page no.
Economic performance indicators
EC 1 Direct economic value generated and distributed. 2
EC 6 Policy, practices and proportion of spending on locally-based suppliers. 29-31
EC 7 Procedures for local hiring and proportion of senior management hired from the local community. 29-31
EC 8 Development and impact of infrastructure investments and services provided primarily for public benefi t through commercial, in kind or pro bono engagement. 36-43, Back cover
Environmental performance indicators
EN 2 Percentage of materials used that is recycled input materials. 18-19, 24-25
EN 5 Energy saved due to conservation and effi ciency improvements. 6, 12-15, 16-17, 20-23
EN 6 Initiatives to provide energy-effi cient or renewable energy based products and services, and reductions in energy 6, 11, 12-15, 16-17, requirements as a result of these initiatives. 20-23, 24-25, 26-27
EN 7 Initiatives to reduce indirect energy consumption and reductions achieved. 12-15, 20-23, 24-25, 26-27
EN 8 Total water withdrawal by source. 9
EN 9 Water sources signifi cantly affected by withdrawal of water. 9
EN 18 Initiatives to reduce greenhouse gas emissions and reductions achieved. 6, 11, 12-15, 16-17, 20-23, 24-25
EN 22 Total weight of waste by type and disposal method. 12-15, 26-27
EN 26 Initiatives to mitigate environmental impacts of products and services, and extent of impact mitigation. 6, 11, 12-15, 16-17, 20-23, 24-25, 26-27
EN 27 Percentage of products sold and their packaging materials that are reclaimed by category. 18-19, 24-25, 26-27
EN 29 Signifi cant environmental impacts of transporting products and other goods and materials. 6, 12-15, 20-23
Social performance indicators
LA 1 Total workforce by employment type, employment contract and region. 2, 29-31
LA 3 Benefi ts provided to full-time employees. 32, 34-35
LA 7 Rates of injury, occupational diseases, lost days, and absenteeism. 34-35
LA 8 Education, training, counseling, prevention, and risk control programs in place to assist workforce members, their families, or community members regarding serious diseases. 34-35
LA 10 Average hours of training per year per employee by employee category. 20-23, 28, 29-31, 32, 34-35, 44-45
LA 11 Programs for skills management and lifelong learning that support the continued employability of employees and assist them in managing career endings. 28, 29-31, 32, 34-35
LA 12 Percentage of employees receiving regular performance and career development reviews. 32
LA 13 Composition of governance bodies and breakdown of employees per category and other indicators of diversity. 29-31
Human rights performance indicators
HR 3 Total hours of employee training on human rights. 28, 29-31
Society performance indicators
SO 3 Percentage of employees trained in organization’s anti-corruption policies and procedures. 44-45
SO 4 Actions taken in response to incidents of corruption. 44-45
SO 5 Public policy positions and participation in public policy development and lobbying. 24-25
bdl304169_COVERS_gr1.indd 2bdl304169_COVERS_gr1.indd 2 9/10/08 6:05:01 PM9/10/08 6:05:01 PMProcess CyanProcess Cyan Process MagentaProcess Magenta Process YellowProcess Yellow Process BlackProcess Black DieDie

1 Pepsi WaySomers, NY 10589www.pbg.com
Direct all inquiries to PBG Headquarters at: [email protected]
HurricaneAfter Hurricane Katrina tore through the Gulf Coast, PBG partnered with relief agencies to deliver 40 truckloads of Aquafina and other Pepsi products to shelters and community centers. Without hesitation, our employees banded together to raise funds and collect trailers full of clothing and food. Some employees even opened their homes to displaced flood victims.
FloodLast fall, PBG got an urgent call from Feeding America (formerly America’s Second Harvest) requesting bottled water for citizens affected by severe flooding in Seattle. Within 24 hours, PBG employees had sent out more than 1,000 cases of Aquafina to insure residents had clean drinking water.
FireAs wildfires engulfed the San Diego hills, PBG drivers – undeterred by encroaching flames – delivered truckload after truckload of Aquafina to residents, relief workers and firefighters on the front lines.
PBG employees take great
pride in providing millions
of people a year with quality
products. We are also proud
to give back in times of need.
When disaster strikes... ...our people and our trucks switch into high gear to get safe
drinking water to the victims, emergency response teams and
relief workers.