Process Safety Leading key performance · PDF fileProcess Safety – Leading key...
42
Process Safety – Leading key performance indicators Supplement to Report 456 implement guide JULY 2016 REPORT 556
Transcript of Process Safety Leading key performance · PDF fileProcess Safety – Leading key...

Process Safety – Leading key performance indicatorsSupplement to Report 456
implement guide
JULY2016
REPORT
556
AcknowledgementsThis report was developed by the IOGP Process Safety Subcommittee.
Photography used with permission courtesy of ©Olivier Lantzendorffer/iStockphoto and ©Georgijevic/iStockphoto (Front cover) ©FabioFilzi/iStockphoto (Back cover)
Disclaimer
Whilst every effort has been made to ensure the accuracy of the information contained in this publication, neither IOGP nor any of its Members past present or future warrants its accuracy or will, regardless of its or their negligence, assume liability for any foreseeable or unforeseeable use made thereof, which liability is hereby excluded. Consequently, such use is at the recipient’s own risk on the basis that any use by the recipient constitutes agreement to the terms of this disclaimer. The recipient is obliged to inform any subsequent recipient of such terms.
This publication is made available for information purposes and solely for the private use of the user. IOGP will not directly or indirectly endorse, approve or accredit the content of any course, event or otherwise where this publication will be reproduced.
Copyright notice
The contents of these pages are © International Association of Oil & Gas Producers. Permission is given to reproduce this report in whole or in part provided (i) that the copyright of IOGP and (ii) the sources are acknowledged. All other rights are reserved. Any other use requires the prior written permission of IOGP.
These Terms and Conditions shall be governed by and construed in accordance with the laws of England and Wales. Disputes arising here from shall be exclusively subject to the jurisdiction of the courts of England and Wales.
Process Safety – Leading key performance indicatorsSupplement to Report 456
Revision history
VERSION DATE AMENDMENTS
1.0 July 2016 First release
JULY2016
REPORT
556
1. Introduction 5
2. Background 7
3. Concepts 9
3.1 Incorporating barrier thinking 93.2 Dual assurance 133.3 Quantify locally and learn widely 17
4. Selection and review 19
4.1 Selection of key barriers for KPIs 194.2 Selection of indicators 204.3 Review of KPIs 224.4 Learning from Tier 1 and 2 events 24
5. Example leading indicators 25
Appendix A: Survey of industry practice of KPI implementation 35
References 41
Contents
4Process Safety – Leading key performance indicators
1. Introduction
This is a supplement to the 2011 publication of Report 456, Process Safety – Recommended Practice on Key Performance Indicators [1]. It builds on the experience of IOGP member companies, and others, to provide further guidance for companies on how to establish process safety key performance indicators (KPIs) that are leading.
The overall aim is to enable companies to establish effective leading indicators that proactively assess the health of barriers that manage the risk of process safety events (PSEs), particularly those that could result in a major incident.
While PSEs are generally defined in terms of loss of primary containment (LOPC) of hydrocarbons, this guidance is equally applicable to other hazards that could be unintentionally released, such as electrical energy or kinetic/potential energy (e.g. dropped objects and marine collisions).
The guidance focuses on the effectiveness of both hardware and human barriers, and supporting management system processes that are designed for either prevention of PSEs, or mitigation to avoid or reduce the potential consequences of PSEs.
This report is presented in five sections, including three concepts that underpin this guidance:
1) Introduction
2) Background – a brief summary of the past work by IOGP and others on the four tier model for process safety KPIs, including the more leading indicators at the Tier 3 and Tier 4 (T3 and T4) levels
3) Concepts – three concepts underpin the guidance in this report:
3.1. Barrier thinking – establishing a standard set of process safety barriers that are regularly reviewed to identify those key barriers that need ongoing monitoring or require strengthening.
3.2. Dual assurance – each key barrier is monitored using a combination of
a) Tier 3 KPIs that track barrier weakness or impairment; and
b) Tier 4 KPIs that measure inputs that maintain barrier effectiveness.
3.3. Measure locally and learn widely – to be relevant and informative, leading KPIs generally need to be sufficiently specific for asset-level application. At company level, review of KPI data promotes shared learning and improvement of barrier and management system effectiveness.
5Process Safety – Leading key performance indicators
4) Selection and review – applies barrier thinking and dual assurance concepts within a continuous improvement process to identify appropriate T3 and T4 KPIs and to ensure the KPIs are regularly assessed and updated, as necessary.
5) Example leading indicators – good practice guidance to illustrate how example Tier 3 and 4 KPIs can be combined to monitor barriers (or Management System Elements).
The results of a survey of IOGP member practice and experience undertaken during January to April 2014 is summarized in Appendix A.
While this report is generally aligned with Report 456, there may be some areas of divergence that reflect progress in understanding and good practice related to process safety KPIs since 2011, and provides alignment with subsequent publications by IOGP and others.
6Process Safety – Leading key performance indicators

2. Background
In November 2011, IOGP published Report 456, Process Safety – Recommended Practice on Key Performance Indicators [1], which built on Report 415, Asset integrity – the Key to Managing Major Incident Risks [1], 2008.
Based on earlier work by CCPS [3] and API [4], Report 456 introduced a four tier model for implementation of process safety KPIs by oil and gas producing companies.
The model is illustrated by the pyramid diagram in Figure 1 that also illustrates the need for higher numbers of KPIs at the more leading levels.
Tier 1LOPC events of
greater consequence
Leading indicators
Lagging indicators
LOPC events oflesser consequence
Challenges to safety systems
Operating discipline & managementsystem performance indicators
Tier 2
Tier 3
Tier 4
From ANSI/API RP 754 [4]
Figure 1: Process safety indicator pyramid
Tier 1 and Tier 2 (T1 and T2) are well defined KPIs based on recording of PSEs that involve LOPC that either exceed gas or liquid release thresholds or result in serious consequences such as injury or fire. T1 and T2 PSEs are intended to be ‘lagging’ indicators that have consistent definitions for both downstream and upstream oil and gas operations and can be benchmarked across the industry. IOGP have published summary T1 and T2 data (actual and normalized) from IOGP member companies based on voluntary submission of annual data since 2011 [5].
7Process Safety – Leading key performance indicators

In contrast, Tiers 3 and 4 (T3 and T4) provide an intentionally broader concept, with the aim of encouraging companies to introduce a range of more leading KPIs that are typically defined locally at the facility or asset level, or in some instances across a business or company, to monitor the effectiveness of barriers that are specifically designed as risk controls at the operating level.
This report provides further guidance at the T3 and T4 level based on good practice that has emerged in the industry. It captures and shares company experience in implementing KPIs since the launch of Report 456.
Leading or Lagging?There can be confusion about the terms ‘leading’ and ‘lagging’. T3 and T4 KPIs are often both considered ‘leading’ because they are implemented to be predictive measures compared to the ‘lagging’ T1 and T2 KPIs which track specific levels of LOPC PSEs including those resulting in incidents with severe consequences. However, when compared to the more proactive leading KPIs within T4, the T3 KPIs are arguably ‘lagging’ as these KPIs monitor events or conditions that indicate failures or weaknesses, such as a minor LOPC below the T2 thresholds.
As indicated by the arrows on Figure 1, it is the combination of T3 and T4, together with the learnings from T1 and T2 events, which collectively provide lagging and leading information to inform a company’s actions to improve its barriers and risk management.
In this report, a T3 KPI may be referred to as lagging when differentiating its purpose from a corresponding leading T4 KPI. This differentiation can be helpful when establishing dashboards or scorecards or ‘dual assurance’ where the intent is to highlight the role of T4 leading indicators in driving preventative performance that reduces T3 weaknesses in safety barriers or Management System Elements.
8Process Safety – Leading key performance indicators
3. Concepts
3.1 Incorporating barrier thinking The concept of barriers is central to management of process safety risks. The well-known bow tie and Swiss Cheese risk management models were used in Report 415 and Report 456 to explain how risks can be controlled to prevent PSEs.
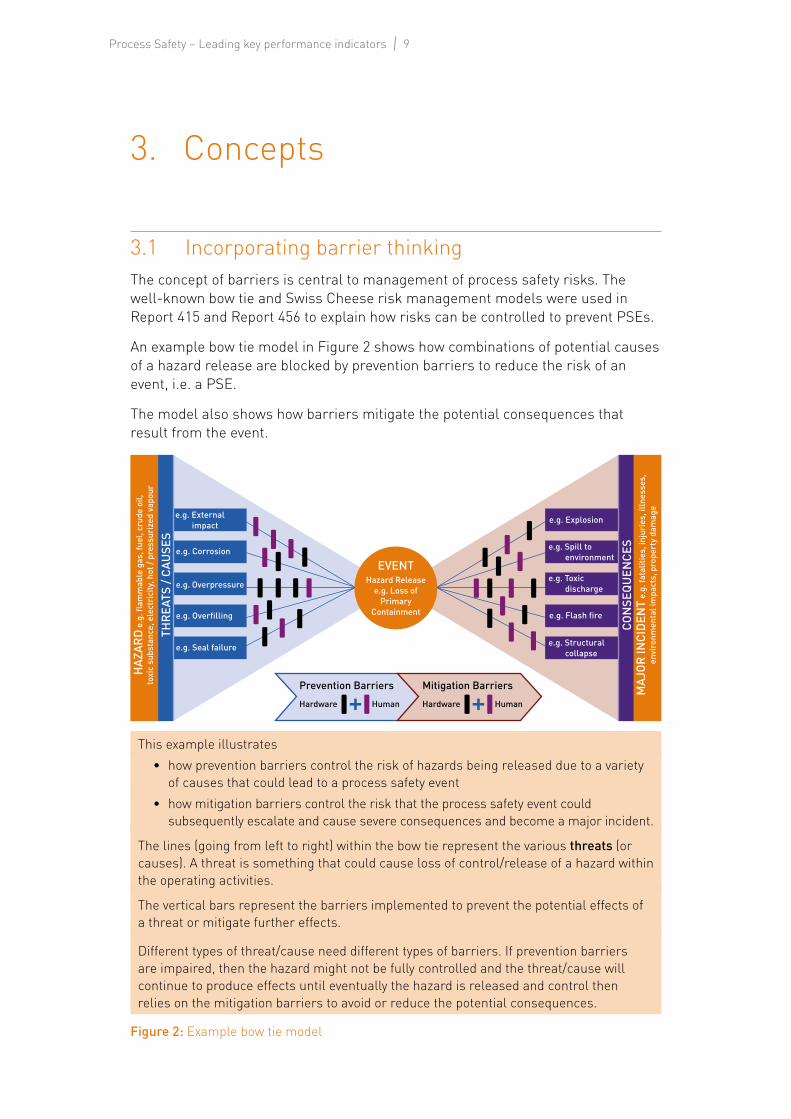
An example bow tie model in Figure 2 shows how combinations of potential causes of a hazard release are blocked by prevention barriers to reduce the risk of an event, i.e. a PSE.
The model also shows how barriers mitigate the potential consequences that result from the event.
e.g. Externalimpact
e.g. Corrosion e.g. Spill toenvironment
e.g. Explosion
e.g. Flash fire
e.g. Structuralcollapse
e.g. Toxicdischargee.g. Overpressure
e.g. Overfilling
e.g. Seal failure
HAZA
RD e
.g. f
lam
mab
le g
as, f
uel,
crud
e oi
l, to
xic
subs
tanc
e, e
lect
ricity
, hot
/ pr
essu
rized
vapo
ur
THRE
ATS
/ CAU
SES
MAJ
OR IN
CIDE
NT
e.g.
fata
litie
s, in
jurie
s, il
lnes
ses,
en
viro
nmen
tal i
mpa
cts,
pro
pert
y dam
age
CON
SEQU
ENCE
S
EVENTHazard Release
e.g. Loss of Primary
Containment
Mitigation BarriersHardware Human
Prevention BarriersHardware Human
This example illustrates• how prevention barriers control the risk of hazards being released due to a variety
of causes that could lead to a process safety event• how mitigation barriers control the risk that the process safety event could
subsequently escalate and cause severe consequences and become a major incident.
The lines (going from left to right) within the bow tie represent the various threats (or causes). A threat is something that could cause loss of control/release of a hazard within the operating activities.
The vertical bars represent the barriers implemented to prevent the potential effects of a threat or mitigate further effects.
Different types of threat/cause need different types of barriers. If prevention barriers are impaired, then the hazard might not be fully controlled and the threat/cause will continue to produce effects until eventually the hazard is released and control then relies on the mitigation barriers to avoid or reduce the potential consequences.
Figure 2: Example bow tie model
9Process Safety – Leading key performance indicators

Report 456 stated that
“T3 & T4 KPIs are primarily intended for monitoring and review of risk control systems (i.e. barriers), especially at the operational level.”
Barrier thinking is a useful concept for process safety management. The term barrier was defined in Report 456. At a practical level, however, the term has been used inconsistently, making it difficult to identify improvement opportunities for broader application. Because barriers are fundamental to T3 and T4 KPIs, this report introduces a more consistent approach to standardize and categorize barriers to assist the transfer of learning and improve systems and performance.
As illustrated by Figure 2, barriers are put in place to manage the risk of a hazard being released resulting in an unintended event, such as LOPC, which could cause harmful consequences. A properly functioning barrier will either stop the event from happening (a prevention barrier) or reduce its consequences (a mitigation barrier).
IOGP have developed Report 544, Standardization of barrier definitions [6], a supplement to Report 415. This provides standardized terminology that supports the transfer of learning from Tier 1 to Tier 4 PSEs and enables barrier improvements to be implemented consistently across an organization’s assets and its management systems.
In Figure 3, hardware barriers include the activities necessary to assure that they continue to meet the performance standards set at the design stage, while the asset’s workforce provides human barriers that respond and act to manage the potential cause or threat of an event. The elements of the asset’s management system then provide the necessary support processes to ensure the barriers are effective throughout the asset’s life.
Examples
For example, in a pressure vessel engineered with sufficient integrity and controls to prevent release of hydrocarbons, the definition of a hardware barrier includes the management of that barrier or the tasks and activities necessary to assure that it continues to meet the requirements of the performance standard. The management system includes a description of the maintenance and inspection process designed to support this.
Or for example, an operator monitoring the filling of a tank can respond to an alarm by implementing a procedure to prevent an over-fill. The effectiveness of this human barrier relies on the discipline and knowledge to operate the plant in accordance with the procedures. Failure to do so may be attributable to an underlying management system failure such as competency management, unclear procedures or under resourcing.
10Process Safety – Leading key performance indicators
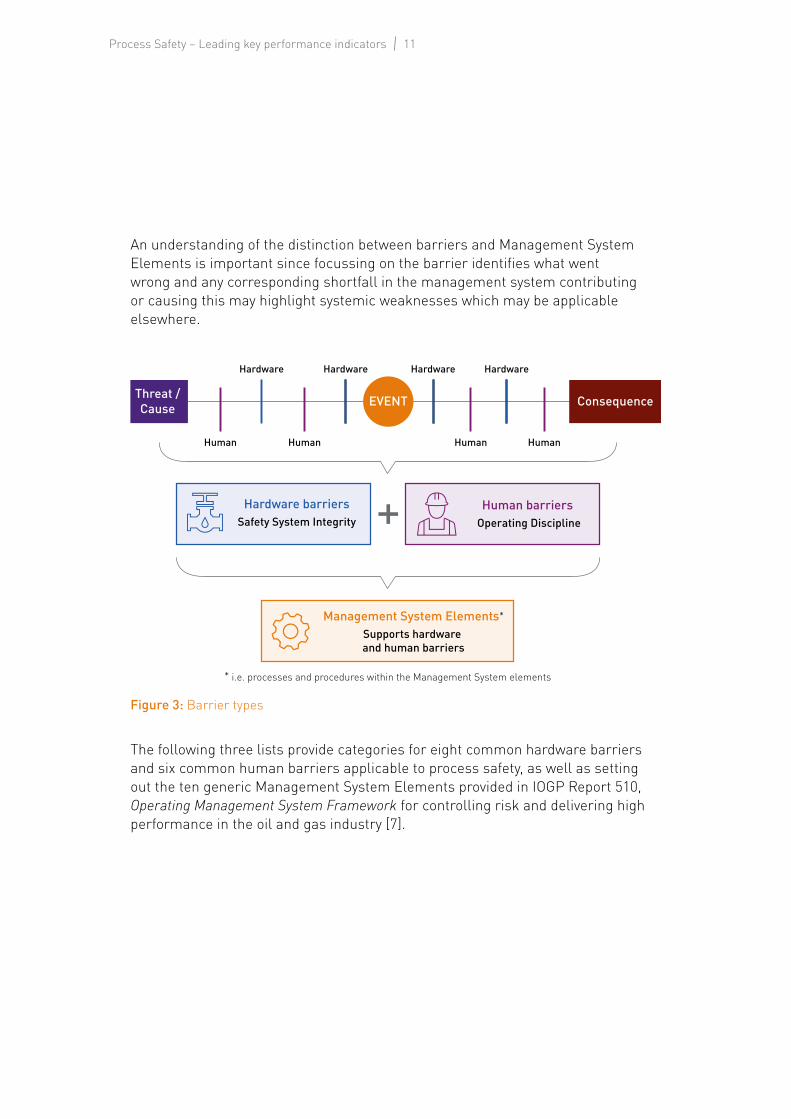
An understanding of the distinction between barriers and Management System Elements is important since focussing on the barrier identifies what went wrong and any corresponding shortfall in the management system contributing or causing this may highlight systemic weaknesses which may be applicable elsewhere.
Threat /Cause ConsequenceEVENT
Human Human Human Human
Hardware Hardware Hardware Hardware
Hardware barriersSafety System Integrity
Human barriers Operating Discipline
Management System Elements*
Supports hardware and human barriers
* i.e. processes and procedures within the Management System elements
Figure 3: Barrier types
The following three lists provide categories for eight common hardware barriers and six common human barriers applicable to process safety, as well as setting out the ten generic Management System Elements provided in IOGP Report 510, Operating Management System Framework for controlling risk and delivering high performance in the oil and gas industry [7].
11Process Safety – Leading key performance indicators

Hardware barriersPrimary Containment, process equipment and engineered systems designed and managed to prevent LOPC and other types of asset integrity or process safety events and mitigate any potential consequences of such events. These are checked and maintained by people (in critical activity/tasks).
Category 1: Structural Integrity
Category 2: Process Containment
Category 3: Ignition Control
Category 4: Detection Systems
Category 5: Protection Systems – including deluge and firewater systems
Category 6: Shutdown Systems – including operational well isolation and drilling well control equipment
Category 7: Emergency Response
Category 8: Life-Saving Equipment – including evacuation systems.
Human barriersBarriers that rely on the actions of people capable of carrying out activities designed to prevent LOPC and other types of asset integrity or process safety events and mitigate any potential consequences of such events.
Category 1: Operating in accordance with procedures • Permit to Work• Isolation of equipment• Overrides and inhibits of safety systems• Shift handover, etc.
Category 2: Surveillance, operator rounds and routine inspection
Category 3: Authorization of temporary and mobile equipment
Category 4: Acceptance of handover or restart of facilities or equipment
Category 5: Response to process alarm and upset conditions (e.g. outside safe envelope)
Category 6: Response to emergencies.
12Process Safety – Leading key performance indicators

Management System ElementsManagement System Elements designed to prevent LOPC and other types of asset integrity or process safety events and mitigate any potential consequences of such events. Management System Elements support hardware and human barriers. See reference [7].
Some examples are:• Permit to work (Element 8)• Management of Change (Element 5) • Emergency Response Procedure (Element 7)• Competency Management (Element 3)• Contractor Management (Element 3)• Technical Integrity (Element 6)• Corrosion Management (Element 6)• Equipment Isolation (Element 8).
3.2 Dual assuranceThe second concept aims to recognize and exploit the correlation between the extent of weaknesses in a barrier and level of proactive activity (effort and investment) to maintain a barrier’s integrity.
Here we turn to the Swiss Cheese model (after J. Reason), which was used in Report 456 to illustrate how PSEs and their consequences occur when barrier weaknesses (holes) align to allow a threat to pass through multiple barriers.
The Swiss Cheese model can also be seen as a single threat or causal line from a bow tie. This illustrates how an asset has reviewed the cause of several minor PSEs that resulted even when all barriers of the bow tie were in place.
In this example scenario (Figure 4), the PSE and its consequences are the result of weakness or impairment of a key hardware prevention barrier – process containment systems – leading to overfills. The overfilling allowed the hazard – in this case flammable hydrocarbons – to be released with the potential for ignition and a fire, which fortunately did not occur.
Review of the barriers in place suggested two had the greatest potential for monitoring and improvement – process containment – because of the recognized weaknesses and – ignition control – because of its criticality in mitigating the risk of consequences.
13Process Safety – Leading key performance indicators
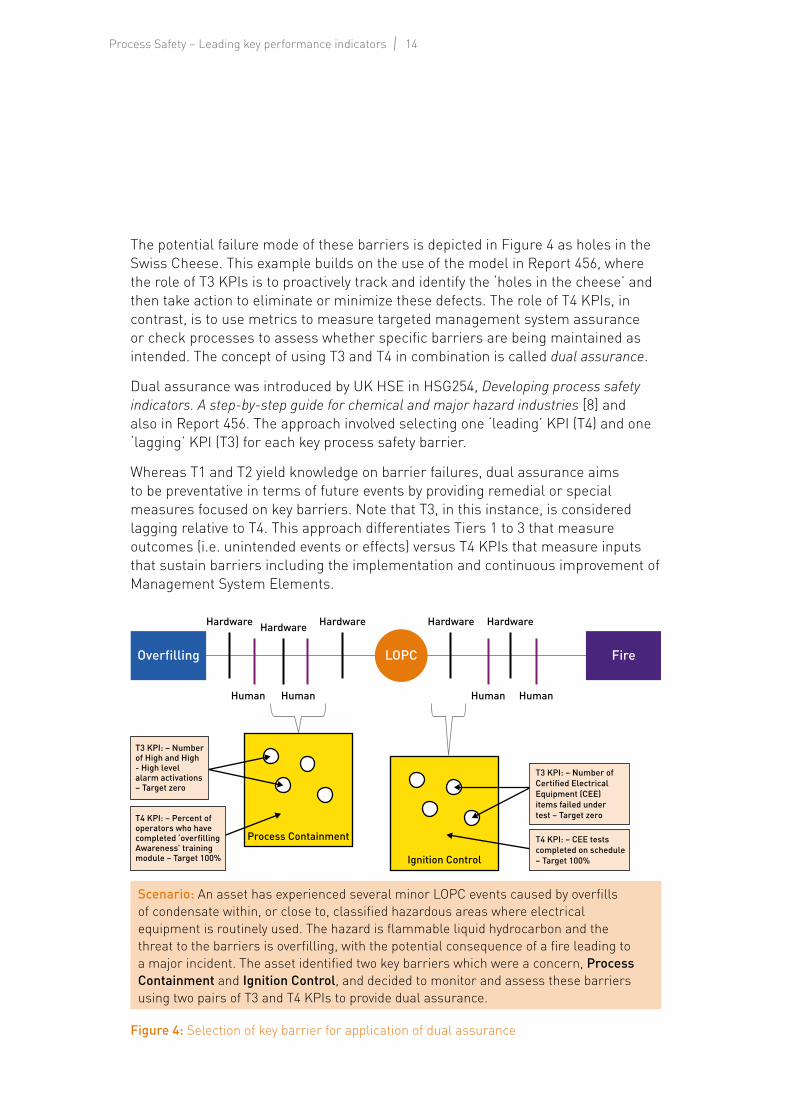
The potential failure mode of these barriers is depicted in Figure 4 as holes in the Swiss Cheese. This example builds on the use of the model in Report 456, where the role of T3 KPIs is to proactively track and identify the ‘holes in the cheese’ and then take action to eliminate or minimize these defects. The role of T4 KPIs, in contrast, is to use metrics to measure targeted management system assurance or check processes to assess whether specific barriers are being maintained as intended. The concept of using T3 and T4 in combination is called dual assurance.
Dual assurance was introduced by UK HSE in HSG254, Developing process safety indicators. A step-by-step guide for chemical and major hazard industries [8] and also in Report 456. The approach involved selecting one ‘leading’ KPI (T4) and one ‘lagging’ KPI (T3) for each key process safety barrier.
Whereas T1 and T2 yield knowledge on barrier failures, dual assurance aims to be preventative in terms of future events by providing remedial or special measures focused on key barriers. Note that T3, in this instance, is considered lagging relative to T4. This approach differentiates Tiers 1 to 3 that measure outcomes (i.e. unintended events or effects) versus T4 KPIs that measure inputs that sustain barriers including the implementation and continuous improvement of Management System Elements.
Overfilling FireLOPC
Human Human HumanHuman
Hardware Hardware HardwareHardwareHardware
Process Containment
Ignition Control
T4 KPI: – CEE tests completed on schedule – Target 100%
T3 KPI: – Number of Certified Electrical Equipment (CEE) items failed under test – Target zero
T3 KPI: – Number of High and High - High level alarm activations – Target zero
T4 KPI: – Percent of operators who have completed ‘overfilling Awareness’ training module – Target 100%
Scenario: An asset has experienced several minor LOPC events caused by overfills of condensate within, or close to, classified hazardous areas where electrical equipment is routinely used. The hazard is flammable liquid hydrocarbon and the threat to the barriers is overfilling, with the potential consequence of a fire leading to a major incident. The asset identified two key barriers which were a concern, Process Containment and Ignition Control, and decided to monitor and assess these barriers using two pairs of T3 and T4 KPIs to provide dual assurance.
Figure 4: Selection of key barrier for application of dual assurance
14Process Safety – Leading key performance indicators

In Figure 4, T3 KPIs are implemented by the asset to monitor the two selected key barriers. The T3 indicators are tracking weaknesses by counting the number of undesirable outcomes:
• the first barrier tracks High or High–High alarms being triggered• the second tracks equipment that failed under test.
An asset will trend this data and may often choose to normalize the KPIs, e.g. alarms triggered per shift or per month, or e.g. equipment failed as a percentage of all equipment tested. Then two T4 indicators are established to measure management system or other inputs that are intended to maintain the strength of the barrier, in this case operator training and completion of equipment tests on schedule.
On reviewing the data recorded, the asset may decide, for example, to increase training and improve equipment tests. Continuation of the T4 KPIs will then allow assessment of the effectiveness of the additional input to further strengthen the two barriers to gain a corresponding reduction in the two T3 KPIs.
An asset will generally define its KPIs in greater detail than in the example provided. In this example scenario, an asset’s version of the T3 and T4 KPIs should be specific to the types of alarm systems, existing data feeds, involved operators and shifts, as well as the ignition control procedures and testing regimes in place.
Over time, in parallel with improvement actions to strengthen the barriers, analysis of the KPIs is used to correlate between T3 and T4 and determine whether the actions are resulting in the desired improvement of the two key barriers. Typically, this correlation is the subject of annual review when T3 and T4 results are analysed comparatively to determine if better barrier performance can be verified, i.e. a sustainable reduction in T3 has been achieved due to corresponding improvements in operating practices and processes.
Once sufficient improvement is achieved, with changes permanently applied to the barrier or embedded within the management system, the KPIs may be retained for assurance (to monitor its sustainability), or refocused on other barriers related to overfilling, or concluded so that efforts can be directed to other causes of LOPC.
15Process Safety – Leading key performance indicators

What is the difference between Tier 3 and Tier 4? When Report 456 was published, the two lower leading tiers of the process safety indicators pyramid were relatively immature in terms of well-defined KPIs, or examples. A result of this was a lack of clear distinction between Tier 3 and 4, which is important when aiming for dual assurance which ideally should use outcome and input measures in combination to assess barrier health.
While there can be a grey area between the two Tiers, a reasonable distinction is:
• Tier 3 KPIs record outcomes of unintended, unplanned, uncontrolled events, conditions, circumstances or effects. Tier 3 is consistent with events such as minor LOPC (below the Tier 1 or Tier 2 thresholds) but more widely applicable to all types of unintended effects and conditions, e.g. component failures in service, safety relief demands, operating envelope excursions or safety instrumented system demands, quality non-conformances, audit non-compliance findings, or corrosion failures. Because Tier 3 data reflects preventable events or findings that represent impairment or failure of a barrier, the desirable objective of a Tier 3 KPI is zero.
• Tier 4 KPIs pro-actively measure the asset’s input (work, effort, investment) to maintain and improve the completeness, integrity, strength or quality of barriers and supporting Management System Elements. Tier 4 is therefore measuring planned activity and the general aim is to achieve 100% completion. Tier 4 supports understanding of the effort required to reduce barrier weaknesses (“holes”) to an appropriate level in terms of risk management.
In practice, some indicators may address more than one barrier, therefore every barrier may not need its own unique pair of T3 and T4 KPIs, but a balanced approach to cover all key barriers with a set of indicators is recommended.
The following examples are selected to illustrate the difference between Tier 3 and Tier 4.
• Relief valve failure to lift would be Tier 3 versus completion of relevant inspection/maintenance which would be Tier 4 (note that a backlog is also T4 because it is simply a ‘negative’ measure of planned maintenance).
• An operating envelope excursion causing a relief valve lift is also Tier 3, versus corresponding Tier 4 measures that ensure operating discipline within the plant.
16Process Safety – Leading key performance indicators
• Audit/HAZOP non-compliance findings would be Tier 3, whereas confirming corrective actions are implemented as planned would be Tier 4, as would completing all audits/reviews.
• Challenges to safety barriers, often referred to as Demands on safety systems (DOSS), are examples of Tier 3 events. Equally, a causal factor that resulted in a DOSS event, such as lack of competence, can also be categorized as Tier 3, even though it relates to a management system element. However, metrics that track completion of safety system training and competence assessments would be Tier 4.
3.3 Quantify locally and learn widely The greatest direct value of T3 and T4 indicators is generally at the local level. This is because a company’s assets will vary in terms of activities, equipment and processes. The indicators need to reflect these differences, as well as maturity, complexity, location and culture.
For example, an indicator that measures closure of high priority safety actions should drive an asset to improve its performance by gaining a clearer understanding of why a backlog or ‘gap’ exists.
Often this understanding is important for corporate assurance or to gain management support for improvement initiatives. In contrast, the same KPI used to confirm that a second asset has successfully closed every safety action over the past five years is of less value to the asset concerned. The KPI can provide assurance to corporate management that controls remain robust but, in this case, the second asset could take the opportunity to review and pro-actively refocus its KPIs by identifying more specific areas for improvement.
The specificity of T3 and T4 KPIs to an asset’s activities, equipment or processes will generally present challenges in comparing leading indicator data between assets, even within one company. Often it is difficult to normalize T3 or T4 KPI data and this can give rise to complexity in determining completeness of ‘denominator’ data. These challenges constrain the value of external intracompany benchmarking by aggregating T3 and T4 KPI data. However, there is considerable value at the corporate level, or between companies, in bringing together the insights gained from asset level analysis. This is particularly important at the corporate level as good analysis and presentation of findings is an essential part of engaging senior management in review of process safety performance.
At the leadership level, either asset or corporate, the experience of oil and gas companies is that the four tier model supports strong levels of management
17Process Safety – Leading key performance indicators
interest and dialogue. In this way, leading indicators also support a culture of constant vigilance or ‘mindfulness’ that develops proactive sensitivity to other observed ‘weak signals’ such as changes in operating discipline or workforce concern and attitude.
Examples of other leadership benefits from leading indicators include:• Because T4 KPIs assess ongoing input measures and T3 KPIs monitor
weaknesses of barriers, they provide more opportunities to take proactive decisions to improve asset process safety performance, which may be difficult to identify based on lower frequency T1 and T2 events alone.
• The clear ‘line of sight’ by using barrier-based KPIs to shed light on management of hazards, prevention of PSEs and mitigation of potential major incidents can lead to focused conversations on barrier or management system weaknesses. This is especially insightful when combined with other evidence from audits and investigations of serious incidents or High Potential events (including those of other companies).
• Corporate or asset level dashboards or scorecards can provide high level indications of performance (e.g. traffic lights, with criteria) with drill down to assets for supporting analysis. In this way, corresponding T3 and T4 data can be presented without the need for aggregation of detailed data. See Report 456 [1] for further discussion of data collection, communication and review (including dashboards).
• The selection and application of T3 and T4 KPIs provide further engagement opportunity to ‘learn widely’. There is always value in bringing together leadership teams to share and transfer KPI good practices between similar assets, especially where dual assurance has demonstrated barrier performance improvement.
• There can be significant benefits of reporting and reviewing T3 and T4 KPI effectiveness at the corporate level, especially related to corporate safety initiatives and when addressing important process safety gaps.
Leading KPIs also provide useful catalysts for intra-company sharing of experiences, successes and technical practices on barrier assessment and improvement. These opportunities are facilitated by adopting standard barrier terminology and the KPI processes described in this report.
18Process Safety – Leading key performance indicators

4. Selection and review
4.1 Selection of key barriers for KPIsReport 456 recommends that key barriers are identified to inform the selection of T3 and T4 KPIs.
For leading indicators, three inputs to this review were recommended:• Proactive input based on hazard analyses to confirm the standardized list
of hardware and human barriers for control of the most important process safety risks and confirm the supporting Management System Elements to maintain and improve those barriers
• Reactive input based upon learning from causes of incidents, T1 and T2 PSE, other high potential events, safety system challenges and audits mapped against the hardware and human barriers, and Management System Elements, to identify weaknesses (‘holes’) in barriers
• External learning input takes account of experience and best practice shared in the oil and gas or other industries, often as a result of investigating past major incidents.
The standardized approach for defining and categorizing barriers in this report (3.1) facilitates the review of barriers and identification of which barriers are key for KPI assessment. Assets can maintain a register or database of the facility specific prevention and mitigation barriers, typically listing:
• barrier titles (ideally from a standard company-wide list)• a short description of the barrier • constituent hardware, human factors or processes (including supporting
Management System Elements)• a short description of the desired safety outcome (what success looks like)• the relation to risks in the asset’s risk register• the hazards addressed• causes/threats managed • review status/dates• relevance to past events/incidents.
Key barriers should include those with known weaknesses and those that address major incident risks (low probability, high consequence events). T3 and T4 KPIs are then identified to assess the effectiveness of the key barriers at the facility or asset level. The T3 and T4 data and analysis then forms further input to subsequent annual reviews of barrier performance, in combination with the proactive, reactive and external inputs noted above.
19Process Safety – Leading key performance indicators

4.2 Selection of indicatorsFor dual assurance, the effectiveness of key barriers should be characterized by at least one T3 KPI and at least one T4 KPI.
It is not necessary to monitor every constituent part of a key barrier to assess effectiveness. A single, well-selected, KPI will often provide ‘the indication’ of performance change that signals the need for further investigation (analogous to a doctor measuring blood pressure before undertaking further tests).
The following factors can be considered for each key barrier:• Which activities or operations must be undertaken correctly on each and
every occasion?• What aspects of the barrier’s hardware, human factors or processes are
liable to deterioration over time?• Which activities are undertaken less frequently?
From these factors, identify an aspect of the barrier functionality that is essential to delivering the barrier’s desired outcome. There may be an acceptable tolerance of deviations which may be applicable when setting the KPIs.
The KPIs should then directly measure:• Tier 3 – The number of recorded occasions (or other quantifiable measure)
that indicates the barrier has not delivered its planned outcome• Tier 4 – The amount of input activity (e.g. effort, investment) related to an
essential aspect of maintaining or improving the barrier’s intended performance.
T3 KPIs are often specific to one key barrier in one facility of an asset (number of times a particular type of flow meter fails), but a T4 KPI may often be applicable to more than one barrier and can be measured with the same definitions across several facilities (e.g. inspection and testing, or training).
KPIs need to have clear definitions and boundaries of applicability, and should be reproducible and accurate in terms of measurement and systematically recorded. Often data already exists and all that is needed is to collate and categorize the relevant data for analysis. Ideally, data for T3 and T4 KPIs related to one key barrier should be normalized using the same factor, which could be time, throughput or production, or hours worked.
Initially, before setting a T4 KPI, it might be necessary to further investigate a barrier’s integrity through advance use of only T3 KPIs to achieve a more complete picture of the barrier’s weakness or failure modes. This is because data from Tier 1 and 2 PSEs, or from other review inputs, may relate to relatively infrequent conditions or circumstances. Therefore, statistically, more T3 monitoring data may be required to understand the causal factors of lower severity, higher frequency events that assess the effectiveness of the barrier to address particular threats/causes.
20Process Safety – Leading key performance indicators
Example – Establishing process safety KPIs
Based on API 754 [4], a member company commenced collection of T1 and T2 PSE data in 2010, with 15 events recorded in the first two years. Two were Tier 1 events resulting in gas releases due to failure of small bore connectors. Investigation revealed that the immediate cause related to vibration and consequently a risk mitigation programme was undertaken for all small bore connectors across all gas processing facilities. T1 and T2 learnings were already providing focus on barrier and management system improvement. It was recognized that T3 and T4 development would further extend the value of process safety KPIs to gain more leading and proactive learning and improvement.
Work then commenced to set indicators at the T3 and T4 levels based on the new IOGP report 456. Around 20 KPIs were selected and reviewed for implementation in 2012. Of these, more than half were straightforward because established data sources were already available. Others required new data that would need to be reviewed in greater detail to ensure reliable, consistent KPIs were reported.
The KPIs included T3 data on events below the threshold for T2, including other LOPC, fires and near miss. To extend the T3 KPIs, and in addition to existing records on high priority alarm events, advantage was taken of the well specified Safety Instrumented Systems (SIS) that automatically logged all system events. This allowed development of a new report Demands on Safety Systems (DOSS). The report also recorded Safe Operating Limit Excursions (although it was recognized that these had been relatively rare occurrences). The new DOSS report required regular review to ensure it was specifically tracking challenges to process safety barriers. Therefore the relevant departments met monthly to analyse the data on pressure relief device and other activations, and to separate spurious or irrelevant events recorded by the SIS (e.g. related to on/off switching of pumps or field testing of SIS as part of planned preventative maintenance tasks).
Other T3 and T4 KPIs focused on the management system processes and again these could be drawn from established data sources, although a few required collection of new data. These KPIs included closure on HAZOP, MOC and other risk assessment actions, as well as system defeats (accounting for approvals), critical preventative maintenance tasks not undertaken, and console operator alarms above threshold.
T3 and T4 data collected over several years has helped improve management system performance which has resulted in a reduction of T1 and T2 events. T1 and T2 events do still occur and the company continues to try to identify those T3 and T4 KPIs which have the potential to be more predictive of a serious incident.
21Process Safety – Leading key performance indicators

4.3 Review of KPIsThe primary role of leading process safety KPIs is to maintain and improve performance of barriers and supporting management system processes at the operating level. This only occurs when KPIs are actively monitored and analysed to interpret differences, correlations, trends and other signals. Analysis of the data is then input to asset level decisions aimed at improving process safety barriers.
The data should be reviewed by management, often based on weighted dashboards to give a higher level indication of change that can prompt deeper performance conversations and escalate decision-making, when required.
Leading KPIs at the facility (or company) level need to continually evolve and improve. While some KPIs may be short term (objective/initiative based), others may be long term (based on monitoring trends, maintaining barriers). It is therefore good practice to set aside time annually for the users of the KPIs to take stock and understand whether the facility’s current set of KPIs are delivering the intended outcomes. It will often make sense to combine the KPI review with the review of key barriers (see 4.1) and significant PSEs.
There is little value from collecting T3 and T4 KPI data without regular review and decision making. Actions need to be taken, e.g. through interventions or resources, to improve KPIs that are trending in the wrong direction or which reveal intolerable performance. If the KPI does not respond to the actions, then it becomes clear that that alternative action needs to be defined and implemented.
For example, a dashboard showing a large T4 gap (e.g. a KPI value of 70% versus a target of 100% for maintenance inspections) versus a smaller T3 gap (e.g. 10% versus 0% target on a corresponding component defects KPI) is a positive scenario as it provides opportunity through better maintenance to close the gap on defects. In contrast, if there is a large T3 gap (e.g. KPI shows an unacceptable level of defects) with a corresponding small or zero T4 gap (e.g. 95–100 % consistently achieved on the maintenance KPI) then a more challenging T4 measure is probably required to drive better performance (on maintenance or another system element) and reduce defects.
Overall, the review should consider if the resources directed at implementing and maintaining T3 and T4 KPIs are appropriate in terms of the process safety assurance and improvements achieved. It is not realistic to have perfect ‘hole-free’ barriers, and therefore the review needs to be risk based with the aim of reducing the number and size of T3 barrier weaknesses to a tolerable level. This also allows T4 KPIs to help assess whether resources to maintain or strengthen a particular barrier are sufficient or excessive.
22Process Safety – Leading key performance indicators

Questions to ask during the annual review of KPIs
Incorporation of ‘barrier thinking’• What actions have been taken over the past year to improve barriers as
a result of KPI findings? • Have any additional key barriers emerged that require monitoring using
T3 and T4 KPIs?• Should any current KPIs become more detailed or focused in order to
achieve improvement in one particular aspect of a key barrier? • Do the current KPIs adequately address the root causes of barrier
failure that resulted in any T1 or T2 incidents, or other related high potential events that occurred during the past year? If not, what actions are in place to identify appropriate KPIs?
Effectiveness for performance management• What questions and comments have been raised to understand
performance based on T3 and T4 KPIs?• Is there correlation between improvements in T4 KPIs and a
corresponding reduction in T3 KPIs for specific barriers? If not, should any KPIs be modified?
• Should any KPIs be retired because a T4 improvement objective (e.g. inspections in date) has been achieved as planned, with a corresponding reduction in related T3 events?
• Is the number of KPIs appropriate to provide sufficient indication that barriers are being sustained and improved? Equally, is the number of KPIs excessive to the extent that no additional insight results, or data overload obscures understanding, or the reporting burden dilutes operating effort to strengthen barriers?
Improvement of KPIs• For new KPIs, is the data now sufficiently mature and stable for reliable
trending and analysis? If not, is any action required?• Are there any challenges in definitions, data collection methods or
resources that are impacting the effectiveness of the KPIs?• Are there any good practices shared by other assets, or from external
sources, that should be considered?
23Process Safety – Leading key performance indicators

4.4 Learning from Tier 1 and 2 events T1 and T2 PSEs are important when assessing overall performance at the corporate level, including performance relative to peer companies through benchmarking. Individually, each event should be considered an opportunity in terms of learning. T1 and T2 PSEs in the oil and gas industry are often the result of multiple hardware and human barrier weaknesses which are normally identified by more rigorous investigation that confirms causes and root causes which can be categorized using standardized barriers (see 3.1).
Responding to the causes of T1 and T2 PSEs with an immediate improvement or repair may prevent immediate repeats but this reactive approach will not generally provide long-term assurance that the barriers are now fully effective. However, T1 and T2 PSE learning can provide more detail on specific barrier weaknesses and impairment that enables confirmation that existing T3 and T4 KPIs are focused on the most important barriers, and enables refinement of these leading indicators, especially to provide dual assurance. This provides a more proactive longer-term approach to avoid repeats by strengthening selected barriers by collecting advance evidence of precursor events at the T3 level (i.e. weak signals) and at the same time measuring inputs at the T4 level that aim to improve barrier effectiveness and embed these improvements within the management system.
There is also value in recognising those barriers that mitigated potential consequences of a T1 or T2 PSE, to ensure that these barriers remain effective in the future. For barriers that are not currently identified as sufficiently important for T3 and T4 KPIs, the causal information can be recorded as input to KPI annual reviews that may identify barriers that should be given higher priority for future assignment of leading KPIs.
24Process Safety – Leading key performance indicators

5. Example leading indicators
This section includes further guidance and examples to illustrate how the three concepts in section 3 can be used to develop T3 and T4 KPIs.
Section 3.1 suggested categories of standard barriers.• Some of the barriers, such as Process containment, are designed primarily for
event prevention, i.e. on the left hand side of the bow tie.• Other barriers, such as Response to emergencies, are implemented to provide
mitigation of an event, i.e. on the right hand side of the bow tie.• Some barriers are effective when applied on either side of the bow tie, such
as Detection systems.
While the guidance in Report 456 focuses primarily on prevention barriers, it is recognized that consequences can be reduced, if not avoided, by establishing and maintaining effective mitigation barriers.
In this section, examples are used to illustrate the application of dual assurance using T3 and T4 KPIs to assess the effectiveness of both prevention and mitigation barriers.
Many oil and gas companies have already established T3 and T4 KPIs (see Appendix A), in some cases for over five years although many regard them as relatively immature. This section is therefore ‘work-in-progress’ to share good practice based on recent company experience or significant past events in our industry.
Four generic groups of leading indicators are discussed with examples to illustrate how leading KPIs can be applied in practice.
• Groups A and B focus on low consequence events at or close to the centre of the bow tie. These KPIs recognize the learning that can be gained through analysis of more frequent events broadly classified either as Minor spills and releases (i.e. LOPC below T2), and Challenges to safety systems (i.e. threats to the final layers of protection).
• Groups C and D are focused on individual barriers. Group C outlines possible approaches to addressing Hardware barrier weakness and Group D covers Human barrier impairment. The examples include suggestions of T3 KPIs with corresponding T4 KPIs (i.e. dual assurance based on barrier thinking).
Many of the examples are set in the context of past incidents to demonstrate the logic of setting leading indicators to prevent recurrence of barrier failures by proactively identifying and eliminating their weaknesses. However, leading indicators are not intended to be limited to barriers that failed in past incidents. In order to prevent future events, it is important to proactively and continually seek evidence of other barrier weaknesses and deploy appropriate indicators to address these deficiencies before new incidents occur.
25Process Safety – Leading key performance indicators

Group A – Minor spills and releases This type of KPI is arguably more lagging than other T3 indicators but is important because it provides additional information on the Process Containment hardware barrier, and may also provide information on the Operating in accordance with procedures barrier.
Because T1 and T2 PSEs are likely to be infrequent at the asset level, there is value in collecting and analysing data on losses of containment that fall below the T1 and T2 thresholds, and categorizing these as T3 events. Good practice at the asset level is to use the company-wide data collection system to classify and quantify all containment losses, irrespective of the amount or type of substance released or activity involved.
The key is to have a workforce culture with that understands that any unintended spill or release needs to be ‘recorded’ and that this is recognized positively by management. Once recorded, events can then be classified to generate ‘reportable’ T3 KPI data. Further guidance is provided in the example on Spill and Release Data.
Example – Spill and Release Data (Tier 1, 2 and 3)
Today most companies have sophisticated computer systems to record, collate and analyse ‘event’ and ‘incident’ data in support of an operating management system (see OMS Element 9). The system may also be used to record data that it not event base, e.g. continuous emissions or discharges.
Such data systems can be set up with categories to enable classification of all spill and release data that has been recorded by the workforce, no matter how ‘minor’ the event, and irrespective of definitions such as primary containment or even process safety. After events are recorded by the workforce, a second step involves a supervisor/manager/administrator trained in use of the data system and KPIs reviewing the data to ensure its completeness and accuracy, as well ensuring the data is classified properly against the company’s KPI definitions. At a basic level, the system can be set-up to automatically enter data, allow for repeat entries or use drop down lists to ensure information can be recorded easily and quickly.
Basic information should include:• time, date, and organ details• substances involved and estimate of quantity and/or duration of release• type of energy release, if involved (electrical spark/arc, pressure or
temperature/fire)• exposure of any person to the substance
26Process Safety – Leading key performance indicators

• location – on-site, off-site, mobile or fixed plant, name of unit/facility• was substance released into secondary containment or released directly
into the environment (air, ground or water). If secondary containment, was it breached?
• brief description of the event.
Assets may consider this phase as ‘recording’ of spill and release data, rather than ‘reporting’ of KPIs. The reported KPIs in scorecards and to corporate level are then the result of classifying the data in the system. By making the event ‘reportable’, it means that certain thresholds and criteria have been met and more information may be required, including:
• Confirmation that the spill or release was from primary containment (i.e. LOPC)• Confirmation that the event was associated with a process as defined by
Report 456 (note that an asset may have a list of questions depending on the type of activity, e.g. drilling, pipelines)
• Did the quantity exceed company or regulatory threshold criteria for oil spills? Or T1 or T2 PSE thresholds?
• What were the actual and potential consequences of the event, including injuries, illness or damage (use standard risk matrix classification)
• What standard barriers failed or were impaired • What was the cause of the event (again, a standard list of causes helps)
The advantage of recording all losses of containment initially in the data system, and then classifying afterwards, is that different assets can then determine their reportable KPIs from the basic recorded data, and that this determination can evolve over time. For example, a T3 ‘Minor LOPC KPI’ could be easily established from a subset of the data based on thresholds that are a fraction (e.g. 10%, or 1%) of the T2 thresholds to increase the available data to test specific barriers.
An asset can decide that certain types of events are not recordable and provide guidance to the workforce on this, for example small fugitive emissions and odours or drips from oil cans – although good practice is to discuss the practice of recording data at the work team/supervisor level and agree what is important to record.
27Process Safety – Leading key performance indicators

Group B – Challenges to safety systems These KPIs can provide considerable insight into systematic weaknesses and improvement opportunities for hardware barriers, particularly Process Containment, and human barriers, particularly Response to process alarm and upset conditions (see 3.1).
For each of these barriers:
a) An unintended or undesirable condition (excessive temperature or pressure, change in fluid. gas composition, corrosion, overfill or other circumstances) causes the hazard (i.e. hydrocarbon liquid or gas) to create an effect that ‘challenges’ the barriers.
b) The challenge is detected (e.g. by sensors or other means) and acted upon through hardware controls such as relief systems or through human intervention.
c) Because the challenge was not intended, it provides evidence that the overall system of barriers is weak or is impaired.
d) The number of challenges and their characteristics are recorded so that the data can be classified for reporting as T3 KPIs.
e) The data has greatest value when the characteristics are analysed to confirm the initial and root causes of the challenges and determine how barriers have been compromised to allow such challenges to occur.
f) Depending on the maturity and type of the plant, the safety systems may be fully automated multi-layered barriers with no requirement for human action or intervention.
At the asset level, the safety systems generally provide data streams automatically and the key is to select and extract the most appropriate data for the KPI and to confirm the causes and modes of barrier failure. Most often the barriers in combination are effective and LOPC does not occur, but T3 events demonstrate that at least one barrier was ineffective.
Examples of these Challenges to safety systems T3 KPIs include:
a) safe operating limit (SOL) excursions
b) demands on Safety Systems (DOS), which can be defined with greater specificity to monitor:
• activation of Mechanical Shutdown System• activation of Pressure Relief Device (PRD)• well control upsets/kicks• Activation of a Safety Instrumented System (SIS)
28Process Safety – Leading key performance indicators

c) safety systems that failed on demand, which could separately monitor:• prevention systems, such as pressure relief and isolation• mitigation systems, such as alarm, ignition control and suppression
d) Average (and/or Maximum) Alarm Rate, which could include the human response by adding:
• average number of alarms per control panel operator • number of console operator shifts exceeding an alarms/hour
threshold.
The identification of appropriate T4 KPIs should be based on the causes and modes of barrier weakness. The T4 KPIs related to the examples above will often be based on confirmation of the effective implementation of processes that support management system/OMS elements, such as maintenance or competence/training.
Examples from Appendix A include:• timely completion of inspections of items of plant and equipment designed to
prevent LOPC • leak detection and repair programme completed on time with reduction in
leak rates• fatigue risk education/awareness• training for process safety critical positions• competency assessment.
The Alarm Floods example is based on two major accidents and highlights the importance of setting KPIs that strengthen the prevention barriers on Process Containment and Response to process alarm and upset conditions.
Human Barrier – Response to process alarm and upset conditions (prevention)
Example – Alarm Floods
Response to process alarm and upset conditions is an important human barrier, and can be effective for both prevention and mitigation of events. The reaction to alarms is important when the potential event is a hydrocarbon release, where detection systems, ignition controls and efficient shutdown mechanisms can greatly eliminate or reduce the potential consequences of a major LOPC. Past failures have shown that a rapid response to cut off the supply of hydrocarbon to the release point, even if ignition has occurred, could have substantially reduced the impact of an LOPC event. Equally when the release is an oil spill, a controlled and effective shutdown could greatly reduce the impact on the surrounding environment.
29Process Safety – Leading key performance indicators

The partial nuclear meltdown in one of two Three Mile Island reactors in 1979 was the worst accident in US commercial nuclear power plant history. A particular causal factor in this example was alarm management, which can be critical for control room operators in complex facilities overloaded with information, including alarms. In the Three Mile Island case, operators initially ignored both alarms and temperature and pressure readouts that indicated a loss of coolant.
The catastrophic fire at the Longford Gas Plant in 1998 provides a further example of alarm floods, where operators were expected to deal with 300–500 alarms per day, and on one investigated incident, 8500 alarms during a 12 hour shift were recorded.
KPIs can be deployed to proactively address alarm flood or other identified weaknesses in the Response to process alarm and upset conditions barrier. Example KPIs in use in the industry include one company which is monitoring the number of operator shifts where the maximum alarm rate is exceeded, which is a T3 KPI. At the T4 level, another company has tracked to completion an alarm prioritization and review programme. T3 and T4 indicators may also be set to assess the sufficiency and quality of competence assurance of shift teams and/or individuals whose roles support the barrier’s effectiveness.
Group C – Addressing weaknesses in other hardware barriersFailed hardware barriers, such as Structural Integrity or Process Containment caused by e.g. corrosion or valve/seal failures, are frequently found to be weakened through physical deficiencies. Data to assess a particular cause and its barriers often already exists through management system processes such as:
a) maintenance
b) inspections and tests
c) safety observations
d) PHAs or HAZOPs
e) audits
f) PSE or incident investigations.
The aim here is to identify relevant barrier-specific evidence through these scheduled processes. Within Appendix A, example T3 KPIs include ‘Number of non-conformances on safety critical equipment identified through inspection/maintenance’. T3 are often focused on a key barrier (e.g. Ignition control) which has been identified as weak through PSE investigations or PS audits.
Corresponding T4 KPIs (for dual assurance) may initially focus on ensuring that the processes that identify and eliminate deficiencies are effectively implemented (sufficiently resourced, on schedule, with actions tracked to closure).
30Process Safety – Leading key performance indicators

Three examples based on past event are provided here to illustrate the importance of setting KPIs on hardware barriers:
• Maintenance of critical equipment is based on a major UK accident that highlights the value of setting KPIs that strengthen the management system processes that support the Process Containment barrier.
• Certification of electrical equipment and ignition source isolation are important protection measures in the event of leak detection within classified areas.
• Functionality of deluge systems needs to be ensured by regular maintenance and testing as part of an asset’s Protection Systems to mitigate the potential consequences of LOPC.
Hardware barrier – Process containment (prevention)
Example – Critical equipment maintenance
Within the IOGP/IPIECA OMS [7], Expectation E6.5 within Element 6, Asset design and integrity seeks to ensure that
“There are processes to maintain, replace, test, inspect, calibrate, certify and verify performance of assets, facilities and equipment. These activities are performed at frequencies appropriate to the level of risk, and deviations from specified criteria are managed.”
This management system expectation directly supports the Process containment standard barrier in 3.1.
An example of this barrier failing due to weak implementation of OMS Expectation E6.5 is illustrated by one of the immediate causes of the Buncefield explosion in 2005. An automatic tank gauge stuck causing the gauge to ‘flatline’. This was a known problem, with 14 previous instances, that were rectified temporarily by operators or through contract engineers without identifying the underlying cause of the malfunctioning gauge. The failure to log the fault and the lack of an effective maintenance regime were management system weaknesses that allowed the threat of overfilling to breach the process containment barrier.
Tier 3 indicators could be used by an asset to ensure that deficiencies of critical equipment such as gauges are logged as PSEs when observed. Tier 4 indicators would track inspections, testing and maintenance to ensure that these processes were completed, including action closure, with appropriate verification. If significant levels of deficiencies continue to be tracked at Tier 3, review should raise the question regarding the frequency and quality of the inspections, testing and maintenance processes.
31Process Safety – Leading key performance indicators
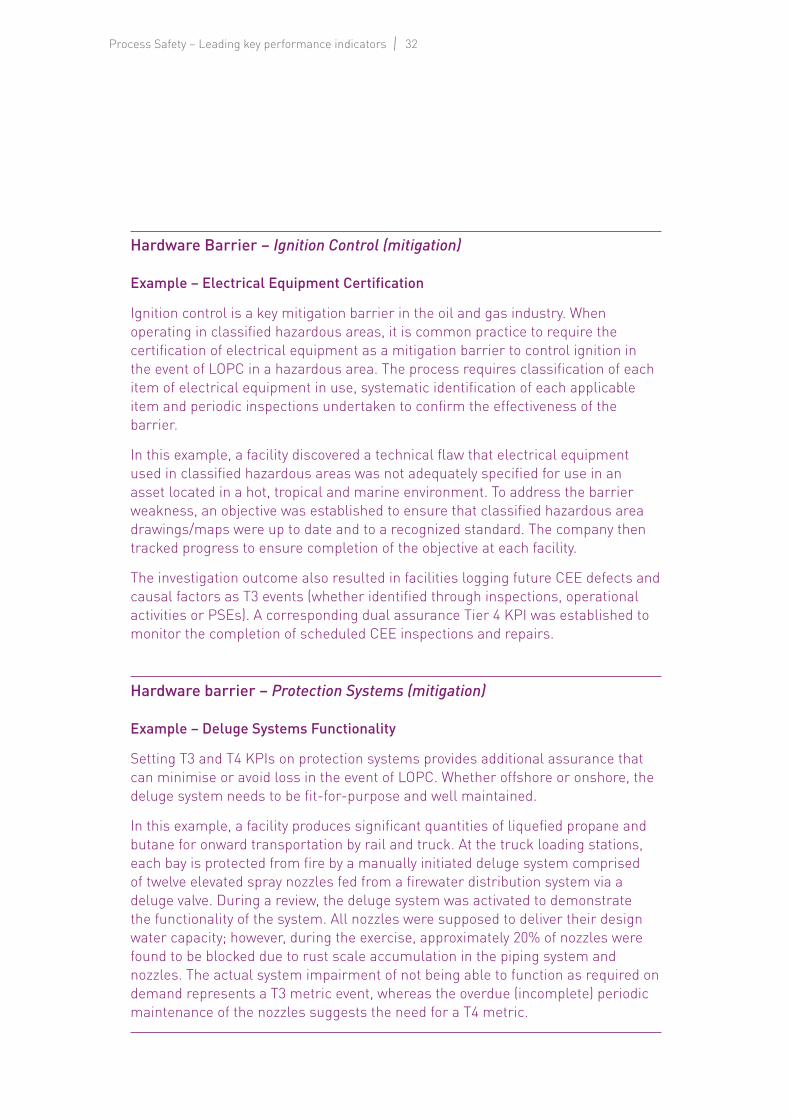
Hardware Barrier – Ignition Control (mitigation)
Example – Electrical Equipment Certification
Ignition control is a key mitigation barrier in the oil and gas industry. When operating in classified hazardous areas, it is common practice to require the certification of electrical equipment as a mitigation barrier to control ignition in the event of LOPC in a hazardous area. The process requires classification of each item of electrical equipment in use, systematic identification of each applicable item and periodic inspections undertaken to confirm the effectiveness of the barrier.
In this example, a facility discovered a technical flaw that electrical equipment used in classified hazardous areas was not adequately specified for use in an asset located in a hot, tropical and marine environment. To address the barrier weakness, an objective was established to ensure that classified hazardous area drawings/maps were up to date and to a recognized standard. The company then tracked progress to ensure completion of the objective at each facility.
The investigation outcome also resulted in facilities logging future CEE defects and causal factors as T3 events (whether identified through inspections, operational activities or PSEs). A corresponding dual assurance Tier 4 KPI was established to monitor the completion of scheduled CEE inspections and repairs.
Hardware barrier – Protection Systems (mitigation)
Example – Deluge Systems Functionality
Setting T3 and T4 KPIs on protection systems provides additional assurance that can minimise or avoid loss in the event of LOPC. Whether offshore or onshore, the deluge system needs to be fit-for-purpose and well maintained.
In this example, a facility produces significant quantities of liquefied propane and butane for onward transportation by rail and truck. At the truck loading stations, each bay is protected from fire by a manually initiated deluge system comprised of twelve elevated spray nozzles fed from a firewater distribution system via a deluge valve. During a review, the deluge system was activated to demonstrate the functionality of the system. All nozzles were supposed to deliver their design water capacity; however, during the exercise, approximately 20% of nozzles were found to be blocked due to rust scale accumulation in the piping system and nozzles. The actual system impairment of not being able to function as required on demand represents a T3 metric event, whereas the overdue (incomplete) periodic maintenance of the nozzles suggests the need for a T4 metric.
32Process Safety – Leading key performance indicators

Group D – Improving effectiveness of other human barriers Failure of human barriers can result from inadequacy of processes and procedures but more commonly through lack of effective implementation during preparation or execution. Therefore, human barriers typically rely on competence assurance in combination with other supporting management system processes.
Generally, deficiencies result from factors such as insufficient resources (including personnel and time), training, operating discipline and verification. The human barriers PTW, Isolation of equipment, Overrides and inhibits of safety systems, Shift handover, etc. and Acceptance of handover or restart of facilities or equipment are also often impacted by non-routine variations from standard work management practices.
Dual assurance T3 and T4 KPIs that focus on potentially impaired human barriers can provide proactive vigilance of the associated risk and improve barrier effectiveness.
Example T3 KPIs include:
a) non-conformances within operating procedures, PTW or related processes
b) temporary modifications continuing longer than planned
c) changes implemented without MOC or PSSR
d) fatigue related events.
At the T4 level, KPIs will vary depending on the affected barriers, but could include:
a) completion of specific training or competency testing
b) completion of audits or other checking processes of PTW or MOCs
c) completion of toolbox talks/task risk assessments
d) monitoring over-time and extended shifts
e) ensuring adequate manpower is in place for all shifts.
The industry example here is drawn from Piper Alpha and highlights the risk of failing to learn lessons from previous incidents. The communication of leading indicator results on key human barriers can heighten awareness within the workforce of a facility’s recognition of weaknesses and the need to improve systems, such as PTW and handover.
33Process Safety – Leading key performance indicators

Human barriers – PTW, Isolation of equipment, Overrides and inhibits of safety systems, Shift handover, etc. (prevention) and Acceptance of handover or restart of facilities or equipment (prevention)
Example – Failure to learn
A primary cause of the LOPC that resulted in the loss of Piper Alpha in 1988 was the failure of the permit-to-work (PTW) system and a lack of communication during a shift change resulting in lack of awareness that staff should not use a pump that was out of service with its PSV removed. The permit-to-work system had failed just one year before, when a worker was killed in an accident that was the result of a breakdown of communications in the PTW system and an error in the shift handovers.
Evidence of significant weaknesses in key barriers should provide impetus for sustainable learning and improvement actions. One of the processes that could help maintain management and staff focus on PTW and handover improvement is to set and communicate targeted T4 KPIs to confirm progress on the specific improvement actions and corresponding measures that aim to identify and manage remaining weaknesses.
For example, completion of audits of a planned proportion of permits and shift handovers can be monitored as a T4 indicator, as well as tracking completion of PTW and handover refresher training. Corresponding T3 KPIs could be recording of non-conformances of the PTW system and handover procedure identified through audits or PSEs, and number of staff failing on test of PTW and handover understanding within one month of refresher training. When a barrier is known to be weak, the T3 KPIs should be revealing a significant number of non-conformances and there should be T4 gaps, otherwise the indicators are not sufficiently effective and need to be improved to be more demanding and insightful.
34Process Safety – Leading key performance indicators
Appendix A: Survey of industry practice of KPI implementation
This appendix summarizes the results of a survey of member practice and experience undertaken during January to April 2014. The results are presented without attribution to the participants.
Adapted from a survey by CCPS, companies were asked to confirm their use of T3 and T4 based on a list of 26 KPIs within 7 types of indicators (where the indicator could be the same or similar to the list indicator.
Of the 26 indicators, 12 would typically be categorized as Tier 3 (identifying barrier weakness or impairment), with the remainder set at the Tier 4 level.
Companies could also indicate whether the indicators were in current use and whether planned use was only at the facility/asset level, versus business/corporate level. Opinion on whether the indicator could be benchmarked between companies was also sought. Companies could also indicate whether they had defined other KPIs in each type or had introduced KPIs that were different from these types.
20 companies participated in the survey, providing a good response in terms of diversity, with representation from North America, Europe, Middle East and Australasia, including integrated multinationals, national oil companies and medium sized upstream companies.
Challenges to safety systems/process safety near miss (9 KPIs + other)The majority of companies have implemented, or plan to implement, this type of indicator, which fall into the Tier 3 level. Almost all companies have one or more of these 9 KPIs in use at some of their facilities/assets. While over half use, or plan to use, these KPIs across a business, use at the corporate level is less (only 25–40%). Based on the comments provided, many companies are still putting these KPIs in place.
All 9 KPIs are popular in terms of applicability:• safe operating limit excursions• primary containment inspection/testing (results outside acceptable limits); • demands on safety system• safety systems that failed on demand• SIS activations• activation of mechanical shutdown system• activation of PRD• well control incidents• other LOPC (below T1 and T2 level).
35Process Safety – Leading key performance indicators
More than 705 of companies having implemented these indicators at asset level, but only 50–60% at business level, and less than 40% at corporate level.
Most companies consistently consider these 9 KPIs to be Tier 3. Around half of the companies consider 5 of the 9 KPIs to have potential value as industry benchmarks. Three of the KPIs – other LOPC (below T1 and T2 level), safe operating limit (SOL) excursions, and demands on safety system failures – were viewed as having industry benchmark value by over 50% of the responders.
Maintenance of mechanical integrity (3 KPIs + other)Both completion of inspections and non-conformance of critical equipment (identified in inspections) were popular with more than 60% of companies using or planning to use the KPIs. Implementation of these 2 KPIs is generally limited to facility and asset level, with corporate use only for 25% of the responders.
Action items follow-up (3 KPIs + other)All three overdue action item KPIs, related to safety related studies, compliance issues and incident investigations were popular for application at facility/asset level or across parts of the company, with a slight bias to incident investigation actions being tracked at the business level.
Management of Change (MOC) (2 KPIs + other)While not widely applied across part of the company or at business/corporate level, KPIs that audit whether the facility or asset MOC procedure is correctly followed is popular with around half of the respondents. Some companies have also developed other KPIs to monitor the extent of MOC closure.
Process Safety workforce training, competency and capability (3 KPIs + other)Both training of safety critical positions and competency assessment were popular at the asset/facility level (over 60% of companies responding positively) although the responses supported the view that there a minority of companies are pursuing competence assessment at corporate level. This area is maturing, with more companies intending to implement KPIs in the future.
Fatigue risk management (3 KPIs + other)KPIs in this area are not used by many companies (less than 20%) with no strong indication of implementation in the future.
36Process Safety – Leading key performance indicators
Operating and maintenance procedures (2 KPIs +other)While about 40% of companies have KPIs targeted at monitoring the quality of procedures at the local level for a few of some assets or facilities, these are generally not implemented as KPIs more widely across parts of the company, or corporate/business level.
Company experienceCompanies were asked to share experience on T3 and T4 KPI implementation based on 11 questions.
DevelopmentMost companies appear to have started more formal processes of KPI development fairly recently, within the past 2–5 years. Some have focused on learning from process safety incidents or highest risks to guide implementation, while others used API 754 and IOGP Reports 415 and 456 as starting points. Others implement specific T3 and T4 KPIs at a facility/asset only. Most have a process or intent to regularly review their KPIs, and some mentioned review of outcomes with senior management.
AlignmentA number of companies align with Report 456, others commonly mentioned practices such as management system alignment with some examples of categorization against standard barriers or process safety categories.
Learning and benefits (responses combined from two questions)While companies generally admit it is early days, and may are still focused in Tier 1 and 2, some have seen direct benefits in terms of risk and excursion awareness and learning from incidents, while others recognise potential for technical improvement in areas such as maintenance, mechanical integrity, PHAs, engineering standards, audits and emergency drills.
A few companies provided examples of definite improvement in areas such as alarm management, process isolations, and technical authority competence.
37Process Safety – Leading key performance indicators

Organization levelThere is quite a lot of variation in whether T3 and T4 KPIs are only used at facility/asset level, or are rolled up further, or are defined to allow aggregation (sometimes only for a limited number of indicators). The approach is also probably affected by the size, scale and location of assets as some responders are multinationals whereas other have few or even single facilities with limited spread.
CoverageAlthough a few companies have corporate company-wide KPIs (not always mandatory but provided as a choice to ensure consistency), most companies reported that T3 and T4 coverage varies due to either risk (i.e. great focus on higher risk facilities), or to meet regulatory requirements.
Maturity and burden (responses combined from two questions)A number of companies started reporting T3 and T4 KPIs in 2008, around the time of the CCPS/API work in the US, while others started reporting around 2012, following the introduction of Report 456. Some companies have had some T4 KPIs in place for around 10 years as leading metrics. The relative immaturity has resulted in quite a high burden of manual data entry, though most companies are in the process of introducing electronic data system.
BenchmarkingSome companies see a lot of value in benchmarking certain KPIs (with many submitting T1 and T2 data to IOGP only) but there are clear concerns from many regarding the value of this at T3 and T4 level.
QualityThere is apparently a general, recent, trend of improving quality of data through training, checks and assurance processes.
MitigationSome companies track KPIs around mitigation processes (right hand side of the bow tie) but generally these are for local monitoring at the facility/asset level such as gas/fire detection systems. Some stated that this is not tracked at corporate level.
38Process Safety – Leading key performance indicators

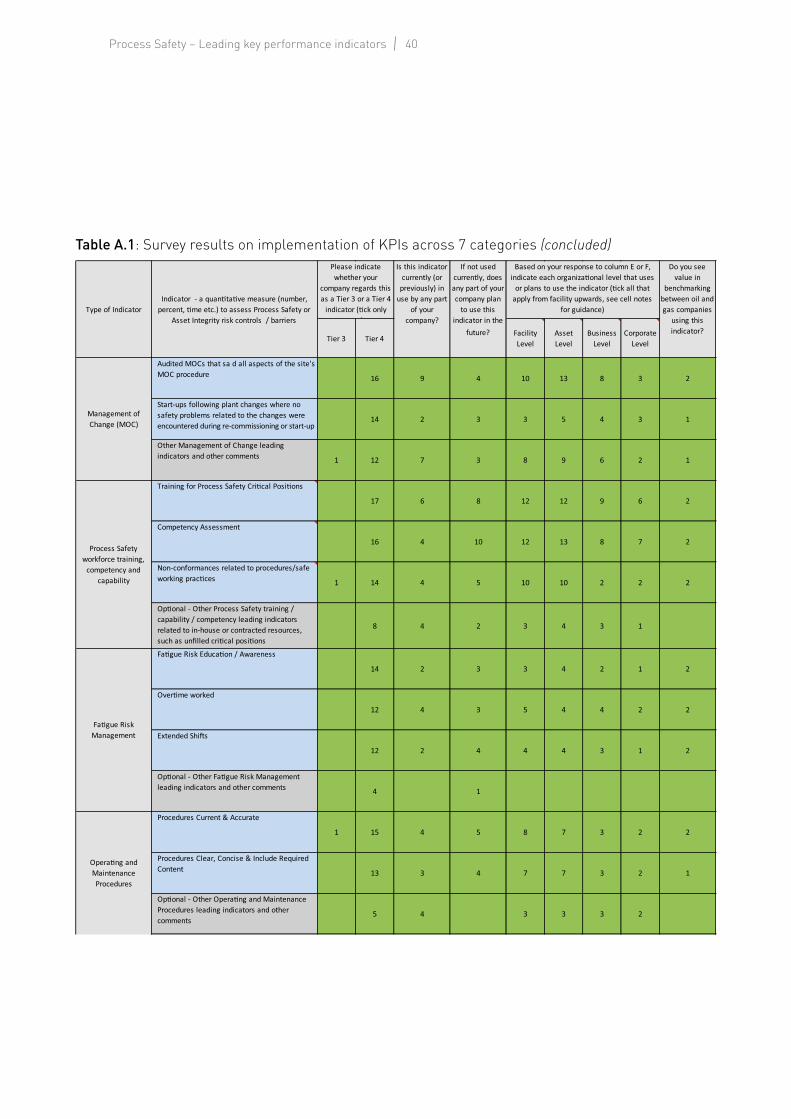
Table A.1: Survey results on implementation of KPIs across 7 categories
39Process Safety – Leading key performance indicators
Tier 3 Tier 4Facility Level
Asset Level
Business Level
Corporate Level
Audited MOCs that sa d all aspects of the site's MOC procedure 16 9 4 10 13 8 3 2
Start-ups following plant changes where no safety problems related to the changes were encountered during re-commissioning or start-up
14 2 3 3 5 4 3 1
Other Management of Change leading indicators and other comments 1 12 7 3 8 9 6 2 1
Training for Process Safety Cri�cal Posi�ons
17 6 8 12 12 9 6 2
Competency Assessment
16 4 10 12 13 8 7 2
Non-conformances related to procedures/safe working prac�ces 1 14 4 5 10 10 2 2 2
Op�onal - Other Process Safety training / capability / competency leading indicators related to in-house or contracted resources, such as unfilled cri�cal posi�ons
8 4 2 3 4 3 1
Fa�gue Risk Educa�on / Awareness
14 2 3 3 4 2 1 2
Over�me worked
12 4 3 5 4 4 2 2
Extended Shi�s
12 2 4 4 4 3 1 2
Op�onal - Other Fa�gue Risk Management leading indicators and other comments 4 1
Procedures Current & Accurate
1 15 4 5 8 7 3 2 2
Procedures Clear, Concise & Include Required Content 13 3 4 7 7 3 2 1
Op�onal - Other Opera�ng and Maintenance Procedures leading indicators and other comments
5 4 3 3 3 2
Fa�gue Risk Management
Opera�ng and Maintenance Procedures
Type of Indicator Indicator - a quan�ta�ve measure (number,
percent, �me etc.) to assess Process Safety or Asset Integrity risk controls / barriers
Please indicate whether your
company regards this as a Tier 3 or a Tier 4
indicator (�ck only )
Is this indicator currently (or
previously) in use by any part
of your company?
If not used currently, does any part of your company plan
to use this indicator in the
future?
Management of Change (MOC)
Process Safety workforce training,
competency and capability
Based on your response to column E or F, indicate each organiza�onal level that uses
or plans to use the indicator (�ck all that apply from facility upwards, see cell notes
for guidance)
Do you see value in
benchmarking between oil and gas companies
using this indicator?
Table A.1: Survey results on implementation of KPIs across 7 categories (concluded)
40Process Safety – Leading key performance indicators

References
[1] IOGP. Report 456. Process Safety – Recommended Practice on Key Performance Indicators. London: November 2011. Available from IOGP at: http://www.iogp.org/pubs/456.pdf
[2] IOGP. Report 415. Asset integrity – the Key to Managing Major Incident Risks. London: December 2008. Available from IOGP at: http://www.iogp.org/pubs/415.pdf
[3] CENTER FOR CHEMICAL PROCESS SAFETY (CCPS). Process Safety Leading and Lagging Metrics, American Institute of Chemical Engineers. 2008. Available from CCPS at http://www.aiche.org/ccps/publications/psmetrics.aspx
[4] AMERICAN PETROLEUM INSTITUTE (API). ANSI/API RP 754: Process Safety Performance Indicators for the Refining and Petrochemical Industries. First Edition, April 2010. Available from API at http://publications.api.org
[5] IOGP. Report 2012p. Process Safety Events – 2011 & 2012 Data. London: 2013. Also Report 2013p. Safety performance indicators – Process safety events – 2013 Data. London: 2015.
[6] IOGP. Report 544, Standardization of barrier definitions. Supplement to Report 415. London: April 2016.
[7] IOGP. Report 510. Operating Management System Framework for controlling risk and delivering high performance in the oil and gas industry. London: June 2014. http://www.iogp.org/Reports/Type/510/id/734
[8] UNITED KINGDOM. HEALTH AND SAFETY EXECUTIVE (HSE). Developing process safety indicators. A step-by-step guide for chemical and major hazard industries. Health and Safety Guide HSG254. 2006. Available from UK HSE at http://www.hse.gov.uk/pubns/books/hsg254.htm
41Process Safety – Leading key performance indicators

This is a supplement to the 2011 publication of Report 456, Process Safety – Recommended Practice on Key Performance Indicators. It builds on the experience of IOGP member companies, and others, to provide further guidance for companies on how to establish process safety key performance indicators (KPIs) that are leading.
The overall aim is to enable companies to establish effective leading indicators that proactively assess the health of barriers that manage the risk of process safety events (PSEs), particularly those that could result in a major incident.
www.iogp.orgRegistered OfficeCity Tower40 Basinghall Street 14th FloorLondon EC2V 5DE United Kingdom
T +44 (0)20 3763 9700F +44 (0)20 3763 [email protected]
Brussels OfficeBd du Souverain,1654th FloorB-1160 BrusselsBelgium
T +32 (0)2 566 9150 F +32 (0)2 566 [email protected]
Houston Office10777 Westheimer Road Suite 1100 Houston, Texas 77042 United States
T +1 (713) 470 [email protected]