April 2018 MAPSS - October 2017 MAPSS - Wisconsin...
40
Wisconsin Department of Transportation April 2018 MA P S S Performance Improvement Report Mobility Accountability Preservation Safety Service Mission Provide leadership in the development and operation of a safe and efficient transportation system
Transcript of April 2018 MAPSS - October 2017 MAPSS - Wisconsin...
Wisconsin Department of Transportation
April 2018
MAPSS Performance Improvement Report
MobilityAccountabilityPreservationSafetyService
Mission Provide leadership in the development
and operation of a safe and efficient
transportation system
Welcome to the
MAPSS Performance Improvement ReportThe Wisconsin Department of Transportation’s (WisDOT) Performance Improvement program focuses on the core goal areas of Mobility, Accountability, Preservation, Safety and Service (MAPSS). The Scorecard measures in this report have been deemed of highest importance to our customers to show the current state of Wisconsin’s transportation system. The progress of these measures is reported on the two-page Scorecard and in the body of this report. The department also has interactive webpages within each core goal area for customers who are interested in “drilling down” into the data.
Three Scorecard measures were scheduled to be reported this quarter but have been postponed. Updates to Delay and Reliability have been postponed while new metrics are being developed to align with the newly published requirements by USDOT. Program Effectiveness has been delayed to allow time for the business area to incorporate new methodologies into its analysis. These methodologies will implement new asset management principles emphasizing cost effective techniques that preserve system health.
Some measures are important in demonstrating transparency and accountability, but do not rise to the level of the Scorecard. The progress of these measures is reported in the appendix of this report and on interactive webpages under Additional Measures.
In addition to the measures we report externally, we also track measures that are important for the smooth internal operations of the department or support other important performance outcomes; these are reported internally to department managers and staff. For example, we track several internal highway construction project measures that support our Scorecard measures and ensure we continue to deliver our programs and services efficiently to serve the needs of the public.
The maturation and progress within this program is a continual process. We are pleased to share that many of the critical Scorecard measures have seen significant improvements and we continue to steadily approach our performance goals.
The latest MAPSS Quarterly Report and the interactive WisDOT webpages provide details of each performance metric. This information is located at: www.mapss.wi.gov
Table of ContentsMAPSS Performance Scorecard 1–2
Mobility 3–6
Accountability 7–11
Preservation 12–19
Safety 20–23
Service 24–27
Appendix A: Additional Performance Measures 28–37
ii
April 2018
Wisconsin Department of TransportationMAPSS Performance Scorecard
Goal has been met Performance is trending in a favorable direction Trend is holding
Performance is trending in an unfavorable direction
Performance measure
How we measure it
Current report period Goal
Goal met Trend Comments
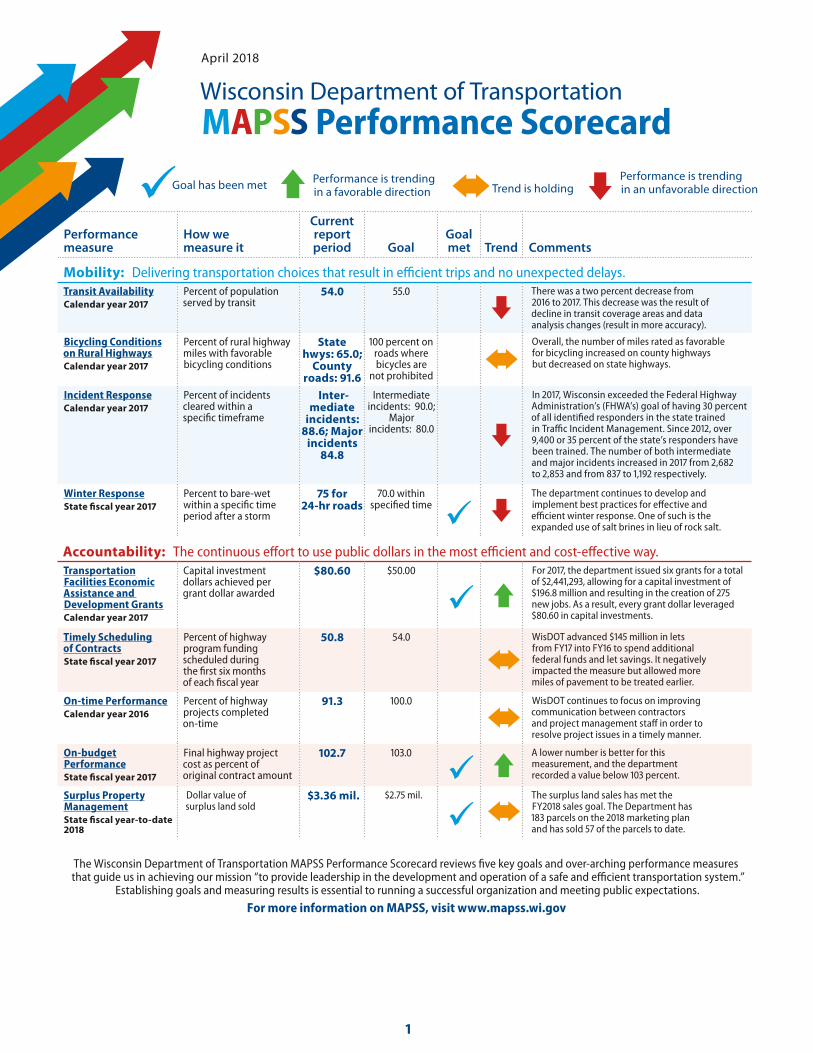
Mobility: Delivering transportation choices that result in efficient trips and no unexpected delays.Transit AvailabilityCalendar year 2017
Percent of population served by transit
54.0 55.0 There was a two percent decrease from 2016 to 2017. This decrease was the result of decline in transit coverage areas and data analysis changes (result in more accuracy).
Bicycling Conditions on Rural HighwaysCalendar year 2017
Percent of rural highway miles with favorable bicycling conditions
State hwys: 65.0;
County roads: 91.6
100 percent on roads where bicycles are
not prohibited
Overall, the number of miles rated as favorable for bicycling increased on county highways but decreased on state highways.
Incident ResponseCalendar year 2017
Percent of incidents cleared within a specific timeframe
Inter-mediate
incidents: 88.6; Major
incidents 84.8
Intermediate incidents: 90.0;
Major incidents: 80.0
In 2017, Wisconsin exceeded the Federal Highway Administration’s (FHWA’s) goal of having 30 percent of all identified responders in the state trained in Traffic Incident Management. Since 2012, over 9,400 or 35 percent of the state’s responders have been trained. The number of both intermediate and major incidents increased in 2017 from 2,682 to 2,853 and from 837 to 1,192 respectively.
Winter ResponseState fiscal year 2017
Percent to bare-wet within a specific time period after a storm
75 for 24-hr roads
70.0 within specified time
The department continues to develop and implement best practices for effective and efficient winter response. One of such is the expanded use of salt brines in lieu of rock salt.
Accountability: The continuous effort to use public dollars in the most efficient and cost-effective way. Transportation Facilities Economic Assistance and Development GrantsCalendar year 2017
Capital investment dollars achieved per grant dollar awarded
$80.60 $50.00 For 2017, the department issued six grants for a total of $2,441,293, allowing for a capital investment of $196.8 million and resulting in the creation of 275 new jobs. As a result, every grant dollar leveraged $80.60 in capital investments.
Timely Scheduling of ContractsState fiscal year 2017
Percent of highway program funding scheduled during the first six months of each fiscal year
50.8 54.0 WisDOT advanced $145 million in lets from FY17 into FY16 to spend additional federal funds and let savings. It negatively impacted the measure but allowed more miles of pavement to be treated earlier.
On-time PerformanceCalendar year 2016
Percent of highway projects completed on-time
91.3 100.0 WisDOT continues to focus on improving communication between contractors and project management staff in order to resolve project issues in a timely manner.
On-budget PerformanceState fiscal year 2017
Final highway project cost as percent of original contract amount
102.7 103.0 A lower number is better for this measurement, and the department recorded a value below 103 percent.
Surplus Property ManagementState fiscal year-to-date 2018
Dollar value of surplus land sold
$3.36 mil. $2.75 mil. The surplus land sales has met the FY2018 sales goal. The Department has 183 parcels on the 2018 marketing plan and has sold 57 of the parcels to date.
The Wisconsin Department of Transportation MAPSS Performance Scorecard reviews five key goals and over-arching performance measures that guide us in achieving our mission “to provide leadership in the development and operation of a safe and efficient transportation system.”
Establishing goals and measuring results is essential to running a successful organization and meeting public expectations.
For more information on MAPSS, visit www.mapss.wi.gov
1
Performance measure
How we measure it
Current report period Goal
Goal met Trend Comments
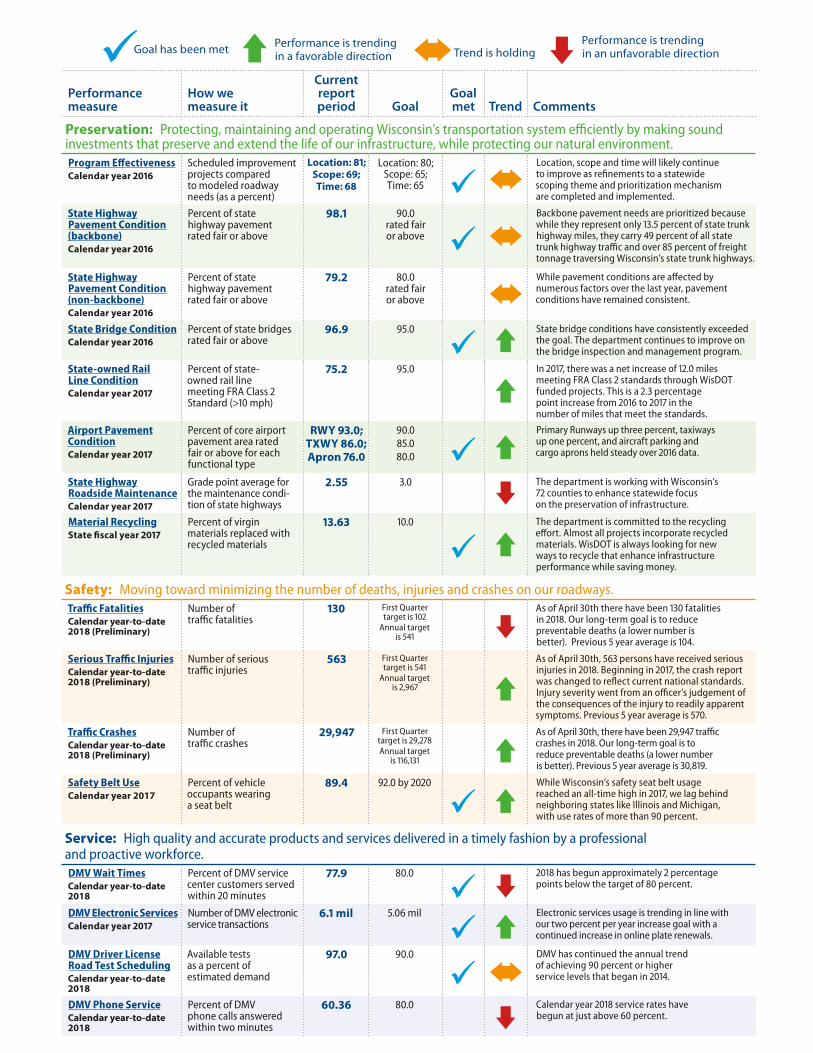
Preservation: Protecting, maintaining and operating Wisconsin’s transportation system efficiently by making sound investments that preserve and extend the life of our infrastructure, while protecting our natural environment.Program EffectivenessCalendar year 2016
Scheduled improvement projects compared to modeled roadway needs (as a percent)
Location: 81; Scope: 69; Time: 68
Location: 80; Scope: 65; Time: 65
Location, scope and time will likely continue to improve as refinements to a statewide scoping theme and prioritization mechanism are completed and implemented.
State Highway Pavement Condition (backbone)Calendar year 2016
Percent of state highway pavement rated fair or above
98.1 90.0 rated fair or above
Backbone pavement needs are prioritized because while they represent only 13.5 percent of state trunk highway miles, they carry 49 percent of all state trunk highway traffic and over 85 percent of freight tonnage traversing Wisconsin’s state trunk highways.
State Highway Pavement Condition (non-backbone)Calendar year 2016
Percent of state highway pavement rated fair or above
79.2 80.0 rated fair or above
While pavement conditions are affected by numerous factors over the last year, pavement conditions have remained consistent.
State Bridge ConditionCalendar year 2016
Percent of state bridges rated fair or above
96.9 95.0 State bridge conditions have consistently exceeded the goal. The department continues to improve on the bridge inspection and management program.
State-owned Rail Line ConditionCalendar year 2017
Percent of state-owned rail line meeting FRA Class 2 Standard (>10 mph)
75.2 95.0 In 2017, there was a net increase of 12.0 miles meeting FRA Class 2 standards through WisDOT funded projects. This is a 2.3 percentage point increase from 2016 to 2017 in the number of miles that meet the standards.
Airport Pavement ConditionCalendar year 2017
Percent of core airport pavement area rated fair or above for each functional type
RWY 93.0; TXWY 86.0; Apron 76.0
90.0 85.0 80.0
Primary Runways up three percent, taxiways up one percent, and aircraft parking and cargo aprons held steady over 2016 data.
State Highway Roadside MaintenanceCalendar year 2017
Grade point average for the maintenance condi-tion of state highways
2.55 3.0 The department is working with Wisconsin’s 72 counties to enhance statewide focus on the preservation of infrastructure.
Material RecyclingState fiscal year 2017
Percent of virgin materials replaced with recycled materials
13.63 10.0 The department is committed to the recycling effort. Almost all projects incorporate recycled materials. WisDOT is always looking for new ways to recycle that enhance infrastructure performance while saving money.
Safety: Moving toward minimizing the number of deaths, injuries and crashes on our roadways.Traffic FatalitiesCalendar year-to-date 2018 (Preliminary)
Number of traffic fatalities
130 First Quarter target is 102
Annual target is 541
As of April 30th there have been 130 fatalities in 2018. Our long-term goal is to reduce preventable deaths (a lower number is better). Previous 5 year average is 104.
Serious Traffic InjuriesCalendar year-to-date 2018 (Preliminary)
Number of serious traffic injuries
563 First Quarter target is 541
Annual target is 2,967
As of April 30th, 563 persons have received serious injuries in 2018. Beginning in 2017, the crash report was changed to reflect current national standards. Injury severity went from an officer’s judgement of the consequences of the injury to readily apparent symptoms. Previous 5 year average is 570.
Traffic CrashesCalendar year-to-date 2018 (Preliminary)
Number of traffic crashes
29,947 First Quarter target is 29,278Annual target
is 116,131
As of April 30th, there have been 29,947 traffic crashes in 2018. Our long-term goal is to reduce preventable deaths (a lower number is better). Previous 5 year average is 30,819.
Safety Belt UseCalendar year 2017
Percent of vehicle occupants wearing a seat belt
89.4 92.0 by 2020 While Wisconsin’s safety seat belt usage reached an all-time high in 2017, we lag behind neighboring states like Illinois and Michigan, with use rates of more than 90 percent.
Service: High quality and accurate products and services delivered in a timely fashion by a professional and proactive workforce.DMV Wait TimesCalendar year-to-date 2018
Percent of DMV service center customers served within 20 minutes
77.9 80.0 2018 has begun approximately 2 percentage points below the target of 80 percent.
DMV Electronic ServicesCalendar year 2017
Number of DMV electronic service transactions
6.1 mil 5.06 mil Electronic services usage is trending in line with our two percent per year increase goal with a continued increase in online plate renewals.
DMV Driver License Road Test SchedulingCalendar year-to-date 2018
Available tests as a percent of estimated demand
97.0 90.0 DMV has continued the annual trend of achieving 90 percent or higher service levels that began in 2014.
DMV Phone ServiceCalendar year-to-date 2018
Percent of DMV phone calls answered within two minutes
60.36 80.0 Calendar year 2018 service rates have begun at just above 60 percent.
Goal has been met Performance is trending in a favorable direction Trend is holding
Performance is trending in an unfavorable direction
Wisconsin Department of TransportationMAPSS Performance Improvement
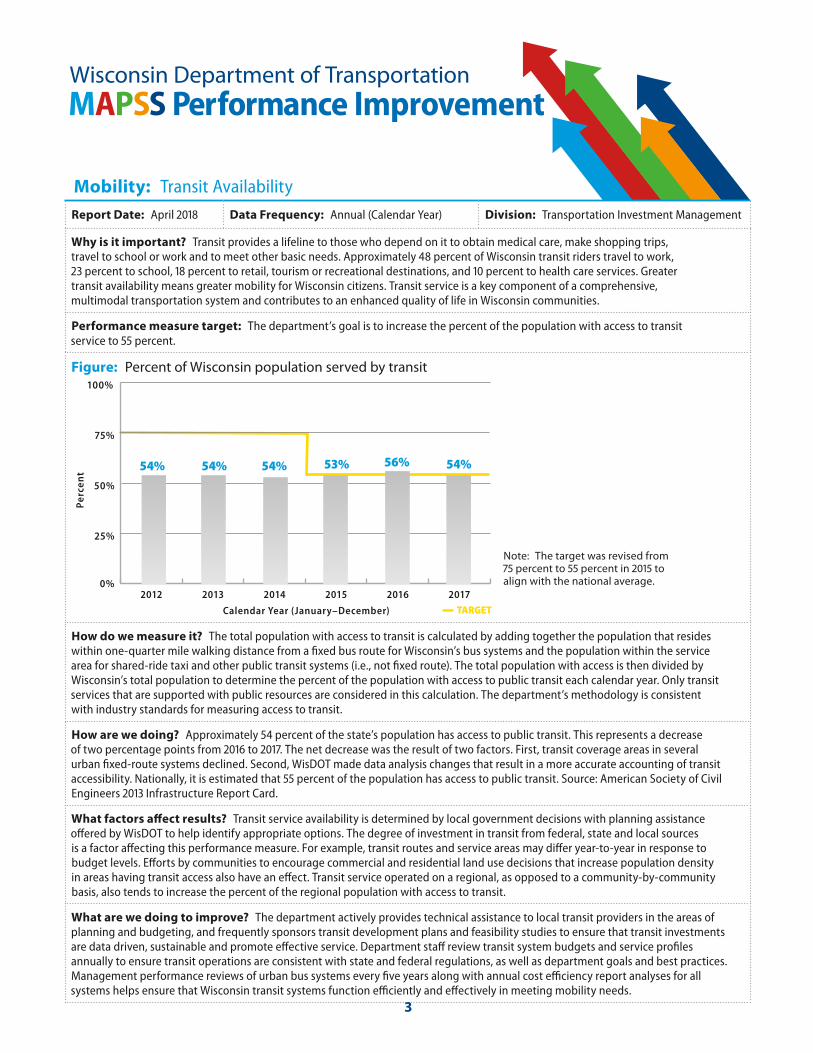
Mobility: Transit Availability
Report Date: April 2018 Data Frequency: Annual (Calendar Year) Division: Transportation Investment Management
Why is it important? Transit provides a lifeline to those who depend on it to obtain medical care, make shopping trips, travel to school or work and to meet other basic needs. Approximately 48 percent of Wisconsin transit riders travel to work, 23 percent to school, 18 percent to retail, tourism or recreational destinations, and 10 percent to health care services. Greater transit availability means greater mobility for Wisconsin citizens. Transit service is a key component of a comprehensive, multimodal transportation system and contributes to an enhanced quality of life in Wisconsin communities.
Performance measure target: The department’s goal is to increase the percent of the population with access to transit service to 55 percent.
Figure: Percent of Wisconsin population served by transit
How do we measure it? The total population with access to transit is calculated by adding together the population that resides within one-quarter mile walking distance from a fixed bus route for Wisconsin’s bus systems and the population within the service area for shared-ride taxi and other public transit systems (i.e., not fixed route). The total population with access is then divided by Wisconsin’s total population to determine the percent of the population with access to public transit each calendar year. Only transit services that are supported with public resources are considered in this calculation. The department’s methodology is consistent with industry standards for measuring access to transit.
How are we doing? Approximately 54 percent of the state’s population has access to public transit. This represents a decrease of two percentage points from 2016 to 2017. The net decrease was the result of two factors. First, transit coverage areas in several urban fixed-route systems declined. Second, WisDOT made data analysis changes that result in a more accurate accounting of transit accessibility. Nationally, it is estimated that 55 percent of the population has access to public transit. Source: American Society of Civil Engineers 2013 Infrastructure Report Card.
What factors affect results? Transit service availability is determined by local government decisions with planning assistance offered by WisDOT to help identify appropriate options. The degree of investment in transit from federal, state and local sources is a factor affecting this performance measure. For example, transit routes and service areas may differ year-to-year in response to budget levels. Efforts by communities to encourage commercial and residential land use decisions that increase population density in areas having transit access also have an effect. Transit service operated on a regional, as opposed to a community-by-community basis, also tends to increase the percent of the regional population with access to transit.
What are we doing to improve? The department actively provides technical assistance to local transit providers in the areas of planning and budgeting, and frequently sponsors transit development plans and feasibility studies to ensure that transit investments are data driven, sustainable and promote effective service. Department staff review transit system budgets and service profiles annually to ensure transit operations are consistent with state and federal regulations, as well as department goals and best practices. Management performance reviews of urban bus systems every five years along with annual cost efficiency report analyses for all systems helps ensure that Wisconsin transit systems function efficiently and effectively in meeting mobility needs.
0%
25%
50%
75%
100%
201720162015201420132012
54% 54% 56%54% 54%
Perc
ent
Calendar Year (January–December) TARGET
53%
Note: The target was revised from 75 percent to 55 percent in 2015 to align with the national average.
3
Wisconsin Department of TransportationMAPSS Performance Improvement
Mobility: Bicycling Conditions on Rural Highways
Report Date: April 2018 Data Frequency: Annual (Calendar Year) Division: Transportation Investment Management
Why is it important? Bicycle travel is an essential component of a multimodal transportation system. The option to travel by bicycle is important for people too young to drive, people who cannot drive or people who choose not to drive. Monitoring rural highway conditions for bicycling helps planners and designers identify potential facility improvements for all modes of travel. This is especially important in areas that are currently less suitable for bicycle travel and are experiencing growth or increased auto congestion. Generally, projects that create safety and operational improvements for all roadway users also result in improved conditions for bicyclists.
Performance measure target: The department’s goal is to have favorable conditions for bicycling on all rural county and state highways on which bicycles are permitted to travel. Favorable is defined as having conditions rated as ‘best’ or ‘moderate’ for bicycling.
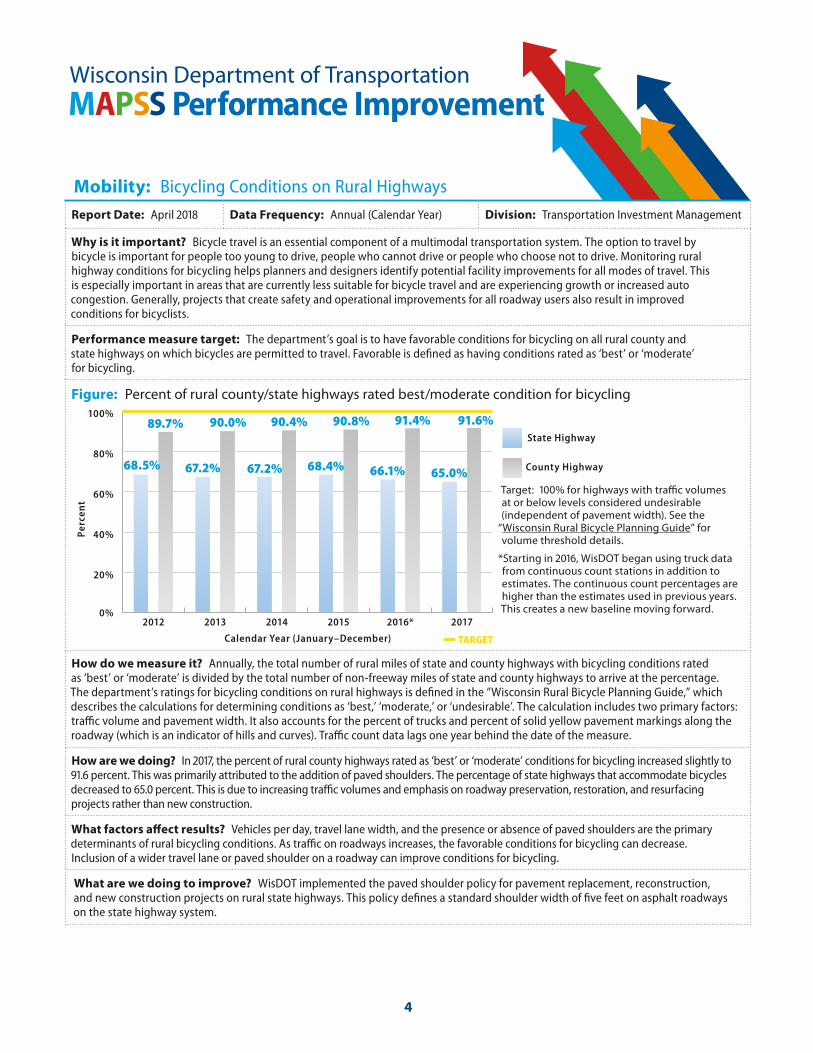
Figure: Percent of rural county/state highways rated best/moderate condition for bicycling
How do we measure it? Annually, the total number of rural miles of state and county highways with bicycling conditions rated as ‘best’ or ‘moderate’ is divided by the total number of non-freeway miles of state and county highways to arrive at the percentage. The department’s ratings for bicycling conditions on rural highways is defined in the “Wisconsin Rural Bicycle Planning Guide,” which describes the calculations for determining conditions as ‘best,’ ‘moderate,’ or ‘undesirable’. The calculation includes two primary factors: traffic volume and pavement width. It also accounts for the percent of trucks and percent of solid yellow pavement markings along the roadway (which is an indicator of hills and curves). Traffic count data lags one year behind the date of the measure.
How are we doing? In 2017, the percent of rural county highways rated as ‘best’ or ‘moderate’ conditions for bicycling increased slightly to 91.6 percent. This was primarily attributed to the addition of paved shoulders. The percentage of state highways that accommodate bicycles decreased to 65.0 percent. This is due to increasing traffic volumes and emphasis on roadway preservation, restoration, and resurfacing projects rather than new construction.
What factors affect results? Vehicles per day, travel lane width, and the presence or absence of paved shoulders are the primary determinants of rural bicycling conditions. As traffic on roadways increases, the favorable conditions for bicycling can decrease. Inclusion of a wider travel lane or paved shoulder on a roadway can improve conditions for bicycling.
What are we doing to improve? WisDOT implemented the paved shoulder policy for pavement replacement, reconstruction, and new construction projects on rural state highways. This policy defines a standard shoulder width of five feet on asphalt roadways on the state highway system.
0%
20%
40%
60%
80%
100%
County Highway
State Highway
20172016*2015201420132012
68.5%
89.7%
67.2%
90.0%
65.0%
91.6%
Perc
ent
Calendar Year (January–December) TARGET
67.2%
90.4% 90.8%
68.4% 66.1%
91.4%
Target: 100% for highways with traffic volumes at or below levels considered undesirable (independent of pavement width). See the
“Wisconsin Rural Bicycle Planning Guide” for volume threshold details.
*Starting in 2016, WisDOT began using truck data from continuous count stations in addition to estimates. The continuous count percentages are higher than the estimates used in previous years. This creates a new baseline moving forward.
4
Wisconsin Department of TransportationMAPSS Performance Improvement
Mobility: Incident Response
Report Date: April 2018 Data Frequency: Annual (Calendar Year) Division: Transportation System Development
Why is it important? Incidents happen on the Interstate and state highway system every day, from minor property damage incidents to serious traffic crashes. This measure focuses on the amount of time it takes to clear intermediate and major traffic incidents on the Interstate and state highways. Intermediate traffic incidents typically affect travel lanes and usually require traffic control on the scene to divert road users past the blockage. Major traffic incidents usually involve hazardous material (HAZMAT) spills, overturned tractor-trailers, fatalities, multiple vehicles, and/or other natural or man-made disasters. Major incidents can result in closing all or part of a roadway. Restoring the roadway to full operation as quickly as possible helps reduce secondary incidents, minimize delay for people and freight, and decreases the associated economic impact of traffic delays.
Performance measure target: The department’s goal is to reduce the length of time traffic flow is disrupted by long-term incidents on the Interstate and state highway system. The goal is to clear 90 percent of all intermediate incidents in less than two hours and to clear 80 percent of all major incidents in less than four hours.
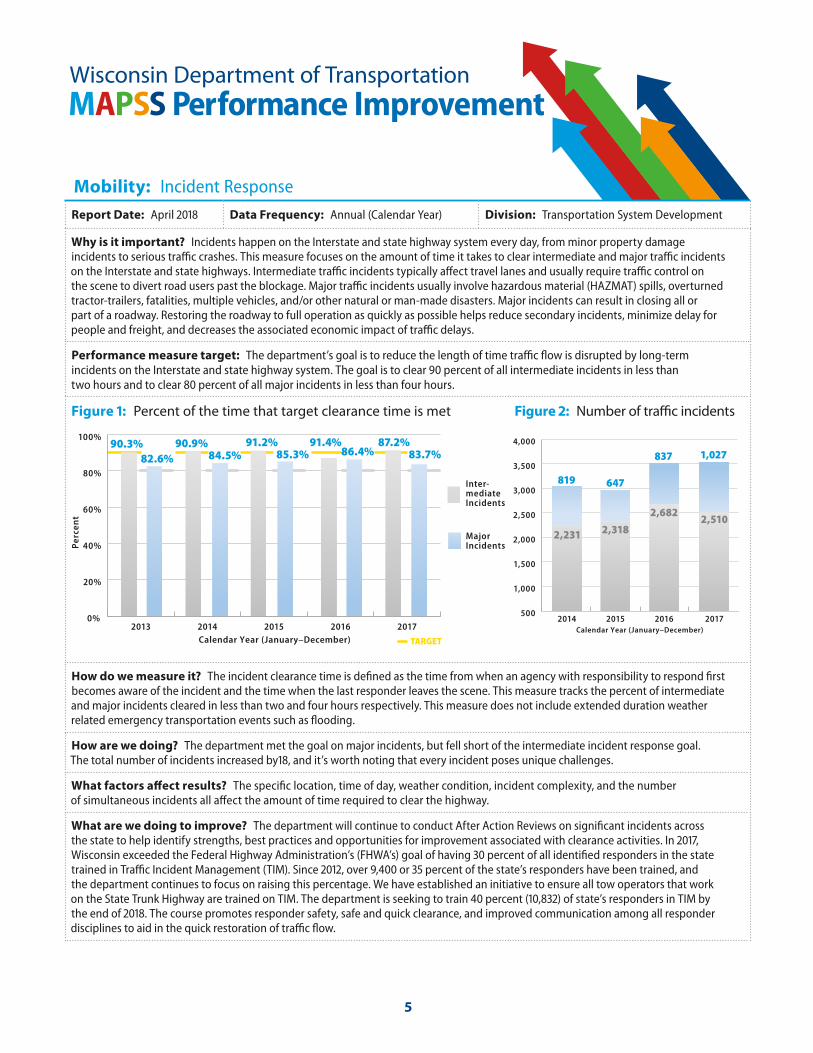
Figure 1: Percent of the time that target clearance time is met
Figure 2: Number of traffic incidents
How do we measure it? The incident clearance time is defined as the time from when an agency with responsibility to respond first becomes aware of the incident and the time when the last responder leaves the scene. This measure tracks the percent of intermediate and major incidents cleared in less than two and four hours respectively. This measure does not include extended duration weather related emergency transportation events such as flooding.
How are we doing? The department met the goal on major incidents, but fell short of the intermediate incident response goal. The total number of incidents increased by18, and it’s worth noting that every incident poses unique challenges.
What factors affect results? The specific location, time of day, weather condition, incident complexity, and the number of simultaneous incidents all affect the amount of time required to clear the highway.
What are we doing to improve? The department will continue to conduct After Action Reviews on significant incidents across the state to help identify strengths, best practices and opportunities for improvement associated with clearance activities. In 2017, Wisconsin exceeded the Federal Highway Administration’s (FHWA’s) goal of having 30 percent of all identified responders in the state trained in Traffic Incident Management (TIM). Since 2012, over 9,400 or 35 percent of the state’s responders have been trained, and the department continues to focus on raising this percentage. We have established an initiative to ensure all tow operators that work on the State Trunk Highway are trained on TIM. The department is seeking to train 40 percent (10,832) of state’s responders in TIM by the end of 2018. The course promotes responder safety, safe and quick clearance, and improved communication among all responder disciplines to aid in the quick restoration of traffic flow.
0%
20%
40%
60%
80%
100%
Major Incidents
Inter-mediate Incidents
20172016201520142013
87.2%90.3% 90.9%
Perc
ent
Calendar Year (January–December) TARGET
91.2%83.7%82.6% 84.5% 85.3%
91.4%86.4%
500
1,000
1,500
2,000
2,500
3,000
3,500
4,000
2017201620152014Calendar Year (January–December)
2,231 2,318
2,682
819 647
837 1,027
2,510
5
Wisconsin Department of TransportationMAPSS Performance Improvement
Mobility: Winter Response
Report Date: April 2018 Data Frequency: Annual (State Fiscal Year) Division: Transportation System Development
Why is it important? Returning roads to the condition they were in before a winter storm restores the capacity of the system to move traffic. This allows safe travel to work, school and other destinations. Clear roads also meet the needs for emergency travel and restore travel time reliability, which is important to the movement of freight.
Performance measure target: Roads maintained 24 hours a day are to be cleared within four hours and roads that are maintained 18 hours a day are to be cleared in six hours of the end of the storm. Eighteen-hour roads have lower traffic counts, concentrated in peak travel time periods, and are not serviced between 10 p.m. and 4 a.m. The department’s goal is achieve these targets 70 percent of the time.
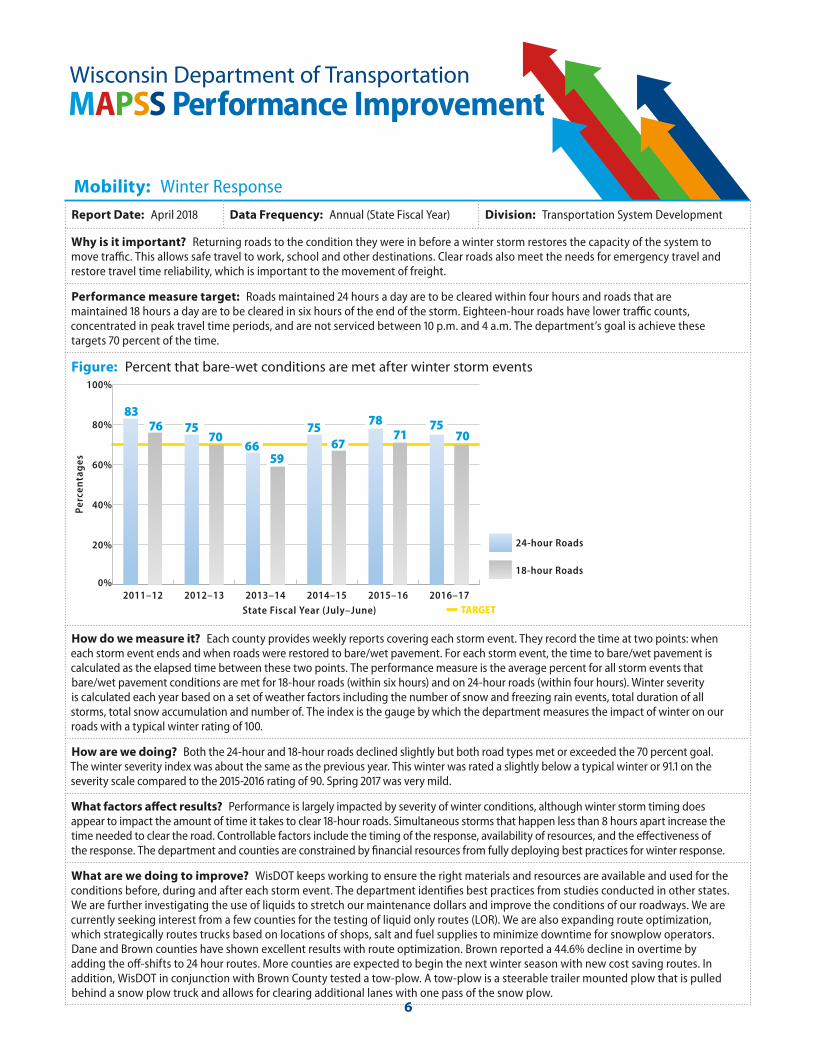
Figure: Percent that bare-wet conditions are met after winter storm events
How do we measure it? Each county provides weekly reports covering each storm event. They record the time at two points: when each storm event ends and when roads were restored to bare/wet pavement. For each storm event, the time to bare/wet pavement is calculated as the elapsed time between these two points. The performance measure is the average percent for all storm events that bare/wet pavement conditions are met for 18-hour roads (within six hours) and on 24-hour roads (within four hours). Winter severity is calculated each year based on a set of weather factors including the number of snow and freezing rain events, total duration of all storms, total snow accumulation and number of. The index is the gauge by which the department measures the impact of winter on our roads with a typical winter rating of 100.
How are we doing? Both the 24-hour and 18-hour roads declined slightly but both road types met or exceeded the 70 percent goal. The winter severity index was about the same as the previous year. This winter was rated a slightly below a typical winter or 91.1 on the severity scale compared to the 2015-2016 rating of 90. Spring 2017 was very mild.
What factors affect results? Performance is largely impacted by severity of winter conditions, although winter storm timing does appear to impact the amount of time it takes to clear 18-hour roads. Simultaneous storms that happen less than 8 hours apart increase the time needed to clear the road. Controllable factors include the timing of the response, availability of resources, and the effectiveness of the response. The department and counties are constrained by financial resources from fully deploying best practices for winter response.
What are we doing to improve? WisDOT keeps working to ensure the right materials and resources are available and used for the conditions before, during and after each storm event. The department identifies best practices from studies conducted in other states. We are further investigating the use of liquids to stretch our maintenance dollars and improve the conditions of our roadways. We are currently seeking interest from a few counties for the testing of liquid only routes (LOR). We are also expanding route optimization, which strategically routes trucks based on locations of shops, salt and fuel supplies to minimize downtime for snowplow operators. Dane and Brown counties have shown excellent results with route optimization. Brown reported a 44.6% decline in overtime by adding the off-shifts to 24 hour routes. More counties are expected to begin the next winter season with new cost saving routes. In addition, WisDOT in conjunction with Brown County tested a tow-plow. A tow-plow is a steerable trailer mounted plow that is pulled behind a snow plow truck and allows for clearing additional lanes with one pass of the snow plow.
0%
20%
40%
60%
80%
100%
18-hour Roads
24-hour Roads
2016–172015–162014–152013–142012–132011–12TARGET
7178
7075
8375
7066
7567
59
76
Perc
enta
ges
State Fiscal Year (July–June)
6
Wisconsin Department of TransportationMAPSS Performance Improvement
Accountability: Transportation Facilities Economic Assistance and Development Grants
Report Date: April 2018 Data Frequency: Semi-annually (Calendar Year) Division: Transportation Investment Management
Why is this important? The Transportation Facilities Economic Assistance and Development (TEA) program provides state matching grants of up to 50 percent, or $5,000 maximum per job, to aid governing bodies supporting local private businesses, and consortiums for road, rail, harbor and airport projects that help attract employers to Wisconsin, or encourage business and industry to remain and expand within Wisconsin. The program strives to increase the number of jobs statewide by responding to the transportation needs of an economic development project contingent on a transportation facility improvement. The goal is to attract and retain business in Wisconsin, which increases the number of local job opportunities, improves the local tax base, and boosts spending in the local economy.
Performance measure target: Achieve $50 of capital investment for every $1 of grant funds awarded.
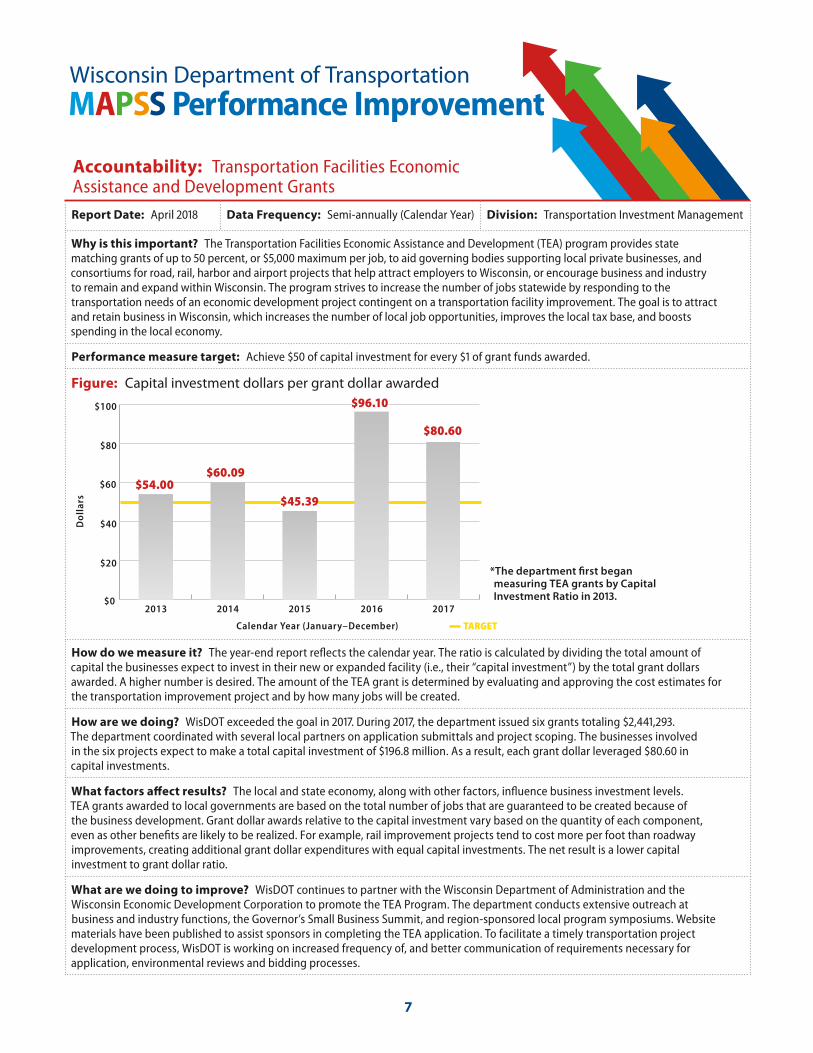
Figure: Capital investment dollars per grant dollar awarded
How do we measure it? The year-end report reflects the calendar year. The ratio is calculated by dividing the total amount of capital the businesses expect to invest in their new or expanded facility (i.e., their “capital investment”) by the total grant dollars awarded. A higher number is desired. The amount of the TEA grant is determined by evaluating and approving the cost estimates for the transportation improvement project and by how many jobs will be created.
How are we doing? WisDOT exceeded the goal in 2017. During 2017, the department issued six grants totaling $2,441,293. The department coordinated with several local partners on application submittals and project scoping. The businesses involved in the six projects expect to make a total capital investment of $196.8 million. As a result, each grant dollar leveraged $80.60 in capital investments.
What factors affect results? The local and state economy, along with other factors, influence business investment levels. TEA grants awarded to local governments are based on the total number of jobs that are guaranteed to be created because of the business development. Grant dollar awards relative to the capital investment vary based on the quantity of each component, even as other benefits are likely to be realized. For example, rail improvement projects tend to cost more per foot than roadway improvements, creating additional grant dollar expenditures with equal capital investments. The net result is a lower capital investment to grant dollar ratio.
What are we doing to improve? WisDOT continues to partner with the Wisconsin Department of Administration and the Wisconsin Economic Development Corporation to promote the TEA Program. The department conducts extensive outreach at business and industry functions, the Governor’s Small Business Summit, and region-sponsored local program symposiums. Website materials have been published to assist sponsors in completing the TEA application. To facilitate a timely transportation project development process, WisDOT is working on increased frequency of, and better communication of requirements necessary for application, environmental reviews and bidding processes.
$0
$20
$40
$60
$80
$100
20172016201520142013
Do
llar
s
Calendar Year (January–December) TARGET
$54.00$60.09
$45.39
$96.10
$80.60
*The department first began measuring TEA grants by Capital Investment Ratio in 2013.
7
Wisconsin Department of TransportationMAPSS Performance Improvement
Accountability: Timely Scheduling of Contracts
Report Date: April 2018 Data Frequency: Annual (State Fiscal Year) Division: Transportation System Development
Why is this important? The process for timely scheduling of contracts is critical because it distributes improvement projects into monthly bid lettings over the course of the state fiscal year. This enhances program delivery by balancing the workload for the department and the road building industry. The department’s ultimate objective is to maximize competitive bids, provide the department flexibility in adjusting lettings in the last half of the fiscal year for let contract savings or overages, and allow the department to spend additional federal funds if they are received late in the year.
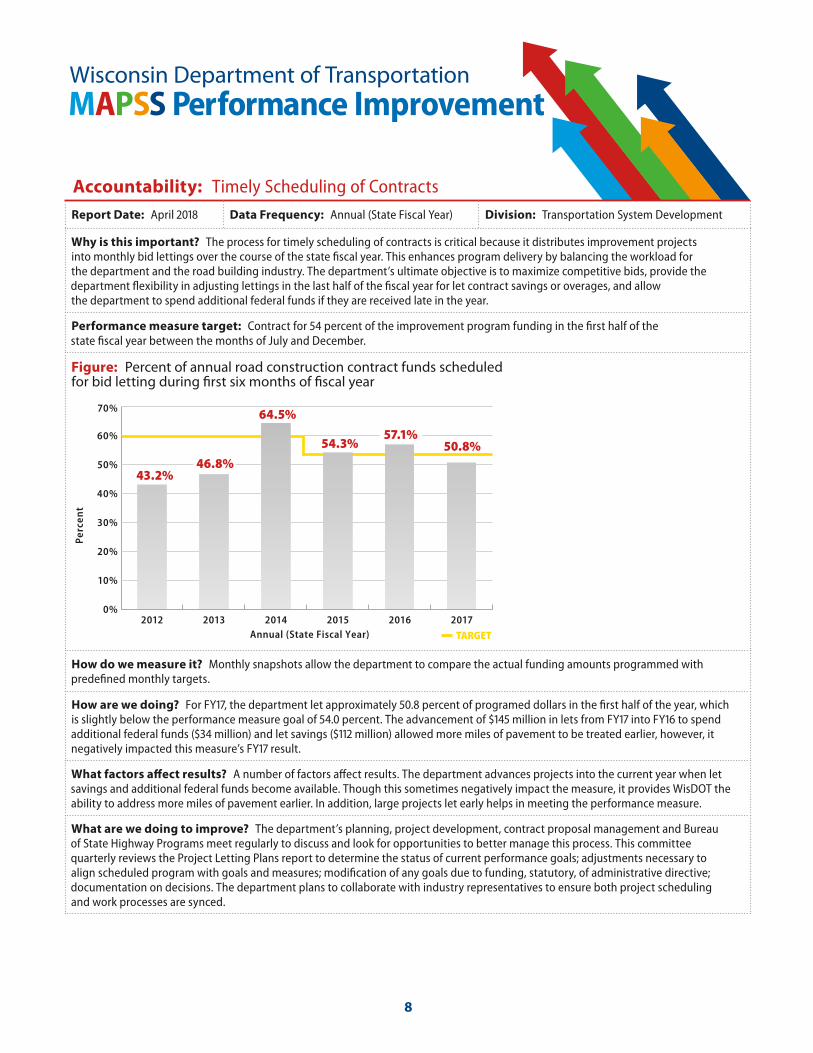
Performance measure target: Contract for 54 percent of the improvement program funding in the first half of the state fiscal year between the months of July and December.
Figure: Percent of annual road construction contract funds scheduled for bid letting during first six months of fiscal year
How do we measure it? Monthly snapshots allow the department to compare the actual funding amounts programmed with predefined monthly targets.
How are we doing? For FY17, the department let approximately 50.8 percent of programed dollars in the first half of the year, which is slightly below the performance measure goal of 54.0 percent. The advancement of $145 million in lets from FY17 into FY16 to spend additional federal funds ($34 million) and let savings ($112 million) allowed more miles of pavement to be treated earlier, however, it negatively impacted this measure’s FY17 result.
What factors affect results? A number of factors affect results. The department advances projects into the current year when let savings and additional federal funds become available. Though this sometimes negatively impact the measure, it provides WisDOT the ability to address more miles of pavement earlier. In addition, large projects let early helps in meeting the performance measure.
What are we doing to improve? The department’s planning, project development, contract proposal management and Bureau of State Highway Programs meet regularly to discuss and look for opportunities to better manage this process. This committee quarterly reviews the Project Letting Plans report to determine the status of current performance goals; adjustments necessary to align scheduled program with goals and measures; modification of any goals due to funding, statutory, of administrative directive; documentation on decisions. The department plans to collaborate with industry representatives to ensure both project scheduling and work processes are synced.
0%
10%
20%
30%
40%
50%
60%
70%
201720162015201420132012
Perc
ent
Annual (State Fiscal Year)
54.3%57.1%
50.8%
43.2%
64.5%
46.8%
TARGET
8
Wisconsin Department of TransportationMAPSS Performance Improvement
Accountability: On-time Performance
Report Date: April 2018 Data Frequency: Annual (Calendar Year) Division: Transportation System Development
Why is this important? This measure indicates the department’s ability to estimate and manage the amount of time it will take to complete a highway construction project. The better the department is at determining project time, the better able we are to schedule future projects to effectively utilize contractor resources. The general public and businesses are affected by construction projects. When the department adheres to a schedule, the better everyone can plan for the impact.
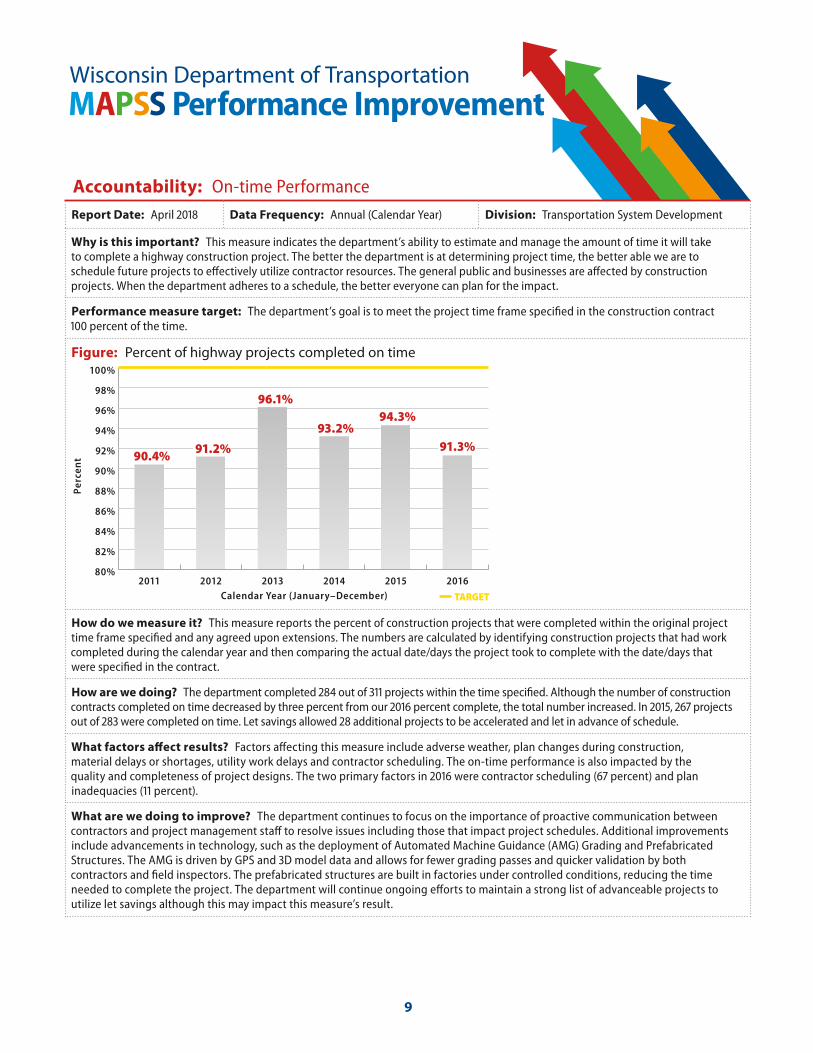
Performance measure target: The department’s goal is to meet the project time frame specified in the construction contract 100 percent of the time.
Figure: Percent of highway projects completed on time
How do we measure it? This measure reports the percent of construction projects that were completed within the original project time frame specified and any agreed upon extensions. The numbers are calculated by identifying construction projects that had work completed during the calendar year and then comparing the actual date/days the project took to complete with the date/days that were specified in the contract.
How are we doing? The department completed 284 out of 311 projects within the time specified. Although the number of construction contracts completed on time decreased by three percent from our 2016 percent complete, the total number increased. In 2015, 267 projects out of 283 were completed on time. Let savings allowed 28 additional projects to be accelerated and let in advance of schedule.
What factors affect results? Factors affecting this measure include adverse weather, plan changes during construction, material delays or shortages, utility work delays and contractor scheduling. The on-time performance is also impacted by the quality and completeness of project designs. The two primary factors in 2016 were contractor scheduling (67 percent) and plan inadequacies (11 percent).
What are we doing to improve? The department continues to focus on the importance of proactive communication between contractors and project management staff to resolve issues including those that impact project schedules. Additional improvements include advancements in technology, such as the deployment of Automated Machine Guidance (AMG) Grading and Prefabricated Structures. The AMG is driven by GPS and 3D model data and allows for fewer grading passes and quicker validation by both contractors and field inspectors. The prefabricated structures are built in factories under controlled conditions, reducing the time needed to complete the project. The department will continue ongoing efforts to maintain a strong list of advanceable projects to utilize let savings although this may impact this measure’s result.
80%
82%
84%
86%
88%
90%
92%
94%
96%
98%
100%
201620152014201320122011
Perc
ent
Calendar Year (January–December)
94.3%
90.4%
TARGET
91.2%
96.1%
93.2%91.3%
9
Wisconsin Department of TransportationMAPSS Performance Improvement
Accountability: On-budget Performance
Report Date: April 2018 Data Frequency: Annual (State Fiscal Year) Division: Transportation System Development
Why is it important? The department aims to have the final project cost as close as possible to the amount that was originally contracted when the project was let out for bid. While managing to our budget is important, WisDOT’s top priority is delivering a quality project. Therefore, projects costs may increase due to an issue recognized in the field.
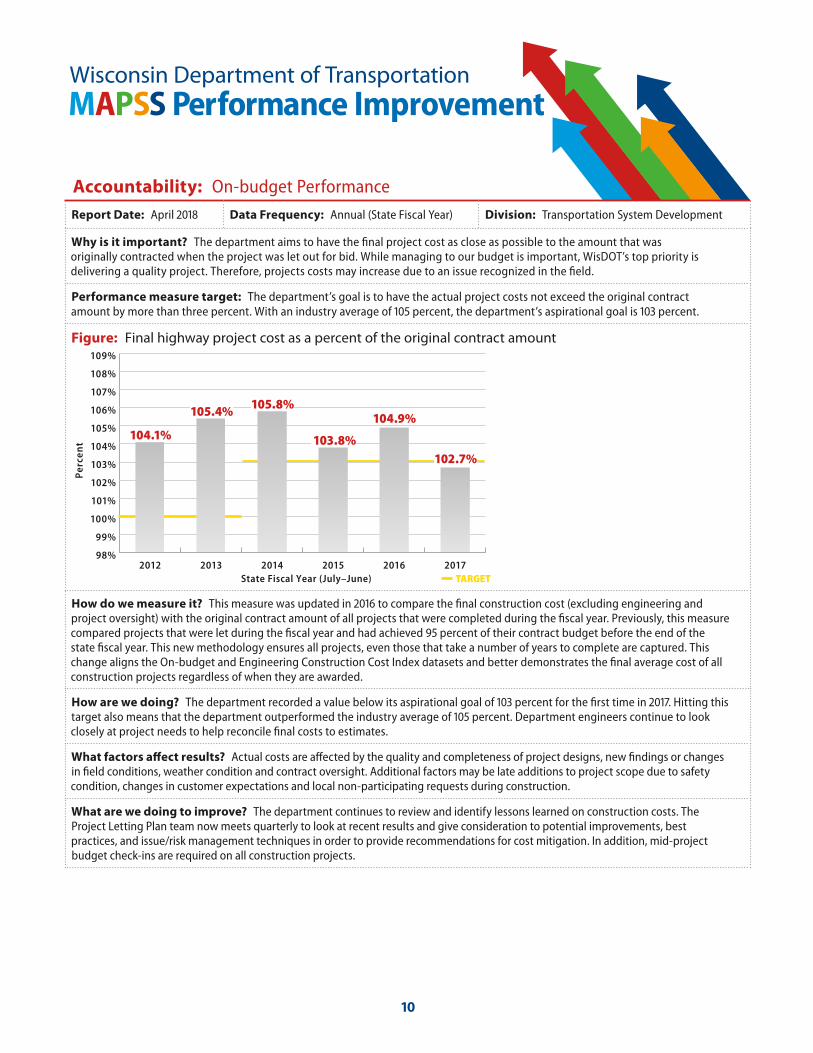
Performance measure target: The department’s goal is to have the actual project costs not exceed the original contract amount by more than three percent. With an industry average of 105 percent, the department’s aspirational goal is 103 percent.
Figure: Final highway project cost as a percent of the original contract amount
How do we measure it? This measure was updated in 2016 to compare the final construction cost (excluding engineering and project oversight) with the original contract amount of all projects that were completed during the fiscal year. Previously, this measure compared projects that were let during the fiscal year and had achieved 95 percent of their contract budget before the end of the state fiscal year. This new methodology ensures all projects, even those that take a number of years to complete are captured. This change aligns the On-budget and Engineering Construction Cost Index datasets and better demonstrates the final average cost of all construction projects regardless of when they are awarded.
How are we doing? The department recorded a value below its aspirational goal of 103 percent for the first time in 2017. Hitting this target also means that the department outperformed the industry average of 105 percent. Department engineers continue to look closely at project needs to help reconcile final costs to estimates.
What factors affect results? Actual costs are affected by the quality and completeness of project designs, new findings or changes in field conditions, weather condition and contract oversight. Additional factors may be late additions to project scope due to safety condition, changes in customer expectations and local non-participating requests during construction.
What are we doing to improve? The department continues to review and identify lessons learned on construction costs. The Project Letting Plan team now meets quarterly to look at recent results and give consideration to potential improvements, best practices, and issue/risk management techniques in order to provide recommendations for cost mitigation. In addition, mid-project budget check-ins are required on all construction projects.
98%
99%
100%
101%
102%
103%
104%
105%
106%
107%
108%
109%
201720162015201420132012
105.8%105.4%
Perc
ent
State Fiscal Year (July–June) TARGET
102.7%
104.1% 103.8%
104.9%
10
Wisconsin Department of TransportationMAPSS Performance Improvement
Accountability: Surplus Property Management
Report Date: April 2018 Data Frequency: Quarterly (State Fiscal Year) Division: Transportation System Development
Why is it important? The department purchases property for transportation improvement projects. Once the project design and construction is complete, land that is no longer needed by the state can be made available for private development. The revenue generated by surplus land sales is deposited into the Transportation Fund to be available for other transportation improvements. Surplus land that is sold spurs local economic development since the parcels often have good access and visibility. When land is returned to the tax rolls, local governments benefit because they can generate new property tax revenue from the property.
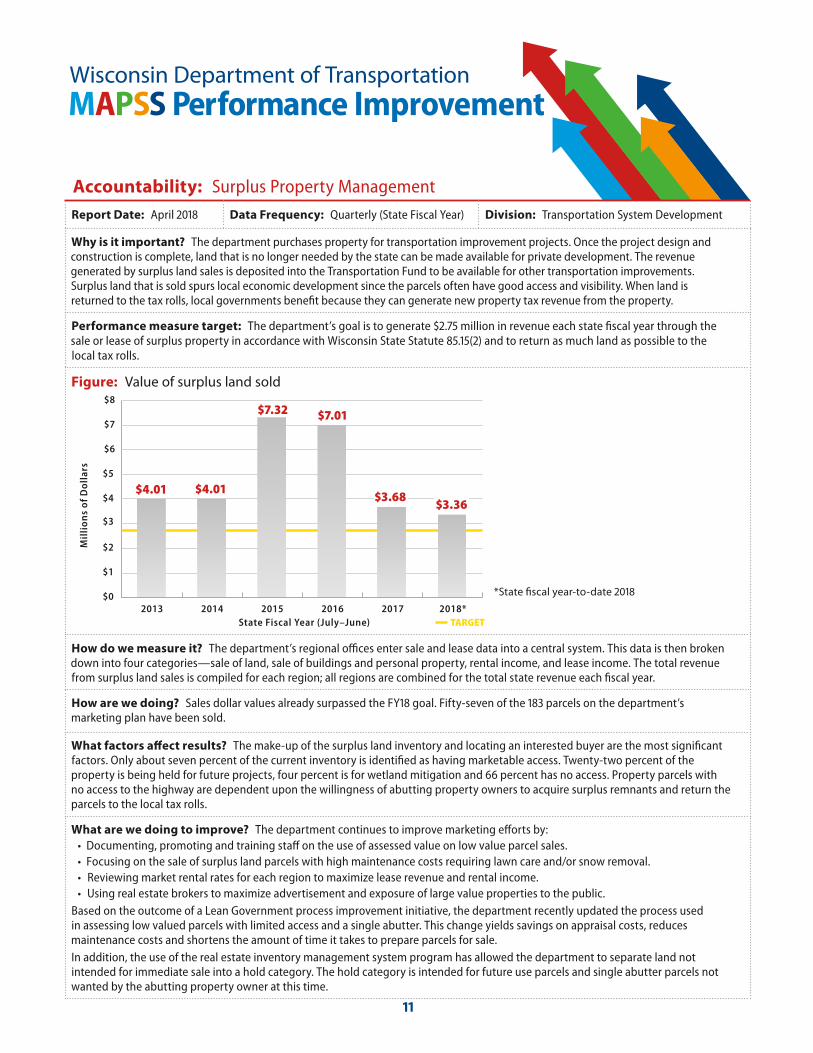
Performance measure target: The department’s goal is to generate $2.75 million in revenue each state fiscal year through the sale or lease of surplus property in accordance with Wisconsin State Statute 85.15(2) and to return as much land as possible to the local tax rolls.
Figure: Value of surplus land sold
How do we measure it? The department’s regional offices enter sale and lease data into a central system. This data is then broken down into four categories—sale of land, sale of buildings and personal property, rental income, and lease income. The total revenue from surplus land sales is compiled for each region; all regions are combined for the total state revenue each fiscal year.
How are we doing? Sales dollar values already surpassed the FY18 goal. Fifty-seven of the 183 parcels on the department’s marketing plan have been sold.
What factors affect results? The make-up of the surplus land inventory and locating an interested buyer are the most significant factors. Only about seven percent of the current inventory is identified as having marketable access. Twenty-two percent of the property is being held for future projects, four percent is for wetland mitigation and 66 percent has no access. Property parcels with no access to the highway are dependent upon the willingness of abutting property owners to acquire surplus remnants and return the parcels to the local tax rolls.
What are we doing to improve? The department continues to improve marketing efforts by: • Documenting, promoting and training staff on the use of assessed value on low value parcel sales.• Focusing on the sale of surplus land parcels with high maintenance costs requiring lawn care and/or snow removal.• Reviewing market rental rates for each region to maximize lease revenue and rental income. • Using real estate brokers to maximize advertisement and exposure of large value properties to the public.
Based on the outcome of a Lean Government process improvement initiative, the department recently updated the process used in assessing low valued parcels with limited access and a single abutter. This change yields savings on appraisal costs, reduces maintenance costs and shortens the amount of time it takes to prepare parcels for sale. In addition, the use of the real estate inventory management system program has allowed the department to separate land not intended for immediate sale into a hold category. The hold category is intended for future use parcels and single abutter parcels not wanted by the abutting property owner at this time.
$0
$1
$2
$3
$4
$5
$6
$7
$8
2018*20172016201520142013
$7.01
$3.68$3.36
$4.01$4.01
$7.32
Mil
lio
ns
of
Do
llar
s
State Fiscal Year (July–June) TARGET
*State fiscal year-to-date 2018
11
Wisconsin Department of TransportationMAPSS Performance Improvement
Preservation: Program Effectiveness
Report Date: April 2018 Data Frequency: Annual (Calendar Year) Division: Transportation Investment Management
Why is it important? The department uses the Program Effectiveness measure as a guide to ensure general conformity in the 3R improvement program with the asset management principles embodied in the department’s scoping and prioritization themes. While the goal is to improve consistency in the use of asset management data and techniques, variation in performance across regions is expected. The asset management model provides “planning level” information that serves as a starting point for program planning. The department’s planners and engineers then use this data to streamline the process of formulating “project level” decisions. It’s important to recognize that the model cannot accommodate all of the competing variables that factor into project and program development. So while regions should keep measure outcomes in mind during the program development process, analysis of the outcomes should not be confused with project level development.
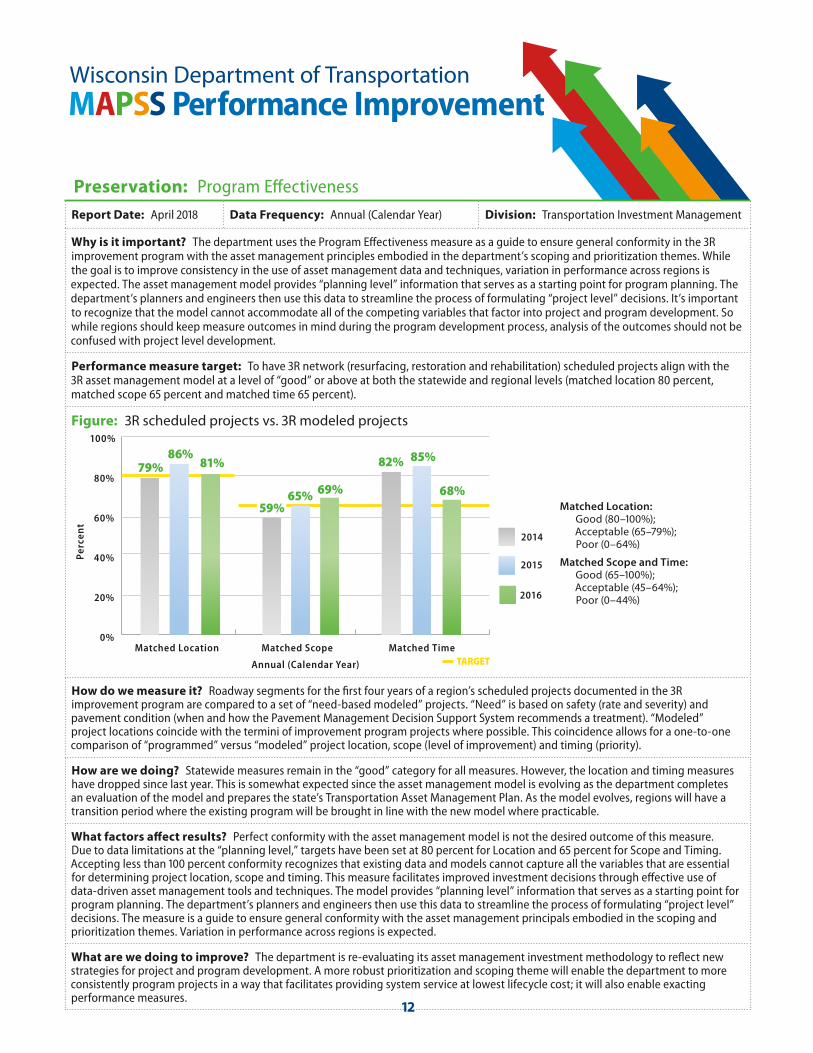
Performance measure target: To have 3R network (resurfacing, restoration and rehabilitation) scheduled projects align with the 3R asset management model at a level of “good” or above at both the statewide and regional levels (matched location 80 percent, matched scope 65 percent and matched time 65 percent).
Figure: 3R scheduled projects vs. 3R modeled projects
How do we measure it? Roadway segments for the first four years of a region’s scheduled projects documented in the 3R improvement program are compared to a set of “need-based modeled” projects. “Need” is based on safety (rate and severity) and pavement condition (when and how the Pavement Management Decision Support System recommends a treatment). “Modeled” project locations coincide with the termini of improvement program projects where possible. This coincidence allows for a one-to-one comparison of “programmed” versus “modeled” project location, scope (level of improvement) and timing (priority).
How are we doing? Statewide measures remain in the “good” category for all measures. However, the location and timing measures have dropped since last year. This is somewhat expected since the asset management model is evolving as the department completes an evaluation of the model and prepares the state’s Transportation Asset Management Plan. As the model evolves, regions will have a transition period where the existing program will be brought in line with the new model where practicable.
What factors affect results? Perfect conformity with the asset management model is not the desired outcome of this measure. Due to data limitations at the “planning level,” targets have been set at 80 percent for Location and 65 percent for Scope and Timing. Accepting less than 100 percent conformity recognizes that existing data and models cannot capture all the variables that are essential for determining project location, scope and timing. This measure facilitates improved investment decisions through effective use of data-driven asset management tools and techniques. The model provides “planning level” information that serves as a starting point for program planning. The department’s planners and engineers then use this data to streamline the process of formulating “project level” decisions. The measure is a guide to ensure general conformity with the asset management principals embodied in the scoping and prioritization themes. Variation in performance across regions is expected.
What are we doing to improve? The department is re-evaluating its asset management investment methodology to reflect new strategies for project and program development. A more robust prioritization and scoping theme will enable the department to more consistently program projects in a way that facilitates providing system service at lowest lifecycle cost; it will also enable exacting performance measures.
0%
20%
40%
60%
80%
100%
2016
2015
2014
Matched TimeMatched ScopeMatched Location
Perc
ent
Annual (Calendar Year)
82%79%
TARGET
59%
81% 85%
65%
86%
69% 68%Matched Location:
Good (80–100%); Acceptable (65–79%); Poor (0–64%)
Matched Scope and Time: Good (65–100%); Acceptable (45–64%); Poor (0–44%)
12
Wisconsin Department of TransportationMAPSS Performance Improvement
Preservation: State Highway Pavement Condition (backbone)
Report Date: April 2018 Data Frequency: Annual (Calendar Year) Division: Transportation Investment Management
Why is it important? Backbone highways are multi-lane highways connecting all major population and economic regions of the state. This 1,588-mile network represents a critical subset of the State Trunk Network because it provides economic links to national and international markets (e.g., Interstates 39, 41, 43, 90 and 94; US Highways 10, 41, 51, 53 and 151; and State Highway 29). New federal performance measures emphasize conditions on Interstates. Good condition pavement promotes the safe, efficient movement of people and products throughout Wisconsin. Prioritizing the backbone network ensures we maximize our investment in the state’s transportation infrastructure.
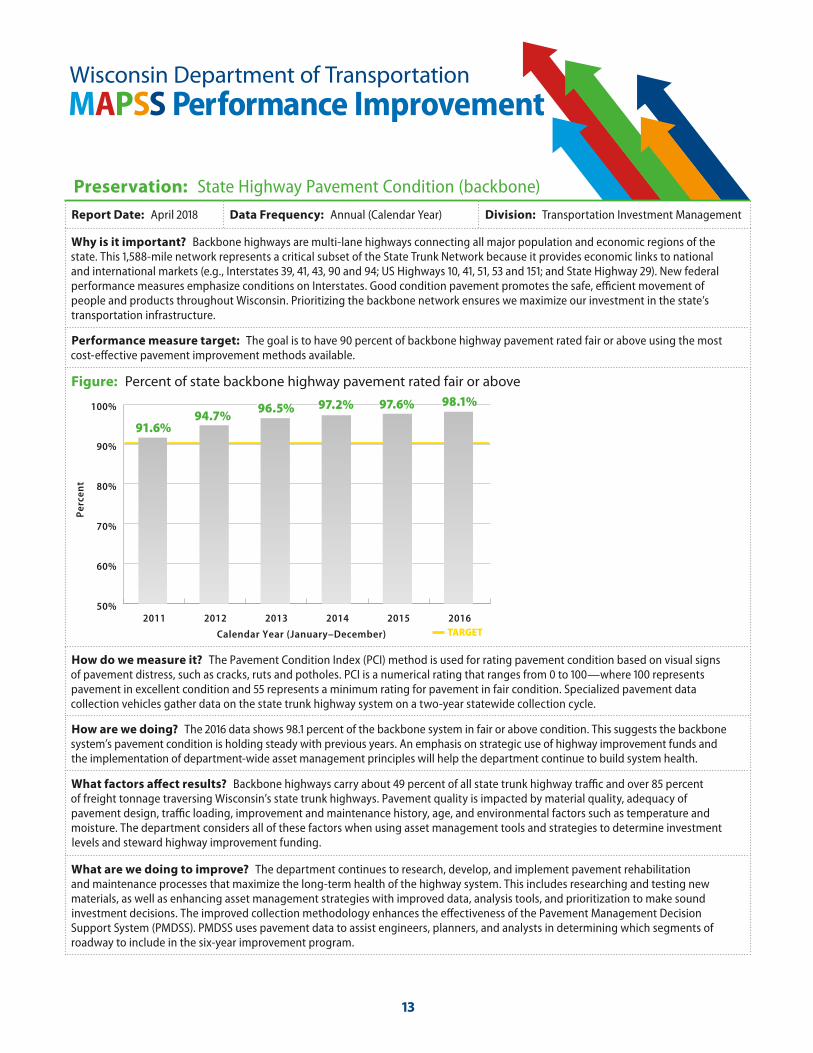
Performance measure target: The goal is to have 90 percent of backbone highway pavement rated fair or above using the most cost-effective pavement improvement methods available.
Figure: Percent of state backbone highway pavement rated fair or above
How do we measure it? The Pavement Condition Index (PCI) method is used for rating pavement condition based on visual signs of pavement distress, such as cracks, ruts and potholes. PCI is a numerical rating that ranges from 0 to 100—where 100 represents pavement in excellent condition and 55 represents a minimum rating for pavement in fair condition. Specialized pavement data collection vehicles gather data on the state trunk highway system on a two-year statewide collection cycle.
How are we doing? The 2016 data shows 98.1 percent of the backbone system in fair or above condition. This suggests the backbone system’s pavement condition is holding steady with previous years. An emphasis on strategic use of highway improvement funds and the implementation of department-wide asset management principles will help the department continue to build system health.
What factors affect results? Backbone highways carry about 49 percent of all state trunk highway traffic and over 85 percent of freight tonnage traversing Wisconsin’s state trunk highways. Pavement quality is impacted by material quality, adequacy of pavement design, traffic loading, improvement and maintenance history, age, and environmental factors such as temperature and moisture. The department considers all of these factors when using asset management tools and strategies to determine investment levels and steward highway improvement funding.
What are we doing to improve? The department continues to research, develop, and implement pavement rehabilitation and maintenance processes that maximize the long-term health of the highway system. This includes researching and testing new materials, as well as enhancing asset management strategies with improved data, analysis tools, and prioritization to make sound investment decisions. The improved collection methodology enhances the effectiveness of the Pavement Management Decision Support System (PMDSS). PMDSS uses pavement data to assist engineers, planners, and analysts in determining which segments of roadway to include in the six-year improvement program.
Calendar Year (January–December)
50%
60%
70%
80%
90%
100%
201620152014201320122011
Perc
ent
TARGET
91.6%94.7%
97.2%96.5% 97.6% 98.1%
13
Wisconsin Department of TransportationMAPSS Performance Improvement
Preservation: State Highway Pavement Condition (non-backbone)
Report Date: April 2018 Data Frequency: Annual (Calendar Year) Division: Transportation Investment Management
Why is it important? The majority of the state’s trunk highway system is on non-backbone highways. Known internally to WisDOT as the 3R (resurfacing, restoration and rehabilitation) system, these highways comprise 10,167 of the nearly 12,000 total centerline miles in the entire system. Keeping these highways in good condition helps to promote the safe, efficient movement of people and products throughout Wisconsin. Comprehensive pavement condition data is used to determine cost-effective maintenance and improvement strategies that extend the life of the state highway system.
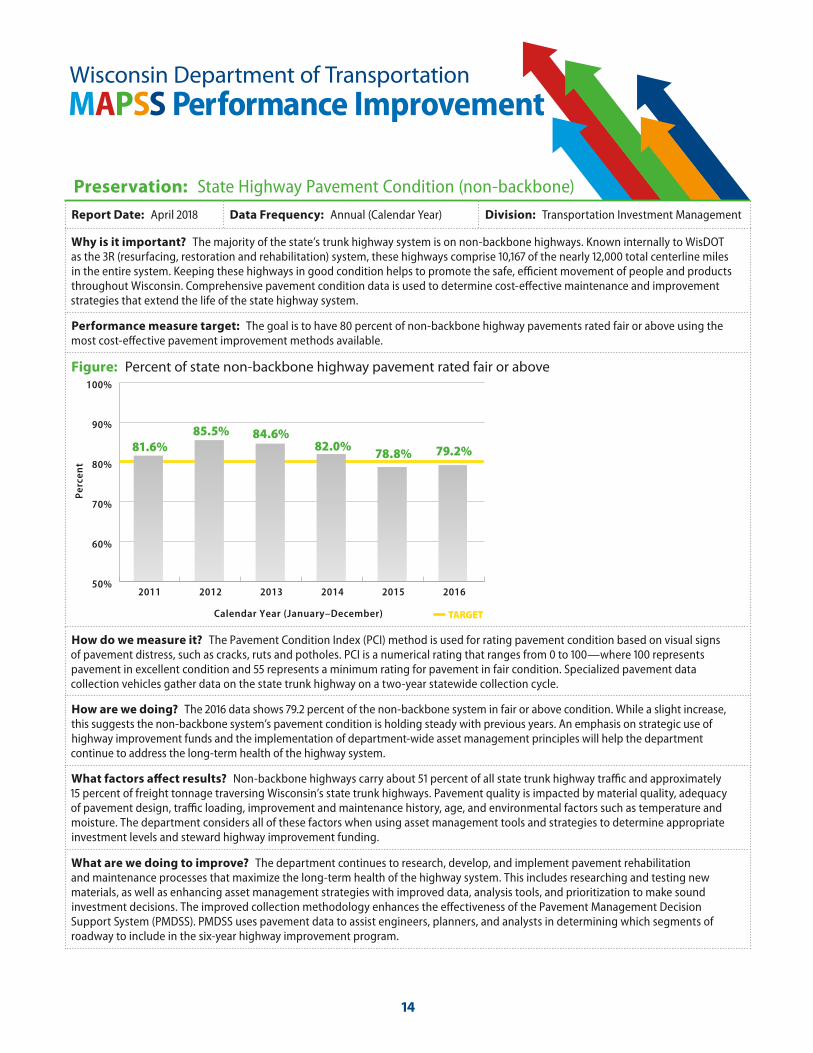
Performance measure target: The goal is to have 80 percent of non-backbone highway pavements rated fair or above using the most cost-effective pavement improvement methods available.
Figure: Percent of state non-backbone highway pavement rated fair or above
How do we measure it? The Pavement Condition Index (PCI) method is used for rating pavement condition based on visual signs of pavement distress, such as cracks, ruts and potholes. PCI is a numerical rating that ranges from 0 to 100—where 100 represents pavement in excellent condition and 55 represents a minimum rating for pavement in fair condition. Specialized pavement data collection vehicles gather data on the state trunk highway on a two-year statewide collection cycle.
How are we doing? The 2016 data shows 79.2 percent of the non-backbone system in fair or above condition. While a slight increase, this suggests the non-backbone system’s pavement condition is holding steady with previous years. An emphasis on strategic use of highway improvement funds and the implementation of department-wide asset management principles will help the department continue to address the long-term health of the highway system.
What factors affect results? Non-backbone highways carry about 51 percent of all state trunk highway traffic and approximately 15 percent of freight tonnage traversing Wisconsin’s state trunk highways. Pavement quality is impacted by material quality, adequacy of pavement design, traffic loading, improvement and maintenance history, age, and environmental factors such as temperature and moisture. The department considers all of these factors when using asset management tools and strategies to determine appropriate investment levels and steward highway improvement funding.
What are we doing to improve? The department continues to research, develop, and implement pavement rehabilitation and maintenance processes that maximize the long-term health of the highway system. This includes researching and testing new materials, as well as enhancing asset management strategies with improved data, analysis tools, and prioritization to make sound investment decisions. The improved collection methodology enhances the effectiveness of the Pavement Management Decision Support System (PMDSS). PMDSS uses pavement data to assist engineers, planners, and analysts in determining which segments of roadway to include in the six-year highway improvement program.
50%
60%
70%
80%
90%
100%
201620152014201320122011
Perc
ent
Calendar Year (January–December) TARGET
79.2%81.6%84.6%
82.0%85.5%
78.8%
14

Wisconsin Department of TransportationMAPSS Performance Improvement
Preservation: State Bridge Condition
Report Date: April 2018 Data Frequency: Annual (Calendar Year) Division: Transportation System Development
Why is it important? Wisconsin bridges are critical infrastructure assets of the highway transportation network. Ensuring safety for the traveling public is a top priority for the department. Inspecting and evaluating bridges is a key component of meeting this objective. Bridges with a condition rating of poor are considered deficient and may need corrective action to ensure current and future operation of the transportation system. An accurate understanding of the condition of the inventory of bridges allows for planning and prioritizing limited resources to address operational needs.
Performance measure target: The department’s goal is to have 95 percent of Wisconsin’s state-owned or maintained bridges rated fair or above.
Figure: Percent of bridges rated fair or above
How do we measure it? The department performs bi-yearly safety inspections and condition assessments of bridges. This is the designated frequency in National Bridge Inspection Standards (NBIS). Through these inspections, condition rating data is collected for the deck, superstructure and substructure with an overall rating of good, fair or poor condition assigned each calendar year. Bridges with a poor condition rating and open to traffic are safe; however, these structures may need corrective action to ensure continued operation.
How are we doing? The department works to allocate available resources to meet the safety and mobility needs of the state. Currently, 96.9 percent of Wisconsin’s 5,293 state-owned or maintained bridges have a good rating or fair rating, while 3.1 percent of state bridges have a poor condition rating. There are 40 state-owned bridges with weight restrictions, an improvement from 44 state-owned weight restricted bridges in 2015. The above yearly data shows that Wisconsin has been exceeding the goal of 95 percent in good/fair condition over the past six years. When including Wisconsin’s 8,894 local bridges, the good/fair bridge condition rating drops to 92.3 percent, which is close to the national average of approximately 92.1 percent. The state highway system network accounts for 10 percent of the total mileage in Wisconsin, yet handles 60 percent of the total vehicle miles traveled.
What factors affect results? The increasing average age of the state bridge inventory is a significant factor. The average age of state system bridges is more than 34 years. Wisconsin puts a high emphasis on maintaining and improving its bridges through its rehabilitation and replacement improvement programming. Bridges receive the highest priority in the project selection process. Wisconsin spends additional state money above the federal dollars it receives from the bridge program to maintain its bridges.
What are we doing to improve? The department continues to improve the bridge inspection and bridge management programs by utilizing new technology and innovative management practices. In 2016, the department introduced a bridge preservation policy that promotes programing of lower level treatments and action to extend the long-term performance of the bridges on our state highways. Also in 2016, Bureau of Structures has worked with FHWA to update the “Agreement for the Use of Federal Funds for Preventative Maintenance of Structures” that provides more flexibility to the department in programming federally funded work actions for structures. This updated agreement and federally funded work types promote preservation of our bridge assets and achievement of good and fair condition.
85%
90%
95%
100%
201620152014201320122011
96.9%
Perc
ent
Calendar Year (January–December) TARGET
96.9% 96.8% 96.8% 96.7% 96.8%
15
Wisconsin Department of TransportationMAPSS Performance Improvement
Preservation: State-owned Rail Line Condition
Report Date: April 2018 Data Frequency: Annual (Calendar Year) Division: Transportation Investment Management
Why is it important? The efficient movement of freight throughout the state enhances Wisconsin’s economic productivity and competitiveness. It is critical to maintain train operating speeds as high as possible to optimize the daily movement of freight in the state.
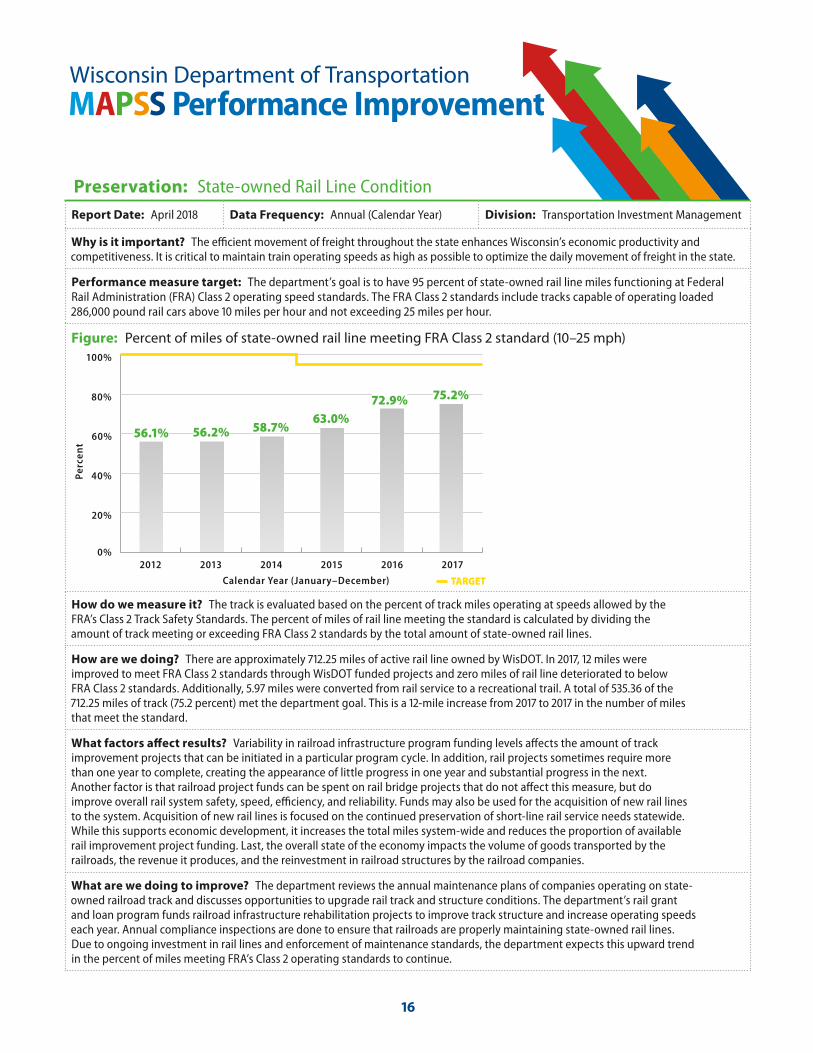
Performance measure target: The department’s goal is to have 95 percent of state-owned rail line miles functioning at Federal Rail Administration (FRA) Class 2 operating speed standards. The FRA Class 2 standards include tracks capable of operating loaded 286,000 pound rail cars above 10 miles per hour and not exceeding 25 miles per hour.
Figure: Percent of miles of state-owned rail line meeting FRA Class 2 standard (10–25 mph)
How do we measure it? The track is evaluated based on the percent of track miles operating at speeds allowed by the FRA’s Class 2 Track Safety Standards. The percent of miles of rail line meeting the standard is calculated by dividing the amount of track meeting or exceeding FRA Class 2 standards by the total amount of state-owned rail lines.
How are we doing? There are approximately 712.25 miles of active rail line owned by WisDOT. In 2017, 12 miles were improved to meet FRA Class 2 standards through WisDOT funded projects and zero miles of rail line deteriorated to below FRA Class 2 standards. Additionally, 5.97 miles were converted from rail service to a recreational trail. A total of 535.36 of the 712.25 miles of track (75.2 percent) met the department goal. This is a 12-mile increase from 2017 to 2017 in the number of miles that meet the standard.
What factors affect results? Variability in railroad infrastructure program funding levels affects the amount of track improvement projects that can be initiated in a particular program cycle. In addition, rail projects sometimes require more than one year to complete, creating the appearance of little progress in one year and substantial progress in the next. Another factor is that railroad project funds can be spent on rail bridge projects that do not affect this measure, but do improve overall rail system safety, speed, efficiency, and reliability. Funds may also be used for the acquisition of new rail lines to the system. Acquisition of new rail lines is focused on the continued preservation of short-line rail service needs statewide. While this supports economic development, it increases the total miles system-wide and reduces the proportion of available rail improvement project funding. Last, the overall state of the economy impacts the volume of goods transported by the railroads, the revenue it produces, and the reinvestment in railroad structures by the railroad companies.
What are we doing to improve? The department reviews the annual maintenance plans of companies operating on state-owned railroad track and discusses opportunities to upgrade rail track and structure conditions. The department’s rail grant and loan program funds railroad infrastructure rehabilitation projects to improve track structure and increase operating speeds each year. Annual compliance inspections are done to ensure that railroads are properly maintaining state-owned rail lines. Due to ongoing investment in rail lines and enforcement of maintenance standards, the department expects this upward trend in the percent of miles meeting FRA’s Class 2 operating standards to continue.
0%
20%
40%
60%
80%
100%
201720162015201420132012
56.1% 56.2%
Perc
ent
Calendar Year (January–December) TARGET
58.7%63.0%
75.2%72.9%
16
Wisconsin Department of TransportationMAPSS Performance Improvement
Preservation: Airport Pavement Condition
Report Date: April 2018 Data Frequency: Annual (Calendar Year) Division: Transportation Investment Management
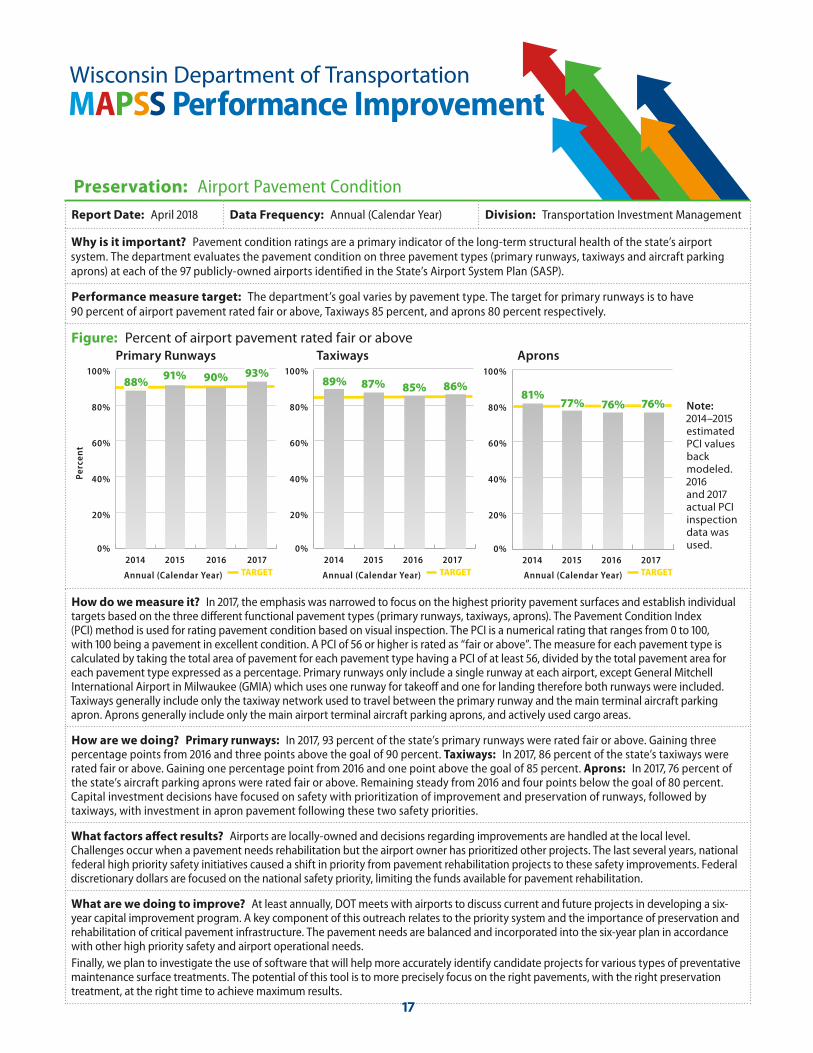
Why is it important? Pavement condition ratings are a primary indicator of the long-term structural health of the state’s airport system. The department evaluates the pavement condition on three pavement types (primary runways, taxiways and aircraft parking aprons) at each of the 97 publicly-owned airports identified in the State’s Airport System Plan (SASP).
Performance measure target: The department’s goal varies by pavement type. The target for primary runways is to have 90 percent of airport pavement rated fair or above, Taxiways 85 percent, and aprons 80 percent respectively.
Figure: Percent of airport pavement rated fair or above Primary Runways Taxiways Aprons
How do we measure it? In 2017, the emphasis was narrowed to focus on the highest priority pavement surfaces and establish individual targets based on the three different functional pavement types (primary runways, taxiways, aprons). The Pavement Condition Index (PCI) method is used for rating pavement condition based on visual inspection. The PCI is a numerical rating that ranges from 0 to 100, with 100 being a pavement in excellent condition. A PCI of 56 or higher is rated as “fair or above”. The measure for each pavement type is calculated by taking the total area of pavement for each pavement type having a PCI of at least 56, divided by the total pavement area for each pavement type expressed as a percentage. Primary runways only include a single runway at each airport, except General Mitchell International Airport in Milwaukee (GMIA) which uses one runway for takeoff and one for landing therefore both runways were included. Taxiways generally include only the taxiway network used to travel between the primary runway and the main terminal aircraft parking apron. Aprons generally include only the main airport terminal aircraft parking aprons, and actively used cargo areas.
How are we doing? Primary runways: In 2017, 93 percent of the state’s primary runways were rated fair or above. Gaining three percentage points from 2016 and three points above the goal of 90 percent. Taxiways: In 2017, 86 percent of the state’s taxiways were rated fair or above. Gaining one percentage point from 2016 and one point above the goal of 85 percent. Aprons: In 2017, 76 percent of the state’s aircraft parking aprons were rated fair or above. Remaining steady from 2016 and four points below the goal of 80 percent. Capital investment decisions have focused on safety with prioritization of improvement and preservation of runways, followed by taxiways, with investment in apron pavement following these two safety priorities.
What factors affect results? Airports are locally-owned and decisions regarding improvements are handled at the local level. Challenges occur when a pavement needs rehabilitation but the airport owner has prioritized other projects. The last several years, national federal high priority safety initiatives caused a shift in priority from pavement rehabilitation projects to these safety improvements. Federal discretionary dollars are focused on the national safety priority, limiting the funds available for pavement rehabilitation.
What are we doing to improve? At least annually, DOT meets with airports to discuss current and future projects in developing a six-year capital improvement program. A key component of this outreach relates to the priority system and the importance of preservation and rehabilitation of critical pavement infrastructure. The pavement needs are balanced and incorporated into the six-year plan in accordance with other high priority safety and airport operational needs. Finally, we plan to investigate the use of software that will help more accurately identify candidate projects for various types of preventative maintenance surface treatments. The potential of this tool is to more precisely focus on the right pavements, with the right preservation treatment, at the right time to achieve maximum results.
Perc
ent
Annual (Calendar Year) TARGET
88% 91% 90%
0%
20%
40%
60%
80%
100%
2017201620152014
93%
Annual (Calendar Year) TARGET Annual (Calendar Year) TARGET
89% 87% 85%
0%
20%
40%
60%
80%
100%
2017201620152014
86%81%
0%
20%
40%
60%
80%
100%
2017201620152014
76%76%77% Note: 2014–2015 estimated PCI values back modeled. 2016 and 2017 actual PCI inspection data was used.
17
Wisconsin Department of TransportationMAPSS Performance Improvement
Preservation: State Highway Roadside Maintenance
Report Date: April 2018 Data Frequency: Annual (Calendar Year) Division: Transportation System Development
Why is this important? Many factors affect the safety, efficient operation and longevity of our highway system. Effective and consistent maintenance efforts preserve our investment in the highway system, enhance safety and economic productivity, and minimize the impact to the natural environment.
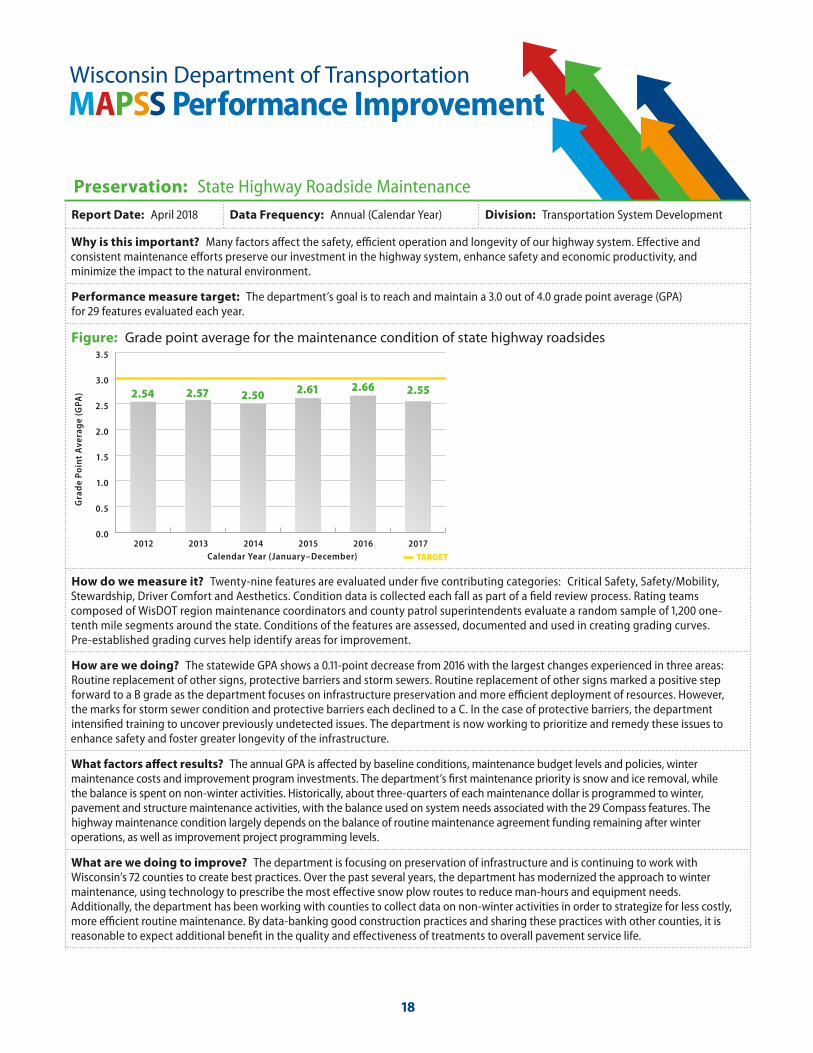
Performance measure target: The department’s goal is to reach and maintain a 3.0 out of 4.0 grade point average (GPA) for 29 features evaluated each year.
Figure: Grade point average for the maintenance condition of state highway roadsides
How do we measure it? Twenty-nine features are evaluated under five contributing categories: Critical Safety, Safety/Mobility, Stewardship, Driver Comfort and Aesthetics. Condition data is collected each fall as part of a field review process. Rating teams composed of WisDOT region maintenance coordinators and county patrol superintendents evaluate a random sample of 1,200 one-tenth mile segments around the state. Conditions of the features are assessed, documented and used in creating grading curves. Pre-established grading curves help identify areas for improvement.
How are we doing? The statewide GPA shows a 0.11-point decrease from 2016 with the largest changes experienced in three areas: Routine replacement of other signs, protective barriers and storm sewers. Routine replacement of other signs marked a positive step forward to a B grade as the department focuses on infrastructure preservation and more efficient deployment of resources. However, the marks for storm sewer condition and protective barriers each declined to a C. In the case of protective barriers, the department intensified training to uncover previously undetected issues. The department is now working to prioritize and remedy these issues to enhance safety and foster greater longevity of the infrastructure.
What factors affect results? The annual GPA is affected by baseline conditions, maintenance budget levels and policies, winter maintenance costs and improvement program investments. The department’s first maintenance priority is snow and ice removal, while the balance is spent on non-winter activities. Historically, about three-quarters of each maintenance dollar is programmed to winter, pavement and structure maintenance activities, with the balance used on system needs associated with the 29 Compass features. The highway maintenance condition largely depends on the balance of routine maintenance agreement funding remaining after winter operations, as well as improvement project programming levels.
What are we doing to improve? The department is focusing on preservation of infrastructure and is continuing to work with Wisconsin’s 72 counties to create best practices. Over the past several years, the department has modernized the approach to winter maintenance, using technology to prescribe the most effective snow plow routes to reduce man-hours and equipment needs. Additionally, the department has been working with counties to collect data on non-winter activities in order to strategize for less costly, more efficient routine maintenance. By data-banking good construction practices and sharing these practices with other counties, it is reasonable to expect additional benefit in the quality and effectiveness of treatments to overall pavement service life.
0.0
0.5
1.0
1.5
2.0
2.5
3.0
3.5
201720162015201420132012
TARGET
2.61 2.662.54 2.57 2.50
Gra
de
Poin
t A
vera
ge
(GPA
)
Calendar Year (January–December)
2.55
18
Wisconsin Department of TransportationMAPSS Performance Improvement
Preservation: Material Recycling
Report Date: April 2018 Data Frequency: Annual (State Fiscal Year) Division: Transportation System Development
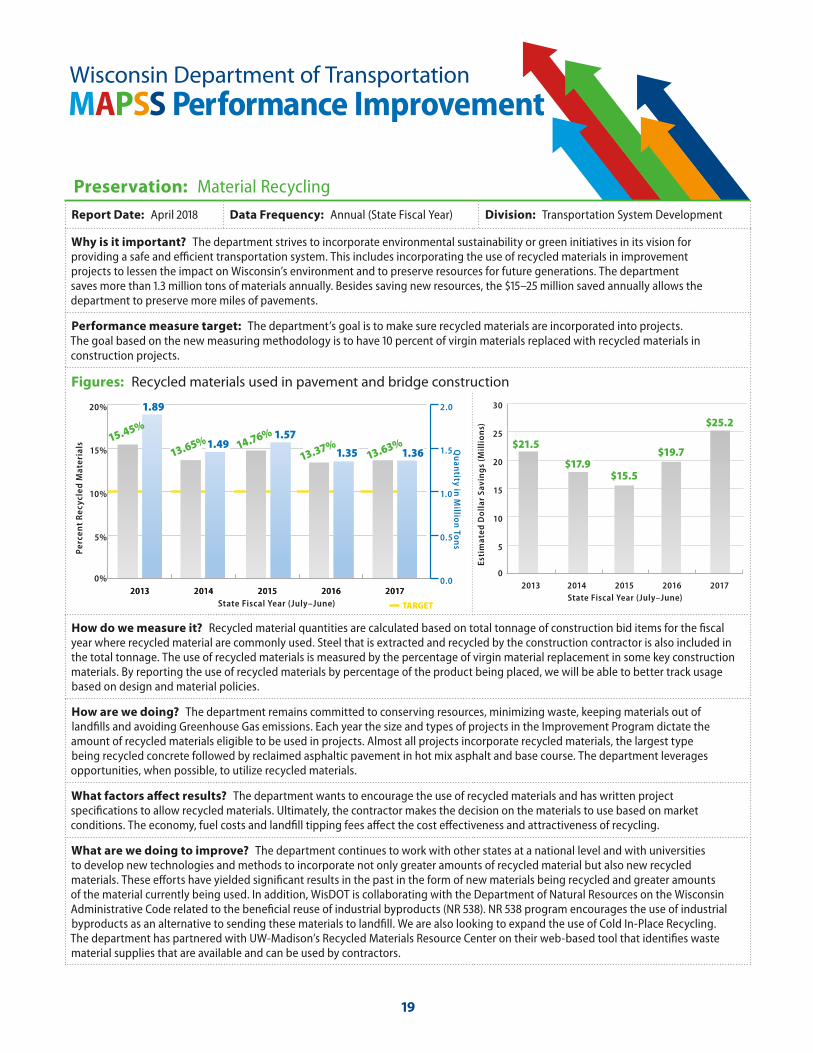
Why is it important? The department strives to incorporate environmental sustainability or green initiatives in its vision for providing a safe and efficient transportation system. This includes incorporating the use of recycled materials in improvement projects to lessen the impact on Wisconsin’s environment and to preserve resources for future generations. The department saves more than 1.3 million tons of materials annually. Besides saving new resources, the $15–25 million saved annually allows the department to preserve more miles of pavements.
Performance measure target: The department’s goal is to make sure recycled materials are incorporated into projects. The goal based on the new measuring methodology is to have 10 percent of virgin materials replaced with recycled materials in construction projects.
Figures: Recycled materials used in pavement and bridge construction
0
5
10
15
20
25
30
20172016201520142013
$21.5
$15.5Es
tim
ated
Do
llar
Sav
ing
s (M
illi
on
s)
State Fiscal Year (July–June)
$19.7$17.9
$25.2
How do we measure it? Recycled material quantities are calculated based on total tonnage of construction bid items for the fiscal year where recycled material are commonly used. Steel that is extracted and recycled by the construction contractor is also included in the total tonnage. The use of recycled materials is measured by the percentage of virgin material replacement in some key construction materials. By reporting the use of recycled materials by percentage of the product being placed, we will be able to better track usage based on design and material policies.
How are we doing? The department remains committed to conserving resources, minimizing waste, keeping materials out of landfills and avoiding Greenhouse Gas emissions. Each year the size and types of projects in the Improvement Program dictate the amount of recycled materials eligible to be used in projects. Almost all projects incorporate recycled materials, the largest type being recycled concrete followed by reclaimed asphaltic pavement in hot mix asphalt and base course. The department leverages opportunities, when possible, to utilize recycled materials.
What factors affect results? The department wants to encourage the use of recycled materials and has written project specifications to allow recycled materials. Ultimately, the contractor makes the decision on the materials to use based on market conditions. The economy, fuel costs and landfill tipping fees affect the cost effectiveness and attractiveness of recycling.
What are we doing to improve? The department continues to work with other states at a national level and with universities to develop new technologies and methods to incorporate not only greater amounts of recycled material but also new recycled materials. These efforts have yielded significant results in the past in the form of new materials being recycled and greater amounts of the material currently being used. In addition, WisDOT is collaborating with the Department of Natural Resources on the Wisconsin Administrative Code related to the beneficial reuse of industrial byproducts (NR 538). NR 538 program encourages the use of industrial byproducts as an alternative to sending these materials to landfill. We are also looking to expand the use of Cold In-Place Recycling. The department has partnered with UW-Madison’s Recycled Materials Resource Center on their web-based tool that identifies waste material supplies that are available and can be used by contractors.
Perc
ent
Rec
ycle
d M
ater
ials
State Fiscal Year (July–June) TARGET
Qu
antity in
Millio
n To
ns
0%
5%
10%
15%
20%
201720162015201420130.0
0.5
1.0
1.5
2.0
20172016201520142013
1.3615.4
5%
1.89
1.57
13.65% 14.7
6%
13.37%1.35
1.4913.6
3%
19
Wisconsin Department of TransportationMAPSS Performance Improvement
Safety: Traffic Fatalities
Report Date: April 2018 Data Frequency: Quarterly (Calendar Year) Division: State Patrol
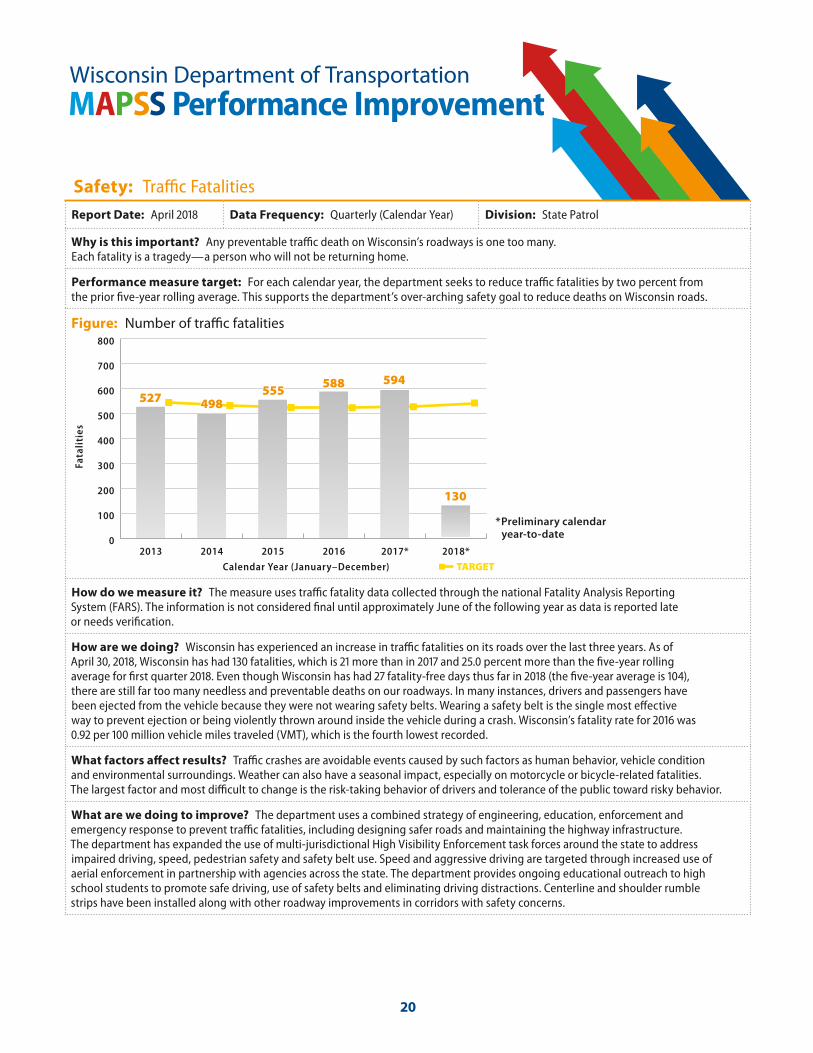
Why is this important? Any preventable traffic death on Wisconsin’s roadways is one too many. Each fatality is a tragedy—a person who will not be returning home.
Performance measure target: For each calendar year, the department seeks to reduce traffic fatalities by two percent from the prior five-year rolling average. This supports the department’s over-arching safety goal to reduce deaths on Wisconsin roads.
Figure: Number of traffic fatalities
How do we measure it? The measure uses traffic fatality data collected through the national Fatality Analysis Reporting System (FARS). The information is not considered final until approximately June of the following year as data is reported late or needs verification.
How are we doing? Wisconsin has experienced an increase in traffic fatalities on its roads over the last three years. As of April 30, 2018, Wisconsin has had 130 fatalities, which is 21 more than in 2017 and 25.0 percent more than the five-year rolling average for first quarter 2018. Even though Wisconsin has had 27 fatality-free days thus far in 2018 (the five-year average is 104), there are still far too many needless and preventable deaths on our roadways. In many instances, drivers and passengers have been ejected from the vehicle because they were not wearing safety belts. Wearing a safety belt is the single most effective way to prevent ejection or being violently thrown around inside the vehicle during a crash. Wisconsin’s fatality rate for 2016 was 0.92 per 100 million vehicle miles traveled (VMT), which is the fourth lowest recorded.
What factors affect results? Traffic crashes are avoidable events caused by such factors as human behavior, vehicle condition and environmental surroundings. Weather can also have a seasonal impact, especially on motorcycle or bicycle-related fatalities. The largest factor and most difficult to change is the risk-taking behavior of drivers and tolerance of the public toward risky behavior.
What are we doing to improve? The department uses a combined strategy of engineering, education, enforcement and emergency response to prevent traffic fatalities, including designing safer roads and maintaining the highway infrastructure. The department has expanded the use of multi-jurisdictional High Visibility Enforcement task forces around the state to address impaired driving, speed, pedestrian safety and safety belt use. Speed and aggressive driving are targeted through increased use of aerial enforcement in partnership with agencies across the state. The department provides ongoing educational outreach to high school students to promote safe driving, use of safety belts and eliminating driving distractions. Centerline and shoulder rumble strips have been installed along with other roadway improvements in corridors with safety concerns.
Fata
liti
es
Calendar Year (January–December) TARGET
0
100
200
300
400
500
600
700
800
2018*2017*2016201520142013
555594
498
588
130
527
* Preliminary calendar year-to-date
20
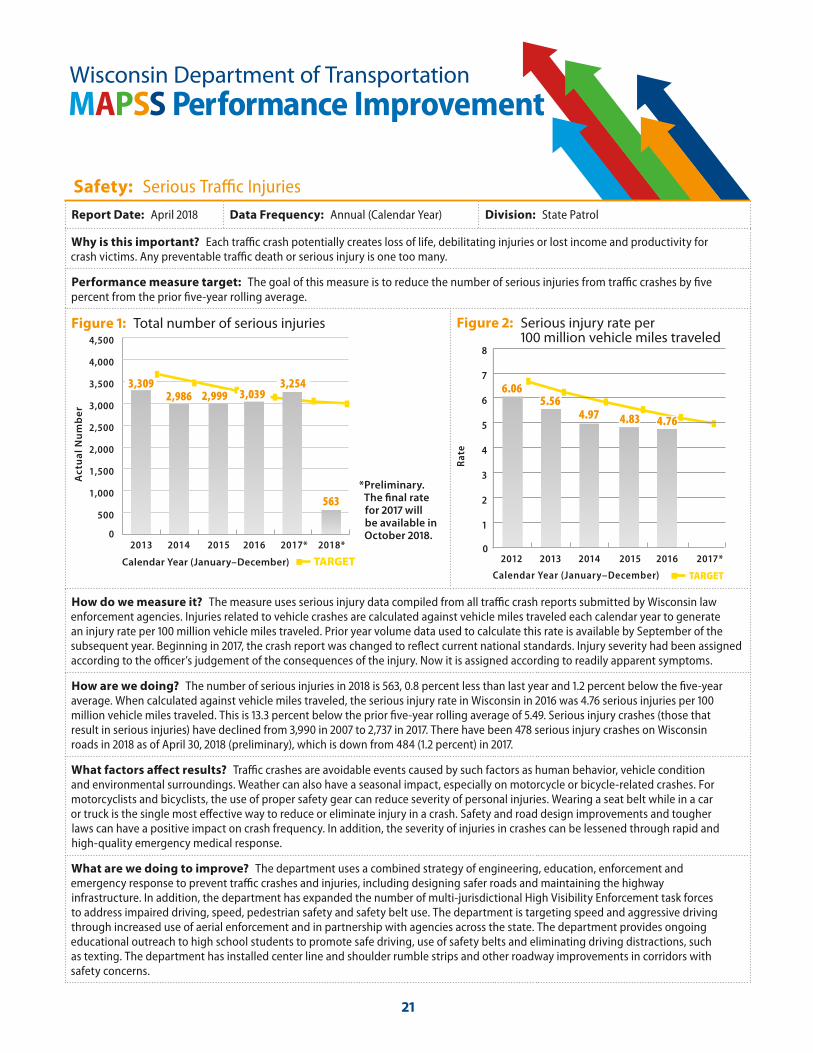
Wisconsin Department of TransportationMAPSS Performance Improvement
Safety: Serious Traffic Injuries
Report Date: April 2018 Data Frequency: Annual (Calendar Year) Division: State Patrol
Why is this important? Each traffic crash potentially creates loss of life, debilitating injuries or lost income and productivity for crash victims. Any preventable traffic death or serious injury is one too many.
Performance measure target: The goal of this measure is to reduce the number of serious injuries from traffic crashes by five percent from the prior five-year rolling average.
Figure 1: Total number of serious injuries
How do we measure it? The measure uses serious injury data compiled from all traffic crash reports submitted by Wisconsin law enforcement agencies. Injuries related to vehicle crashes are calculated against vehicle miles traveled each calendar year to generate an injury rate per 100 million vehicle miles traveled. Prior year volume data used to calculate this rate is available by September of the subsequent year. Beginning in 2017, the crash report was changed to reflect current national standards. Injury severity had been assigned according to the officer’s judgement of the consequences of the injury. Now it is assigned according to readily apparent symptoms.
How are we doing? The number of serious injuries in 2018 is 563, 0.8 percent less than last year and 1.2 percent below the five-year average. When calculated against vehicle miles traveled, the serious injury rate in Wisconsin in 2016 was 4.76 serious injuries per 100 million vehicle miles traveled. This is 13.3 percent below the prior five-year rolling average of 5.49. Serious injury crashes (those that result in serious injuries) have declined from 3,990 in 2007 to 2,737 in 2017. There have been 478 serious injury crashes on Wisconsin roads in 2018 as of April 30, 2018 (preliminary), which is down from 484 (1.2 percent) in 2017.
What factors affect results? Traffic crashes are avoidable events caused by such factors as human behavior, vehicle condition and environmental surroundings. Weather can also have a seasonal impact, especially on motorcycle or bicycle-related crashes. For motorcyclists and bicyclists, the use of proper safety gear can reduce severity of personal injuries. Wearing a seat belt while in a car or truck is the single most effective way to reduce or eliminate injury in a crash. Safety and road design improvements and tougher laws can have a positive impact on crash frequency. In addition, the severity of injuries in crashes can be lessened through rapid and high-quality emergency medical response.
What are we doing to improve? The department uses a combined strategy of engineering, education, enforcement and emergency response to prevent traffic crashes and injuries, including designing safer roads and maintaining the highway infrastructure. In addition, the department has expanded the number of multi-jurisdictional High Visibility Enforcement task forces to address impaired driving, speed, pedestrian safety and safety belt use. The department is targeting speed and aggressive driving through increased use of aerial enforcement and in partnership with agencies across the state. The department provides ongoing educational outreach to high school students to promote safe driving, use of safety belts and eliminating driving distractions, such as texting. The department has installed center line and shoulder rumble strips and other roadway improvements in corridors with safety concerns.
0
500
1,000
1,500
2,000
2,500
3,000
3,500
4,000
4,500
2018*2017*2016201520142013
Act
ual
Nu
mb
er
Calendar Year (January–December) TARGET
3,0393,2543,309
2,986
563
2,999
0
1
2
3
4
5
6
7
8
2017*20162015201420132012
Rat
e
Calendar Year (January–December) TARGET
6.065.56
4.97 4.83 4.76
Figure 2: Serious injury rate per 100 million vehicle miles traveled
* Preliminary. The final rate for 2017 will be available in October 2018.
21
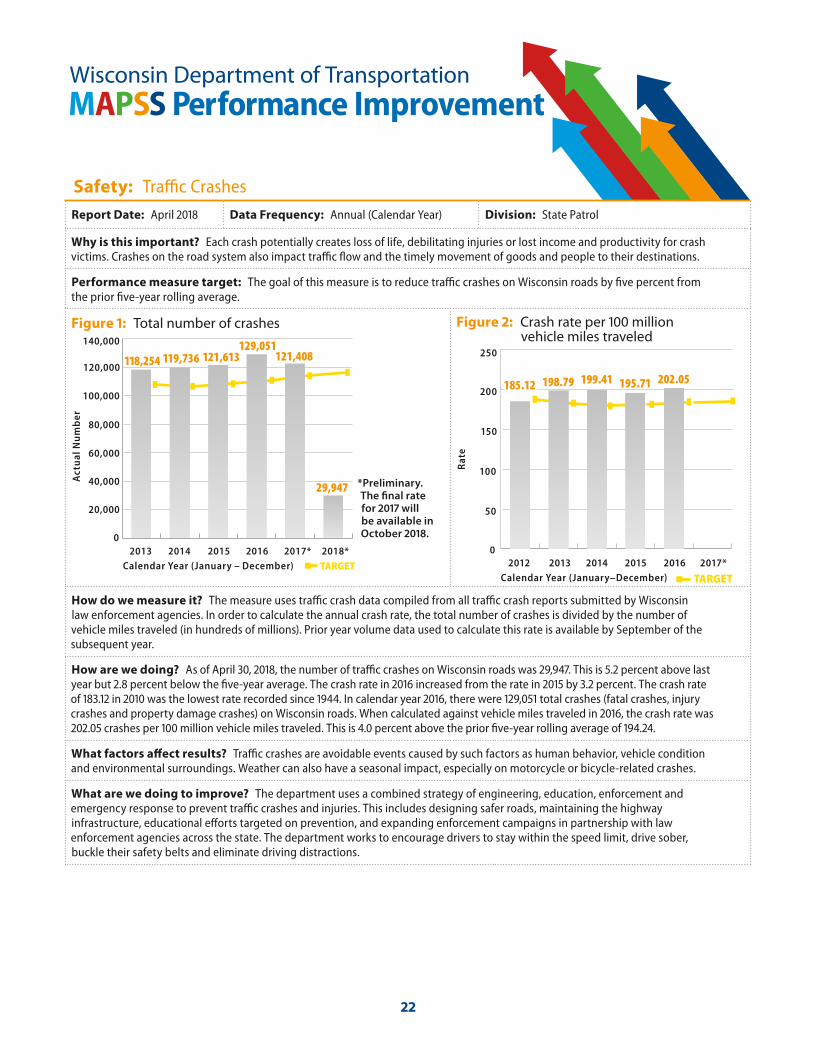
Wisconsin Department of TransportationMAPSS Performance Improvement
Safety: Traffic Crashes
Report Date: April 2018 Data Frequency: Annual (Calendar Year) Division: State Patrol
Why is this important? Each crash potentially creates loss of life, debilitating injuries or lost income and productivity for crash victims. Crashes on the road system also impact traffic flow and the timely movement of goods and people to their destinations.
Performance measure target: The goal of this measure is to reduce traffic crashes on Wisconsin roads by five percent from the prior five-year rolling average.
Figure 1: Total number of crashes
How do we measure it? The measure uses traffic crash data compiled from all traffic crash reports submitted by Wisconsin law enforcement agencies. In order to calculate the annual crash rate, the total number of crashes is divided by the number of vehicle miles traveled (in hundreds of millions). Prior year volume data used to calculate this rate is available by September of the subsequent year.
How are we doing? As of April 30, 2018, the number of traffic crashes on Wisconsin roads was 29,947. This is 5.2 percent above last year but 2.8 percent below the five-year average. The crash rate in 2016 increased from the rate in 2015 by 3.2 percent. The crash rate of 183.12 in 2010 was the lowest rate recorded since 1944. In calendar year 2016, there were 129,051 total crashes (fatal crashes, injury crashes and property damage crashes) on Wisconsin roads. When calculated against vehicle miles traveled in 2016, the crash rate was 202.05 crashes per 100 million vehicle miles traveled. This is 4.0 percent above the prior five-year rolling average of 194.24.
What factors affect results? Traffic crashes are avoidable events caused by such factors as human behavior, vehicle condition and environmental surroundings. Weather can also have a seasonal impact, especially on motorcycle or bicycle-related crashes.
What are we doing to improve? The department uses a combined strategy of engineering, education, enforcement and emergency response to prevent traffic crashes and injuries. This includes designing safer roads, maintaining the highway infrastructure, educational efforts targeted on prevention, and expanding enforcement campaigns in partnership with law enforcement agencies across the state. The department works to encourage drivers to stay within the speed limit, drive sober, buckle their safety belts and eliminate driving distractions.
Act
ual
Nu
mb
er
Calendar Year (January – December) TARGET
0
20,000
40,000
60,000
80,000
100,000
120,000
140,000
2018*2017*2016201520142013
129,051121,408
29,947
118,254 119,736 121,613
Rat
e
Calendar Year (January–December)
0
50
100
150
200
250
2017*20162015201420132012
TARGET
198.79185.12 199.41 195.71 202.05
*Preliminary. The final rate for 2017 will be available in October 2018.
Figure 2: Crash rate per 100 million vehicle miles traveled
22
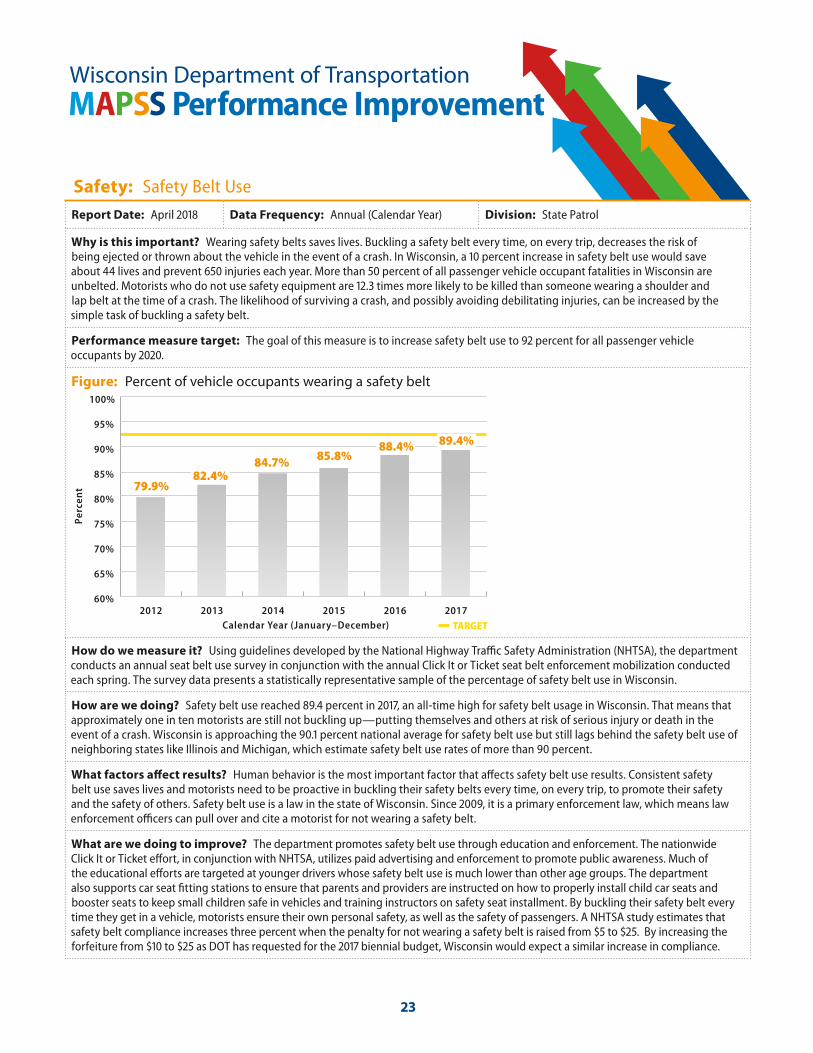
Wisconsin Department of TransportationMAPSS Performance Improvement
Safety: Safety Belt Use
Report Date: April 2018 Data Frequency: Annual (Calendar Year) Division: State Patrol
Why is this important? Wearing safety belts saves lives. Buckling a safety belt every time, on every trip, decreases the risk of being ejected or thrown about the vehicle in the event of a crash. In Wisconsin, a 10 percent increase in safety belt use would save about 44 lives and prevent 650 injuries each year. More than 50 percent of all passenger vehicle occupant fatalities in Wisconsin are unbelted. Motorists who do not use safety equipment are 12.3 times more likely to be killed than someone wearing a shoulder and lap belt at the time of a crash. The likelihood of surviving a crash, and possibly avoiding debilitating injuries, can be increased by the simple task of buckling a safety belt.
Performance measure target: The goal of this measure is to increase safety belt use to 92 percent for all passenger vehicle occupants by 2020.
Figure: Percent of vehicle occupants wearing a safety belt
How do we measure it? Using guidelines developed by the National Highway Traffic Safety Administration (NHTSA), the department conducts an annual seat belt use survey in conjunction with the annual Click It or Ticket seat belt enforcement mobilization conducted each spring. The survey data presents a statistically representative sample of the percentage of safety belt use in Wisconsin.
How are we doing? Safety belt use reached 89.4 percent in 2017, an all-time high for safety belt usage in Wisconsin. That means that approximately one in ten motorists are still not buckling up—putting themselves and others at risk of serious injury or death in the event of a crash. Wisconsin is approaching the 90.1 percent national average for safety belt use but still lags behind the safety belt use of neighboring states like Illinois and Michigan, which estimate safety belt use rates of more than 90 percent.
What factors affect results? Human behavior is the most important factor that affects safety belt use results. Consistent safety belt use saves lives and motorists need to be proactive in buckling their safety belts every time, on every trip, to promote their safety and the safety of others. Safety belt use is a law in the state of Wisconsin. Since 2009, it is a primary enforcement law, which means law enforcement officers can pull over and cite a motorist for not wearing a safety belt.
What are we doing to improve? The department promotes safety belt use through education and enforcement. The nationwide Click It or Ticket effort, in conjunction with NHTSA, utilizes paid advertising and enforcement to promote public awareness. Much of the educational efforts are targeted at younger drivers whose safety belt use is much lower than other age groups. The department also supports car seat fitting stations to ensure that parents and providers are instructed on how to properly install child car seats and booster seats to keep small children safe in vehicles and training instructors on safety seat installment. By buckling their safety belt every time they get in a vehicle, motorists ensure their own personal safety, as well as the safety of passengers. A NHTSA study estimates that safety belt compliance increases three percent when the penalty for not wearing a safety belt is raised from $5 to $25. By increasing the forfeiture from $10 to $25 as DOT has requested for the 2017 biennial budget, Wisconsin would expect a similar increase in compliance.
60%
65%
70%
75%
80%
85%
90%
95%
100%
201720162015201420132012
Perc
ent
Calendar Year (January–December)
85.8%84.7%82.4%
88.4% 89.4%
79.9%
TARGET
23
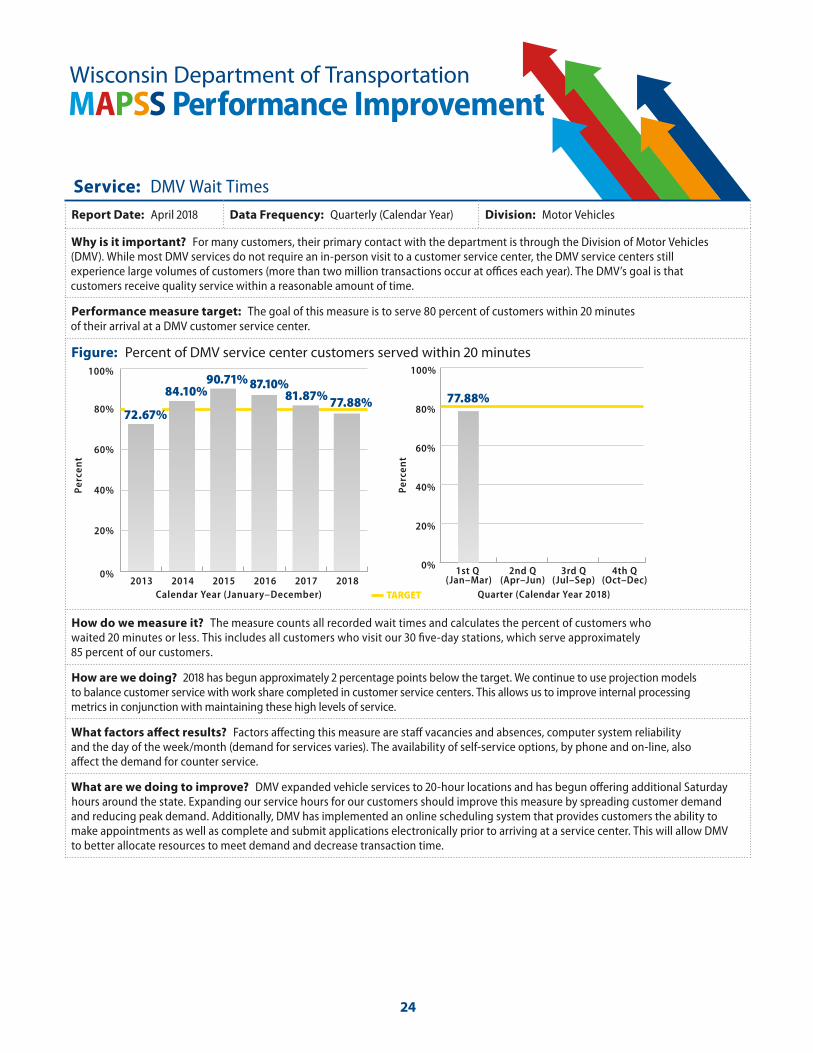
Wisconsin Department of TransportationMAPSS Performance Improvement
Service: DMV Wait Times
Report Date: April 2018 Data Frequency: Quarterly (Calendar Year) Division: Motor Vehicles
Why is it important? For many customers, their primary contact with the department is through the Division of Motor Vehicles (DMV). While most DMV services do not require an in-person visit to a customer service center, the DMV service centers still experience large volumes of customers (more than two million transactions occur at offices each year). The DMV’s goal is that customers receive quality service within a reasonable amount of time.
Performance measure target: The goal of this measure is to serve 80 percent of customers within 20 minutes of their arrival at a DMV customer service center.
Figure: Percent of DMV service center customers served within 20 minutes
How do we measure it? The measure counts all recorded wait times and calculates the percent of customers who waited 20 minutes or less. This includes all customers who visit our 30 five-day stations, which serve approximately 85 percent of our customers.
How are we doing? 2018 has begun approximately 2 percentage points below the target. We continue to use projection models to balance customer service with work share completed in customer service centers. This allows us to improve internal processing metrics in conjunction with maintaining these high levels of service.
What factors affect results? Factors affecting this measure are staff vacancies and absences, computer system reliability and the day of the week/month (demand for services varies). The availability of self-service options, by phone and on-line, also affect the demand for counter service.
What are we doing to improve? DMV expanded vehicle services to 20-hour locations and has begun offering additional Saturday hours around the state. Expanding our service hours for our customers should improve this measure by spreading customer demand and reducing peak demand. Additionally, DMV has implemented an online scheduling system that provides customers the ability to make appointments as well as complete and submit applications electronically prior to arriving at a service center. This will allow DMV to better allocate resources to meet demand and decrease transaction time.
TARGET
0%
20%
40%
60%
80%
100%
4th Q(Oct–Dec)
3rd Q(Jul–Sep)
2nd Q(Apr–Jun)
1st Q (Jan–Mar)
Perc
ent
Quarter (Calendar Year 2018)
0%
20%
40%
60%
80%
100%
201820172016201520142013
Perc
ent
Calendar Year (January–December)
90.71%77.88%
72.67%77.88%
84.10% 87.10%81.87%
24
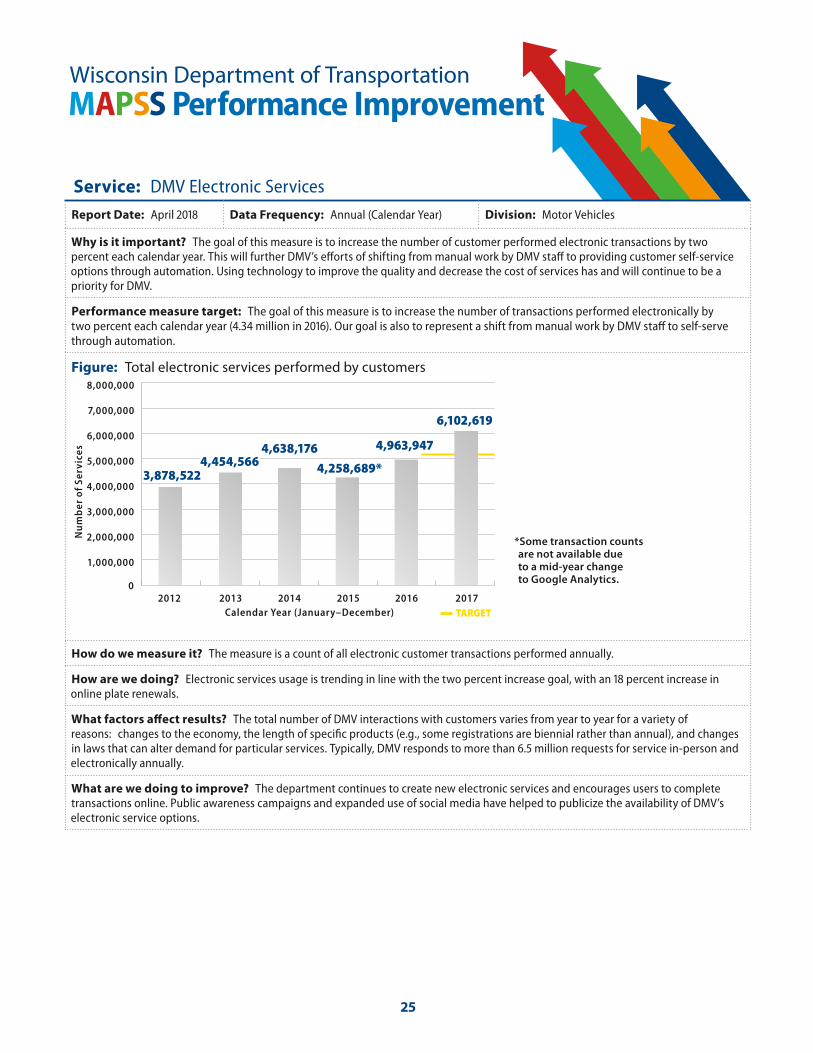
Wisconsin Department of TransportationMAPSS Performance Improvement
Service: DMV Electronic Services
Report Date: April 2018 Data Frequency: Annual (Calendar Year) Division: Motor Vehicles
Why is it important? The goal of this measure is to increase the number of customer performed electronic transactions by two percent each calendar year. This will further DMV’s efforts of shifting from manual work by DMV staff to providing customer self-service options through automation. Using technology to improve the quality and decrease the cost of services has and will continue to be a priority for DMV.
Performance measure target: The goal of this measure is to increase the number of transactions performed electronically by two percent each calendar year (4.34 million in 2016). Our goal is also to represent a shift from manual work by DMV staff to self-serve through automation.
Figure: Total electronic services performed by customers
How do we measure it? The measure is a count of all electronic customer transactions performed annually.
How are we doing? Electronic services usage is trending in line with the two percent increase goal, with an 18 percent increase in online plate renewals.
What factors affect results? The total number of DMV interactions with customers varies from year to year for a variety of reasons: changes to the economy, the length of specific products (e.g., some registrations are biennial rather than annual), and changes in laws that can alter demand for particular services. Typically, DMV responds to more than 6.5 million requests for service in-person and electronically annually.
What are we doing to improve? The department continues to create new electronic services and encourages users to complete transactions online. Public awareness campaigns and expanded use of social media have helped to publicize the availability of DMV’s electronic service options.
0
1,000,000
2,000,000
3,000,000
4,000,000
5,000,000
6,000,000
7,000,000
8,000,000
201720162015201420132012
Nu
mb
er o
f Se
rvic
es
TARGET
6,102,619
Calendar Year (January–December)
3,878,5224,454,566
4,638,176
4,258,689*
4,963,947
*Some transaction counts are not available due to a mid-year change to Google Analytics.
25
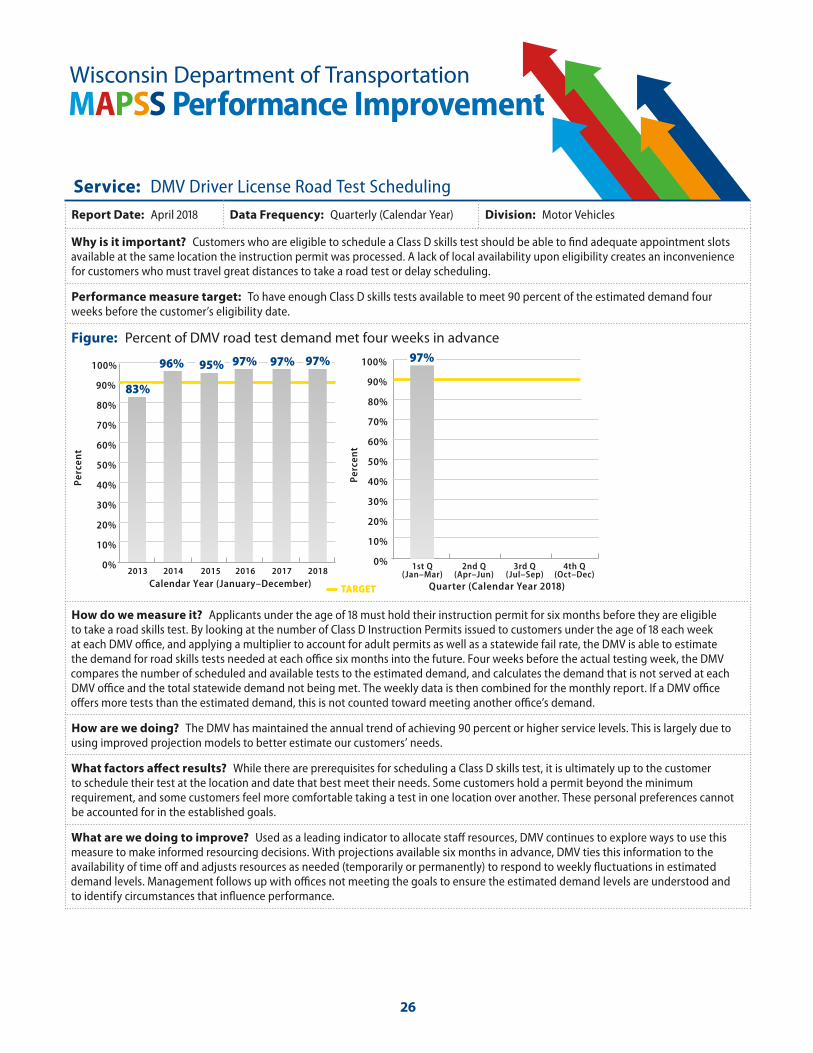
Wisconsin Department of TransportationMAPSS Performance Improvement
Service: DMV Driver License Road Test Scheduling
Report Date: April 2018 Data Frequency: Quarterly (Calendar Year) Division: Motor Vehicles
Why is it important? Customers who are eligible to schedule a Class D skills test should be able to find adequate appointment slots available at the same location the instruction permit was processed. A lack of local availability upon eligibility creates an inconvenience for customers who must travel great distances to take a road test or delay scheduling.
Performance measure target: To have enough Class D skills tests available to meet 90 percent of the estimated demand four weeks before the customer’s eligibility date.
Figure: Percent of DMV road test demand met four weeks in advance
How do we measure it? Applicants under the age of 18 must hold their instruction permit for six months before they are eligible to take a road skills test. By looking at the number of Class D Instruction Permits issued to customers under the age of 18 each week at each DMV office, and applying a multiplier to account for adult permits as well as a statewide fail rate, the DMV is able to estimate the demand for road skills tests needed at each office six months into the future. Four weeks before the actual testing week, the DMV compares the number of scheduled and available tests to the estimated demand, and calculates the demand that is not served at each DMV office and the total statewide demand not being met. The weekly data is then combined for the monthly report. If a DMV office offers more tests than the estimated demand, this is not counted toward meeting another office’s demand.
How are we doing? The DMV has maintained the annual trend of achieving 90 percent or higher service levels. This is largely due to using improved projection models to better estimate our customers’ needs.
What factors affect results? While there are prerequisites for scheduling a Class D skills test, it is ultimately up to the customer to schedule their test at the location and date that best meet their needs. Some customers hold a permit beyond the minimum requirement, and some customers feel more comfortable taking a test in one location over another. These personal preferences cannot be accounted for in the established goals.
What are we doing to improve? Used as a leading indicator to allocate staff resources, DMV continues to explore ways to use this measure to make informed resourcing decisions. With projections available six months in advance, DMV ties this information to the availability of time off and adjusts resources as needed (temporarily or permanently) to respond to weekly fluctuations in estimated demand levels. Management follows up with offices not meeting the goals to ensure the estimated demand levels are understood and to identify circumstances that influence performance.
TARGET
0%
10%
20%
30%
40%
50%
60%
70%
80%
90%
100%
201820172016201520142013
Perc
ent
Quarter (Calendar Year 2018)
83%
0%
10%
20%
30%
40%
50%
60%
70%
80%
90%
100%
4th Q(Oct–Dec)
3rd Q(Jul–Sep)
2nd Q(Apr–Jun)
1st Q(Jan–Mar)
Perc
ent
Calendar Year (January–December)
96% 95% 97% 97%97% 97%
26
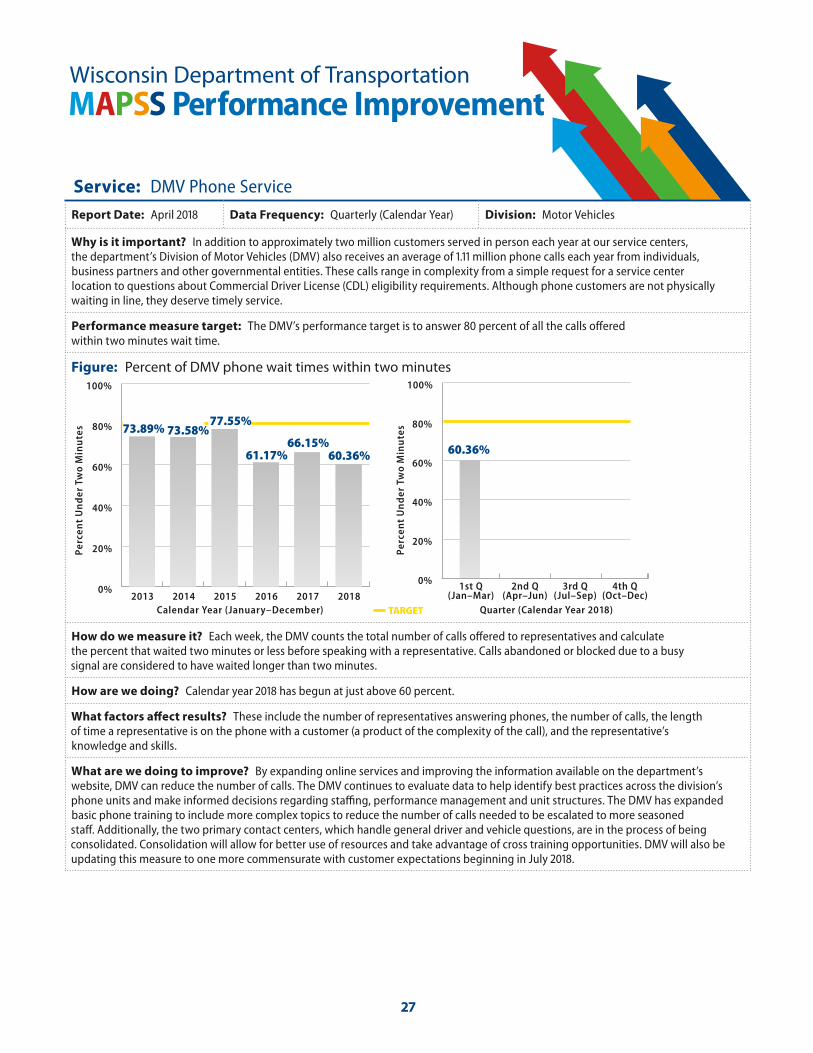
Wisconsin Department of TransportationMAPSS Performance Improvement
Service: DMV Phone Service
Report Date: April 2018 Data Frequency: Quarterly (Calendar Year) Division: Motor Vehicles
Why is it important? In addition to approximately two million customers served in person each year at our service centers, the department’s Division of Motor Vehicles (DMV) also receives an average of 1.11 million phone calls each year from individuals, business partners and other governmental entities. These calls range in complexity from a simple request for a service center location to questions about Commercial Driver License (CDL) eligibility requirements. Although phone customers are not physically waiting in line, they deserve timely service.
Performance measure target: The DMV’s performance target is to answer 80 percent of all the calls offered within two minutes wait time.
Figure: Percent of DMV phone wait times within two minutes
How do we measure it? Each week, the DMV counts the total number of calls offered to representatives and calculate the percent that waited two minutes or less before speaking with a representative. Calls abandoned or blocked due to a busy signal are considered to have waited longer than two minutes.
How are we doing? Calendar year 2018 has begun at just above 60 percent.
What factors affect results? These include the number of representatives answering phones, the number of calls, the length of time a representative is on the phone with a customer (a product of the complexity of the call), and the representative’s knowledge and skills.
What are we doing to improve? By expanding online services and improving the information available on the department’s website, DMV can reduce the number of calls. The DMV continues to evaluate data to help identify best practices across the division’s phone units and make informed decisions regarding staffing, performance management and unit structures. The DMV has expanded basic phone training to include more complex topics to reduce the number of calls needed to be escalated to more seasoned staff. Additionally, the two primary contact centers, which handle general driver and vehicle questions, are in the process of being consolidated. Consolidation will allow for better use of resources and take advantage of cross training opportunities. DMV will also be updating this measure to one more commensurate with customer expectations beginning in July 2018.
TARGET
0%
20%
40%
60%
80%
100%
4th Q(Oct–Dec)
3rd Q(Jul–Sep)
2nd Q(Apr–Jun)
1st Q(Jan–Mar)
Perc
ent
Un
der
Tw
o M
inu
tes
Quarter (Calendar Year 2018)
0%
20%
40%
60%
80%
100%
201820172016201520142013
Perc
ent
Un
der
Tw
o M
inu
tes
Calendar Year (January–December)
77.55%
61.17%66.15% 60.36%
73.89%
60.36%
73.58%
27
Wisconsin Department of Transportation
MAPSS Performance Improvement
Appendix A: Additional Performance Measures
Mobility
Accountability Damage Claims Collections 29 Design On Time (Local System) 30 DMV Efficiency 31
Preservation Local Bridge Condition 32
Safety Air Support Unit Deployments for Traffic Enforcement 33 Annual Worker Compensation Claims 34 Annual Worker Compensation Lost Time Claims 35 Average Worker Compensation Claim Cost 36 Safety and Weight Enforcement Facilities (SWEFs) 37
Service
28
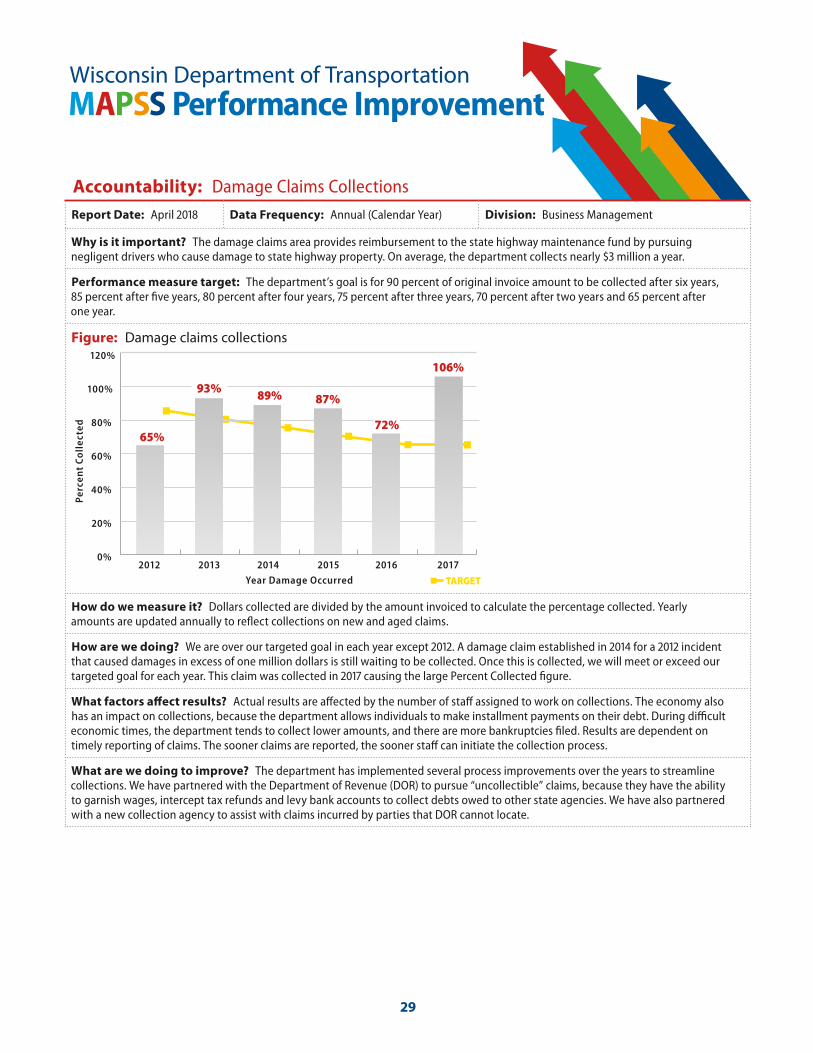
Wisconsin Department of TransportationMAPSS Performance Improvement
Accountability: Damage Claims Collections
Report Date: April 2018 Data Frequency: Annual (Calendar Year) Division: Business Management
Why is it important? The damage claims area provides reimbursement to the state highway maintenance fund by pursuing negligent drivers who cause damage to state highway property. On average, the department collects nearly $3 million a year.
Performance measure target: The department’s goal is for 90 percent of original invoice amount to be collected after six years, 85 percent after five years, 80 percent after four years, 75 percent after three years, 70 percent after two years and 65 percent after one year.
Figure: Damage claims collections
How do we measure it? Dollars collected are divided by the amount invoiced to calculate the percentage collected. Yearly amounts are updated annually to reflect collections on new and aged claims.
How are we doing? We are over our targeted goal in each year except 2012. A damage claim established in 2014 for a 2012 incident that caused damages in excess of one million dollars is still waiting to be collected. Once this is collected, we will meet or exceed our targeted goal for each year. This claim was collected in 2017 causing the large Percent Collected figure.
What factors affect results? Actual results are affected by the number of staff assigned to work on collections. The economy also has an impact on collections, because the department allows individuals to make installment payments on their debt. During difficult economic times, the department tends to collect lower amounts, and there are more bankruptcies filed. Results are dependent on timely reporting of claims. The sooner claims are reported, the sooner staff can initiate the collection process.
What are we doing to improve? The department has implemented several process improvements over the years to streamline collections. We have partnered with the Department of Revenue (DOR) to pursue “uncollectible” claims, because they have the ability to garnish wages, intercept tax refunds and levy bank accounts to collect debts owed to other state agencies. We have also partnered with a new collection agency to assist with claims incurred by parties that DOR cannot locate.
0%
20%
40%
60%
80%
100%
120%
201720162015201420132012
Perc
ent
Coll
ecte
d
Year Damage Occurred
106%
89%
72%
87%
65%
93%
TARGET
29
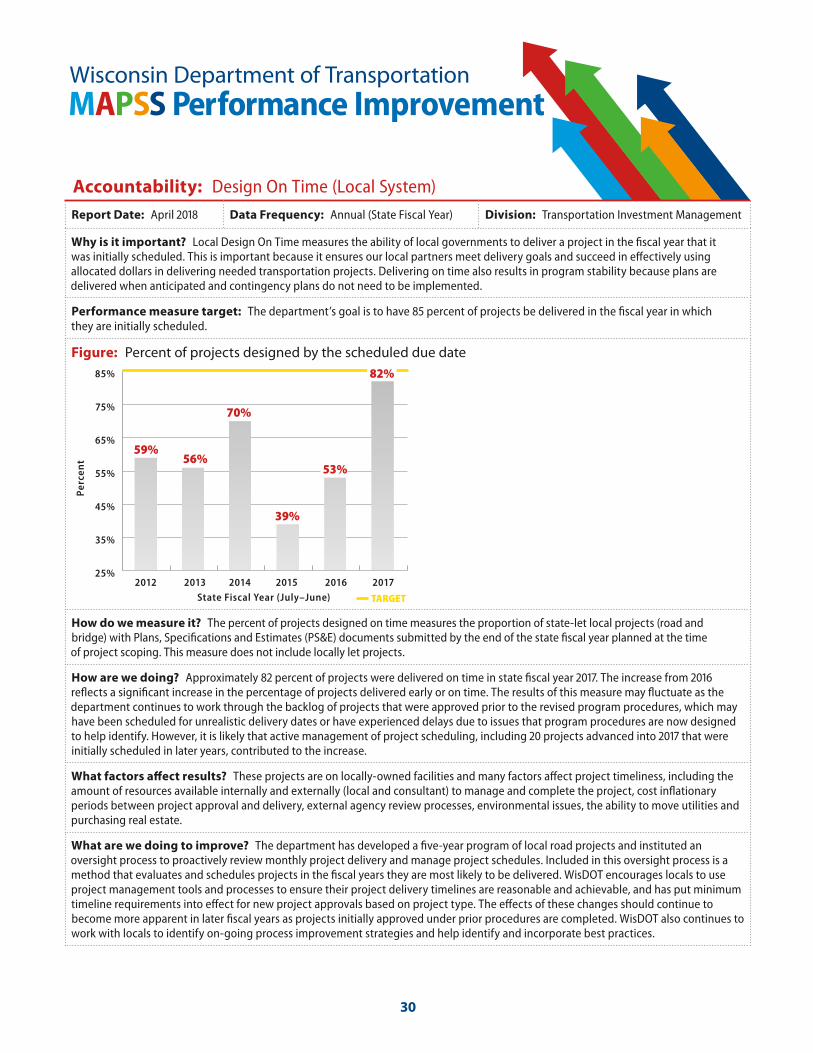
Wisconsin Department of TransportationMAPSS Performance Improvement
Accountability: Design On Time (Local System)
Report Date: April 2018 Data Frequency: Annual (State Fiscal Year) Division: Transportation Investment Management
Why is it important? Local Design On Time measures the ability of local governments to deliver a project in the fiscal year that it was initially scheduled. This is important because it ensures our local partners meet delivery goals and succeed in effectively using allocated dollars in delivering needed transportation projects. Delivering on time also results in program stability because plans are delivered when anticipated and contingency plans do not need to be implemented.
Performance measure target: The department’s goal is to have 85 percent of projects be delivered in the fiscal year in which they are initially scheduled.
Figure: Percent of projects designed by the scheduled due date
How do we measure it? The percent of projects designed on time measures the proportion of state-let local projects (road and bridge) with Plans, Specifications and Estimates (PS&E) documents submitted by the end of the state fiscal year planned at the time of project scoping. This measure does not include locally let projects.
How are we doing? Approximately 82 percent of projects were delivered on time in state fiscal year 2017. The increase from 2016 reflects a significant increase in the percentage of projects delivered early or on time. The results of this measure may fluctuate as the department continues to work through the backlog of projects that were approved prior to the revised program procedures, which may have been scheduled for unrealistic delivery dates or have experienced delays due to issues that program procedures are now designed to help identify. However, it is likely that active management of project scheduling, including 20 projects advanced into 2017 that were initially scheduled in later years, contributed to the increase.
What factors affect results? These projects are on locally-owned facilities and many factors affect project timeliness, including the amount of resources available internally and externally (local and consultant) to manage and complete the project, cost inflationary periods between project approval and delivery, external agency review processes, environmental issues, the ability to move utilities and purchasing real estate.
What are we doing to improve? The department has developed a five-year program of local road projects and instituted an oversight process to proactively review monthly project delivery and manage project schedules. Included in this oversight process is a method that evaluates and schedules projects in the fiscal years they are most likely to be delivered. WisDOT encourages locals to use project management tools and processes to ensure their project delivery timelines are reasonable and achievable, and has put minimum timeline requirements into effect for new project approvals based on project type. The effects of these changes should continue to become more apparent in later fiscal years as projects initially approved under prior procedures are completed. WisDOT also continues to work with locals to identify on-going process improvement strategies and help identify and incorporate best practices.
25%
35%
45%
55%
65%
75%
85%
201720162015201420132012
Perc
ent
State Fiscal Year (July–June)
56%
70%
59%
TARGET
39%
53%
82%
30
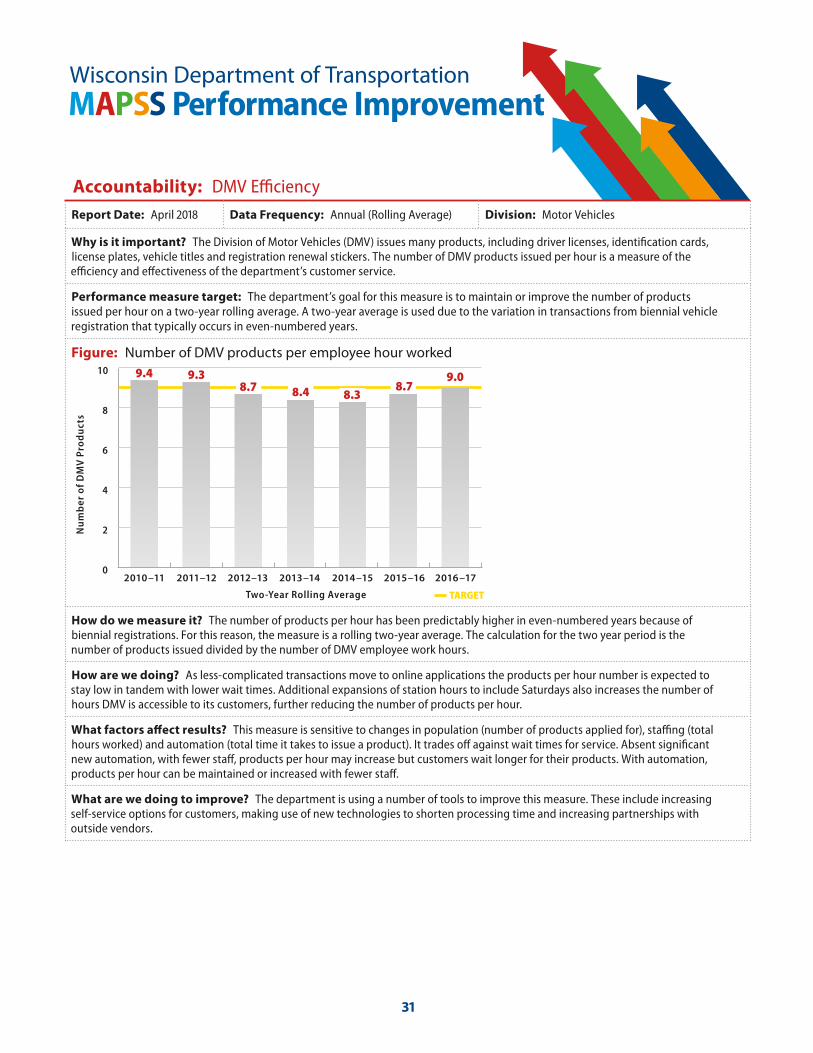
Wisconsin Department of TransportationMAPSS Performance Improvement
Accountability: DMV Efficiency
Report Date: April 2018 Data Frequency: Annual (Rolling Average) Division: Motor Vehicles
Why is it important? The Division of Motor Vehicles (DMV) issues many products, including driver licenses, identification cards, license plates, vehicle titles and registration renewal stickers. The number of DMV products issued per hour is a measure of the efficiency and effectiveness of the department’s customer service.
Performance measure target: The department’s goal for this measure is to maintain or improve the number of products issued per hour on a two-year rolling average. A two-year average is used due to the variation in transactions from biennial vehicle registration that typically occurs in even-numbered years.
Figure: Number of DMV products per employee hour worked
How do we measure it? The number of products per hour has been predictably higher in even-numbered years because of biennial registrations. For this reason, the measure is a rolling two-year average. The calculation for the two year period is the number of products issued divided by the number of DMV employee work hours.
How are we doing? As less-complicated transactions move to online applications the products per hour number is expected to stay low in tandem with lower wait times. Additional expansions of station hours to include Saturdays also increases the number of hours DMV is accessible to its customers, further reducing the number of products per hour.
What factors affect results? This measure is sensitive to changes in population (number of products applied for), staffing (total hours worked) and automation (total time it takes to issue a product). It trades off against wait times for service. Absent significant new automation, with fewer staff, products per hour may increase but customers wait longer for their products. With automation, products per hour can be maintained or increased with fewer staff.
What are we doing to improve? The department is using a number of tools to improve this measure. These include increasing self-service options for customers, making use of new technologies to shorten processing time and increasing partnerships with outside vendors.
0
2
4
6
8
10
2016–172015–162014–152013–142012–132011–122010–11
Nu
mb
er o
f D
MV
Pro
du
cts
Two-Year Rolling Average
8.38.78.7
9.4 9.3
TARGET
9.08.4
31
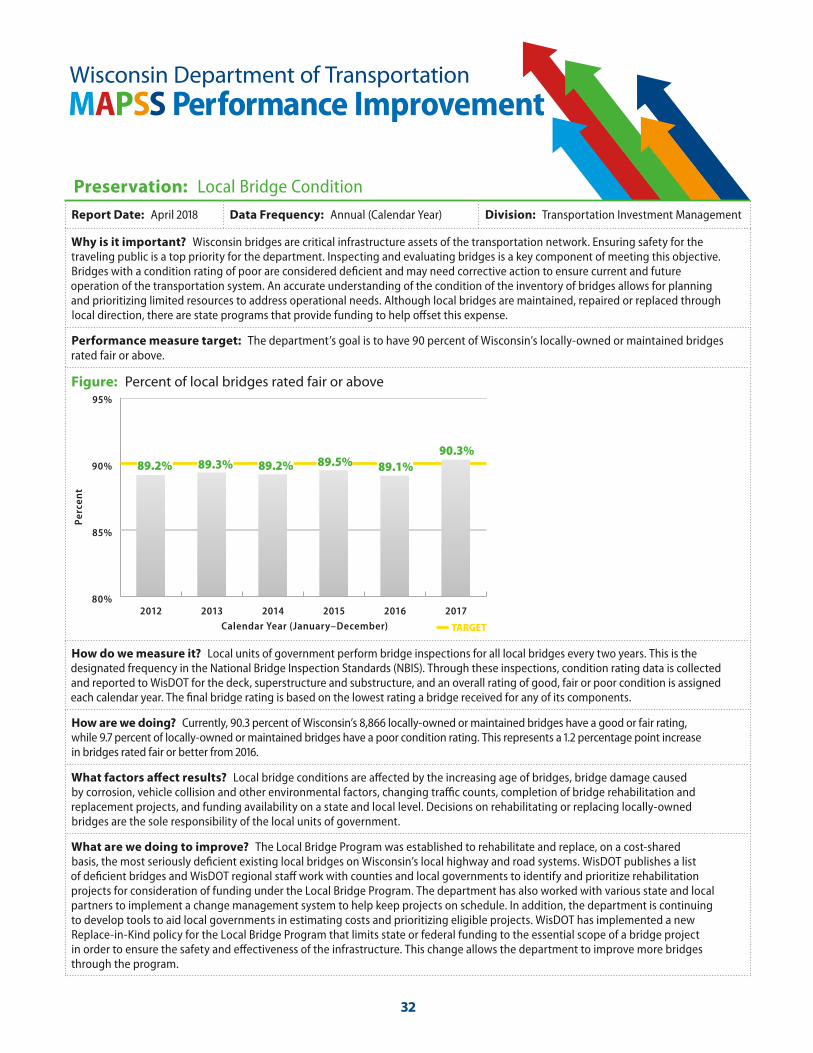
Wisconsin Department of TransportationMAPSS Performance Improvement
Preservation: Local Bridge Condition
Report Date: April 2018 Data Frequency: Annual (Calendar Year) Division: Transportation Investment Management
Why is it important? Wisconsin bridges are critical infrastructure assets of the transportation network. Ensuring safety for the traveling public is a top priority for the department. Inspecting and evaluating bridges is a key component of meeting this objective. Bridges with a condition rating of poor are considered deficient and may need corrective action to ensure current and future operation of the transportation system. An accurate understanding of the condition of the inventory of bridges allows for planning and prioritizing limited resources to address operational needs. Although local bridges are maintained, repaired or replaced through local direction, there are state programs that provide funding to help offset this expense.
Performance measure target: The department’s goal is to have 90 percent of Wisconsin’s locally-owned or maintained bridges rated fair or above.
Figure: Percent of local bridges rated fair or above
How do we measure it? Local units of government perform bridge inspections for all local bridges every two years. This is the designated frequency in the National Bridge Inspection Standards (NBIS). Through these inspections, condition rating data is collected and reported to WisDOT for the deck, superstructure and substructure, and an overall rating of good, fair or poor condition is assigned each calendar year. The final bridge rating is based on the lowest rating a bridge received for any of its components.
How are we doing? Currently, 90.3 percent of Wisconsin’s 8,866 locally-owned or maintained bridges have a good or fair rating, while 9.7 percent of locally-owned or maintained bridges have a poor condition rating. This represents a 1.2 percentage point increase in bridges rated fair or better from 2016.
What factors affect results? Local bridge conditions are affected by the increasing age of bridges, bridge damage caused by corrosion, vehicle collision and other environmental factors, changing traffic counts, completion of bridge rehabilitation and replacement projects, and funding availability on a state and local level. Decisions on rehabilitating or replacing locally-owned bridges are the sole responsibility of the local units of government.
What are we doing to improve? The Local Bridge Program was established to rehabilitate and replace, on a cost-shared basis, the most seriously deficient existing local bridges on Wisconsin’s local highway and road systems. WisDOT publishes a list of deficient bridges and WisDOT regional staff work with counties and local governments to identify and prioritize rehabilitation projects for consideration of funding under the Local Bridge Program. The department has also worked with various state and local partners to implement a change management system to help keep projects on schedule. In addition, the department is continuing to develop tools to aid local governments in estimating costs and prioritizing eligible projects. WisDOT has implemented a new Replace-in-Kind policy for the Local Bridge Program that limits state or federal funding to the essential scope of a bridge project in order to ensure the safety and effectiveness of the infrastructure. This change allows the department to improve more bridges through the program.
80%
85%
90%
95%
201720162015201420132012
89.5% 89.1%90.3%
89.2% 89.3% 89.2%
Perc
ent
Calendar Year (January–December) TARGET
32
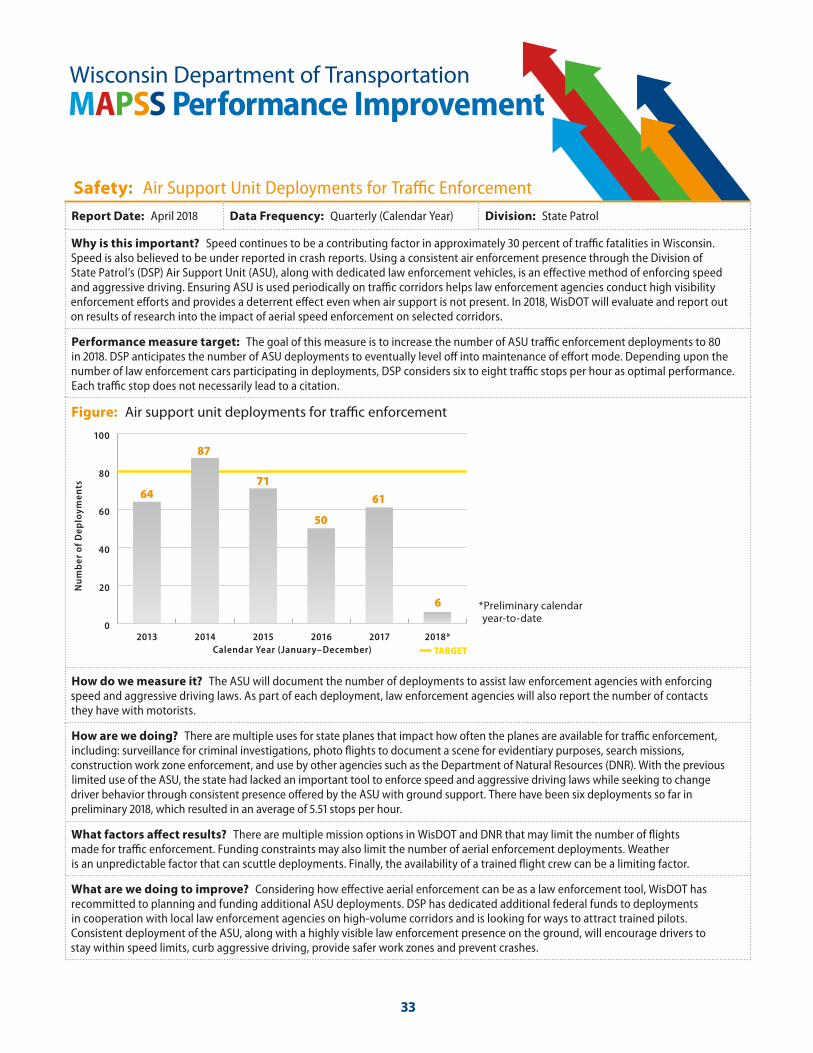
Wisconsin Department of TransportationMAPSS Performance Improvement
Safety: Air Support Unit Deployments for Traffic Enforcement
Report Date: April 2018 Data Frequency: Quarterly (Calendar Year) Division: State Patrol
Why is this important? Speed continues to be a contributing factor in approximately 30 percent of traffic fatalities in Wisconsin. Speed is also believed to be under reported in crash reports. Using a consistent air enforcement presence through the Division of State Patrol’s (DSP) Air Support Unit (ASU), along with dedicated law enforcement vehicles, is an effective method of enforcing speed and aggressive driving. Ensuring ASU is used periodically on traffic corridors helps law enforcement agencies conduct high visibility enforcement efforts and provides a deterrent effect even when air support is not present. In 2018, WisDOT will evaluate and report out on results of research into the impact of aerial speed enforcement on selected corridors.
Performance measure target: The goal of this measure is to increase the number of ASU traffic enforcement deployments to 80 in 2018. DSP anticipates the number of ASU deployments to eventually level off into maintenance of effort mode. Depending upon the number of law enforcement cars participating in deployments, DSP considers six to eight traffic stops per hour as optimal performance. Each traffic stop does not necessarily lead to a citation.
Figure: Air support unit deployments for traffic enforcement
How do we measure it? The ASU will document the number of deployments to assist law enforcement agencies with enforcing speed and aggressive driving laws. As part of each deployment, law enforcement agencies will also report the number of contacts they have with motorists.
How are we doing? There are multiple uses for state planes that impact how often the planes are available for traffic enforcement, including: surveillance for criminal investigations, photo flights to document a scene for evidentiary purposes, search missions, construction work zone enforcement, and use by other agencies such as the Department of Natural Resources (DNR). With the previous limited use of the ASU, the state had lacked an important tool to enforce speed and aggressive driving laws while seeking to change driver behavior through consistent presence offered by the ASU with ground support. There have been six deployments so far in preliminary 2018, which resulted in an average of 5.51 stops per hour.
What factors affect results? There are multiple mission options in WisDOT and DNR that may limit the number of flights made for traffic enforcement. Funding constraints may also limit the number of aerial enforcement deployments. Weather is an unpredictable factor that can scuttle deployments. Finally, the availability of a trained flight crew can be a limiting factor.
What are we doing to improve? Considering how effective aerial enforcement can be as a law enforcement tool, WisDOT has recommitted to planning and funding additional ASU deployments. DSP has dedicated additional federal funds to deployments in cooperation with local law enforcement agencies on high-volume corridors and is looking for ways to attract trained pilots. Consistent deployment of the ASU, along with a highly visible law enforcement presence on the ground, will encourage drivers to stay within speed limits, curb aggressive driving, provide safer work zones and prevent crashes.
0
20
40
60
80
100
2018*20172016201520142013
Nu
mb
er o
f D
eplo
ymen
ts
Calendar Year (January–December)
50
71
61
6
TARGET
64
87
*Preliminary calendar year-to-date
33
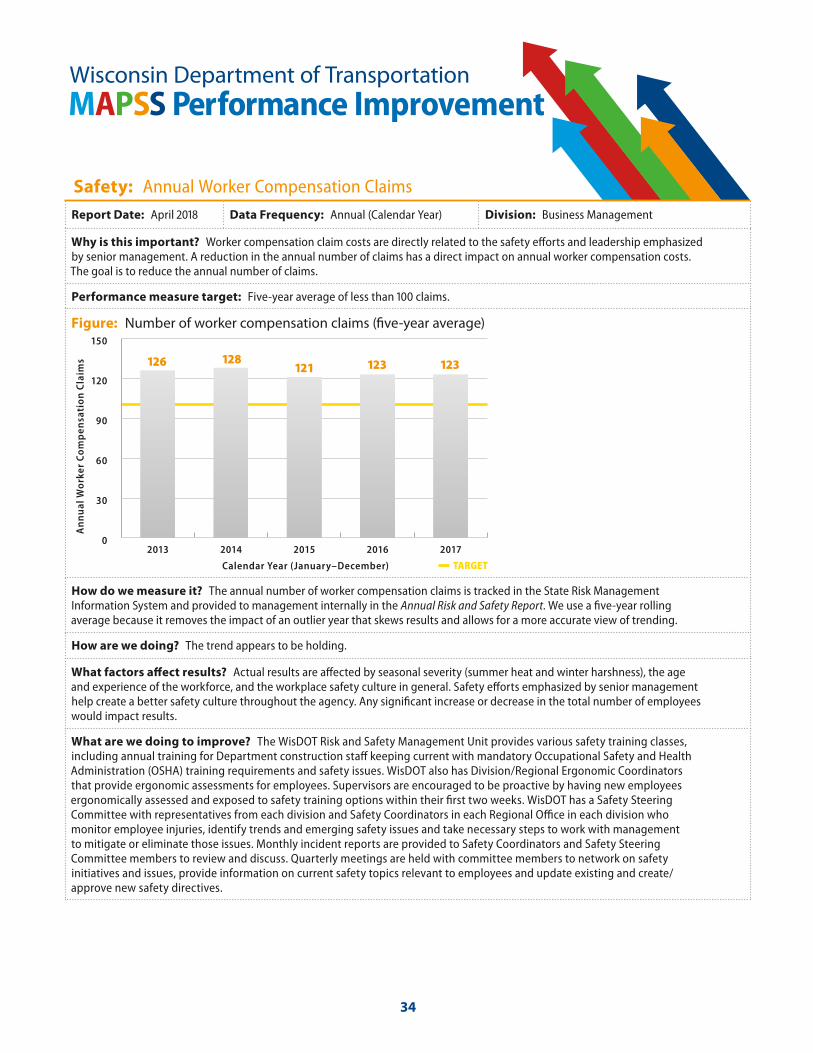
Wisconsin Department of TransportationMAPSS Performance Improvement
Safety: Annual Worker Compensation Claims
Report Date: April 2018 Data Frequency: Annual (Calendar Year) Division: Business Management
Why is this important? Worker compensation claim costs are directly related to the safety efforts and leadership emphasized by senior management. A reduction in the annual number of claims has a direct impact on annual worker compensation costs. The goal is to reduce the annual number of claims.
Performance measure target: Five-year average of less than 100 claims.
Figure: Number of worker compensation claims (five-year average)
How do we measure it? The annual number of worker compensation claims is tracked in the State Risk Management Information System and provided to management internally in the Annual Risk and Safety Report. We use a five-year rolling average because it removes the impact of an outlier year that skews results and allows for a more accurate view of trending.
How are we doing? The trend appears to be holding.
What factors affect results? Actual results are affected by seasonal severity (summer heat and winter harshness), the age and experience of the workforce, and the workplace safety culture in general. Safety efforts emphasized by senior management help create a better safety culture throughout the agency. Any significant increase or decrease in the total number of employees would impact results.
What are we doing to improve? The WisDOT Risk and Safety Management Unit provides various safety training classes, including annual training for Department construction staff keeping current with mandatory Occupational Safety and Health Administration (OSHA) training requirements and safety issues. WisDOT also has Division/Regional Ergonomic Coordinators that provide ergonomic assessments for employees. Supervisors are encouraged to be proactive by having new employees ergonomically assessed and exposed to safety training options within their first two weeks. WisDOT has a Safety Steering Committee with representatives from each division and Safety Coordinators in each Regional Office in each division who monitor employee injuries, identify trends and emerging safety issues and take necessary steps to work with management to mitigate or eliminate those issues. Monthly incident reports are provided to Safety Coordinators and Safety Steering Committee members to review and discuss. Quarterly meetings are held with committee members to network on safety initiatives and issues, provide information on current safety topics relevant to employees and update existing and create/approve new safety directives.
0
30
60
90
120
150
20172016201520142013
An
nu
al W
ork
er C
om
pen
sati
on
Cla
ims
Calendar Year (January–December)
128
TARGET
121 123 123126
34
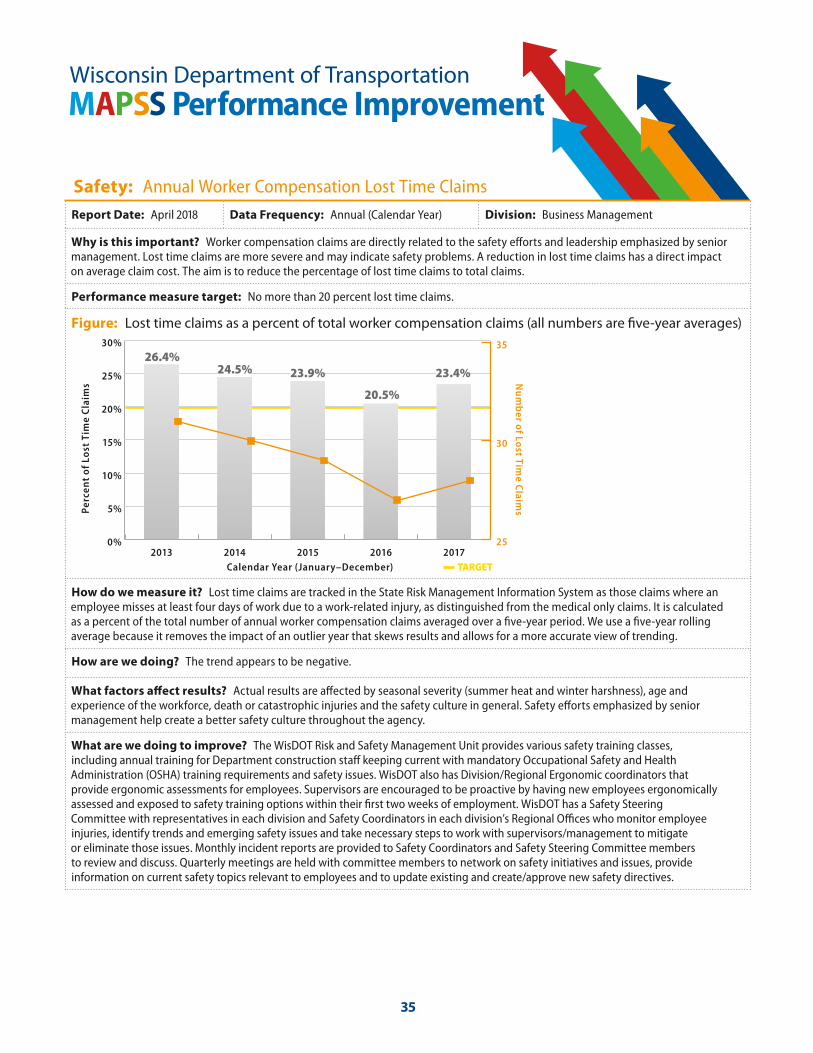
Wisconsin Department of TransportationMAPSS Performance Improvement
Safety: Annual Worker Compensation Lost Time Claims
Report Date: April 2018 Data Frequency: Annual (Calendar Year) Division: Business Management
Why is this important? Worker compensation claims are directly related to the safety efforts and leadership emphasized by senior management. Lost time claims are more severe and may indicate safety problems. A reduction in lost time claims has a direct impact on average claim cost. The aim is to reduce the percentage of lost time claims to total claims.
Performance measure target: No more than 20 percent lost time claims.
Figure: Lost time claims as a percent of total worker compensation claims (all numbers are five-year averages)
How do we measure it? Lost time claims are tracked in the State Risk Management Information System as those claims where an employee misses at least four days of work due to a work-related injury, as distinguished from the medical only claims. It is calculated as a percent of the total number of annual worker compensation claims averaged over a five-year period. We use a five-year rolling average because it removes the impact of an outlier year that skews results and allows for a more accurate view of trending.
How are we doing? The trend appears to be negative.
What factors affect results? Actual results are affected by seasonal severity (summer heat and winter harshness), age and experience of the workforce, death or catastrophic injuries and the safety culture in general. Safety efforts emphasized by senior management help create a better safety culture throughout the agency.
What are we doing to improve? The WisDOT Risk and Safety Management Unit provides various safety training classes, including annual training for Department construction staff keeping current with mandatory Occupational Safety and Health Administration (OSHA) training requirements and safety issues. WisDOT also has Division/Regional Ergonomic coordinators that provide ergonomic assessments for employees. Supervisors are encouraged to be proactive by having new employees ergonomically assessed and exposed to safety training options within their first two weeks of employment. WisDOT has a Safety Steering Committee with representatives in each division and Safety Coordinators in each division’s Regional Offices who monitor employee injuries, identify trends and emerging safety issues and take necessary steps to work with supervisors/management to mitigate or eliminate those issues. Monthly incident reports are provided to Safety Coordinators and Safety Steering Committee members to review and discuss. Quarterly meetings are held with committee members to network on safety initiatives and issues, provide information on current safety topics relevant to employees and to update existing and create/approve new safety directives.
0%
5%
10%
15%
20%
25%
30%
20172016201520142013
Perc
ent
of
Lost
Tim
e C
laim
s
Calendar Year (January–December)
24.5%
TARGET
20.5%
23.9% 23.4%26.4%
Nu
mb
er of Lost Tim
e Claim
s
25
30
35
35
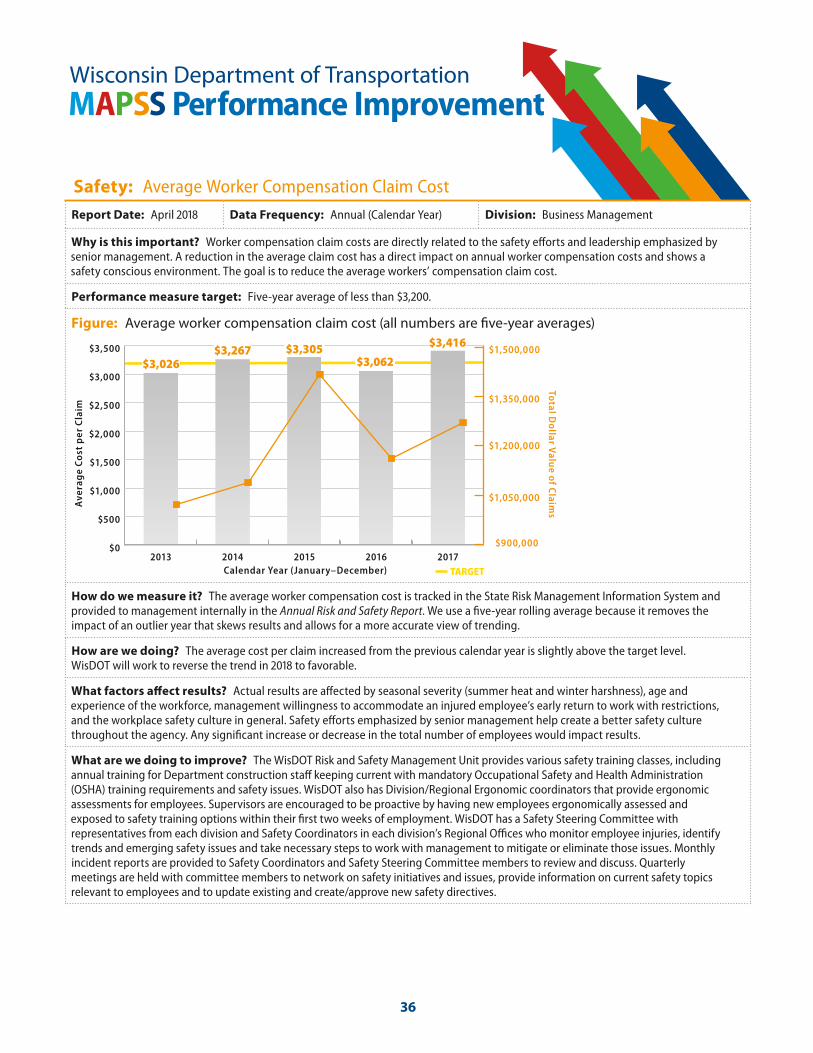
Wisconsin Department of TransportationMAPSS Performance Improvement
Safety: Average Worker Compensation Claim Cost
Report Date: April 2018 Data Frequency: Annual (Calendar Year) Division: Business Management
Why is this important? Worker compensation claim costs are directly related to the safety efforts and leadership emphasized by senior management. A reduction in the average claim cost has a direct impact on annual worker compensation costs and shows a safety conscious environment. The goal is to reduce the average workers’ compensation claim cost.
Performance measure target: Five-year average of less than $3,200.
Figure: Average worker compensation claim cost (all numbers are five-year averages)
How do we measure it? The average worker compensation cost is tracked in the State Risk Management Information System and provided to management internally in the Annual Risk and Safety Report. We use a five-year rolling average because it removes the impact of an outlier year that skews results and allows for a more accurate view of trending.
How are we doing? The average cost per claim increased from the previous calendar year is slightly above the target level. WisDOT will work to reverse the trend in 2018 to favorable.
What factors affect results? Actual results are affected by seasonal severity (summer heat and winter harshness), age and experience of the workforce, management willingness to accommodate an injured employee’s early return to work with restrictions, and the workplace safety culture in general. Safety efforts emphasized by senior management help create a better safety culture throughout the agency. Any significant increase or decrease in the total number of employees would impact results.
What are we doing to improve? The WisDOT Risk and Safety Management Unit provides various safety training classes, including annual training for Department construction staff keeping current with mandatory Occupational Safety and Health Administration (OSHA) training requirements and safety issues. WisDOT also has Division/Regional Ergonomic coordinators that provide ergonomic assessments for employees. Supervisors are encouraged to be proactive by having new employees ergonomically assessed and exposed to safety training options within their first two weeks of employment. WisDOT has a Safety Steering Committee with representatives from each division and Safety Coordinators in each division’s Regional Offices who monitor employee injuries, identify trends and emerging safety issues and take necessary steps to work with management to mitigate or eliminate those issues. Monthly incident reports are provided to Safety Coordinators and Safety Steering Committee members to review and discuss. Quarterly meetings are held with committee members to network on safety initiatives and issues, provide information on current safety topics relevant to employees and to update existing and create/approve new safety directives.
$0
$500
$1,000
$1,500
$2,000
$2,500
$3,000
$3,500
20172016201520142013
Ave
rag
e Co
st p
er C
laim
Calendar Year (January–December) TARGET
$3,416
$3,026$3,267 $3,305
$3,062
Total Do
llar Valu
e of C
laims
$900,000
$1,050,000
$1,200,000
$1,350,000
$1,500,000
36
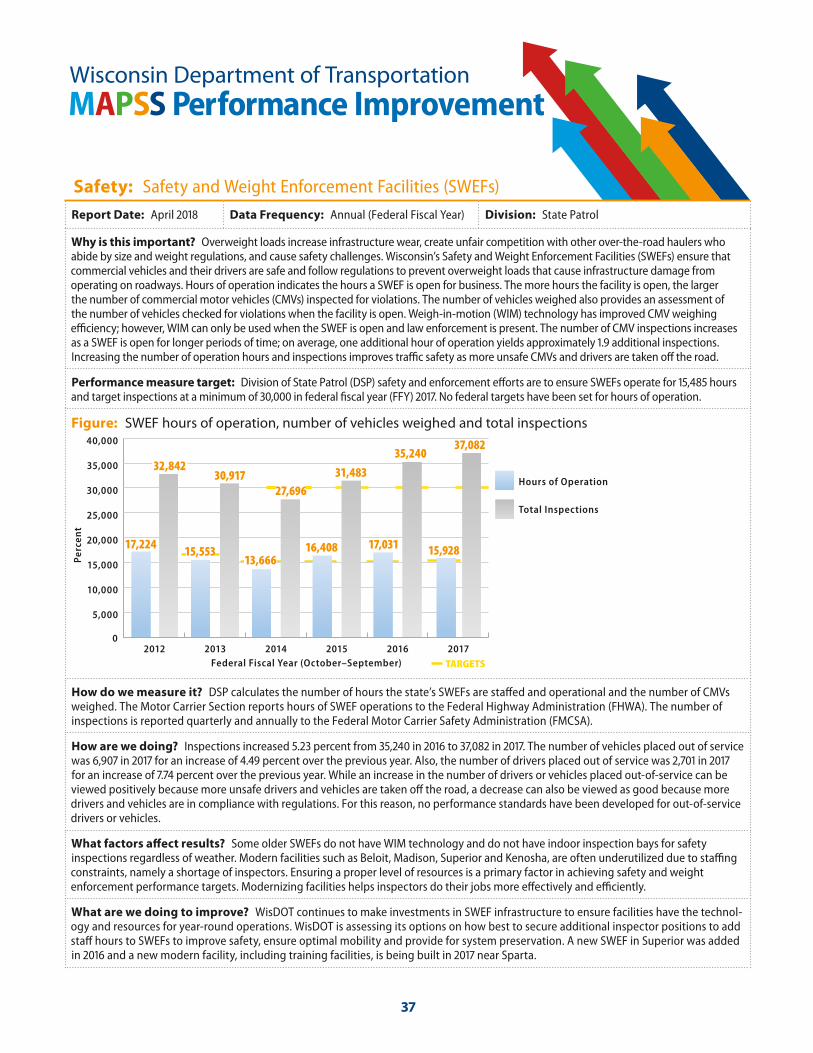
Wisconsin Department of TransportationMAPSS Performance Improvement
Safety: Safety and Weight Enforcement Facilities (SWEFs)
Report Date: April 2018 Data Frequency: Annual (Federal Fiscal Year) Division: State Patrol
Why is this important? Overweight loads increase infrastructure wear, create unfair competition with other over-the-road haulers who abide by size and weight regulations, and cause safety challenges. Wisconsin’s Safety and Weight Enforcement Facilities (SWEFs) ensure that commercial vehicles and their drivers are safe and follow regulations to prevent overweight loads that cause infrastructure damage from operating on roadways. Hours of operation indicates the hours a SWEF is open for business. The more hours the facility is open, the larger the number of commercial motor vehicles (CMVs) inspected for violations. The number of vehicles weighed also provides an assessment of the number of vehicles checked for violations when the facility is open. Weigh-in-motion (WIM) technology has improved CMV weighing efficiency; however, WIM can only be used when the SWEF is open and law enforcement is present. The number of CMV inspections increases as a SWEF is open for longer periods of time; on average, one additional hour of operation yields approximately 1.9 additional inspections. Increasing the number of operation hours and inspections improves traffic safety as more unsafe CMVs and drivers are taken off the road.
Performance measure target: Division of State Patrol (DSP) safety and enforcement efforts are to ensure SWEFs operate for 15,485 hours and target inspections at a minimum of 30,000 in federal fiscal year (FFY) 2017. No federal targets have been set for hours of operation.
Figure: SWEF hours of operation, number of vehicles weighed and total inspections
How do we measure it? DSP calculates the number of hours the state’s SWEFs are staffed and operational and the number of CMVs weighed. The Motor Carrier Section reports hours of SWEF operations to the Federal Highway Administration (FHWA). The number of inspections is reported quarterly and annually to the Federal Motor Carrier Safety Administration (FMCSA).
How are we doing? Inspections increased 5.23 percent from 35,240 in 2016 to 37,082 in 2017. The number of vehicles placed out of service was 6,907 in 2017 for an increase of 4.49 percent over the previous year. Also, the number of drivers placed out of service was 2,701 in 2017 for an increase of 7.74 percent over the previous year. While an increase in the number of drivers or vehicles placed out-of-service can be viewed positively because more unsafe drivers and vehicles are taken off the road, a decrease can also be viewed as good because more drivers and vehicles are in compliance with regulations. For this reason, no performance standards have been developed for out-of-service drivers or vehicles.
What factors affect results? Some older SWEFs do not have WIM technology and do not have indoor inspection bays for safety inspections regardless of weather. Modern facilities such as Beloit, Madison, Superior and Kenosha, are often underutilized due to staffing constraints, namely a shortage of inspectors. Ensuring a proper level of resources is a primary factor in achieving safety and weight enforcement performance targets. Modernizing facilities helps inspectors do their jobs more effectively and efficiently.
What are we doing to improve? WisDOT continues to make investments in SWEF infrastructure to ensure facilities have the technol-ogy and resources for year-round operations. WisDOT is assessing its options on how best to secure additional inspector positions to add staff hours to SWEFs to improve safety, ensure optimal mobility and provide for system preservation. A new SWEF in Superior was added in 2016 and a new modern facility, including training facilities, is being built in 2017 near Sparta.
Federal Fiscal Year (October–September) TARGETS
Perc
ent
0
5,000
10,000
15,000
20,000
25,000
30,000
35,000
40,000
Total Inspections
Hours of Operation
201720162015201420132012
31,483
35,240
17,224 16,408 17,031
37,082
15,928
32,842
13,66615,553
30,91727,696
37
MissionProvide leadership in the development and operation of a safe and effi cient transportation system.
Values
Accountability Being individually and collectively responsible for the impact of our actions on resources, the people we serve, and each other.
AttitudeBeing positive, supportive and proactive in our words and actions.
CommunicationCreating a culture in which people listen and information is shared openly, clearly, and timel y —both internally and externally.
ExcellenceProviding quality products and services that exceed our customers’ expectations by being professional and the best in all we do.
ImprovementFinding innovative and visionary ways to provide better products and services and measure our success.
IntegrityBuilding trust and confi dence in all our relationships through honesty, commitment and the courage to do what is right.
RespectCreating a culture where we recognize and value the uniqueness of all our customers and each member of our diverse organization through tolerance, compassion, care and courtesy to all.
TeamworkCreating lasting partnerships and working together to achieve mutual goals.
MAPSSPerformanceDashboard
MobilityAccountabilityPreservationSafety Service
For more information on MAPSS, visit www.mapss.wi.gov
VisionDedicated people creating transportation solutions through innovation and exceptional service.
Wisconsin Department of Transportation