April 2013 YOUTH UNEMPLOYMENT Lithuania. TERITORIAL YOUTH UNEMPLOYMENT January 1, 2013 Hightest...
9
April 2013 YOUTH UNEMPLOYMENT Lithuania
-
Upload
rosemary-butler -
Category
Documents
-
view
213 -
download
1
Transcript of April 2013 YOUTH UNEMPLOYMENT Lithuania. TERITORIAL YOUTH UNEMPLOYMENT January 1, 2013 Hightest...

April 2013
YOUTH UNEMPLOYMENT
Lithuania

TERITORIAL YOUTH UNEMPLOYMENTJanuary 1, 2013
Hightest rates: Alytus (12 %)
Kalvarija (11,2 %)Alytus & Anykščiai (10,8 %)
Panevėžys (8,6 %)
Lowest rates: Neringa (4,3 %)
Kaišiadorys (4,4 %)Trakai (4,5 %)
Klaipėda (4,7 %)

UNEMPLOYMENT RATESJanuary – November 2012
BLUE – YOUNG MEN % (15-24); YELLOW – YOUNG WOMEN % (15-24); GREEN - MEN % (15-74); RED – WOMEN % (15-74)
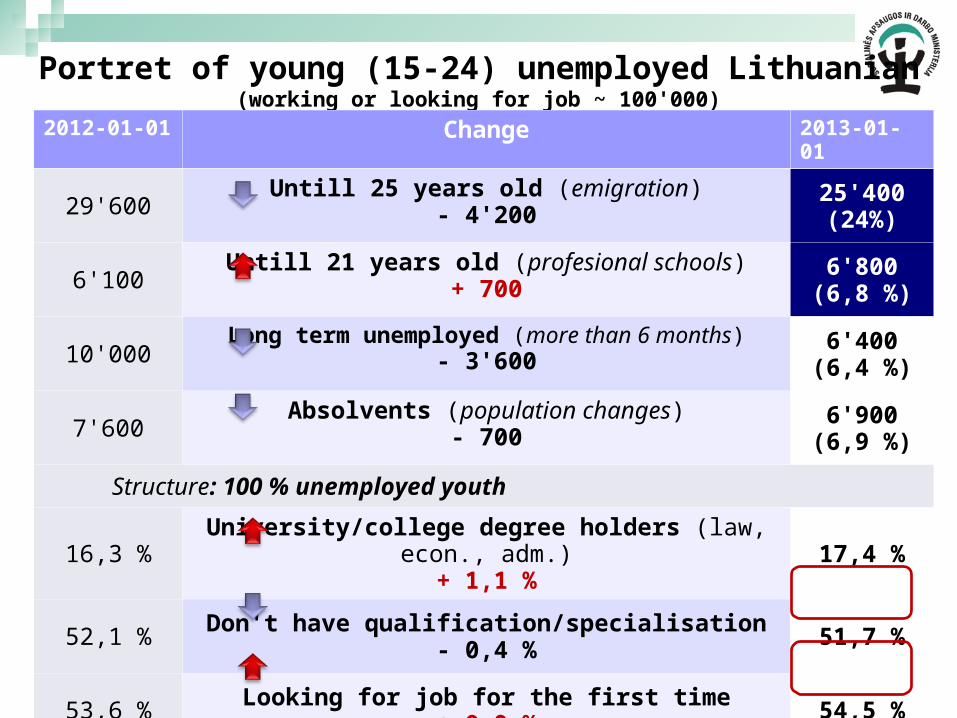
Portret of young (15-24) unemployed Lithuanian(working or looking for job ~ 100'000)
2012-01-01 Change 2013-01-01
29'600Untill 25 years old (emigration)
- 4'20025'400 (24%)
6'100Untill 21 years old (profesional schools)
+ 7006'800
(6,8 %)
10'000Long term unemployed (more than 6 months)
- 3'6006'400
(6,4 %)
7'600Absolvents (population changes)
- 7006'900
(6,9 %)
Structure: 100 % unemployed youth
16,3 %University/college degree holders (law, econ., adm.)
+ 1,1 % 17,4 %
52,1 %Don't have qualification/specialisation
- 0,4 %51,7 %
53,6 %Looking for job for the first time
+ 0,9 %54,5 %
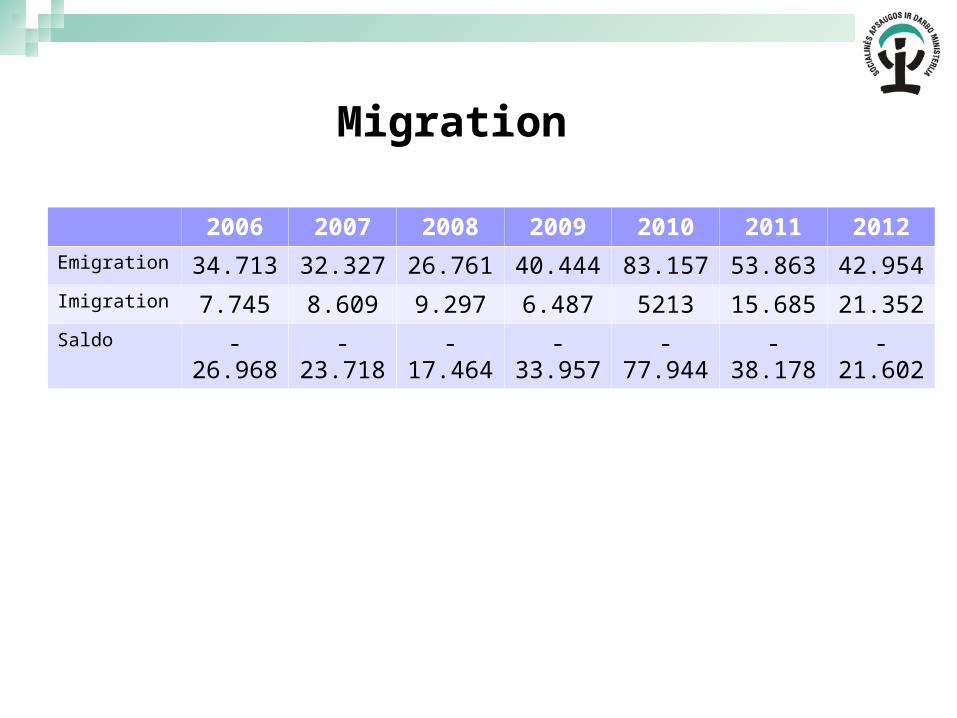
Migration
2006 2007 2008 2009 2010 2011 2012
Emigration 34.713 32.327 26.761 40.444 83.157 53.863 42.954
Imigration 7.745 8.609 9.297 6.487 5213 15.685 21.352
Saldo -26.968 -23.718 -17.464 -33.957 -77.944 -38.178 -21.602
Portait of emigrant
55,5 % - 20-34 years old;82 % were unemployed for a year and
longer;Main reason – to earn more money than in
Lithuania

Natural population change in Lithuania
Year Natural population change
1950 29.849
1960 40.874
1970 27.471
1980 15.894
1990 17.108
1995 - 4.111
2000 - 4.770
2005 - 13.258
2010 -6.494
2011 - 6.652
2012 - 6.593

Working age people63,1 %
Retirees20,8 %
Retirees19,5 %
Working age people63,0 %
Children16,2 %
Children17,4 %
2007 2012
Population structure according to age groups in 2007 and 2012

THANK YOU!
:)
NO CONCULSIONS