(Apresentação Geral JSL Day ENG...
72
Transcript of (Apresentação Geral JSL Day ENG...


Institutional Presentation
Fernando Antonio SimõesFernando Antonio Simões

HistoryHistory2000 - 20102000 - 2010
Creation of Company
foundation
Service diversification
Consolidation of logistics integrated services
Beginning of cargo
transportation activities of Julio
Simões
Group’s 1st acquisition
Acquisition of Transcoffer
Operation in new
businessesCharter
services and Tourism,
Rental of light vehicles
Acquisition of Transcel
Acquisition ofTransportadora
Grande ABC(April/08)
Acquisition of
LubianiLogística
(June/07)
Beginning of dedicated, customized
servicesForestry, auto, rental of heavy
equipment
19501950 19701970 19801980 19901990
Beginning of integrated
services and new
industries Mining and
food products
Urban DistributionFood and
Civil Aviation
Passenger transportation
concessions
IPOPerpetuity and
support to growth
> 2011 - 2012> 2011 - 2012
Acquisition of Rodoviário Schio
Merger of Simpar Concessionárias
Creation of JSL Aluguel de Caminhões
Creation of CS Brasil
Outsourcing of light vehicles for the 2007 Pan American Games
2011 Proforma Net Revenue:
R$2.7 billionCAGR01-11: 28.3%

Organizational IdentityOrganizational Identity
Business
Mission
Vision
Values
Solutions and Services of industrial and social integration.
To provide services and logistics solutions, through a dedicated workforce, generating value for our clients and shareholders, and contributing to the development of the communities where we operate.
Maintain our position as the leading Logistics Operator in the market, offering the broadest range of services and innovative solutions, that are recognized for their excellence and are aligned with the clients’ needsTo be recognized for the professionalism of our managementTo become a benchmark in the utilization and commercialization of assets.
The client: Understand and serve, to ensure a long term relationship.People: They make all the difference in our business.Hard work: You don´t build anything without it.Simplicity: Objective in our actions, to ensure agility.Profit: Indispensable for growth and perpetuation.
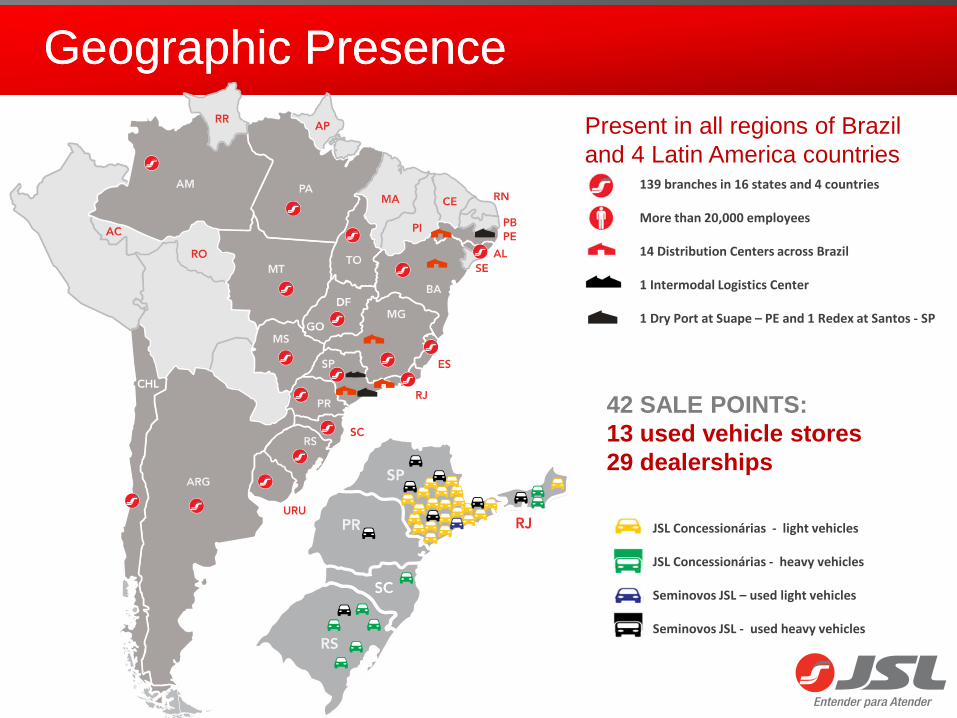
Geographic PresenceGeographic Presence
42 SALE POINTS:13 used vehicle stores29 dealerships
JSL Concessionárias - light vehicles
JSL Concessionárias - heavy vehicles
Seminovos JSL – used light vehicles
Seminovos JSL - used heavy vehicles
Present in all regions of Braziland 4 Latin America countries
139 branches in 16 states and 4 countries
More than 20,000 employees
14 Distribution Centers across Brazil
1 Intermodal Logistics Center
1 Dry Port at Suape – PE and 1 Redex at Santos - SP

Business LinesBusiness Lines
Dedicated Logistics Services
Fleet Management
and Outsourcing
Passenger Transportation
General Cargo Transportation
% of Gross Revenue from Services of JSL + Schio – Base: last 12 months

Diversified RevenueDiversified Revenue
Solid relations with clients and diversified revenu e
Food and Beverage
15%
Pulp and Paper
12%
Public
13%
Steel and Mining
11%
Automotive
11%
Passenger Transportation
10%
Agriculture
6%
Petrochemical
5%
Others
6%
ConsumerGoods
5%
Capital Goods
4%
EletricEnergy
2%
¹ JSL + Schio Proforma last 12 months
50 largest clients represent around
58% of the gross revenue
Breakdown of Gross Revenue from Services by Sector¹
Presence in more than 16 sectors of the
economy
Presence in more than 16 sectors of the
economy

Historical relationships and activitiesHistorical relationships and activities
Rankings correspond to the classification of JSL in the respective segments in ILOS Logistics Award 2012, traditional award that recognizes the best companies in the industry
OTHERS
10 years3 services
18 years4 services
4 years1 service
2 years2 services
2 years3 services
ELETRIC & BIOENERGY
3 years1 service
2 years1 service
2 years1 service
3 years3 services
3 years2 services
56 years9 services
34 years12 services
22 years1 service
9 years7 services
5 years7 services
PULP AND PAPER
17 years5 services
16 years1 service
17 years2 services
16 years2 services
16 years6 services
AUTOMOTIVE
28 years3 services
10 years7 services
3 years1 service
6 years2 services
28 years1 service
METAL & MINING
9 years4 services
15 years5 services
20 years4 services
13 years7 services
39 years7 services
FOOD & BEVERAGE
1º 1º1º 2º
JSL has been building relationships with its clients for more than 50 years
Currently with more than 300 clients
They begin in great majority with 1 service

JSL in figuresJSL in figures
+22,000 employees
More than 34,000 operating assets
Over 300 active clients
LTM logistics revenue
3.2 billion3.2 billion16 industries
CAGR2001-2011
28.3%28.3%25%
organic
Logistics
Dealerships and Insurance Brokers¹
VehiclesSold
Number R$ million
Total New Used Revenue
Total 2,031 1,323 708 82.7
Light 1,907 1,213 694 60.1
Heavy 124 110 14 22.6
¹Monthly average in 2012
• 1.156 insured
assets
• 66% renewal rate
15.3 million km mileage¹
6.4 milion liters of fuel¹
7,100 tires
bought¹
9.3 million transported passengers¹
30.7 million in
charter service payments¹
Da prospecção à operaçãoDa prospecção à operação
Eduardo PereiraEduardo Pereira
From prospecting to operationFrom prospecting to operation

• Services• Monitoring
From Prospecting to OperationFrom Prospecting to Operation
• Prospecting• Pricing• Closing
• Check list• Dedicated structure
Financing and acquisition
Implementation
Operation
Asset resale
New business development
From business
prospecting to operation

New Business DevelopmentNew Business Development
Active prospecting through clients
• The client contacts our sales department
• The Sales Department develops a new opportunity
• The Operational Department identifies a new potential service for a current client and submits it to the Sales Department
• Public bidding
Operations Executive Board
Mining Forestry Sugar and ethanolManagement
and Outsourcing CS Brasil
Development Management
Sales Executive
Board
General and dedicated cargo
Rental light equipment
Rental heavy equipment
Car manufacturing Machines/ Equipment
Chilled and International
Prospecting
Financing and acquisition
Implemen-tation
Operation
Asset resale
New business development
Negotiation: Only Sales Area takes
part
Negotiation: Only Sales Area takes
part
Project and Pricing Closing
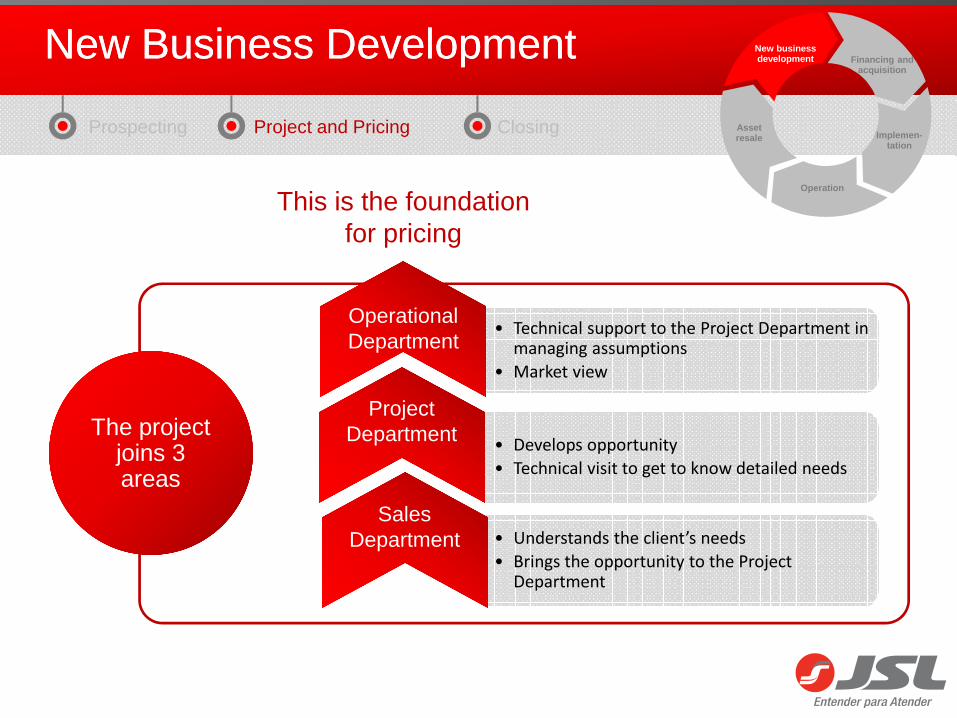
New Business DevelopmentNew Business Development
Prospecting Project and Pricing Closing
• Understands the client’s needs
• Brings the opportunity to the Project Department
• Technical support to the Project Department in managing assumptions
• Market view
The project joins 3 areas
The project joins 3 areas
This is the foundation for pricing
Financing and acquisition
Implemen-tation
Operation
Asset resale
New business development
Project Department
Sales Department
• Develops opportunity
• Technical visit to get to know detailed needs
Operational Department

The pricing assumptions are ratified by the operational manager and the price is ratified by the Sales Executive Officer, for final
approval by the CEO or another Executive Officer
The pricing assumptions are ratified by the operational manager and the price is ratified by the Sales Executive Officer, for final
approval by the CEO or another Executive Officer
• Period: 2 to 10 years
• Adjustments
• Minimum volume
• Cancellation penalties
• Obligation to purchase in case of early termination
• Period: 2 to 10 years
• Adjustments
• Minimum volume
• Cancellation penalties
• Obligation to purchase in case of early termination
• Asset acquisition price
• Fixed asset depreciation
• Return on fixed asset
• Residual amount
• Operating costs
• Administrative expenses
• Taxes
• Margin
• Asset acquisition price
• Fixed asset depreciation
• Return on fixed asset
• Residual amount
• Operating costs
• Administrative expenses
• Taxes
• Margin
Sales ConditionsSales Conditions
New Business DevelopmentNew Business Development
Prospecting Project and Pricing Closing
PricingPricing• Assumptions
• Management software
• Pricing spreadsheet
• Pricing and Sales Conditions
++
Financing and acquisition
Implemen-tation
Operation
Asset resale
New business development
Financing and acquisition
Implemen-tation
Operation
Asset resale
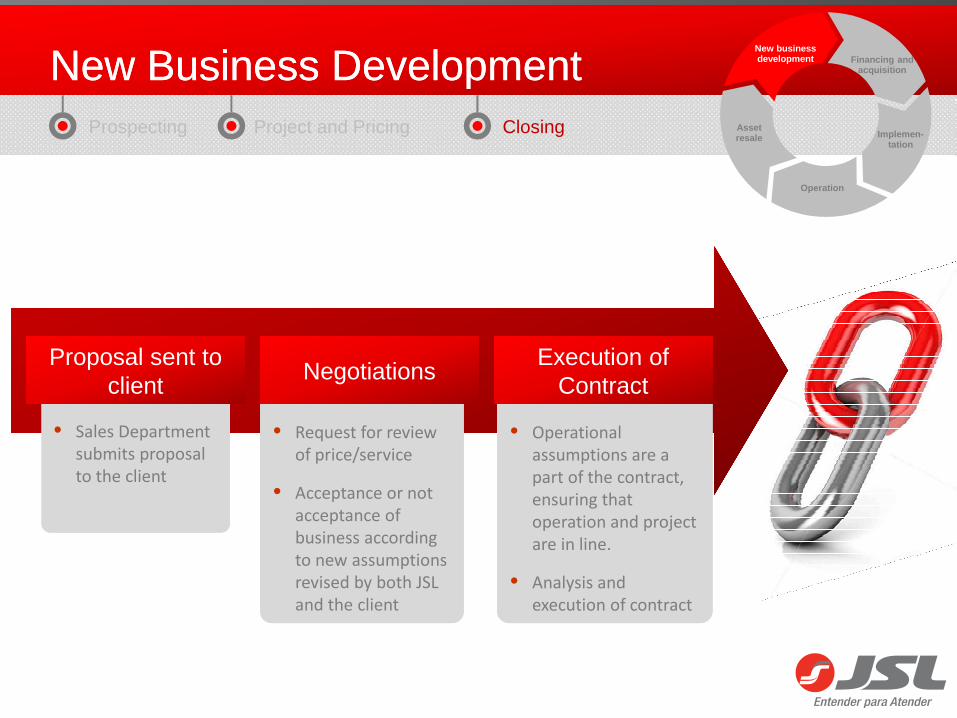
New business developmentNew Business DevelopmentNew Business Development
Prospecting Project and Pricing Closing
• Operational assumptions are a part of the contract, ensuring that operation and project are in line.
• Analysis and execution of contract
• Operational assumptions are a part of the contract, ensuring that operation and project are in line.
• Analysis and execution of contract
• Request for review of price/service
• Acceptance or not acceptance of business according to new assumptions revised by both JSL and the client
• Request for review of price/service
• Acceptance or not acceptance of business according to new assumptions revised by both JSL and the client
• Sales Department submits proposal to the client
• Sales Department submits proposal to the client
Proposal sent to client
Proposal sent to client
NegotiationsNegotiationsExecution of
ContractExecution of
Contract

Checklist of deployment for involved areas
E-mailInformar o layout do EDI (comunicação Cliente/JSL)
20-30 dias de antecedência
Verificar a possibilidade com o cliente de fornecer internet Solicitar link de internet
Informar necessidade de internet 3G
Informar os usuários para email2 dias de
antecedênciaFiscal - Abertura de filial Contato da área Prazo Via Aplicável
Entrar em contato com a matriz (Controladoria) para verificar a necessidade de abertura de filial ou ponto de apoio
Antônio Carlos Ajudarte
30 dias para Estado de SP,
60 dias outros
Estados
Enviar para o setor Fiscal o endereço da nova filial (ATENÇÃO: CEP Verificar se o CEP é o mesmo nos Correios/Prefeitura e outros órgãos)
Vânia de Siqueira
Enviar a documentação que comprove a regularidade do local (Laudo do bombeiro, certidão de débitos na prefeitura, pauta aprovada, habite-se)Enviar a documentação para a locação do local ao JurídicoVerificar na prefeitura se podemos exercer a atividade e enviar o comprovante (Depende de cada região: Uso do solo, diretrizes, viabilidade)
Providenciar licenças para o exercício da atividadeVerificar na prefeitura se não existe outra empresa cadastrada no local e enviar o comprovante (Prefeitura e Secretaria da Fazenda)
Fiscal - Documentação Contato da área Prazo Via AplicávelInformar ao setor Fiscal a operação juntamente com o número de inscrição e CNPJ
Fábio Barbosa7 dias de
antecedênciaE-mail
Solicitar a área Fiscal os formuláriosDefinir junto ao Fiscal a forma de preenchimento e emissão de conhecimentosLigar para a matriz em caso de dúvida quanto à tributação
Cadastro Contato da área Prazo Via AplicávelSolicitar cadastro dos veículos
Diorwilton Heusser
Após chegada dos
ativos
Sistema
Solicitar cadastro dos equipamentos
Solicitar cadastro de motoristasApós
admissão dos motoristas
Solicitar cadastro de usuários no sistemaApós
admissão dos usuários
Solicitar cadastro de rotas 1ª semana de
implantaçãoSolicitar cadastro de pontos de entrega (CNPJ origem/destino)
Solicitar cadastro de tabela comercial no sistemaApós
definido o modelo fiscal
Sistema de Gestão Contato da área Prazo Via AplicávelDefinir procedimentos padrões
Simone GonzalezAté 30 dias após início
da operaçãoE-mail
Definir meios de controle da operação
Definir os indicadores operacionaisValidar com SGI (Sistema de Gestão Integrada)Treinamento da equipe envolvida
Definir modelos de relatórios a serem usados na operação
ChecklistChecklist Financing and acquisition
Implemen-tation
Operation
Asset resale
New business development

Raio X das OperaçõesRaio X das Operações
Adriano ThieleAdriano Thiele
X-Ray of OperationsX-Ray of Operations
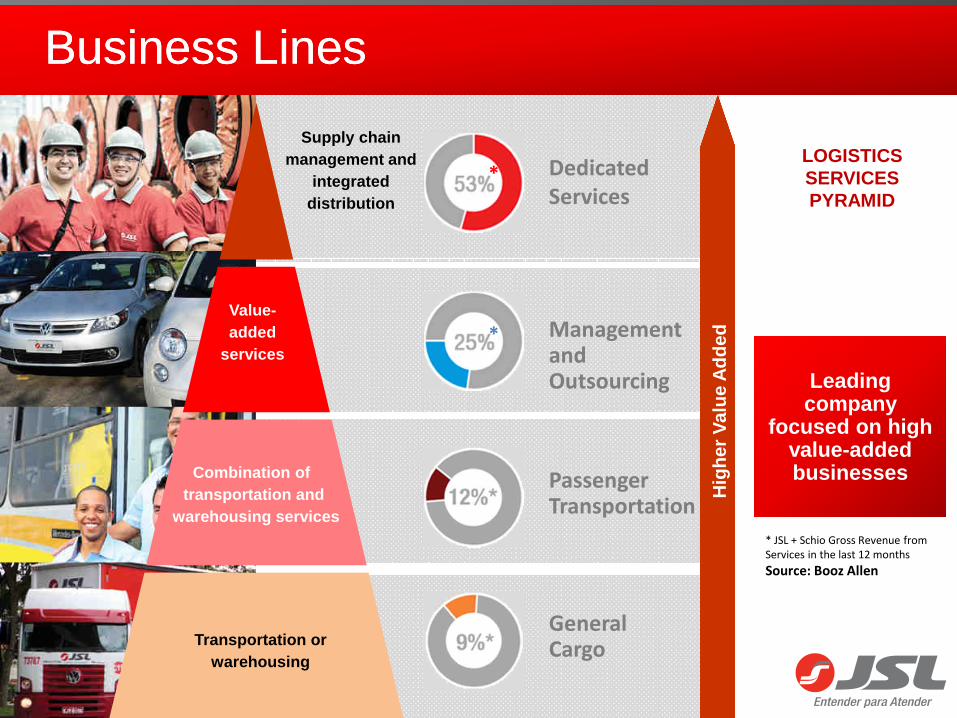
Business LinesBusiness Lines
Dedicated Services
Management and Outsourcing
Passenger Transportation
General Cargo
Leading company
focused on high value-added businesses
Leading company
focused on high value-added businesses
* JSL + Schio Gross Revenue from Services in the last 12 months
Source: Booz Allen
LOGISTICS SERVICES PYRAMID
Supply chain management and
integrated distribution
Value-added
services
Combination of transportation and
warehousing services
Transportation orwarehousing
Hig
her
Val
ue A
dded
*
*

R$1.5 billionLTM revenue
R$1.5 billionLTM revenue
Complete logistics solutionsComplete logistics solutions
Supply Chain Dedicated ServicesSupply Chain Dedicated Services
• High value added with integrated, flexible and customized solutions• Physical and human resources exclusively allocated to the operation• Specific IT and processes• Demands high technical specifications
* Proforma Schio + JSL Gross Revenue from Services in the last 12 months¹ Proforma Schio + JSL Gross Revenue from Dedicated Services n the last 12 months² 2Q12 base date
Main Sectors(% of Revenue¹):
• Food (26.6%)
• Pulp and Paper (19.5%)
• Automotive (18.5%)
• Steel and Mining (10.5%)
• Sugar and Ethanol (6.7%)
Main Sectors(% of Revenue¹):
• Food (26.6%)
• Pulp and Paper (19.5%)
• Automotive (18.5%)
• Steel and Mining (10.5%)
• Sugar and Ethanol (6.7%)
• Dedicated operations, customized client service
• Complete portfolio of services
• High client loyalty levels
• High cross-selling rates
• Dedicated operations, customized client service
• Complete portfolio of services
• High client loyalty levels
• High cross-selling rates
What we doWhat we doExpertise in several
sectors of the economyExpertise in several
sectors of the economy
Gross Revenue from Services
Gross Revenue from Services
INBOUND WAREHOUSING AND INTERNAL LOGISTICS
OUTBOUND
CAGR 08-11: +17.8%
*
• Input handling and warehousing• Production line supply• Stockroom management• Handling and warehousing of finished products• Shipment of finished products
* 10,412 Employees²7,819 Operational Assets²10,412 Employees²7,819 Operational Assets²

Supply Chain Dedicated ServicesSupply Chain Dedicated Services
• Revenue of R$157.6 million
• Services:- Loading and transportation of ore- Waste management- Highway maintenance- Industrial cleaning- Road watering
• 993 Employees¹ and 603 Operational Assets¹
• Revenue of R$157.6 million
• Services:- Loading and transportation of ore- Waste management- Highway maintenance- Industrial cleaning- Road watering
• 993 Employees¹ and 603 Operational Assets¹
Steel and MiningSteel and Mining
• Revenue of R$291.5 million• Services:
- Loading and transportation of wood - Handling and transportation of pulp
- Industrial cleaning- Waste removal
• 2,203 Employees¹ and 2,346 Operational Assets¹
• Revenue of R$291.5 million• Services:
- Loading and transportation of wood - Handling and transportation of pulp
- Industrial cleaning- Waste removal
• 2,203 Employees¹ and 2,346 Operational Assets¹
Pulp and PaperPulp and Paper
• Revenue of R$277.2 million
• Services:- Milk run- Just in time- Cross docking- Information management- Production line supply- Stockroom management
• 1,322 Employees¹ and 1,164 Operational Assets¹
• Revenue of R$277.2 million
• Services:- Milk run- Just in time- Cross docking- Information management- Production line supply- Stockroom management
• 1,322 Employees¹ and 1,164 Operational Assets¹
AutomotiveAutomotive
*Percentage of proforma Schio + JSL Gross Revenue from Services in the last 12 months¹ 2Q12 base date
*

Supply Chain Dedicated ServicesSupply Chain Dedicated Services
• Revenue of R$398.1 million
• Services:- Inbound/outbound- Warehousing/handling of frozen and chilled products- Labor outsourcing
• 4,290 Employees¹ and1,944 Operational Assets
• Revenue of R$398.1 million
• Services:- Inbound/outbound- Warehousing/handling of frozen and chilled products- Labor outsourcing
• 4,290 Employees¹ and1,944 Operational Assets
Food and BeveragesFood and
Beverages
• Revenue of R$100.9 million
• Services:- Transportation of chopped sugarcane- Transportation of sugarcane from the field to the industrial unit941 Employees¹ and849 Operational Assets¹
• Revenue of R$100.9 million
• Services:- Transportation of chopped sugarcane- Transportation of sugarcane from the field to the industrial unit941 Employees¹ and849 Operational Assets¹
Sugar and Ethanol
Sugar and Ethanol
* Proforma Schio + JSL Gross Revenue from Services in the last 12 months¹ 2Q12 base date
*

Automotive (example)
Dedicated Services, Fleet Management and Outsourcing and Passengers Transportation
Fleet management and outsourcing
Transportation of employees
Internal handling and assembly of kits
Shipping.Outbound
Delivery of raw materials.Inbound
Inventory maintenance and management
Electronic registration of
inventory
Invoicing
Auto parts.Milk run.
Rental of vehicle withdriver at the client’s
disposal
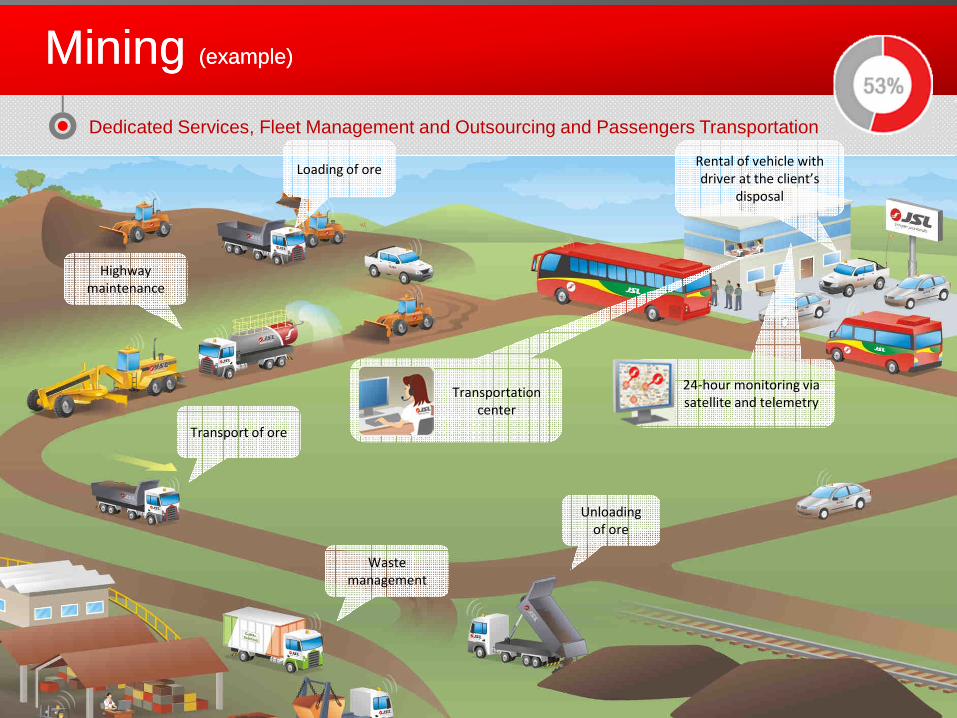
Mining (example)Mining (example)
Dedicated Services, Fleet Management and Outsourcing and Passengers Transportation
Loading of ore
Highwaymaintenance
Transport of ore
Wastemanagement
Unloadingof ore
24-hour monitoring via satellite and telemetry
Transportationcenter
R$637 millionLTM revenue
R$637 millionLTM revenue
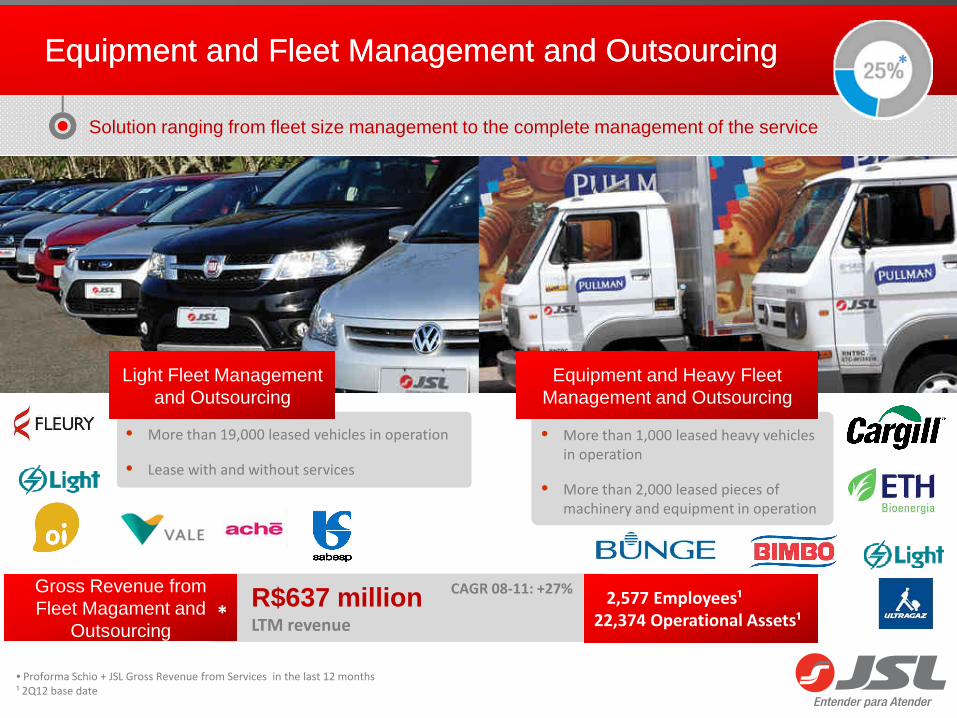
Equipment and Fleet Management and OutsourcingEquipment and Fleet Management and Outsourcing
Solution ranging from fleet size management to the complete management of the service
Gross Revenue from Fleet Magament and
Outsourcing
Gross Revenue from Fleet Magament and
Outsourcing
CAGR 08-11: +27%
• More than 19,000 leased vehicles in operation
• Lease with and without services
• More than 19,000 leased vehicles in operation
• Lease with and without services
Light Fleet Management and Outsourcing
Light Fleet Management and Outsourcing
• More than 1,000 leased heavy vehicles in operation
• More than 2,000 leased pieces of machinery and equipment in operation
• More than 1,000 leased heavy vehicles in operation
• More than 2,000 leased pieces of machinery and equipment in operation
Equipment and Heavy Fleet Management and OutsourcingEquipment and Heavy Fleet
Management and Outsourcing
• Proforma Schio + JSL Gross Revenue from Services in the last 12 months ¹ 2Q12 base date
*
*2,577 Employees¹
22,374 Operational Assets¹2,577 Employees¹
22,374 Operational Assets¹
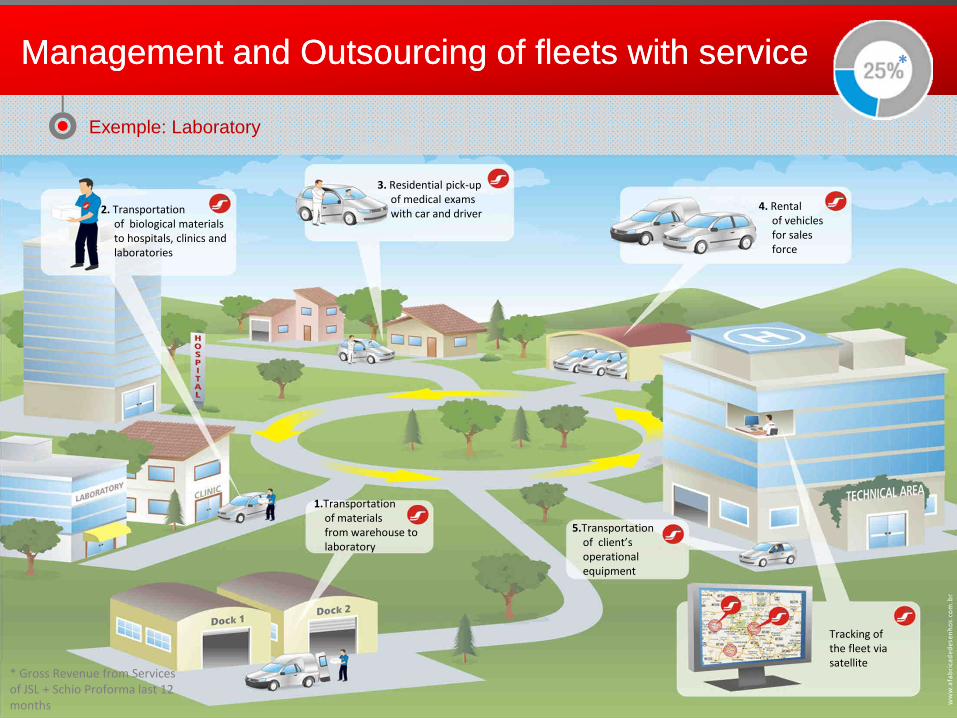
1.Transportation of materials from warehouse to laboratory
2. Transportation of biological materialsto hospitals, clinics and laboratories
4. Rentalof vehicles for sales force
3. Residential pick-up of medical exams with car and driver
5.Transportation of client’s operational equipment
Tracking of the fleet via satellite
Exemple: Laboratory
Management and Outsourcing of fleets with serviceManagement and Outsourcing of fleets with service *
* Gross Revenue from Services of JSL + Schio Proforma last 12 months

Passenger TransportationPassenger Transportation
R$ 351 millionGross revenue in the last 12 months
R$ 351 millionGross revenue in the last 12 months
CAGR 11-08: +14.9%Gross Revenue from Passenger
Transportation
Gross Revenue from Passenger
Transportation
Correlation diversification strategy
• Corporate (Permanent Charter) and Tourism Passenger Chartering
• Corporate (Permanent Charter) and Tourism Passenger Chartering
Charter ServicesCharter Services
• Municipal and intercity urban lines
• Municipal and intercity urban lines
Urban Transportation
Urban Transportation
*
* Pro-forma Gross Revenue from Services of JSL + Schio in the last 12 months¹ Reference date 2Q12
*
3,165 Employees¹1,072 Operating Assets¹3,165 Employees¹1,072 Operating Assets¹

Services for clients who present high variation in volumeInformation specification and management
General CargoGeneral Cargo
R$ 247 millionGross revenue in the last 12 months
R$ 247 millionGross revenue in the last 12 months
CAGR 08-11: +7,2%Gross Revenue from General
Cargo
Gross Revenue from General
Cargo
• Closed cargo transportation operations from point A to point B• More than 95% transported by independent contractors and third
parties • High seasonality within the month/year• Physical and human resources non-exclusive to a client/operation• Average cycles without guaranteed counter-flow• Expertise in the hiring of third parties/independent contractors• Contracts with reduced terms
General Cargo TransportationGeneral Cargo Transportation
*
* Pro-forma Gross Revenue from Services of JSL + Schio in the last 12 months¹ Reference date 2Q12
*
292 Employees¹728 Operating Assets¹292 Employees¹728 Operating Assets¹

Management Structure
Dedicated structure to each operationDedicated structure to each operation
Chief Operations Officer
Adriano Thiele
Mining Forestry Sugar and EthanolManagement
and OutsourcingPassanger
Transportation
Business Development Management
Manager by Client
Waste ManagerFleet Outsourcing
ManagerCharting Manager
Mine handling Manager
Support areas: Maintenance, HSE and
Personnel
*
MAIN LINK WITH CLIENTS (SINGLE CHANNEL)• Ensures culture• Captures synergies• Identification and implementation of the best internal
and market practices

Quest for continuous improvement, generating new business and perpetuating
customer relationship
Quest for continuous improvement, generating new business and perpetuating
customer relationshipAdriano ThieleAdriano Thiele

Case: ValeCase: Vale
Optimization of passenger transportation routes
Improvement Project• Optimization/Redefining of routes
• Reduced mileage
• Increased occupancy rate of vehicles
• Reduced number of vehicles
• Use of Simulation Software
• Improvements shared with clients on a 50%/50% basis
• 168 Administrative Buses and Shifts
• Daily transportation of 6,300 employees
• 168 Administrative Buses and Shifts
• Daily transportation of 6,300 employees
Current OperationCurrent Operation

MethodologyMethodology
Chart Occupancy Rate – Monthly Analysis
Occ
upan
cy R
ate

MethodologyMethodology
Chart Occupancy Rate – Daily Analysis
Historical 28 daysOP34 route
Number of passengers
Num
ber
of o
ccur
renc
es%
Cum
ulative
MethodologyMethodology
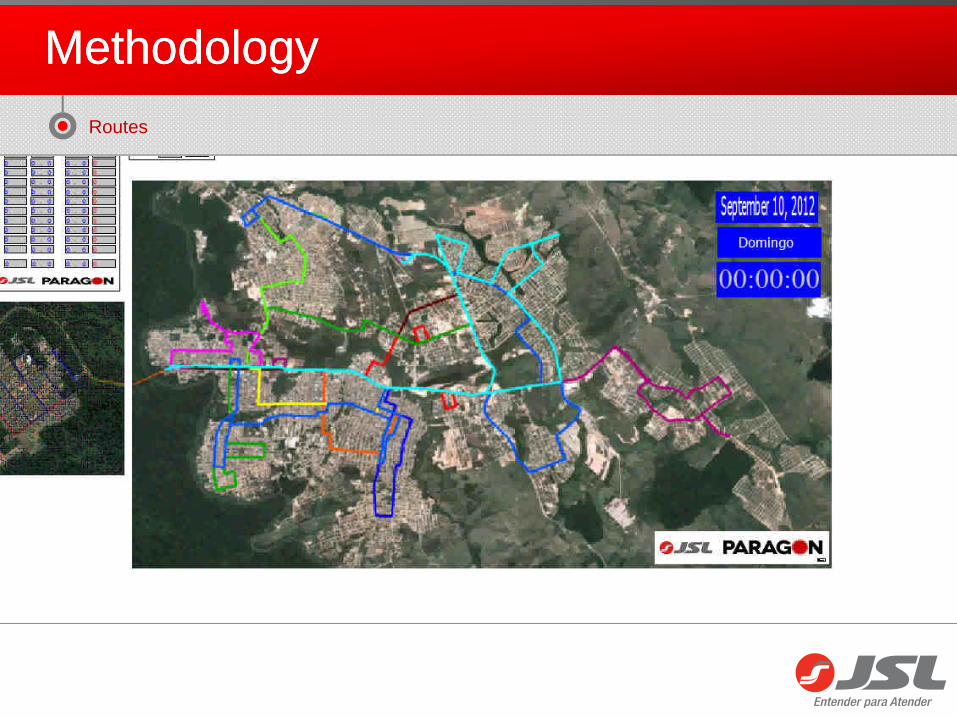
Routes

Preliminary ResultsPreliminary Results
ADMINISTRATIVE CONTRACT - IRON/MANGANESE:
• 38 buses – daily transportation of 1,521 people
• Reduction of 2 buses (5.2% of total) due to the lower number of vehicles after passing the gateway
• Higher vehicle occupancy rate
ADMINISTRATIVE CONTRACT - IRON/MANGANESE:
• 38 buses – daily transportation of 1,521 people
• Reduction of 2 buses (5.2% of total) due to the lower number of vehicles after passing the gateway
• Higher vehicle occupancy rate
Preliminary simulation results
Preliminary simulation results
• Redefining of routes due to the occupancy rate - 6,300 pickup points
• Impact from adoption of equipment with higher number of seats
• Replicating the model developed for other mines
• Reduced number of pickup points
• Redefining of routes due to the occupancy rate - 6,300 pickup points
• Impact from adoption of equipment with higher number of seats
• Replicating the model developed for other mines
• Reduced number of pickup points
Current scenariosCurrent scenarios

Operations in numbersOperations in numbers
Total Gross Revenue from Services*R$ 2.8 billion
18.2 thousand Employees¹
31.3 thousand operating Assets¹
139 branches
Total Gross Revenue from Services*R$ 2.8 billion
18.2 thousand Employees¹
31.3 thousand operating Assets¹
139 branches
* Gross Revenue from Services JSL + Schio Proforma last 12 months¹ Base date 2T12

Pricing, Monitoringand Capital StructurePricing, Monitoring
and Capital Structure
Denys Marc FerrezDenys Marc Ferrez

Administrative StructureAdministrative Structure
• Executive Officers• Procurement• Asset Management• Legal Department• New Businesses• Customer Services
• Investor Relations• Financial Services• Controllership• Projects• Communication and Marketing• Cargo/Dedicated Services Operations• Electronic means of payment
• Fleet Outsourcing and Management• Information Technology• Schio• Dealerships
• HSE• Medical Department• Personnel Department• Recruiting and Selection• Cafeteria
YOU ARE
HERE!

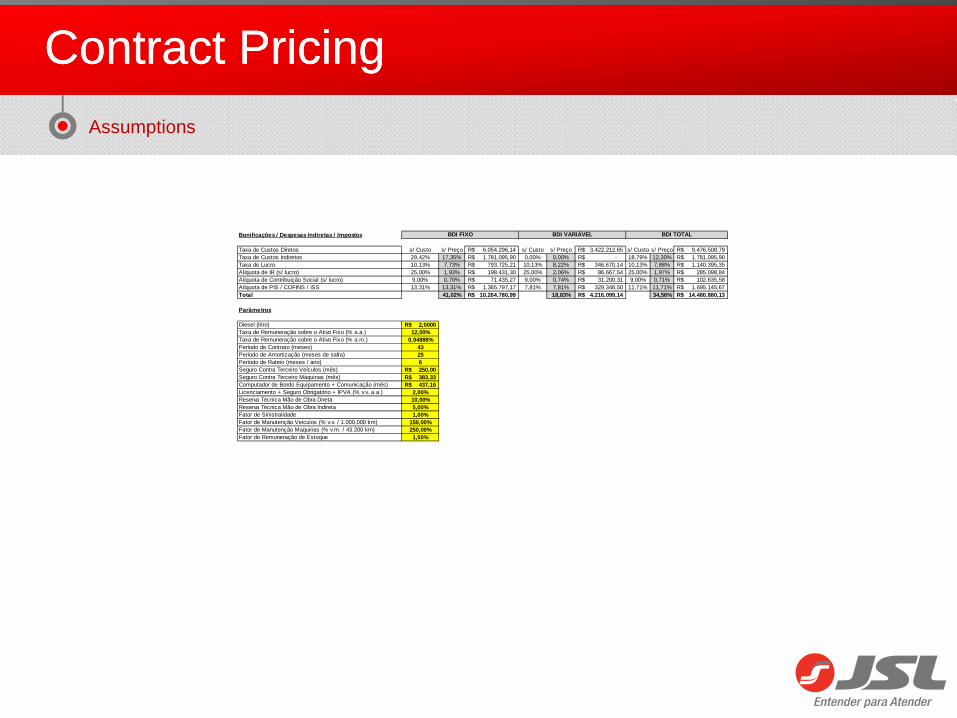
Contract PricingContract Pricing
Pricing tables

Contract PricingContract Pricing
Sizing
Ano 2011 2012 2013 2014 2015 TOTALVolume (ton/ano) 333.333 2.000.000 2.000.000 2.000.000 2.000.000 8.333.333Período contrato (meses) 1 12 12 12 6 43Período safra (meses) 1 6 6 6 6 25Período safra (dias) 30 180 180 180 180 174Período de paralisações (%) 20% 20% 20% 20% 20% 20%Período de paralisações (dias/ano) 6 36 36 36 36 35Período produtivo (dias/ano) 24 144 144 144 144 139Período produtivo (dias/mês) 24 24 24 24 24 24Volume (ton/mês) 333.333 333.333 333.333 333.333 333.333 333.333Volume (ton/dia) 13.889 13.889 13.889 13.889 13.889 13.889Operação Colheita Colheita Colheita Colheita Colheita ColheitaEquipamento 1 colhedora colhedora colhedora colhedora colhedora colhedoraProdução (ton/hr/equipamento) 40 40 40 40 40 40DF - Disponibilidade física 90% 90% 90% 90% 90% 90%DO - Disponibilidade operacional 85% 85% 85% 85% 85% 85%DO + DF 77% 77% 77% 77% 77% 77%Produtividade (hr/mês) 441 441 441 441 441 441Produtividade (hr/dia) 18,36 18,36 18,36 18,36 18,36 18,36Produção (ton/dia/equipamento) 734,4 734,4 734,4 734,4 734,4 734,4Total de equipamento 1 (qtd) 19 19 19 19 19 19Operação Transbordo Transbordo Transbordo Transbordo Transbordo TransbordoEquipamento 1 trator trator trator trator trator tratorEquipamento 2 transbordo transbordo transbordo transbordo transbordo transbordoProdução (ton/hr/equipamento) 20 20 20 20 20 20DF - Disponibilidade física 90% 90% 90% 90% 90% 90%DO - Disponibilidade operacional 85% 85% 85% 85% 85% 85%DO + DF 77% 77% 77% 77% 77% 77%Produtividade (hr/mês) 441 441 441 441 441 441Produtividade (hr/dia) 18,36 18,36 18,36 18,36 18,36 18,36Produção (ton/dia/equipamento) 367,2 367,2 367,2 367,2 367,2 367,2Total de equipamento 1 (qtd) 38 38 38 38 38 38Total de equipamento 2 (qtd) 76 76 76 76 76 76Operação Transporte Transporte Transporte Transporte Transporte TransporteEquipamento 1 cavalo cavalo cavalo cavalo cavalo cavaloEquipamento 2 rodotrem rodotrem rodotrem rodotrem rodotrem rodotremProdução (ton/viagem) 60 60 60 60 60 60DF - Disponibilidade física 90% 90% 90% 90% 90% 90%DO - Disponibilidade operacional 85% 85% 85% 85% 85% 85%DO + DF 77% 77% 77% 77% 77% 77%Produtividade (hr/mês) 441 441 441 441 441 441Produtividade (hr/dia) 18,36 18,36 18,36 18,36 18,36 18,36Distancia média (km ida e volta) 62,5 62,5 62,5 62,5 62,5 62,5Tempo carga (hr) 0,5 0,5 0,5 0,5 0,5 0,5Tempo descarga (hr) 0,5 0,5 0,5 0,5 0,5 0,5Velocidade (km/hr) 35 35 35 35 35 35Produção (viagem/dia/equipamento) 7 7 7 7 7 7Produção (ton/dia/equipamento) 395 395 395 395 395 395Produção (km/mês/equipamento 1) 9886 9886 9886 9886 9886 9886Produção (km/mês/equipamento 2) 4943 4943 4943 4943 4943 4943Total de equipamento 1 (qtd) 36 36 36 36 36 36Total de equipamento 2 (qtd) 72 72 72 72 72 72
DIMENSIONAMENTO
Contract PricingContract Pricing
Assumptions
Bonificações / Despesas Indiretas / Impostos
Taxa de Custos Diretos s/ Custo s/ Preço 6.054.296,14R$ s/ Custo s/ Preço 3.422.212,65R$ s/ Custo s/ Preço 9.476.508,79R$ Taxa de Custos Indiretos 29,42% 17,35% 1.781.095,90R$ 0,00% 0,00% -R$ 18,79% 12,30% 1.781.095,90R$ Taxa de Lucro 10,13% 7,73% 793.725,21R$ 10,13% 8,22% 346.670,14R$ 10,13% 7,88% 1.140.395,35R$ Alíquota de IR (s/ lucro) 25,00% 1,93% 198.431,30R$ 25,00% 2,06% 86.667,54R$ 25,00% 1,97% 285.098,84R$ Alíquota de Contribuição Social (s/ lucro) 9,00% 0,70% 71.435,27R$ 9,00% 0,74% 31.200,31R$ 9,00% 0,71% 102.635,58R$ Alíquota de PIS / COFINS / ISS 13,31% 13,31% 1.365.797,17R$ 7,81% 7,81% 329.348,50R$ 11,71% 11,71% 1.695.145,67R$ Total 41,02% 10.264.780,99R$ 18,83% 4.216.099,14R$ 34,56% 14.480.880,13R$
Parâmetros
Diesel (litro) 2,0000R$ Taxa de Remuneração sobre o Ativo Fixo (% a.a.) 12,00%Taxa de Remuneração sobre o Ativo Fixo (% a.m.) 0,94888%Período de Contrato (meses) 43Período de Amortização (meses de safra) 25Período de Rateio (meses / ano) 6Seguro Contra Terceiro Veículos (mês) 250,00R$ Seguro Contra Terceiro Máquinas (mês) 383,33R$ Computador de Bordo Equipamento + Comunicação (mês) 437,16R$ Licenciamento + Seguro Obrigatório + IPVA (% v.v. a.a.) 2,00%Reserva Técnica Mão de Obra Direta 10,00%Reserva Técnica Mão de Obra Indireta 5,00%Fator de Sinistralidade 1,00%Fator de Manutenção Veiculos (% v.v. / 1.000.000 km) 150,00%Fator de Manutenção Maquinas (% v.m. / 43.200 km) 250,00%Fator de Remuneração de Estoque 1,50%
BDI VARIÁVEL BDI TOTALBDI FIXO

Operação
Equipamento
Qtd.FIX Fator RT Fator
DF/DO
Hr - Km Prod. /
Mês
Investimento Residual
Custo Fixo Custo Variável
Lucro Impostos (IR/CS)
Impostos (PIS/COFINS/ISS)
PreçoUnitárioMensal
Custo de Propriedade
(RC + DP)
Seguro Contra Terceiro
Computador de Bordo
Fator de Sinistralidade
Documentação (IPVA + DPVAT + Licenc.)
Mão de Obra
Indiretos Total Lubrificante / Lavagem
Peças de Reposição Pneus / Esteiras Combustível
Total
Tipo Marca Equip. Acess. Total Equip. Acess. Total Qtd./Eqpto. Custo Custo /
Hr - Km Custo /
Mês Custo /
Mês Consumo (lt/hr - km/lt) Custo / Mês
COLHEITA Colhedora de esteira John Deere 3520 19 11% 76,50% 441 hr R$ 800.000,00 R$ - R$ 800.000,00 30% 0% 30% R$ 30.900,84 R$ 423,68 R$ 483,18 R$ 736,84 R$ - 4 R$ 59.788,74 R$ 27.163,26 R$ 119.496,55 R$ 5.600,42 R$ 46,30 R$ 20.400,00 R$ 6.381,68 40 lt/hr R$ 35.251,20 R$ 67.633,30 R$ 18.956,25 R$ 6.445,13 R$ 28.177,61 R$ 240.708,83
TRANSBORDO
Trator 185 cv John Deere 7185 38 21% 76,50% 441 hr R$ 200.000,00 R$ - R$ 200.000,00 30% 0% 30% R$ 8.460,94 R$ 464,04 R$ 529,20 R$ 201,75 R$ - 4 R$ 27.035,26 R$ 10.794,08 R$ 47.485,27 R$ 2.572,21 R$ 11,57 R$ 5.100,00 R$ 581,64 12 lt/hr R$ 10.575,36 R$ 18.829,21 R$ 6.717,66 R$ 2.284,00 R$ 9.985,49 R$ 85.301,63
Transbordo 10,5 ton Saltal VT10 76 11% 76,50% 441 hr R$ 80.000,00 R$ - R$ 80.000,00 30% 0% 30% R$ 3.090,08 R$ 423,68 R$ 483,18 R$ 73,68 R$ - 0 R$ - R$ 1.197,53 R$ 5.268,16 R$ - R$ 4,63 R$ 2.040,00 R$ 387,76 0 lt/hr R$ - R$ 2.427,76 R$ 779,60 R$ 265,06 R$ 1.158,84 R$ 9.899,42
TRANSPORTE
Cavalo 6x4 420 cv com ar condicionado Scania G420 36 19% 76,50% 9.886 km R$ 300.000,00 R$ - R$ 300.000,00 40% 0% 40% R$ 11.226,86 R$ 298,61 R$ 522,17 R$ 298,61 R$ 1.194,44 4 R$ 27.035,26 R$ 11.936,92 R$ 52.512,87 R$ 736,14 R$ 0,45 R$ 4.448,90 R$ 2.416,68 1,2 km/lt R$ 16.477,40 R$ 24.079,12 R$ 7.758,77 R$ 2.637,98 R$ 11.533,06 R$ 98.521,80
Rodotrem Canavieiro de 12,5m Rodolinea 72 8% 76,50% 4.943 km R$ 220.000,00 R$ - R$ 220.000,00 40% 0% 40% R$ 7.467,17 R$ 270,83 R$ 473,59 R$ 198,61 R$ 794,44 0 R$ - R$ 2.707,89 R$ 11.912,54 R$ - R$ 0,33 R$ 1.631,26 R$ 2.900,02 0,0 km/lt R$ - R$ 4.531,28 R$ 1.665,76 R$ 566,36 R$ 2.476,08 R$ 21.152,02
APOIO
Caminhão Comboio Abastecimento 9.000l VW 26260 / Gascom 4 25% 76,50% 2.400 km R$ 185.000,00 R$ 80.000,00 R$ 265.000,00 50% 10% 38% R$ 10.626,96 R$ 312,50 R$ 546,46 R$ 276,04 R$ 1.104,17 4 R$ 29.572,87 R$ 12.485,00 R$ 54.924,00 R$ 281,60 R$ 0,40 R$ 954,00 R$ 528,00 2,5 km/lt R$ 1.920,00 R$ 3.683,60 R$ 5.936,95 R$ 2.018,56 R$ 8.825,00 R$ 75.388,11
Caminhão Bombeiro 15.000l VW 26260 / Gascom 4 25% 76,50% 2.400 km R$ 185.000,00 R$ 90.000,00 R$ 275.000,00 50% 10% 37% R$ 11.154,22 R$ 312,50 R$ 546,46 R$ 286,46 R$ 1.145,83 4 R$ 25.311,69 R$ 11.401,86 R$ 50.159,02 R$ 281,60 R$ 0,41 R$ 990,00 R$ 528,00 2,5 km/lt R$ 1.920,00 R$ 3.719,60 R$ 5.457,90 R$ 1.855,69 R$ 8.112,92 R$ 69.305,13
Caminhão Oficina VW 26260 / Gascom 4 25% 76,50% 2.400 km R$ 185.000,00 R$ 60.000,00 R$ 245.000,00 50% 10% 40% R$ 9.572,44 R$ 312,50 R$ 546,46 R$ 255,21 R$ 1.020,83 4 R$ 25.311,69 R$ 10.890,55 R$ 47.909,69 R$ 281,60 R$ 0,37 R$ 882,00 R$ 528,00 2,5 km/lt R$ 1.920,00 R$ 3.611,60 R$ 5.219,11 R$ 1.774,50 R$ 7.757,96 R$ 66.272,86
Total 253 13% R$ 57.740.000,00 R$ 920.000,00 R$ 58.660.000,00 35% 10% 35% R$ 2.210.695,59 R$ 91.883,33 R$ 125.466,21 R$ 55.587,50 R$ 113.283,33 420 R$ 3.457.380,17 R$ 1.781.095,90 R$ 7.835.392,04 R$ 234.032,04 R$ 1.025.355,17 R$ 474.962,70 R$ 1.687.862,74 R$ 3.422.212,65 R$ 1.140.395,35 R$ 387.734,42 R$ 1.695.145,67 R$ 14.480.880,13
Total Máquinas 133 441 hr R$ 28.880.000,00 R$ - R$ 28.880.000,00 R$ 1.143.478,18 R$ 57.883,33 R$ 66.011,84 R$ 27.266,67 R$ - R$ 2.163.325,85 R$ 1.017.288,99 R$ 4.475.254,86 R$ 204.151,84 R$ 1.671,30 R$ 736.440,00 R$ 172.824,48 R$ 1.071.636,48 R$ 2.185.052,80 R$ 674.689,17 R$ 229.394,32 R$ 1.002.894,66 R$ 8.567.285,80
Total Veículos 120 3.206 km R$ 28.860.000,00 R$ 920.000,00 R$ 29.780.000,00 R$ 1.067.217,41 R$ 34.000,00 R$ 59.454,37 R$ 28.320,83 R$ 113.283,33 R$ 1.294.054,32 R$ 763.806,91 R$ 3.360.137,18 R$ 29.880,20 R$ 44,67 R$ 288.915,17 R$ 302.138,22 R$ 616.226,26 R$ 1.237.159,85 R$ 465.706,19 R$ 158.340,10 R$ 692.251,00 R$ 5.913.594,33
Operação Tipo Marca FIX RT TT
COLHEITA Colhedora de esteira John Deere 3520 19 2 21
TRANSBORDOTrator 185 cv John Deere 7185 38 8 46
Transbordo 10,5 ton Saltal VT10 76 8 84
TRANSPORTECavalo 6x4 420 cv com ar condicionado Scania G420 36 7 43
Rodotrem Canavieiro de 12,5m Rodolinea 72 6 78
APOIO
Caminhão Comboio Abastecimento 9.000l VW 26260 / Gascom 4 1 5
Caminhão Bombeiro 15.000l VW 26260 / Gascom 4 1 5
Caminhão Oficina VW 26260 / Gascom 4 1 5
Total 253 34 287
Contract PricingContract Pricing
Calculation spreadsheet

Contract PricingContract Pricing
Mobilization period
Ramp-up of revenueand maturity
Sale of assetsexcluding renewal
Cash Flow
Premises• Amortization term: 36 months• Residual value from asset sales:
35.0%• Investment: R$66.5 million• Technical reserve: 10.00%
Nominal Delev. IRR
(p.a.)
• 18.8%
EBITDA margin
• 26.2%
Return
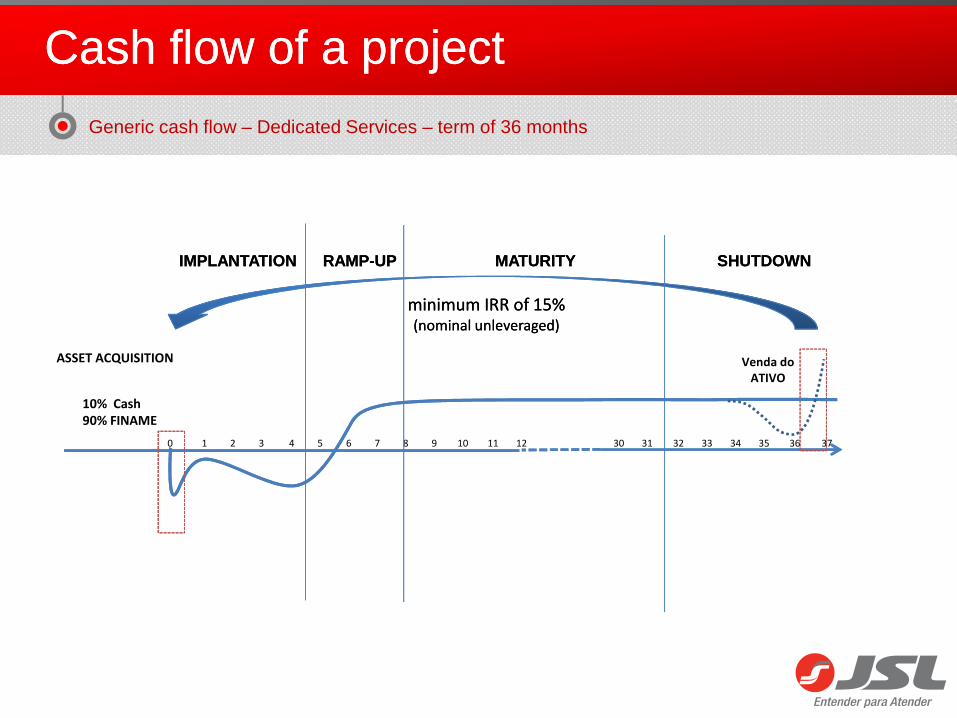
Cash flow of a projectCash flow of a project
IMPLANTATIONIMPLANTATION RAMP-UPRAMP-UP MATURITYMATURITY SHUTDOWNSHUTDOWN
ASSET ACQUISITION Venda doATIVO
minimum IRR of 15%(nominal unleveraged)
minimum IRR of 15%(nominal unleveraged)
10% Cash90% FINAME
0 1 2 3 4 5 6 7 8 9 10 11 12 30 31 32 33 34 35 36 37
Generic cash flow – Dedicated Services – term of 36 months

Meeting Results – Managerial IndicatorsMeeting Results – Managerial Indicators
Assessment for each operation
More than 500cost centers
em 000 Mês Meses
Anteriores
com
entá
rios
Mês Meses
Anteriores
Veiculo Modelo Qt. Fatur. Fat./Carro Julho Junho Km K m/Veic. Julho Junho
14856 19.745.255 1.329 1.342 1.272 160.374.846 10.795 74 64 Faturamento/ Investido 4,77%
Início do Contrato Mês/Ano Mês/Ano Mês/Ano Proximo Reajuste
Manutenção por
veículo
Ultimos Reajustes Mês Julho R$ 177,23
Indice Indice Agosto R$ 171,69
Acumulado Média 2012 Média 2011
Agosto Julho Junho Maio Abril 2012
F. Pagto 959,98 987,62 906,72 826,68 876,04 6.776,50 847,06 659,77
Salários 489,62 525,44 462,25 420,45 435,40 3.536,19 442,02 341,15
Encargos Sociais 324,78 331,40 329,37 287,61 263,18 2.219,01 277,38 214,21
Benefícios 145,57 130,77 115,09 118,63 177,46 1.021,30 127,66 104,41
Numero de Funcionários 312,00 313,00 284,00 273,00 2 72,00
Desp. Gerais 754,84 953,52 731,09 739,20 947,05 6.403,58 800,45 350,02
Total Desp. Filial 1.714,81 1.941,15 1.637,81 1.565, 88 1.823,09 13.180,08 1.647,51 1.009,80
Despesas Operacionais 14.072,53 13.741,72 13.325,31 13.092,32 12.084,76 100.194,02 12.524,25 8.550,57
Despesas Administrativas Local 344,28 679,34 510,1 4 515,01 682,46 4.652,87 581,61 459,49
Total Despesas 16.131,62 16.362,21 15.473,26 15.173, 22 14.590,31 118.026,98 14.753,37 10.019,85
Gestão 19.745,25 19.917,41 18.697,01 19.772,09 17.932,32 147.108,77 18.388,60 11.110,22
Reembolso Avarias 1.138,56 1.102,92 491,13 753,22 61 7,94 5.802,89 725,36 545,33
Reembolso Multas 65,48 62,43 58,16 136,68 520,25 1.2 24,93 153,12 112,47
Reembolso Sublocação 59,45 78,45 73,33 50,66 29,77 3 73,33 46,67 50,32
Faturamento Bruto 21.008,75 21.161,22 19.319,64 20. 712,65 19.100,28 154.509,92 19.313,74 11.818,34
Descontos e Abatimentos 217,73 224,15 (516,83) 251,16 391,33 1.128,07 141,01 108,50
Impostos (PIS / COFINS / ISS) 434,83 432,19 397,76 4 21,06 379,86 3.134,72 391,84 241,97
Faturamento Líquido 20.356,19 20.504,88 19.438,71 2 0.040,42 18.329,09 150.247,12 18.780,89 11.467,86
Resultado Oper. 4.224,57 4.142,67 3.965,45 4.867,21 3.738,78 32.220,14 4.027,52 1.448,01
% 20,11% 19,58% 20,53% 23,50% 19,57% 20,85% 20,85% 12,25%
Despesas Administrativas Matriz 2.026,44 1.794,71 1 .558,74 1.570,52 2.276,03 13.481,62 1.685,20 945,48
Resultado Liquido 2.198,14 2.347,95 2.406,71 3.296,6 9 1.462,75 18.738,52 2.342,32 502,53
% 10,46% 11,10% 12,46% 15,92% 7,66% 12,13% 12,13% 4,25%
Ebitda 10.410,55 10.689,33 10.611,77 11.541,02 9.467,15 82.534,79 10.316,85 5.406,64
Ebitda % 50,60% 51,57% 56,08% 56,88% 50,57% 54,52% 54,52% 46,70%

Meeting Results – Financial IndicatorsMeeting Results – Financial Indicators
Monthly financial assessment for each operation

Meeting Results – Operational IndicatorsMeeting Results – Operational Indicators
RESUMO GESTÃO E TERCEIRIZAÇÃO DE CAMINHÕES PRIVADOS acumulado
INDICADORES OPERACIONAIS
Previsto Por Veíc. Previsto Por Veíc. Previsto Por Veíc.
Total 0 4.172.424 0 4.940.266 0 4.281
Gestão 3.278
Reembolso Avarias 135
Reembolso Multas 232
Reembolso Sublocação 0
Previsto Diferença Previsto Diferença Média Previsto Diferença
R$ 0 3.788.989 0 3.993.781 0 3.800.338
Por Veículo 0 3.460 0 3.303 0 3.501
Total Mês Total Mês Total Mês
Alocadas Matriz R$ 463.690 537.956 535.981
Total Mês % Repres. /C.D.O. Total Mês % Repres. /C.D.O. Total Mês % Repres. /C.D.O.
Alocadas Local R$ 168.763 4,45% 197.095 4,94% 208.430 5,48%
Total Mês % Repres. /C.D.O. Total Mês % Repres. /C.D.O. Total Mês % Repres. /C.D.O.
Impostos R$ 79.726 2,10% 96.229 2,41% 86.394 2,27%
Total Mês % Repres. / Fat. % Repres. /C.D.O. Total Mês % Repres. / Fat. % Repres. /C.D.O. Total Mês % Repres. / Fat. % Repres. /C.D.O.
Depreciação e Remuneração De Capital R$ 2.299.016 55,10% 60,68% 2.436.229 49,31% 61,00% 2.179.136 46,90% 57,34%
Implantação Quant. Média Dias Ag. Fat. Média Dias Pós Fat. Total Dias Quant. Média Dias Ag. Fat. Média Dias Pós Fat. Total Dias Quant. Média Dias Ag. Fat. Média Dias Pós Fat. Total Dias
Implantação Total 113 22,0 100,0 122,0 39 17,0 102,0 119,0 58 46,3 140,1 186,4
Desmobilização
Desmobilização Cliente até o Pátio Total
Veículos Total
Total Mês Km / Veic. Total Mês Km / Veic. Total Mês Km / Veic.
Km Rodado Total 6.316.857 5.769 5.403.227 4.469 3.821.426 3.521
Total Mês R$ / Veíc. Equip. R$ / Km % Repres. /C.D.O. Total Mês R$ / Veíc. Equip. R$ / Km % Repres. /C.D.O. Total Mês R$ / Veíc. Equip. R$ / Km % Repres. /C.D.O.
Combustível - R$ R$ -277 -0,25 -0,00 -0,01% 905 0,75 0,00 0,02% 524 0,48 0,00 0,01%
Total Mês R$ / Veíc. Equip. R$ / Km % Repres. /C.D.O. Total Mês R$ / Veíc. Equip. R$ / Km % Repres. /C.D.O. Total Mês R$ / Veíc. Equip. R$ / Km % Repres. /C.D.O.
Pneus (novos, recapados, consertos e nitrogênio) R$ 119.437 109,07 0,02 3,15% 78.549 64,97 0,01 1,97% 86.355 79,56 0,02 2,27%
Total Mês R$ / Veíc. Equip. R$ / Km % Repres. /C.D.O. Total Mês R$ / Veíc. Equip. R$ / Km % Repres. /C.D.O. Total Mês R$ / Veíc. Equip. R$ / Km % Repres. /C.D.O.
Peças R$ 199.928 182,58 0,03 5,28% 212.659 175,90 0,04 5,32% 217.467 200,36 0,06 5,72%
Total Mês R$ / Veíc. Equip. R$ / Km % Repres. /C.D.O. Total Mês R$ / Veíc. Equip. R$ / Km % Repres. /C.D.O. Total Mês R$ / Veíc. Equip. R$ / Km % Repres. /C.D.O.
Manutenção (máquinas, equip., veículos, lubrificantes e serviços)R$ 174.681 159,53 0,03 4,61% 129.576 107,18 0,02 3,24% 162.785 149,98 0,04 4,28%
Total Mês R$ / Veíc. Equip. R$ / Km % Repres. /C.D.O. Total Mês R$ / Veíc. Equip. R$ / Km % Repres. /C.D.O. Total Mês R$ / Veíc. Equip. R$ / Km % Repres. /C.D.O.
Lubrificantes R$ 21.469 19,61 0,00 0,57% 25.126 20,78 0,00 0,63% 25.789 23,76 0,01 0,68%
Total Mês R$ / Veíc. Equip. R$ / Km % Repres. /C.D.O. Total Mês R$ / Veíc. Equip. R$ / Km % Repres. /C.D.O. Total Mês R$ / Veíc. Equip. R$ / Km % Repres. /C.D.O.
Manuseio de Cargas R$ 5.952 5,44 0,00 0,16% 26.677 22,07 0,00 0,67% 10.993 10,13 0,00 0,29%
Total Mês R$ / Veíc. Equip. R$ / Km % Repres. /C.D.O. Total Mês R$ / Veíc. Equip. R$ / Km % Repres. /C.D.O. Total Mês R$ / Veíc. Equip. R$ / Km % Repres. /C.D.O.
Total de Manutenção R$ 521.468 476,23 0,08 13,76% 472.588 390,89 0,09 11,83% 503.389 463,79 0,13 13,25%
Manutenção Total Mês Idade Média Quant. Veíc. Ticket Médio Total Mês Idade Média Quant. Veíc. Ticket Médio Total Mês Idade Média Quant. Veíc. Ticket Médio
Total de Manutenção R$ 520.625 17 1.083 480,72 470.586 18 1.209 389,24 458.707 1.057 433,97
Sublocação Diárias R$ / Diária Diárias R$ / Diária Diárias R$ / Diária
Locação (sub-locação) R$ #DIV/0! #DIV/0! #DIV/0!
Ticket Médio Diárias Por Evento
AVARIAS / MULTAS Pagto / Veículo% de Reembolso /
PagamentoPagto / Veículo
% de Reembolso /
PagamentoPagto / Veículo
% de Reembolso /
Pagamento
Pagamento 0,36 1,15% 0,52 1,01% 0,54
Reembolso 0,71 2,23% 1,49 2,93% 2,59
Saldo 0,34 194,19% 0,97 288,79% 2,05 481,63%
Reemb / Veículo % Repres. / Fat. Reemb / Veículo % Repres. / Fat. Reemb / Veículo % Repres. / Fat.
Pagamento 1,71 4,91% 5,21 8,28% 3,05
Reembolso 1,14 3,27% 0,85 1,35% 3,43
Saldo -0,57 66,62% -4,36 16,34% 0,39 112,67%
% de Saldo / Pagamento % de Saldo / Pagamento Saldo / Veículo% de Reembolso /
Pagamento
Pagamento -370,25% -909,35% 3,58
Reembolso -61,34% 42,88% 6,02
Saldo -519,55% -416,07% 2,44 167,96%
Nº Colaboradores H.E. (R$) R$ / Total Colab. % Repres. / F.P. Nº Colaboradores H.E. (R$) R$ / Total Colab. % Repres. / F.P. Nº Colaboradores H.E. (R$) R$ / Total Colab. % Repres. / F.P.
Admisnistrativos da filial 11 0 0 0,00% 10 0 0 0,00% 11 64 6 0,16%
Tráfego 1 0 0 0,00% 1 0 0 0,00% 1 0 0 0,00%
Total 12 0 0 0,00% 11 0 0 0,00% 12 64 6 0,16%
Folha / Colab. Indenizações Folha / Colab. Indenizações Folha / Colab. Indenizações
Folha De Pagamento R$ 3.608 0 3.658 0 3.545 215
3.936.316
84.521
Quant. Média Dias Quant. Média Dias
15 0,5
Quant. Média Dias
151.586
4.398.043
491.125
51.098
0
210.394
33.349
-212.995 -318.403
Avarias + Multas
-68.313 -342.276
177.045
Multas
40.996 76.526
Avarias
3.557.390
146.125
251.659
519.965
223.437
50.200-51.843
309.571-161.152 -368.603
Total MêsTotal Mês Total Mês
66.862 296.528136.365
263.180204.677 409.138
Total MêsTotal Mês Total Mês
117.061
46.392
84.521
40.53543.526
Total MêsTotal Mês Total Mês
2 5,0
11 12
Mai 2012 Jun 2012 Média 2012
Realizado Realizado Realizado
Faturamento Bruto
4.172.424 4.940.266 4.646.686
Realizado Realizado Média Real
Custos e Despesas Operacionais3.788.989 3.993.781 3.800.338
3.460 3.303 3.501
% Repres. / Fat. % Repres. / Fat. % Repres. / Fat.
11,11% 10,89% 11,53%
% Repres. / Fat. % Repres. / Fat. % Repres. / Fat.
4,04% 3,99% 4,49%
% Repres. / Fat. % Repres. / Fat. % Repres. / Fat.
1,91% 1,95% 1,86%
Total MêsTotal Mês Total Mês
0 0 0
Ticket Médio Diárias Por Evento Ticket Médio Diárias Por EventoTotal Evento Total Evento Ticket Médio Diárias Por Evento Total Evento
Total Mês Total Mês Total Mês
1.095 1.209 1.085
Horas Extras e Número De Colaboradores
Total Folha de Pagamento
40.239
Total Folha de Pagamento Total Folha de Pagamento
43.296
#DIV/0!#DIV/0!#DIV/0!
41.209
Monthly operational assessment for each operation

Operations with12 or more months ofRevenue
Other Operations(with less than 12
months ofRevenue)
2,271.0 451.7
333.5 (32.0)
14.7% -7.1%
233.5 (22.4)
1,655.1 838.5
14.1% -2.7%
510.5 43.1
22.5% 9.5%
175.0 (82.0)
7.7% -18.2%
981.1 1,115.4
1.4 9.0
0.81 n.a.
10.70 10.70
13.3 n.a.
6.5 n.a.
20.8% n.a.
Total
3,421.5
502.5
14.7%
351.8
2,493.6
14.1%
769.2
22.5%
233.6
6.8%
2,096.5
2.0
1.08
10.70
9.9
5.7
27.6%
ROIC LTM 06/30/2012(R$ million)
Total
Net Revenue 2,722.7
EBIT 301.6
EBIT Margin 11.1%
(=) Net Operating Profit less Taxes (NOPLAT) - 1
211.1
(=) Invested Capital - 2 2,493.6
ROIC - 1/2 8.5%
Recurring EBITDA 553.6
Recurring EBITDA Margin 20.3%
Recurring Net Profit 95.3
Recurring Net Profit Margin 3.5%
Net Debt 2,096.5
Net Debt/EBITDA-A 2.5
Earnings per Share 0.44
Share Price (09/14/2012) 10.70
P/E 24.3
EV/EBITDA LTM 8.0
ROE 11.3%
Return of operationsReturn of operations
Other Operations(with less than 12
months ofRevenue)
1,150.5
169.0
14.7%
118.3
838.5
14.1%
258.7
22.5%
58.6
5.1%
1,115.4
3.3
0.27
10.70
39.6
13.3
n.a.
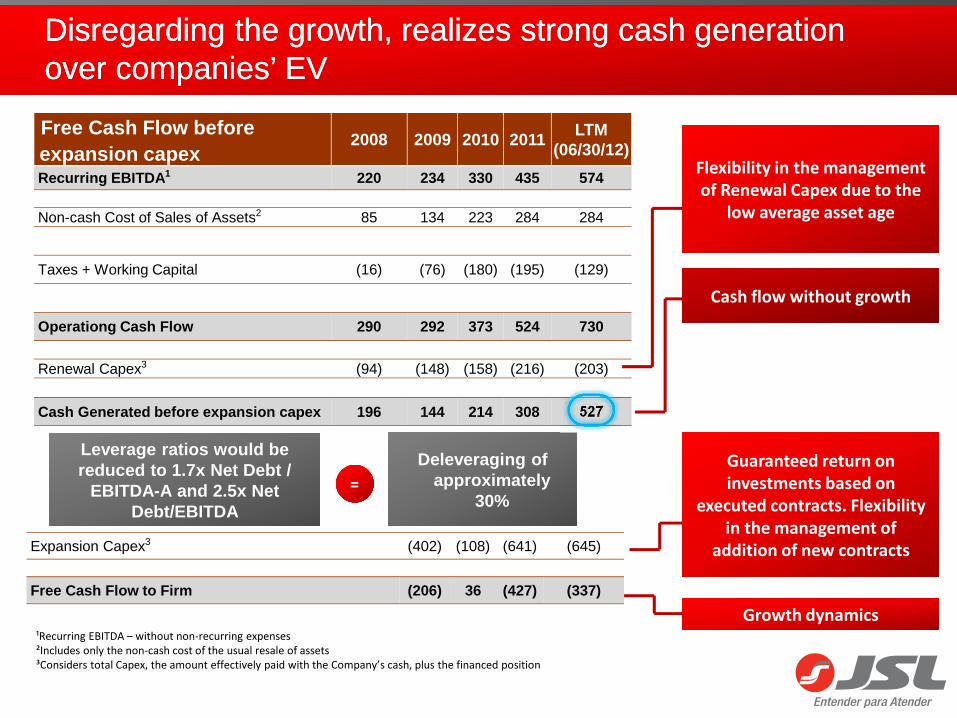
Disregarding the growth, realizes strong cash generationover companies’ EVDisregarding the growth, realizes strong cash generationover companies’ EV
Free Cash Flow beforeexpansion capex
2008 2009 2010 2011LTM
(06/30/12)
Recurring EBITDA 1 220 234 330 435 574
Non-cash Cost of Sales of Assets2 85 134 223 284 284
Taxes + Working Capital (16) (76) (180) (195) (129)
Operationg Cash Flow 290 292 373 524 730
Renewal Capex3 (94) (148) (158) (216) (203)
Cash Generated before expansion capex 196 144 214 308 527
¹Recurring EBITDA – without non-recurring expenses²Includes only the non-cash cost of the usual resale of assets³Considers total Capex, the amount effectively paid with the Company’s cash, plus the financed position
Deleveraging ofapproximately
30%
Cash flow without growthCash flow without growth
Guaranteed return on investments based on
executed contracts. Flexibility in the management of
addition of new contracts
Guaranteed return on investments based on
executed contracts. Flexibility in the management of
addition of new contracts
Flexibility in the management of Renewal Capex due to the
low average asset age
Flexibility in the management of Renewal Capex due to the
low average asset age
Growth dynamicsGrowth dynamics
Leverage ratios would bereduced to 1.7x Net Debt /
EBITDA-A and 2.5x Net Debt/EBITDA
Expansion Capex3 (402) (108) (641) (645)
Free Cash Flow to Firm (206) 36 (427) (337)
==
GROSS DEBT CASH AND INVESTMENTS NET DEBT
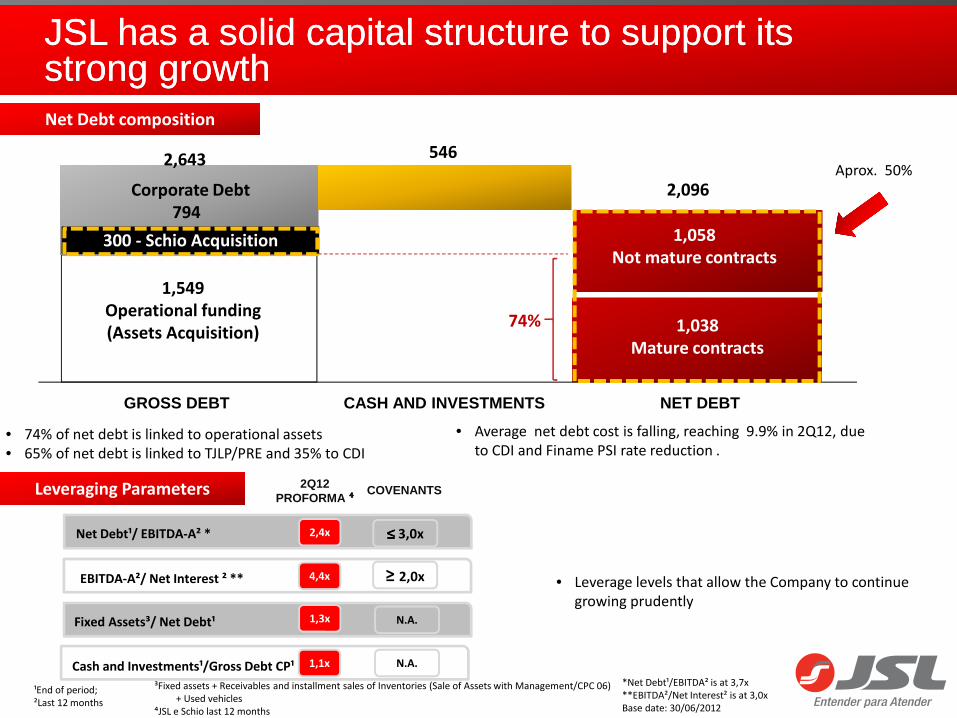
JSL has a solid capital structure to support its strong growthJSL has a solid capital structure to support its strong growth
• 74% of net debt is linked to operational assets• 65% of net debt is linked to TJLP/PRE and 35% to CDI
Net Debt compositionNet Debt composition
• Average net debt cost is falling, reaching 9.9% in 2Q12, due to CDI and Finame PSI rate reduction .
2,096
1,038Mature contracts
1,058Not mature contracts
1,549Operational funding(Assets Acquisition)
Corporate Debt794
5462,643
74%
300 - Schio Acquisition
• Leverage levels that allow the Company to continue growing prudently
¹End of period; ²Last 12 months
³Fixed assets + Receivables and installment sales of Inventories (Sale of Assets with Management/CPC 06) + Used vehicles
⁴JSL e Schio last 12 months
*Net Debt¹/EBITDA² is at 3,7x**EBITDA²/Net Interest² is at 3,0xBase date: 30/06/2012
1,3xFixed Assets³/ Net Debt¹
1,1xCash and Investments¹/Gross Debt CP¹
2,4xNet Debt¹/ EBITDA-A² *
Leveraging ParametersLeveraging Parameters
4,4xEBITDA-A²/ Net Interest ² **
N.A.
N.A.
2Q12PROFORMA ⁴⁴⁴⁴
COVENANTS
≥ 2,0x
≤≤≤≤ 3,0x
Aprox. 50%

Moreover, JSL has flexibility in managing CAPEX dueto low average age of fleet
• Linked to new contracts
• Low average age of fleet• Flexibility to manage the time of renewal
without harming maintenance
• 2.1 years is the current average age of the total fleet
Fleet Evolution (thousands)Fleet Evolution (thousands)
CAPEX Forecast 2012 (R$ million) 1S12R 2012E
Net Renewal CAPEX (23) 60
Gross renewal CAPEX 116 420
Revenue with resale of assets (139) (360)
Expansion CAPEX 289 590
Commited - 2011 new contracts 102 130
New contracts signed in 2012 and to be
captured 187 460
Others (IT, improvements, etc) 29 60
Net CAPEX 295 710

JSL's initiatives in sustainability projects in the logistics chain
JSL's initiatives in sustainability projects in the logistics chain
Irecê A. RodriguesIrecê A. Rodrigues

InstituteInstitute
Julio Simões Institute
Mission
Vision
The Julio Simões Institute was created in 2006 to organize and plan the execution of JSL’s social initiatives, allocating resources proportionally to its operational locations.
To promote initiatives and share expertise that IMPROVES ROAD TRANSPORTATION SAFETY and that QUALIFIES HUMAN CAPITAL in the logistics sector.
To become a BENCHMARK for good of professional ROAD TRANSPORTATION SAFETY and SUSTAINABLE DEVELOPMENT practices .
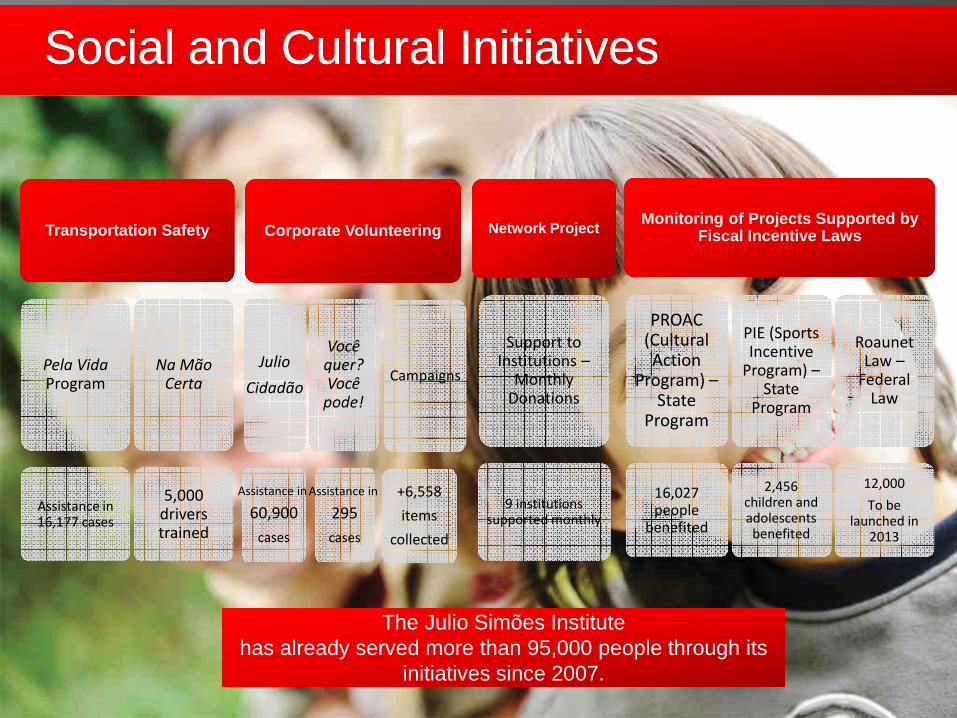
Social and Cultural InitiativesSocial and Cultural Initiatives
Transportation Safety
Pela Vida Program
Assistance in 16,177 cases
Na MãoCerta
5,000 drivers trained
Network Project
Support to Institutions –
Monthly Donations
9 institutions supported monthly
Monitoring of Projects Supported by Fiscal Incentive Laws
PROAC (Cultural Action
Program) –State
Program
16,027 people
benefited
PIE (Sports Incentive
Program) –State
Program
2,456 children and adolescents benefited
Roaunet Law –
Federal Law
12,000
To be launched in
2013
The Julio Simões Institutehas already served more than 95,000 people through its
initiatives since 2007.
The Julio Simões Institutehas already served more than 95,000 people through its
initiatives since 2007.
Corporate Volunteering
Julio
Cidadão
Assistance in
60,900
cases
Campaigns
+6,558
items
collected
Vocêquer?Vocêpode!
Assistance in
295
cases

CoverageCoverage
PA
MS
PR
SC
RS
AP
MA
PI
CE
PE
ALSEBA
TO
GO
DF
MG
RJ
ES
SP
RR
MT
AM
AC
RO
Pela Vida (For Life)
Monthly Donations -Social
Monthly Donations –Environmental
Campaigns
Projects Supported by Tax Incentive Laws

ActionsActions

Desenvolvimento de Novos Projetos / NegóciosDesenvolvimento de Novos Projetos / Negócios
Fábio VellosoFábio Velloso
Development of New Projects / BusinessesDevelopment of New Projects / Businesses

Development of New Projects / BusinessesDevelopment of New Projects / Businesses
To develop new projects and businesses in areas / scopes still unexplored by JSL
• Recycling of materials
• Industrial center
• Logistics center
• 4PL projects
• Highway projects
• Port and retroport projects
• Railway projects
• Projects in the pharmaceutical segment
• Projects in the gas distribution segment
• Projects in the energy segment
• Recycling of materials
• Industrial center
• Logistics center
• 4PL projects
• Highway projects
• Port and retroport projects
• Railway projects
• Projects in the pharmaceutical segment
• Projects in the gas distribution segment
• Projects in the energy segment
Projects under development
Projects under development

Example: Energy Segment (Current Scenario)Example: Energy Segment (Current Scenario)
58
FINAL DESTINATION
Work
Work
Work
Small Distribution Centers
SUPPLIERS
Work
Garage
DISTRIBUTION CENTERS

Example: Energy Segment (Proposed Scenario)Example: Energy Segment (Proposed Scenario)
SUPPLIERS
LOGISTICS CENTER
CONSOLIDATION CENTERS
FINAL DESTINATION
Work
Work
Work
Small Distribution Centers
Work
CONSOLIDATION CENTERS

Example: Pharmaceutical SegmentExample: Pharmaceutical Segment
PHARMACEUTICAL INDUSTRY
HOSPITALS
DISTRIBUTORS
LARGE PHARMACEUTICAL
CHAINS
PHARMACIES
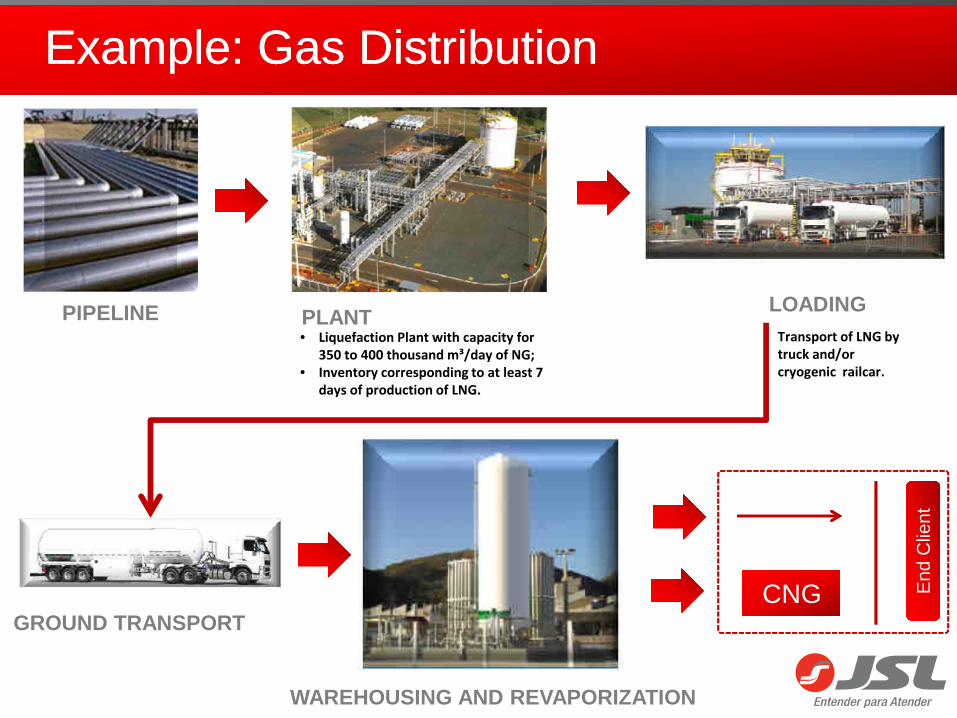
Example: Gas DistributionExample: Gas Distribution
PLANTLOADING
GROUND TRANSPORT
WAREHOUSING AND REVAPORIZATION
End
Clie
ntE
nd C
lient
PIPELINE• Liquefaction Plant with capacity for
350 to 400 thousand m³/day of NG;• Inventory corresponding to at least 7
days of production of LNG.
Transport of LNG by truck and/or cryogenic railcar.
CNGCNG

Example: Logistics CenterExample: Logistics Center
Dry warehouse/with temperature
control
Outdoor warehousing
Located at the exit to key highways
Close to ports
Truck center
Close to the railway
Strategies and ActionsStrategies and Actions
Fernando Antonio SimõesFernando Antonio Simões

Corporate GovernanceCorporate Governance
5 members,2 of which are independent member
3 members, 1 of which is independent member
Board of DirectorsBoard of Directors
Financial and Procurement
Committe
Financial and Procurement
Committe
Fiscal CouncilFiscal
Council
External Audit
External Audit
216,799,134 common sharesShareholders
• Novo Mercado
• Financial and Procurement Committee
• PricewaterhouseCoopers
• Code of Ethics
• Incorporation of dealerships
• 40% of board of directors is independent
• Guidance delivery
• Novo Mercado
• Financial and Procurement Committee
• PricewaterhouseCoopers
• Code of Ethics
• Incorporation of dealerships
• 40% of board of directors is independent
• Guidance delivery
Corporate Governance
Best Practices
Corporate Governance
Best Practices
Management Structure
ManagementManagementTreasury Shares
Treasury Shares
Fernando Antônio Simões
Fernando Antônio Simões
Other members of Simões
family
Other members of Simões
family
7% 13% 53% 25% 1% 1%
CEOCEO
Bloco de controle
Guidance Realized %
2010 300 330 110.0%
2011 400 435 108.8%
Guidance Realized %
2010 300 330 110.0%
2011 400 435 108.8%

226.0 333.0 427.0 499.0 593.0 727.0 1,027.7
1,478.0 1,477.8
2,028.5
2,739.7
2001 2002 2003 2004 2005 2006 2007 2008 2009 2010 2011*
Organic Acquisitions
Growth JSL x PIBGrowth JSL x PIB
Proven historical growth
Elasticity x GDP
Source: Company
Net Revenues(R$ million)
*Proforma
05% 05%00%
08%03% 03%
36% 36%
08%
25%
19%
41%
2007 2008 2009 2010 2011 Reported FY11 JSL + Schio
GDP Gross Revenue from Services
6.2 x
6.6x 7.1x
3,900.0x
6.9 x
CAGR PIB 07-11: +4.8%
CAGR JSL 07-11: +29.7%
15.3 x
3.3x
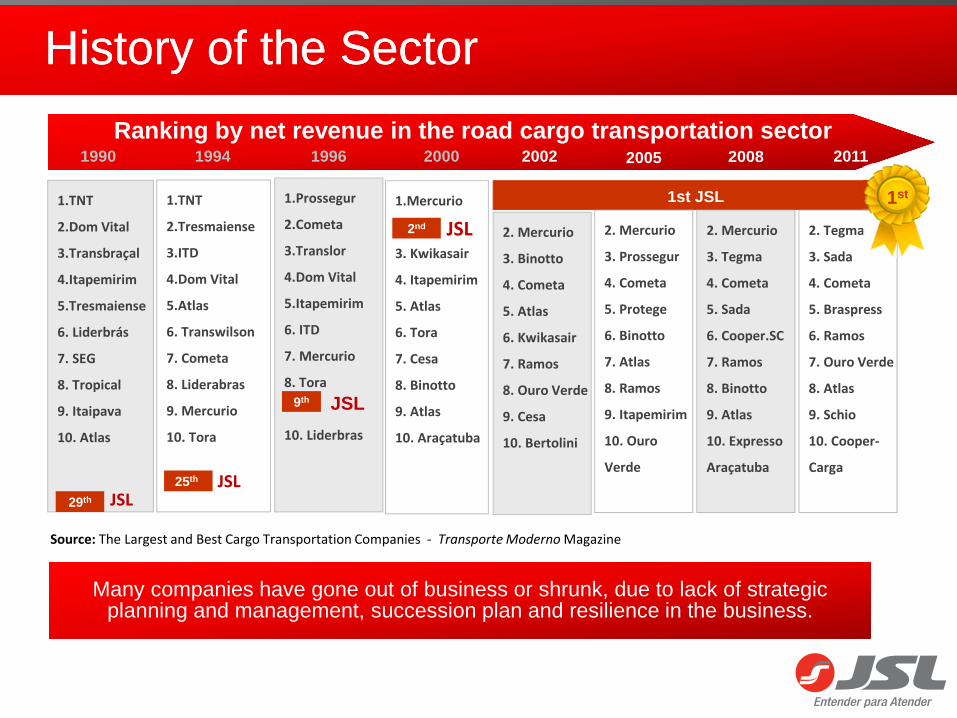
History of the SectorHistory of the Sector
Many companies have gone out of business or shrunk, due to lack of strategic planning and management, succession plan and resilience in the business.
Many companies have gone out of business or shrunk, due to lack of strategic planning and management, succession plan and resilience in the business.
1.TNT
2.Dom Vital
3.Transbraçal
4.Itapemirim
5.Tresmaiense
6. Liderbrás
7. SEG
8. Tropical
9. Itaipava
10. Atlas
29th
1990
1.TNT
2.Tresmaiense
3.ITD
4.Dom Vital
5.Atlas
6. Transwilson
7. Cometa
8. Liderabras
9. Mercurio
10. Tora
25th
1.Prossegur
2.Cometa
3.Translor
4.Dom Vital
5.Itapemirim
6. ITD
7. Mercurio
8. Tora
10. Liderbras
9o
1996
1.Mercurio
3. Kwikasair
4. Itapemirim
5. Atlas
6. Tora
7. Cesa
8. Binotto
9. Atlas
10. Araçatuba
9th
2. Mercurio
3. Binotto
4. Cometa
5. Atlas
6. Kwikasair
7. Ramos
8. Ouro Verde
9. Cesa
10. Bertolini
2nd
2000 2011
1st JSL
1994 2002
JSL
JSL
JSL
Source: The Largest and Best Cargo Transportation Companies - Transporte Moderno Magazine
JSL
2. Mercurio
3. Prossegur
4. Cometa
5. Protege
6. Binotto
7. Atlas
8. Ramos
9. Itapemirim
10. Ouro
Verde
2. Mercurio
3. Tegma
4. Cometa
5. Sada
6. Cooper.SC
7. Ramos
8. Binotto
9. Atlas
10. Expresso
Araçatuba
2. Tegma
3. Sada
4. Cometa
5. Braspress
6. Ramos
7. Ouro Verde
8. Atlas
9. Schio
10. Cooper-
Carga
1st
2005 2008Ranking by net revenue in the road cargo transporta tion sector

New ContractsNew Contracts
Note: Although each contract is adjusted according to the inflation of its specific cost structure, to estimate the base of 2012and 2013 we used the IGP-M index (Source: Bacen).
2,267
696
2011R 2012E
115
2013E
1883,406
2,246
3,206
+34.9%
+11.4%
3,057
2,267
Contracts negotiated in 2012
ConsolidatedDedicated Services +
Passengers
HEAVYManagement
and outsourcing
LIGHTManagement
and outsourcing
Global Revenue (R$ thousand)
1,263.2 997.1 229.3 36.8
Term (months) 60 61 60 24
EBTIDA Margin 33.0% 23.1% 76.7% 51.2%
IRR 16.8% 17.7% 15.3% 18.3%
Residual Value 48.0% 47.0% 46.0% 80.0%
Gross Revenue from Services

Criteria for AcquisitionCriteria for Acquisition
Some points analyzed
• Entry in segments in which JSL does not have a strong presence
• Penetration in unique markets with an accelerated growth curve
• To penetrate into profitable and protected segments with entry barriers
• To operate in the sector through a more efficient business model
• Generate value via economy of scale
• Operational synergies
• To enable growth in a structured and systematic manner, with value generation that is sustainable in the long term

Current MarketCurrent Market
Brazil´s GDP100% = R$ 2.9 tri
Logistical Expenses100% = R$ 576 bi
Others94%
LSP6%
Source: World Bank - 2008
5.4%
16.5%24.5%
37.4%46.9%
58.3%
Brasil Alemanha França Espanha ReinoUnido
Holanda
% of total fleet
Source: DataMonitor, Unidas
Low penetration level
1 vehicle48%
2 to 5 vehicles
36%
6 to 15 vehicles
11%
More than16 vehicles
5%
Fleet Management and Outsourcing
Size of the companies’ fleet
Average age of Brazil’s truck fleet: 17.6 years
Average age of Brazil’s truck fleet: 17.6 years
Total of 206 thousand highway transportation companies
Germany France Spain England NetherlandsBrazil

Brazil’s Logistics MarketBrazil’s Logistics Market
• Companies with revenue of up to R$500.0 million
• Family management
• Some have made mistakes
• Disproportional liabilities
• Clients responsible for civil, labor and tax liabilities
• Competitive market (need for innovation)
• Solutions without integration

JSL’s PositionJSL’s Position
• Corporate Governance
• Credibility
• Committed and integrated staff
• Succession
• Differentiated board of directors
• Corporate Governance
• Credibility
• Committed and integrated staff
• Succession
• Differentiated board of directors
• Brazil’s largest service portfolio
• Cross-selling ability
• Resilience in business
• Flexibility in CAPEX management
• Diversified operations
• Penetration in sale of assets
• Geographic presence
• Scale
• Entry barriers
• Administrative/operational structure
• Brazil’s largest service portfolio
• Cross-selling ability
• Resilience in business
• Flexibility in CAPEX management
• Diversified operations
• Penetration in sale of assets
• Geographic presence
• Scale
• Entry barriers
• Administrative/operational structure
Solid Competitive Advantages
Solid Competitive Advantages
Sustainable GrowthSustainable Growth

THANK YOU